Ditch The Duct Tape: Reduce Security Sprawl With XDR

Post Syndicated from Amy Hunt original https://blog.rapid7.com/2023/01/11/ditch-the-duct-tape-reduce-security-sprawl-with-xdr/

Ditch The Duct Tape: Reduce Security Sprawl With XDR

The New Year’s Day edition of The Wall Street Journal asked a big question in a big headline: “Can Southwest Airlines Buy Back Its Customers’ Love?”

While other airlines rebounded from extreme winter weather and service disruptions, Southwest—always top-rated, with a famously loyal following—melted down. It canceled more than 2,300 flights, stranding passengers and their baggage around the country over the Christmas holidays. The U.S. Department of Transportation is putting the entire event “under a microscope.”

Most believe Southwest will, in fact, be loved again. Tickets were refunded, travel expenses were reimbursed, and approximately 25,000 frequent flyer miles were doled out to each stranded customer. Whatever. That’s not why you should pay attention to this tale.

The object lesson that matters? WSJ’s CIO Journal followed up, reporting that “balky crew scheduling technology” caused the disaster. Airline staff who used the system had been frustrated by it for some time, but couldn’t get executive attention. A scathing New York Times op-ed on December 31, “The Shameful Open Secret Behind Southwest’s Failure,” blames the strong incentives to address problems by “adding a bit of duct tape and wire to what you already have.”

Balky tech that frustrates staff: Sound familiar?

Two years ago, ZDNet reported the average enterprise managed 45 different tools to secure their environment. A few weeks ago, the Silicon Valley Business Journal said the number has jumped to 76, with sprawl driven by a need to keep pace with cloud adoption and remote work. Security teams are spending more than half their time manually producing reports, and pulling in data from multiple siloed tools.

The cybersecurity skills gap isn’t going anywhere. And the most tech savvy generation in human history—Gen Z, the latest entrants to adulthood and the workforce—is unlikely to stick it out in a burnout job laden with clunky tools. They grew up with customer-obsessed brands like Apple and Amazon and Zappos. Expectations about technology and elegant simplicity are built into all corners of their lives—work included— and they instantly know the difference between good and shambolic. Younger workers led The Great Resignation of 2021.

The trend toward XDR adoption is part of a solution. While capabilities can vary, XDR should integrate and correlate data from across your environment, letting you prioritize and eliminate threats, automate repetitive tasks, and liberate people to do important work.

If 2023 is your year to consider XDR, start with this Buyer’s Guide

Our new XDR Buyer’s Guide is for all of you who want to consolidate, simplify, and attract top talent. In this guide, you’ll get:

  • Must-have requirements any real XDR offers
  • Ways XDR is a staffing and efficiency game-changer
  • Key questions to ask as you evaluate options

Last year, Southwest announced $2 billion in customer experience investments, including upgraded WiFi, in-seat power, and larger overhead bins, as well as a new multimedia brand campaign, “Go With Heart.”  

After taking very good care of stranded customers—and true  to form, the airline did—it announced a 10-year, $10 million plan to hit carbon reduction goals. The Wall Street Journal asked: “Could not the Southwest IT department have used another $10 million?”

…and you’ve surely heard about this

This morning at 7:20am, the FAA grounded all domestic departures when the NOTAM (Notice to Air Mission) system failed. This critical system ingests information about anomalies at 19,000 airports for 45,000 flights every day, and alerts the right pilots at the right time. We woke up hearing about “failure to modernize” and also possible compromise.

Thanks for reading and come back tomorrow, as we’ll be following this developing story closely.

Security updates for Wednesday

Post Syndicated from original https://lwn.net/Articles/919649/

Security updates have been issued by Debian (exiv2, hsqldb, libjettison-java, ruby-sinatra, and viewvc), Fedora (golang-github-docker, mbedtls, and vim), Gentoo (alpine, commons-text, jupyter_core, liblouis, mbedtls, ntfs3g, protobuf-java, scikit-learn, and twisted), Red Hat (kernel and kpatch-patch), SUSE (rubygem-activerecord-5.2, tiff, and webkit2gtk3), and Ubuntu (dotnet6, linux-azure-5.4, linux-azure-fde, linux-gcp, linux-oracle, linux-ibm, and linux-oem-5.17, linux-oem-6.0).

Email Link Isolation: your safety net for the latest phishing attacks

Post Syndicated from Joao Sousa Botto original https://blog.cloudflare.com/area1-eli-ga/

Email Link Isolation: your safety net for the latest phishing attacks

Email Link Isolation: your safety net for the latest phishing attacks

Email is one of the most ubiquitous and also most exploited tools that businesses use every single day. Baiting users into clicking malicious links within an email has been a particularly long-standing tactic for the vast majority of bad actors, from the most sophisticated criminal organizations to the least experienced attackers.

Even though this is a commonly known approach to gain account access or commit fraud, users are still being tricked into clicking malicious links that, in many cases, lead to exploitation. The reason is simple: even the best trained users (and security solutions) cannot always distinguish a good link from a bad link.

On top of that, securing employees’ mailboxes often results in multiple vendors, complex deployments, and a huge drain of resources.

Email Link Isolation turns Cloudflare Area 1 into the most comprehensive email security solution when it comes to protecting against phishing attacks. It rewrites links that could be exploited, keeps users vigilant by alerting them of the uncertainty around the website they’re about to visit, and protects against malware and vulnerabilities through the user-friendly Cloudflare Browser Isolation service. Also, in true Cloudflare fashion,  it’s a one-click deployment.

With more than a couple dozen customers in beta and over one million links protected (so far), we can now clearly see the significant value and potential that this solution can deliver. To extend these benefits to more customers and continue to expand on the multitude of ways we can apply this technology, we’re making Email Link Isolation generally available (GA) starting today.

Email Link Isolation is included with Cloudflare Area 1 enterprise plan at no extra cost, and can be enabled with three clicks:

1. Log in to the Area 1 portal.

2. Go to Settings (the gear icon).

3. On Email Configuration, go to Email Policies > Link Actions.

4. Scroll to Email Link Isolation and enable it.

Email Link Isolation: your safety net for the latest phishing attacks

Defense in layers

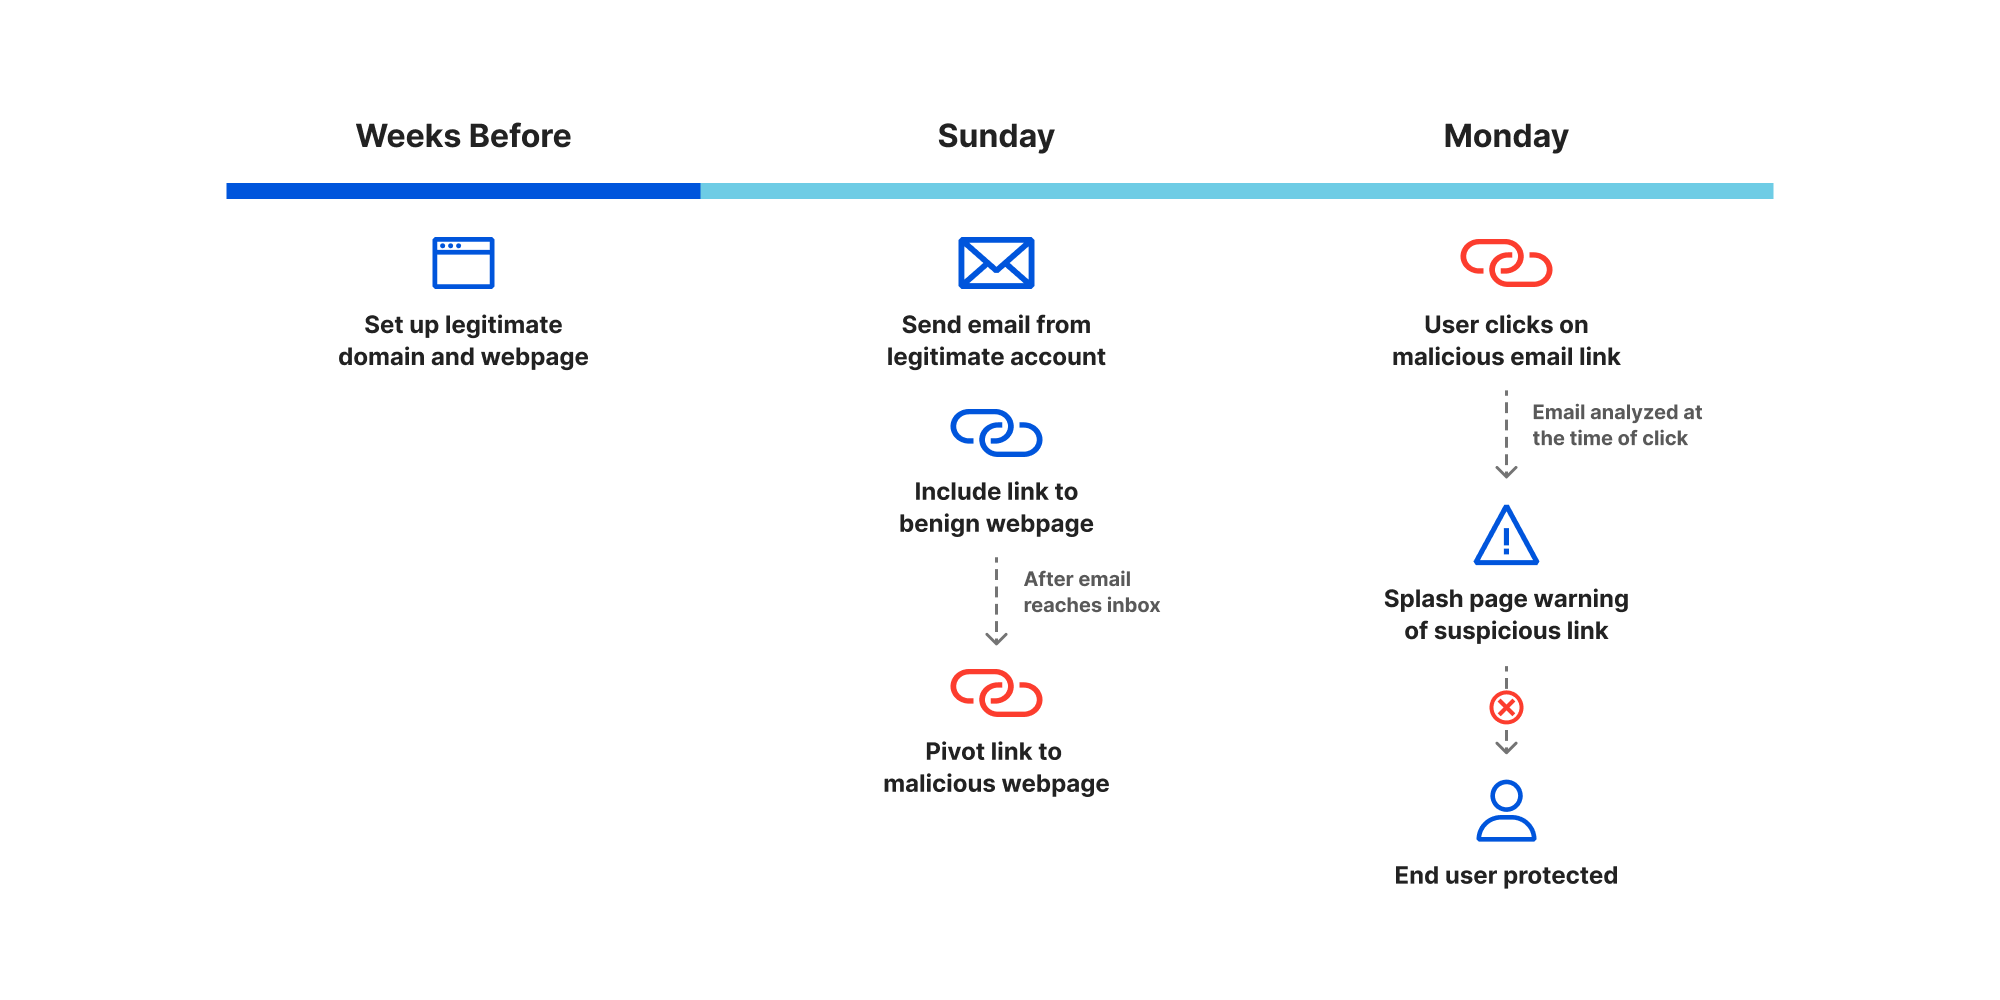
Applying multiple layers of defense becomes ever more critical as threat actors continuously look for ways to navigate around each security measure and develop more complex attacks. One of the best examples that demonstrates these evolving techniques is a deferred phishing attack, where an embedded URL is benign when the email reaches your email security stack and eventually your users’ inbox, but is later weaponized post-delivery.

Email Link Isolation: your safety net for the latest phishing attacks

To combat evolving email-borne threats, such as malicious links, Area 1 continually updates its machine learning (ML) models to account for all potential attack vectors, and leverages post-delivery scans and retractions as additional layers of defense. And now, customers on the Enterprise plan also have access to Email Link Isolation as one last defense – a safety net.

The key to successfully adding layers of security is to use a strong Zero Trust suite, not a disjointed set of products from multiple vendors. Users need to be kept safe without disrupting their productivity – otherwise they’ll start seeing important emails being quarantined or run into a poor experience when accessing websites, and soon enough they’ll be the ones looking for ways around the company’s security measures.

Built to avoid productivity impacts

Email Link Isolation provides an additional layer of security with virtually no disruption to the user experience. It’s smart enough to decide which links are safe, which are malicious, and which are still dubious. Those dubious links are then changed (rewritten to be precise) and Email Link Isolation keeps evaluating them until it reaches a verdict with a high degree of confidence. When a user clicks on one of those rewritten links, Email Link Isolation checks for a verdict (benign or malign) and takes the corresponding action – benign links open in the local browser as if they hadn’t been changed, while malign links are prevented from opening altogether.

Most importantly, when Email Link Isolation is unable to confidently determine a verdict based on all available intelligence, an interstitial page is presented to ask the user to be extra vigilant. The interstitial page calls out that the website is suspicious, and that the user should refrain from entering any personal information and passwords unless they know and fully trust the website. Over the last few months of beta, we’ve seen that over two thirds of users don’t proceed to the website after seeing this interstitial – that’s a good thing!

For the users that still want to navigate to the website after seeing the interstitial page, Email Link Isolation uses Cloudflare Browser Isolation to automatically open the link in an isolated browser running in Cloudflare’s closest data center to the user. This delivers an experience virtually indistinguishable from using the local browser, thanks to our Network Vector Rendering (NVR) technology and Cloudflare’s expansive, low-latency network. By opening the suspicious link in an isolated browser, the user is protected against potential browser attacks (including malware, zero days, and other types of malicious code execution).

In a nutshell, the interstitial page is displayed when Email Link Isolation is uncertain about the website, and provides another layer of awareness and protection against phishing attacks. Then, Cloudflare Browser Isolation is used to protect against malicious code execution when a user decides to still proceed to such a website.

What we’ve seen in the beta

As expected, the percentage of rewritten links that users actually click is quite small (single digit percentage). That’s because the majority of such links are not delivered in messages the users are expecting, and aren’t coming from trusted colleagues or partners of theirs. So, even when a user clicks on such a link, they will often see the interstitial page and decide not to proceed any further. We see that less than half of all clicks lead to the user actually visiting the website (in Browser Isolation, to protect against malicious code that could otherwise be executing behind the scenes).

Email Link Isolation: your safety net for the latest phishing attacks

You may be wondering why we’re not seeing a larger amount of clicks on these rewritten links. The answer is quite simply that link Email Link Isolation is indeed that last layer of protection against attack vectors that may have evaded other lines of defense. Virtually all the well crafted phishing attacks that try and trick users into clicking malicious links are already being stopped by the Area 1 email security, and such messages don’t reach users’ inboxes.

The balance is very positive. From all the customers using Email Link Isolation beta in production, some Fortune 500, we received no negative feedback on the user experience. That means that we’re meeting one of the most challenging goals – to provide additional security without negatively affecting users and without adding the burden of tuning/administration to the SOC and IT teams.

One interesting thing we uncover is how valuable our customers are finding our click-time inspection of link shorteners. The fact that a shortened URL (e.g. bit.ly) can be modified at any time to point to a different website has been making some of our customers anxious. Email Link Isolation inspects the link at time-of-click, evaluates the actual website that it’s going to open, and proceeds to open locally, block or present the interstitial page as adequate. We’re now working on full link shortener coverage through Email Link Isolation.

All built on Cloudflare

Cloudflare’s intelligence is driving the decisions of what gets rewritten. We have earlier signals than others.

Email Link Isolation has been built on Cloudflare’s unique capabilities in many areas.

First, because Cloudflare sees enough Internet traffic for us to confidently identify new/low confidence and potentially dangerous domains earlier than anyone else – leveraging the Cloudflare intelligence for this early signal is key to the user experience, to not add speed bumps to legitimate websites that are part of our users’ daily routines. Next, we’re using Cloudflare Workers to process this data and serve the interstitial without introducing frustrating delays to the user. And finally, only Cloudflare Browser Isolation can protect against malicious code with a low-latency experience that is invisible to end users and feels like a local browser.

If you’re not yet a Cloudflare Area 1 customer, start your free trial and phishing risk assessment here.

Improved access controls: API access can now be selectively disabled

Post Syndicated from Joseph So original https://blog.cloudflare.com/improved-api-access-control/

Improved access controls: API access can now be selectively disabled

Improved access controls: API access can now be selectively disabled

Starting today, it is possible to selectively scope API access to your account to specific users.

We are making it easier for account owners to view and manage the access their users have on an account by allowing them to restrict API access to the account. Ensuring users have the least amount of access they need, and maximizing visibility of the access is critical, and our move today is another step in this direction.

When Cloudflare was first introduced, a single user had access to a single account. As we have been adopted by larger enterprises, the need to maximize access granularity and retain control of an account has become progressively more important. Nowadays, enterprises using Cloudflare could have tens or hundreds of users on an account, some of which need to do account configuration, and some that do not. In addition, to centralize the configuration of the account, some enterprises have a need for service accounts, or those shared between several members of an organization.

While account owners have always been able to restrict access to an account by their users, they haven’t been able to view the keys and tokens created by their users. Restricting use of the API is the first step in a direction that will allow account owners a single control plane experience to manage their users’ access.

Steps to secure an account

The safest thing to do to reduce risk is to scope every user to the minimal amount of access required, and the second is to monitor what they do with their access.

While a dashboard login has some degree of non-repudiation, especially when being protected by multiple factors and an SSO configuration, an API key or token can be leaked, and no further authentication factors will block the use of this credential. Therefore, in order to reduce the attack surface, we can limit what the token can do.

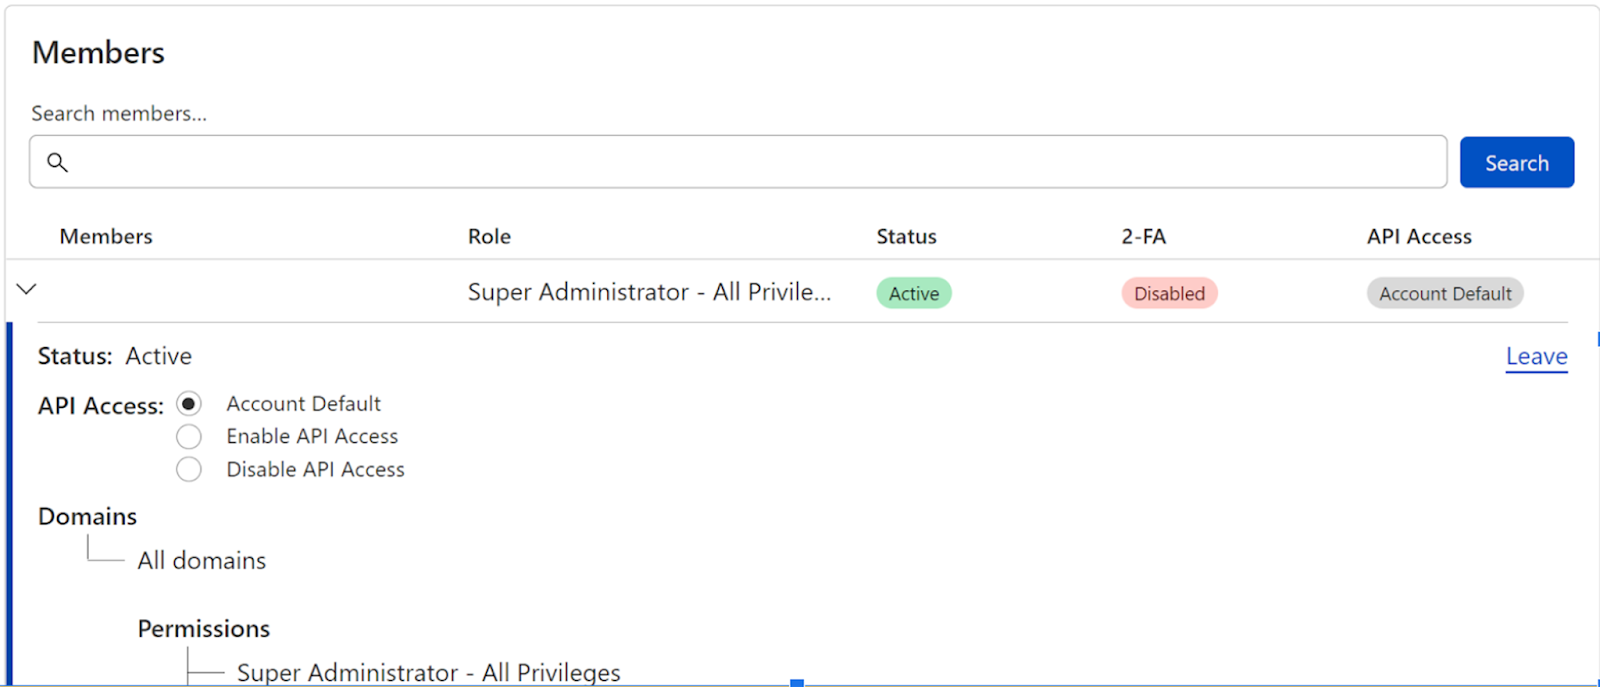
A Cloudflare account owner can now access their members page, and turn API access on or off for specific users, as well as account wide.

Improved access controls: API access can now be selectively disabled

This feature is available for our enterprise users starting today.

Moving forward

On our journey to making the account management experience safer, and more granular, we will continue to increase the level of control account owners have over their accounts. Building these API restrictions is a first step on the way to allowing account-owned API tokens (which will limit the need to have personal tokens), as well as increasing general visibility of tokens among account members.

One-click data security for your internal and SaaS applications

Post Syndicated from Tim Obezuk original https://blog.cloudflare.com/one-click-zerotrust-isolation/

One-click data security for your internal and SaaS applications

One-click data security for your internal and SaaS applications

Most of the CIOs we talk to want to replace dozens of point solutions as they start their own Zero Trust journey. Cloudflare One, our comprehensive Secure Access Service Edge (SASE) platform can help teams of any size rip out all the legacy appliances and services that tried to keep their data, devices, and applications safe without compromising speed.

We also built those products to work better together. Today, we’re bringing Cloudflare’s best-in-class browser isolation technology to our industry-leading Zero Trust access control product. Your team can now control the data in any application, and what a user can do in the application, with a single click in the Cloudflare dashboard. We’re excited to help you replace your private networks, virtual desktops, and data control boxes with a single, faster solution.

Zero Trust access control is just the first step

Most organizations begin their Zero Trust migration by replacing a virtual private network (VPN). VPN deployments trust too many users by default. In most configurations, any user on a private network can reach any resource on that same network.

The consequences vary. On one end of the spectrum, employees in marketing can accidentally stumble upon payroll amounts for the entire organization. At the other end, attackers who compromise the credentials of a support agent can move through a network to reach trade secrets or customer production data.

Zero Trust access control replaces this model by inverting the security posture. A Zero Trust network trusts no one by default. Every user and each request or connection, must prove they can reach a specific resource. Administrators can build granular rules and monitor comprehensive logs to prevent incidental or malicious access incidents.

Over 10,000 teams have adopted Cloudflare One to replace their own private network with a Zero Trust model. We offer those teams rules that go beyond just identity. Security teams can enforce hard key authentication for specific applications as a second factor. Sensitive production systems can require users to provide the reason they need temporary access while they request permission from a senior manager. We integrate with just about every device posture provider, or you can build your own, to ensure that only corporate devices connect to your systems.

The teams who deploy this solution improve the security of their enterprise overnight while also making their applications faster and more usable for employees in any region. However, once users pass all of those checks we still rely on the application to decide what they can and cannot do.

In some cases, that means Zero Trust access control is not sufficient. An employee planning to leave tomorrow could download customer contact info. A contractor connecting from an unmanaged device can screenshot schematics. As enterprises evolve on their SASE migration, they need to extend Zero Trust control to application usage and data.

Isolate sessions without any client software

Cloudflare’s browser isolation technology gives teams the ability to control usage and data without making the user experience miserable. Legacy approaches to browser isolation relied on one of two methods to secure a user on the public Internet:

  • Document Object Model (DOM) manipulation – unpack the webpage, inspect it, hope you caught the vulnerability, attempt to repack the webpage, deliver it. This model leads to thousands of broken webpages and total misses on zero days and other threats.
  • Pixel pushing – stream a browser running far away to the user, like a video. This model leads to user complaints due to performance and a long tail of input incompatibilities.

Cloudflare’s approach is different. We run headless versions of Chromium, the open source project behind Google Chrome and Microsoft Edge and other browsers, in our data centers around the world. We send the final rendering of the webpage, the draw commands, to a user’s local device.

One-click data security for your internal and SaaS applications

The user thinks it is just the Internet. Highlighting, right-clicking, videos – they all just work. Users do not need a special browser client. Cloudflare’s technology just works in any browser on mobile or desktop. For security teams, they can guarantee that code never executes on the devices in the field to stop Zero-Day attacks.

We added browser isolation to Cloudflare One to protect against attacks that leap out of a browser from the public Internet. However, controlling the browser also gives us the ability to pass that control along to security and IT departments, so they can focus on another type of risk – data misuse.

As part of this launch, when administrators secure an application with Cloudflare’s Zero Trust access control product, they can click an additional button that will force sessions into our isolated browser.

One-click data security for your internal and SaaS applications

When the user authenticates, Cloudflare Access checks all the Zero Trust rules configured for a given application. When this isolation feature is enabled, Cloudflare will silently open the session in our isolated browser. The user does not need any special software or to be trained on any unique steps. They just navigate to the application and start doing their work. Behind the scenes, the session runs entirely in Cloudflare’s network.

Control usage and data in sessions

By running the session in Cloudflare’s isolated browser, administrators can begin to build rules that replace some goals of legacy virtual desktop solutions. Some enterprises deploy virtual desktop instances (VDIs) to sandbox application usage. Those VDI platforms extended applications to employees and contractors without allowing the application to run on the physical device.

Employees and contractors tend to hate this method. The client software required is clunky and not available on every operating system. The speed slows them down. Administrators also need to invest time in maintaining the desktops and the virtualization software that power them.

We’re excited to help you replace that point solution, too. Once an application is isolated in Cloudflare’s network, you can toggle additional rules that control how users interact with the resource. For example, you can disable potential data loss vectors like file downloads, printing, or copy-pasting. Add watermarks, both visible and invisible, to audit screenshot leaks.

You can extend this control beyond just data loss. Some teams have sensitive applications where you need users to connect without inputting any data, but they do not have the developer time to build a “Read Only” mode. With Cloudflare One, those teams can toggle “Disable keyboard” and allow users to reach the service while blocking any input.

One-click data security for your internal and SaaS applications

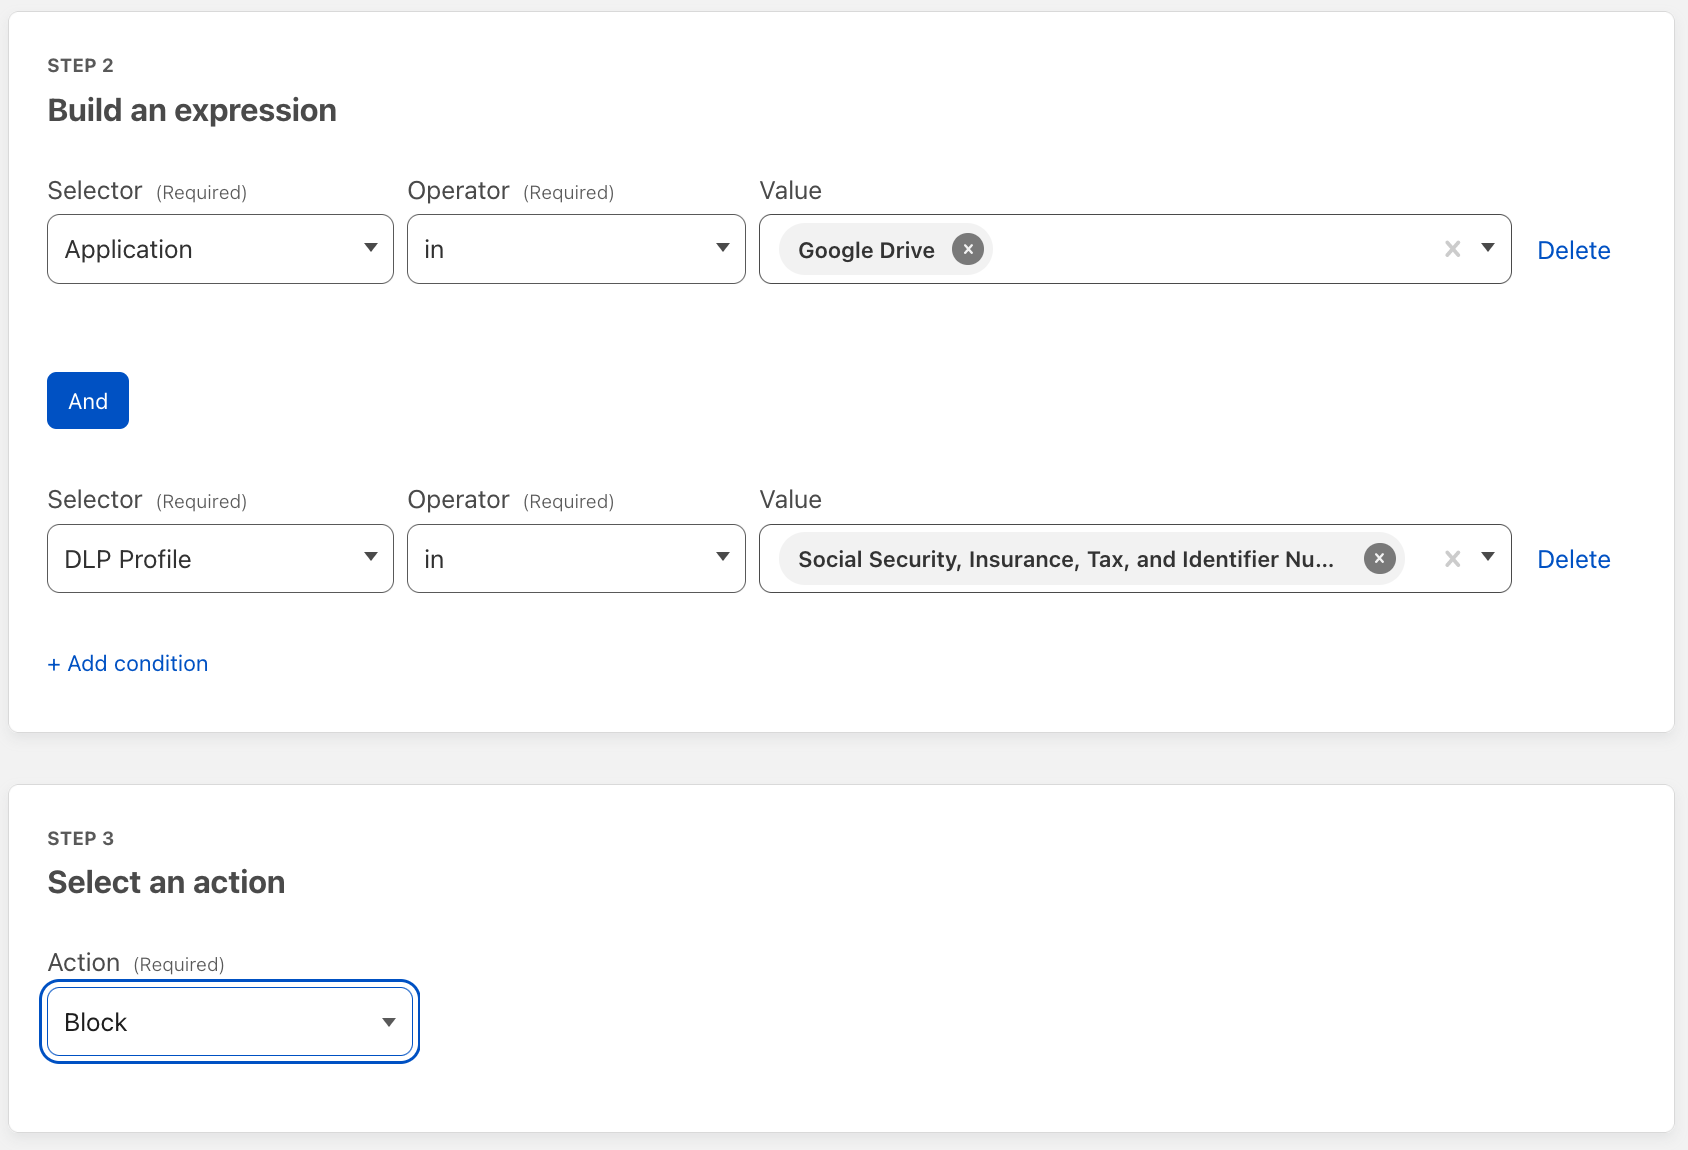
The isolated solution also integrates with Cloudflare One’s Data Loss Prevention (DLP) suite. With a few additional settings, you can bring comprehensive data control to your applications without any additional engineering work or point solution deployment. If a user strays too far in an application and attempts to download something that contains personal information like social security or credit card numbers, Cloudflare’s network will stop that download while still allowing otherwise approved files.

One-click data security for your internal and SaaS applications

Extend that control to SaaS applications

Most of the customers we hear from need to bring this level of data and usage control to their self-hosted applications. Many of the SaaS tools they rely on have more advanced role-based rules. However, that is not always the case and, even if the rules exist, they are not as comprehensive as needed and require an administrator to manage a dozen different application settings.

To avoid that hassle you can bring Cloudflare One’s one-click isolation feature to your SaaS applications, too. Cloudflare’s access control solution can be configured as an identity proxy that will force all logins to any SaaS application that supports SSO through Cloudflare’s network where additional rules, including isolation, can be applied.

What’s next?

Today’s announcement brings together two of our customers’ favorite solutions – our Cloudflare Access solution and our browser isolation technology. Both products are available to use today. You can start building rules that force isolation or control data usage by following the guides linked here.

Willing to wait for the easy button? Join the beta today for the one-click version that we are rolling out to customer accounts.

How Cloudflare Area 1 and DLP work together to protect data in email

Post Syndicated from Ayush Kumar original https://blog.cloudflare.com/dlp-area1-to-protect-data-in-email/

How Cloudflare Area 1 and DLP work together to protect data in email

How Cloudflare Area 1 and DLP work together to protect data in email

Threat prevention is not limited to keeping external actors out, but also keeping sensitive data in. Most organizations do not realize how much confidential information resides within their email inboxes. Employees handle vast amounts of sensitive data on a daily basis, such as intellectual property, internal documentation, PII, or payment information and often share this information internally via email making email one of the largest locations confidential information is stored within a company. It comes as no shock that organizations worry about protecting the accidental or malicious egress of sensitive data and often address these concerns by instituting strong Data Loss Prevention policies. Cloudflare makes it easy for customers to manage the data in their email inboxes with Area 1 Email Security and Cloudflare One.

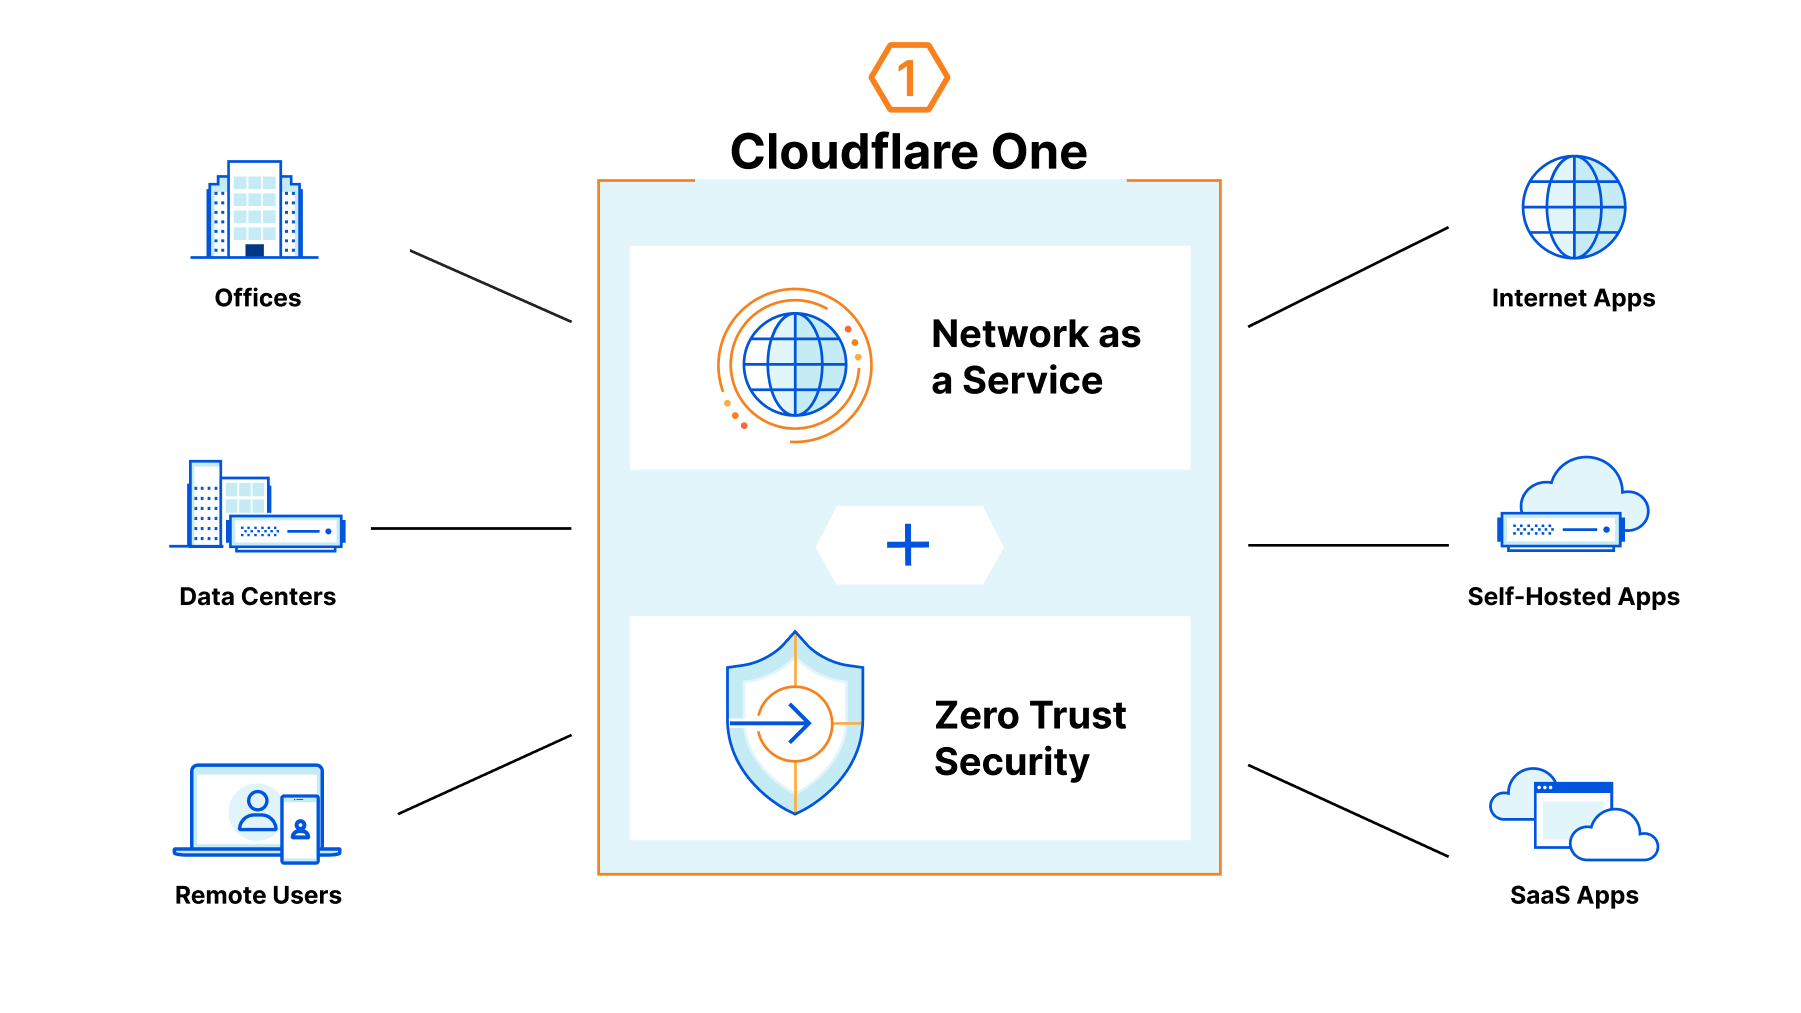
Cloudflare One, our SASE platform that delivers network-as-a-service (NaaS) with Zero Trust security natively built-in, connects users to enterprise resources, and offers a wide variety of opportunities to secure corporate traffic, including the inspection of data transferred to your corporate email. Area 1 email security, as part of our composable Cloudflare One platform, delivers the most complete data protection for your inbox and offers a cohesive solution when including additional services, such as Data Loss Prevention (DLP). With the ability to easily adopt and implement Zero Trust services as needed, customers have the flexibility to layer on defenses based on their most critical use cases. In the case of Area 1 + DLP, the combination can collectively and preemptively address the most pressing use cases that represent high-risk areas of exposure for organizations. Combining these products provides the in-depth defense of your corporate data.

Preventing egress of cloud email data via HTTPs

Email provides a readily available outlet for corporate data, so why let sensitive data reach email in the first place? An employee can accidentally attach an internal file rather than a public white paper in a customer email, or worse, attach a document with the wrong customers’ information to an email.

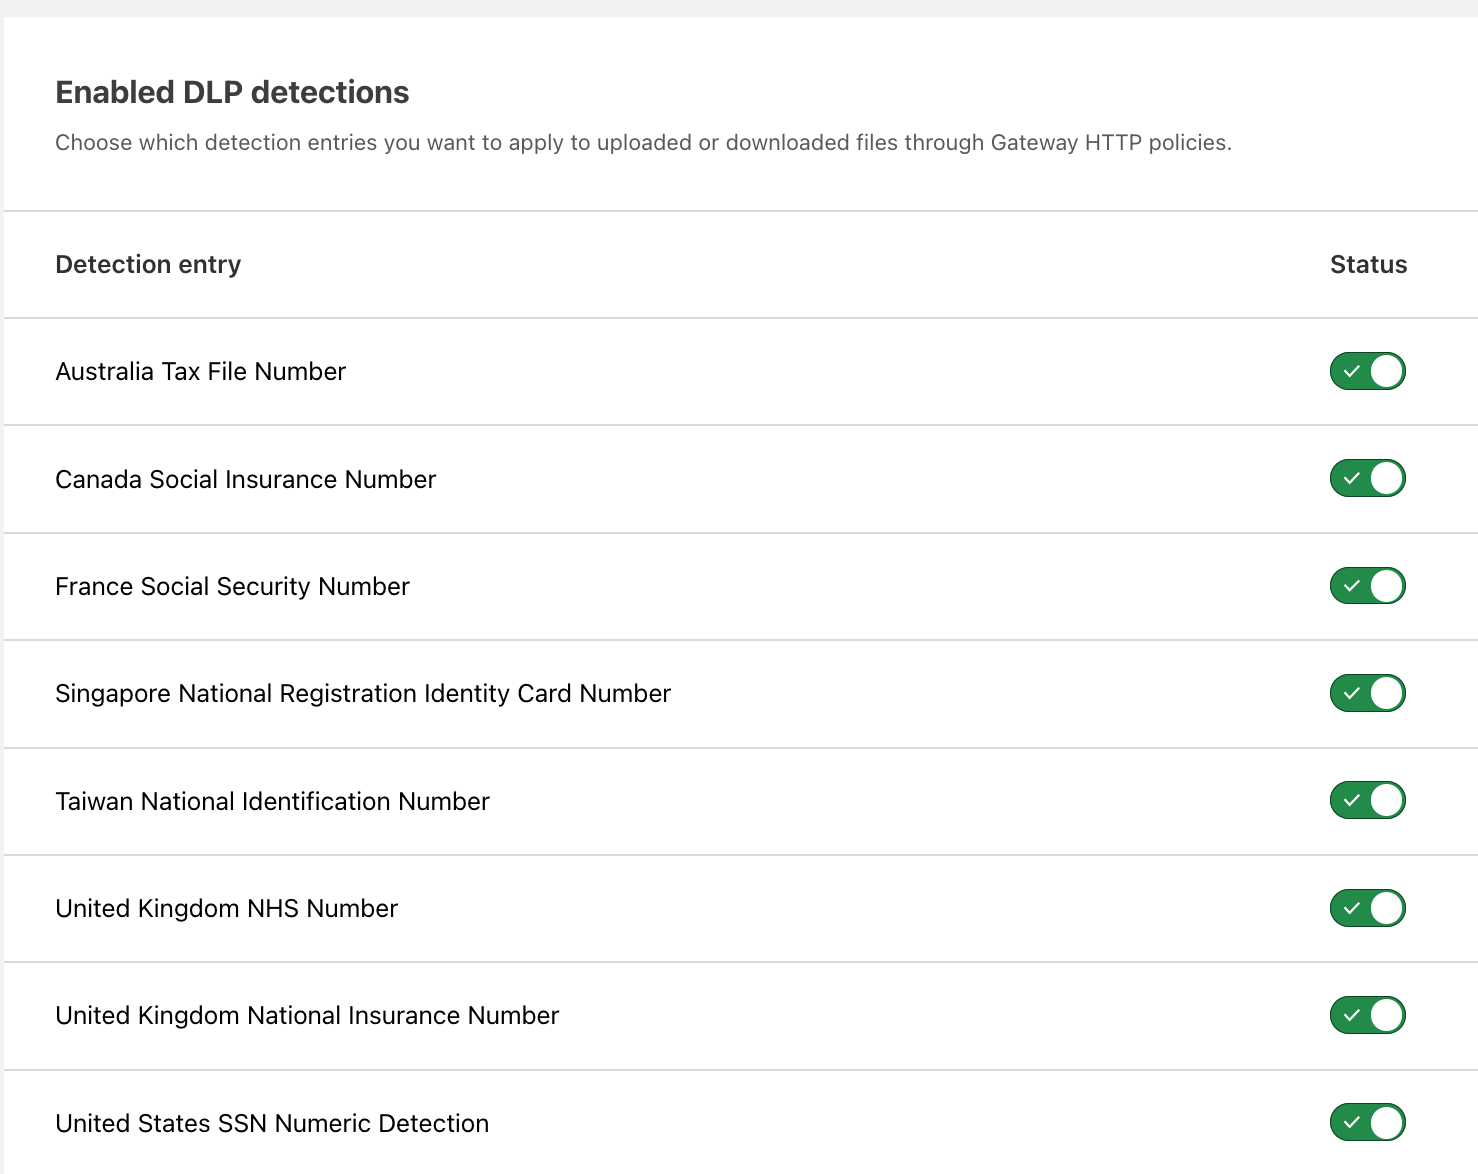
With Cloudflare Data Loss Prevention (DLP) you can prevent the upload of sensitive information, such as PII or intellectual property, to your corporate email. DLP is offered as part of Cloudflare One, which runs traffic from data centers, offices, and remote users through the Cloudflare network.  As traffic traverses Cloudflare, we offer protections including validating identity and device posture and filtering corporate traffic.

How Cloudflare Area 1 and DLP work together to protect data in email

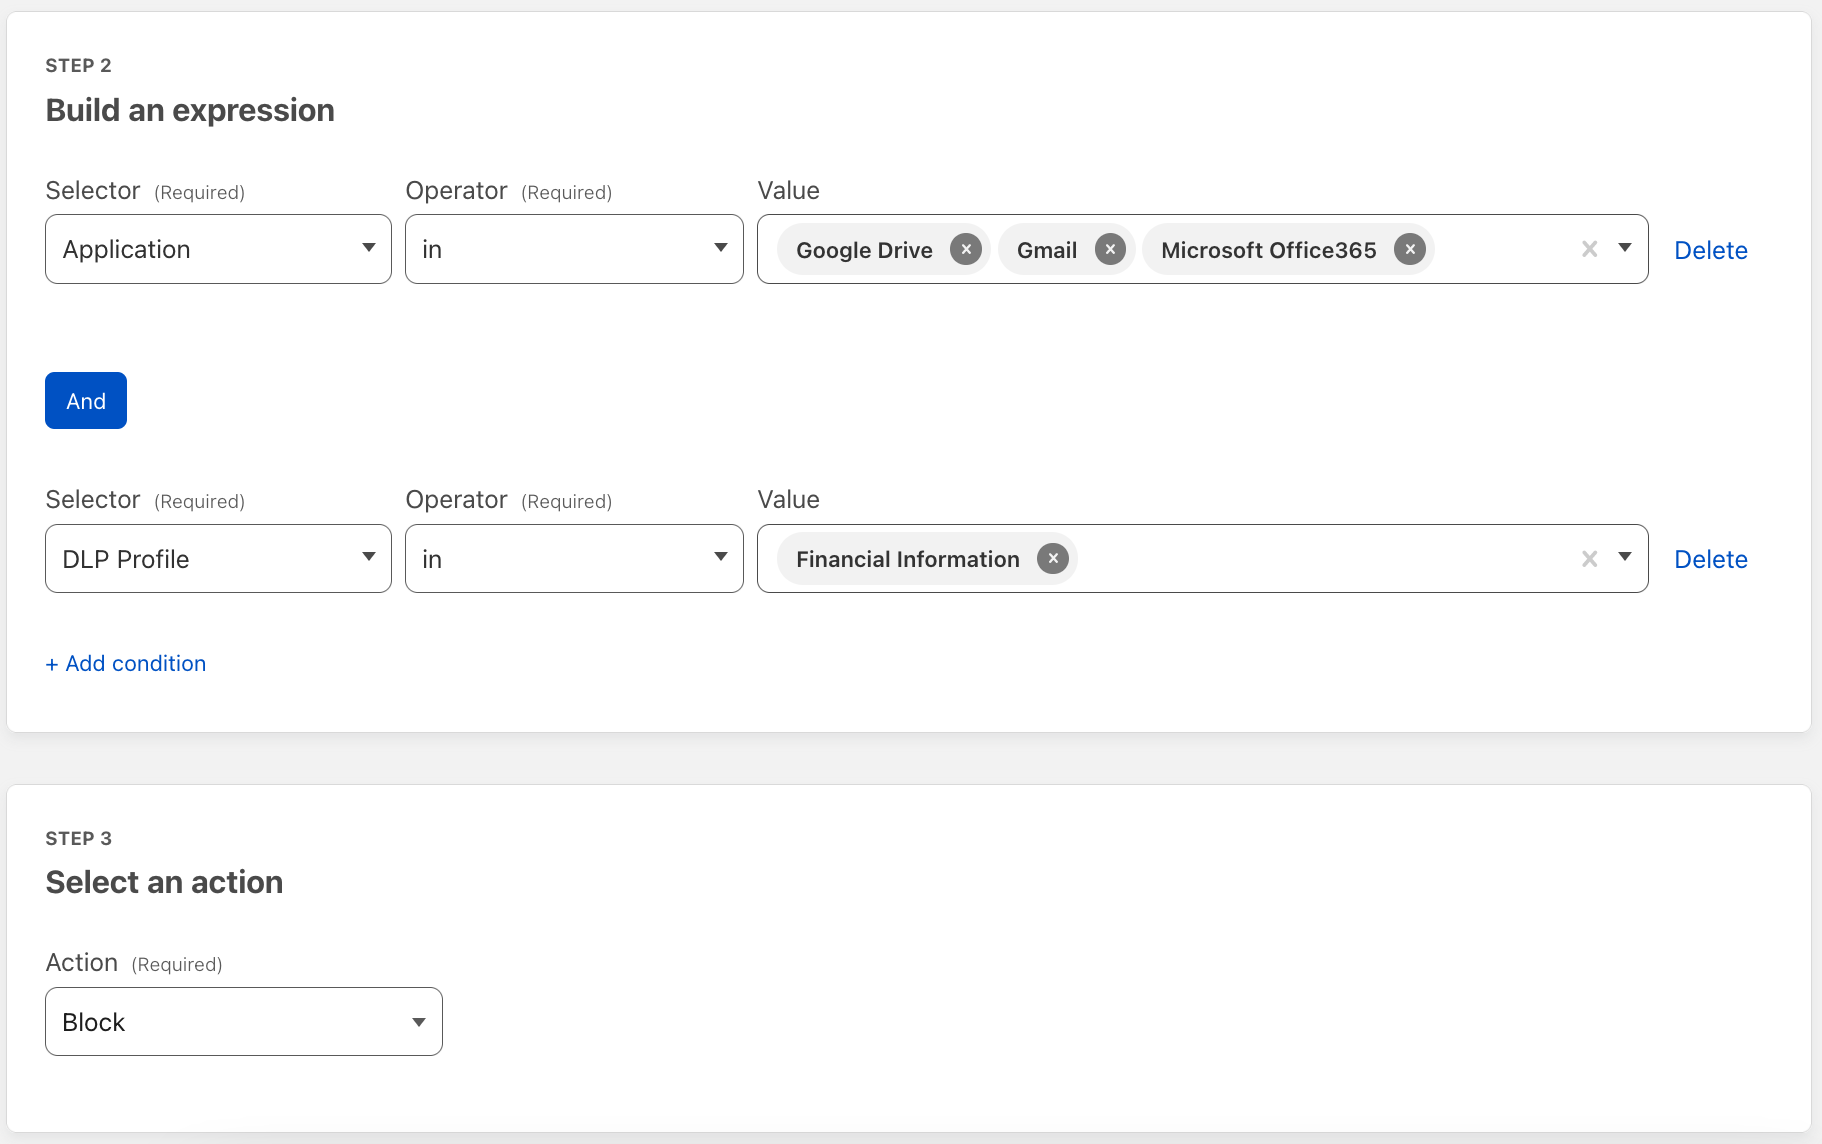
Cloudflare One offers HTTP(s) filtering, enabling you to inspect and route the traffic to your corporate applications. Cloudflare Data Loss Prevention (DLP) leverages the HTTP filtering abilities of Cloudflare One. You can apply rules to your corporate traffic and route traffic based on information in an HTTP request. There are a wide variety of options for filtering, such as domain, URL, application, HTTP method, and many more. You can use these options to segment the traffic you wish to DLP scan. All of this is done with the performance of our global network and managed with one control plane.

You can apply DLP policies to corporate email applications, such as Google Suite or O365.  As an employee attempts to upload an attachment to an email, the upload is inspected for sensitive data, and then allowed or blocked according to your policy.

How Cloudflare Area 1 and DLP work together to protect data in email

Inside your corporate email extend more core data protection principles with Area 1 in the following ways:

Enforcing data security between partners

With Cloudflare’s Area 1, you can also enforce strong TLS standards. Having TLS configured adds an extra layer of security as it ensures that emails are encrypted, preventing any attackers from reading sensitive information and changing the message if they intercept the email in transit (on-path-attack). This is especially useful for G Suite customers whose internal emails still go out to the whole Internet in front of prying eyes or for customers who have contractual obligations to communicate with partners with SSL/TLS.

Area 1 makes it easy to enforce SSL/TLS inspections. From the Area 1 portal, you can configure Partner Domain(s) TLS by navigating “Partner Domains TLS” within “Domains & Routing” and adding a partner domain with which you want to enforce TLS. If TLS is required then all emails from that domain with no TLS will be automatically dropped. Our TLS ensures strong TLS rather than the best effort in order to make sure that all traffic is encrypted with strong ciphers preventing a malicious attacker from being able to decrypt any intercepted emails.

How Cloudflare Area 1 and DLP work together to protect data in email

Stopping passive email data loss

Organizations often forget that exfiltration also can be done without ever sending any email. Attackers who are able to compromise a company account are able to passively sit by, monitoring all communications and picking out information manually.

Once an attacker has reached this stage, it is incredibly difficult to know an account is compromised and what information is being tracked. Indicators like email volume, IP address changes, and others do not work since the attacker is not taking any actions that would cause suspicion. At Cloudflare, we have a strong thesis on preventing these account takeovers before they take place, so no attacker is able to fly under the radar.

In order to stop account takeovers before they happen, we place great emphasis on filtering emails that pose a risk for stealing employee credentials. The most common attack vector used by malicious actors are phishing emails. Given its ability to have a high impact in accessing confidential data when successful, it’s no shock that this is the go-to tool in the attackers tool kit. Phishing emails pose little threat to an email inbox protected by Cloudflare’s Area 1 product. Area 1’s models are able to assess if a message is a suspected phishing email by analyzing different metadata. Anomalies detected by the models like domain proximity (how close a domain is to the legitimate one), sentiment of email, or others can quickly determine if an email is legitimate or not. If Area 1 determines an email to be a phishing attempt, we automatically retract the email and prevent the recipient from receiving the email in their inbox ensuring that the employee’s account remains uncompromised and unable to be used to exfiltrate data.

Attackers who are looking to exfiltrate data from an organization also often rely on employees clicking on links sent to them via email. These links can point to online forms which on the surface look innocuous but serve to gather sensitive information. Attackers can use these websites to initiate scripts which gather information about the visitor without any interaction from the employee. This presents a strong concern since an errant click by an employee can lead to the exfiltration of sensitive information. Other malicious links can contain exact copies of websites which the user is accustomed to accessing. However, these links are a form of phishing where the credentials entered by the employee are sent to the attacker rather than logging them into the website.

Area 1 covers this risk by providing Email Link Isolation as part of our email security offering. With email link isolation, Area 1 looks at every link sent and accesses its domain authority. For anything that’s on the margin (a link we cannot confidently say is safe), Area 1 will launch a headless Chromium browser and open the link there with no interruption. This way, any malicious scripts that execute will run on an isolated instance far from the company’s infrastructure, stopping the attacker from getting company information. This is all accomplished instantaneously and reliably.

Stopping Ransomware

Attackers have many tools in their arsenal to try to compromise employee accounts. As we mentioned above, phishing is a common threat vector, but it’s far from the only one. At Area 1, we are also vigilant in preventing the propagation of ransomware.

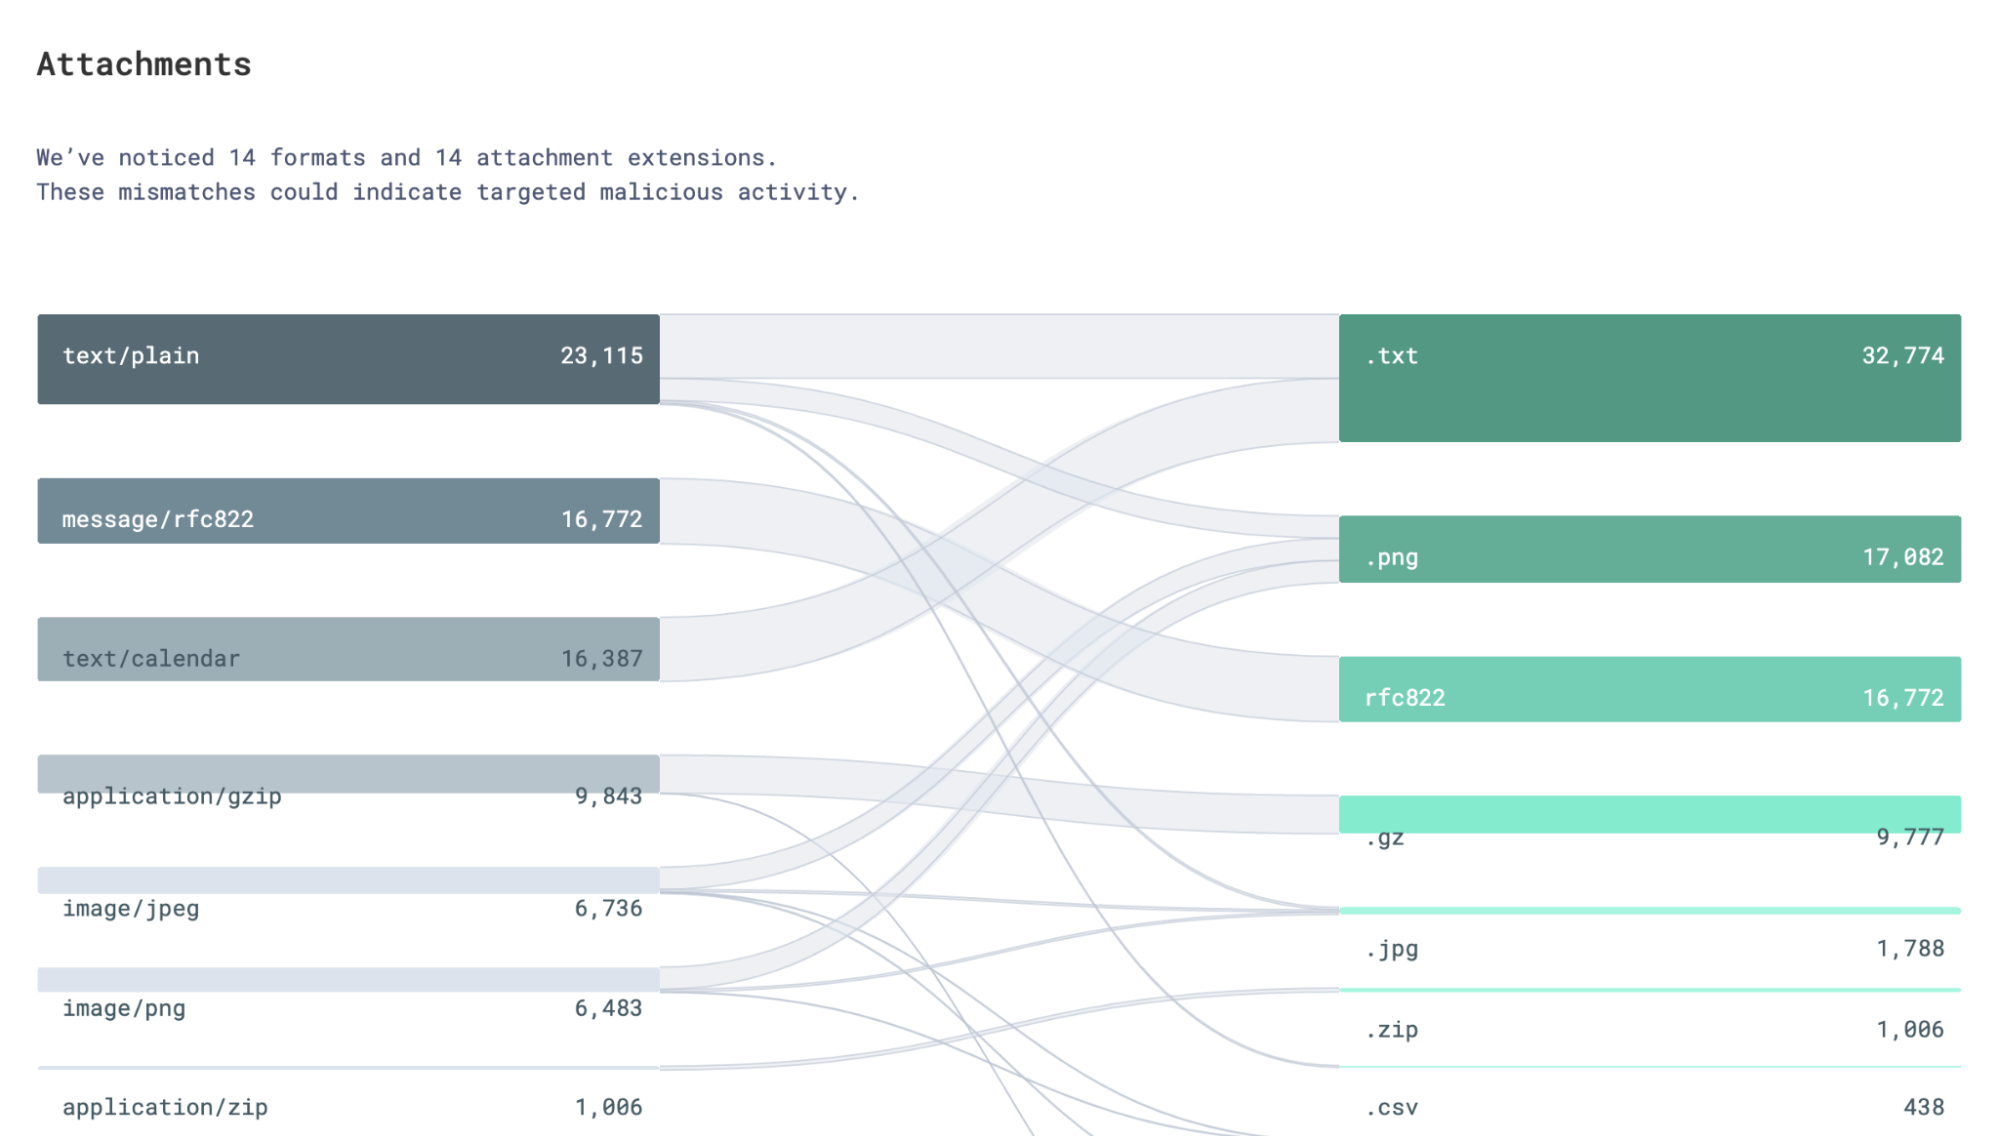
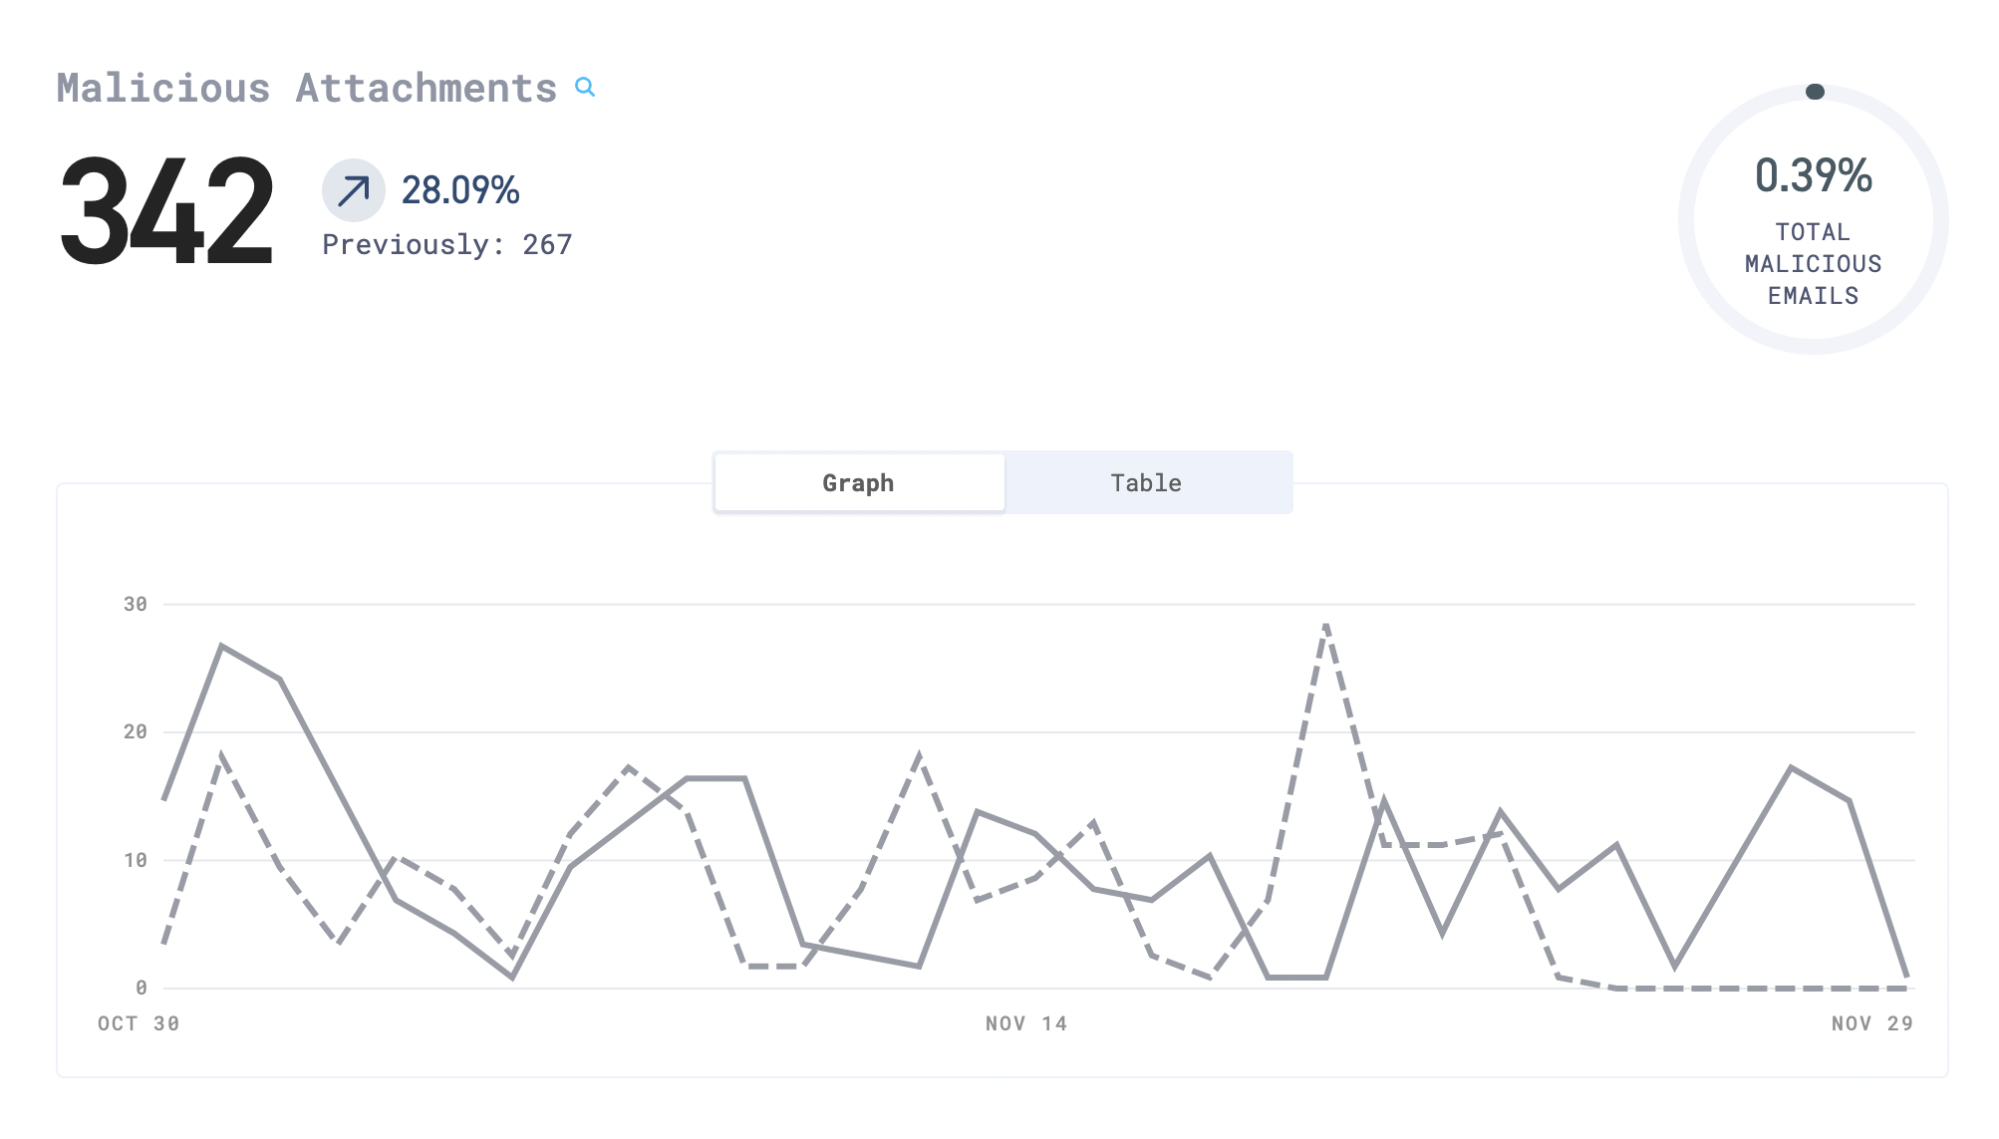
A common mechanism that attackers use to disseminate ransomware is to disguise attachments by renaming them. A ransomware payload could be renamed from petya.7z to Invoice.pdf in order to try to trick an employee into downloading the file. Depending on how urgent the email made this invoice seem, the employee could blindly try to open the attachment on their computer causing the organization to suffer a ransomware attack. Area 1’s models detect these mismatches and stop malicious ones from arriving into their target’s email inbox.

How Cloudflare Area 1 and DLP work together to protect data in email

A successful ransomware campaign can not only stunt the daily operations of any company, but can also lead to the loss of local data if the encryption is unable to be reversed. Cloudflare’s Area 1 product has dedicated payload models which analyze not only the attachment extensions but also the hashed value of the attachment to compare it to known ransomware campaigns. Once Area 1 finds an attachment deemed to be ransomware, we prohibit the email from going any further.

How Cloudflare Area 1 and DLP work together to protect data in email

Cloudflare’s DLP vision

We aim for Cloudflare products to give you the layered security you need to protect your organization, whether its malicious attempts to get in or sensitive data getting out. As email continues to be the largest surface of corporate data, it is crucial for companies to have strong DLP policies in place to prevent the loss of data. With Area 1 and Cloudflare One working together, we at Cloudflare are able to provide organizations with more confidence about their DLP policies.

If you are interested in these email security or DLP services, contact us for a conversation about your security and data protection needs.

Or if you currently subscribe to Cloudflare services, consider reaching out to your Cloudflare customer success manager to discuss adding additional email security or DLP protection.

How Cloudflare CASB and DLP work together to protect your data

Post Syndicated from Alex Dunbrack original https://blog.cloudflare.com/casb-dlp/

How Cloudflare CASB and DLP work together to protect your data

How Cloudflare CASB and DLP work together to protect your data

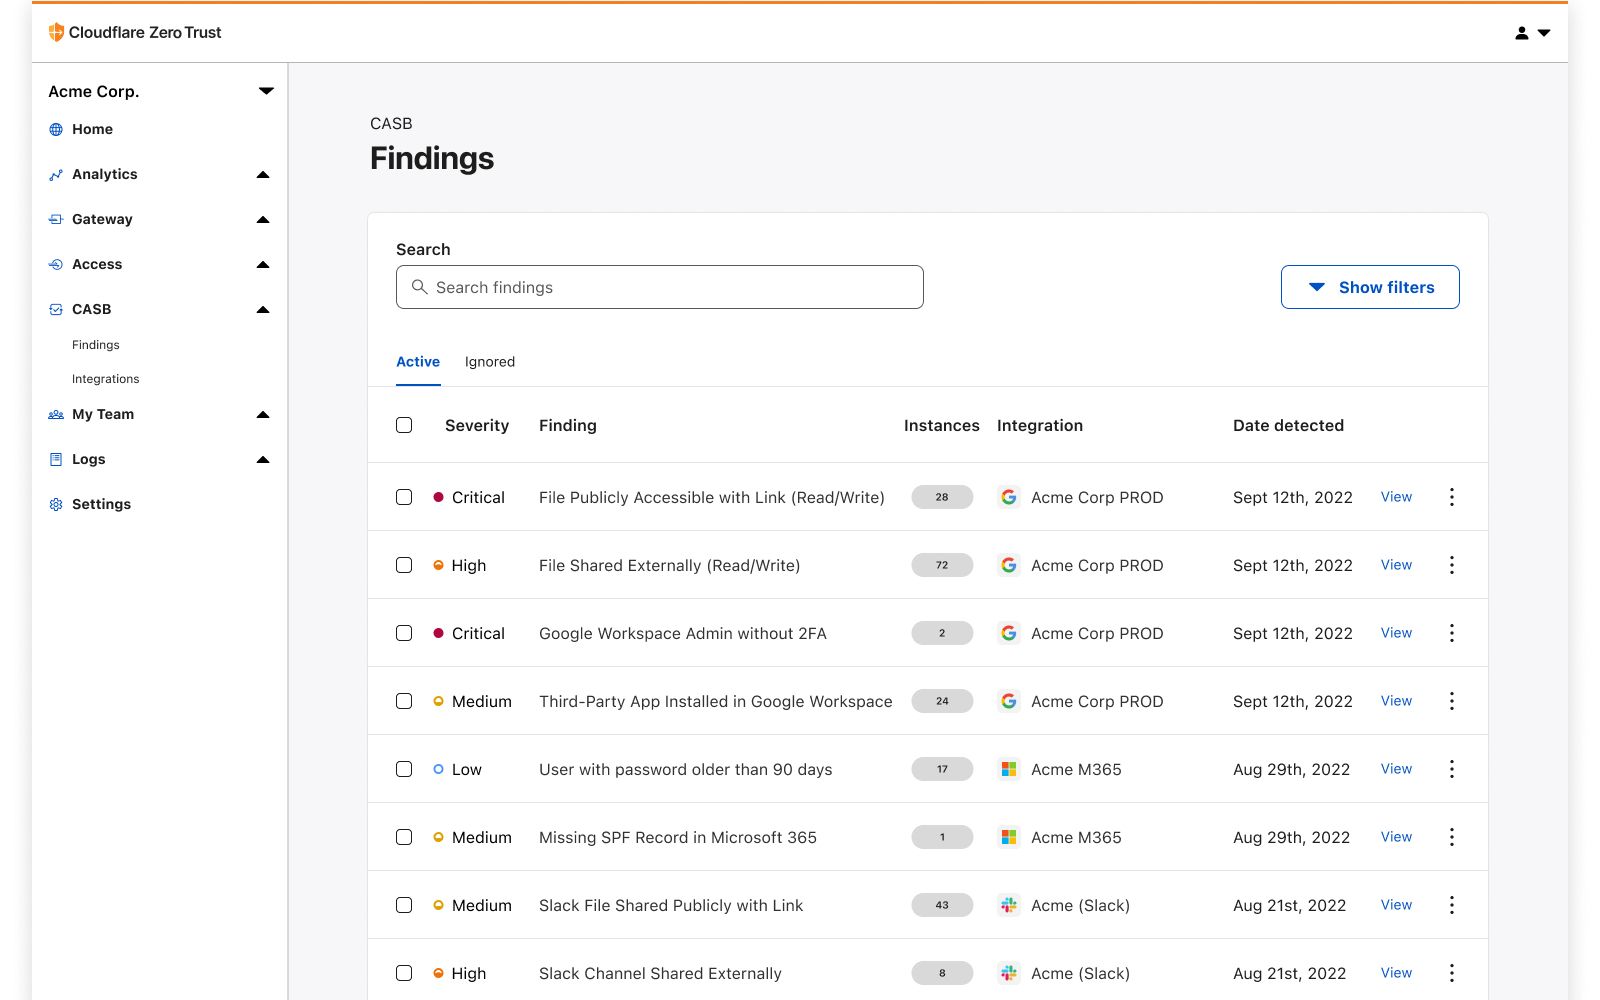
Cloudflare’s Cloud Access Security Broker (CASB) scans SaaS applications for misconfigurations, unauthorized user activity, shadow IT, and other data security issues. Discovered security threats are called out to IT and security administrators for timely remediation, removing the burden of endless manual checks on a long list of applications.

But Cloudflare customers revealed they want more information available to assess the risk associated with a misconfiguration. A publicly exposed intramural kickball schedule is not nearly as critical as a publicly exposed customer list, so customers want them treated differently. They asked us to identify where sensitive data is exposed, reducing their assessment and remediation time in the case of leakages and incidents. With that feedback, we recognized another opportunity to do what Cloudflare does best: combine the best parts of our products to solve customer problems.

What’s underway now is an exciting effort to provide Zero Trust users a way to get the same DLP coverage for more than just sensitive data going over the network: SaaS DLP for data stored in popular SaaS apps used by millions of organizations.

With these upcoming capabilities, customers will be able to connect their SaaS applications in just a few clicks and scan them for sensitive data – such as PII, PCI, and even custom regex – stored in documents, spreadsheets, PDFs, and other uploaded files. This gives customers the signals to quickly assess and remediate major security risks.

Understanding CASB

How Cloudflare CASB and DLP work together to protect your data

Released in September, Cloudflare’s API CASB has already enabled organizations to quickly and painlessly deep-dive into the security of their SaaS applications, whether it be Google Workspace, Microsoft 365, or any of the other SaaS apps we support (including Salesforce and Box released today). With CASB, operators have been able to understand what SaaS security issues could be putting their organization and employees at risk, like insecure settings and misconfigurations, files shared inappropriately, user access risks and best practices not being followed.

“But what about the sensitive data stored inside the files we’re collaborating on? How can we identify that?”

Understanding DLP

Also released in September, Cloudflare DLP for data in-transit has provided users of Gateway, Cloudflare’s Secure Web Gateway (SWG), a way to manage and outright block the movement of sensitive information into and out of the corporate network, preventing it from landing in the wrong hands. In this case, DLP can spot sensitive strings, like credit card and social security numbers, as employees attempt to communicate them in one form or another, like uploading them in a document to Google Drive or sent in a message on Slack. Cloudflare DLP blocks the HTTP request before it reaches the intended application.

How Cloudflare CASB and DLP work together to protect your data

But once again we received the same questions and feedback as before.

“What about data in our SaaS apps? The information stored there won’t be visible over the network.”

CASB + DLP, Better Together

Coming in early 2023, Cloudflare Zero Trust will introduce a new product synergy that allows customers to peer into the files stored in their SaaS applications and identify any particularly sensitive data inside them.

Credit card numbers in a Google Doc? No problem. Social security numbers in an Excel spreadsheet? CASB will let you know.

With this product collaboration, Cloudflare will provide IT and security administrators one more critical area of security coverage, rounding out our data loss prevention story. Between DLP for data in-transit, CASB for file sharing monitoring, and even Remote Browser Isolation (RBI) and Area 1 for data in-use DLP and email DLP, respectively, organizations can take comfort in knowing that their bases are covered when it comes to data exfiltration and misuse.

While development continues, we’d love to hear how this kind of functionality could be used at an organization like yours. Interested in learning more about either of these products or what’s coming next? Reach out to your account manager or click here to get in touch if you’re not already using Cloudflare.

Team Collaboration with Amazon CodeCatalyst

Post Syndicated from original https://aws.amazon.com/blogs/devops/team-collaboration-with-amazon-codecatalyst/

Amazon CodeCatalyst enables teams to collaborate on features, tasks, bugs, and any other work involved when building software. CodeCatalyst was announced at re:Invent 2022 and is currently in preview.

Introduction:

In a prior post in this series, Using Workflows to Build, Test, and Deploy with Amazon CodeCatalyst, I discussed reading The Unicorn Project, by Gene Kim, and how the main character, Maxine, struggles with a complicated software development lifecycle (SLDC) after joining a new team. Some of the challenges she encounters include:

  • Continually delivering high-quality updates is complicated and slow
  • Collaborating efficiently with others is challenging
  • Managing application environments is increasingly complex
  • Setting up a new project is a time-consuming chore

In this post, I will focus on the second bullet, and how CodeCatalyst helps you collaborate from anywhere with anyone.

Prerequisites

If you would like to follow along with this walkthrough, you will need to:

Walkthrough

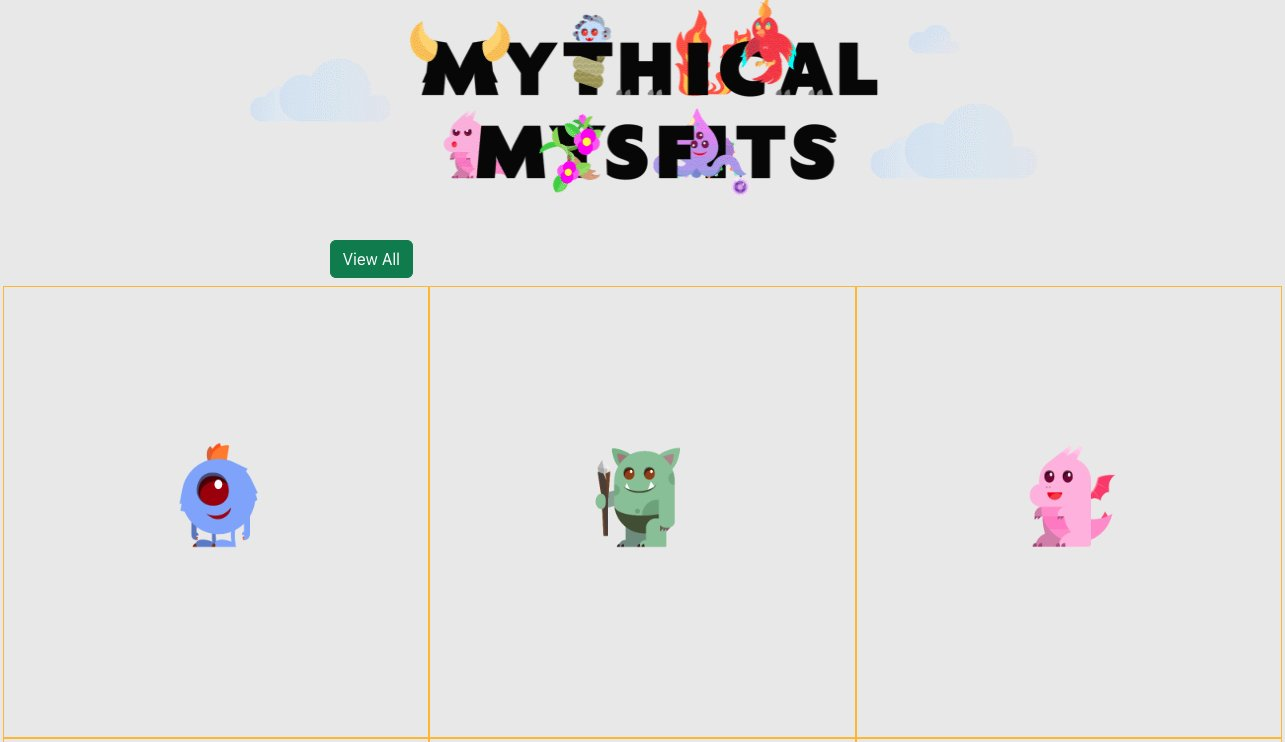
Similar to the prior post, I am going to use the Modern Three-tier Web Application blueprint in this walkthrough. A CodeCatalyst blueprint provides a template for a new project. If you would like to follow along, you can launch the blueprint as described in Creating a project in Amazon CodeCatalyst.  This will deploy the Mythical Mysfits sample application shown in the following image.

The Mythical Mysfits user interface showing header and three Mysfits

Figure 1. The Mythical Mysfits user interface showing header and three Mysfits

For this Walkthrough, let us assume that I need to make a simple change to the application. The legal department would like to add a footer that includes the text “© 2023 Demo Organization.” I will create an issue in CodeCatalyst to track this work and use CodeCatalyst to track the change throughout the entire Software Development Life Cycle (SDLC).

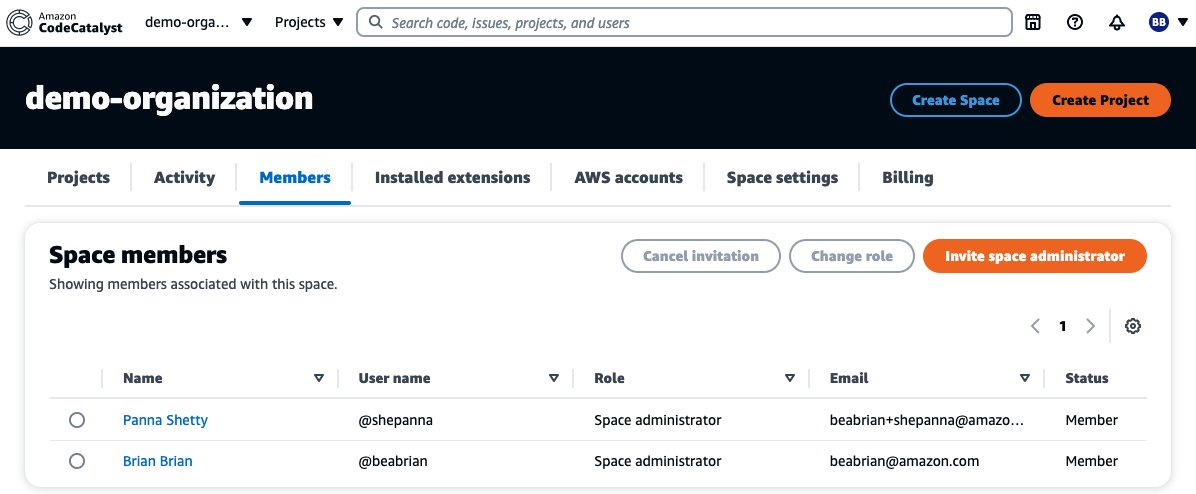
CodeCatalyst organizes projects into Spaces. A space represents your company, department, or group; and contains projects, members, and the associated cloud resources you create in CodeCatalyst. In this walkthrough, my Space currently includes two members, Brian Beach and Panna Shetty, as shown in the following screenshot.  Note that both users are administrators, but CodeCatalyst supports multiple roles. You can read more about roles in members of your space.

The space members configuration page showing two users

Figure 2. The space members configuration page showing two users

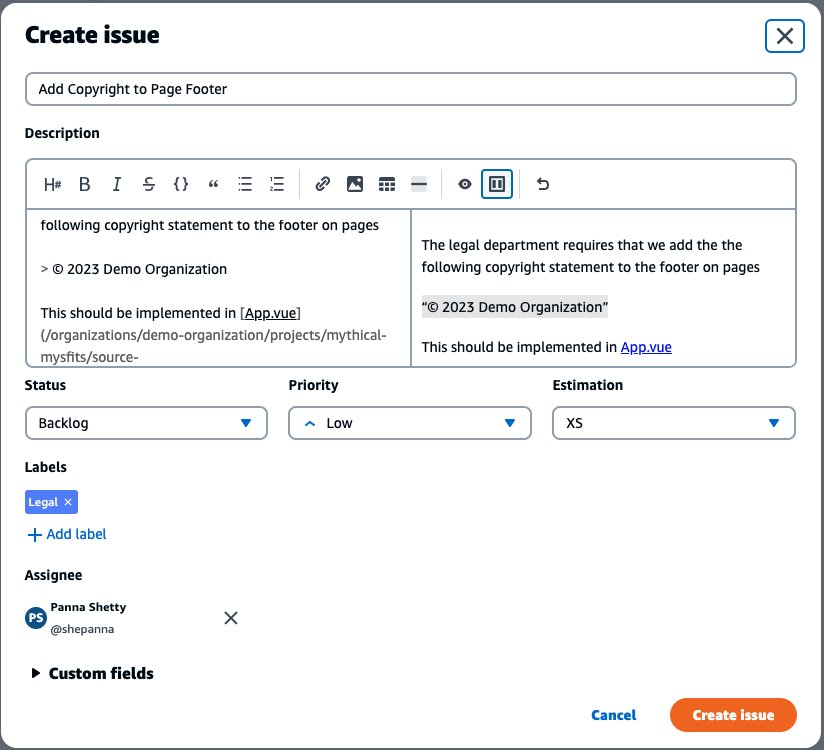
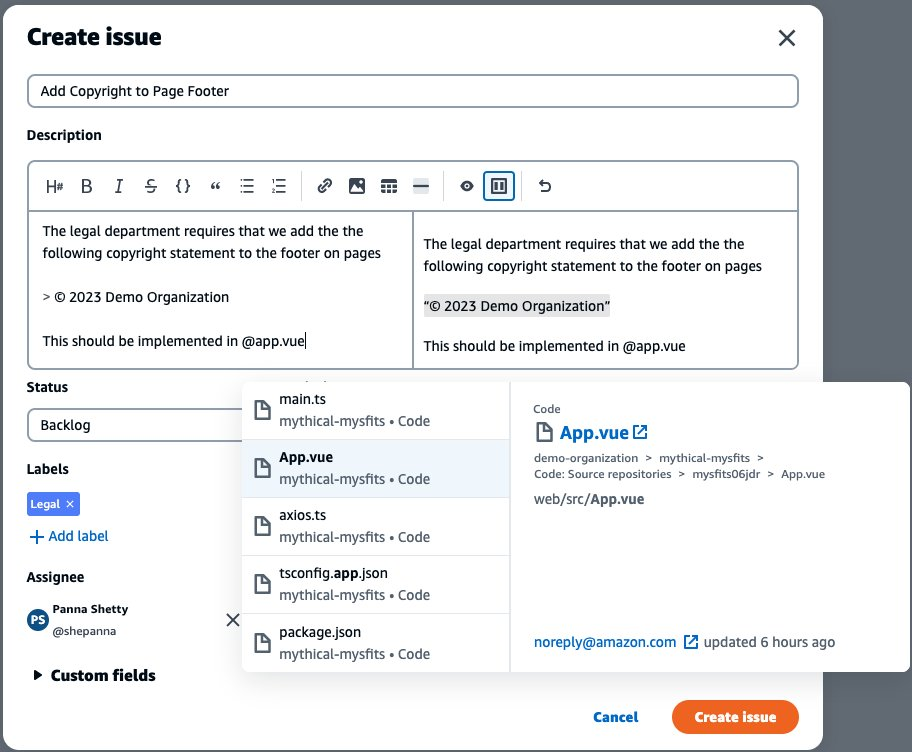
To begin, Brian creates a new issue to track the request from legal. He assigns the issue to Panna, but leaves it in the backlog for now. Note that CodeCatalyst supports multiple metadata fields to organize your work. This issue is not impacting users and is relatively simple to fix. Therefore, Brian has categorized it as low priority and estimated the effort as extra small (XS). Brian has also added a label, so all the requests from legal can be tracked together. Note that these metadata fields are customizable. You can read more in configuring issue settings.

Create issue dialog box with name, description and metadata

Figure 3. Create issue dialog box with name, description and metadata

CodeCatalyst supports rich markdown in the description field. You can read about this in Markdown tips and tricks. In the following screenshot, Brian types “@app.vue” which brings up an inline search for people, issues, and code to help Panna find the relevant bit of code that needs changing later.

Create issue dialog box with type-ahead overlay

Figure 4. Create issue dialog box with type-ahead overlay

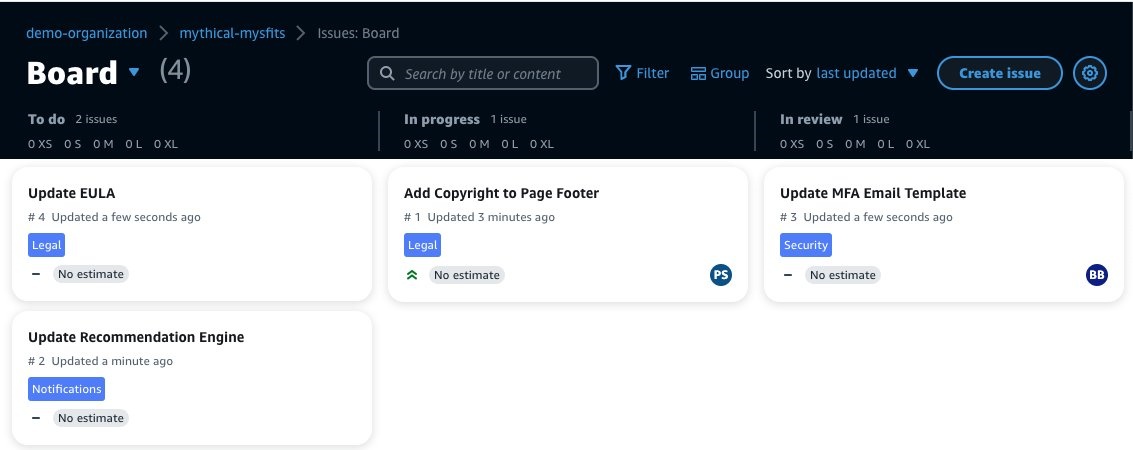
When Panna is ready to begin work on the new feature, she moves the issue from the “Backlog“ to ”In progress.“ CodeCatalyst allows users to manage their work using a Kanban style board. Panna can simply drag-and-drop issues on the board to move the issue from one state to another. Given the small team, Brian and Panna use a single board. However, CodeCatalyst allows you to create multiple views filtered by the metadata fields discussed earlier. For example, you might create a label called Sprint-001, and use that to create a board for the sprint.

Kanban board showing to do, in progress and in review columns

Figure 5. Kanban board showing to do, in progress and in review columns

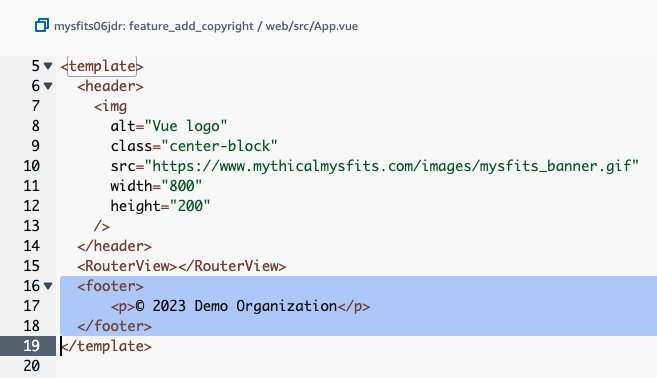
Panna creates a new branch for the change called feature_add_copyright and uses the link in the issue description to navigate to the source code repository. This change is so simple that she decides to edit the file in the browser and commits the change. Note that for more complex changes, CodeCatalyst supports Dev Environments. The next post in this series will be dedicated to Dev Environments. For now, you just need to know that a Dev Environment is a cloud-based development environment that you can use to quickly work on the code stored in the source repositories of your project.

Editor with new lines highlighted

Figure 6. Editor with new lines highlighted

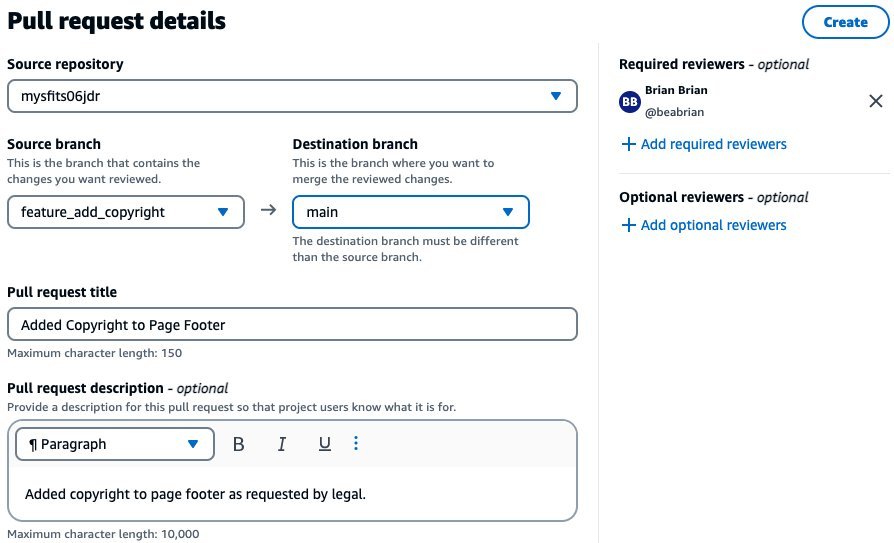
Panna also creates a pull request to merge the feature branch in to the main branch. She identifies Brian as a required reviewer. Panna then moves the issue to the “In review” column on the Kanban board so the rest of the team can track the progress. Once Brian reviews the change, he approves and merges the pull request.

Pull request details with title, description, and reviewed assigned

Figure 7. Pull request details with title, description, and reviewed assigned

When the pull request is merged, a workflow is configured to run automatically on code changes to build, test, and deploy the change. Note that Workflows were covered in the prior post in this series. Once the workflow is complete, Panna is notified in the team’s Slack channel. You can read more about notifications in working with notifications in CodeCatalyst. She verifies the change in production and moves the issue to the done column on the Kanban board.

Kanban board showing in progress, in review, and done columns

Figure 8. Kanban board showing in progress, in review, and done columns

Once the deployment completes, you will see the footer added at the bottom of the page.

Figure 9. The Mythical Mysfits user interface showing footer and three Mysfits

At this point the issue is complete and you have seen how this small team collaborated to progress through the entire software development lifecycle (SDLC).

Cleanup

If you have been following along with this workflow, you should delete the resources you deployed so you do not continue to incur charges. First, delete the two stacks that CDK deployed using the AWS CloudFormation console in the AWS account you associated when you launched the blueprint. These stacks will have names like mysfitsXXXXXWebStack and mysfitsXXXXXAppStack. Second, delete the project from CodeCatalyst by navigating to Project settings and choosing Delete project.

Conclusion

In this post, you learned how CodeCatalyst can help you rapidly collaborate with other developers. I used issues to track feature and bugs, assigned code reviews, and managed pull requests. In future posts I will continue to discuss how CodeCatalyst can address the rest of the challenges Maxine encountered in The Unicorn Project.

About the authors:

Brian Beach

Brian Beach has over 20 years of experience as a Developer and Architect. He is currently a Principal Solutions Architect at Amazon Web Services. He holds a Computer Engineering degree from NYU Poly and an MBA from Rutgers Business School. He is the author of “Pro PowerShell for Amazon Web Services” from Apress. He is a regular author and has spoken at numerous events. Brian lives in North Carolina with his wife and three kids.

Panna Shetty

Panna Shetty is a Sr. Solutions Architect with Amazon Web Services (AWS), working with public sector customers. She enjoys helping customers architect and build scalable and
reliable modern applications using cloud-native technologies.

Patch Tuesday – January 2023

Post Syndicated from Greg Wiseman original https://blog.rapid7.com/2023/01/10/patch-tuesday-january-2023/

Patch Tuesday - January 2023

Microsoft is starting the new year with a bang! Today’s Patch Tuesday release addresses almost 100 CVEs. After a relatively mild holiday season, defenders and admins now have a wide range of exciting new vulnerabilities to consider.

Two zero-day vulnerabilities emerged today, both affecting a wide range of current Windows operating systems.

CVE-2023-21674 allows Local Privilege Escalation (LPE) to SYSTEM via a vulnerability in Windows Advanced Local Procedure Call (ALPC), which Microsoft has already seen exploited in the wild. Given its low attack complexity, the existence of functional proof-of-concept code, and the potential for sandbox escape, this may be a vulnerability to keep a close eye on. An ALPC zero-day back in 2018 swiftly found its way into a malware campaign.

CVE-2023-21549 is Windows SMB elevation for which Microsoft has not yet seen in-the-wild exploitation or a solid proof-of-concept, although Microsoft has marked it as publicly disclosed.

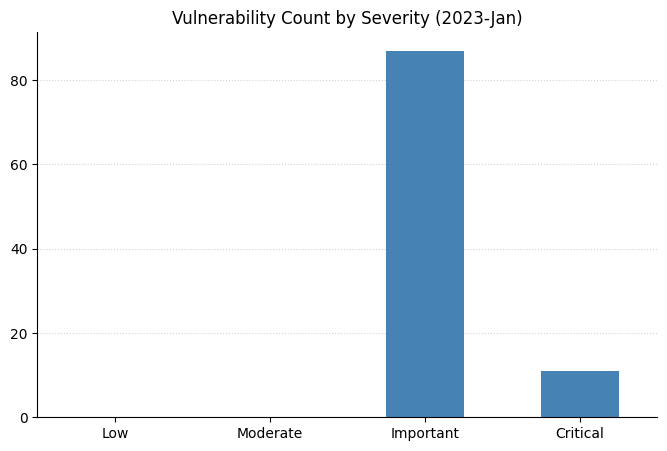
This Patch Tuesday also includes a batch of seven Critical Remote Code Execution (RCE) vulnerabilities. These are split between Windows Secure Socket Tunneling Protocol (SSTP) – source of another Critical RCE last month – and Windows Layer 2 Tunneling Protocol (L2TP). Happily, none of these has yet been seen exploited in the wild, and Microsoft has assessed all seven as “exploitation less likely” (though time will tell).

Today’s haul includes two Office Remote Code Execution vulnerabilities. Both CVE-2023-21734 and CVE-2023-21735 sound broadly familiar: a user needs to be tricked into running malicious files. Unfortunately, the security update for Microsoft Office 2019 for Mac and Microsoft Office LTSC for Mac 2021 are not immediately available, so admins with affected assets will need to check back later and rely on other defenses for now.

On the server side, five CVEs affecting Microsoft Exchange Server were addressed today: two Spoofing vulnerabilities, two Elevation of Privilege, and an Information Disclosure. Any admins who no longer wish to run on-prem Exchange may wish to add these to the evidence pile.

Anyone responsible for a SharePoint Server instance has three new vulnerabilities to consider. Perhaps the most noteworthy is CVE-2023-21743, a remote authentication bypass. Remediation requires additional admin action after the installation of the SharePoint Server security update; however, exploitation requires no user interaction, and Microsoft already assesses it as “Exploitation More Likely”. This regrettable combination of properties explains the Critical severity assigned by Microsoft despite the relatively low CVSS score.

Another step further away from the Ballmer era: Microsoft recently announced the potential inclusion of CBL-Mariner CVEs as part of Security Update Guide guidance starting as early as tomorrow (Jan 11). First released on the carefully-selected date of April 1, 2020, CBL-Mariner is the Microsoft-developed Linux distro which acts as the base container OS for Azure services, and also underpins elements of WSL2.

Farewell Windows 8.1, we hardly knew ye: today’s security patches include fixes for Windows 8.1 for the final time, since Extended Support for most editions of Windows 8.1 ends today.

Summary charts

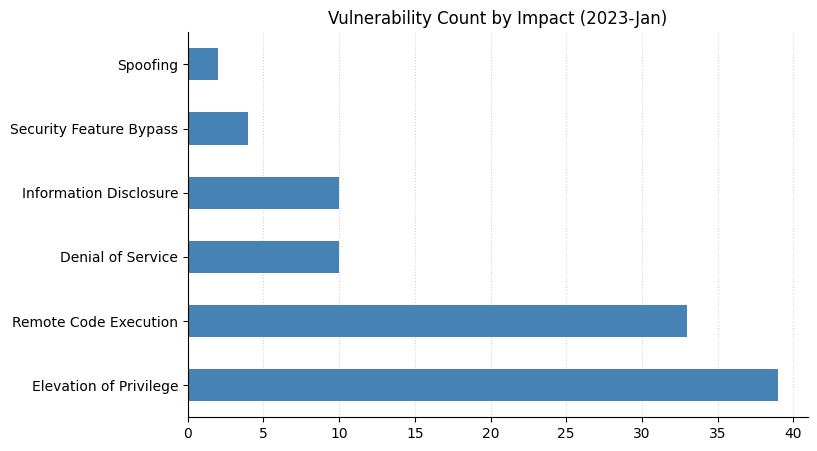
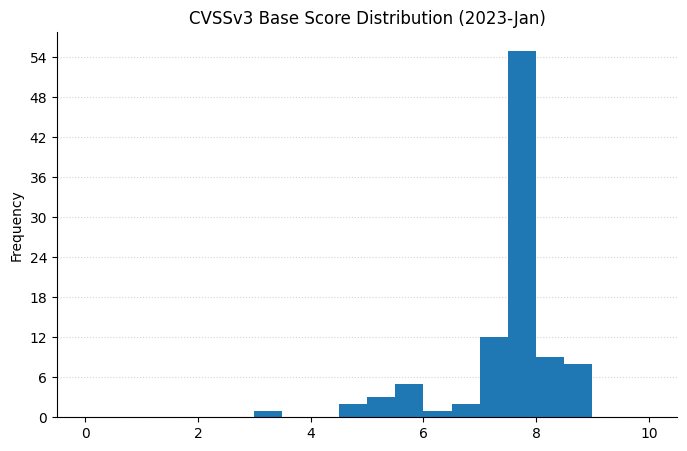
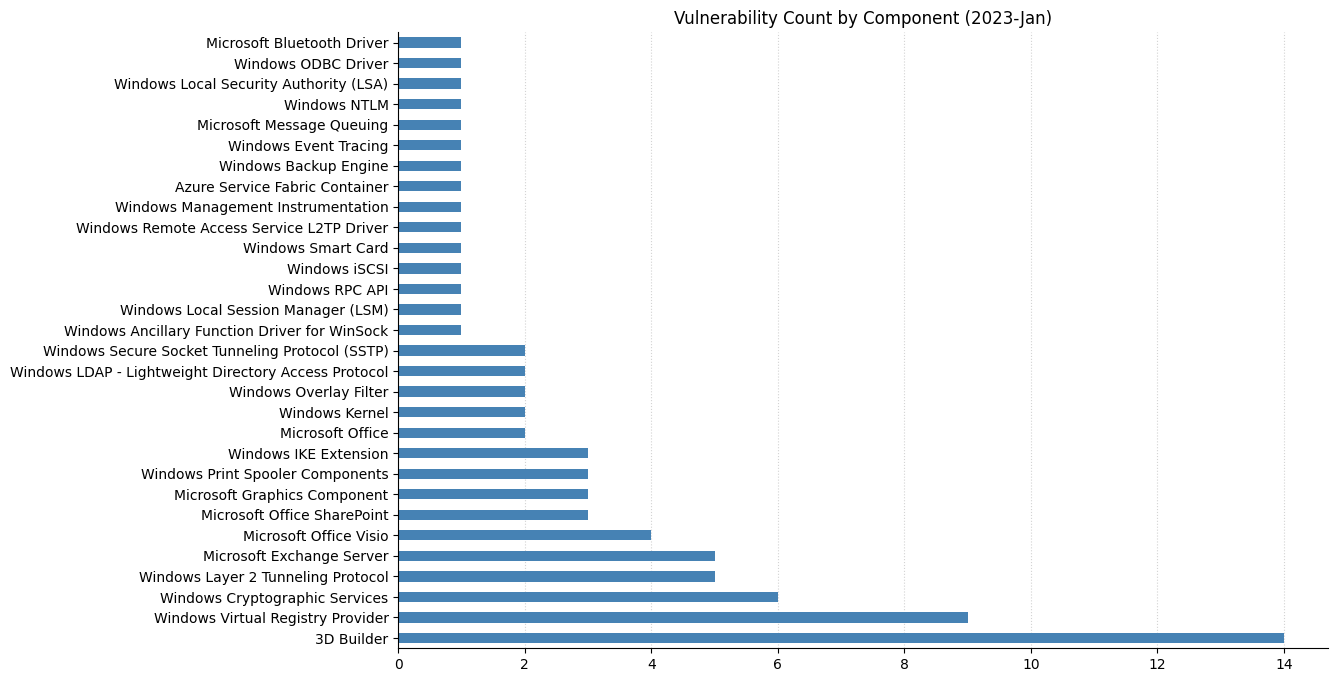
Patch Tuesday - January 2023

Summary tables

Apps vulnerabilities

CVE Title Exploited? Publicly disclosed? CVSSv3 base score
CVE-2023-21780 3D Builder Remote Code Execution Vulnerability No No 7.8
CVE-2023-21781 3D Builder Remote Code Execution Vulnerability No No 7.8
CVE-2023-21782 3D Builder Remote Code Execution Vulnerability No No 7.8
CVE-2023-21784 3D Builder Remote Code Execution Vulnerability No No 7.8
CVE-2023-21786 3D Builder Remote Code Execution Vulnerability No No 7.8
CVE-2023-21791 3D Builder Remote Code Execution Vulnerability No No 7.8
CVE-2023-21793 3D Builder Remote Code Execution Vulnerability No No 7.8
CVE-2023-21783 3D Builder Remote Code Execution Vulnerability No No 7.8
CVE-2023-21785 3D Builder Remote Code Execution Vulnerability No No 7.8
CVE-2023-21787 3D Builder Remote Code Execution Vulnerability No No 7.8
CVE-2023-21788 3D Builder Remote Code Execution Vulnerability No No 7.8
CVE-2023-21789 3D Builder Remote Code Execution Vulnerability No No 7.8
CVE-2023-21790 3D Builder Remote Code Execution Vulnerability No No 7.8
CVE-2023-21792 3D Builder Remote Code Execution Vulnerability No No 7.8

Azure vulnerabilities

CVE Title Exploited? Publicly disclosed? CVSSv3 base score
CVE-2023-21531 Azure Service Fabric Container Elevation of Privilege Vulnerability No No 7

Developer Tools vulnerabilities

CVE Title Exploited? Publicly disclosed? CVSSv3 base score
CVE-2023-21538 .NET Denial of Service Vulnerability No No 7.5
CVE-2023-21779 Visual Studio Code Remote Code Execution No No 7.3

Exchange Server vulnerabilities

CVE Title Exploited? Publicly disclosed? CVSSv3 base score
CVE-2023-21762 Microsoft Exchange Server Spoofing Vulnerability No No 8
CVE-2023-21745 Microsoft Exchange Server Spoofing Vulnerability No No 8
CVE-2023-21763 Microsoft Exchange Server Elevation of Privilege Vulnerability No No 7.8
CVE-2023-21764 Microsoft Exchange Server Elevation of Privilege Vulnerability No No 7.8
CVE-2023-21761 Microsoft Exchange Server Information Disclosure Vulnerability No No 7.5

Microsoft Office vulnerabilities

CVE Title Exploited? Publicly disclosed? CVSSv3 base score
CVE-2023-21742 Microsoft SharePoint Server Remote Code Execution Vulnerability No No 8.8
CVE-2023-21744 Microsoft SharePoint Server Remote Code Execution Vulnerability No No 8.8
CVE-2023-21736 Microsoft Office Visio Remote Code Execution Vulnerability No No 7.8
CVE-2023-21737 Microsoft Office Visio Remote Code Execution Vulnerability No No 7.8
CVE-2023-21734 Microsoft Office Remote Code Execution Vulnerability No No 7.8
CVE-2023-21735 Microsoft Office Remote Code Execution Vulnerability No No 7.8
CVE-2023-21738 Microsoft Office Visio Remote Code Execution Vulnerability No No 7.1
CVE-2023-21741 Microsoft Office Visio Information Disclosure Vulnerability No No 7.1
CVE-2023-21743 Microsoft SharePoint Server Security Feature Bypass Vulnerability No No 5.3

System Center vulnerabilities

CVE Title Exploited? Publicly disclosed? CVSSv3 base score
CVE-2023-21725 Windows Malicious Software Removal Tool Elevation of Privilege Vulnerability No No 6.3

Windows vulnerabilities

CVE Title Exploited? Publicly disclosed? CVSSv3 base score
CVE-2023-21676 Windows Lightweight Directory Access Protocol (LDAP) Remote Code Execution Vulnerability No No 8.8
CVE-2023-21674 Windows Advanced Local Procedure Call (ALPC) Elevation of Privilege Vulnerability Yes No 8.8
CVE-2023-21767 Windows Overlay Filter Elevation of Privilege Vulnerability No No 7.8
CVE-2023-21755 Windows Kernel Elevation of Privilege Vulnerability No No 7.8
CVE-2023-21558 Windows Error Reporting Service Elevation of Privilege Vulnerability No No 7.8
CVE-2023-21768 Windows Ancillary Function Driver for WinSock Elevation of Privilege Vulnerability No No 7.8
CVE-2023-21724 Microsoft DWM Core Library Elevation of Privilege Vulnerability No No 7.8
CVE-2023-21551 Microsoft Cryptographic Services Elevation of Privilege Vulnerability No No 7.8
CVE-2023-21677 Windows Internet Key Exchange (IKE) Extension Denial of Service Vulnerability No No 7.5
CVE-2023-21683 Windows Internet Key Exchange (IKE) Extension Denial of Service Vulnerability No No 7.5
CVE-2023-21758 Windows Internet Key Exchange (IKE) Extension Denial of Service Vulnerability No No 7.5
CVE-2023-21539 Windows Authentication Remote Code Execution Vulnerability No No 7.5
CVE-2023-21547 Internet Key Exchange (IKE) Protocol Denial of Service Vulnerability No No 7.5
CVE-2023-21771 Windows Local Session Manager (LSM) Elevation of Privilege Vulnerability No No 7
CVE-2023-21739 Windows Bluetooth Driver Elevation of Privilege Vulnerability No No 7
CVE-2023-21733 Windows Bind Filter Driver Elevation of Privilege Vulnerability No No 7
CVE-2023-21540 Windows Cryptographic Information Disclosure Vulnerability No No 5.5
CVE-2023-21550 Windows Cryptographic Information Disclosure Vulnerability No No 5.5
CVE-2023-21559 Windows Cryptographic Information Disclosure Vulnerability No No 5.5
CVE-2023-21753 Event Tracing for Windows Information Disclosure Vulnerability No No 5.5
CVE-2023-21766 Windows Overlay Filter Information Disclosure Vulnerability No No 4.7
CVE-2023-21536 Event Tracing for Windows Information Disclosure Vulnerability No No 4.7
CVE-2023-21759 Windows Smart Card Resource Management Server Security Feature Bypass Vulnerability No No 3.3

Windows ESU vulnerabilities

CVE Title Exploited? Publicly disclosed? CVSSv3 base score
CVE-2023-21549 Windows SMB Witness Service Elevation of Privilege Vulnerability No Yes 8.8
CVE-2023-21681 Microsoft WDAC OLE DB provider for SQL Server Remote Code Execution Vulnerability No No 8.8
CVE-2023-21732 Microsoft ODBC Driver Remote Code Execution Vulnerability No No 8.8
CVE-2023-21561 Microsoft Cryptographic Services Elevation of Privilege Vulnerability No No 8.8
CVE-2023-21535 Windows Secure Socket Tunneling Protocol (SSTP) Remote Code Execution Vulnerability No No 8.1
CVE-2023-21548 Windows Secure Socket Tunneling Protocol (SSTP) Remote Code Execution Vulnerability No No 8.1
CVE-2023-21546 Windows Layer 2 Tunneling Protocol (L2TP) Remote Code Execution Vulnerability No No 8.1
CVE-2023-21543 Windows Layer 2 Tunneling Protocol (L2TP) Remote Code Execution Vulnerability No No 8.1
CVE-2023-21555 Windows Layer 2 Tunneling Protocol (L2TP) Remote Code Execution Vulnerability No No 8.1
CVE-2023-21556 Windows Layer 2 Tunneling Protocol (L2TP) Remote Code Execution Vulnerability No No 8.1
CVE-2023-21679 Windows Layer 2 Tunneling Protocol (L2TP) Remote Code Execution Vulnerability No No 8.1
CVE-2023-21680 Windows Win32k Elevation of Privilege Vulnerability No No 7.8
CVE-2023-21541 Windows Task Scheduler Elevation of Privilege Vulnerability No No 7.8
CVE-2023-21678 Windows Print Spooler Elevation of Privilege Vulnerability No No 7.8
CVE-2023-21765 Windows Print Spooler Elevation of Privilege Vulnerability No No 7.8
CVE-2023-21746 Windows NTLM Elevation of Privilege Vulnerability No No 7.8
CVE-2023-21524 Windows Local Security Authority (LSA) Elevation of Privilege Vulnerability No No 7.8
CVE-2023-21747 Windows Kernel Elevation of Privilege Vulnerability No No 7.8
CVE-2023-21748 Windows Kernel Elevation of Privilege Vulnerability No No 7.8
CVE-2023-21749 Windows Kernel Elevation of Privilege Vulnerability No No 7.8
CVE-2023-21754 Windows Kernel Elevation of Privilege Vulnerability No No 7.8
CVE-2023-21772 Windows Kernel Elevation of Privilege Vulnerability No No 7.8
CVE-2023-21773 Windows Kernel Elevation of Privilege Vulnerability No No 7.8
CVE-2023-21774 Windows Kernel Elevation of Privilege Vulnerability No No 7.8
CVE-2023-21675 Windows Kernel Elevation of Privilege Vulnerability No No 7.8
CVE-2023-21552 Windows GDI Elevation of Privilege Vulnerability No No 7.8
CVE-2023-21726 Windows Credential Manager User Interface Elevation of Privilege Vulnerability No No 7.8
CVE-2023-21537 Microsoft Message Queuing (MSMQ) Elevation of Privilege Vulnerability No No 7.8
CVE-2023-21730 Microsoft Cryptographic Services Elevation of Privilege Vulnerability No No 7.8
CVE-2023-21527 Windows iSCSI Service Denial of Service Vulnerability No No 7.5
CVE-2023-21728 Windows Netlogon Denial of Service Vulnerability No No 7.5
CVE-2023-21557 Windows Lightweight Directory Access Protocol (LDAP) Denial of Service Vulnerability No No 7.5
CVE-2023-21757 Windows Layer 2 Tunneling Protocol (L2TP) Denial of Service Vulnerability No No 7.5
CVE-2023-21760 Windows Print Spooler Elevation of Privilege Vulnerability No No 7.1
CVE-2023-21750 Windows Kernel Elevation of Privilege Vulnerability No No 7.1
CVE-2023-21752 Windows Backup Service Elevation of Privilege Vulnerability No No 7.1
CVE-2023-21542 Windows Installer Elevation of Privilege Vulnerability No No 7
CVE-2023-21532 Windows GDI Elevation of Privilege Vulnerability No No 7
CVE-2023-21563 BitLocker Security Feature Bypass Vulnerability No No 6.8
CVE-2023-21560 Windows Boot Manager Security Feature Bypass Vulnerability No No 6.6
CVE-2023-21776 Windows Kernel Information Disclosure Vulnerability No No 5.5
CVE-2023-21682 Windows Point-to-Point Protocol (PPP) Information Disclosure Vulnerability No No 5.3
CVE-2023-21525 Remote Procedure Call Runtime Denial of Service Vulnerability No No 5.3

[$] Formalizing f-strings

Post Syndicated from original https://lwn.net/Articles/919426/

Python’s formatted strings, or “f-strings”, came relatively late to the
language, but have become a popular feature. F-strings allow a compact
representation for the common task of interpolating program data into
strings, often in order to output them in some fashion. Some
restrictions were placed on f-strings to simplify the implementation of
them, but those restrictions are not really needed anymore and, in
fact, are complicating the CPython parser. That has led to a Python
Enhancement Proposal (PEP) to formalize the syntax of f-strings for the
benefit of Python users while simplifying the maintenance of the
interpreter itself.

Building Sustainable, Efficient, and Cost-Optimized Applications on AWS

Post Syndicated from Sheila Busser original https://aws.amazon.com/blogs/compute/building-sustainable-efficient-and-cost-optimized-applications-on-aws/

This blog post is written by Isha Dua Sr. Solutions Architect AWS, Ananth Kommuri Solutions Architect AWS, and Dr. Sam Mokhtari Sr. Sustainability Lead SA WA for AWS.

Today, more than ever, sustainability and cost-savings are top of mind for nearly every organization. Research has shown that AWS’ infrastructure is 3.6 times more energy efficient than the median of U.S. enterprise data centers and up to five times more energy efficient than the average in Europe. That said, simply migrating to AWS isn’t enough to meet the Environmental, Social, Governance (ESG) and Cloud Financial Management (CFM) goals that today’s customers are setting. In order to make conscious use of our planet’s resources, applications running on the cloud must be built with efficiency in mind.

That’s because cloud sustainability is a shared responsibility. At AWS, we’re responsible for optimizing the sustainability of the cloud – building efficient infrastructure, enough options to meet every customer’s needs, and the tools to manage it all effectively. As an AWS customer, you’re responsible for sustainability in the cloud – building workloads in a way that minimizes the total number of resource requirements and makes the most of what must be consumed.

Most AWS service charges are correlated with hardware usage, so reducing resource consumption also has the added benefit of reducing costs. In this blog post, we’ll highlight best practices for running efficient compute environments on AWS that maximize utilization and decrease waste, with both sustainability and cost-savings in mind.

First: Measure What Matters

Application optimization is a continuous process, but it has to start somewhere. The AWS Well Architected Framework Sustainability pillar includes an improvement process that helps customers map their journey and understand the impact of possible changes. There is a saying “you can’t improve what you don’t measure.”, which is why it’s important to define and regularly track metrics which are important to your business. Scope 2 Carbon emissions, such as those provided by the AWS Customer Carbon Footprint Tool, are one metric that many organizations use to benchmark their sustainability initiatives, but they shouldn’t be the only one.

Even after AWS meets our 2025 goal of powering our operations with 100% renewable energy, it’s still be important to maximize the utilization and minimize the consumption of the resources that you use. Just like installing solar panels on your house, it’s important to limit your total consumption to ensure you can be powered by that energy. That’s why many organizations use proxy metrics such as vCPU Hours, storage usage, and data transfer to evaluate their hardware consumption and measure improvements made to infrastructure over time.

In addition to these metrics, it’s helpful to baseline utilization against the value delivered to your end-users and customers. Tracking utilization alongside business metrics (orders shipped, page views, total API calls, etc) allows you to normalize resource consumption with the value delivered to your organization. It also provides a simple way to track progress towards your goals over time. For example, if the number of orders on your ecommerce site remained constant over the last month, but your AWS infrastructure usage decreased by 20%, you can attribute the efficiency gains to your optimization efforts, not changes in your customer behavior.

Utilize all of the available pricing models

Compute tasks are the foundation of many customers’ workloads, so it typically sees biggest benefit by optimization. Amazon EC2 provides resizable compute across a wide variety of compute instances, is well-suited to virtually every use case, is available via a number of highly flexible pricing options. One of the simplest changes you can make to decrease your costs on AWS is to review the purchase options for the compute and storage resources that you already use.

Amazon EC2 provides multiple purchasing options to enable you to optimize your costs based on your needs. Because every workload has different requirements, we recommend a combination of purchase options tailored for your specific workload needs. For steady-state workloads that can have a 1-3 year commitment, using Compute Savings Plans helps you save costs, move from one instance type to a newer, more energy-efficient alternative, or even between compute solutions (e.g., from EC2 instances to AWS Lambda functions, or AWS Fargate).

EC2 Spot instances are another great way to decrease cost and increase efficiency on AWS. Spot Instances make unused Amazon EC2 capacity available for customers at discounted prices. At AWS, one of our goals it to maximize utilization of our physical resources. By choosing EC2 Spot instances, you’re running on hardware that would otherwise be sitting idle in our datacenters. This increases the overall efficiency of the cloud, because more of our physical infrastructure is being used for meaningful work. Spot instances use market-based pricing that changes automatically based on supply and demand. This means that the hardware with the most spare capacity sees the highest discounts, sometimes up to XX% off on-demand prices, to encourage our customers to choose that configuration.

Savings Plans are ideal for predicable, steady-state work. On-demand is best suited for new, stateful, and spiky workloads which can’t be instance, location, or time flexible. Finally, Spot instances are a great way to supplement the other options for applications that are fault tolerant and flexible. AWS recommends using a mix of pricing models based on your workload needs and ability to be flexible.

By using these pricing models, you’re creating signals for your future compute needs, which helps AWS better forecast resource demands, manage capacity, and run our infrastructure in a more sustainable way.

Choose efficient, purpose-built processors whenever possible

Choosing the right processor for your application is as equally important consideration because under certain use cases a more powerful processor can allow for the same level of compute power with a smaller carbon footprint. AWS has the broadest choice of processors, such as Intel – Xeon scalable processors, AMD – AMD EPYC processors, GPU’s FPGAs, and Custom ASICs for Accelerated Computing.

AWS Graviton3, AWS’s latest and most power-efficient processor, delivers 3X better CPU performance per-watt than any other processor in AWS, provides up to 40% better price performance over comparable current generation x86-based instances for various workloads, and helps customers reduce their carbon footprint. Consider transitioning your workload to Graviton-based instances to improve the performance efficiency of your workload (see AWS Graviton Fast Start and AWS Graviton2 for ISVs). Note the considerations when transitioning workloads to AWS Graviton-based Amazon EC2 instances.

For machine learning (ML) workloads, use Amazon EC2 instances based on purpose-built Amazon Machine Learning (Amazon ML) chips, such as AWS TrainiumAWS Inferentia, and Amazon EC2 DL1.

Optimize for hardware utilization

The goal of efficient environments is to use only as many resources as required in order to meet your needs. Thankfully, this is made easier on the cloud because of the variety of instance choices, the ability to scale dynamically, and the wide array of tools to help track and optimize your cloud usage. At AWS, we offer a number of tools and services that can help you to optimize both the size of individual resources, as well as scale the total number of resources based on traffic and load.

Two of the most important tools to measure and track utilization are Amazon CloudWatch and the AWS Cost & Usage Report (CUR). With CloudWatch, you can get a unified view of your resource metrics and usage, then analyze the impact of user load on capacity utilization over time. The Cost & Usage Report (CUR) can help you understand which resources are contributing the most to your AWS usage, allowing you to fine-tune your efficiency and save on costs. CUR data is stored in S3, which allows you to query it with tools like Amazon Athena or generate custom reports in Amazon QuickSight or integrate with AWS Partner tools for better visibility and insights.

An example of a tool powered by CUR data is the AWS Cost Intelligence Dashboard. The Cost Intelligence Dashboard provides a detailed, granular, and recommendation-driven view of your AWS usage. With its prebuilt visualizations, it can help you identify which service and underlying resources are contributing the most towards your AWS usage, and see the potential savings you can realize by optimizing. It even provides right sizing recommendations and the appropriate EC2 instance family to help you optimize your resources.

Cost Intelligence Dashboard is also integrated with AWS Compute Optimizer, which makes instance type and size recommendations based on workload characteristics. For example, it can identify if the workload is CPU-intensive, if it exhibits a daily pattern, or if local storage is accessed frequently. Compute Optimizer then infers how the workload would have performed on various hardware platforms (for example, Amazon EC2 instance types) or using different configurations (for example, Amazon EBS volume IOPS settings, and AWS Lambda function memory sizes) to offer recommendations. For stable workloads, check AWS Compute Optimizer at regular intervals to identify right-sizing opportunities for instances. By right sizing with Compute Optimizer, you can increase resource utilization and reduce costs by up to 25%. Similarly, Lambda Power Tuning can help choose the memory allocated to Lambda functions is an optimization process that balances speed (duration) and cost while lowering your carbon emission in the process.

CloudWatch metrics are used to power EC2 Autoscaling, which can automatically choose the right instance to fit your needs with attribute-based instance selection and scale your entire instance fleet up and down based on demand in order to maintain high utilization. AWS Auto Scaling makes scaling simple with recommendations that let you optimize performance, costs, or balance between them. Configuring and testing workload elasticity will help save money, maintain performance benchmarks, and reduce the environmental impact of workloads. You can utilize the elasticity of the cloud to automatically increase the capacity during user load spikes, and then scale down when the load decreases. Amazon EC2 Auto Scaling allows your workload to automatically scale up and down based on demand. You can set up scheduled or dynamic scaling policies based on metrics such as average CPU utilization or average network in or out. Then, you can integrate AWS Instance Scheduler and Scheduled scaling for Amazon EC2 Auto Scaling to schedule shut downs and terminate resources that run only during business hours or on weekdays to further reduce your carbon footprint.

Design applications to minimize overhead and use fewer resources

Using the latest Amazon Machine Image (AMI) gives you updated operating systems, packages, libraries, and applications, which enable easier adoption as more efficient technologies become available. Up-to-date software includes features to measure the impact of your workload more accurately, as vendors deliver features to meet their own sustainability goals.

By reducing the amount of equipment that your company has on-premises and using managed services, you can help facilitate the move to a smaller, greener footprint. Instead of buying, storing, maintaining, disposing of, and replacing expensive equipment, businesses can purchase services as they need that are already optimized with a greener footprint. Managed services also shift responsibility for maintaining high average utilization and sustainability optimization of the deployed hardware to AWS. Using managed services will help distribute the sustainability impact of the service across all of the service tenants, thereby reducing your individual contribution. The following services help reduce your environmental impact because capacity management is automatically optimized.

 AWS  Managed Service   Recommendation for sustainability improvement

Amazon Aurora

You can use Amazon  Aurora Serverless to automatically start up, shut down, and scale capacity up or down based on your application’s needs.

Amazon Redshift

You can use Amazon Redshift Serverless to run and scale data warehouse capacity.

AWS Lambda

You can Migrate AWS Lambda functions to Arm-based AWS Graviton2 processors.

Amazon ECS

You can run Amazon ECS on AWS Fargate to avoid the undifferentiated heavy lifting by leveraging sustainability best practices AWS put in place for management of the control plane.

Amazon EMR

You can use EMR Serverless to avoid over- or under-provisioning resources for your data processing jobs.

AWS Glue

You can use Auto-scaling for AWS Glue to enable on-demand scaling up and scaling down of the computing resources.

 Centralized data centers consume a lot of energy, produce a lot of carbon emissions and cause significant electronic waste. While more data centers are moving towards green energy, an even more sustainable approach (alongside these so-called “green data centers”) is to actually cut unnecessary cloud traffic, central computation and storage as much as possible by shifting computation to the edge. Edge Computing stores and uses data locally, on or near the device it was created on. This reduces the amount of traffic sent to the cloud and, at scale, can limit the overall energy used and carbon emissions.

Use storage that best supports how your data is accessed and stored to minimize the resources provisioned while supporting your workload. Solid state devices (SSDs) are more energy intensive than magnetic drives and should be used only for active data use cases. You should look into using ephemeral storage whenever possible and categorize, centralize, deduplicate, and compress persistent storage.

AWS OutpostsAWS Local Zones and AWS Wavelength services deliver data processing, analysis, and storage close to your endpoints, allowing you to deploy APIs and tools to locations outside AWS data centers. Build high-performance applications that can process and store data close to where it’s generated, enabling ultra-low latency, intelligent, and real-time responsiveness. By processing data closer to the source, edge computing can reduce latency, which means that less energy is required to keep devices and applications running smoothly. Edge computing can help to reduce the carbon footprint of data centers by using renewable energy sources such as solar and wind power.

Conclusion

In this blog post, we discussed key methods and recommended actions you can take to optimize your AWS compute infrastructure for resource efficiency. Using the appropriate EC2 instance types with the right size, processor, instance storage and pricing model can enhance the sustainability of your applications. Use of AWS managed services, options for edge computing and continuously optimizing your resource usage can further improve the energy efficiency of your workloads. You can also analyze the changes in your emissions over time as you migrate workloads to AWS, re-architect applications, or deprecate unused resources using the Customer Carbon Footprint Tool.

Ready to get started? Check out the AWS Sustainability page to find out more about our commitment to sustainability and learn more about renewable energy usage, case studies on sustainability through the cloud, and more.

Accelerate orchestration of an ELT process using AWS Step Functions and Amazon Redshift Data API

Post Syndicated from Poulomi Dasgupta original https://aws.amazon.com/blogs/big-data/accelerate-orchestration-of-an-elt-process-using-aws-step-functions-and-amazon-redshift-data-api/

Extract, Load, and Transform (ELT) is a modern design strategy where raw data is first loaded into the data warehouse and then transformed with familiar Structured Query Language (SQL) semantics leveraging the power of massively parallel processing (MPP) architecture of the data warehouse. When you use an ELT pattern, you can also use your existing SQL workload while migrating from your on-premises data warehouse to Amazon Redshift. This eliminates the need to rewrite relational and complex SQL workloads into a new framework. With Amazon Redshift, you can load, transform, and enrich your data efficiently using familiar SQL with advanced and robust SQL support, simplicity, and seamless integration with your existing SQL tools. When you adopt an ELT pattern, a fully automated and highly scalable workflow orchestration mechanism will help to minimize the operational effort that you must invest in managing the pipelines. It also ensures the timely and accurate refresh of your data warehouse.

AWS Step Functions is a low-code, serverless, visual workflow service where you can orchestrate complex business workflows with an event-driven framework and easily develop repeatable and dependent processes. It can ensure that the long-running, multiple ELT jobs run in a specified order and complete successfully instead of manually orchestrating those jobs or maintaining a separate application.

Amazon DynamoDB is a fast, flexible NoSQL database service for single-digit millisecond performance at any scale.

This post explains how to use AWS Step Functions, Amazon DynamoDB, and Amazon Redshift Data API to orchestrate the different steps in your ELT workflow and process data within the Amazon Redshift data warehouse.

Solution overview

In this solution, we will orchestrate an ELT process using AWS Step Functions. As part of the ELT process, we will refresh the dimension and fact tables at regular intervals from staging tables, which ingest data from the source. We will maintain the current state of the ELT process (e.g., Running or Ready) in an audit table that will be maintained at Amazon DynamoDB. AWS Step Functions allows you to directly call the Data API from a state machine, reducing the complexity of running the ELT pipeline. For loading the dimensions and fact tables, we will be using Amazon Redshift Data API from AWS Lambda. We will use Amazon EventBridge for scheduling the state machine to run at a desired interval based on the customer’s SLA.

For a given ELT process, we will set up a JobID in a DynamoDB audit table and set the JobState as “Ready” before the state machine runs for the first time. The state machine performs the following steps:

  1. The first process in the Step Functions workflow is to pass the JobID as input to the process that is configured as JobID 101 in Step Functions and DynamoDB by default via the CloudFormation template.
  2. The next step is to fetch the current JobState for the given JobID by running a query against the DynamoDB audit table using Lambda Data API.
  3. If JobState is “Running,” then it indicates that the previous iteration is not completed yet, and the process should end.
  4. If the JobState is “Ready,” then it indicates that the previous iteration was completed successfully and the process is ready to start. So, the next step will be to update the DynamoDB audit table to change the JobState to “Running” and JobStart to the current time for the given JobID using DynamoDB Data API within a Lambda function.
  5. The next step will be to start the dimension table load from the staging table data within Amazon Redshift using Lambda Data API. In order to achieve that, we can either call a stored procedure using the Amazon Redshift Data API, or we can also run series of SQL statements synchronously using Amazon Redshift Data API within a Lambda function.
  6. In a typical data warehouse, multiple dimension tables are loaded in parallel at the same time before the fact table gets loaded. Using Parallel flow in Step Functions, we will load two dimension tables at the same time using Amazon Redshift Data API within a Lambda function.
  7. Once the load is completed for both the dimension tables, we will load the fact table as the next step using Amazon Redshift Data API within a Lambda function.
  8. As the load completes successfully, the last step would be to update the DynamoDB audit table to change the JobState to “Ready” and JobEnd to the current time for the given JobID, using DynamoDB Data API within a Lambda function.
    Solution Overview

Components and dependencies

The following architecture diagram highlights the end-to-end solution using AWS services:

Architecture Diagram

Before diving deeper into the code, let’s look at the components first:

  • AWS Step Functions – You can orchestrate a workflow by creating a State Machine to manage failures, retries, parallelization, and service integrations.
  • Amazon EventBridge – You can run your state machine on a daily schedule by creating a Rule in Amazon EventBridge.
  • AWS Lambda – You can trigger a Lambda function to run Data API either from Amazon Redshift or DynamoDB.
  • Amazon DynamoDB – Amazon DynamoDB is a fully managed, serverless, key-value NoSQL database designed to run high-performance applications at any scale. DynamoDB is extremely efficient in running updates, which improves the performance of metadata management for customers with strict SLAs.
  • Amazon Redshift – Amazon Redshift is a fully managed, scalable cloud data warehouse that accelerates your time to insights with fast, easy, and secure analytics at scale.
  • Amazon Redshift Data API – You can access your Amazon Redshift database using the built-in Amazon Redshift Data API. Using this API, you can access Amazon Redshift data with web services–based applications, including AWS Lambda.
  • DynamoDB API – You can access your Amazon DynamoDB tables from a Lambda function by importing boto3.

Prerequisites

To complete this walkthrough, you must have the following prerequisites:

  1. An AWS account.
  2. An Amazon Redshift cluster.
  3. An Amazon Redshift customizable IAM service role with the following policies:
    • AmazonS3ReadOnlyAccess
    • AmazonRedshiftFullAccess
  4. Above IAM role associated to the Amazon Redshift cluster.

Deploy the CloudFormation template

To set up the ETL orchestration demo, the steps are as follows:

  1. Sign in to the AWS Management Console.
  2. Click on Launch Stack.

    CreateStack-1
  3. Click Next.
  4. Enter a suitable name in Stack name.
  5. Provide the information for the Parameters as detailed in the following table.
CloudFormation template parameter Allowed values Description
RedshiftClusterIdentifier Amazon Redshift cluster identifier Enter the Amazon Redshift cluster identifier
DatabaseUserName Database user name in Amazon Redshift cluster Amazon Redshift database user name which has access to run SQL Script
DatabaseName Amazon Redshift database name Name of the Amazon Redshift primary database where SQL script would be run
RedshiftIAMRoleARN Valid IAM role ARN attached to Amazon Redshift cluster AWS IAM role ARN associated with the Amazon Redshift cluster

Create Stack 2

  1. Click Next and a new page appears. Accept the default values in the page and click Next. On the last page check the box to acknowledge resources might be created and click on Create stack.
    Create Stack 3
  2. Monitor the progress of the stack creation and wait until it is complete.
  3. The stack creation should complete approximately within 5 minutes.
  4. Navigate to Amazon Redshift console.
  5. Launch Amazon Redshift query editor v2 and connect to your cluster.
  6. Browse to the database name provided in the parameters while creating the cloudformation template e.g., dev, public schema and expand Tables. You should see the tables as shown below.
    Redshift Query Editor v2 1
  7. Validate the sample data by running the following SQL query and confirm the row count match above the screenshot.
select 'customer',count(*) from public.customer
union all
select 'fact_yearly_sale',count(*) from public.fact_yearly_sale
union all
select 'lineitem',count(*) from public.lineitem
union all
select 'nation',count(*) from public.nation
union all
select 'orders',count(*) from public.orders
union all
select 'supplier',count(*) from public.supplier

Run the ELT orchestration

  1. After you deploy the CloudFormation template, navigate to the stack detail page. On the Resources tab, choose the link for DynamoDBETLAuditTable to be redirected to the DynamoDB console.
  2. Navigate to Tables and click on table name beginning with <stackname>-DynamoDBETLAuditTable. In this demo, the stack name is DemoETLOrchestration, so the table name will begin with DemoETLOrchestration-DynamoDBETLAuditTable.
  3. It will expand the table. Click on Explore table items.
  4. Here you can see the current status of the job, which will be in Ready status.
    DynamoDB 1
  5. Navigate again to stack detail page on the CloudFormation console. On the Resources tab, choose the link for RedshiftETLStepFunction to be redirected to the Step Functions console.
    CFN Stack Resources
  6. Click Start Execution. When it successfully completes, all steps will be marked as green.
    Step Function Running
  7. While the job is running, navigate back to DemoETLOrchestration-DynamoDBETLAuditTable in the DynamoDB console screen. You will see JobState as Running with JobStart time.
    DynamoDB 2
  1. After Step Functions completes, JobState will be changed to Ready with JobStart and JobEnd time.
    DynamoDB 3

Handling failure

In the real world sometimes, the ELT process can fail due to unexpected data anomalies or object related issues. In that case, the step function execution will also fail with the failed step marked in red as shown in the screenshot below:
Step Function 2

Once you identify and fix the issue, please follow the below steps to restart the step function:

  1. Navigate to the DynamoDB table beginning with DemoETLOrchestration-DynamoDBETLAuditTable. Click on Explore table items and select the row with the specific JobID for the failed job.
  2. Go to Action and select Edit item to modify the JobState to Ready as shown below:
    DynamoDB 4
  3. Follow steps 5 and 6 under the “Run the ELT orchestration” section to restart execution of the step function.

Validate the ELT orchestration

The step function loads the dimension tables public.supplier and public.customer and the fact table public.fact_yearly_sale. To validate the orchestration, the process steps are as follows:

  1. Navigate to the Amazon Redshift console.
  2. Launch Amazon Redshift query editor v2 and connect to your cluster.
  3. Browse to the database name provided in the parameters while creating the cloud formation template e.g., dev, public schema.
  4. Validate the data loaded by Step Functions by running the following SQL query and confirm the row count to match as follows:
select 'customer',count(*) from public.customer
union all
select 'fact_yearly_sale',count(*) from public.fact_yearly_sale
union all
select 'supplier',count(*) from public.supplier

Redshift Query Editor v2 2

Schedule the ELT orchestration

The steps are as follows to schedule the Step Functions:

  1. Navigate to the Amazon EventBridge console and choose Create rule.
    Event Bridge 1
  1. Under Name, enter a meaningful name, for example, Trigger-Redshift-ELTStepFunction.
  2. Under Event bus, choose default.
  3. Under Rule Type, select Schedule.
  4. Click on Next.
    Event Bridge 2
  5. Under Schedule pattern, select A schedule that runs at a regular rate, such as every 10 minutes.
  6. Under Rate expression, enter Value as 5 and choose Unit as Minutes.
  7. Click on Next.
    Event Bridge 3
  8. Under Target types, choose AWS service.
  9. Under Select a Target, choose Step Functions state machine.
  10. Under State machine, choose the step function created by the CloudFormation template.
  11. Under Execution role, select Create a new role for this specific resource.
  12. Click on Next.
    Event Bridge 4
  13. Review the rule parameters and click on Create Rule.

After the rule has been created, it will automatically trigger the step function every 5 minutes to perform ELT processing in Amazon Redshift.

Clean up

Please note that deploying a CloudFormation template incurs cost. To avoid incurring future charges, delete the resources you created as part of the CloudFormation stack by navigating to the AWS CloudFormation console, selecting the stack, and choosing Delete.

Conclusion

In this post, we described how to easily implement a modern, serverless, highly scalable, and cost-effective ELT workflow orchestration process in Amazon Redshift using AWS Step Functions, Amazon DynamoDB and Amazon Redshift Data API. As an alternate solution, you can also use Amazon Redshift for metadata management instead of using Amazon DynamoDB. As part of this demo, we show how a single job entry in DynamoDB gets updated for each run, but you can also modify the solution to maintain a separate audit table with the history of each run for each job, which would help with debugging or historical tracking purposes. Step Functions manage failures, retries, parallelization, service integrations, and observability so your developers can focus on higher-value business logic. Step Functions can integrate with Amazon SNS to send notifications in case of failure or success of the workflow. Please follow this AWS Step Functions documentation to implement the notification mechanism.


About the Authors

Poulomi Dasgupta is a Senior Analytics Solutions Architect with AWS. She is passionate about helping customers build cloud-based analytics solutions to solve their business problems. Outside of work, she likes travelling and spending time with her family.

Raks KhareRaks Khare is an Analytics Specialist Solutions Architect at AWS based out of Pennsylvania. He helps customers architect data analytics solutions at scale on the AWS platform.

Tahir Aziz is an Analytics Solution Architect at AWS. He has worked with building data warehouses and big data solutions for over 13 years. He loves to help customers design end-to-end analytics solutions on AWS. Outside of work, he enjoys traveling
and cooking.

Add your own libraries and application dependencies to Spark and Hive on Amazon EMR Serverless with custom images

Post Syndicated from Veena Vasudevan original https://aws.amazon.com/blogs/big-data/add-your-own-libraries-and-application-dependencies-to-spark-and-hive-on-amazon-emr-serverless-with-custom-images/

Amazon EMR Serverless allows you to run open-source big data frameworks such as Apache Spark and Apache Hive without managing clusters and servers. Many customers who run Spark and Hive applications want to add their own libraries and dependencies to the application runtime. For example, you may want to add popular open-source extensions to Spark, or add a customized encryption-decryption module that is used by your application.

We are excited to announce a new capability that allows you to customize the runtime image used in EMR Serverless by adding custom libraries that your applications need to use. This feature enables you to do the following:

  • Maintain a set of version-controlled libraries that are reused and available for use in all your EMR Serverless jobs as part of the EMR Serverless runtime
  • Add popular extensions to open-source Spark and Hive frameworks such as pandas, NumPy, matplotlib, and more that you want your EMR serverless application to use
  • Use established CI/CD processes to build, test, and deploy your customized extension libraries to the EMR Serverless runtime
  • Apply established security processes, such as image scanning, to meet the compliance and governance requirements within your organization
  • Use a different version of a runtime component (for example the JDK runtime or the Python SDK runtime) than the version that is available by default with EMR Serverless

In this post, we demonstrate how to use this new feature.

Solution Overview

To use this capability, customize the EMR Serverless base image using Amazon Elastic Container Registry (Amazon ECR), which is a fully managed container registry that makes it easy for your developers to share and deploy container images. Amazon ECR eliminates the need to operate your own container repositories or worry about scaling the underlying infrastructure. After the custom image is pushed to the container registry, specify the custom image while creating your EMR Serverless applications.
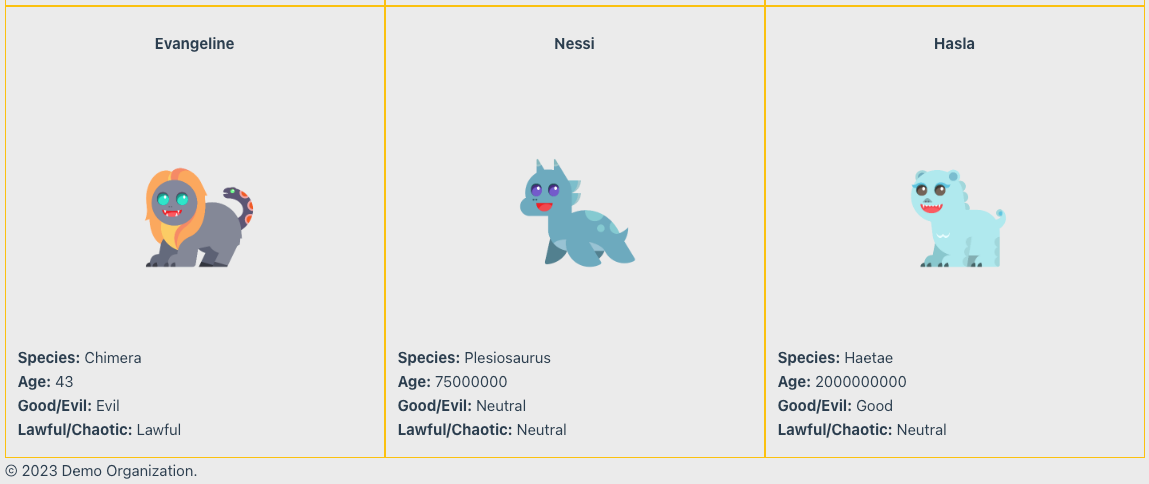
The following diagram illustrates the steps involved in using custom images for your EMR Serverless applications.

In the following sections, we demonstrate using custom images with Amazon EMR Serverless to address three common use cases:

  • Add popular open-source Python libraries into the EMR Serverless runtime image
  • Use a different or newer version of the Java runtime for the EMR Serverless application
  • Install a Prometheus agent and customize the Spark runtime to push Spark JMX metrics to Amazon Managed Service for Prometheus, and visualize the metrics in a Grafana dashboard

General prerequisites

The following are the prerequisites to use custom images with EMR Serverless. Complete the following steps before proceeding with the subsequent steps:

  1. Create an AWS Identity and Access Management (IAM) role with IAM permissions for Amazon EMR Serverless applications, Amazon ECR permissions, and Amazon S3 permissions for the Amazon Simple Storage Service (Amazon S3) bucket aws-bigdata-blog and any S3 bucket in your account where you will store the application artifacts.
  2. Install or upgrade to the latest AWS Command Line Interface (AWS CLI) version and install the Docker service in an Amazon Linux 2 based Amazon Elastic Compute Cloud (Amazon EC2) instance. Attach the IAM role from the previous step for this EC2 instance.
  3. Select a base EMR Serverless image from the following public Amazon ECR repository. Run the following commands on the EC2 instance with Docker installed to verify that you are able to pull the base image from the public repository:
    # If docker is not started already, start the process
    $ sudo service docker start 
    
    # Check if you are able to pull the latest EMR 6.9.0 runtime base image 
    $ sudo docker pull public.ecr.aws/emr-serverless/spark/emr-6.9.0:latest

  4. Log in to Amazon ECR with the following commands and create a repository called emr-serverless-ci-examples, providing your AWS account ID and Region:
    $ sudo aws ecr get-login-password --region <region> | sudo docker login --username AWS --password-stdin <your AWS account ID>.dkr.ecr.<region>.amazonaws.com
    
    $ aws ecr create-repository --repository-name emr-serverless-ci-examples --region <region>

  5. Provide IAM permissions to the EMR Serverless service principal for the Amazon ECR repository:
    1. On the Amazon ECR console, choose Permissions under Repositories in the navigation pane.
    2. Choose Edit policy JSON.
    3. Enter the following JSON and save:
      {
        "Version": "2012-10-17",
        "Statement": [
          {
            "Sid": "Emr Serverless Custom Image Support",
            "Effect": "Allow",
            "Principal": {
              "Service": "emr-serverless.amazonaws.com"
            },
            "Action": [
              "ecr:BatchGetImage",
              "ecr:DescribeImages",
              "ecr:GetDownloadUrlForLayer"
            ]
          }
        ]
      }

Make sure that the policy is updated on the Amazon ECR console.

For production workloads, we recommend adding a condition in the Amazon ECR policy to ensure only allowed EMR Serverless applications can get, describe, and download images from this repository. For more information, refer to Allow EMR Serverless to access the custom image repository.

In the next steps, we create and use custom images in our EMR Serverless applications for the three different use cases.

Use case 1: Run data science applications

One of the common applications of Spark on Amazon EMR is the ability to run data science and machine learning (ML) applications at scale. For large datasets, Spark includes SparkML, which offers common ML algorithms that can be used to train models in a distributed fashion. However, you often need to run many iterations of simple classifiers to fit for hyperparameter tuning, ensembles, and multi-class solutions over small-to-medium-sized data (100,000 to 1 million records). Spark is a great engine to run multiple iterations of such classifiers in parallel. In this example, we demonstrate this use case, where we use Spark to run multiple iterations of an XGBoost model to select the best parameters. The ability to include Python dependencies in the EMR Serverless image should make it easy to make the various dependencies (xgboost, sk-dist, pandas, numpy, and so on) available for the application.

Prerequisites

The EMR Serverless job runtime IAM role should be given permissions to your S3 bucket where you will be storing your PySpark file and application logs:

{
    "Version": "2012-10-17",
    "Statement": [
        {
            "Sid": "AccessToS3Buckets",
            "Effect": "Allow",
            "Action": [
                "s3:PutObject",
                "s3:GetObject",
                "s3:ListBucket"
            ],
            "Resource": [
                "arn:aws:s3:::<YOUR-BUCKET>",
                "arn:aws:s3:::<YOUR-BUCKET>/*"
            ]
        }
    ]
}

Create an image to install ML dependencies

We create a custom image from the base EMR Serverless image to install dependencies required by the SparkML application. Create the following Dockerfile in your EC2 instance that runs the docker process inside a new directory named datascience:

FROM public.ecr.aws/emr-serverless/spark/emr-6.9.0:latest

USER root

# python packages
RUN pip3 install boto3 pandas numpy
RUN pip3 install -U scikit-learn==0.23.2 scipy 
RUN pip3 install sk-dist
RUN pip3 install xgboost
RUN sed -i 's|import Parallel, delayed|import Parallel, delayed, logger|g' /usr/local/lib/python3.7/site-packages/skdist/distribute/search.py

# EMRS will run the image as hadoop
USER hadoop:hadoop

Build and push the image to the Amazon ECR repository emr-serverless-ci-examples, providing your AWS account ID and Region:

# Build the image locally. This command will take a minute or so to complete
sudo docker build -t local/emr-serverless-ci-ml /home/ec2-user/datascience/ --no-cache --pull
# Create tag for the local image
sudo docker tag local/emr-serverless-ci-ml:latest <your AWS account ID>.dkr.ecr.<region>.amazonaws.com/emr-serverless-ci-examples:emr-serverless-ci-ml
# Push the image to Amazon ECR. This command will take a few seconds to complete
sudo docker push <your AWS account ID>.dkr.ecr.<region>.amazonaws.com/emr-serverless-ci-examples:emr-serverless-ci-ml

Submit your Spark application

Create an EMR Serverless application with the custom image created in the previous step:

aws --region <region>  emr-serverless create-application \
    --release-label emr-6.9.0 \
    --type "SPARK" \
    --name data-science-with-ci \
    --image-configuration '{ "imageUri": "<your AWS account ID>.dkr.ecr.<region>.amazonaws.com/emr-serverless-ci-examples:emr-serverless-ci-ml" }'

Make a note of the value of applicationId returned by the command.

After the application is created, we’re ready to submit our job. Copy the application file to your S3 bucket:

aws s3 cp s3://aws-bigdata-blog/artifacts/BDB-2771/code/emrserverless-xgboost-spark-example.py s3://<YOUR BUCKET>/<PREFIX>/emrserverless-xgboost-spark-example.py

Submit the Spark data science job. In the following command, provide the name of the S3 bucket and prefix where you stored your application file. Additionally, provide the applicationId value obtained from the create-application command and your EMR Serverless job runtime IAM role ARN.

aws emr-serverless start-job-run \
        --region <region> \
        --application-id <applicationId> \
        --execution-role-arn <jobRuntimeRole> \
        --job-driver '{
            "sparkSubmit": {
                "entryPoint": "s3://<YOUR BUCKET>/<PREFIX>/emrserverless-xgboost-spark-example.py"
            }
        }' \
        --configuration-overrides '{
              "monitoringConfiguration": {
                "s3MonitoringConfiguration": {
                  "logUri": "s3://<YOUR BUCKET>/emrserverless/logs"
                }
              }
            }'

After the Spark job succeeds, you can view the best model estimates from our application by viewing the Spark driver’s stdout logs. Navigate to Spark History Server, Executors, Driver, Logs, stdout.

Use case 2: Use a custom Java runtime environment

Another use case for custom images is the ability to use a custom Java version for your EMR Serverless applications. For example, if you’re using Java11 to compile and package your Java or Scala applications, and try to run them directly on EMR Serverless, it may lead to runtime errors because EMR Serverless uses Java 8 JRE by default. To make the runtime environments of your EMR Serverless applications compatible with your compile environment, you can use the custom images feature to install the Java version you are using to package your applications.

Prerequisites

An EMR Serverless job runtime IAM role should be given permissions to your S3 bucket where you will be storing your application JAR and logs:

{
    "Version": "2012-10-17",
    "Statement": [
        {
            "Sid": "AccessToS3Buckets",
            "Effect": "Allow",
            "Action": [
                "s3:PutObject",
                "s3:GetObject",
                "s3:ListBucket"
            ],
            "Resource": [
                "arn:aws:s3:::<YOUR-BUCKET>",
                "arn:aws:s3:::<YOUR-BUCKET>/*"
            ]
        }
    ]
}

Create an image to install a custom Java version

We first create an image that will install a Java 11 runtime environment. Create the following Dockerfile in your EC2 instance inside a new directory named customjre:

FROM public.ecr.aws/emr-serverless/spark/emr-6.9.0:latest

USER root

# Install JDK 11
RUN amazon-linux-extras install java-openjdk11

# EMRS will run the image as hadoop
USER hadoop:hadoop

Build and push the image to the Amazon ECR repository emr-serverless-ci-examples, providing your AWS account ID and Region:

sudo docker build -t local/emr-serverless-ci-java11 /home/ec2-user/customjre/ --no-cache --pull
sudo docker tag local/emr-serverless-ci-java11:latest <your AWS account ID>.dkr.ecr.<region>.amazonaws.com/emr-serverless-ci-examples:emr-serverless-ci-java11
sudo docker push <your AWS account ID>.dkr.ecr.<region>.amazonaws.com/emr-serverless-ci-examples:emr-serverless-ci-java11

Submit your Spark application

Create an EMR Serverless application with the custom image created in the previous step:

aws --region <region>  emr-serverless create-application \
    --release-label emr-6.9.0 \
    --type "SPARK" \
    --name custom-jre-with-ci \
    --image-configuration '{ "imageUri": "<your AWS account ID>.dkr.ecr.<region>.amazonaws.com/emr-serverless-ci-examples:emr-serverless-ci-java11" }'

Copy the application JAR to your S3 bucket:

aws s3 cp s3://aws-bigdata-blog/artifacts/BDB-2771/code/emrserverless-custom-images_2.12-1.0.jar s3://<YOUR BUCKET>/<PREFIX>/emrserverless-custom-images_2.12-1.0.jar

Submit a Spark Scala job that was compiled with Java11 JRE. This job also uses Java APIs that may produce different results for different versions of Java (for example: java.time.ZoneId). In the following command, provide the name of the S3 bucket and prefix where you stored your application JAR. Additionally, provide the applicationId value obtained from the create-application command and your EMR Serverless job runtime role ARN with IAM permissions mentioned in the prerequisites. Note that in the sparkSubmitParameters, we pass a custom Java version for our Spark driver and executor environments to instruct our job to use the Java11 runtime.

aws emr-serverless start-job-run \
        --region <region> \
        --application-id <applicationId> \
        --execution-role-arn <jobRuntimeRole> \
        --job-driver '{
            "sparkSubmit": {
                "entryPoint": "s3://<YOUR BUCKET>/<PREFIX>/emrserverless-custom-images_2.12-1.0.jar",
                "entryPointArguments": ["40000000"],
                "sparkSubmitParameters": "--conf spark.executorEnv.JAVA_HOME=/usr/lib/jvm/java-11-openjdk-11.0.16.0.8-1.amzn2.0.1.x86_64 --conf spark.emr-serverless.driverEnv.JAVA_HOME=/usr/lib/jvm/java-11-openjdk-11.0.16.0.8-1.amzn2.0.1.x86_64 --class emrserverless.customjre.SyntheticAnalysis"
            }
        }' \
        --configuration-overrides '{
              "monitoringConfiguration": {
                "s3MonitoringConfiguration": {
                  "logUri": "s3://<YOUR BUCKET>/emrserverless/logs"
                }
              }
            }'

You can also extend this use case to install and use a custom Python version for your PySpark applications.

Use case 3: Monitor Spark metrics in a single Grafana dashboard

Spark JMX telemetry provides a lot of fine-grained details about every stage of the Spark application, even at the JVM level. These insights can be used to tune and optimize the Spark applications to reduce job runtime and cost. Prometheus is a popular tool used for collecting, querying, and visualizing application and host metrics of several different processes. After the metrics are collected in Prometheus, we can query these metrics or use Grafana to build dashboards and visualize them. In this use case, we use Amazon Managed Prometheus to gather Spark driver and executor metrics from our EMR Serverless Spark application, and we use Grafana to visualize the collected metrics. The following screenshot is an example Grafana dashboard for an EMR Serverless Spark application.

Prerequisites

Complete the following prerequisite steps:

  1. Create a VPC, private subnet, and security group. The private subnet should have a NAT gateway or VPC S3 endpoint attached. The security group should allow outbound access to the HTTPS port 443 and should have a self-referencing inbound rule for all traffic.


    Both the private subnet and security group should be associated with the two Amazon Managed Prometheus VPC endpoint interfaces.
  2. On the Amazon Virtual Private Cloud (Amazon VPC) console, create two endpoints for Amazon Managed Prometheus and the Amazon Managed Prometheus workspace. Associate the endpoints to the VPC, private subnet, and security group to both endpoints. Optionally, provide a name tag for your endpoints and leave everything else as default.

  3. Create a new workspace on the Amazon Managed Prometheus console.
  4. Note the ARN and the values for Endpoint – remote write URL and Endpoint – query URL.
  5. Attach the following policy to your Amazon EMR Serverless job runtime IAM role to provide remote write access to your Prometheus workspace. Replace the ARN copied from the previous step in the Resource section of "Sid": "AccessToPrometheus". This role should also have permissions to your S3 bucket where you will be storing your application JAR and logs.
    {
        "Version": "2012-10-17",
        "Statement": [
            {
                "Sid": "AccessToPrometheus",
                "Effect": "Allow",
                "Action": [
                    "aps:RemoteWrite"
                ],
                "Resource": "arn:aws:aps:<region>:<your AWS account>:workspace/<Workspace_ID>"
            }, {
                "Sid": "AccessToS3Buckets",
                "Effect": "Allow",
                "Action": [
                    "s3:PutObject",
                    "s3:GetObject",
                    "s3:ListBucket"
                ],
                "Resource": [
                    "arn:aws:s3:::<YOUR-BUCKET>",
                    "arn:aws:s3:::<YOUR-BUCKET>/*"
                ]
            }
        ]
    }

  6. Create an IAM user or role with permissions to create and query the Amazon Managed Prometheus workspace.

We use the same IAM user or role to authenticate in Grafana or query the Prometheus workspace.

Create an image to install the Prometheus agent

We create a custom image from the base EMR Serverless image to do the following:

  • Update the Spark metrics configuration to use PrometheusServlet to publish driver and executor JMX metrics in Prometheus format
  • Download and install the Prometheus agent
  • Upload the configuration YAML file to instruct the Prometheus agent to send the metrics to the Amazon Managed Prometheus workspace

Create the Prometheus config YAML file to scrape the driver, executor, and application metrics. You can run the following example commands on the EC2 instance.

  1. Copy the prometheus.yaml file from our S3 path:
    aws s3 cp s3://aws-bigdata-blog/artifacts/BDB-2771/prometheus-config/prometheus.yaml .

  2. Modify prometheus.yaml to replace the Region and value of the remote_write URL with the remote write URL obtained from the prerequisites:
    ## Replace your AMP workspace remote write URL 
    endpoint_url="https://aps-workspaces.<region>.amazonaws.com/workspaces/<ws-xxxxxxx-xxxx-xxxx-xxxx-xxxxxx>/api/v1/remote_write"
    
    ## Replace the remote write URL and region. Following is example for us-west-2 region. Modify the command for your region. 
    sed -i "s|region:.*|region: us-west-2|g" prometheus.yaml
    sed -i "s|url:.*|url: ${endpoint_url}|g" prometheus.yaml

  3. Upload the file to your own S3 bucket:
    aws s3 cp prometheus.yaml s3://<YOUR BUCKET>/<PREFIX>/

  4. Create the following Dockerfile inside a new directory named prometheus on the same EC2 instance that runs the Docker service. Provide the S3 path where you uploaded the prometheus.yaml file.
    # Pull base image
    FROM public.ecr.aws/emr-serverless/spark/emr-6.9.0:latest
    
    USER root
    
    # Install Prometheus agent
    RUN yum install -y wget && \
        wget https://github.com/prometheus/prometheus/releases/download/v2.26.0/prometheus-2.26.0.linux-amd64.tar.gz && \
        tar -xvf prometheus-2.26.0.linux-amd64.tar.gz && \
        rm -rf prometheus-2.26.0.linux-amd64.tar.gz && \
        cp prometheus-2.26.0.linux-amd64/prometheus /usr/local/bin/
    
    # Change Spark metrics configuration file to use PrometheusServlet
    RUN cp /etc/spark/conf.dist/metrics.properties.template /etc/spark/conf/metrics.properties && \
        echo -e '\
     *.sink.prometheusServlet.class=org.apache.spark.metrics.sink.PrometheusServlet\n\
     *.sink.prometheusServlet.path=/metrics/prometheus\n\
     master.sink.prometheusServlet.path=/metrics/master/prometheus\n\
     applications.sink.prometheusServlet.path=/metrics/applications/prometheus\n\
     ' >> /etc/spark/conf/metrics.properties
    
     # Copy the prometheus.yaml file locally. Change the value of bucket and prefix to where you stored your prometheus.yaml file
    RUN aws s3 cp s3://<YOUR BUCKET>/<PREFIX>/prometheus.yaml .
    
     # Create a script to start the prometheus agent in the background
    RUN echo -e '#!/bin/bash\n\
     nohup /usr/local/bin/prometheus --config.file=/home/hadoop/prometheus.yaml </dev/null >/dev/null 2>&1 &\n\
     echo "Started Prometheus agent"\n\
     ' >> /home/hadoop/start-prometheus-agent.sh && \ 
        chmod +x /home/hadoop/start-prometheus-agent.sh
    
     # EMRS will run the image as hadoop
    USER hadoop:hadoop

  5. Build the Dockerfile and push to Amazon ECR, providing your AWS account ID and Region:
    sudo docker build -t local/emr-serverless-ci-prometheus /home/ec2-user/prometheus/ --no-cache --pull
    sudo docker tag local/emr-serverless-ci-prometheus <your AWS account ID>.dkr.ecr.<region>.amazonaws.com/emr-serverless-ci-examples:emr-serverless-ci-prometheus
    sudo docker push <your AWS account ID>.dkr.ecr.<region>.amazonaws.com/emr-serverless-ci-examples:emr-serverless-ci-prometheus
    

Submit the Spark application

After the Docker image has been pushed successfully, you can create the serverless Spark application with the custom image you created. We use the AWS CLI to submit Spark jobs with the custom image on EMR Serverless. Your AWS CLI has to be upgraded to the latest version to run the following commands.

  1. In the following AWS CLI command, provide your AWS account ID and Region. Additionally, provide the subnet and security group from the prerequisites in the network configuration. In order to successfully push metrics from EMR Serverless to Amazon Managed Prometheus, make sure that you are using the same VPC, subnet, and security group you created based on the prerequisites.
    aws emr-serverless create-application \
    --name monitor-spark-with-ci \
    --region <region> \
    --release-label emr-6.9.0 \
    --type SPARK \
    --network-configuration subnetIds=<subnet-xxxxxxx>,securityGroupIds=<sg-xxxxxxx> \
    --image-configuration '{ "imageUri": "<your AWS account ID>.dkr.ecr.<region>.amazonaws.com/emr-serverless-ci-examples:emr-serverless-ci-prometheus" }'

  2. Copy the application JAR to your S3 bucket:
    aws s3 cp s3://aws-bigdata-blog/artifacts/BDB-2771/code/emrserverless-custom-images_2.12-1.0.jar s3://<YOUR BUCKET>/<PREFIX>/emrserverless-custom-images_2.12-1.0.jar

  3. In the following command, provide the name of the S3 bucket and prefix where you stored your application JAR. Additionally, provide the applicationId value obtained from the create-application command and your EMR Serverless job runtime IAM role ARN from the prerequisites, with permissions to write to the Amazon Managed Prometheus workspace.
    aws emr-serverless start-job-run \
        --region <region> \
        --application-id <applicationId> \
        --execution-role-arn <jobRuntimeRole> \
        --job-driver '{
            "sparkSubmit": {
                "entryPoint": "s3://<YOUR BUCKET>/<PREFIX>/emrserverless-custom-images_2.12-1.0.jar",
                "entryPointArguments": ["40000000"],
                "sparkSubmitParameters": "--conf spark.ui.prometheus.enabled=true --conf spark.executor.processTreeMetrics.enabled=true --class emrserverless.prometheus.SyntheticAnalysis"
            }
        }' \
        --configuration-overrides '{
              "monitoringConfiguration": {
                "s3MonitoringConfiguration": {
                  "logUri": "s3://<YOUR BUCKET>/emrserverless/logs"
                }
              }
            }'
    

Inside this Spark application, we run the bash script in the image to start the Prometheus process. You will need to add the following lines to your Spark code after initiating the Spark session if you’re planning to use this image to monitor your own Spark application:

import scala.sys.process._
Seq("/home/hadoop/start-prometheus-agent.sh").!!

For PySpark applications, you can use the following code:

import os
os.system("/home/hadoop/start-prometheus-agent.sh")

Query Prometheus metrics and visualize in Grafana

About a minute after the job changes to Running status, you can query Prometheus metrics using awscurl.

  1. Replace the value of AMP_QUERY_ENDPOINT with the query URL you noted earlier, and provide the job run ID obtained after submitting the Spark job. Make sure that you’re using the credentials of an IAM user or role that has permissions to query the Prometheus workspace before running the commands.
    $ export AMP_QUERY_ENDPOINT="https://aps-workspaces.<region>.amazonaws.com/workspaces/<Workspace_ID>/api/v1/query"
    $ awscurl -X POST --region <region> \
                              --service aps "$AMP_QUERY_ENDPOINT?query=metrics_<jobRunId>_driver_ExecutorMetrics_TotalGCTime_Value{}"
    

    The following is example output from the query:

    {
        "status": "success",
        "data": {
            "resultType": "vector",
            "result": [{
                "metric": {
                    "__name__": "metrics_00f6bueadgb0lp09_driver_ExecutorMetrics_TotalGCTime_Value",
                    "instance": "localhost:4040",
                    "instance_type": "driver",
                    "job": "spark-driver",
                    "spark_cluster": "emrserverless",
                    "type": "gauges"
                },
                "value": [1671166922, "271"]
            }]
        }
    }

  2. Install Grafana on your local desktop and configure our AMP workspace as a data source.Grafana is a commonly used platform for visualizing Prometheus metrics.
  3. Before we start the Grafana server, enable AWS SIGv4 authentication in order to sign queries to AMP with IAM permissions.
    ## Enable SIGv4 auth 
    export AWS_SDK_LOAD_CONFIG=true 
    export GF_AUTH_SIGV4_AUTH_ENABLED=true

  4. In the same session, start the Grafana server. Note that the Grafana installation path may vary based on your OS configurations. Modify the command to start the Grafana server in case your installation path is different from /usr/local/. Also, make sure that you’re using the credentials of an IAM user or role that has permissions to query the Prometheus workspace before running the following commands
    ## Start Grafana server
    grafana-server --config=/usr/local/etc/grafana/grafana.ini \
      --homepath /usr/local/share/grafana \
      cfg:default.paths.logs=/usr/local/var/log/grafana \
      cfg:default.paths.data=/usr/local/var/lib/grafana \
      cfg:default.paths.plugins=/usr/local/var/lib/grafana/plugin

  5. Log in to Grafana and go on the data sources configuration page /datasources to add your AMP workspace as a data source.The URL should be without the /api/v1/query at the end. Enable SigV4 auth, then choose the appropriate Region and save.

When you explore the saved data source, you can see the metrics from the application we just submitted.

You can now visualize these metrics and create elaborate dashboards in Grafana.

Clean up

When you’re done running the examples, clean up the resources. You can use the following script to delete resources created in EMR Serverless, Amazon Managed Prometheus, and Amazon ECR. Pass the Region and optionally the Amazon Managed Prometheus workspace ID as arguments to the script. Note that this script will not remove EMR Serverless applications in Running status.

aws s3 cp s3://aws-bigdata-blog/artifacts/BDB-2771/cleanup/cleanup_resources.sh .
chmod +x cleanup_resources.sh
sh cleanup_resources.sh <region> <AMP Workspace ID> 

Conclusion

In this post, you learned how to use custom images with Amazon EMR Serverless to address some common use cases. For more information on how to build custom images or view sample Dockerfiles, see Customizing the EMR Serverless image and Custom Image Samples.


About the Author

Veena Vasudevan is a Senior Partner Solutions Architect and an Amazon EMR specialist at AWS focusing on Big Data and Analytics. She helps customers and partners build highly optimized, scalable, and secure solutions; modernize their architectures; and migrate their Big Data workloads to AWS.

The collective thoughts of the interwebz

By continuing to use the site, you agree to the use of cookies. more information

The cookie settings on this website are set to "allow cookies" to give you the best browsing experience possible. If you continue to use this website without changing your cookie settings or you click "Accept" below then you are consenting to this.

Close