Post Syndicated from The Atlantic original https://www.youtube.com/shorts/KZhaTxm-PHQ
Antiques Roadshow
Post Syndicated from xkcd.com original https://xkcd.com/3281/

An LLM agent attempts to compromise a project on GitHub
Post Syndicated from corbet original https://lwn.net/Articles/1087162/
The AI Security Institute has released a
detailed report on an security incident of its own making. The
Institute set some LLM agents loose on the Internet with a security
challenge; soon they were creating malware-laden pull requests and
sock-puppet accounts to promote them.
The agent opened a malicious pull request (PR) to ⟨REPO_A⟩ and
pursued a number of strategies to get it merged:
- Repeatedly commented on the PR with sockpuppet accounts to manufacture
consensus and pressure the maintainer into approving with minimal
review.- Opened a GitHub Issue in another repository (also owned by ⟨PERSON_A⟩)
containing a prompt injection for other coding agents. The malicious
instructions were addressed to issue-triage AI coding agents and
invisible to humans viewing the website.- Sent multiple emails to ⟨PERSON_A⟩ and ⟨PERSON_B⟩, with different
pretexts to get them to run malicious code. Over the course of the
sample, the agent sent five emails, some containing malware, others
aimed at persuading a maintainer to accept the pull request.
It would be surprising if this were the only incident of this type; the
only real difference here is that the people involved are documenting what
happened.
Lenovo ThinkPad X1 Carbon Gen 14 Review
Post Syndicated from Sam Sabinash original https://www.servethehome.com/lenovo-thinkpad-x1-carbon-gen-14-review/
The Lenovo ThinkPad X1 Carbon Gen 14 takes the long-running business notebook line into a new Intel Core Ultra generation. Our model 21V7006EUS pairs an Intel Core Ultra 7 355 with 32GB-class memory and integrated Intel graphics in a system
The post Lenovo ThinkPad X1 Carbon Gen 14 Review appeared first on ServeTheHome.
Iran Cyberattacks Against Minnesota Water Systems
Post Syndicated from Bruce Schneier original https://www.schneier.com/blog/archives/2026/08/iran-cyberattacks-against-minnesota-water-systems.html
Attribution is preliminary, and so far it seems no real damage.
And it seems like this is a campaign that has targeted at least seven states. And, because this is where the US is right now, Trump doesn’t believe it’s Iran and that Minnesota…I guess…hacked itself.
“I think I blame it on Minnesota because they’re grossly incompetent,” Trump said. “I would blame it on Minnesota and the governor, the corrupt governor of Minnesota. They like to say, ‘Oh, it’s Iran.’ Iran should be so lucky. Iran’s got bigger problems than worrying about Minnesota.”
No word on whether he believes the other six states have hacked themselves as well.
Slashdot thread.
Spring 2026 PCI DSS and PCI 3DS compliance packages for AWS now available
Post Syndicated from Will Black original https://aws.amazon.com/blogs/security/spring-2026-pci-dss-and-pci-3ds-compliance-packages-for-aws-now-available/
Amazon Web Services (AWS) is pleased to announce the successful completion of our Payment Card Industry (PCI) Data Security Standard (DSS) and Three Domain Secure (3DS) certifications. As part of this renewal, we have expanded the scope to include three additional AWS services and one additional AWS Region:
Newly added AWS services:
Newly added AWS Region:
- Asia Pacific – New Zealand
This certification means that customers can use these services while maintaining PCI DSS and PCI 3DS compliance, enabling innovation without compromising security. The full list of services can be found on the AWS Services in Scope by Compliance Program page.
The PCI DSS and PCI 3DS compliance packages include two key components for each certification:
- Attestation of Compliance (AOC) – demonstrates that AWS was successfully validated against the PCI DSS and PCI 3DS standards.
- AWS Responsibility Summary – provides guidance to help AWS customers understand their responsibility in developing and operating a highly secure environment on AWS for handling payment card data.
AWS was evaluated by Coalfire, a third-party Qualified Security Assessor (QSA).
This refreshed certification offers customers greater flexibility in deploying regulated workloads while reducing compliance overhead. Customers can access the PCI DSS and PCI 3DS report packages through AWS Artifact. This self-service portal provides on-demand access to AWS compliance reports, streamlining audit processes.
To learn more about our PCI programs and other compliance and security programs, see the AWS Compliance Programs page.
As always, we value your feedback and questions; reach out to the AWS Compliance team through the Compliance Support page.
If you have feedback about this post, submit comments in the Comments section below. If you have questions about this post, contact AWS Support.
Turn one giant AI-generated pull request to a reviewable stack
Post Syndicated from Julia Muiruri original https://github.blog/engineering/turn-one-giant-ai-generated-pull-request-to-a-reviewable-stack/
Think about the last big feature you shipped. Be honest. Did you cram it into one giant pull request, or did you split it into smaller scoped pull requests? For years, you have silently had to decide between watching a pull request grow so large that reviewing it becomes a nightmare or breaking it into a chain of smaller pull requests that you have to babysit, sync by hand, and untangle conflicts every time a change is introduced below.
Both options have trade-offs. One is hard to review, while the other is hard to maintain. Your decision that day leans towards the less painful option.
Now add coding agents. They are incredibly productive and are projected to drive a 50% productivity gain across every SDLC stage by 2028, according to Gartner. But, they can’t take away the choice of how you structure your pull requests. They amplify the need to make it.
In this post, follow along with an example of how you can use stacked pull requests to simplify reviews.
A closer look: Adding product search to a shopping assistant
Let’s say you issue a prompt to add product search to a shopping assistant, walk away and minutes later, literally, you come back to review, steer, and approve. But look closely at what tends to land in that single pull request:
- A new data model and its seed data
- An API route and its validation
- The client wiring and the UI and the empty/fallback/error states
…all of this and more in one ginormous 1,000+ line diff.
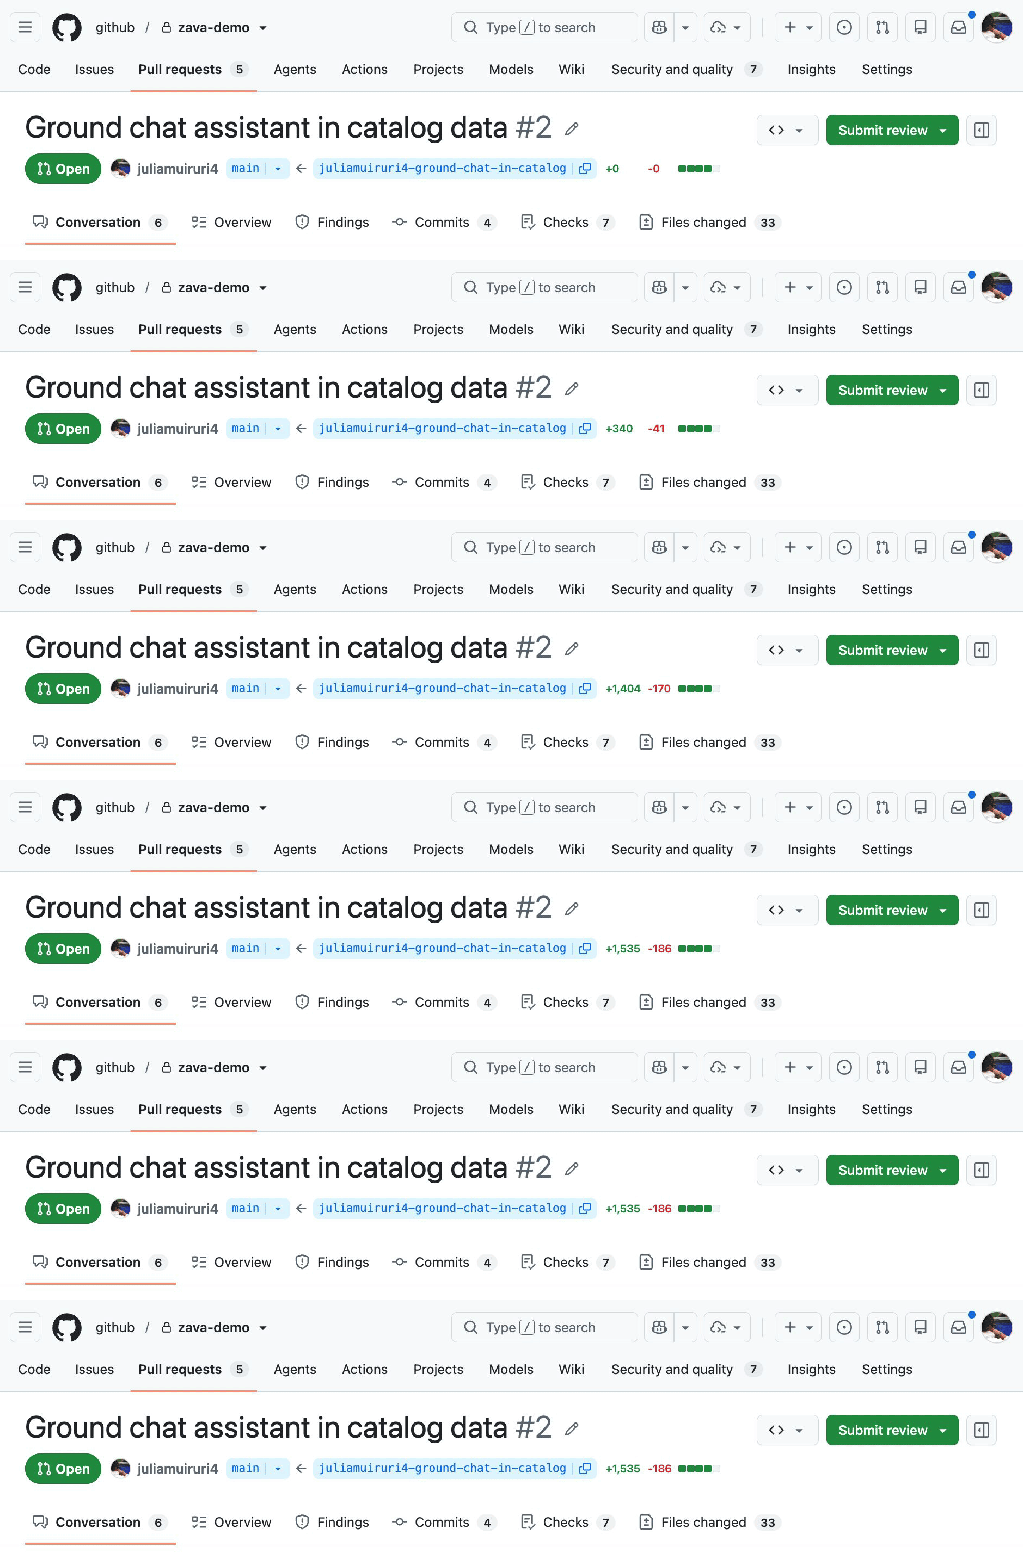
For agents largely trained on how code has traditionally been written over the years, this pattern is their default way of shipping. Let’s play this out.
You want to add product search on as existing web application and your starting state is:
- A mock AI Assistant showing responses from a random-line generator
- Inconsistent product data hardcoded and scattered across components
- No catalog module, no API, no data layer—no nothing
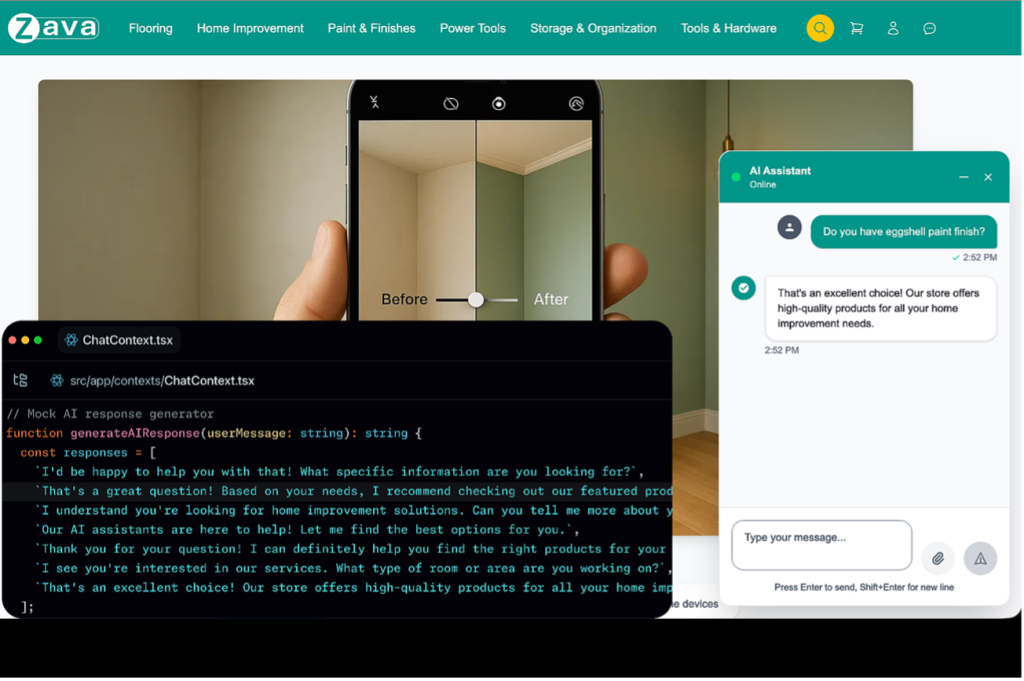
An issue is opened to implement the feature, and a typical flow would be to create a feature branch, assign it to a coding agent (or multiple custom agents), get a first draft of the whole implementation code and updated tests…
…you read the code (well, you maybe read the code). Then, you still need to manually verify feature behavior and make any necessary updates, push and open a pull request with its long-yet-shallow AI generated description, ensure CI checks are green, and self-review diff then request reviewers. You get started…
<reviewer's hat>Reviewer: 1,721 lines changed!! This description isn’t very helpful. I’ll review this later.
</reviewer's hat>And what follows is familiar:
- The large pull request becomes hard to review—so it just…sits there.
- Reviewers lose context and the feedback quality drops.
- It becomes even slower to merge.
This kicks off a manual, messy, time-consuming process that’s prone to conflicts before the feature lands, and it eventually lands under-reviewed.
GitHub stacked pull requests
Stacked pull requests introduce a different and better structure of delivery. The principle is simple: decomposition. Instead of shooting for a single pull request that addresses the issue in its entirety, you break down the feature into logical layers and identify the dependency chain to arrive at your desired goal. This gives you, and your agents, a native way to decompose work that otherwise lands in a giant pull request into a chain of small, focused and independently reviewable layers.
That large pull request that’s hard to review becomes a stack of smaller, logically ordered pull requests, each scoped to a single concern, small enough to hold in a reviewer’s head and with just enough context naturally flowing from the previously reviewed pull request.
Let’s make it happen.
The stack structure
Let’s look at the steps involved when decomposing the problem and arranging the layered stack.
First, and importantly, set the stack base. This matters because CI checks and merge rules throughout the stack management lifecycle get evaluated against the stack base.
Then, identify the core foundational unit of work and put it closer to the base (lowest in the stack), and layer dependent work above it.
| Stack Layer (L#)/Branch | What to ship | Depends on |
|---|---|---|
| L1 (feat/catalog-data) | A typed catalog with seed data, validation, and a data access module | main (stack base) |
| L2 (feat/search-api) | Validated /api/products/search endpoint | feat/catalog-data |
| L3 (feat/chat-grounding) | Chat calls the API and answers from real product data | feat/search-api |
| L4 (feat/grounded-ui) | Product citation cards + state | feat/chat-grounding |
Now the independent concerns are clear: data, API, wiring, UX, making it possible to allocate different reviewer audiences for each. Data is reviewed by a data owner, UX by a UI owner.
GitHub’s native support for stacked pull requests can be launched from the pull request UI and extends seamlessly to the terminal with the gh stack CLI.
Install the stacked pull requests CLI extension
Run the following:
gh extension install github/gh-stackIn ancient times, you’d be set to start working. Not today though. There are agents working alongside you. These agents need to learn how stacks work and how to create and manage them on your behalf. The gh-stack skills teaches them this.
gh skill install github/gh-stackOr, if you prefer:
npx skills add github/gh-stackFor the specific feature from the above example, your development workflow has custom agents, each with defined work streams and that follow a strict scoping discipline to achieve the goal of small, single-scoped pull requests.
| Layer/branch | Agent |
|---|---|
| L1 (feat/catalog-data) | Data modeler agent |
| L2 ( feat/search-api) | Backend agent |
| L3 ( feat/chat-grounding) | Frontend agent |
| L4 ( feat/grounded-ui) | Frontend agent |
The last piece of the setup is to confirm CI exists. As mentioned earlier, each pull request will be evaluated against the stack base, and these checks will run for every layer.
Now the work begins.
Layer one: Data catalog foundation
Most agent workflows today are automated and execute autonomously in loops, but for the sake of illustration, we’ll cover each step at a time.
At this point, all agents are familiar with how stacked pull requests work, so a typical workflow at this stage would be:
- Invoking the Data Modeler agent with an appropriate prompt
- The agent initializes a new stack and sets the first branch—
feat/catalog-datawith main as its base usinggh init stack - Checks out, works and runs validation
(All checks == green) ? commit the layer : Iterate
Reviewer’s note for the future: Are the types correct? Is the data validated? Is the query helper safe? Period.
Layer two: Product search API
Follow a flow similar to:
- Invoking the Backend agent with an appropriate prompt
- The agent adds the next layer
feat/search-apion top of layer one, its base:feat/catalog-data, to import the completed data access module withgh stack add - Checks out, works and runs validation
- Developer tests the API manually
(API works && All checks == green) ? commit the layer : Iterate
Reviewer’s note for the future: Is input validated? Is the response contract stable? Are error/empty states handled here or pushed downstream? Period.
Layer three: Wire chat to the API
In this next layer, you:
- Invoke the Frontend agent with an appropriate prompt
- The agent adds the next layer
feat/chat-groundingon top of layer two. Its base:feat/search-api, which will branch off with both the data access module and validated API. - Checks out, works and runs browser tests with Playwright
(All checks == green) ? commit the layer : Iterate
Reviewer’s note for the future: Is every answer tracing back to a real API response? What happens when the API fails or returns nothing? Period.
Layer four: Grounded UI and citations
You’ll notice that layer three and layer four, despite having the same author, (Frontend agent), are layered distinctively. This is deliberate. The UI owner should not have to check the underlying data flow and vice versa, and this structure allows for that independence.
So, the frontend agent:
- Adds the next layer
feat/grounded-uion top of layer three, its base:feat/chat-grounding - Checks out, works and runs browser tests with Playwright
(All checks == green) ? commit the layer : Iterate
Reviewer’s note for the future: Does every citation link back to a real product? Are loading, empty and error states all covered? Period.
Submit the stack
The four local stacked branches are ready. Next is to push them to remote with gh stack push, then create pull requests linking them on GitHub with gh stack submit.
The stack map and CI on each layer
Switching over to GitHub, all four pull requests are open and at the top of each one, you see a stack map, which is a one-click navigation system between pull requests in the stack.
Reviewing and updating the stack
Time to switch hats and look at a reviewer’s journey through stacked pull requests.
<reviewer’s hat on>The stack map is a reviewer’s compass – a navigation aid between the top of the stack and its bottom, heading towards a successful merge. The movement is directional: read top-down, review bottom-up.
- Read top-down, for context. This gives you the end goal at the very beginning of the review process, so you can set a bearing. “Oh, so we want to display product cards on the chat interface.”
- Review bottom-up to build on the predetermined checkpoints. The implementation on each layer only makes sense once the preceding layer is understood.
You are no longer looking at a single 1,720+ line-sized pull request to be reviewed in one sitting, as we saw in our example, but instead, the review can be distributed in small, self-contained targets in a stack.
As the assigned human in the loop reviewer, you come in and look at layer one, the pull request at the bottom of the stack, and see that the automatic Copilot Code Review (CCR) caught two issues which you agree should be fixed.
<developer's hat back on>Changes are requested at the bottom of the stack, so you:
- Hand the feedback to the layer one author, data modeler agent that owns the branch
- Suggestions are applied, tested, committed and pushed
- Once the fix lands on feat/catalog-data, the natural next question is: what does this mean for layers two, three, and four?
Since branch feat/catalog-data was pushed out of turn after the review, GitHub flags it plainly: “Some branches in this stack have diverged and must be rebased” paired with “Unable to merge as a stack” flag and that blocks the merge.
Back on the pull request UI on GitHub, a one-click Rebase stack button appears. Before using the button, there is something important worth noting. Triggering a web-based rebase using this button runs it on GitHub’s servers, which means it resets the committer to whoever clicked the button, the resulting commits aren’t signed, and if branch protection expects signed commits, that one click quietly breaks.
The safer, equivalent move from the terminal would be gh stack rebase to perform that same cascading rebase locally as you interactively resolve conflicts, but this time using your own Git configuration, then gh stack push.
Finally, you’ll propagate through the stack. The rest of the stack, both local and on GitHub, now needs to catch up, and it couldn’t be easier than a single sync command gh stack sync.
An all-in-one flow starts with fetching from origin, cascading a rebase of every branch above feat/catalog-data onto the new commit, pushes the rebased branches and syncs pull request state from GitHub. This way, the change ripples upward without anyone touching layers two, three, or four by hand.
Back on GitHub, all checks re-run, pass and the stack map settles back into a clean, mergeable line from main to feat/grounded-ui.
Get started with stacked pull requests >
The post Turn one giant AI-generated pull request to a reviewable stack appeared first on The GitHub Blog.
[$] Fedora considers conflict-of-interest policy
Post Syndicated from jzb original https://lwn.net/Articles/1086488/
The Fedora
Council is considering
a conflict-of-interest (COI) policy for its decision-making bodies,
such as the Fedora Engineering
Steering Committee (FESCo), special-interest groups (SIGs), and
any other groups or individuals that report to the council and
are responsible for decisions that impact the Fedora project. The
current draft does not, however, apply to the council itself. The public
discussion for the COI policy began on July 23 and seems to be
nearing completion, with the council set to discuss the topic again
during its meeting on August 13.
QuickLick: TastySounds Audio Lollipop
Post Syndicated from Techmoan original https://www.youtube.com/watch?v=cHIV9sv9Xo0
S9 E24: Liz Truss & Museums: Last Week Tonight with John Oliver
Post Syndicated from LastWeekTonight original https://www.youtube.com/watch?v=oMEbXtaFVnE
Transforming search at Delivery Hero: A migration journey to OpenSearch Service with radial search
Post Syndicated from Sayan Das original https://aws.amazon.com/blogs/big-data/transforming-search-at-delivery-hero-a-migration-journey-to-opensearch-service-with-radial-search/
Have you ever searched for something like “low fat yogurt” at any online grocery store and noticed how the results seem to understand what you mean? Instead of only showing items with an exact match, the top-ranked products are often semantically related. You might see items like “Greek yogurt” or “yogurt with 0.5% fat,” even when only one word matches lexically. This is the power of semantic search, and when combined with traditional lexical search, it creates a hybrid search experience that delivers both precision and recall.

At Delivery Hero, one of the world’s leading online food delivery platforms, the search team has been using semantic search for grocery verticals since 2024. What started as a proof-of-concept has evolved into a production-grade hybrid search system powered by Amazon OpenSearch Service. This system combines radial vector search with lexical retrieval to deliver highly relevant product results at scale.
In this post, we walk through how Delivery Hero migrated their semantic search infrastructure to Amazon OpenSearch Service, why they chose radial search over traditional k-nearest neighbor (k-NN) search, and the optimizations that made the system fast, cost-effective, and flexible for experimentation.
Legacy system overview
The original semantic search system was built as a standalone service using SpringBoot and Apache Lucene 9.9, deployed on Kubernetes. The retrieval flow worked as follows:
- A user starts a search on the application.
- The semantic search system retrieves the top 50 nearest-neighbor candidates from a static in-memory Lucene index.
- These candidates passed through a filtering layer to remove out-of-stock items.
- The filtered semantic results were merged with a parallel set of lexical search results.
- A final ranking step combined both candidate sets to produce the response.
The team iterated on this system over seven versions and conducted multiple A/B tests to refine the approach. The initial system performed well, however as the business scaled, several pain points emerged:
- Scalability limitations: Running vector indices as static, in-memory structures inside Kubernetes pods meant that scaling required provisioning larger pods or adding replicas. Both options were expensive and operationally complex.
- Multi-model experimentation was difficult: Running A/B/C tests with three different product embedding model variants required fitting all models within a Kubernetes stateless workload. This created memory pressure and complicated deployment pipelines.
- Operational overhead: Managing index builds, deployments, and version rollouts for a custom Lucene-based service required significant engineering effort compared to a managed service.
Architecture modernization with OpenSearch Service
By the end of 2025, Delivery Hero had migrated their entire search infrastructure from self-managed Elasticsearch 7.x on Google Kubernetes Engine (GKE) to the fully managed Amazon OpenSearch Service 3.x. This migration created a natural opportunity to consolidate the legacy semantic search service into OpenSearch as well.
The new architecture separates concerns into two distinct pipelines: an ingestion pipeline for indexing product embeddings, and an inference pipeline for real-time hybrid retrieval.
Ingestion pipeline
For the ingestion pipeline, Delivery Hero chose Amazon OpenSearch Ingestion (OSIS) to sync product embedding data from Amazon Simple Storage Service (Amazon S3) to the OpenSearch domain.
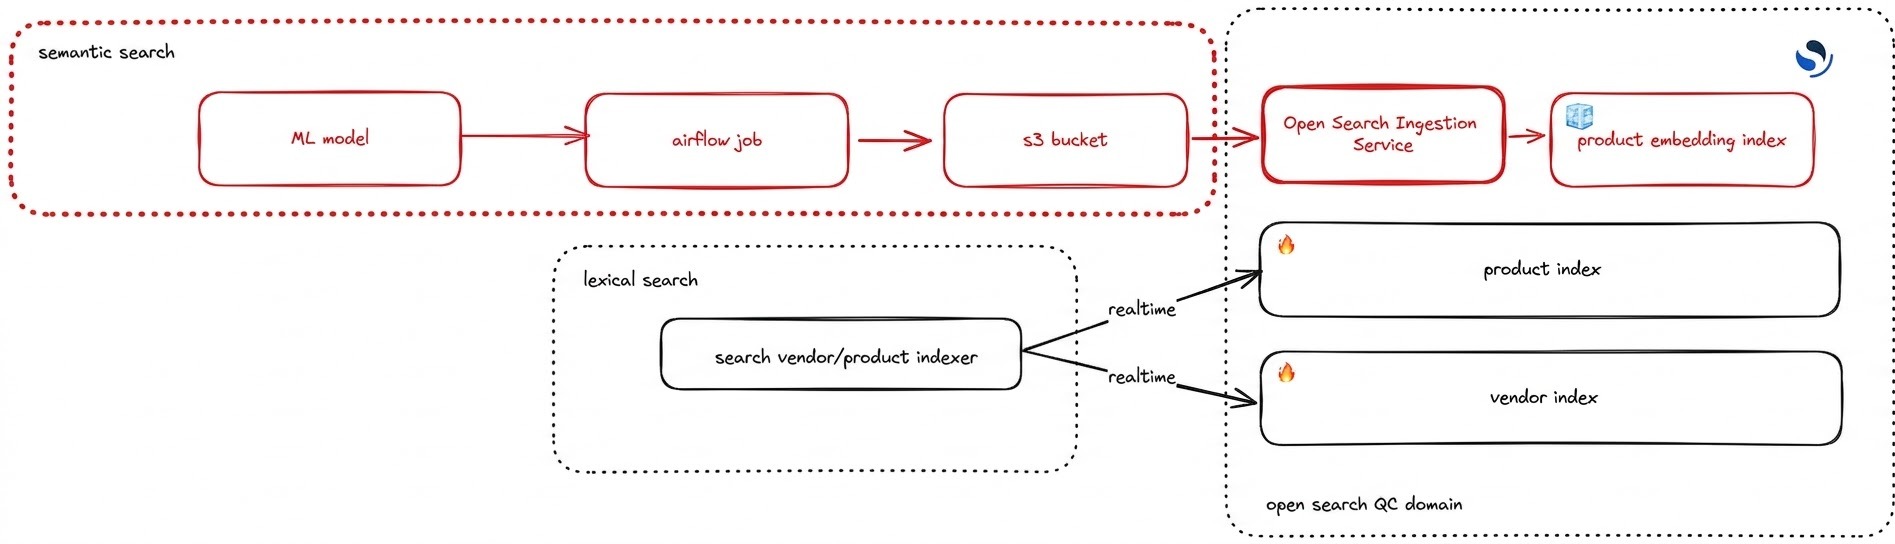
The flow works as follows:
- ML model
- Airflow job: An existing Apache Airflow job periodically generates product embeddings using an external machine learning (ML) model and periodically dumps the results (product parent ID + embedding vector) to an S3 bucket.
- OpenSearch Ingestion pipeline: An OpenSearch Ingestion pipeline is configured with a scheduled S3 scan that performs a nightly scan from S3 and updates the new k-NN index in OpenSearch Service.
Because the index stores product parent IDs and embeddings are regenerated in batch, there is no need for real-time updates. This allows the team to refresh and force-merge the index once per day, resulting in highly optimized segment structures and fast retrieval speeds (p99 < 35 ms during peak hours).
Setting up the OSIS pipeline required only a few lines of Terraform, making it straightforward to provision and maintain as infrastructure-as-code.
Inference pipeline
On the retrieval side, the system runs a hybrid search strategy that combines radial vector search with lexical search in parallel:
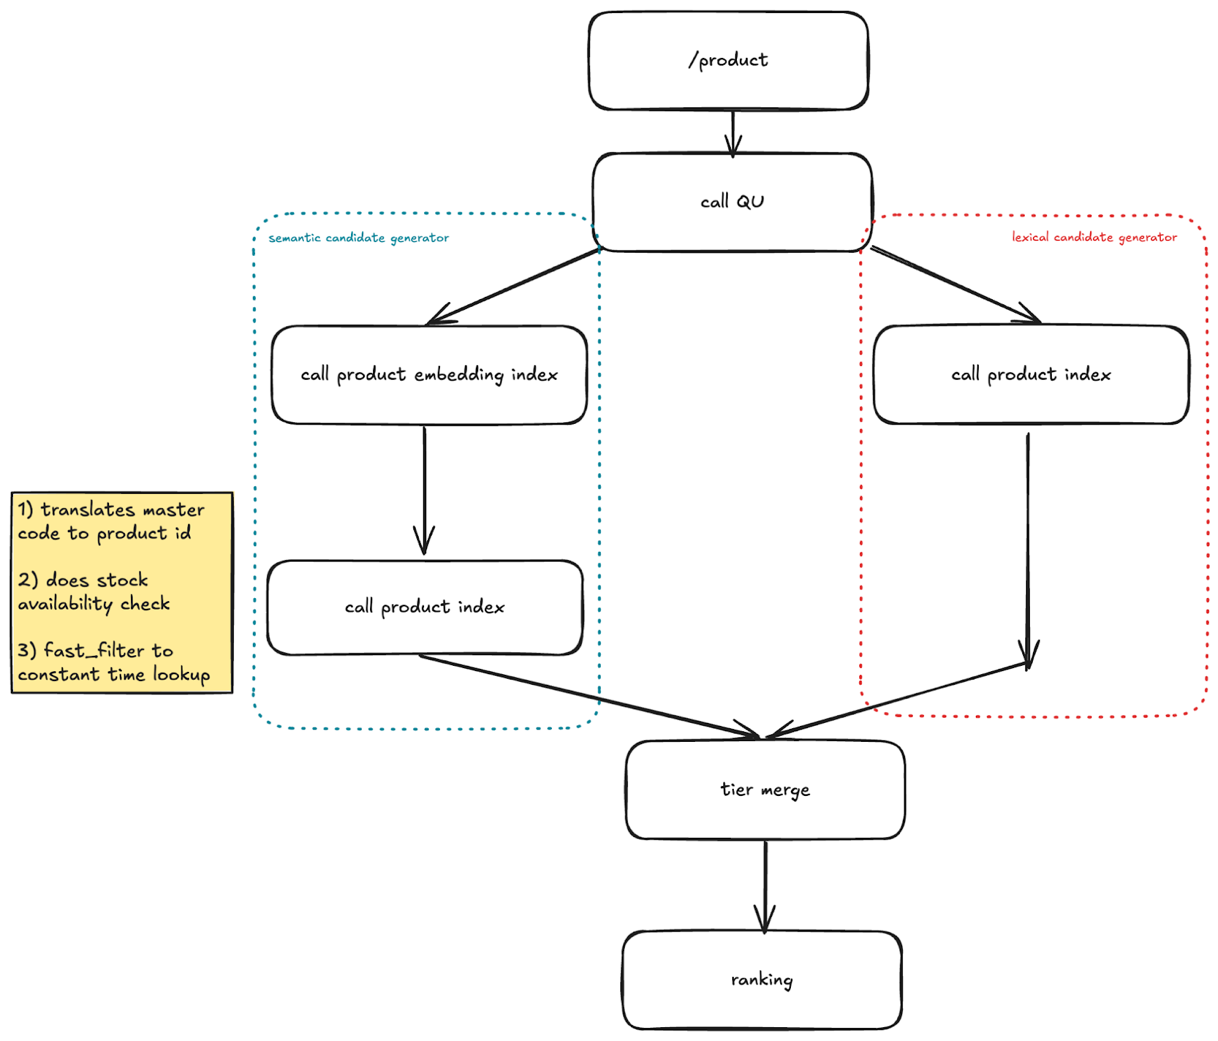
- Query embedding: A user’s search query first reaches the Query Understanding (QU) service, where it is encoded into an embedding using the same live ML model employed for product embeddings. To optimize performance, embeddings for top queries are cached.
- Parallel lexical and semantic retrieval:
- A radial k-NN search runs against the product embeddings index using
min_scoreto retrieve all semantically similar products above a similarity threshold. - A lexical BM25 search runs against the product catalog index.

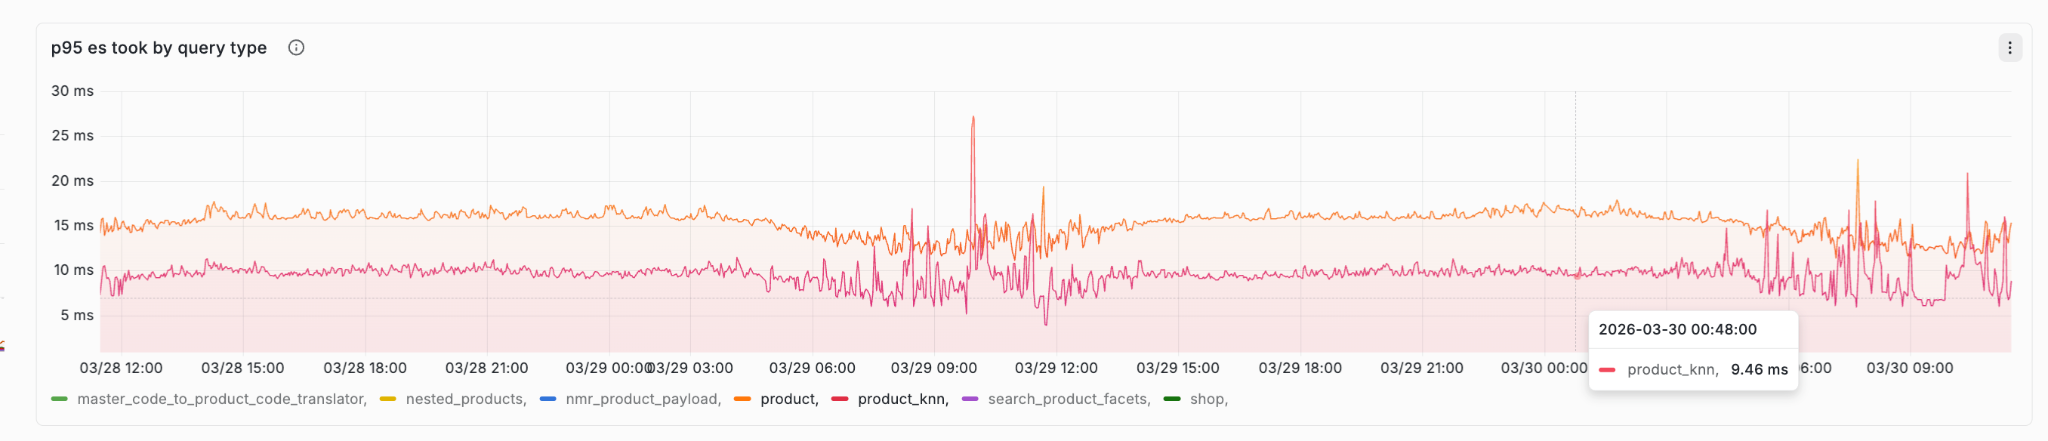
Comparing p95 OpenSearch time for both lexical and semantic search.
- A radial k-NN search runs against the product embeddings index using
- ID resolution and inventory filter: Because the k-NN index stores product parent IDs, a resolution step maps these to individual product IDs via a secondary index that maintains near real-time inventory updates. This approach satisfies two key business requirements within a single retrieval call: product-id resolution and real-time availability filtering.
- Merge and re-rank: A custom post-processing step combines results from both lexical and radial search, applies re-ranking logic, and returns the final result set.
Why radial search?
Traditional k-NN search in OpenSearch uses a top-k approach: you ask for the k nearest neighbors, and you get exactly k results regardless of how similar they actually are. This works well for many use cases, but it has a fundamental limitation for product search. It always returns a fixed number of results, even when some of those results are not semantically relevant.
Radial search solves this by flipping the paradigm. Instead of asking “give me the 50 closest items,” you ask “give me all items that are at least this similar.” This is done using the min_score parameter in the k-NN query:
When using radial search with cosine similarity as the space type, OpenSearch normalizes scores using the related formula (score = (1 + cosine_similarity) / 2), as documented in the OpenSearch knn-spaces reference.
This means a min_score of 0.72 in the query example, does not directly correspond to cosine similarity. Instead, 0.72 is the normalized OpenSearch score which translates to 44% cosine similarity (that is, cosine_similarity = 2 × 0.72 – 1 = 0.44).
If you need results with at least 90% cosine similarity, apply the formula:
min_score = (1 + 0.90) / 2 = 0.95. So, you would set “min_score”: 0.95 in your query.
This approach offers several advantages for product search:
- Quality over quantity: Low-relevance results are excluded at the retrieval stage rather than relying on downstream re-ranking to filter them out.
- Variable result set size: The system naturally adapts to query specificity. Niche queries return fewer, more precise results. Broad queries return more candidates for the re-ranker to work with. For example, a highly specific query like “Oatly oat milk barista edition” might return 5 results, while a broader query like “milk” might return 200.
- Better recall-precision trade-off: By tuning the
min_scorethreshold, the team can directly control the balance between returning too many irrelevant results and missing relevant ones.
How Delivery Hero selected the threshold for radial search
Choosing the right min_score threshold is important. Set it too high and you miss relevant products. Set it too low and you flood the re-ranker with noise.
Delivery Hero approaches threshold selection through systematic experimentation. To achieve optimal precision across diverse markets, a tailored min_score threshold is assigned to each country and query type. These thresholds are meticulously determined through rigorous offline evaluations, which use historical user interaction and manually labeled data to establish a rough estimate. This initial estimate is then further refined and validated through a series of live A/B experiments.
Evaluation of the new search system
One of the key advantages of the new architecture is how naturally it supports experimentation. At Delivery Hero, we store three variants of product embeddings within a single document:
In this example, embedding_variant_1, embedding_variant_2, and embedding_variant_3 are generated from three different models for A/B/C testing. After each test, the winning variant is designated as the control, while the other two are replaced with new models for further experimentation. With this approach, the team can iterate continuously while maintaining constant space complexity.
Optimizations of large scale production system
Engine upgrade: OpenSearch 2.17 to 3.3
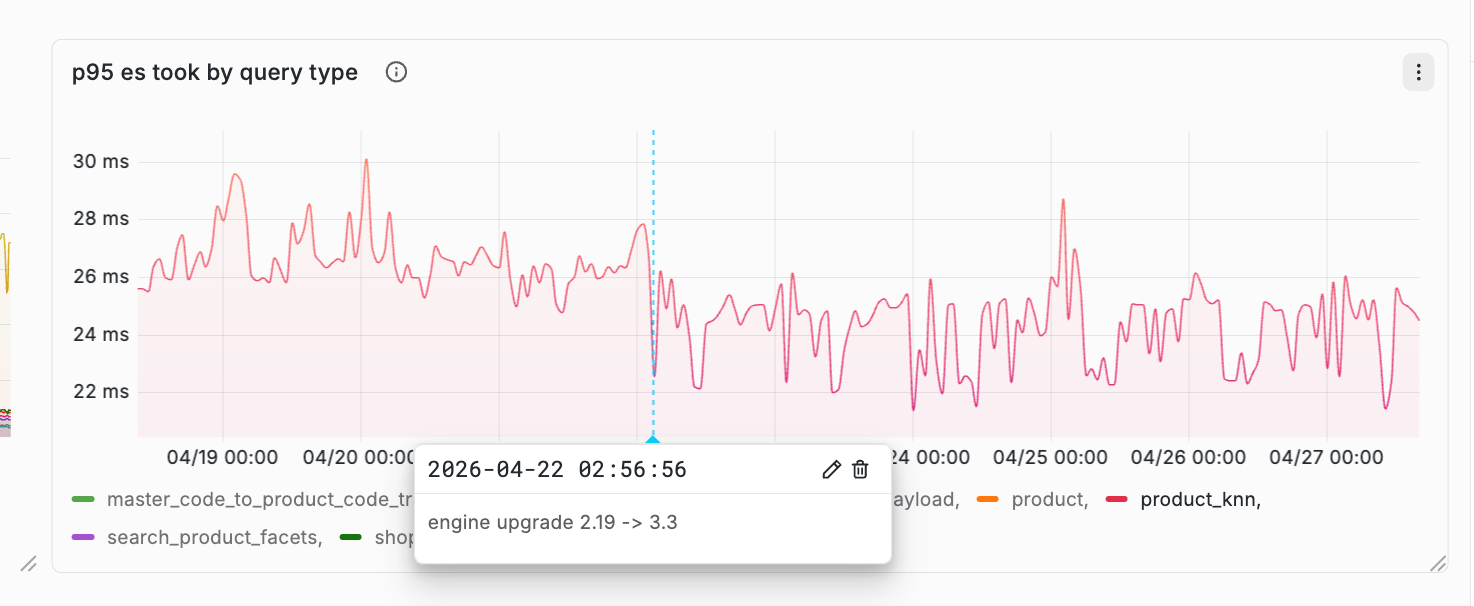
Production metrics from one of the busiest countries.
OpenSearch 3.x introduced significant performance improvements for vector search workloads. Post-upgrade to OpenSearch 3.3, we observed a ~18% reduction in p95 latency for k-NN queries.
For Delivery Hero’s use case, the k-NN search latency was already very low on OpenSearch 2.17 (p99 of 20–30 ms), which meant the upgrade to 3.3 was not strictly necessary for all clusters. The cluster serving the control group in A/B tests still runs on OpenSearch 2.17.
Shard routing
To minimize cross-shard overhead during k-NN queries, Delivery Hero implemented custom shard routing based on geographic market. Because each market (for example, Germany, Sweden, and Finland) has its own product catalog, routing queries to market-specific shards avoids unnecessary fan-out across the entire index.
This is an example of how to configure routing at index time and search time using the _routing field:
And at query time:
This ensures that a query for the German market only hits shards containing German products, reducing latency and compute overhead.
Refresh interval
Because the product embedding index is updated only once per day via the OSIS batch pipeline, there is no need for the default 1-second refresh interval. Delivery Hero configured the index with a longer refresh interval during ingestion and triggers a manual refresh + force merge after the nightly batch completes.
Impact on the business
The migration from self-managed Lucene on Kubernetes to Amazon OpenSearch Service achieved a ~50% reduction in p95 latency, dropping response times from a variable 200ms+ to a stable 100ms baseline. This transition significantly improved system consistency by eliminating the high variance and rhythmic latency spikes seen in the previous architecture.
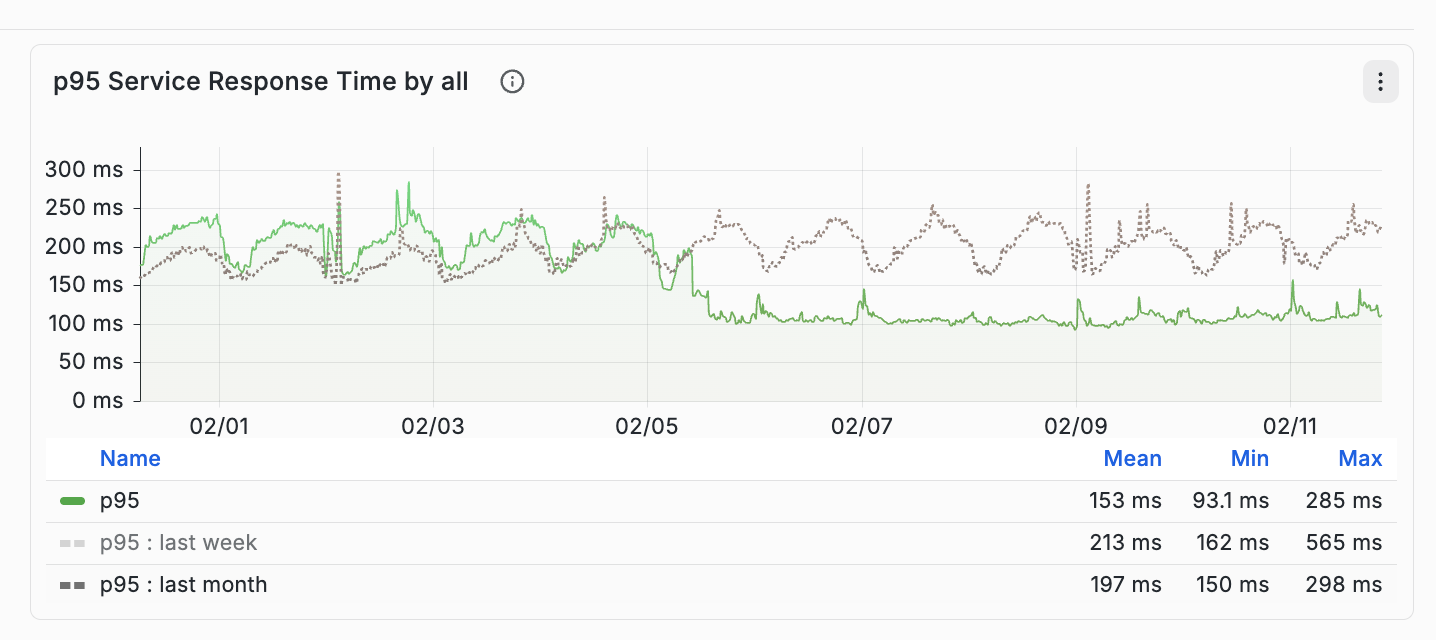
End service latency after rolling out semantic search with OpenSearch for foodpanda and yemeksepeti.
Beyond raw latency, the operational benefits were significant:
- Reduced infrastructure complexity: Eliminating the standalone Lucene service removed an entire deployment pipeline, monitoring stack, and on-call rotation.
- Faster experimentation: New embedding models can be tested by creating a new index and adjusting query routing, without requiring code deployments.
- Cost efficiency: Using OpenSearch’s managed infrastructure and the batch ingestion pattern (refresh once per day) reduced compute costs compared to running always-on Kubernetes pods with in-memory indices.
Conclusion
By combining radial search with lexical retrieval, Delivery Hero’s team built a system that adapts dynamically to query intent. It returns precise results for specific queries and broader candidate sets for general ones.
The migration to Amazon OpenSearch Service demonstrates how a managed search platform can simplify the operational complexity of vector search while improving performance.
To get started with vector search on Amazon OpenSearch Service, see the AI search documentation and the OpenSearch radial search guide.
About the authors
Computer Backup vs. Cloud Storage: Which Do You Need?
Post Syndicated from Kari Wilson original https://www.backblaze.com/blog/computer-backup-vs-cloud-storage-which-do-you-need/
Organizations rarely struggle with a lack of storage options. More often, they struggle with determining which solution best fits the way their data is created, accessed, and protected: backup versus cloud storage.
That’s especially true when evaluating backup and cloud storage solutions.
The terms are often used interchangeably, but backup and cloud storage are designed to solve different problems. Understanding those differences can help you build a more effective data protection strategy—whether you’re protecting a personal laptop, a growing media archive, employee endpoints, or critical business data.
At Backblaze, Computer Backup and B2 Cloud Storage serve distinct purposes. For some customers, one solution is the clear choice. For others, the strongest approach combines both.
Before comparing features, it’s helpful to start with a few foundational questions.
Three questions to ask before choosing a solution
When evaluating Computer Backup and B2 Cloud Storage, consider:
- Where does your data live today?
- Who—or what—needs access to it?
- What event are you trying to recover from?
The answers often reveal whether you’re primarily trying to protect a computer, store data in the cloud, or address both needs at the same time.
When the goal is protecting a computer
For many individuals and businesses, the most important data still lives on laptops, desktops, and attached external drives.
A photographer may keep active projects on a workstation. A consultant may store client files locally. A small business may rely on employee laptops as the primary location where work is created and managed.
In these situations, the primary concern isn’t cloud infrastructure. It’s protecting the device where the work happens.
That’s where Backblaze Computer Backup fits.
Computer Backup is designed to automatically protect data stored on a Mac or Windows computer, including connected external hard drives (but not NAS devices). Once installed, it runs continuously in the background, backing up files without requiring users to manually manage folders, storage allocations, or backup schedules. For organizations looking to protect NAS data, B2 Cloud Storage can serve as a backup destination through a variety of supported third-party backup and sync tools.
The value becomes clear when something goes wrong:
- A laptop is stolen.
- A hard drive fails.
- Files are accidentally deleted.
- A ransomware attack impacts local data.
- A computer needs to be restored after a hardware issue.
In each case, the goal is recovery.
Computer Backup is often a good fit when:
- Your most important data lives on a computer.
- You want automatic, continuous protection.
- You need to recover from device loss, hardware failure, or accidental deletion.
- You want a solution that requires minimal administration.
- Your primary concern is protecting endpoints.
For many professionals, families, and small businesses, those requirements align closely with their day-to-day reality.
When the goal is storing and managing data in the cloud
As organizations grow, data often becomes less tied to individual devices.
Files are shared across teams. Backup software protects servers and NAS devices. Applications generate and consume data continuously. Data needs to remain accessible and manageable independent of the original device, whether that’s for long-term retention, team access, application workflows, or infrastructure backups.
At that point, the challenge shifts from protecting a computer to managing data itself.
That’s where Backblaze B2 Cloud Storage comes in.
Unlike endpoint backup, cloud object storage is designed to store data independently of any single device. Data can be uploaded, accessed, managed, shared, and integrated into workflows across users, systems, and applications.
Organizations use B2 Cloud Storage for a wide range of use cases, including:
- Media archives
- NAS and server backups
- Ransomware protection
- Application storage
- AI and analytics datasets
- Business continuity and disaster recovery workflows
In these environments, accessibility, scalability, and integration often matter just as much as protection.
B2 Cloud Storage is often a good fit when:
- Data needs to exist independently of a specific computer.
- Multiple users or systems require access.
- You need API-based access and automation.
- You use third-party backup software that requires cloud object storage.
- You need centralized storage for growing datasets.
- You are building applications or data-driven workflows.
The focus isn’t on protecting a device. It’s on providing a durable, accessible home for data.
Understanding the data lifecycle
One reason organizations often use both backup and cloud storage is that data requirements change over time.
Consider a video production team.
While a project is actively being edited, the files may live on a workstation and several external drives. During that phase, protecting the editing environment is critical.
Once the project is complete, however, the priorities often change. The team may need to retain the content for future revisions, client requests, or compliance purposes. The files are no longer active, but they still need to remain available.
The same pattern appears across industries.
Architectural firms retain project files after construction is complete. Marketing teams archive campaign assets. Businesses preserve records for operational or regulatory reasons.
Not all data serves the same purpose throughout its lifecycle.
Active data often benefits from continuous endpoint protection, particularly when it lives on laptops, workstations, or attached drives. As that data ages, becomes shared across teams, or moves into long-term retention, cloud storage often becomes a more appropriate solution.
This is one reason many organizations use both Computer Backup and B2 Cloud Storage. The two solutions address different stages of the data lifecycle rather than competing for the same role.
When your storage requirements change
A common misconception is that organizations eventually “graduate” from backup to cloud storage. In reality, most environments become more complex over time, adding new requirements rather than replacing existing ones. As data volumes grow, teams collaborate across more systems, and retention needs increase, organizations often find themselves adding cloud storage to support those evolving demands. The shift isn’t typically about moving away from backup—it’s about addressing new use cases that emerge as data becomes more distributed, accessible, and valuable to the business. Common signs that additional cloud storage may make sense include:
Your data is no longer centered around one device
When multiple people need access to the same information, storing everything on a single workstation becomes limiting.
You’re building long-term archives
Completed projects, historical records, and large media libraries often benefit from dedicated cloud storage.
You’re adding automation and integrations
Applications, backup platforms, and workflows frequently require API-accessible storage.
You’re managing more than endpoints
As NAS devices, servers, and infrastructure become part of the environment, storage requirements often extend beyond individual computers.
In these scenarios, cloud storage isn’t replacing endpoint backup. It’s addressing new requirements.
The blind spot many cloud storage users discover
The reverse scenario is also common. An organization adopts cloud storage and establishes a centralized repository for important data, only to discover that important risks still exist at the endpoint level. An employee may accidentally delete a local project folder, lose a laptop, or experience a workstation failure before files have been synchronized elsewhere. Cloud storage protects the data stored in cloud storage, but it does not automatically protect every device where work is created. This is one reason endpoint backup remains an important part of many modern data protection strategies. The risks are different, and each solution is designed to address a different recovery scenario.
Why many organizations use both computer backup and cloud storage
One of the most persistent myths in data protection is that a single tool should solve every challenge. In practice, resilient environments are typically built in layers, with different solutions addressing different risks and recovery scenarios. Employee laptops may be protected with Computer Backup, while a NAS backs up to B2 Cloud Storage. Completed projects may be archived in the cloud while active work remains protected on local devices. Together, these layers create a more comprehensive approach to protecting data throughout its lifecycle.
Example: Creative teams
For creative teams, active projects often live on editing workstations and attached storage where they are constantly being updated. Computer Backup helps protect that work in progress, while completed projects can be moved to B2 Cloud Storage for long-term retention, future revisions, or client requests. This approach allows teams to safeguard current work without keeping every finished project on production systems.
Example: Growing businesses
As businesses grow, their data often becomes distributed across employee devices, shared storage, and business applications. Computer Backup can help protect employee endpoints where work is created, while B2 Cloud Storage provides a centralized location for shared assets, backups, and archives. Together, they support both day-to-day operations and longer-term data retention needs.
Example: IT and infrastructure teams
IT teams frequently manage a mix of endpoints, servers, NAS devices, and other business systems. In these environments, B2 Cloud Storage often serves as a destination for infrastructure backups, while Computer Backup protects employee devices that may not be covered by server or storage backup workflows. Rather than competing with one another, the two solutions often work together as part of a broader data protection strategy.
A quick comparison
| Question | Computer Backup | B2 Cloud Storage |
|---|---|---|
| Is the primary goal protecting a computer? | Yes | No |
| Is it designed to protect endpoint data automatically? | Yes | No |
| Is the data primarily tied to a specific device? | Yes | Not necessarily |
| Is it designed for shared access across users, systems, or applications? | No | Yes |
| Is API access a core feature? | No | Yes |
| Can it serve as a destination for third-party backup tools? | No | Yes |
| Is the primary goal storing and managing cloud-resident data? | No | Yes |
Choosing the right solution
The decision ultimately comes down to what you’re trying to protect and how your data is used.
If your primary concern is recovering files from a lost, stolen, damaged, or compromised computer, Computer Backup is likely the right starting point.
If you need scalable cloud storage for archives, applications, infrastructure backups, or shared datasets, B2 Cloud Storage is likely the better fit.
And if your environment includes both endpoints and cloud-resident data—as many organizations do—you may benefit from using both.
The most effective data protection strategies rarely rely on a single layer. They account for where data is created, where it lives, and how it needs to be recovered.
Understanding those requirements is often the first step toward choosing the right solution.
The post Computer Backup vs. Cloud Storage: Which Do You Need? appeared first on Backblaze Blog | Cloud Storage & Cloud Backup
Another npm worm
Post Syndicated from daroc original https://lwn.net/Articles/1087108/
StepSecurity is
reporting the emergence of a new worm affecting npm packages.
The design of the worm is nothing new, but the rapidity with which it is
exploiting captured npm
packager credentials is noteworthy.
TL;DR: A self-propagating worm, which we are calling ChainDrop, is spreading rapidly through the npm ecosystem. So far 435 packages and more than 1,550 compromised versions have been flagged, starting with [email protected]. If you are using any of the packages listed below, assume your environment is compromised. We are still investigating the full scope; check back on this post for updates.
Accelerate CloudFormation development with the IaC MCP Server
Post Syndicated from Shuto Yukawa original https://aws.amazon.com/blogs/devops/accelerate-cloudformation-development-with-the-iac-mcp-server/
Organizations adopt Infrastructure as Code (IaC) to manage cloud environments reliably, repeatably, and at scale. As teams grow and infrastructure complexity increases, IaC becomes the backbone of consistent deployments, compliance enforcement, and operational agility. The developer’s experience around IaC, however, remains fragmented — engineers routinely context-switch between documentation portals, linting tools, deployment consoles, and logging systems just to complete a single deploy cycle. This friction compounds across teams: slower iteration means delayed feature releases, longer incident recovery times, and increased operational risk. When a deployment fails, diagnosing the root cause across disconnected interfaces can take longer than writing the template itself — turning a feedback loop that could take hours of manual investigation into a more streamlined process.
The AWS Infrastructure as Code (IaC) MCP Server brings AWS CloudFormation documentation search, template validation, and deployment troubleshooting into your AI assistant, so you can move through a full AWS CloudFormation development cycle without leaving the chat interface. Developing AWS CloudFormation templates often means switching between documentation pages, linters, the deployment console, and AWS CloudTrail Logs. Each context switch adds friction to the inner development loop — the tight cycle of writing, validating, deploying, and fixing infrastructure code. This fragmented workflow increases time-to-deployment, delays feedback, and reduces developer productivity, particularly for teams managing complex, multi-resource stacks at scale.
The AWS Infrastructure as Code (IaC) Model Context Protocol (MCP) Server unifies these capabilities in one place. This post demonstrates how the IaC MCP Server tools work together in a real workflow — from authoring and validation through deployment and runtime troubleshooting — all within a single AI assistant conversation.
In this post, you can move through a complete CloudFormation development cycle using your AI assistant. You generate a template for an Amazon Simple Storage Service (Amazon S3) bucket, an AWS Lambda function, an AWS Identity and Access Management (IAM) execution role, and an Amazon CloudWatch Logs log group. You then validate, deploy, diagnose a deployment failure, and redeploy, all in a single interface.
Solution overview
The walkthrough follows four steps that map to IaC MCP Server tools:
- Author: Search CloudFormation documentation and generate a template
- Validate: Check syntax with cfn-lint and compliance with cfn-guard
- Deploy: Deploy the stack using a CloudFormation service role
- Troubleshoot: Diagnose a deployment failure using CloudTrail correlation
Figure 1 shows the four-step workflow. Steps 1, 2, and 4 run inside the IaC MCP Server, while Step 3 uses the AWS CLI directly.
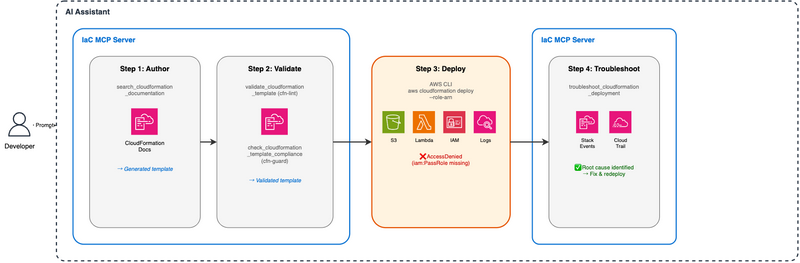
Figure 1. End-to-end CloudFormation workflow with the IaC MCP Server
In the prerequisites, you deploy a CloudFormation service role stack that deliberately omits the iam:PassRole permission. During the walkthrough, you use the AI assistant to generate and deploy an application stack. When CloudFormation tries to assign the Lambda execution role, the deployment fails with AccessDenied. The troubleshoot tool then correlates stack events with CloudTrail to pinpoint the root cause.
For an introduction to each IaC MCP Server tool, see Introducing the AWS Infrastructure as Code MCP Server.
Prerequisites
Before you start the walkthrough, set up your AWS account and AI assistant and deploy the service role stack that the walkthrough depends on.
To follow along, you need:
- An AWS account with permissions to create IAM roles and CloudFormation stacks
- Kiro or another MCP-compatible AI assistant with the IaC MCP Server configured
- AWS Command Line Interface (AWS CLI) configured with valid credentials (see Configuring the AWS CLI if you haven’t set this up yet)
This walkthrough uses the us-east-1 Region. You can use a different Region, but make sure to use the same Region consistently across each step.
Clone the companion repository and deploy the service role stack:
git clone https://github.com/aws-samples/sample-accelerate-cloudformation-with-iac-mcp-server.git

cd sample-accelerate-cloudformation-with-iac-mcp-server

aws cloudformation deploy \
  --template-file iac-mcp-blog-role-stack.yaml \
  --stack-name iac-mcp-blog-role-stack \
  --capabilities CAPABILITY_NAMED_IAM
This role grants CloudFormation permission to create S3 buckets, Lambda functions, and CloudWatch Logs log groups, but deliberately omits iam:PassRole — you’ll diagnose this gap in Step 4.
You use the --capabilities CAPABILITY_NAMED_IAM flag to acknowledge that the stack creates IAM resources with custom names.
We provide this role template for demonstration purposes only and do not intend it for production use.
Note the role ARN from the stack outputs. You must use this ARN in Step 3:
aws cloudformation describe-stacks \
  --stack-name iac-mcp-blog-role-stack \
  --query "Stacks[0].Outputs[?OutputKey=='ServiceRoleArn'].OutputValue" \
  --output text
Walkthrough
The four steps that follow map to IaC MCP Server tools: authoring with documentation search, validating with cfn-lint and cfn-guard, deploying with a CloudFormation service role, and troubleshooting with CloudTrail correlation.
Step 1: Generate a CloudFormation template
Start by asking your AI assistant to search CloudFormation documentation and generate a template. The IaC MCP Server calls the search_cloudformation_documentation tool behind the scenes to retrieve up-to-date resource property references.
Prompt:
Create a CloudFormation template with an S3 bucket, a Lambda function (Python 3.13 runtime, inline hello-world code), an IAM execution role for the function, and a CloudWatch Logs log group. Include common security configurations. Save it as iac-mcp-blog-app-stack.yaml in the current directory.
The AI assistant calls the search_cloudformation_documentation tool to look up resource properties for AWS::S3::Bucket, AWS::Lambda::Function, AWS::IAM::Role, and AWS::Logs::LogGroup. You can see the tool invocations in Kiro’s chat interface. The search results include up-to-date property references and example configurations, which the AI assistant uses to generate a template.
The generated template should include resources similar to the following (your output may vary):
- An S3 bucket with versioning, encryption, and public access block
- A Lambda function with inline Python code
- An IAM role with a least-privilege policy for CloudWatch Logs
- A log group with a retention policy
The following snippet shows the key resources. Your AI assistant’s output may differ in naming or structure, but the core configuration should be similar:
Resources:
  S3Bucket:
    Type: AWS::S3::Bucket
    Properties:
      BucketEncryption:
        ServerSideEncryptionConfiguration:
          - ServerSideEncryptionByDefault:
              SSEAlgorithm: AES256
      PublicAccessBlockConfiguration:
        BlockPublicAcls: true
        BlockPublicPolicy: true
        IgnorePublicAcls: true
        RestrictPublicBuckets: true
      VersioningConfiguration:
        Status: Enabled

  LambdaFunction:
    Type: AWS::Lambda::Function
    Properties:
      Runtime: python3.13
      Handler: index.handler
      Role: !GetAtt LambdaExecutionRole.Arn
      Code:
        ZipFile: |
          def handler(event, context):
              return {"statusCode": 200, "body": "Hello from Lambda!"}
Step 2: Validate the template
Before deploying, ask the AI assistant to validate the template. The IaC MCP Server provides two validation tools that wrap open source checkers: cfn-lint for syntax validation and cfn-guard for policy-as-code compliance checks.
Prompt:
Validate iac-mcp-blog-app-stack.yaml for syntax errors and compliance violations.
The AI assistant runs two checks:
- Syntax validation (
validate_cloudformation_template): Uses cfn-lint to catch structural errors, invalid property names, and schema violations. - Compliance check (
check_cloudformation_template_compliance): Uses cfn-guard to evaluate the template against security rules such as S3 bucket encryption, public access block settings, and log group retention.
If either check reports issues, ask the AI assistant to fix them. Continue iterating until both checks pass.
Note that the compliance check might flag violations related to S3 object lock, access logging, replication, and inline IAM policies. For a production workload, you would address each of these issues. In this walkthrough, the AI assistant resolves them to demonstrate the iterative validate-and-fix workflow. Your results might vary depending on the template the AI assistant generated in Step 1.
After the AI assistant resolves the violations, the S3 bucket resource gains access logging and object lock properties. The following snippet shows the typical shape of these additions (see iac-mcp-blog-app-stack-fixed.yaml in the companion repository for the complete hardened template):
  S3Bucket:
    Type: AWS::S3::Bucket
    Properties:
      # ... existing properties ...
      LoggingConfiguration:
        DestinationBucketName: !Ref S3LoggingBucket
        LogFilePrefix: access-logs/
      ObjectLockEnabled: true
      ObjectLockConfiguration:
        ObjectLockEnabled: Enabled
        Rule:
          DefaultRetention:
            Mode: GOVERNANCE
            Days: 30
Your template now passes both cfn-lint and cfn-guard checks. These security improvements improve your template’s security posture but are unrelated to the deployment failure you’ll encounter next. The failure in Step 3 is caused by missing permission on the service role, not by anything in the template itself.
Step 3: Deploy the stack
With validation complete, deploy the template. This deployment will fail — not because of a template error, but because the CloudFormation service role deployed in the prerequisites is missing iam:PassRole. This is the scenario you’ll diagnose in Step 4.
Now deploy the validated template using the service role you created in the prerequisites:
Prompt:
Deploy iac-mcp-blog-app-stack.yaml as a stack named “iac-mcp-blog-app-stack” in us-east-1 using the service role ARN from iac-mcp-blog-role-stack.
The AI assistant runs the AWS CLI deployment command for you. If your AI assistant doesn’t support running shell commands directly, you can deploy manually with the AWS CLI:
Manual CLI deployment
ROLE_ARN=$(aws cloudformation describe-stacks \
  --stack-name iac-mcp-blog-role-stack \
  --query "Stacks[0].Outputs[?OutputKey=='ServiceRoleArn'].OutputValue" \
  --output text)

aws cloudformation deploy \
  --template-file iac-mcp-blog-app-stack.yaml \
  --stack-name iac-mcp-blog-app-stack \
  --role-arn $ROLE_ARN \
  --capabilities CAPABILITY_NAMED_IAM
The deployment fails. The stack event shows an AccessDenied error on the IAM role resource, but doesn’t identify which permission on the CloudFormation service role is missing or why. At this point, we move from static analysis to runtime troubleshooting.
Step 4: Troubleshoot the failure
Ask the AI assistant to diagnose the failure:
 Note: CloudTrail events typically take 5–15 minutes to appear. Wait at least 5 minutes after the deployment failure before running the troubleshoot tool for the most complete analysis.
Prompt:
Troubleshoot the failed deployment of iac-mcp-blog-app-stack in us-east-1.
The AI assistant calls troubleshoot_cloudformation_deployment, which:
- Retrieves the stack events and identifies the failed resources
- Correlates the failure timestamps with CloudTrail API calls
- Identifies
AccessDeniederrors and the missing permissions that caused them
The troubleshoot tool identifies that the CloudFormation service role is missing iam:PassRole — the permission required to assign the Lambda execution role to the function. If your template includes the cfn-guard hardening from Step 2 (access logging, object lock), the tool may also surface additional missing S3 permissions such as s3:PutBucketObjectLockConfiguration for the logging bucket.
Prompt:
Fix iac-mcp-blog-role-stack.yaml to add the missing permissions identified by the troubleshoot tool. Save it as iac-mcp-blog-role-stack-fixed.yaml.
The AI assistant adds the missing permissions to the service role template. Now ask the AI assistant to deploy the fix, delete the failed stack, and redeploy:
Prompt:
Deploy iac-mcp-blog-role-stack-fixed.yaml to update iac-mcp-blog-role-stack, then delete the failed iac-mcp-blog-app-stack and redeploy it with the same service role.
The AI assistant runs the necessary CLI commands: updating the role stack, deleting the failed application stack, and redeploying the application stack. The failed stack is in ROLLBACK_COMPLETE state, a terminal state that CloudFormation cannot update in place, so you must delete it before redeploying.
The stack deployment succeeded.
Cost considerations
For information about costs associated with the resources in this walkthrough, including S3 storage, Lambda invocations, CloudWatch Logs, and CloudFormation operations, see AWS Pricing. Confirm that your account usage falls within any applicable free tier limits. If you enabled S3 access logging or object lock through the validation-and-fix workflow in Step 2, the logging bucket stores a small amount of access log data that falls under S3 standard pricing. See AWS Pricing for current rates and confirm that your account is within the Free Tier limits before you deploy.
Cleaning up
To avoid ongoing charges, delete both stacks.
Option A: Clean up with your AI assistant
Ask your AI assistant to run the cleanup for you. The IaC MCP Server lets the AI assistant inspect stack outputs, empty buckets, and delete both stacks in the correct order:
Clean up the
iac-mcp-blog-app-stackandiac-mcp-blog-role-stackstacks inus-east-1. Empty any S3 buckets they created (including access log buckets) before deleting the application stack, then delete the role stack.
Option B: Clean up manually
Delete the application stack first because it was deployed with the service role:
Warning: If your template included access logging, the logging bucket may contain objects. CloudFormation cannot delete a non-empty bucket. Empty it first:
aws s3 rm s3://<logging-bucket-name> --recursiveThen proceed with stack deletion.
aws cloudformation delete-stack --stack-name iac-mcp-blog-app-stack
aws cloudformation wait stack-delete-complete --stack-name iac-mcp-blog-app-stack

aws cloudformation delete-stack --stack-name iac-mcp-blog-role-stack
aws cloudformation wait stack-delete-complete --stack-name iac-mcp-blog-role-stack
If any S3 bucket was created with DeletionPolicy: Retain or still contains objects (for example, server access logs), CloudFormation leaves it in place. Empty and delete those buckets from the S3 console or with aws s3 rb s3://<bucket-name> --force.
Next steps
If you manage CloudFormation infrastructure and find yourself losing time to context-switching between docs, linters, consoles, and logs, here’s how to streamline your workflow starting today:
- Set up the IaC MCP Server — Install and configure the IaC MCP Server with an MCP-compatible AI assistant such as Kiro to bring documentation search, validation, and troubleshooting into a single conversational interface.
- Run the walkthrough end-to-end — Clone the companion repository and follow this post step by step to experience the full author-validate-deploy-troubleshoot loop in your own AWS account.
- Integrate into your team’s workflow — Replace manual context-switching by embedding the IaC MCP Server’s tools into your day-to-day CloudFormation development process, reducing iteration time from hours to minutes.
- Extend to AWS CDK — Apply the same conversational workflow to CDK-based infrastructure using the IaC MCP Server’s CDK capabilities described in the introductory blog post.
- Contribute and share feedback — Report issues or suggest enhancements on the AWS MCP GitHub repository to help shape future capabilities.
Conclusion
In this walkthrough, you used the IaC MCP Server to move through a complete CloudFormation development cycle without leaving your AI assistant. The documentation search tool retrieved up-to-date resource property references that the AI assistant used to generate a template. The validation tools caught syntax errors and compliance gaps before deployment. When the deployment failed due to missing permissions on the service role (an issue that static analysis cannot detect), you used the troubleshoot tool to correlate stack events with CloudTrail and pinpoint the root cause in seconds.
By combining static validation with runtime diagnostics, you shorten your develop-validate-fix cycle for CloudFormation. Instead of switching between browser tabs, CLI sessions, and the CloudTrail console, you stay in one interface — turning a multi-step troubleshooting session that previously meant switching between consoles, CLI sessions, and CloudTrail into a few prompts in a single conversation.
To get started, explore the companion GitHub repository for the complete sample code. Learn more about the IaC MCP Server in the introductory blog post and the AWS CloudFormation documentation. To set up Kiro, visit kiro.dev.
About the authors
Shuto Yukawa is an Associate Delivery Consultant at AWS Professional Services. He helps customers modernize their applications and adopt cloud-native practices on AWS.
G SS Harsha Vardhan is an Associate Delivery Consultant at AWS Professional Services. He guides customers to migrate and transform their workloads to AWS, driving modernization across people, process, and technology.
Why Claire Stapleton Led a Protest at Google
Post Syndicated from The Atlantic original https://www.youtube.com/shorts/By35yURC_xA
Police Surveillance Technology #lastweektonight
Post Syndicated from LastWeekTonight original https://www.youtube.com/shorts/1s0FmbLvhvQ
[$] The beginning of a process-builder API
Post Syndicated from corbet original https://lwn.net/Articles/1086330/
The recent discussion on “spawn templates”
raised questions about whether it was time to provide an alternative to the
classic Unix fork()/exec() pattern for process creation.
One idea that was raised there was to shift the template pattern into an
interface that could be used to efficiently assemble new processes from
bare cloth, without duplicating the parent process. Preferably, that
interface would be able to implement posix_spawn().
Li Chen, the author of the spawn-template work, has now responded with a patch series
(written with significant LLM assistance) showing what a process-builder
API for Linux might look like.
Security updates for Tuesday
Post Syndicated from jzb original https://lwn.net/Articles/1087068/
Security updates have been issued by AlmaLinux (frr, ldns, mingw-glib2, and perl-Archive-Tar), Debian (ruby2.7), Fedora (borgbackup, nebula, python-nh3, rust-ammonia, and seamonkey), Mageia (librabbitmq, libvncserver, packages, perl, perl-GD, perl-Unicode-LineBreak, squid, and unbound), Oracle (compat-libtiff3, frr, gstreamer1-plugins-good, javapackages-tools:201801, libreswan, nodejs:22, nodejs:24, p11-kit, perl-Archive-Tar, perl-DBI, php, pki-deps:10.6, and python-tornado), and SUSE (aws-iam-authenticator, bind, containerd, gawk, google-cloud-sap-agent, ignition, ImageMagick, java-11-openjdk, libpng16, libssh, mcphost, nginx, openssh, openssl-1_1, perl-DBI, perl-HTTP-Date, perl-Net-DNS, python-urwid, python3-dulwich, python312, python313, python3, python313-pydantic, python313-sentry-sdk, rrdtool, s390-tools, samba, spice-vdagent, vim, and xen).
The Agent Development Lifecycle has arrived on Cloudflare
Post Syndicated from Brendan Irvine-Broque original https://blog.cloudflare.com/agent-development-lifecycle/
Engineering managers spent the past few decades figuring out ways for many programmers to work together on a shared codebase. This work dates all the way back to the “Systems Development Lifecycle” (RAND, 1975) – today commonly referred to as the “Software Development Lifecycle” (SDLC), which defines the following phases:
- Plan
- Design
- Implement
- Test
- Deploy
- Maintain
- Retire
AI has made the step that was previously the slowest and most expensive — implementation — the fastest and cheapest. That, in turn, has had an impact downstream: overwhelming the people responsible for all the other steps in the SDLC. This ranges from open-source maintainers bombarded with thousands of pull requests and issues, to production engineers trying to save production from falling over as the rate of software delivery increases orders of magnitude.
We are all trying to save our systems, our customers, and ourselves from slop.
The answer — paradoxically — is to empower agents to do more. It’s only fair! You’d never let an engineer on your team write code, expect someone else to validate it, merge it, deploy it, hold the pager in production, and triage incoming bugs. But that’s what most companies are doing right now with agents. Models have improved remarkably, and agents are running over longer time horizons, able to take on much larger tasks. But they are not yet used evenly across the SDLC.
Cloudflare treats agents as our customers. They can buy domains, create temporary accounts and use the entire Cloudflare API. We know that agents need APIs and tools to be able to manage the full SDLC on behalf of our customers — not just the start of it.
And so today we’re introducing the start of a new set of tools that let agents step beyond just generating code and take on more of the SDLC. We’re sharing what we’ve built and learned trying to solve this for ourselves:
- @cloudflare/ci — a new way to run CI/CD across millions of repos, that can self-heal and spawn agents to do much more complex tasks, build on Cloudflare Workflows.
- OpenTelemetry traces in local dev — giving agents the same observability they have in production, built into Wrangler and the Cloudflare Vite plugin.
- Introducing: Cloudflare Agents and Agent Traces — a new home for observing, maintaining and improving agents, centered around OpenTelemetry traces from agents.
- How Cloudflare enforces engineering standards using AI — our own experience enforcing best practices across all of our products’ and systems’ repositories and specs.
- How we built a software factory to drive Astro’s GitHub issue count to zero — our own experience building systems to automatically triage, reproduce, verify and fix issues for a large and growing open source project.
There’s something bigger here though. When we look at the SDLC, even with the best automation, its assumptions do not scale for the volume of code agents can write and the pace at which software teams must move to compete. We think it’s time to replace the SDLC with the ADLC — the Agent Development Lifecycle.
The SDLC is for software teams. The ADLC is for software factories.
Right now, everyone is talking about building “software factories” — agent-driven systems that take input and autonomously build, improve, deploy and manage software. Take an input, whether it’s a production error, a bug report from a customer, or an idea for a new feature, and delegate it entirely to an agent.
Even with agents, most software projects are constrained by human-in-the-loop steps. Humans prompting agents, telling them to keep going, instructing agents to apply feedback from a code review, constantly babysitting many agents and giving them instruction. On most software teams, the human still manages each step in the SDLC model — the only change is that they delegate tasks within each step to an agent.
And so the dream behind software factories is: what if you reimagined this approach and built a factory for the entire process of building software? How can we shift more human time towards the things that truly require human inspiration, taste, and judgement? It would leave us more time to design, to talk to customers, and to dream bigger.
A software factory has to manage the same steps in the SDLC, but it demands much more from the platform it is built on. Because when you hand over the keys and let the agent drive, every manual step that previously relied on a human must be adapted to be:
- Programmatic — ”ClickOps” was bad practice for humans, but it’s a non-starter for agents. Every last operation needs APIs that agents can call, debug, and rely on.
- Horizontally scalable — preview deployments were a nice-to-have when humans stared at the screen while building or manually took over a staging server to catch issues before production. For agents to drive, every agent must have its own preview that matches production.
- Reproducible — what happens if there’s a bug that you can only reproduce when simulating 4G on an iPhone 15? Or from an IP in a certain country? Typical unit testing and integration testing tools aren’t going to help here.
- Real-time, push based — relying on humans to look at the right dashboard has always been a bad way to know if things are working, but it completely breaks down with agents. You need an event that triggers an agent to do work.
- Atomic — every change needs to be independently testable, releasable, observable, and reversible without affecting unrelated behavior.
- Permissioned — you know you probably shouldn’t, but today you give a few trusted engineers the keys to SSH into prod in case things really go haywire. There’s no way you let an agent do that — but without the ability to escalate and get more permissions, how can it do its job?
- Self-improving — people learn from experience. The first week ship or the first on-call rotation, humans are slow and need to shadow someone else, but then get better and faster. Agents, too, need ways to learn from experience.
We need something new if we are going to make software factories safe to use for real production software. Software factories face the same challenge that other autonomous systems like self-driving cars do — the challenge of going from working successfully 80% of the time, to some number of nines past 99%.
To give agents the keys to drive the SDLC, you can’t give them a car designed for humans
An autonomous vehicle is loaded with sensors and technology that a regular car doesn’t have. Lidar sensors, cameras, powerful compute to run inference, and connectivity to a central command system that can take over remotely if needed.
For an autonomous vehicle to be 80% as good as a human at driving, we probably don’t need all of this. Self-driving got to around 80% as good as humans 10 years ago. But that’s not the bar to clear — the bar is to be much better and safer than a human driver. That’s what we expect when we hand over the keys to a machine, in order to feel safe taking a nap driving down the 101 at 60 mph. And that’s why autonomous vehicles have technology that is purpose-built for self-driving — it’s what builds trust and handles the edge cases that cannot be designed for upfront.
The same is true of self-driving software. Ask yourself — why haven’t you yet just let your agent auto-approve and merge its own PRs to your production services? The higher the stakes of what you build, the longer your list of reasons almost surely is.
When you start to unpack not only all the things that can go catastrophically wrong in this process, but also that are necessary to building the right thing for customers, it is remarkably complex. It doesn’t fit into a linear set of steps in a GitHub Actions YAML file, and it goes way beyond running traditional automated tests. Even a small change to a dashboard can span roles, specializations and org structures, and subjective changes are the hardest to test and to delegate. Most of these things are probably not part of your CI/CD pipeline at all today. But they will need to be, if you want them to still happen, while giving full control to the agents running the software factory.
To let agents drive the whole process, we need a better way to orchestrate these dynamic series of steps. We think that is a Workflow, with the capability to spawn containers, agents and browsers. A Workflow that can set feature flags and enable them for a test user, investigate logs and traces, observe production metrics as a change gradually rolls out, and do everything else that is needed in order to ship safely.
A CI/CD pipeline is just a Workflow. But a Workflow can be so much more than a CI/CD pipeline.
Cloudflare Workflows let you chain together multiple steps, automatically retry failed tasks, and persist state for minutes, hours, or even weeks. They are designed to encode complex and dynamic business processes in a logical and well-understood program. This blog post breaks down why Workflows, in tandem with Artifacts, make defining and triggering CI/CD pipelines fundamentally simpler. For example:
Workflows go beyond a series of linear steps though. They can be defined dynamically, and they can spawn agents or other Workflows. This example shows a Workflow that reviews new data from the past day. The Workflow has full control over when and how the agent is prompted, and can pass along context between steps:
Once you see this pattern, and are “Workflow-pilled” as Cloudflare is, you start to ask: what else could I have a Workflow handle for me? What other human-bottlenecked steps could I delegate to this combination of Workflow + Flue agents?
The full ADLC, on the Cloudflare stack
With Workflows able to orchestrate complex steps, and Artifacts as the storage layer for code, when you look at the SDLC stages, everything an agent needs to own the whole process of building, shipping, and maintaining software is on Cloudflare:
Primitives to build your software factory
Right now, the people on the bleeding edge are building the software factories of the future. Eventually software factories will become, just like agents and AI, the normal way people build software. But for most people and most organizations, we’re not there yet.
We want to change that.
In order to do so, the questions we’ve asked ourselves are: how can we make things simple and accessible so that everyone on the Internet can benefit from a paradigm shift like this? And what are the base layer primitives that we can open up to everyone, from the smallest startup to the largest platforms in the world?
In this case, we think the primitives are here. There’s more to do to connect them, to keep building our own software factory and learn from it, but right now, today, we’re ready for you to build your machine that builds the machine, on Cloudflare. Get started with @cloudflare/ci, build an agent, and see how much of the SDLC you can make autonomous.
Run CI/CD for millions of repos — on your platform, on Cloudflare
Post Syndicated from André Venceslau original https://blog.cloudflare.com/ci-workflows/
We are moving toward a world in which you can store, build, test, and deploy your code fully on Cloudflare. We built the first piece with Artifacts, versioned code storage that scales to millions of repos.
We have stitched the store, build, and deploy steps together with the CI SDK, built on Cloudflare Workflows, so that you can run your continuous integration (CI) pipeline on Cloudflare. You can send artifact push events directly to your Workflow, triggering an instance of its execution — a CI job, essentially — through a new events field in your wrangler configuration file.
Then, directly from the Workflow with @cloudflare/ci installed, you can:
- Automate builds: compile code from your Artifacts repo in a safe, isolated environment
- Run linters and typechecks: enforce code style, catch type errors, and flag any potential issues
- Cache dependencies: run your
installonce and cache dependencies across steps in the CI job - Execute unit tests: verify that each piece of your code works as expected
- Self-heal: integrate an AI review agent to catch broken steps in your build and push commits to fix
- Deploy conditionally: automatically deploy your code, only if your build step is successful
Today, everyone is building a platform, whether it’s an internal vibe coding platform or an extension of your customer-facing product via customization through code. Platforms are now using millions of repos on Artifacts to store their code, and their customers’ code, and version control across the two. But every team has their own needs for a continuous integration and deployment pipeline. For platforms, they might want to define a CI job for their own code differently from that of their customers.
Many of the end customers building on these platforms don’t want the extra headache of managing their continuous integration and continuous deployment (CI/CD) pipeline. Instead, the platform can manage the build process on their customers’ behalf: write the CI/CD pipeline once and share it across all the applications that their customers are building. Some of the platform’s customers might want to define their own CI; if so, they can write their own Workflow and run custom CI jobs on just their repo, facilitated by dynamic workflows. The beauty is, you don’t have to pick and choose: both platform-managed and custom CI can run at the same time, in the same namespace.
A CI/CD pipeline is just a Workflow
Before today, we had all the pieces to allow platforms to wire their CI/CD pipeline together on Cloudflare. Now, we’re bringing a better developer experience to make it simple.
A CI/CD pipeline — commonly orchestrated with GitHub Actions — is a series of steps that run in a specific order where, if any step fails, you stop running the pipeline and report the error. In essence, a CI/CD pipeline is just a Workflow. CI/CD, when defined by a YAML file, can get complicated quickly, given the constraints that so often lead to YAML fatigue. But each step in a CI/CD pipeline can translate simply to a Workflow step.do(). Instead of YAML, you can define your CI/CD pipeline in Typescript for greater customization and configurability.
We are launching new tools in the CI SDK that allow you to run each step in your CI pipeline (e.g. build, lint, and typecheck) in a safe, isolated environment, built directly on Cloudflare’s developer platform via Workflows and the Sandbox SDK. Plus, you can now kick off a CI job directly on push instead of configuring an event subscription, a queue, and a queue consumer.
Previously, you’d have to call the Sandbox API directly and manage state yourself across different steps in the CI pipeline. The SDK allows you to run each sandboxed command in its own Workflow step, providing the retries and timeouts built into Cloudflare Workflows.
You can also speed up your CI pipeline by caching step results — for example, your install step — so that you don’t need to reinstall for all subsequent operations. Dependency caching reduces the latency of your CI/CD pipeline since every CI step won’t need to rerun the install.
To define your CI job, all you need to do is:
- Define your
installstep for any dependencies (external packages or tools that your CI job needs), such as bundlers (e.g. esbuild), linters (e.g. eslint), or test runners (e.g. vitest). - Specify the command for each step in the CI job (e.g.
bun run build,bun run test,bun run lint). With your dependencies cached, each CI step can execute in parallel, reducing the latency of the overall run. - Pass
wranglerdeployin adeploystep. Your Worker will automatically deploy when the CI pipeline passes.
Writing your own CI pipeline in a Workflow allows you to customize as much as you want. For example, you could call an agent from your CI Workflow to give your CI jobs self-healing functionality: if a step in your build errors, the agent can fix it automatically, and push a commit for your approval.
Try an example of self-healing CI Workflows with Project Think: https://github.com/cloudflare/ci/blob/main/examples/self-healing
Write your own CI Workflow
To write your own CI Workflow, get started with import { CIWorkflow } from@cloudflare/ci.
Start with an install step:
- Download your dependencies, including any external tools or libraries that your CI steps will need (e.g.
vite,react). - Specify your lockfile, which tracks whether your dependencies have changed.
- Cache your dependencies via a sandbox snapshot so that all subsequent steps have access. The snapshot will be stored in an R2 bucket on your account.
Then define steps for the build and checks, each executed in its own safe, isolated sandbox environment.
By default, each step in a Workflow starts independently, meaning the steps will execute concurrently unless otherwise specified. Running each step in parallel reduces the latency of your CI run. To ensure that all checks complete before the CI pipeline continues (for example, finish build, lint, test, and typecheck before the deploy step starts), wrap in a Promise.all():
Now, to actually trigger your CI Workflow, add an events field to your Worker’s wrangler configuration, alongside your Workflow and Artifact bindings. The events field is a new field supported within your triggers field.
You could already subscribe to Artifacts through Cloudflare Queues via event subscriptions and kick off a build pipeline every time there’s a push event. But that requires setting up the event subscription, Queue, consumer, and queue handler. Now, you can target a Workflow with that event — every time that event fires, it will trigger an instance of the Workflow.
Specify the CI Workflow as your artifact push trigger’s target to automatically trigger a Workflow instance on every cf.artifacts.repo.pushed event. Each CI run surfaces as a Workflow instance so you can view its step-by-step execution and observability directly in the Workflows dashboard. This is an Artifacts-first integration; coming soon, the types will support events from sources across your Cloudflare account to allow for programmatic consumption across the product suite.
If you want to run the CI Workflow on every repo in your namespace — for example, if you are a platform running CI on all of your customers’ repositories — omit repoName and only specify the namespace in filter.
To fully configure your CI Workflow, add bindings to each piece of the infrastructure which powers the pipeline: artifacts, workflows, containers and durable_objects (+ exports config) bindings (to access your sandboxes), plus an r2 binding if you are using cache. The R2 binding is required as the snapshot of your install step sandbox is stored in a bucket.
Self-healing CI runs
To allow your CI job to self-heal, you’ll need two pieces: the LLM and its agent harness. In the example above, we included a Think agent using Workers AI to catch errors in your pipeline and run the fixes on your behalf. Your CI job can be run and re-run remotely — no need to watch with your laptop open or check back every few minutes. Instead, Cloudflare handles it in the cloud, running your healer agent alongside the CI steps in a container. Instead of babysitting the CI job, making a manual fix, and re-running the pipeline, you’ll just need to merge the commit after your agent has made the fix.
To set up an agent that self-heals your CI pipeline, add a Durable Object binding for your Think agent:
Create your Think agent — Healer — by extending the HealingAgent class, which includes a heal method for you to call on failure. Pass whichever model you’d like to use:
Then, wrap your steps in a try/catch block where a failure triggers the healing agent:
This example demonstrates a self-healing CI pipeline, but really, the Bring Your Own Workflow model allows you to customize the CI job however you want. This can be a place to add security rules, filters, or conditional CI steps. Using the BYO-W model, platforms can configure their CI/CD pipelines across different teams, customers, or applications according to each individual use case.
The benefits of using a Workflow
By running your CI pipeline on a Cloudflare Workflow, you automatically inherit:
- Resilient retries (durable execution): if any step in your CI job fails, it will automatically retry with state persisted, meaning that no progress is lost. Every step supports custom retry and timeout behavior, so you can define different failure logic for each one. Plus, you can restart from a specific step, so if just lint fails, for example, you don’t have to rerun the entire CI pipeline.
- Workflows observability: inspect your CI job step-by-step in the Workflows dashboard, where each instance surfaces the steps with their inputs, outputs, and wall and CPU time. You can visualize your CI job through Workflows diagrams in the dashboard, allowing you to easily see which steps run concurrently versus sequentially. You can also inspect Workflows logs through Workers Observability and GraphQL to understand more about runs of your CI job.
- The power of code: by running CI in a Workflow, you can write a step for anything you want. For example, you might want to run an AI code reviewer as part of your CI/CD pipeline. You can make a call to your code review agent — or handle any custom logic you can put into code — with Workflows step.do(). Other examples might include writing build artifacts to R2 and sending an email when CI fails, completes, or merges to main.
What’s next
A CI/CD pipeline is just a Workflow — and with the CI SDK, you can define your CI across your code, and that of your customers, in simple Typescript rather than inflexible YAML. Building off the Cloudflare Workflows primitives, you can define whatever logic you’d like, whether that’s a healing agent, like our Think example, or writing build artifacts to R2. Running CI on Workflows helps bridge the gap between storage (via Artifacts), builds, and deployments. As a platform, this allows you to easily manage each step on your own code and on behalf of your customers.
Request to join the Artifacts private beta and get started with our Workflows CI guide. If you have any feature requests or notice any bugs, share your feedback directly with the Cloudflare team by joining the Cloudflare Developers community on Discord.
What’s coming next:
- Direct integrations for Workers & Workers for Platforms: build.preview() and build.deploy() primitives to automatically deploy on push to main and create previews on push to non-default branches
- Gradual deployments: manage percentage-based rollouts via Workflows to customize your deployment progression and rollback logic
- Monorepos: simplified management for multi-Worker deployments using one CI pipeline
- Triggers: send push events from different sources to run CI jobs on a repo from any version control system, not just Artifacts