Honeypots are great security tools – you install a “decoy”, which attracts malicious traffic. They have certain ports open and they work with certain protocols, mimicking regular interactions, e.g. SSH, RDP, Telnet, HTTP. Usually, at least in introductory materials, honeypots are assumed to be externally-facing (e.g. installed in the DMZ). This means attackers can see it in the open internet and you can collect valuable information.
However, there can be a different mode for honeypots – internally-facing. In normal circumstances, they’d be completely silent. Only in case of a real intruder (doing lateral movement) or during security audits and pentests they will collect data (otherwise nobody has any business poking in that IP address).
It makes sense to have both types of honeypots. Here are the positive sides of an externally facing honeypot:
Constantly collects threat information (IPs, attempted passwords, attempted protocols) and apply this knowledge in other tools (e.g. insert IPs in SIEM/Firewall)
Distinguish automated probes from human intrusion attempts
Visualize trends in malicious activity
And the benefits of internally-facing honeypot:
Get alerted in case of lateral movement. Almost every hit on the internal honeypot needs to be investigated immediately
No risk for allowing intruders in through 0days in the honeypot software stack
Not consuming much resources (the external honeypot has to services potentially many requests; the internal one is serving 0 if everything is fine)
The ublk subsystem enables the creation of
user-space block drivers that communicate with the kernel using io_uring. Drivers implemented this way show
some promise with regard to performance, but there is a bottleneck in the
way: copying data between the kernel and the user-space driver’s address
space. It is thus not surprising that there is interest in implementing
zero-copy I/O for ublk. The mailing lists have recently seen three
different proposals for how this could be done.
In this blog post, we wanted to highlight some ways that Cloudflare and IBM Cloud work together to help drive product innovation and deliver services that address the needs of our mutual customers. On our blog, we often discuss exciting new product developments and how we are solving real-world problems in our effort to make the internet better and many of our customers and partners play an important role.
IBM Cloud and Cloudflare have been working together since 2018 to integrate Cloudflare application security and performance products natively into IBM Cloud. IBM Cloud Internet Services (CIS) has customers across a wide range of industry verticals and geographic regions but they also have several specialist groups building unique service offerings.
The IBM Cloud team specializes in serving clients in highly regulated industries, aiming to ensure their resiliency, performance, security and compliance needs are met. One group that we’ve been working with recently is IBM Cloud for Financial Services. This group extends the capabilities of IBM Cloud to help serve the complex security and compliance needs of banks, financial institutions and fintech companies.
Bot Management
As malicious bot attacks get more sophisticated and manual mitigations become more onerous, a dynamic and adaptive solution is required for enterprises running Internet facing workloads. With Cloudflare Bot Management on IBM Cloud Internet Services, we aim to help IBM clients protect their Internet properties from targeted application abuse such as account takeover attacks, inventory hoarding, carding abuse and more. Bot Management will be available in the second quarter of 2023.
Threat actors specifically target financial services entities with Account Takeover Attacks, and this is where Cloudflare can help. As much as 71% of login requests we see come from bots (Source: Cloudflare Data) Cloudflare’s Bot Management is powered by a global machine learning model that analyses an average of 45 million HTTP requests a second to track botnets across our network. Cloudflare’s Bot Management solution has the potential to benefit all IBM CIS customers.
Supporting banks, financial institutions, and fintechs
IBM Cloud has been a leader when it comes to providing solutions for the financial services industry and has developed several key management solutions that are designed so clients only need to store their private keys in custom built devices.
The IBM CIS team wants to incorporate the right mix of security and performance, which necessitates the use of cloud-based DDoS, WAF, and Bot Management. Specifically, they wanted to incorporate the powerful security tools that were offered through IBM’s Enterprise-level Cloud Internet Services offerings. When using a cloud solution, it is necessary to proxy traffic which can create a potential challenge when it comes to managing private keys. While Cloudflare adopts strict controls to protect these keys, organizations in highly regulated industries may have security policies and compliance requirements that prevent them from sharing these private keys.
Cloudflare built Keyless SSL to allow customers to have total control over exactly where private keys are stored. With Keyless SSL and IBM’s key storage solutions, we aim to help enterprises benefit from the robust application protections available through Cloudflare’s WAF, including Cloudflare Bot Management, while still retaining control of their private keys.
“We aim to ensure our clients meet their resiliency, performance, security and compliance needs. The introduction of Keyless SSL and Bot Management security capabilities can further our collaborative accomplishments with Cloudflare and help enterprises, including those in regulated industries, to leverage cloud-native security and adaptive threat mitigation tools.” — Zane Adam, Vice President, IBM Cloud.
“Through our collaboration with IBM Cloud Internet Services, we get to draw on the knowledge and experience of IBM teams, such as the IBM Cloud for Financial Services team, and combine it with our incredible ability to innovate, resulting in exciting new product and service offerings.” — David McClure, Global Alliance Manager, Strategic Partnerships
Today, we’re excited to announce a big security enhancement to our Keyless SSL offering. Keyless SSL allows customers to store their private keys on their own hardware, while continuing to use Cloudflare’s proxy services. In the past, the configuration required customers to expose the location of their key server through a DNS record – something that is publicly queryable. Now, customers will be able to use our Cloudflare Tunnels product to send traffic to the key server through a secure channel, without publicly exposing it to the rest of the Internet.
A primer on Keyless SSL
Security has always been a critical aspect of online communication, especially when it comes to protecting sensitive information. Today, Cloudflare manages private keys for millions of domains which allows the data communicated by a client to stay secure and encrypted. While Cloudflare adopts the strictest controls to secure these keys, certain industries such as financial or medical services may have compliance requirements that prohibit the sharing of private keys.In the past, Cloudflare required customers to upload their private key in order for us to provide our L7 services. That was, until we built out Keyless SSL in 2014, a feature that allows customers to keep their private keys stored on their own infrastructure while continuing to make use of Cloudflare’s services.
While Keyless SSL is compatible with any hardware that support PKCS#11 standard, Keyless SSL users frequently opt to secure their private keys within HSMs (Hardware Security Modules), which are specialized machines designed to be tamper proof and resistant to to unauthorized access or manipulation, secure against attacks, and optimized to efficiently execute cryptographic operations such as signing and decryption. To make it easy for customers to set this up, during Security Week in 2021, we launched integrations between Keyless SSL and HSM offerings from all major cloud providers.
Strengthening the security of key servers even further
In order for Cloudflare to communicate with a customer’s key server, we have to know the IP address associated with it. To configure Keyless SSL, we ask customers to create a DNS record that indicates the IP address of their keyserver. As a security measure, we ask customers to keep this record under a long, random hostname such as “11aa40b4a5db06d4889e48e2f738950ddfa50b7349d09b5f.example.com”. While it adds a layer of obfuscation to the location of the key server, it does expose the IP address of the keyserver to the public Internet, allowing anyone to send requests to that server. We lock the connection between Cloudflare and the Keyless server down through Mutual TLS, so that the Keyless server should only accept the request if a Cloudflare client certificate associated with the Keyless client is served. While this allows the key server to drop any requests with an invalid or missing client certificate, the key server is still publicly exposed, making it susceptible to attacks.
Instead, Cloudflare should be the only party that knows about this key server’s location, as it should be the only party making requests to it.
Enter: Cloudflare Tunnel
Instead of re-inventing the wheel, we decided to make use of an existing Cloudflare product that our customers use to protect the connections between Cloudflare and their origin servers — Cloudflare Tunnels!
Cloudflare Tunnel gives customers the tools to connect incoming traffic to their private networks without exposing those networks to the Internet through a public hostname. It works by having customers install a Cloudflare daemon, called “cloudflared” which Cloudflare’s client will then connect to.
Now, customers will be able to use the same functionality but for connections made to their key server.
Getting started
To set this up, customers will need to configure a virtual network on Cloudflare – this is where customers will tell us the IP address or hostname of their key server. Then, when uploading a Keyless certificate, instead of telling us the public hostname associated with the key server, customers will be able to tell us the virtual network that resolves to it. When making requests to the key server, Cloudflare’s gokeyless client will automatically connect to the “cloudflared” server and will continue to use Mutual TLS as an additional security layer on top of that connection. For more instructions on how to set this up , check out our Developer Docs.
If you’re an Enterprise customer and are interested in using Keyless SSL in conjunction with Cloudflare Tunnels, reach out to your account team today to get set up.
Millions of customers around the world use Cloudflare to keep their applications safe by blocking bot traffic to their website. We block an average of 336 million requests per day for self-service customers using a service called Super Bot Fight Mode. It is a crucial part of how customers keep their websites online.
While most customers use Cloudflare’s Verified Bot directory to securely allow good, automated traffic, some customers also like to write their own localized integration scripts to crawl and update their website, or perform other necessary maintenance functions. Because these bots are only used on a single website, they don’t fit our verified bot criteria the way a Google or Bing crawler does. This makes Super Bot Fight Mode difficult to manage for these types of customers.
Super Bot Fight Mode: now configurable!
Previously, Super Bot Fight Mode ran as an independent service on our global network and other Cloudflare security services were unable to affect its configuration. To solve this, we’ve rewritten Super Bot Fight Mode behind the scenes. It’s now a new managed ruleset in the new WAF, just like the OWASP Core Ruleset or the Cloudflare Managed Ruleset. This doesn’t change the interface, but brings Super Bot Fight Mode closer to where customers are managing their other security exceptions.
As we speak, the WAF team is carefully migrating all self-serve customers from our old Firewall Rules system to a new system. This new system, called Custom Rules, simplifies the exception process in the rules you write with no other changes or loss of functionality. In the old system we had two separate actions, “allow” and “bypass”. In the new Custom Rules, there’s only one action called “skip”. Rules that “skip” traffic can skip the rest of your custom rules (just like an “allow” rule would) and other Cloudflare services. As Cloudflare customers are given the “Skip” action, you will be able to see the option available to “skip” Super Bot Fight Mode. Here’s an example:
While we spoke to customers about their use cases for skipping Super Bot Fight Mode, one use-case kept popping up that didn’t quite fit the rest: WordPress Loopback requests. As many people know, as part of WordPress’ self-diagnostic capabilities, a WordPress site will make automated requests back to itself over the Internet to confirm its reachability and functionality. These loopback diagnostics can come from dozens of different community developed plugins, each implementing loopback requests slightly differently. To help accommodate an ever-growing diversity in diagnostic tools used in WordPress, we have added a simple configuration option to securely allow these loop-back requests.
In the future, we will be integrating this feature with the Cloudflare WordPress plugin to make it even easier to use WordPress with Cloudflare.
What’s next?
Self-serve customers with Custom Rules can create “Skip” rules to create exceptions for Super Bot Fight Mode today. We are currently rolling out Custom Rules to all of our customers. If you do not see this option available now, you should expect to see it in the next several weeks. If the lack of flexibility has prevented you from using Super Bot Fight Mode in the past, please log into the Cloudflare dashboard and try it with these new skip rules!
While we’ve added flexibility to customers’ Super Bot Fight Mode deployments, we know that Free plan customers want the same level of customization that self-serve customers do. Now that our migration of Super Bot Fight Mode to the new WAF is complete, we plan to do the same for the original Bot Fight Mode to allow more free customers than ever before to join us in the fight against bots.
News coverage of a recent paper caused a bit of a stir with this headline: “AI Helps Crack NIST-Recommended Post-Quantum Encryption Algorithm”. The news article claimed that Kyber, the encryption algorithm in question, which we have deployed world-wide, had been “broken.” Even more dramatically, the news article claimed that “the revolutionary aspect of the research was to apply deep learning analysis to side-channel differential analysis”, which seems aimed to scare the reader into wondering what will Artificial Intelligence (AI) break next?
Reporting on the paper has been wildly inaccurate: Kyber is not broken and AI has been used for more than a decade now to aid side-channel attacks. To be crystal clear: our concern is with the news reporting around the paper, not the quality of the paper itself. In this blog post, we will explain how AI is actually helpful in cryptanalysis and dive into the paper by Dubrova, Ngo, and Gärtner (DNG), that has been misrepresented by the news coverage. We’re honored to have Prof. Dr. Lejla Batina and Dr. Stjepan Picek, world-renowned experts in the field of applying AI to side-channel attacks, join us on this blog.
We start with some background, first on side-channel attacks and then on Kyber, before we dive into the paper.
Breaking cryptography
When one thinks of breaking cryptography, one imagines a room full of mathematicians puzzling over minute patterns in intercepted messages, aided by giant computers, until they figure out the key. Famously in World War II, the Nazis’ Enigma cipher machine code was completely broken in this way, allowing the Allied forces to read along with their communications.
It’s exceedingly rare for modern established cryptography to get broken head-on in this way. The last catastrophically broken cipher was RC4, designed in 1987, while AES, designed in 1998, stands proud with barely a scratch. The last big break of a cryptographic hash was on SHA-1, designed in 1995, while SHA-2, published in 2001, remains untouched in practice.
So what to do if you can’t break the cryptography head-on? Well, you get clever.
Side-channel attacks
Can you guess the pin code for this gate?
You can clearly see that some of the keys are more worn than the others, suggesting heavy use. This observation gives us some insight into the correct pin, namely the digits. But the correct order is not immediately clear. It might be 1580, 8510, or even 115085, but it’s a lot easier than trying every possible pin code. This is an example of a side-channel attack. Using the security feature (entering the PIN) had some unintended consequences (abrading the paint), which leaks information.
There are many different types of side channels, and which one you should worry about depends on the context. For instance, the sounds your keyboard makes as you type leaks what you write, but you should not worry about that if no one is listening in.
Remote timing side channel
When writing cryptography in software, one of the best known side channels is the time it takes for an algorithm to run. For example, let’s take the classic example of creating an RSA signature. Grossly simplified, to sign a message m with private key d, we compute the signature s as md (mod n). Computing the exponent of a big number is hard, but luckily, because we’re doing modular arithmetic, there is the square-and-multiply trick. Here is a naive implementation in pseudocode:
The algorithm loops over the bits of the secret key, and does a multiply step if the current bit is a 1. Clearly, the runtime depends on the secret key. Not great, but if the attacker can only time the full run, then they only learn the number of 1s in the secret key. The typical catastrophic timing attack against RSA instead is hidden behind the “mod n”. In a naive implementation this modular reduction is slower if the number being reduced is larger or equal n. This allows an attacker to send specially crafted messages to tease out the secret key bit-by-bit and similar attacks are surprisingly practical.
Because of this, the mantra is: cryptography should run in “constant time”. This means that the runtime does not depend on any secret information. In our example, to remove the first timing issue, one would replace the if-statement with something equivalent to:
s = ((s * powerOfM) mod n) * bit(s, i) + s * (1 - bit(s, i))
This ensures that the multiplication is always done. Similar countermeasures prevent practically all remote timing attacks.
Power side-channel
The story is quite different for power side-channel attacks. Again, the classic example is RSA signatures. If we hook up an oscilloscope to a smartcard that uses the naive algorithm from before, and measure the power usage while it signs, we can read off the private key by eye:
Even if we use a constant-time implementation, there are still minute changes in power usage that can be detected. The underlying issue is that hardware gates that switch use more power than those that don’t. For instance, computing 127 + 64 takes more energy than 64 + 64.
127+64 and 64+64 in binary. There are more switched bits in the first.
Masking A common countermeasure against power side-channel leakage is masking. This means that before using the secret information, it is split randomly into shares. Then, the brunt of the computation is done on the shares, which are finally recombined.
In the case of RSA, before creating a new signature, one can generate a random r and compute md+r (mod n) and mr (mod n) separately. From these, the final signature md (mod n) can be computed with some extra care.
Masking is not a perfect defense. The parts where shares are created or recombined into the final value are especially vulnerable. It does make it harder for the attacker: they will need to collect more power traces to cut through the noise. In our example we used two shares, but we could bump that up even higher. There is a trade-off between power side-channel resistance and implementation cost.
One of the challenging parts in the field is to estimate how much secret information is actually leaked through the traces, and how to extract it. Here machine learning enters the picture.
Machine learning: extracting the key from the traces
Machine learning, of which deep learning is a part, represents the capability of a system to acquire its knowledge by extracting patterns from data — in this case, the secrets from the power traces. Machine learning algorithms can be divided into several categories based on their learning style. The most popular machine learning algorithms in side-channel attacks follow the supervised learning approach. In supervised learning, there are two phases: 1) training, where a machine learning model is trained based on known labeled examples (e.g., side-channel measurements where we know the key) and 2) testing, where, based on the trained model and additional side-channel measurements (now, with an unknown key), the attacker guesses the secret key. A common depiction of such attacks is given in the figure below.
While the threat model may sound counterintuitive, it is actually not difficult to imagine that the attacker will have access (and control) of a device similar to the one being attacked.
In side-channel analysis, the attacks following those two phases (training and testing) are called profiling attacks.
Profiling attacks are not new. The first such attack, called the template attack, appeared in 2002. Diverse machine learning techniques have been used since around 2010, all reporting good results and the ability to break various targets. The big breakthrough came in 2016, when the side-channel community started using deep learning. It greatly increased the effectiveness of power side-channel attacks both against symmetric-key and public-key cryptography, even if the targets were protected with, for instance, masking or some other countermeasures. To be clear: it doesn’t magically figure out the key, but it gets much better at extracting the leaked bits from a smaller number of power traces.
While machine learning-based side-channel attacks are powerful, they have limitations. Carefully implemented countermeasures make the attacks more difficult to conduct. Finding a good machine learning model that can break a target can be far from trivial: this phase, commonly called tuning, can last weeks on powerful clusters.
What will the future bring for machine learning/AI in side-channel analysis? Counter intuitively, we would like to see more powerful and easy to use attacks. You’d think that would make us worse off, but to the contrary it will allow us to better estimate how much actual information is leaked by a device. We also hope that we will be able to better understand why certain attacks work (or not), so that more cost-effective countermeasures can be developed. As such, the future for AI in side-channel analysis is bright especially for security evaluators, but we are still far from being able to break most of the targets in real-world applications.
Kyber
Kyber is a post-quantum (PQ) key encapsulation method (KEM). After a six-year worldwide competition, the National Institute of Standards and Technology (NIST) selected Kyber as the post-quantum key agreement they will standardize. The goal of a key agreement is for two parties that haven’t talked to each other before to agree securely on a shared key they can use for symmetric encryption (such as Chacha20Poly1305). As a KEM, it works slightly different with different terminology than a traditional Diffie–Hellman key agreement (such as X25519):
When connecting to a website the client first generates a new ephemeral keypair that consists of a private and public key. It sends the public key to the server. The server then encapsulates a shared key withthat public key, which gives it a random shared key, which it keeps, and a ciphertext (in which the shared key is hidden), which the server returns to the client. The client can then use its private key to decapsulate the shared key from the ciphertext. Now the server and client can communicate with each other using the shared key.
Key agreement is particularly important to make secure against attacks of quantum computers. The reason is that an attacker can store traffic today, and crack the key agreement in the future, revealing the shared key and all communication encrypted with it afterwards. That is why we have already deployed support for Kyber across our network.
The DNG paper
With all the background under our belt, we’re ready to take a look at the DNG paper. The authors perform a power side-channel attack on their own masked implementation of Kyber with six shares.
Point of attack
They attack the decapsulation step. In the decapsulation step, after the shared key is extracted, it’s encapsulated again, and compared against the original ciphertext to detect tampering. For this re-encryption step, the precursor of the shared key—let’s call it the secret—is encoded bit-by-bit into a polynomial. To be precise, the 256-bit secret needs to be converted to a polynomial with 256 coefficients modulo q=3329, where the ith coefficient is (q+1)/2 if the ith bth is 1 and zero otherwise.
This function sounds simple enough, but creating a masked version is tricky. The rub is that the natural way to create shares of the secret is to have shares that xor together to be the secret, and that the natural way to share polynomials is to have shares that add together to get to the intended polynomial.
This is the two-shares implementation of the conversion that the DNG paper attacks:
The code loops over the bits of the two shares. For each bit, it creates a mask, that’s 0xffff if the bit was 1 and 0 otherwise. Then this mask is used to add (q+1)/2 to the polynomial share if appropriate. Processing a 1 will use a bit more power. It doesn’t take an AI to figure out that this will be a leaky function. In fact, this pattern was pointed out to be weak back in 2016, and explicitly mentioned to be a risk for masked Kyber in 2020. Apropos, one way to mitigate this, is to process multiple bits at once — for the state of the art, tune into April 2023’s NIST PQC seminar. For the moment, let’s allow the paper its weak target.
The authors do not claim any fundamentally new attack here. Instead, they improve the effectiveness of the attack in two ways: the way they train the neural network, and how to use multiple traces more effectively by changing the ciphertext sent. So, what did they achieve?
Effectiveness
To test the attack, they use a Chipwhisperer-lite board, which has a Cortex M4 CPU, which they downclock to 24Mhz. Power usage is sampled at 24Mhz, with high 10-bit precision.
To train the neural networks, 150,000 power traces are collected for decapsulation of different ciphertexts (with known shared key) for the same KEM keypair. This is already a somewhat unusual situation for a real-world attack: for key agreement KEM keypairs are ephemeral; generated and used only once. Still, there are certainly legitimate use cases for long-term KEM keypairs, such as for authentication, HPKE, and in particular ECH.
The training is a key step: different devices even from the same manufacturer can have wildly different power traces running the same code. Even if two devices are of the same model, their power traces might still differ significantly.
The main contribution highlighted by the authors is that they train their neural networks to attack an implementation with 6 shares, by starting with a neural network trained to attack an implementation with 5 shares. That one can be trained from a model to attack 4 shares, and so on. Thus to apply their method, of these 150,000 power traces, one-fifth must be from an implementation with 6 shares, another one-fifth from one with 5 shares, et cetera. It seems unlikely that anyone will deploy a device where an attacker can switch between the number of shares used in the masking on demand.
Given these affordances, the attack proper can commence. The authors report that, from a single power trace of a two-share decapsulation, they could recover the shared key under these ideal circumstances with probability… 0.12%. They do not report the numbers for single trace attacks on more than two shares.
When we’re allowed multiple traces of the same decapsulation, side-channel attacks become much more effective. The second trick is a clever twist on this: instead of creating a trace of decapsulation of exactly the same message, the authors rotate the ciphertext to move bits of the shared key in more favorable positions. With 4 traces that are rotations of the same message, the success probability against the two-shares implementation goes up to 78%. The six-share implementation stands firm at 0.5%. When allowing 20 traces from the six-share implementation, the shared key can be recovered with an 87% chance.
In practice
The hardware used in the demonstration might be somewhat comparable to a smart card, but it is very different from high-end devices such as smartphones, desktop computers and servers. Simple power analysis side-channel attacks on even just embedded 1GHz processors are much more challenging, requiring tens of thousands of traces using a high-end oscilloscope connected close to the processor. There are much better avenues for attack with this kind of physical access to a server: just connect the oscilloscope to the memory bus.
Except for especially vulnerable applications, such as smart cards and HSMs, power-side channel attacks are widely considered infeasible. Although sometimes, when the planets align, an especially potent power side-channel attack can be turned into a remote timing attack due to throttling, as demonstrated by Hertzbleed. To be clear: the present attack does not even come close.
And even for these vulnerable applications, such as smart cards, this attack is not particularly potent or surprising. In the field, it is not a question of whether a masked implementation leaks its secrets, because it always does. It’s a question of how hard it is to actually pull off. Papers such as the DNG paper contribute by helping manufacturers estimate how many countermeasures to put in place, to make attacks too costly. It is not the first paper studying power side-channel attacks on Kyber and it will not be the last.
Wrapping up
AI did not completely undermine a new wave of cryptography, but instead is a helpful tool to deal with noisy data and discover the vulnerabilities within it. There is a big difference between a direct break of cryptography and a power side-channel attack. Kyber is not broken, and the presented power side-channel attack is not cause for alarm.
At Cloudflare, helping to build a better Internet is not just a catchy saying. We are committed to the long-term process of standards development. We love the work of pushing the fundamental technology of the Internet forward in ways that are accessible to everyone. Today we are adding even more substance to that commitment. One of our core beliefs is that privacy is a human right. We believe that to achieve that right the most advanced cryptography needs to be available to everyone, free of charge, forever. Today, we are announcing that our implementations of post-quantum cryptography will meet that standard: available to everyone, and included free of charge, forever.
We have a proud history of taking paid encryption products and launching it to the Internet at scale for Free. Even at the cost of short and long-term revenue because it’s the right thing to do. In 2014, we made SSL free for every Cloudflare customer with Universal SSL. As we make our implementations of post-quantum cryptography free forever today, we do it in the spirit of that first major announcement:
“Having cutting-edge encryption may not seem important to a small blog, but it is critical to advancing the encrypted-by-default future of the Internet. Every byte, however seemingly mundane, that flows encrypted across the Internet makes it more difficult for those who wish to intercept, throttle, or censor the web. In other words, ensuring your personal blog is available over HTTPS makes it more likely that a human rights organization or social media service or independent journalist will be accessible around the world. Together we can do great things.”
We hope that others will follow us in making their implementations of PQC free as well so that we can create a secure and private Internet without a “quantum” up-charge.
The Internet has matured since the 1990’s and the launch of SSL. What was once an experimental frontier has turned into the underlying fabric of modern society. It runs in our most critical infrastructure like power systems, hospitals, airports, and banks. We trust it with our most precious memories. We trust it with our secrets. That’s why the Internet needs to be private by default. It needs to be secure by default. It’s why we’re committed to ensuring that anyone and everyone can achieve post quantum security for free as well as start deploying it at scale today.
Our work on post-quantum crypto is driven by the thesis that quantum computers that can break conventional cryptography create a similar problem to the Year 2000 bug. We know there is going to be a problem in the future that could have catastrophic consequences for users, businesses, and even nation states. The difference this time is we don’t know the date and time that this break in the paradigm of how computers operate will occur. We need to prepare today to be ready for this threat.
To that end we have been preparing for this transition since 2018. At that time we were concerned about the implementation problems other large protocol transitions, like the move to TLS 1.3, had caused our customers and wanted to get ahead of it. Cloudflare Research over the last few years has become a leader and champion of the idea that PQC security wasn’t an afterthought for tomorrow but a real problem that needed to be solved today. We have collaborated with industry partners like Google and Mozilla, contributed to development through participation in the IETF, and even launched an open source experimental cryptography suite to help move the needle. We have tried hard to work with everyone that wanted to be a part of the process and show our work along the way.
As we have worked with our partners in both industry and academia to help prepare us and the Internet for a post-quantum future, we have become dismayed by an emerging trend. There are a growing number of vendors out there that want to cash in on the legitimate fear that nervous executives, privacy advocates, and government leaders have about quantum computing breaking traditional encryption. These vendors offer vague solutions based on unproven technologies like “Quantum Key Distribution” or “Post Quantum Security” libraries that package non-standard algorithms that haven’t been through public review with exorbitant price tags like RSA did in the 1990s. They often love to throw around phrases like “AI” and “Post Quantum” without really showing their work on how any of their systems actually function. Security and privacy are table stakes in the modern Internet, and no one should be charged just to get the baseline protection needed in our contemporary world.
Launch your PQC transition today
Testing and adopting post-quantum cryptography in modern networks doesn’t have to be hard! In fact, Cloudflare customers can test PQC in their systems today, as we describe later in this post.
After testing out how Cloudflare can help you implement PQC in your networks, it’s time to start to prepare yourself for the transition to PQC in all of your systems. This first step of inventorying and identifying is critical to a smooth rollout. We know first hand since we have undertaken an extensive evaluation of all of our systems to earn our FedRAMP Authorization certifications, and we are doing a similar evaluation again to transition all of our internal systems to PQC.
How we are setting ourselves up for the future of quantum computing
Here’s a sneak preview of the path that we are developing right now to fully secure Cloudflare itself against the cryptographic threat of quantum computers. We can break that path down into three parts: internal systems, zero trust, and open source contributions.
The first part of our path to full PQC adoption at Cloudflare is around all of our connections. The connection between yourself and Cloudflare is just one part of the larger path of the connection. Inside our internal systems we are implementing two significant upgrades in 2023 to ensure that they are PQC secure as well.
The first is that we use BoringSSL for a substantial amount of connections. We currently use our fork and we are excited that upstream support for Kyber is underway. Any additional internal connections that use a different cryptographic system are being upgraded as well. The second major upgrade we are making is to shift the remaining internal connections that use TLS 1.2 to TLS 1.3. This combination of Kyber and TLS 1.3 will make our internal connections faster and more secure, even though we use a hybrid of classical and post-quantum secure cryptography. It’s a speed and security win-win. And we proved this power house combination would provide that speed and security over three and half years ago thanks to the groundbreaking work of Cloudflare Research and Google.
The next part of that path is all about using PQC and zero trust as allies together. As we think about the security posture of tomorrow being based around post-quantum cryptography, we have to look at the other critical security paradigm being implemented today: zero trust. Today, the zero trust vendor landscape is littered with products that fail to support common protocols like IPv6 and TLS 1.2, let alone the next generation of protocols like TLS 1.3 and QUIC that enable PQC. So many middleboxes struggle under the load of today’s modern protocols. They artificially downgrade connections and break end user security all in the name of inspecting traffic because they don’t have a better solution. Organizations big and small struggled to support customers that wanted the highest possible performance and security, while also keeping their businesses safe, because of the resistance of these vendors to adapt to modern standards. We do not want to repeat the mistakes of the past. We are planning and evaluating the needed upgrades to all of our zero trust products to support PQC out of the box. We believe that zero trust and post-quantum cryptography are not at odds with one another, but rather together are the future standard of security.
Finally, it’s not enough for us to do this for ourselves and for our customers. The Internet is only as strong as its weakest links in the connection chains that network us all together. Every connection on the Internet needs the strongest possible encryption so that businesses can be secure, and everyday users can be ensured of their privacy. We believe that this core technology should be vendor agnostic and open to everyone. To help make that happen our final part of the path is all about contributing to open source projects. We have already been focused on releases to CIRCL. CIRCL (Cloudflare Interoperable, Reusable Cryptographic Library) is a collection of cryptographic primitives written in Go. The goal of this library is to be used as a tool for experimental deployment of cryptographic algorithms targeting post quantum.
Later on this year we will be publishing as open source a set of easy to adopt, vendor-neutral roadmaps to help you upgrade your own systems to be secure against the future today. We want the security and privacy created by post quantum crypto to be accessible and free for everyone. We will also keep writing extensively about our post quantum journey. To learn more about how you can turn on PQC today, and how we have been building post-quantum cryptography at Cloudflare, please check out these resources:
Security updates have been issued by Debian (firefox-esr and pcre2), Oracle (nss), Red Hat (kpatch-patch and nss), SUSE (java-11-openjdk, kernel, and python310), and Ubuntu (emacs24, ffmpeg, firefox, imagemagick, libphp-phpmailer, librecad, and openjpeg2).
Ако не сте чували за „Баншите от Инишерин“, вероятно през последния месец и половина сте живeли в изолация, подобна на тази, в която живеят обитателите на едноименния остров (с измислено име¹) от филма, а и тотално сте проспали вълненията (и разочарованията) покрай Оскарите в неделя. Но дори да сте гледали филма, предполагам, че малко от вас са задълбали особено в етимологията на думата „банши“, а още по-малко са се замислили за превода на благозвучното и същевременно трудно произносимо заглавие. Това смятам да направя аз тук, дори и с риск да разкрия подробности от филма и да разваля удоволствието на тези от вас, на които предстои да го гледат.
Самият филм съдържа елегантно вмъкнато в един кратък диалог обяснение какво представляват „баншите“, а много от рецензиите също предлагат базисна дефиниция на думата като
духове от ирландския фолклор, чиито писъци предвещават смърт.
При малко по-задълбочено търсене откриваме, че
думата banshee произлиза от ирландското понятие bean sí, което от своя страна идва от староирландското ben sídhe и буквално означава „жена от хълма“².
След като се модифицира в banshee, думата навлиза в английския език през 1771 г. и освен с горната дефиниция, впоследствие започва да се използва и като обидно название за шумна, проклета и зла жена.
Някои източници описват съществото banshee като старица с бяла коса и бледо лице, загърната в наметало с качулка, което доста се доближава до образа на мисис Маккормик от филма. Други експерти по ирландски фолклор и легенди твърдят, че баншите оплакват смъртта само на „истинските“ ирландци, които се познават по това, че фамилните им имена започват с О’ или Мак. (Това до известна степен може да ни успокои относно съдбата на двамата главни герои във филма Падрик и Колм, чиито фамилии, за разлика от на гореспоменатата госпожа, не съдържат тези представки³.)
Оказва се, обаче, че
най-съществената характеристика на баншите не е нито видът им, нито адресатите на предупредителните им писъци, а самите писъци.
Откакто преди двайсетина години за първи път чух думата banshee (като наименование на едно американско студентско списание за поезия), почти неизменно съм я срещала във фразеологични комбинации с викове, крясъци или ридания⁴.
Макар и да се срещат сравнително рядко и да звучат леко ретро, английските изрази, в които се споменават този вид пронизителни писъци, се използват като описания на изненадващо разнообразни ситуации: от умилени майки, твърдящи, че бебетата им „врещят като банши“ (screeching like a banshee), през военни кореспонденти, оприличаващи звука, с който руските снаряди приближават украинските градове, на „писък на банши“ (banshee-scream), до неуки готвачки в английски сериали, които възкликват, че настоятелният и пронизителен звън на новоинсталирания телефон е като „рев на банши“ (cry of the banshee).
Не е учудващо, че писъците на баншите се появяват и в музикален контекст: дебютният албум на британската група Siouxsie and the Banshees от 1978 г. например се казва The Scream. Но ако съдим по музикалния подбор във филма на Макдона⁵, като че ли най-доброто музикално въплъщение на зловещия, обезпокоителен, не от този свят повик на баншите е не пънкарска мелодия, а песента „Полегнала е Тодора“ в изпълнение на The Ensemble of the Bulgarian Republic⁶. В звученето на песента, особено ако се абстрахираме от иначе прозаично-любовния ѝ текст, наистина има нещо извънземно, макар че – ако ще си говорим за български народни песни – „Назад, назад, моме Калино“ е доста по-свързана с темата за предизвестяването на смъртта („жена ке уморам…“), а може би още по-подходящ избор щеше да бъде „Излел е Дельо хайдутин“ – не само заради „космическата“ асоциация, а и заради звука на гайдите, които освен на Балканите, са традиционен музикален инструмент в Ирландия и Шотландия.
Така или иначе, инишеринските банши далеч не са първите, които се появяват на български под това наименование. През годините сме ги срещали в заглавия на литературни произведения, филми и телевизионни сериали, като например разказа „Банши“ на Рей Бредбъри⁷ и екшъна с участието на Антонио Бандерас „Кодово име Банши“⁸.
На фона на вече съществуващите преводи, а и сам по себе си
българският превод на заглавието на филма на Мартин Макдона е доста сполучлив.
Макар все още да не може да се каже, че думата „банши“ е широко навлязла и добре позната в българския език⁹, решението на преводача Камен Велчев да я използва в българското заглавие, вместо да търси някакъв приблизителен местен еквивалент, без съмнение е добро. Колкото и да са цветисти, караконджулите, таласъмите10 и полтъргайстите11, одомашнявайки ирландското понятие, просто нямаше да постигнат ефекта на баншите, а по-неутрални думи като „духове“, „призраци“ или „привидения“ щяха да нормализират и сплескат заглавието до нива на отчайващa скука. И в двата случая чудесната алитерация – двойният звук „ш“, който много се нрави и на героя Колм във филма – съвсем би изчезнала.
Но дори и българският преводачески подход да ни се струва правилен, един бърз преглед на заглавието на различни езици показва, че той далеч не е единственият възможен. Повечето преводи, както може да се очаква, все пак следват този модел и само адаптират заглавието към граматиката на приемащия език, например Les Banshees d’Inisherin на френски, Inišerinas Banšī на латвийски, или „Банші Інішерина“ на украински. Някои, като датския, холандския и норвежкия, даже оставят английското заглавие в оригинал, без никакви промени.
Но има и изненадващо много преводи, които заменят баншите с някаква обща дума: на езика на баските например те стават феи (Insiheringo Maitagarriak), на немски – феи на смъртта (Die Todesfeen von Inisherin), на турски – нимфи на смъртта (Inisherin'in Ölüm Perileri), на полски – призраци (Duchy Inisherin), а на румънски – духове (Spiritele din Inisherin, които и доста добре си кореспондират с Aventuri în Bruges).
Но най-несполучливи, поне за мен, са преводите, които унищожават спецификата и на двете реалии, като ги превеждат с генерични понятия, сред които са сръбският „Духови острва“ и италианският Gli spiriti dell’isola. Особено любопитни са испанските и португалските преводи, като на всеки език заглавието съществува в две различни версии. В Испания филмът излиза под заглавието Almas en pena de Inisherin („Изтерзани души от Инишерин“), а в Латинска Америка – Los espíritus de la isla („Духовете от острова“). На португалски стратегиите са огледални: в Бразилия филмът е озаглавен Os Banshees de Inisherin, а в Португалия – Os Espíritos de Inisherin.
Принципното ми одобрение на подхода, използван в превода на българското заглавие, съвсем не означава, че не изпитвам известни притеснения относно граматическата му правилност. Според моята логика, тъй като думата banshee е в единствено число, в множествено тя би трябвало да бъде „баншита“ (подобно на „уиски“, съответно „уискита“12), а членувана да стане „баншитата“ – дори и „Баншитата от Инишерин“ да звучи леко нелепо. От Службата „Езикови справки и консултации“ на Института за български език към БАН обаче любезно опровергаха моите опасения и ме успокоиха. Според тях,
въпреки че думата „банши“ все още не е формално навлязла в българския език и не е нормирана, сегашното заглавие би могло да се сметне за граматически правилно, ако при формирането на членуваното множествено число се следва моделът не на „уиски“, а на „янки“.
Ето че дори и тук, въпреки географската отдалеченост, можем да открием връзка с българската народна музика: една от теориите за произхода на думата yankee като прозвище на американците е от Janke, умалителна форма на името Jan/John, използвано от холандските заселници в Америка. От умалителна форма на същото име, но в българския му вариант Иван/Йоан, пък идва собственото име на една от най-известните български народни певици – Янка Рупкина. A една от песните, които тя пее, също има „извънземно“, или по-скоро космическо измерение: песента „Калиманку Денку“ в нейно изпълнение е звучала вместо Сватбения марш на Менделсон на сватбата на Дейвид Боуи и Иман.
1 Голяма част от филма е заснета на остров Инишмор, най-големия от Аранските острови, които са разположени покрай западния бряг на Ирландия. Въпреки че истинското наименование също създава хубава алитерация с „банши“, Мартин Макдона решава да не го използва, а да кръсти острова с измислено име, като по този начин цели да придаде на историята по-митологичен и алегоричен тон.
2 Думата sidhe (произнася се „ши“) означава не просто хълм, а хълм, във и под който според ирландския фолклор и келтската митология живеят т.нар. Aos Sí – свръхестествена „раса“ създания, сред които феи, самодиви, елфи и тем подобни. С времето думата, освен със значението си като „хълм“ или „могила“, става синоним и на самите митологични същества.
3 Силно се съмнявам самият Мартин Макдона да се е съобразявал с това „правило“, докато е писал сценария на филма, но все пак ще отбележа, че фамилното име на трогателния герой Доминик Киърни също не започва с О’ или Мак, макар и това да не го спасява от трагичната му участ.
4 Любопитно е да се отбележи, че макар и да няма етимологична връзка между думата „банши“ и английските думи за тези писъци, плачове и крясъци (screaming, wailing, shrieking), между тях се усеща звукова връзка, която вероятно се дължи на това, че както изброените глаголи са ономатопеични, така и самата думата „банши“ – особено ако двойното е накрая се произнесе издължено – звучи като зловещо пищене.
5 Според композитора на филма Картър Бъруел, който също беше номиниран за „Оскар“ в категорията „Най-добра оригинална музика“, Мартин Макдона e искал саундтракът да не отразява ирландската атмосфера на филма, а да е по-скоро приказен. Ето защо Бъруел се вдъхновява и базира композициите си на изпълнение на традиционен индонезийски ансамбъл, известен като гамелан, който свири на металофони, гонгове и звънци.
6 „Баншите от Инишерин“ не е първият англоезичен филм, в който се използва българска народна музика, за да внуши на зрителите си чувство за приказност и мистерия. В британската комедийна драма Skeletons, която разказва за двама професионални екзорсисти, като постоянен мотив звучи друга народна песен, пак за полягане – „Полегнала е пшеница“ в изпълнение на „Мистерията на българските гласове“. Във филма, когато работата се обърка и героите се заклещят между две различни измерения, това се нарича going Bulgarian и предизвиква говорене на български.
7 Българският преводач на разказа „Банши“, чието име, за съжаление, не е упоменато в chitanka.info, е удържал на изкушението да побългари заглавието, но не и на порива да сложи обяснителна бележка под линия при първото споменаване на думата в текста, въпреки че значението ѝ става ясно в течение на самия разказ.
8 Из мрежата също така откривам американски хорър филм The Scream of the Banshee от 2011 г., преведен като „Викът на Банши“ и „Писъкът на Банши“. Съдейки по анотацията, според която филмът „преразказва мита за крещящото банши“, главната буква в заглавието е подвеждаща, тъй като подсказва, че „банши“ е собствено име, а не нарицателно. (Откривам и британски хорър филм от 1970 г. с участието на Винсънт Прайс, чието заглавие The Cry of the Banshee не е превеждано на български, но пък е вдъхновило името на гореспоменатата пънк група Siouxsie And The Banshees.) Американският криминален драма сериал с оригинално заглавие Banshee (2013–2016) е преведен на български като „Банши, Пенсилвания“, което разкрива, че Банши в случая е име на град, и по този начин унищожава част от мистерията на оригинала. В превода на екшън филма с участието на Антонио Бандерас като „Кодово име Банши“ (Code Name Banshee) главната буква си е намясто, тъй като в случая Банши е прякор на един от героите.
9 Думата „банши“ не фигурира в последното издание на „Речник на българския език“, т. 1, 2001 г., но из интернет вече се намират доста български материали, които съдържат думата, включително и страница, посветена на понятието в българската Wikipedia.
10 На пръв поглед, преводът на „банши“ като „караконджули“ или „таласъми“ изглежда неудачен, но всъщност не е – гореспоменатата мисис Маккормик във филма неколкократно е описана като ghoul, което на български се превежда точно като „таласъм“ или „караконджул“.
11 Полтъргайстите също получават наименованието си заради шумовете, които произвеждат: от немското poltern („шуми“) + Geist („дух“).
12 Произходът на думата „уиски“, както този на „банши“, също е от староирландски: uisce („вода“) + bethu („живот“). Предполага се, че думата е калка на латинския термин aqua vitae.
В рубриката „От дума на дума“ Екатерина Петрова търси актуални, интересни или новопоявили се думи от нашето ежедневие и проследява често изненадващия им произход, развитието на значенията им във времето и взаимовръзките им с близки и далечни езици.
We are thrilled to announce Cloudflare’s worldwide 2022 Channel Partner Award winners. Each of these partner companies and individuals went above and beyond, demonstrating outstanding commitment to working closely with Cloudflare to build technical competencies and to deliver compelling, integrated security and performance solutions for customers around the globe.
This past year was another milestone year, with record-setting growth for Cloudflare and our partners. The Cloudflare Channel and Alliances Partner Program received the highest, 5-star rating in CRN’s Partner Program Guide. New customer bookings acquired through partners jumped over 28% year over year.
In June, we announced the Cloudflare One Partner Specialization, with tailored enablement and new partner go-to-market resources for Cloudflare One, our SASE solution which includes the industry’s first, 100% Cloud-native Zero Trust platform. More than 1,600 partner sellers and technical sellers have completed Cloudflare Zero Trust training courses, enabling them to deliver the most comprehensive security needed in today’s connect-from-anywhere economy.The Cloudflare Channel Partner Network contributed to the significant market traction we’ve seen for Cloudflare One, including partner-sourced pipeline for Cloudflare One growing 240% from Q1 through Q4 of 2022.
As organizations across industries and the public sector require a fast and secure path to Zero Trust architectures, going forward Cloudflare partners will play an even more strategic role in Cloudflare’s growth. We look to our partners to deliver not only Cloudflare solutions but the managed or professional services customers need to help them. For instance, to conduct Zero Trust assessments, migrate from legacy products, integrate with existing technology stacks, and provide ongoing services and support. As notable a year as 2022 was, we are even more excited about what we’ll achieve together with our partners in 2023!
Congratulations to our Partner Award winners, and thank you to all our partners for your dedication and commitment to delivering a faster, more secure, and more reliable Internet for customers and their users globally.
Americas Partner Awards
Master Agent of the Year: AVANT Honors the top performing Master Agent that has best represented Cloudflare and enabled partners to secure sales and growth revenue streams.
Partner of the Year: Optiv Honors the top performing partner that has demonstrated phenomenal sales achievement in 2022.
Growth Partner of the Year: Verinext Honors the partner who made substantial investments to grow our shared business, achieving not only full certification compliance but also exceeding revenue targets.
Technical Excellence Award: Syntax Honors the partner company whose Solutions Engineers (SEs) demonstrated great knowledge and expertise in leading the customer’s Cloudflare presales and POC experience.
Partner Solutions Engineers Champions of the Year: Niko O’Hara and Stephen Semmelroth (AVANT) Honors the individual partner SEs who have demonstrated depth of knowledge and expertise in Cloudflare solutions and went above and beyond in delivering the Cloudflare experience for our joint customers.
APJC Partner Awards
Distributor of the Year: Softdebut Co., Ltd. Honors the top performing Distributor that has best represented Cloudflare and enabled partners to secure sales and growth revenue streams.
Partner of the Year: Kingsoft Cloud Honors the top performing partner that has demonstrated phenomenal sales achievement in 2022.
New Partner of the Year: Anchor Systems Pty Ltd Honors the partner who, although new to the Cloudflare Partner Network in 2022, has already made substantial investments to grow our shared business achieving not only full certification compliance but also exceeding revenue targets.
Partner Win of the Year: Union Victory Technologies Development Limited Honors the partner who has brought in the largest, most strategic deal and deployed a comprehensive end-to-end security, performance, and reliability solution to a customer.
Technical Excellence Award: Omni Intelligent Services Honors the partner company whose SEs demonstrated great knowledge and expertise in leading the customer’s Cloudflare presales and POC experience.
Certification Champion of the Year:Tokyo Electron Device Ltd Honors partner companies whose teams earned the highest total number of Cloudflare certifications.
Honors the individual partner SEs who have demonstrated depth of knowledge and expertise in Cloudflare solutions and went above and beyond in delivering the Cloudflare experience for our joint customers.
Marketing Partner of the Year: PT. Helios Informatika Nusantara Honors the partner company who demonstrated outstanding collaboration and business outcomes in marketing Cloudflare solutions.
Services Partner of the Year: Megazone Cloud Corporation Honors the top performing services solution provider.
Honors top partner achievers who not only provided stellar service to our joint customers, but also built new business value by tapping into the power of network, relationships, and ecosystems.
EMEA Partner Awards
Distributor of the Year:V-Valley Honors the top performing Distributor that has best represented Cloudflare and enabled partners to secure sales and growth revenue streams.
Partner of the Year: Datacentrix PTY LTD Honors the top performing partner that has demonstrated phenomenal sales achievement in 2022.
New Partners of the Year:KAEMI GmbH and Liquid C2 Honors the partners who, although new to the Cloudflare Partner Network in 2022, have already made substantial investments to grow our shared business achieving not only full certification compliance but also exceeding revenue targets.
Rising Star Award: David Sanchez (V-Valley) Honors individual partner representatives who, although new to our collaboration, have already made a significant, positive contribution both to our partnership and to driving outcomes for our customers.
Partner Win of the Year: Rackspace Technology Honors the partner who has brought in the largest, most strategic deal and deployed a comprehensive end-to-end security, performance and reliability solution to a customer.
Technical Excellence Award: Shawn Gradwell (Datacentrix PTY LTD), Yogesh Padharia (IBM Security Services Netherlands) and Sven Launspach (KAEMI GmbH) Honors the partner company whose SEs demonstrated great knowledge and expertise in leading the customer’s Cloudflare presales and POC experience.
Partner SE Champion of the Year: Lee Kazaz (Nanosek) Honors the individual partner SE who demonstrated depth of knowledge and expertise in Cloudflare solutions and went above and beyond in delivering the Cloudflare experience for our joint customers.
Certification Champion of the Year: Liquid C2 This award honors the Partner whose teams earned the highest total number of Cloudflare certifications during 2022.
Marketing Champion of the Year:V-Valley and Concat AG Honors partner companies who have demonstrated outstanding collaboration and business outcomes in marketing Cloudflare solutions.
Most Valuable Player of the Year:Nanosek Honors the top partner achiever who not only provided stellar service to our joint customers, but also built new business value by tapping into the power of network, relationships, and ecosystems.
MSP of the Year:Castelis Honors the top performing managed services solutions provider.
GSI of the Year:Wipro Limited Honors the top performing SI partner.
For more information on Cloudflare’s Channel and Alliances Partner Program, go here. Apply to become a Cloudflare Partner on our Partner Portal.
At GitHub you’ve heard us talk about how we are using GitHub Projects and GitHub Actions to plan and track our work and now we’ve asked one of our customers, Grafana Labs, to share how their teams are approaching work in a new way. Whether they are managing open source requests, operational tasks, or escalations, the Grafana Labs Alerting team uses GitHub Projects to manage all these issues efficiently.
Let’s hear more from Armand Grillet, Senior Engineering Manager at Grafana Labs, including how his teams use tasklists to break work into manageable tasks, use a common set of labels to filter tasks, create multiple views on a single project to meet the needs of different teams and stakeholders, and use automation to enable engineers to stay focused on the code.
Grafana is a leading open source platform for monitoring and observability, which is why the Grafana Labs GitHub organization is the center of our engineering efforts with nearly 1,000 repositories, including eight having more than 2,000 stars. In addition to this open source work, Grafana Labs engineers also work on the Grafana Cloud observability platform and its customers’ escalations.
As the manager of the Grafana Alerting and service-level objectives (SLOs) backend teams at Grafana Labs it was essential to have one project board that benefited our multiple stakeholders: team members, other employees, as well as the open source community. Our GitHub Project has offered us the opportunity to do just that. You can even make a copy of our board and adapt it for your own project needs, using the ‘make a copy’ functionality.
One view for each team, assembled around task lists
Our four teams each have a view in the Grafana Alerting project: “Backend”,”Front-end”,”UX”,and “Docs”.
Grafana Alerting has contributors working across four teams: backend, front-end, UX, and docs. Each of these contributor types has their own view in our project. The field options (thus the columns) are the same for each of these views:
Inbox—not reviewed yet
Waiting for input—open source issues that need more details
Backlog—reviewed, priority depending on the milestone set
In progress
In review
Done
These columns (custom fields) are intentionally generic. They can work for all teams, no matter whether the issue has been written by someone in the community or by someone internally. We use project filters based on labels, such as “area/frontend” to allow issues to be automatically added to the correct views once they are added to our project.
Big issues that we work on over a quarter use tasklists to breakdown the main pieces of work.
Note: Tasklists are currently in private beta; you can sign your organization up for access on the GitHub Feature Preview portal
For bigger issues, we make use of the GitHub tasklist feature to break down the work into tasks. We use labels to filter the tasks to be included in the relevant team’s view. This creates views that provide two different, but useful, kinds of information. For example, for the docs team:
Smaller issues with only the label “type/docs” are items the docs team needs to work on.
Bigger issues containing task lists with the label “type/docs” along with labels for additional areas (for example, “area/frontend”) are issues with a dependency on the docs team, but the item is not owned by “docs.” For these bigger issues, if the status is “in progress” someone in the docs team should start checking how they can help.
As a manager of the backend team and project lead for Grafana Alerting, this workflow gives me peace of mind. Even if our docs team members miss some meetings, the Docs view in our project is always accurate, because engineers maintain the status of issues.
The four team views, combined with our “Epics” view (the first view in our board) that lists our big issues for an entire quarter, allow everyone to see our progress on Grafana Alerting. GitHub users who are part of the Grafana Labs organization can see all issues, whereas Github users within our community can only see issues in public repositories. As most of our issues live in the Grafana public repository this allows us to be transparent by default.
Whilst we use a private repository for issues relating to our operational work, we use the same labels in all our alerting-related repositories so that we can use project filters easily. Having common labels in many repositories creates an incentive to have the same labels in other repositories, especially new ones, even if they do not relate to alerting. This growing commonality makes searching for issues across multiple repositories easier, which is particularly useful for our product managers.
Custom fields to create tailored views
A valuable feature of GitHub Projects is the ability to have different columns (custom fields) per view. This allows us to view not only smaller issues but also larger issues covering an entire quarter. Our team also handles engineering escalations that are worked at a faster pace compared to normal issues.
As a team, our three custom fields are:
Status: the default field for all issues except escalations (as mentioned above).
Quarter: used for bigger issues that include tasklists.
Escalation: used to capture more granular status of each escalation.
With these custom fields, we can have custom views, such as our epic view, which gives us a birds-eye view of our quarterly goals, and our escalations view, which lets us review the state of escalations that need engineering work.
The escalations view uses the escalation status custom field with special values such as “Waiting for release.”
Thanks to the adaptability of GitHub Projects, we finally have one ‘source-of-truth’ to reference normal issues, big issues, and escalations.
Enhancing projects with GitHub Actions
For escalations, which are urgent to solve, we also use GitHub Actions to notify us on Slack or use Grafana OnCall if this is a high priority escalation.
Combining GitHub Projects and GitHub Actions offers endless possibilities. Actions like github/issue-labeler allow us to have repositories shared by different teams with issues labeled automatically depending on keywords used in an issue. These labels are then used by other actions to add the issue to the right view or to send notifications to external systems. Opening the project and seeing that new relevant issues have been added automatically, ready for triage, feels like magic.
An issue labeled “alerting” and “prio/3” has been created by support in “grafana/support-escalations.” This adds the issue to the right project and notifies the current on-call on Slack via GitHub Actions.
We often have escalations related to features requested by customers. Being able to link to an escalation in an open source issue allows engineers and product managers to prioritize together on one platform while keeping this information confidential from GitHub users outside our organization.
These automations have been important in terms of engineers’ motivation and our productivity. For example, the Grafana Alerting team receives around five issues from support regarding escalations per week. During the last quarter of 2022, at any given time, the team had on average only four open escalations due to the automation motivating engineers to prioritize this work. This is a significant reduction from the average of 20 open escalations at any given time prior to our shift to GitHub Projects and GitHub Actions.
Combining GitHub Projects and GitHub Actions allows us to route feedback from various sources through the most relevant repos and then onto a single project.
GitHub Projects at scale
Since we started using GitHub Projects, our team has been growing. An important moment for me in our scaling was the creation of a new project for the team working on SLOs. Originally, this team had no escalations and a small number of engineers. We were able to easily make a copy of the ‘Alerting’ project, changing the filters to accommodate the new team’s repositories, too. The important question was whether the workflows we had for a big team would be too much for such a new team. The answer was yes, there were too many views, creating unnecessary overhead, but it was very easy to reduce the number of views to adapt to the new team’s needs. Using the existing project as a starting point for the SLO team enabled us to get a new project up and running fast.
After a year of using GitHub Projects, we have seen its ability to handle our different types of issues and to adapt to the needs of our various teams at Grafana Labs. We find GitHub Projects to be a flexible planning and tracking solution that enables engineers to stay focussed on code and gives issues more visibility. GitHub Projects keeps the burden for contributors low whilst still providing the views managers need to understand and plan team efforts. GitHub Projects is the only tool the Grafana Alerting team needs to do project planning.
Using rules
as code to help bridge the gaps between policy creation, its
implementation, and its, often unintended, effects on people was the
subject of a talk by
Pia Andrews on the first day of the inaugural
Everything Open conference in Melbourne, Australia. She
has long been exploring the space of open government,
and her talk was a report on what
she and others have been working on
over the last seven years. Everything Open is the successor
to the
long-running, well-regarded linux.conf.au (LCA); Andrews (then Pia Waugh) gave the opening keynote at LCA 2017 in
Hobart, Tasmania, and helped organize the 2007 event in Sydney.
Every generation of Amazon Linux distribution is secured, optimized for the cloud, and receives long-term AWS support. We built Amazon Linux 2023 on these principles, and we go even further. Deploying your workloads on Amazon Linux 2023 gives you three major benefits: a high-security standard, a predictable lifecycle, and a consistent update experience.
Let’s look at security first. Amazon Linux 2023 includes preconfigured security policies that make it easy for you to implement common industry guidelines. You can configure these policies at launch time or run time.
For example, you can configure the system crypto policy to enforce system-wide usage of a specific set of cipher suites, TLS versions, or acceptable parameters in certificates and key exchanges. Also, the Linux kernel has many hardening features enabled by default.
Amazon Linux 2023 makes it easier to plan and manage the operating system lifecycle. New Amazon Linux major versions will be available every two years. Major releases include new features and improvements in security and performance across the stack. The improvements might include major changes to the kernel, toolchain, GLib C, OpenSSL, and any other system libraries and utilities.
During those two years, a major release will receive an update every three months. These updates include security updates, bug fixes, and new features and packages. Each minor version is a cumulative list of updates that includes security and bug fixes in addition to new features and packages. These releases might include the latest language runtimes such as Python or Java. They might also include other popular software packages such as Ansible and Docker. In addition to these quarterly updates, security updates will be provided as soon as they are available.
Each major version, including 2023, will come with five years of long-term support. After the initial two-year period, each major version enters a three-year maintenance period. During the maintenance period, it will continue to receive security bug fixes and patches as soon as they are available. This support commitment gives you the stability you need to manage long project lifecycles.
The following diagram illustrates the lifecycle of Amazon Linux distributions:
Last—and this policy is by far my favorite—Amazon Linux provides you with deterministic updates through versioned repositories, a flexible and consistent update mechanism. The distribution locks to a specific version of the Amazon Linux package repository, giving you control over how and when you absorb updates. By default, and in contrast with Amazon Linux 2, a dnf update command will not update your installed packages (dnf is the successor to yum). This helps to ensure that you are using the same package versions across your fleet. All Amazon Elastic Compute Cloud (Amazon EC2) instances launched from an Amazon Machine Image (AMI) will have the same version of packages. Deterministic updates also promote usage of immutable infrastructure, where no infrastructure is updated after deployment. When an update is required, you update your infrastructure as code scripts and redeploy a new infrastructure. Of course, if you really want to update your distribution in place, you can point dnf to an updated package repository and update your machine as you do today. But did I tell you this is not a good practice for production workloads? I’ll share more technical details later in this blog post.
How to Get Started Getting started with Amazon Linux 2023 is no different than with other Linux distributions. You can use the EC2 run-instances API, the AWS Command Line Interface (AWS CLI), or the AWS Management Console, and one of the four Amazon Linux 2023 AMIs that we provide. We support two machine architectures (x86_64 and Arm) and two sizes (standard and minimal). Minimal AMIs contain the most basic tools and utilities to start the OS. The standard version comes with the most commonly used applications and tools installed.
To retrieve the latest AMI ID for a specific Region, you can use AWS Systems Managerget-parameter API and query the /aws/service/ami-amazon-linux-latest/<alias> parameter.
Be sure to replace <alias> with one of the four aliases available:
For arm64 architecture (standard AMI): al2023-ami-kernel-default-arm64
For arm64 architecture (minimal AMI): al2023-ami-minimal-kernel-default-arm64
For x86_64 architecture (standard AMI): al2023-ami-kernel-default-x86_64
For x86_64 architecture (minimal AMI): al2023-ami-minimal-kernel-default-x86_64
For example, to search for the latest Arm64 full distribution AMI ID, I open a terminal and enter:
When the instance is launched, and if the associated security group allows SSH (TCP 22) connections, I can connect to the machine:
~ ssh [email protected]
Warning: Permanently added '3.145.19.213' (ED25519) to the list of known hosts.
   ,     #_
   ~\_  ####_        Amazon Linux 2023
  ~~  \_#####\       Preview
  ~~     \###|
  ~~       \#/ ___   https://aws.amazon.com/linux/amazon-linux-2023
   ~~       V~' '->
    ~~~         /
      ~~._.   _/
         _/ _/
       _/m/'
Last login: Tue Feb 28 14:14:44 2023 from 81.49.148.9
[ec2-user@ip-172-31-9-76 ~]$ uname -a
Linux ip-172-31-9-76.us-east-2.compute.internal 6.1.12-19.43.amzn2023.aarch64 #1 SMP Thu Feb 23 23:37:18 UTC 2023 aarch64 aarch64 aarch64 GNU/Linux
We also distribute Amazon Linux 2023 as Docker images. The Amazon Linux 2023 container image is built from the same software components that are included in the Amazon Linux 2023 AMI. The container image is available for use in any environment as a base image for Docker workloads. If you’re using Amazon Linux for applications in EC2, you can containerize your applications with the Amazon Linux container image.
~ docker run --rm -it public.ecr.aws/amazonlinux/amazonlinux:2023 /bin/bash
Unable to find image 'public.ecr.aws/amazonlinux/amazonlinux:2023' locally
2023: Pulling from amazonlinux/amazonlinux
b4265814d5cf: Pull complete
Digest: sha256:bbd7a578cff9d2aeaaedf75eb66d99176311b8e3930c0430a22e0a2d6c47d823
Status: Downloaded newer image for public.ecr.aws/amazonlinux/amazonlinux:2023
bash-5.2# uname -a
Linux 9d5b45e9f895 5.15.49-linuxkit #1 SMP PREEMPT Tue Sep 13 07:51:32 UTC 2022 aarch64 aarch64 aarch64 GNU/Linux
bash-5.2# exit
When pulling from Docker Hub, you can use this command to pull the image: docker pull amazonlinux:2023.
What Are the Main Differences Compared to Amazon Linux 2? Amazon Linux 2023 has some differences compared to Amazon Linux 2. The documentation explains these differences in detail. The two differences I would like to focus on are dnf and the package management policies.
AL2023 comes with Fedora’s dnf, the successor to yum. But don’t worry, dnf provides similar commands as yum to search, install, or remove packages. Where you used to run the commands yum list or yum install httpd, you may now run dnf list or dnf install httpd. For convenience, we create a symlink for /usr/bin/yum, so you can run your scripts unmodified.
$ which yum
/usr/bin/yum
$ ls -al /usr/bin/yum
lrwxrwxrwx. 1 root root 5 Jun 19 18:06 /usr/bin/yum -> dnf-3
The biggest difference, in my opinion, is the deterministic updates through versioned repositories. By default, the software repository is locked to the AMI version. This means that a dnf update command will not return any new packages to install. Versioned repositories give you the assurance that all machines started from the same AMI ID are identical. Your infrastructure will not deviate from the baseline.
$ sudo dnf update
Last metadata expiration check: 0:14:10 ago on Tue Feb 28 14:12:50 2023.
Dependencies resolved.
Nothing to do.
Complete!
Yes, but what if you want to update a machine? You have two options to update an existing machine. The cleanest one for your production environment is to create duplicate infrastructure based on new AMIs. As I mentioned earlier, we publish updates for every security fix and a consolidated update every three months for two years after the initial release. Each update is provided as a set of AMIs and their corresponding software repository.
For smaller infrastructure, such as test or development machines, you might choose to update the operating system or individual packages in place as well. This is a three-step process:
first, list the available updated software repositories;
second, point dnf to a specific software repository;
and third, update your packages.
To show you how it works, I purposely launched an EC2 instance with an “old” version of Amazon Linux 2023 from February 2023. I first run dnf check-release-update to list the available updated software repositories.
$ dnf check-release-update
WARNING:
  A newer release of "Amazon Linux" is available.

  Available Versions:

  Version 2023.0.20230308:
    Run the following command to upgrade to 2023.0.20230308:

      dnf upgrade --releasever=2023.0.20230308

    Release notes:
     https://docs.aws.amazon.com/linux/al2023/release-notes/relnotes.html
Then, I might either update the full distribution using dnf upgrade --releasever=2023.0.20230308 or point dnf to the updated repository to select individual packages.
Finally, I might run a dnf update <package_name> command to update a specific package.
This might look like overkill for a simple machine, but when managing enterprise infrastructure or large-scale fleets of instances, this facilitates the management of your fleet by ensuring that all instances run the same version of software packages. It also means that the AMI ID is now something that you can fully run through your CI/CD pipelines for deployment and that you have a way to roll AMI versions forward and backward according to your schedule.
Where is Fedora? When looking for a base to serve as a starting point for Amazon Linux 2023, Fedora was the best choice. We found that Fedora’s core tenets (Freedom, Friends, Features, First) resonate well with our vision for Amazon Linux. However, Amazon Linux focuses on a long-term, stable OS for the cloud, which is a notable different release cycle and lifecycle than Fedora. Amazon Linux 2023 provides updated versions of open-source software, a larger variety of packages, and frequent releases.
Amazon Linux 2023 isn’t directly comparable to any specific Fedora release. The Amazon Linux 2023 GA version includes components from Fedora 34, 35, and 36. Some of the components are the same as the components in Fedora, and some are modified. Other components more closely resemble the components in CentOS Stream 9 or were developed independently. The Amazon Linux kernel, on its side, is sourced from the long-term support options that are on kernel.org, chosen independently from the kernel provided by Fedora.
Like every good citizen in the open-source community, we give back and contribute our changes to upstream distributions and sources for the benefit of the entire community. Amazon Linux 2023 itself is open source. The source code for all RPM packages that are used to build the binaries that we ship are available through the SRPM yum repository (sudo dnf install -y 'dnf-command(download)' && dnf download --source bash)
One More Thing: Amazon EBS Gp3 Volumes Amazon Linux 2023 AMIs use gp3 volumes by default.
Gp3 is the latest generation general-purpose solid-state drive (SSD) volume for Amazon Elastic Block Store (Amazon EBS). Gp3 provides 20 percent lower storage costs compared to gp2. Gp3 volumes deliver a baseline performance of 3,000 IOPS and 125MB/s at any volume size. What I particularly like about gp3 volumes is that I can now provision performance independently of capacity. When using gp3 volumes, I can now increase IOPS and throughput without incurring charges for extra capacity that I don’t actually need.
With the availability of gp3-backed AL2023 AMIs, this is the first time a gp3-backed Amazon Linux AMI is available. Gp3-backed AMIs have been a common customer request since gp3 was launched in 2020. It is now available by default.
Price and Availability Amazon Linux 2023 is provided at no additional charge. Standard Amazon EC2 and AWS charges apply for running EC2 instances and other services. This distribution includes full support for five years. When deploying on AWS, our support engineers will provide technical support according to the terms and conditions of your AWS Support plan. AMIs are available in all AWS Regions.
Amazon Linux is the most used Linux distribution on AWS, with hundreds of thousands of customers using Amazon Linux 2. Dozens of Independent Software Vendors (ISVs) and hardware partners are supporting Amazon Linux 2023 today. You can adopt this new version with the confidence that the partner tools you rely on are likely to be supported. We are excited about this release, which brings you an even higher level of security, a predictable release lifecycle, and a consistent update experience.
This is a guest post co-written with Gowtham Dandu from Infomedia.
Infomedia Ltd (ASX:IFM) is a leading global provider of DaaS and SaaS solutions that empowers the data-driven automotive ecosystem. Infomedia’s solutions help OEMs, NSCs, dealerships and 3rd party partners manage the vehicle and customer lifecycle. They are used by over 250,000 industry professionals, across 50 OEM brands and in 186 countries to create a convenient customer journey, drive dealer efficiencies and grow sales.
In this post, we share how Infomedia built a serverless data pipeline with change data capture (CDC) using AWS Glue and Apache Hudi.
Infomedia was looking to build a cloud-based data platform to take advantage of highly scalable data storage with flexible and cloud-native processing tools to ingest, transform, and deliver datasets to their SaaS applications. The team wanted to set up a serverless architecture with scale-out capabilities that would allow them to optimize time, cost, and performance of the data pipelines and eliminate most of the infrastructure management.
To serve data to their end-users, the team wanted to develop an API interface to retrieve various product attributes on demand. Performance and scalability of both the data pipeline and API endpoint were key success criteria. The data pipeline needed to have sufficient performance to allow for fast turnaround in the event that data issues needed to be corrected. Finally, the API endpoint performance was important for end-user experience and customer satisfaction. When designing the data processing pipeline for the attribute API, the Infomedia team wanted to use a flexible and open-source solution for processing data workloads with minimal operational overhead.
They saw an opportunity to use AWS Glue, which offers a popular open-source big data processing framework, and Apache Spark, in a serverless environment for end-to-end pipeline development and deployment.
Solution overview
The solution involved ingesting data from various third-party sources in different formats, processing to create a semantic layer, and then exposing the processed dataset as a REST API to end-users. The API retrieves data at runtime from an Amazon Aurora PostgreSQL-Compatible Edition database for end-user consumption. To populate the database, the Infomedia team developed a data pipeline using Amazon Simple Storage Service (Amazon S3) for data storage, AWS Glue for data transformations, and Apache Hudi for CDC and record-level updates. They wanted to develop a simple incremental data processing pipeline without having to update the entire database each time the pipeline ran. The Apache Hudi framework allowed the Infomedia team to maintain a golden reference dataset and capture changes so that the downstream database could be incrementally updated in a short timeframe.
To implement this modern data processing solution, Infomedia’s team chose a layered architecture with the following steps:
The raw data originates from various third-party sources and is a collection of flat files with a fixed width column structure. The raw input data is stored in Amazon S3 in JSON format (called the bronze dataset layer).
The raw data is converted to an optimized Parquet format using AWS Glue. The Parquet data is stored in a separate Amazon S3 location and serves as the staging area during the CDC process (called the silver dataset layer). The Parquet format results in improved query performance and cost savings for downstream processing.
AWS Glue reads the Parquet file from the staging area and updates Apache Hudi tables stored in Amazon S3 (the golden dataset layer) as part of incremental data processing. This process helps create mutable datasets on Amazon S3 to store the versioned and latest set of records.
Finally, AWS Glue is used to populate Amazon Aurora PostgreSQL-Compatible Edition with the latest version of the records. This dataset is used to serve the API endpoint. The API itself is a Spring Java application deployed as a Docker container in an Amazon Elastic Container Service (Amazon ECS) AWS Fargate environment.
The following diagram illustrates this architecture.
AWS Glue and Apache Hudi overview
AWS Glue is a serverless data integration service that makes it easy to prepare and process data at scale from a wide variety of data sources. With AWS Glue, you can ingest data from multiple data sources, extract and infer schema, populate metadata in a centralized data catalog, and prepare and transform data for analytics and machine learning. AWS Glue has a pay-as-you-go model with no upfront costs, and you only pay for resources that you consume.
Apache Hudi is an open-source data management framework used to simplify incremental data processing and data pipeline development by providing record-level insert, update, upsert, and delete capabilities. It allows you to comply with data privacy laws, manage CDC operations, reinstate late-arriving data, and roll back to a particular point in time. You can use AWS Glue to build a serverless Apache Spark-based data pipeline and take advantage of the AWS Glue native connector for Apache Hudi at no cost to manage CDC operations with record-level insert, updates, and deletes.
Solution benefits
Since the start of Infomedia’s journey with AWS Glue, the Infomedia team has experienced several benefits over the self-managed extract, transform, and load (ETL) tooling. With the horizontal scaling of AWS Glue, they were able to seamlessly scale the compute capacity of their data pipeline workloads by a factor of 5. This allowed them to increase both the volume of records and the number of datasets they could process for downstream consumption. They were also able to take advantage of AWS Glue built-in optimizations, such as pre-filtering using pushdown predicates, which allowed the team to save valuable engineering time tuning the performance of data processing jobs.
In addition, Apache Spark-based AWS Glue enabled developers to author jobs using concise Spark SQL and dataset APIs. This allowed for rapid upskilling of developers who are already familiar with database programming. Because developers are working with higher-level constructs across entire datasets, they spend less time solving for low-level technical implementation details.
Also, the AWS Glue platform has been cost-effective when compared against running self-managed Apache Spark infrastructure. The team did an initial analysis that showed an estimated savings of 70% over running a dedicated Spark EC2 infrastructure for their workload. Furthermore, the AWS Glue Studio job monitoring dashboard provides the Infomedia team with detailed job-level visibility that makes it easy to get a summary of the job runs and understand data processing costs.
Conclusion and next steps
Infomedia will continue to modernize their complex data pipelines using the AWS Glue platform and other AWS Analytics services. Through integration with services such as AWS Lake Formation and the AWS Glue Data Catalog, the Infomedia team plans to maintain reference primary datasets and democratize access to high-value datasets, allowing for further innovation.
If you would like to learn more, please visit AWS Glue and AWS Lake Formation to get started on your data integration journey.
About the Authors
Gowtham Dandu is an Engineering Lead at Infomedia Ltd with a passion for building efficient and effective solutions on the cloud, especially involving data, APIs, and modern SaaS applications. He specializes in building microservices and data platforms that are cost-effective and highly scalable.
Praveen Kumar is a Specialist Solution Architect at AWS with expertise in designing, building, and implementing modern data and analytics platforms using cloud-native services. His areas of interests are serverless technology, streaming applications, and modern cloud data warehouses.
This is a guest post co-written with Udayasimha Theepireddy from Elastic.
Processing and analyzing log and Internet of Things (IoT) data can be challenging, especially when dealing with large volumes of real-time data. Elastic and Amazon Kinesis Data Firehose are two powerful tools that can help make this process easier. For example, by using Kinesis Data Firehose to ingest data from IoT devices, you can stream data directly into Elastic for real-time analysis. This can help you identify patterns and anomalies in the data as they happen, allowing you to take action in real time. Additionally, by using Elastic to store and analyze log data, you can quickly search and filter through large volumes of log data to identify issues and troubleshoot problems.
In this post, we explore how to integrate Elastic and Kinesis Data Firehose to streamline log and IoT data processing and analysis. We walk you through a step-by-step example of how to send VPC flow logs to Elastic through Kinesis Data Firehose.
Solution overview
Elastic is an AWS ISV Partner that helps you find information, gain insights, and protect your data when you run on AWS. Elastic offers enterprise search, observability, and security features that are built on a single, flexible technology stack that can be deployed anywhere.
Kinesis Data Firehose is a popular service that delivers streaming data from over 20 AWS services such as AWS IoT Core and Amazon CloudWatch logs to over 15 analytical and observability tools such as Elastic. Kinesis Data Firehose provides a fast and easy way to send your VPC flow logs data to Elastic in minutes without a single line of code and without building or managing your own data ingestion and delivery infrastructure.
VPC flow logs capture the traffic information going to and from your network interfaces in your VPC. With the launch of Kinesis Data Firehose support to Elastic, you can analyze your VPC flow logs with just a few clicks. Kinesis Data Firehose provides a true end-to-end serverless mechanism to deliver your flow logs to Elastic, where you can use Elastic Dashboards to search through those logs, create dashboards, detect anomalies, and send alerts. VPC flow logs help you to answer questions like what percentage of your traffic is getting dropped, and how much traffic is getting generated for specific sources and destinations.
Integrating Elastic and Kinesis Data Firehose is a straightforward process. There are no agents and beats. Simply configure your Firehose delivery stream to send its data to Elastic’s endpoint.
The following diagram depicts this specific configuration of how to ingest VPC flow logs via Kinesis Data Firehose into Elastic.
In the past, users would have to use an AWS Lambda function to transform the incoming data from VPC flow logs into an Amazon Simple Storage Service (Amazon S3) bucket before loading it into Kinesis Data Firehose or create a CloudWatch Logs subscription that sends any incoming log events that match defined filters to the Firehose delivery stream.
With this new integration, you can set up this configuration directly from your VPC flow logs to Kinesis Data Firehose and into Elastic Cloud. (Note that Elastic Cloud must be deployed on AWS.)
Let’s walk through the details of configuring Kinesis Data Firehose and Elastic, and demonstrate ingesting data.
Prerequisites
To set up this demonstration, make sure you have the following prerequisites:
An account on Elastic Cloud and a deployed stack on AWS. Deploying this on AWS is required for Kinesis Data Firehose log ingestion. For instructions, refer to Installing the Elastic Stack.
An AWS account with permissions to pull the necessary data from AWS.
VPC flow logs enabled for the VPC where the application is deployed and configured to send data to Kinesis Data Firehose.
Once logged in to Elastic Cloud, create a deployment on AWS. It’s important to ensure that the deployment is on AWS. The Firehose delivery stream connects specifically to an endpoint that needs to be on AWS.
After you create your deployment, copy the Elasticsearch endpoint to use in a later step.
The endpoint should be an AWS endpoint, such as https://thevaa-cluster-01.es.us-east-1.aws.found.io.
Enable Elastic’s AWS integration
In your deployment’s Elastic Integration section, navigate to the AWS integration and choose Install AWS assets.
Configure a Firehose delivery stream
Create a new delivery stream on the Kinesis Data Firehose console. This is where you provide the endpoint you saved earlier. Refer to the following screenshot for the destination settings, and for more details, refer to Choose Elastic for Your Destination.
In this example, we are pulling in VPC flow logs via the data stream parameter we added (logs-aws.vpcflow-default). The parameter es_datastream_name can be configured with one of the following types of logs:
Configure VPC flow logs to send to Kinesis Data Firehose
In the VPC for the application you deployed, you need to configure your VPC flow logs and point them to the Firehose delivery stream.
Validate the VPC flow logs
In the Elastic Observability view of the log streams, you should see the VPC flow logs coming in after a few minutes, as shown in the following screenshot.
Analyze VPC flow logs in Elastic
Now that you have VPC flow logs in Elastic Cloud, how can you analyze them? There are several analyses you can perform on the VPC flow log data:
Use Elastic’s Analytics Discover capabilities to manually analyze the data
Use Elastic Observability’s anomaly feature to identify anomalies in the logs
Use an out-of-the-box dashboard to further analyze the data
Use Elastic’s Analytics Discover to manually analyze data
In Elastic Analytics, you can search and filter your data, get information about the structure of the fields, and display your findings in a visualization. You can also customize and save your searches and place them on a dashboard.
For a complete understanding of Discover and all of Elastic’s Analytics capabilities, refer to Discover.
For VPC flow logs, it’s important to understand the following:
How many logs were accepted or rejected
Where potential security violations occur (source IPs from outside the VPC)
What port is generally being queried
For our example, we filter the logs on the following:
Delivery stream name – AWS-3-TIER-APP-VPC-LOGS
VPC flow log action – REJECT
Time frame – 5 hours
VPC network interface – Webserver 1 and Webserver 2 interfaces
We want to see what IP addresses are trying to hit our web servers. From that, we want to understand which IP addresses we’re getting the most REJECT actions from. We simply find the source.ip field and can quickly get a breakdown that shows 185.156.73.54 is the most rejected for the last 3 or more hours we’ve turned on VPC flow logs.
Additionally, we can create a visualization by choosing Visualize. We get the following donut chart, which we can add to a dashboard.
Additionally to IP addresses, we want to also see what port is being hit on our web servers.
We select the destination port field, and the pop-up shows us that port 8081 is being targeted. This port is generally used for the administration of Apache Tomcat. This is a potential security issue, however port 8081 is turned off for outside traffic, hence the REJECT.
Detect anomalies in Elastic Observability logs
In addition to Discover, Elastic Observability provides the ability to detect anomalies on logs using machine learning (ML). The feature has the following options:
For our VPC flow log, we enabled both features. When we look at what was detected for anomalous log entry rates, we get the following results.
Elastic immediately detected a spike in logs when we turned on VPC flow logs for our application. The rate change is being detected because we’re also ingesting VPC flow logs from another application for a couple of days prior to adding the application in this post.
We can drill down into this anomaly with ML and analyze further.
To learn more about the ML analysis you can utilize with your logs, refer to Machine learning.
Because we know that a spike exists, we can also use the Elastic AIOps Labs Explain Log Rate Spikes capability. Additionally, we’ve grouped them to see what is causing some of the spikes.
In the preceding screenshot, we can observe that a specific network interface is sending more VPC log flows than others. We can drill down into this further in Discover.
Use the VPC flow log dashboard
Finally, Elastic also provides an out-of-the-box dashboard to show the top IP addresses hitting your VPC, geographically where they are coming from, the time series of the flows, and a summary of VPC flow log rejects within the time frame.
You can enhance this baseline dashboard with the visualizations you find in Discover, as we discussed earlier.
Conclusion
This post demonstrated how to configure an integration with Kinesis Data Firehose and Elastic for efficient infrastructure monitoring of VPC flow logs in Elastic Kibana dashboards. Elastic offers flexible deployment options on AWS, supporting software as a service (SaaS), AWS Marketplace, and bring your own license (BYOL) deployments. Elastic also provides AWS Marketplace private offers. You have the option to deploy and run the Elastic Stack yourself within your AWS account, either free or with a paid subscription from Elastic. To get started, visit the Kinesis Data Firehose console and specify Elastic as the destination. To learn more, explore the Amazon Kinesis Data Firehose Developer Guide.
About the Authors
Udayasimha Theepireddy is an Elastic Principal Solution Architect, where he works with customers to solve real world technology problems using Elastic and AWS services. He has a strong background in technology, business, and analytics.
Antony Prasad Thevaraj is a Sr. Partner Solutions Architect in Data and Analytics at AWS. He has over 12 years of experience as a Big Data Engineer, and has worked on building complex ETL and ELT pipelines for various business units.
Mostafa Mansour is a Principal Product Manager – Tech at Amazon Web Services where he works on Amazon Kinesis Data Firehose. He specializes in developing intuitive product experiences that solve complex challenges for customers at scale. When he’s not hard at work on Amazon Kinesis Data Firehose, you’ll likely find Mostafa on the squash court, where he loves to take on challengers and perfect his dropshots.
Security teams must continuously contort their efforts to effectively respond to the growing volume of cyberthreats. These constantly shifting methods in the security operations center (SOC) can be difficult to manage in the face of emerging external threats—it can be like keeping multiple spinning plates in the air at once.
As the world continues to lean into the convenience of the digital age, cyberthreats continue to rise. Greater visibility is needed. Accurate automation is needed. And enhancements to every organization’s overall security posture are most certainly needed to stay secure in the global economy.
Intelligence when you need it
The more contextualized alerts and insight you can gain on a potential threat, the better positioned you’ll be to mitigate the threat before it can have a tangible impact on the business. Threat Command from Rapid7 was specifically built to help security organizations gain clarity about external threats. Can it see around corners? Almost.
Threat Command produced an ROI of more than 300%! The characteristics of the composite organization used for this calculation were based on real-life customer interviews Forrester conducted within their Total Economic Impact (TEI) framework. This representative organization is described as a $5.7 billion global enterprise consisting of 7,500 employees and headquartered in North America. The study concluded that this business realized 311% ROI over three years while also fending off threats with a solution that prioritizes:
Immediate value and the ability to get up and running quickly
More active responses with agile detection and automated alert responses
Simplified workflows that leverage mapping capabilities to accelerate investigations
All of this translates into greater visibility into threats—before their truly concussive effects are felt—which can lead to significantly reduced aftershocks of cyberattacks.
Benefits and other findings
Threat Command reduced the likelihood of a major security breach by up to 70%. The composite organization was able to realize significant efficiencies—and cost savings—leading to a considerable reduction in the probability of a breach event. The Forrester Consulting study states:
“By implementing Threat Command, the composite organization gains greater efficiency to detect, investigate, respond to, and remediate cyberattacks… Having Threat Command as a part of its security environment has the effect of lowering the likelihood of successful breaches by up to 70% over the course of three years and decreasing the impact of cyberattacks. This results in up to $1.1 million (PV) in savings over three years.”
Organizations were also able to leverage Threat Command to lower signal-to-noise alert ratio, as well as proactively identify and remediate threats before they morph into significant business impact. Indeed, automation helped in this area and led to time savings. A study interviewee—the principal threat intelligence analyst for a financial services firm—estimated three analysts on the security team saved three to four hours a day after implementing Threat Command.
“We were having a lot of trouble distinguishing relevant threats from noise. It was a manual approach of pulling the information from these sources … It was very reactive.”—Principal threat intelligence analyst, financial services
Remediation efficiency
Threat Command delivered a 75% reduction in time for investigation, threat hunting, and analysis. When looked at in terms of workforce, this helped organizations avoid the cost of bringing on additional headcount due to Threat Command’s comprehensive detection and user access to Rapid7’s internal SOC and remediation teams.
What about security posture?
Threat Command created benefits of $1.88 million over three years against costs of $457,000. We believe that with numbers like that, employees would benefit, shareholders would be happy, and the company would make progress toward meeting its financial goals.
But threats still loom. So, how did interviewees’ overall security postures look after implementing Threat Command? They experienced the following gains:
More efficient security processes
Personalized alerts on potential threats
Rapid takedowns of accounts and domains from the dark web
Greater accounting of all digital assets
Transition from a reactive to proactive approach for threat intelligence and remediation
Make intelligence intelligent
With regard to securing an ever-expanding attack surface, information means nothing if it can’t be interpreted and acted upon. Threat Command from Rapid7 can supercharge your ability to turn intelligence into results-focused action with faster detection and automated alert responses across your environment.
There are lots of numbers in this study, and we love that. It’s great to see proof that a solution is capable of helping customers become more confident in their security postures. But Rapid7’s commitment to partnering with our customers goes beyond the numbers. We’ll never stop innovating on the effectiveness of our products and services to proactively defend against—and defeat—the growing volume of global threats.
For a deep-dive into The Total Economic Impact(™) of Rapid7 Threat Command for Digital Risk Protection and Threat Intelligence, download the study now.
The collective thoughts of the interwebz
Manage Consent
To provide the best experiences, we use technologies like cookies to store and/or access device information. Consenting to these technologies will allow us to process data such as browsing behavior or unique IDs on this site. Not consenting or withdrawing consent, may adversely affect certain features and functions.
Functional
Always active
The technical storage or access is strictly necessary for the legitimate purpose of enabling the use of a specific service explicitly requested by the subscriber or user, or for the sole purpose of carrying out the transmission of a communication over an electronic communications network.
Preferences
The technical storage or access is necessary for the legitimate purpose of storing preferences that are not requested by the subscriber or user.
Statistics
The technical storage or access that is used exclusively for statistical purposes.The technical storage or access that is used exclusively for anonymous statistical purposes. Without a subpoena, voluntary compliance on the part of your Internet Service Provider, or additional records from a third party, information stored or retrieved for this purpose alone cannot usually be used to identify you.
Marketing
The technical storage or access is required to create user profiles to send advertising, or to track the user on a website or across several websites for similar marketing purposes.


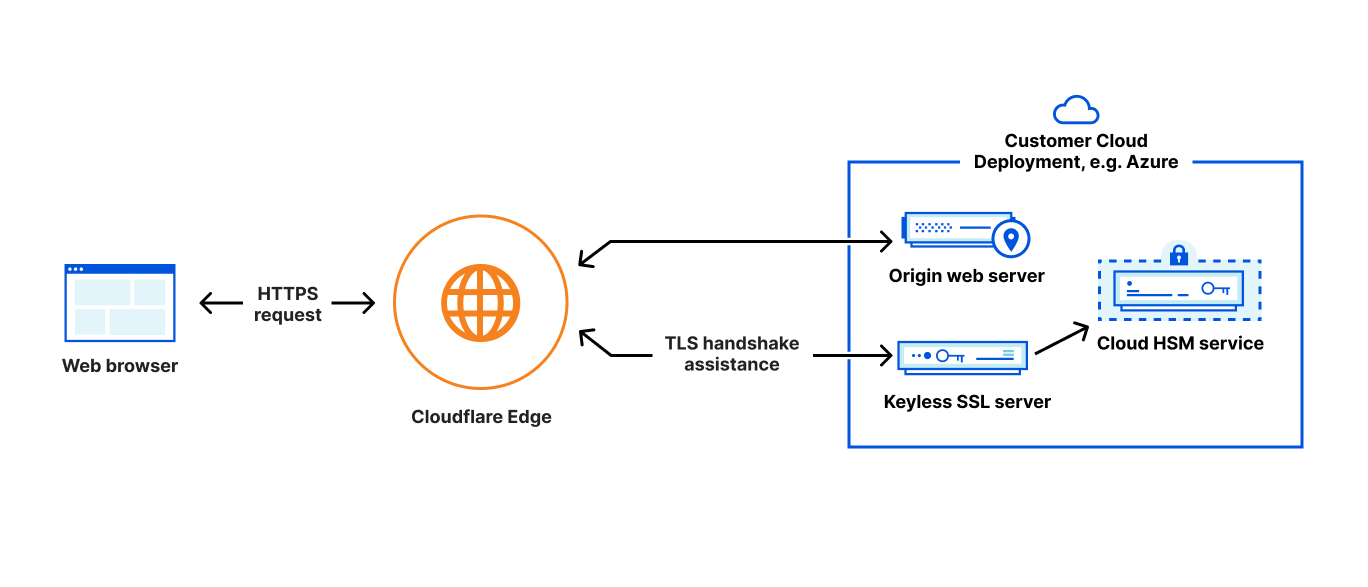
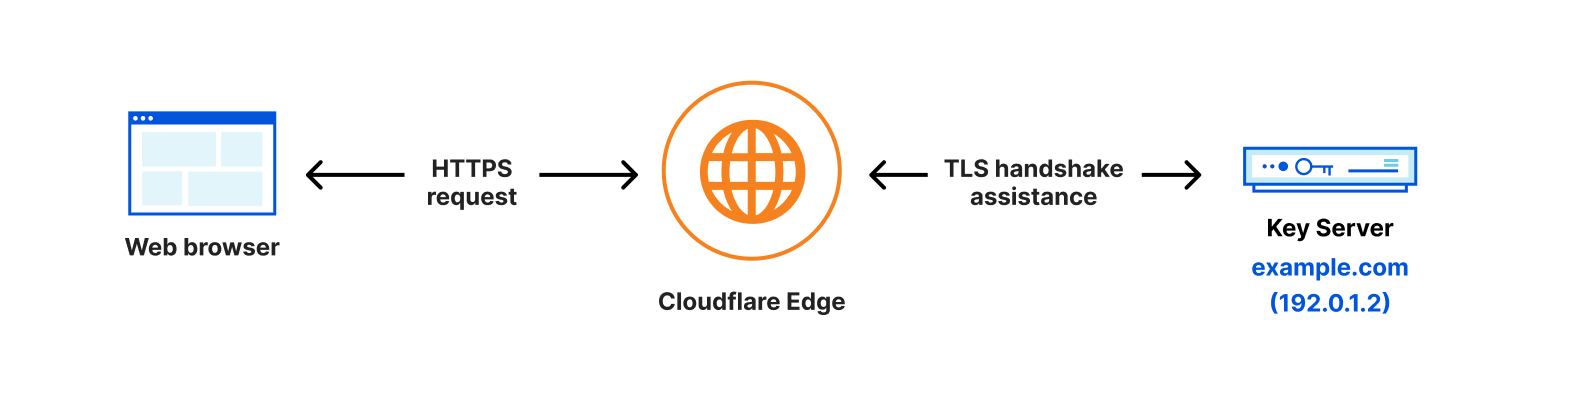
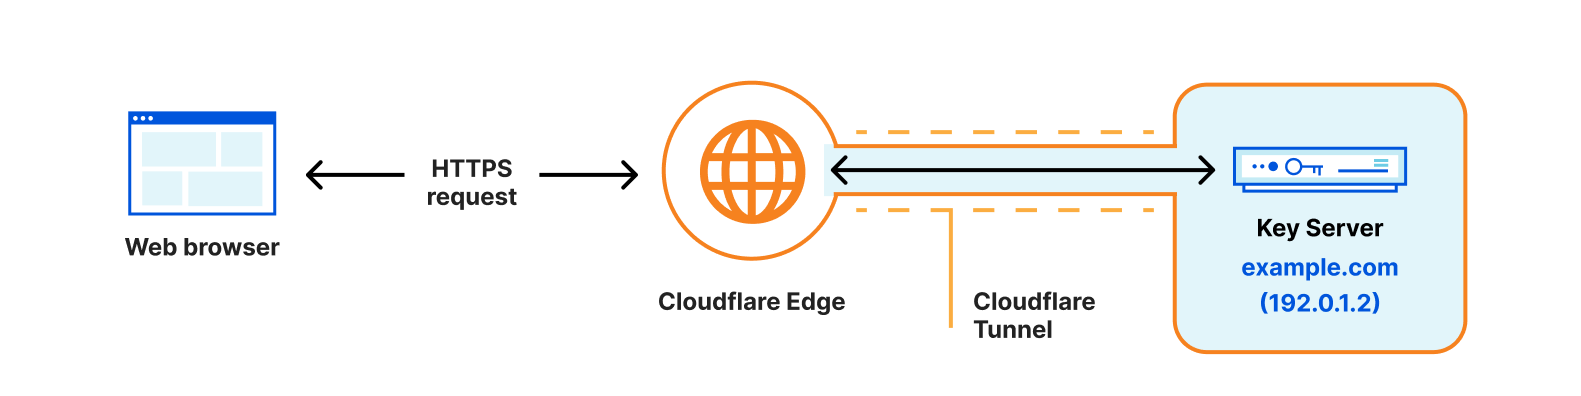


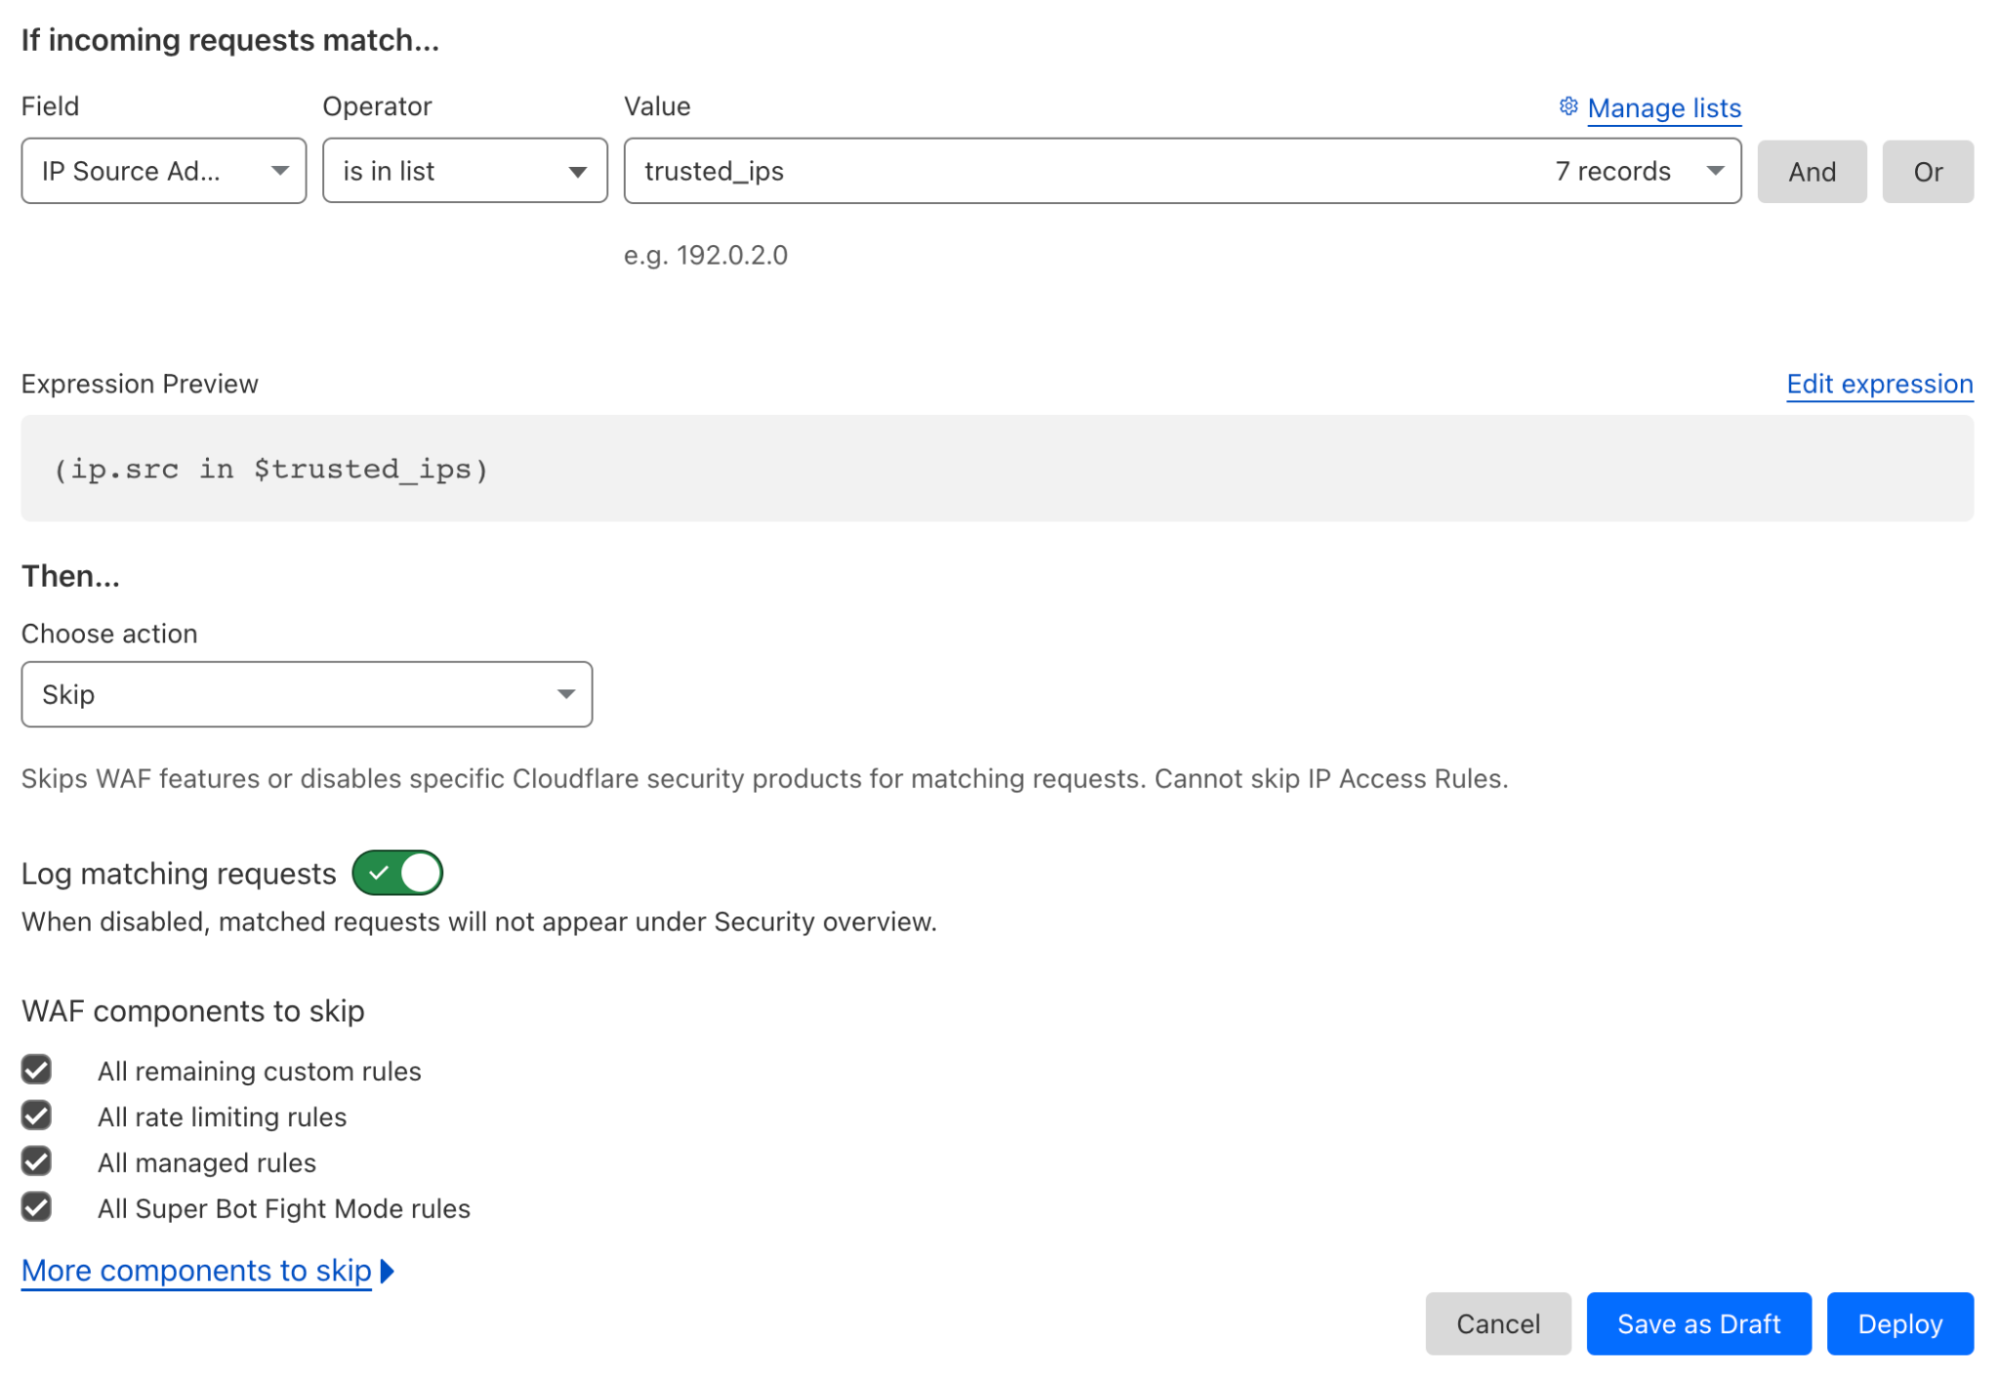
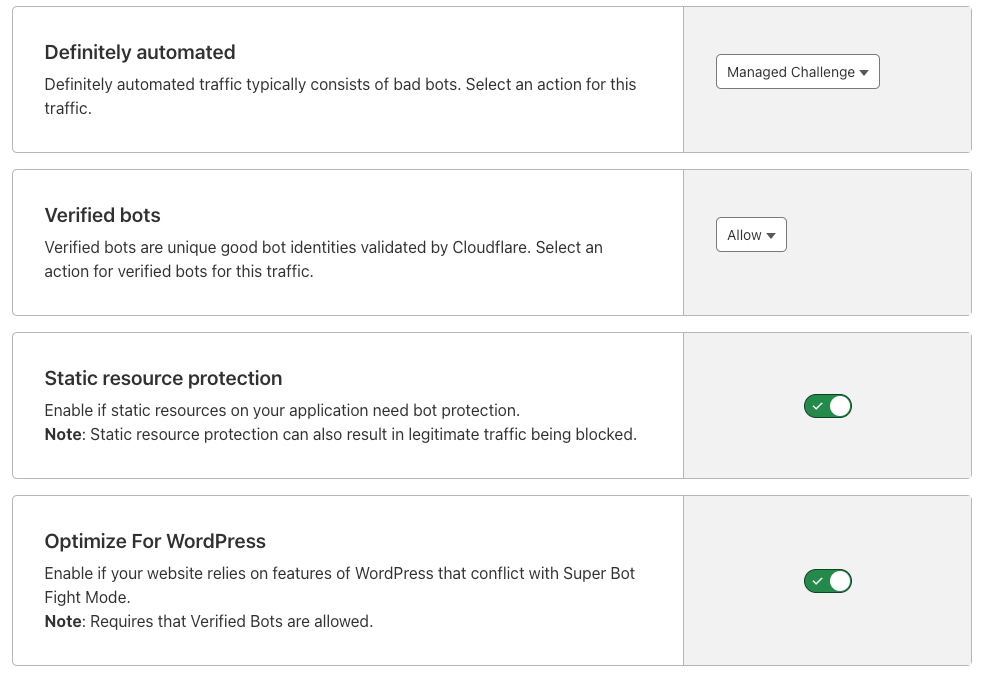


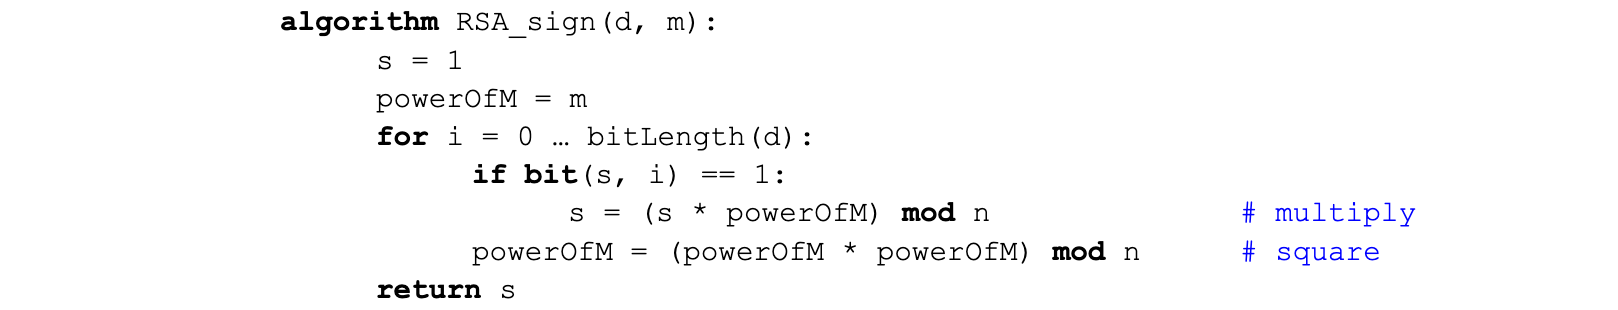
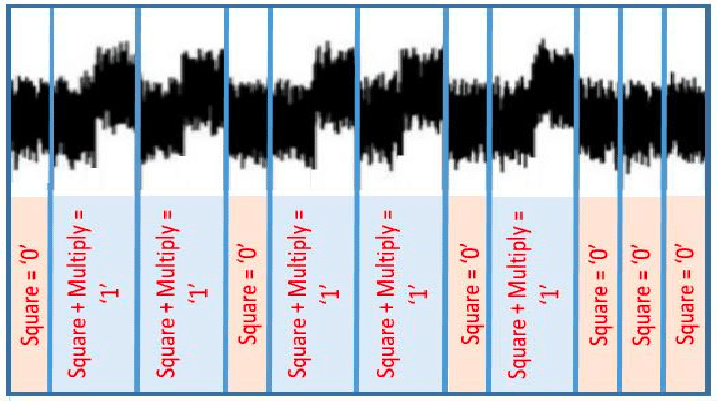
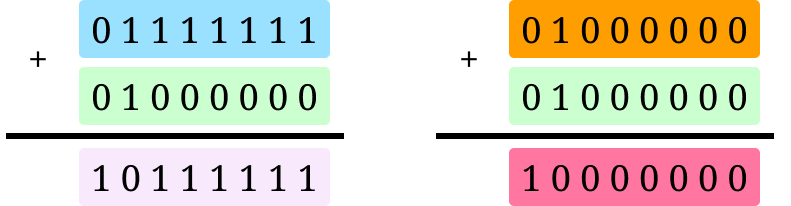
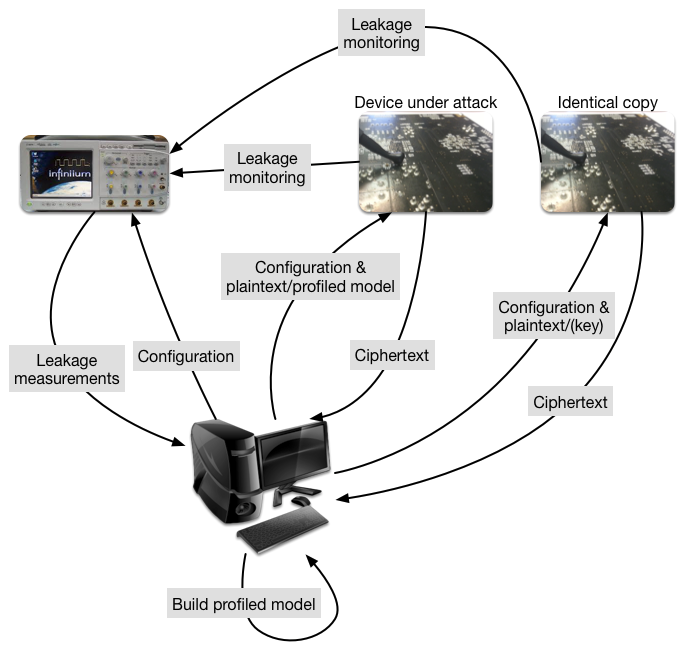
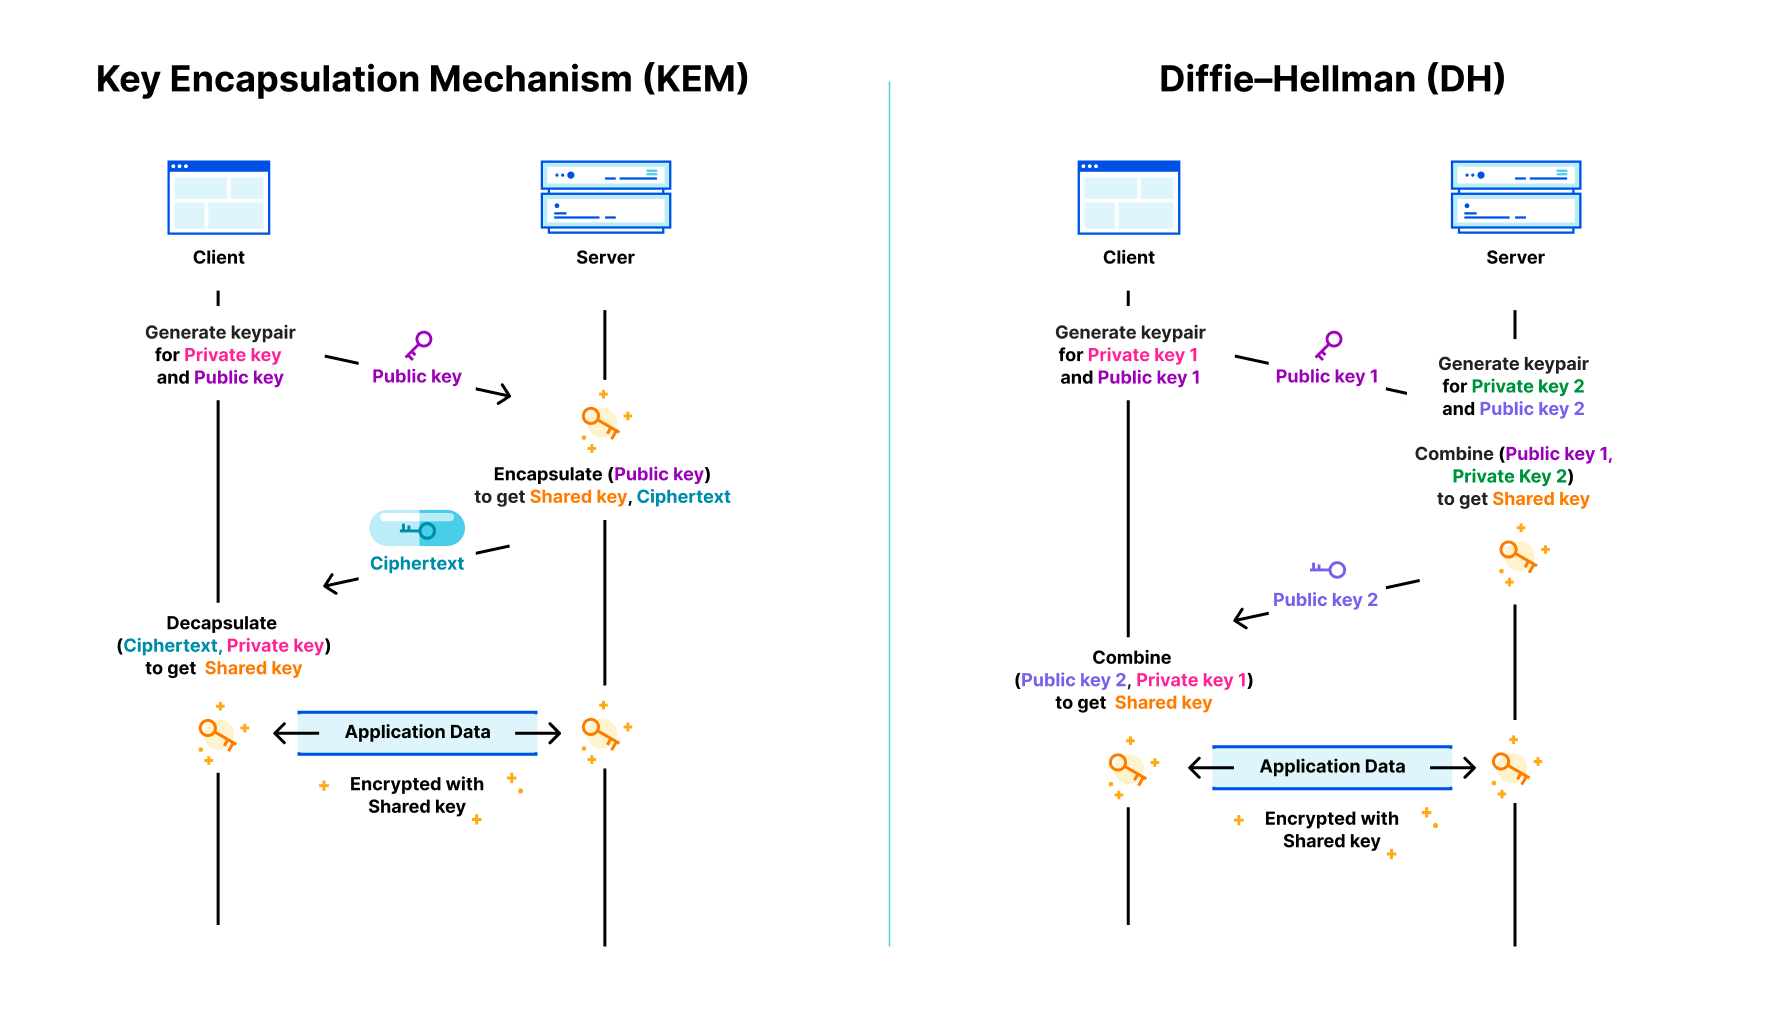

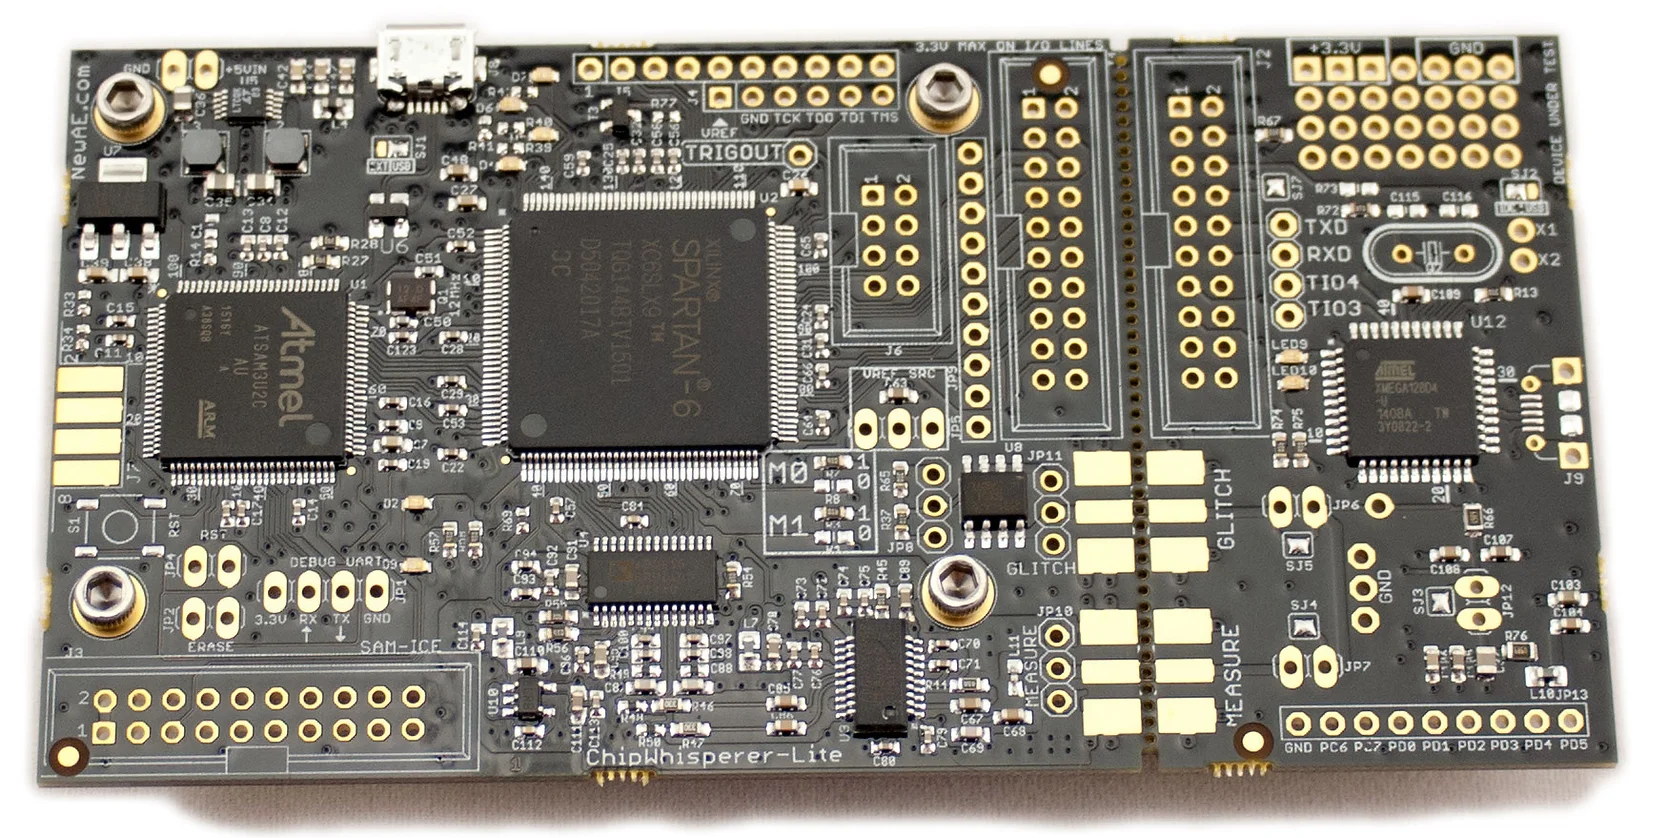


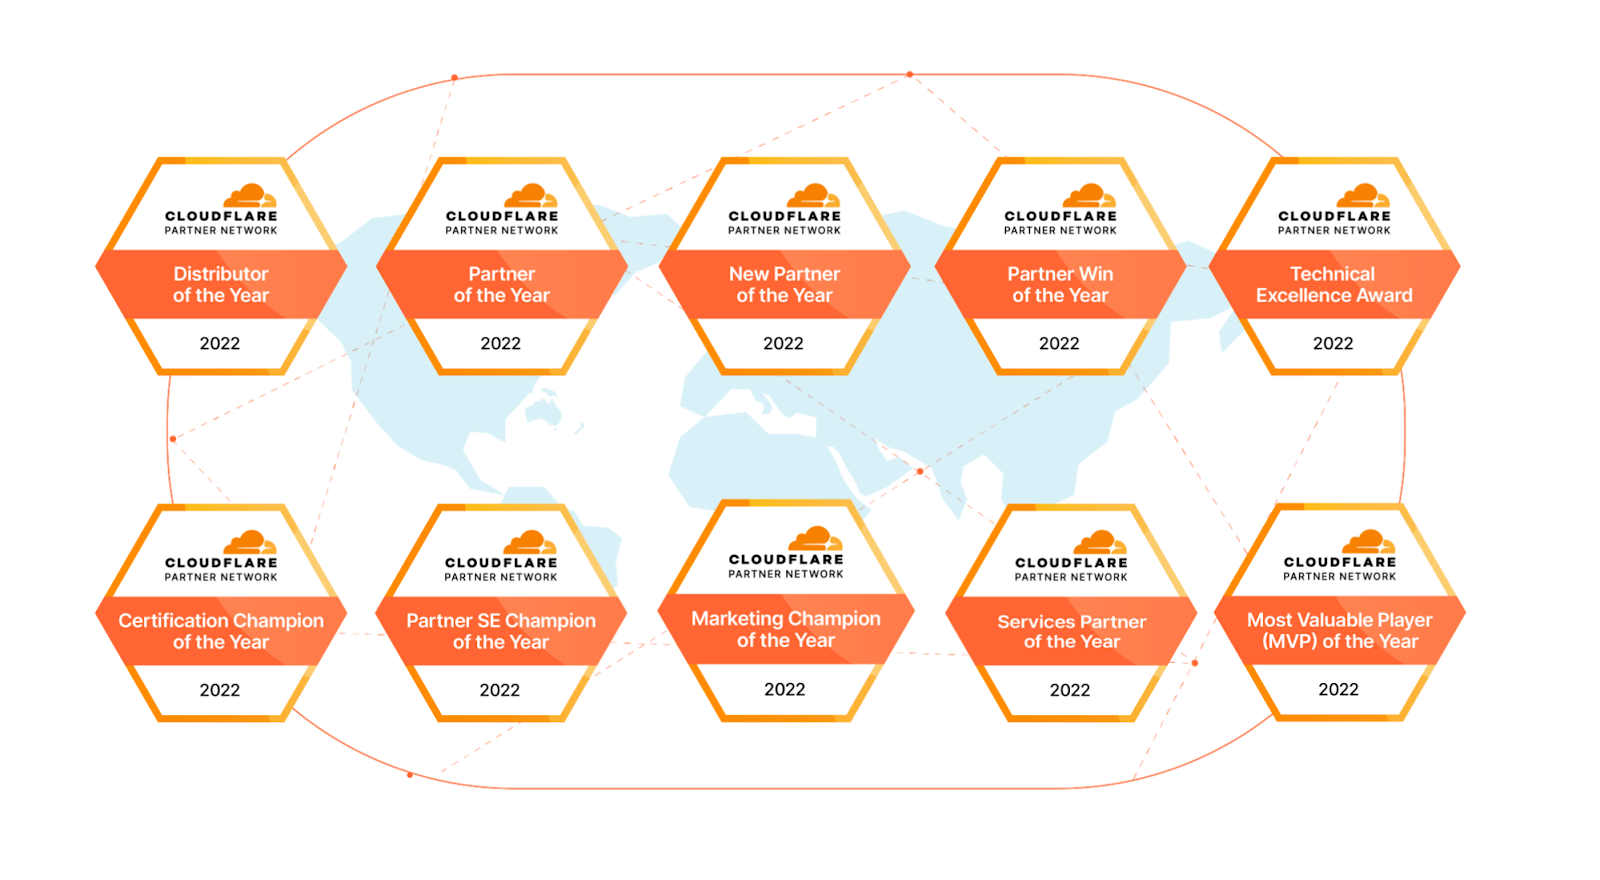

 Let’s hear more from
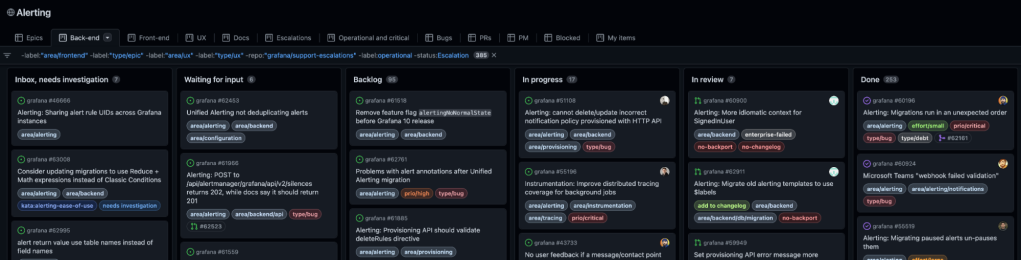
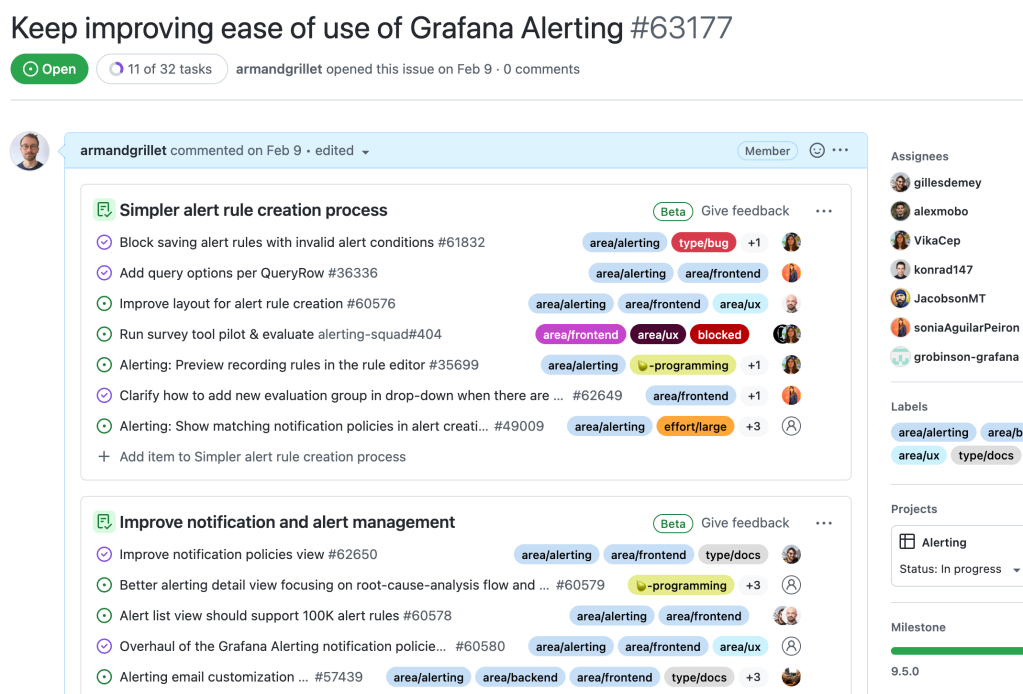
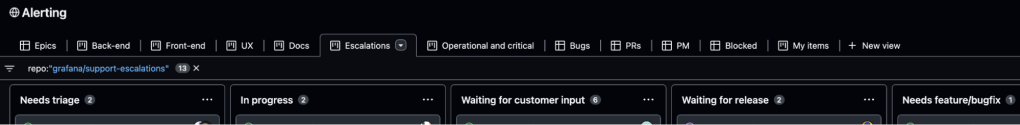
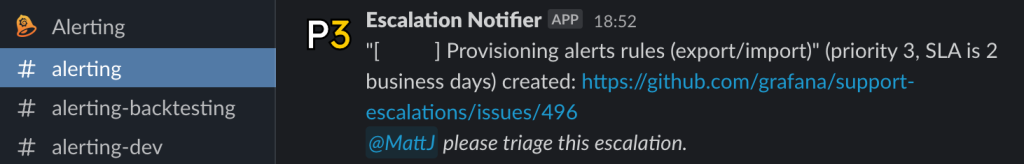
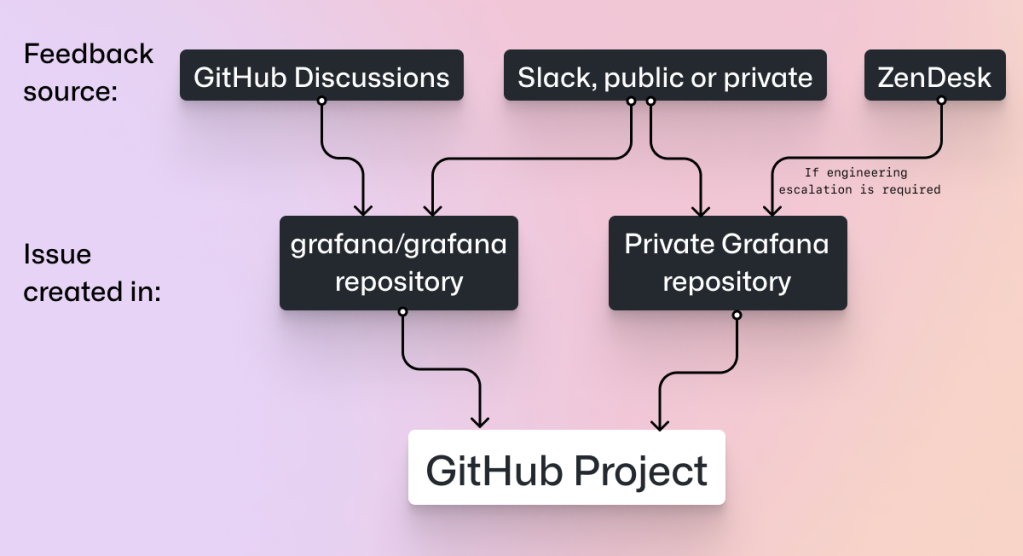
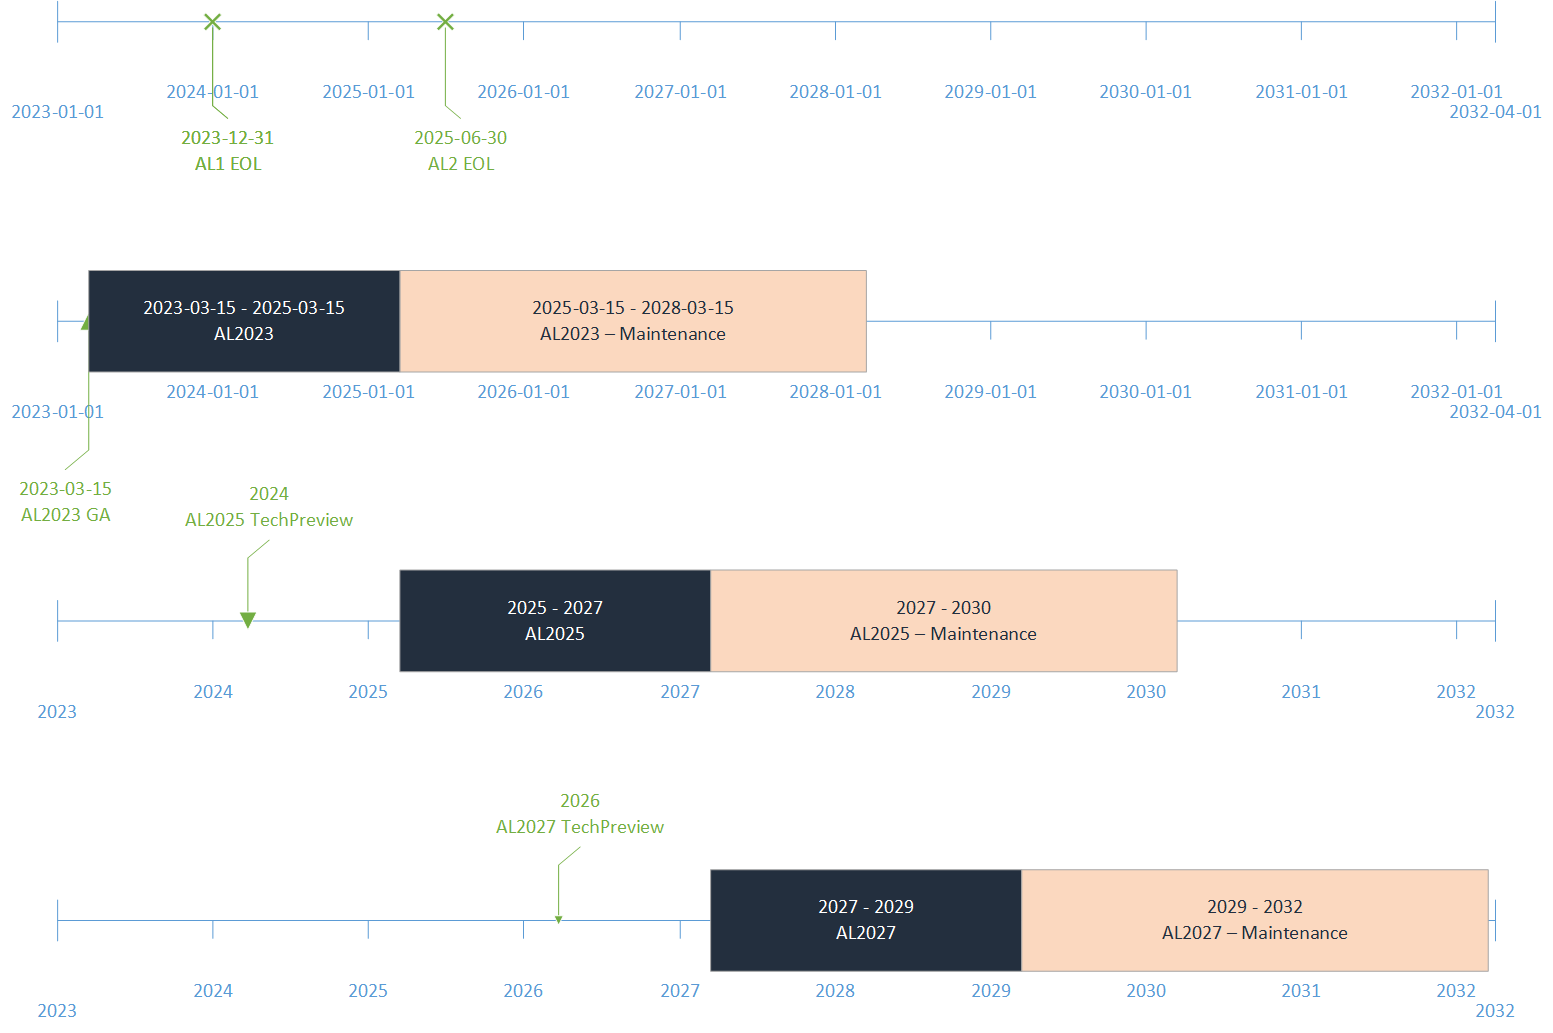

 Gowtham Dandu is an Engineering Lead at Infomedia Ltd with a passion for building efficient and effective solutions on the cloud, especially involving data, APIs, and modern SaaS applications. He specializes in building microservices and data platforms that are cost-effective and highly scalable.
 Praveen Kumar is a Specialist Solution Architect at AWS with expertise in designing, building, and implementing modern data and analytics platforms using cloud-native services. His areas of interests are serverless technology, streaming applications, and modern cloud data warehouses.
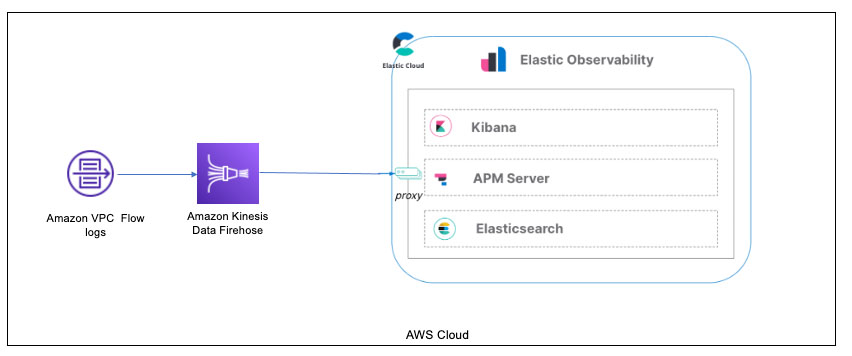
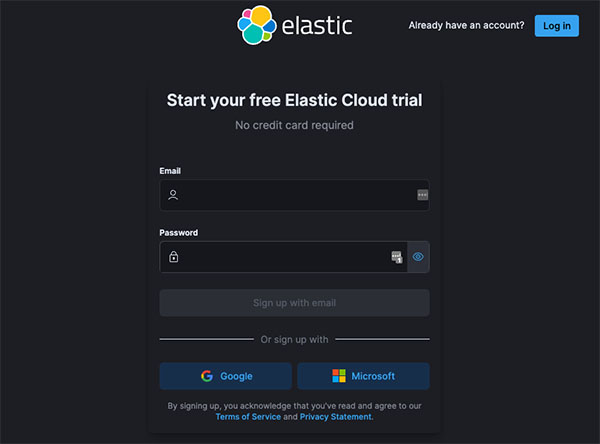
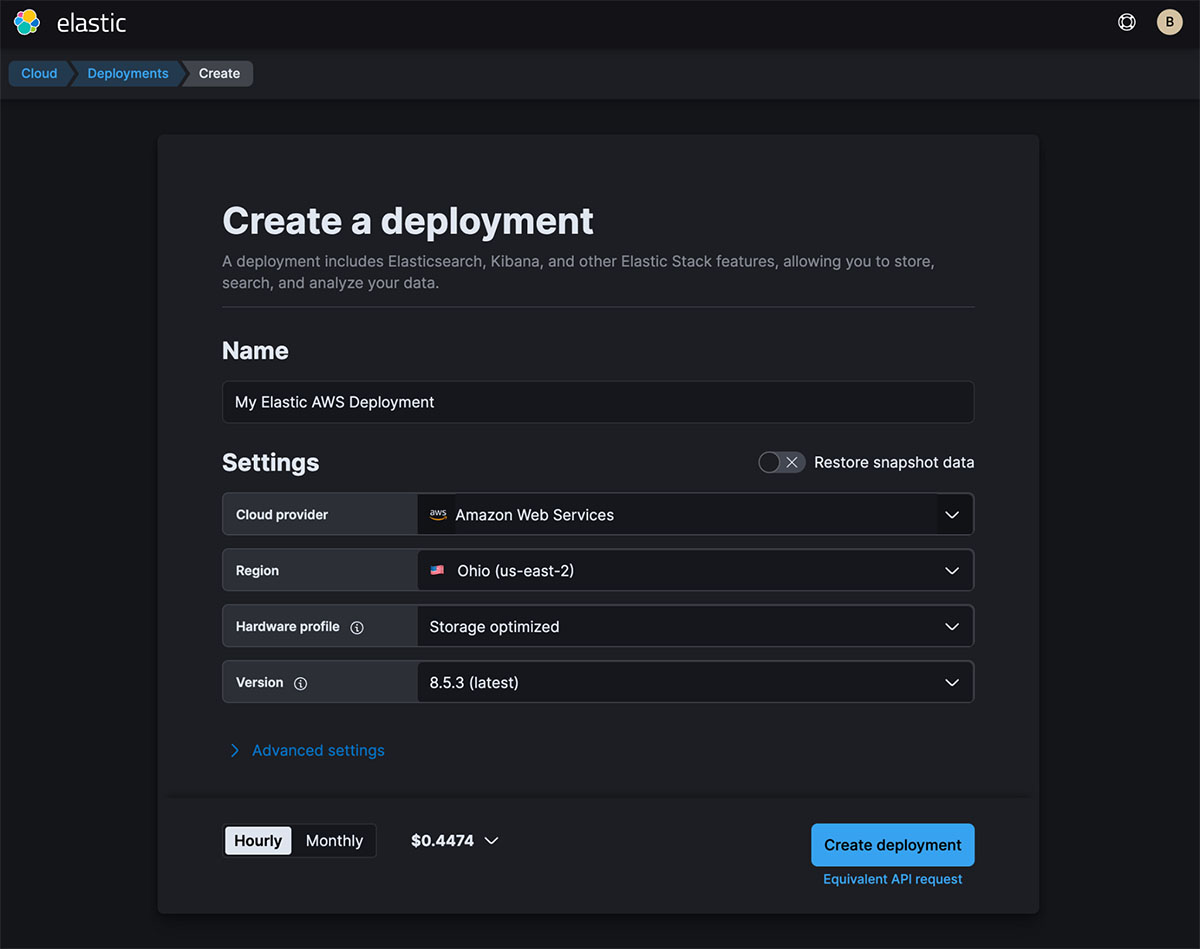

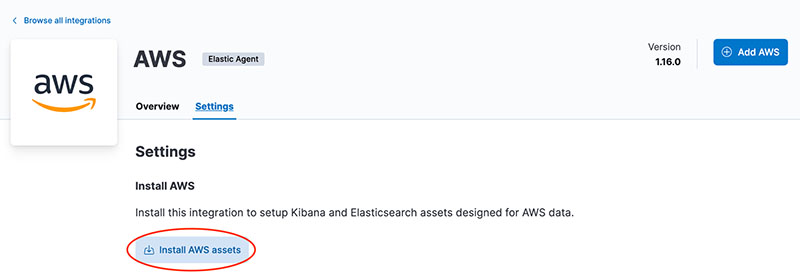

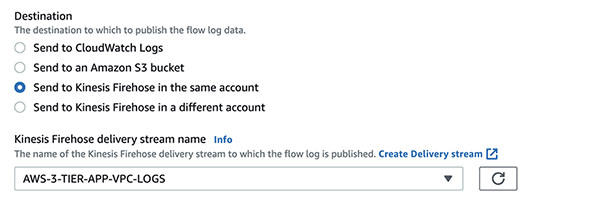
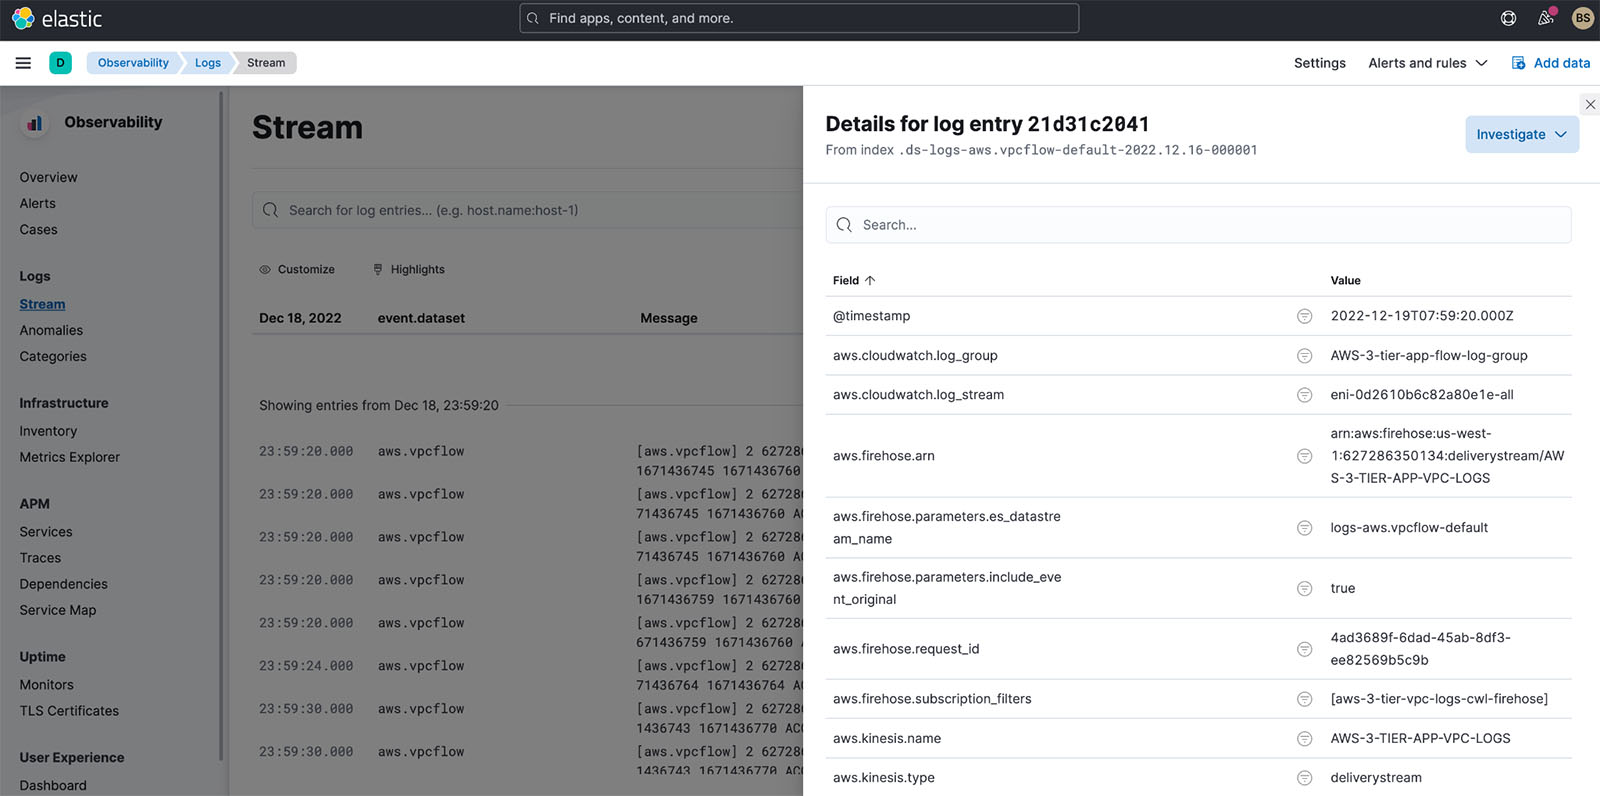
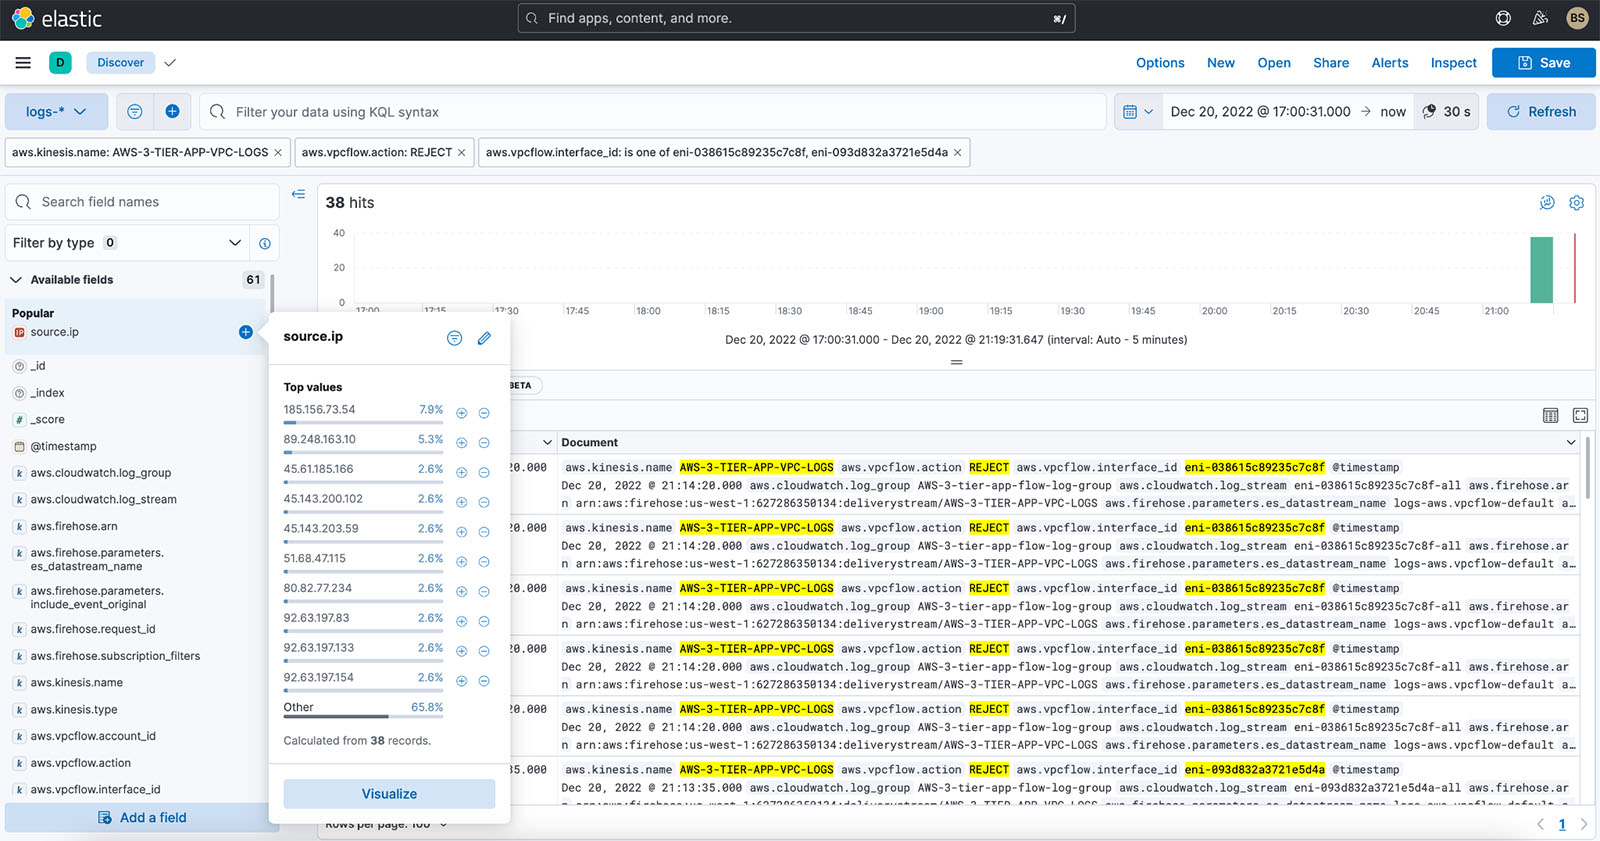

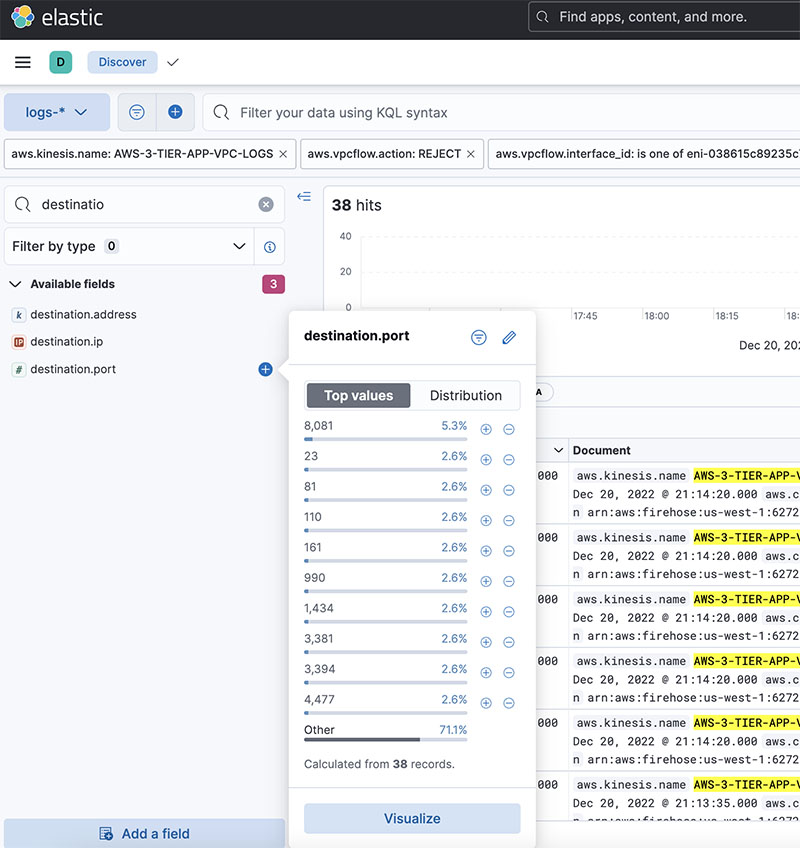
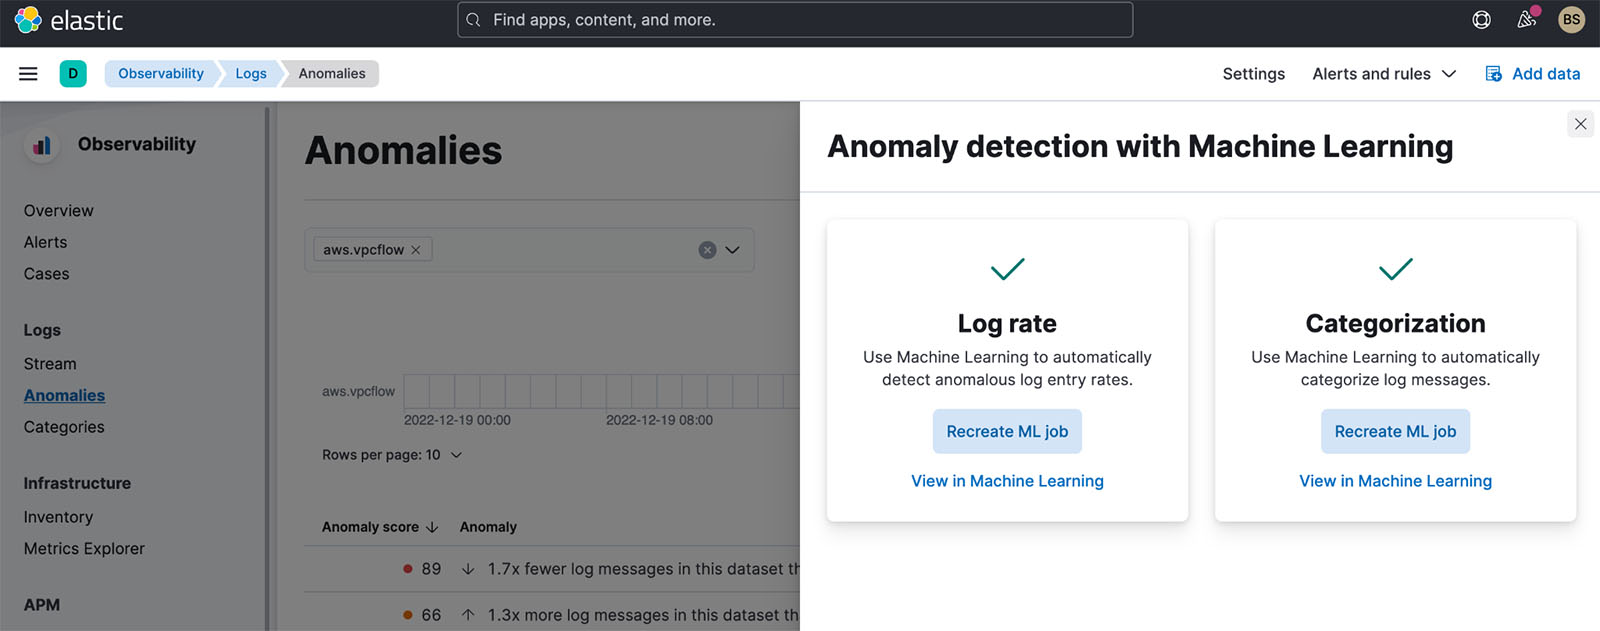

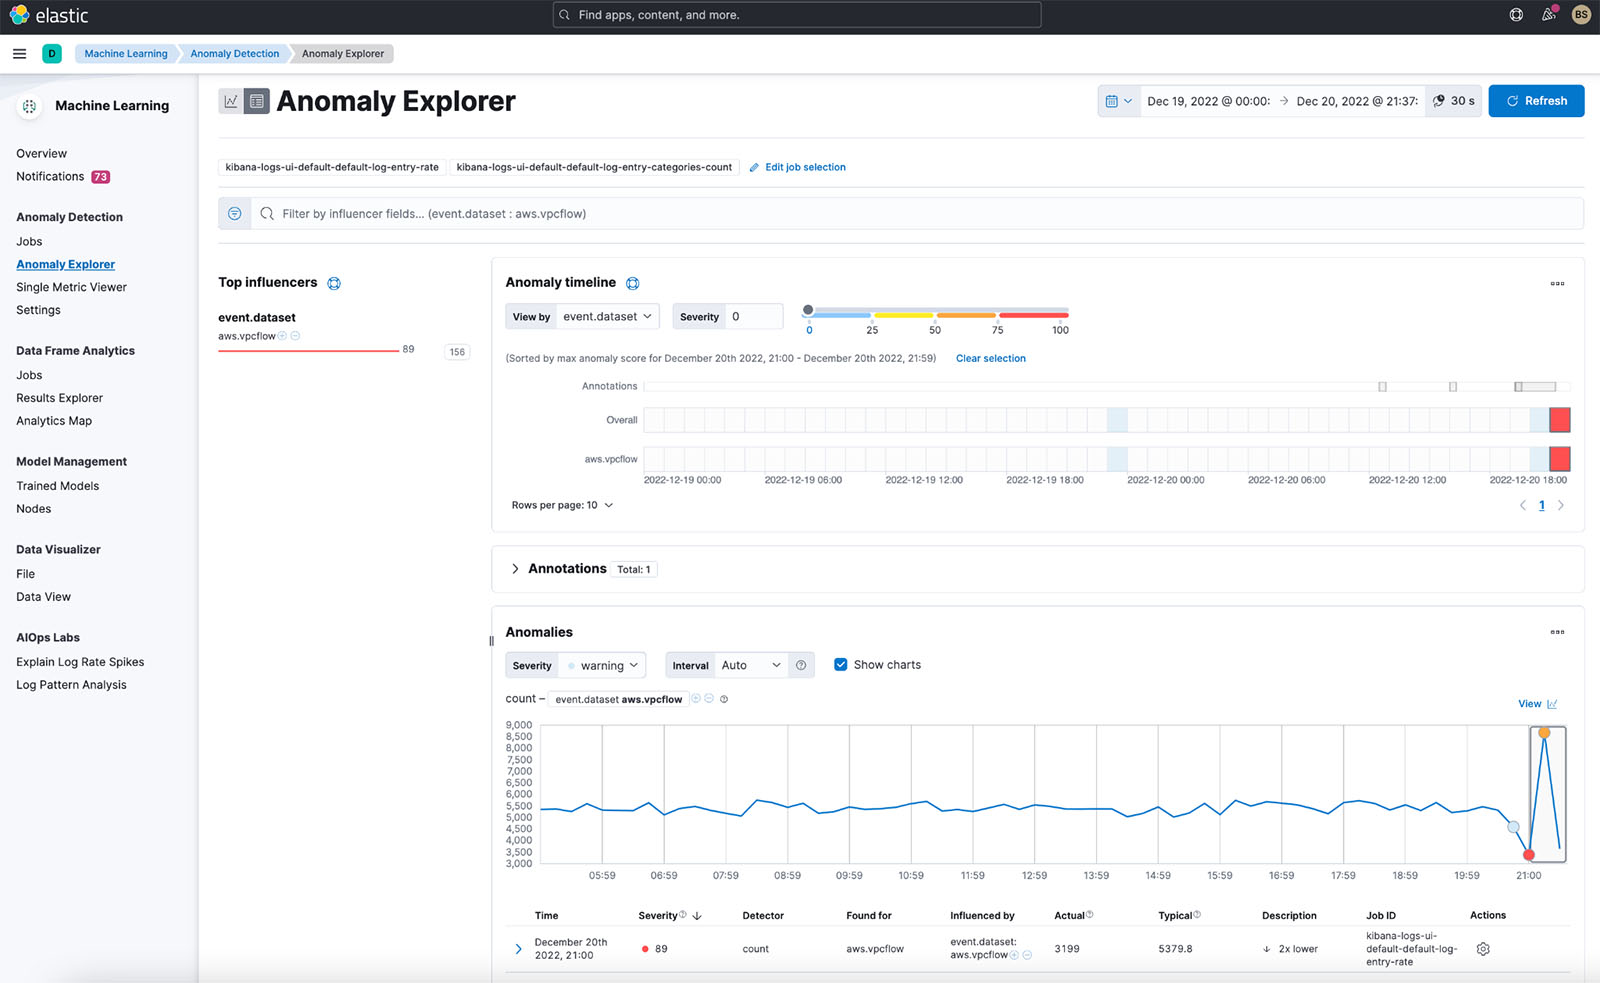


 Udayasimha Theepireddy is an Elastic Principal Solution Architect, where he works with customers to solve real world technology problems using Elastic and AWS services. He has a strong background in technology, business, and analytics.
 Antony Prasad Thevaraj is a Sr. Partner Solutions Architect in Data and Analytics at AWS. He has over 12 years of experience as a Big Data Engineer, and has worked on building complex ETL and ELT pipelines for various business units.
 Mostafa Mansour is a Principal Product Manager – Tech at Amazon Web Services where he works on Amazon Kinesis Data Firehose. He specializes in developing intuitive product experiences that solve complex challenges for customers at scale. When he’s not hard at work on Amazon Kinesis Data Firehose, you’ll likely find Mostafa on the squash court, where he loves to take on challengers and perfect his dropshots.