The primary storage solutions for EC2 Windows instances, Amazon EC2 Instance Store and Amazon Elastic Block Store (Amazon EBS) , now provide detailed performance statistics for real-time monitoring. Real-time monitoring enables you to gain visibility into key performance metrics, such as latency, throughput, and IOPS, allowing you to detect and address potential bottlenecks or issues proactively.
In this post, we explore how to use detailed performance statistics for both Amazon EBS and Instance Storage on Windows environments. These new metrics provide sub-minute granularity, offering real-time visibility into storage volume performance across both storage types. You can access these statistics directly from your Amazon EBS NVMe/Amazon Instance Storage NVMe device attached to the Amazon Elastic Compute Cloud (Amazon EC2) instance and use them to monitor I/O performance at the storage level. We also provide examples of how to use these statistics to quickly assess EBS volume/Storage health and identify performance bottlenecks, which improve both the reliability and performance of your applications. When creating or attaching EBS volumes, enable encryption at rest using AWS Key Management Service (AWS KMS) to protect your data. For more information, see Amazon EBS encryption in the Amazon EC2 User Guide.
Solution overview
Using the new Amazon EC2 Instance Store/Amazon Elastic Block Store (Amazon EBS) detailed performance statistics at the instance-level, this sample solution enhances observability and troubleshooting capabilities for latency-sensitive applications running on EC2 Nitro instances. We use the new nvme_amzn.exe tool to collect high-frequency statistics on I/O operations, latency, and queue length, enabling proactive troubleshooting.
As examples of how to use these granular metrics, this solution demonstrates how to validate the responsiveness of local storage and EBS volume, so that you can quickly identify any I/O interruptions. This solution helps you identify storage performance bottlenecks, which can be used to optimize the local storage and EC2 instance configurations for your workloads.
Prerequisites
This solution involves setting up an EC2 Nitro instance and an attached local storage to access detailed performance statistics for the local storage. This is a setup you likely already have if using Amazon EC2. To deploy the required components, you must complete the following steps:
Launch an EC2 Nitro instance (or use an existing Nitro instance), and connect to it via Remote Desktop Protocol (RDP).
Verify that your EC2 Windows instance includes AWS NVMe driver version 1.7.0 or later installed by following identify your driver type
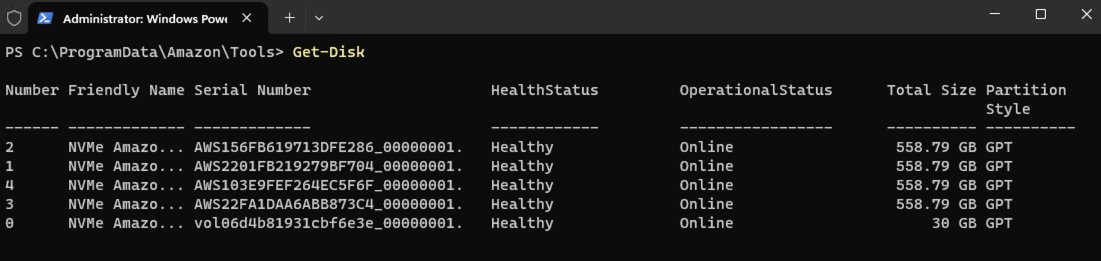
Identify the NVMe device associated with the local storage/EBS volume for which you want to query the stats. You can run the Get-Disk command in PowerShell to output all NVMe devices on the instance. For more information, see Map NVMe disks on Amazon EC2 Windows instance to volumes.
For this demonstration, we’ll monitor two storage volumes:
EBS volume (Disk 0): Serial Number vol01234567890abcdef_00000001.
Local storage (Disk 1): Serial Number AWSEXAMPLE1234567890_00000001.
Ensure that nvme_amzn.exe is present in C:\ProgramData\Amazon\Tools by default.
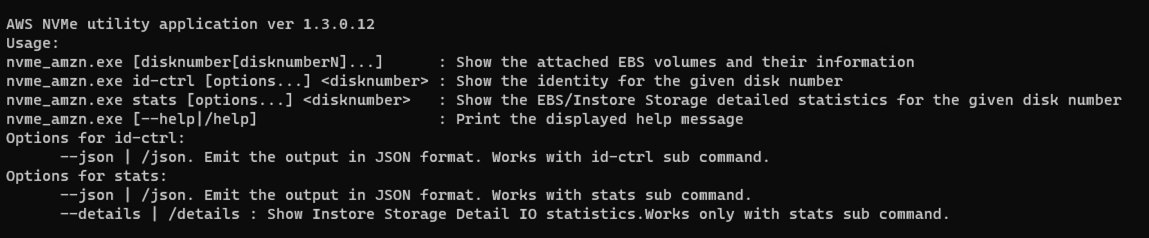
Use the nvme_amzn.exe tool, with administrator privileges, and pass the disk number as a parameter with different command. The returned output looks like the following.
Administrator: Windows PowerShell:
.\nvme_amzn.exe --help or nvme_amzn.exe /help
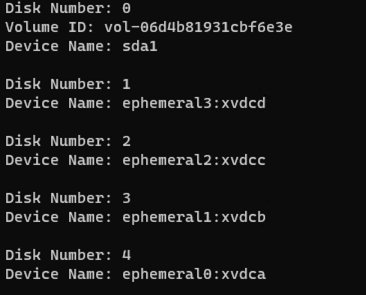
Users can see the EBS volumes devices mapping by default without passing the disk number as a parameter
.\nvme_amzn.exe
Users can view the specific device mapping by passing disk numbers or a single disk number as a parameter.
.\nvme_amzn.exe 0 1 2 3 4
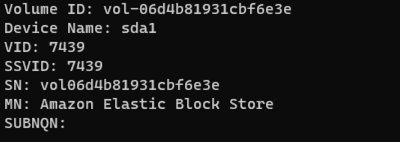
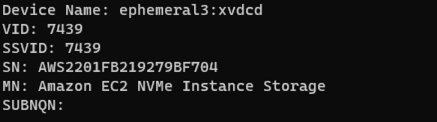
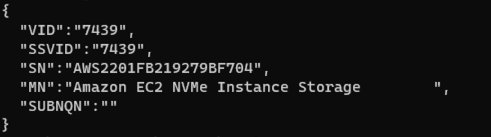
Users can see the nvme controller details by using id-ctrl and pass the disk number as a parameter (JSON output can be retrieved by providing the --json or /json parameter to the tool)
# EBS volume
.\nvme_amzn.exe id-ctrl 0
# EC2 local storage
.\nvme_amzn.exe id-ctrl 1
.\nvme_amzn.exe id-ctrl 0 --json
Users can see the performance statistics for EBS/EC2 local storage volume by using stats and pass the disk number as a parameter (provide the --json or /json parameter to retrieve JSON output).
# EBS volume
.\nvme_amzn.exe stats 0
# Json format
.\nvme_amzn.exe stats 0 --json

# EC2 Local storage volume
.\nvme_amzn.exe stats 1
# Json format
.\nvme_amzn.exe stats 1 --json
In addition, for EC2 local storage volume, by providing the --details/-d option, you can see the histogram of 5 different IO bands: (0, 512 Byte], (512B, 4KiB], (4KiB, 8KiB], (8KiB, 32KiB], (32 KiB, MAX].
.\nvme_amzn.exe stats 0 --details
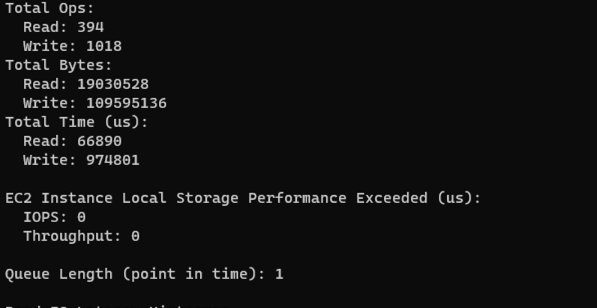
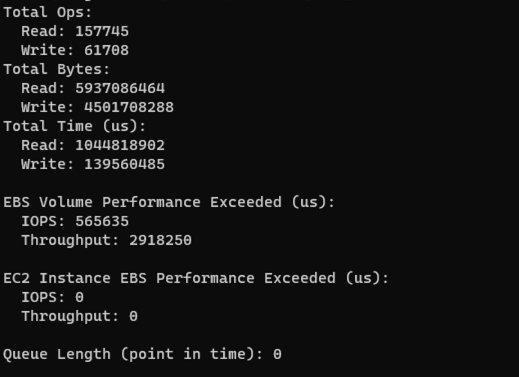
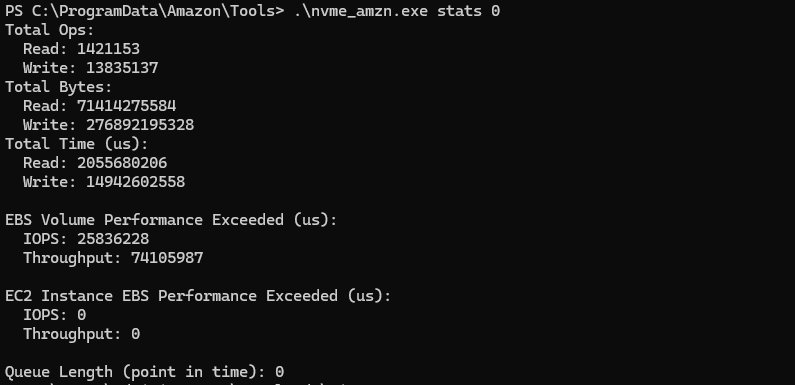
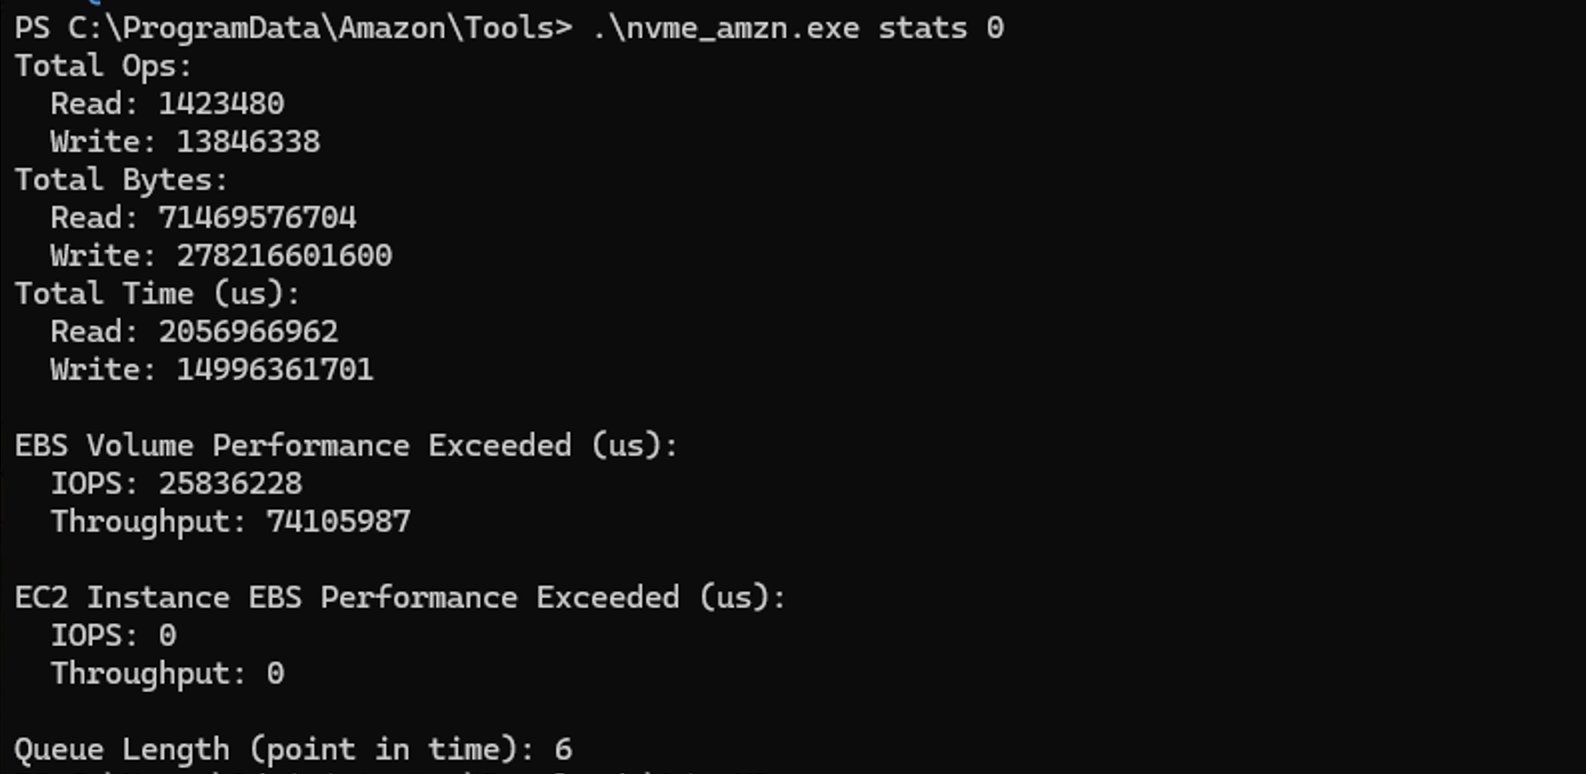
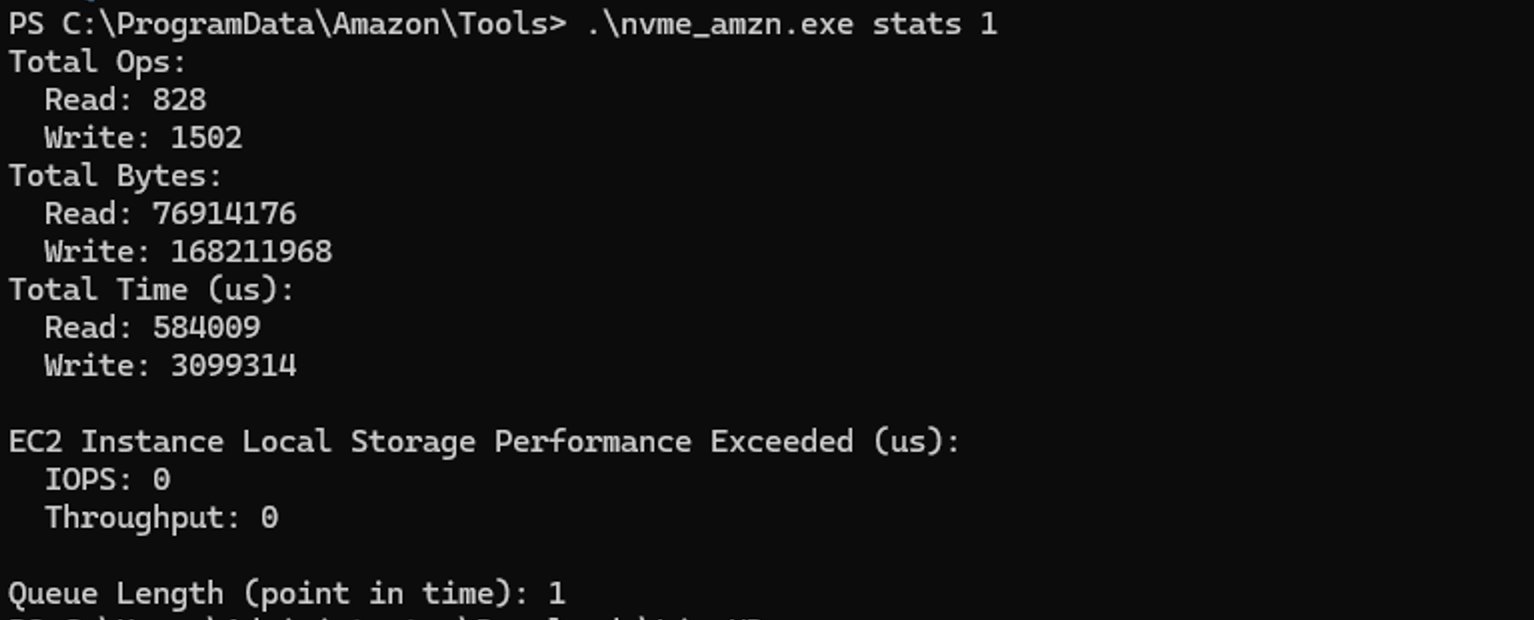
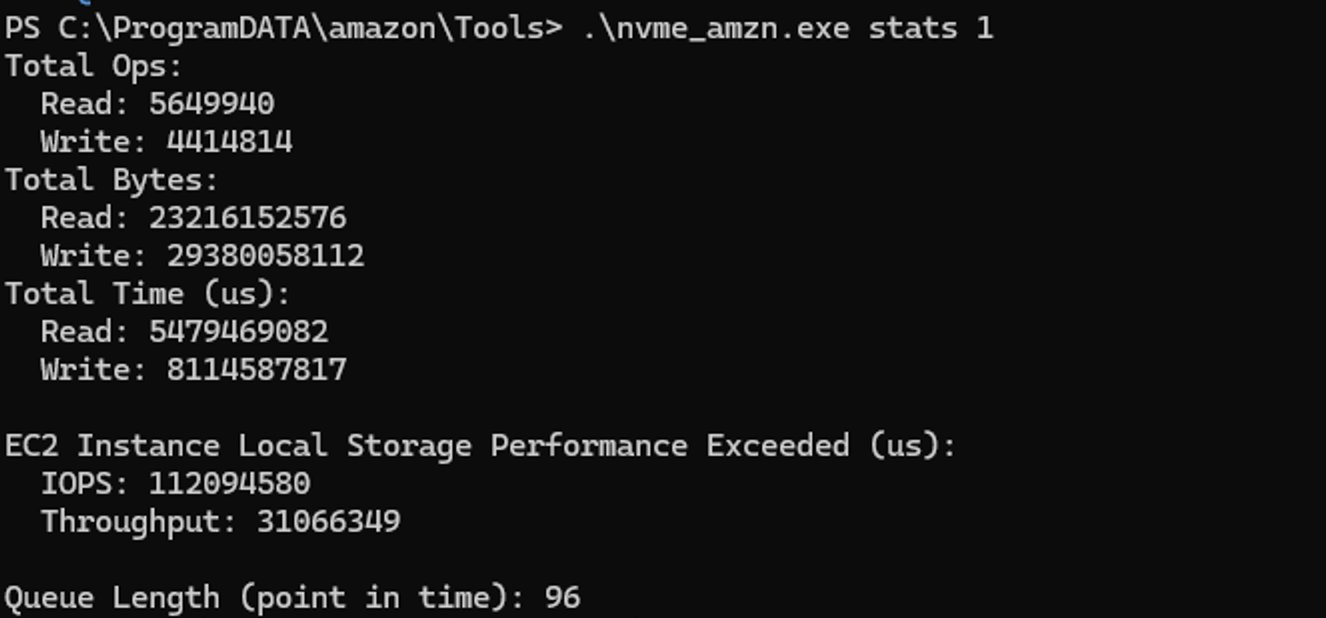
The following example shows NVMe log output with cumulative statistics. The statistics indicate read/write operations, bytes transferred, and time spent processing operations (in microseconds). They also show the number of microseconds in which the application attempted to exceed the Amazon EBS or Amazon EC2 Instance Local Storage IOPS/throughput limits
EBS volume:
EC2 local storage volume:
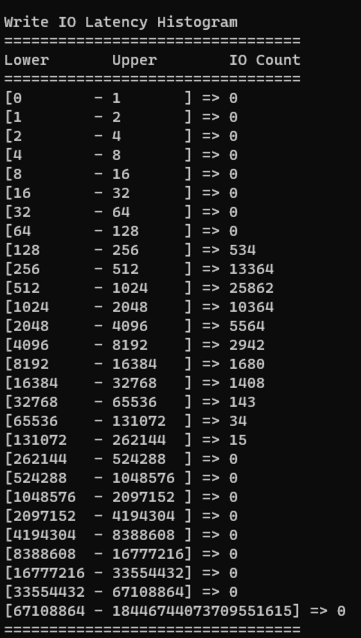
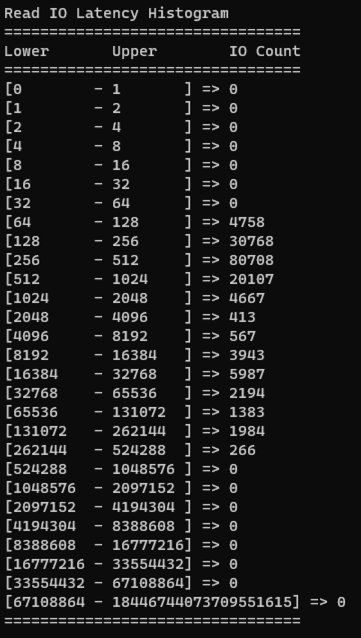
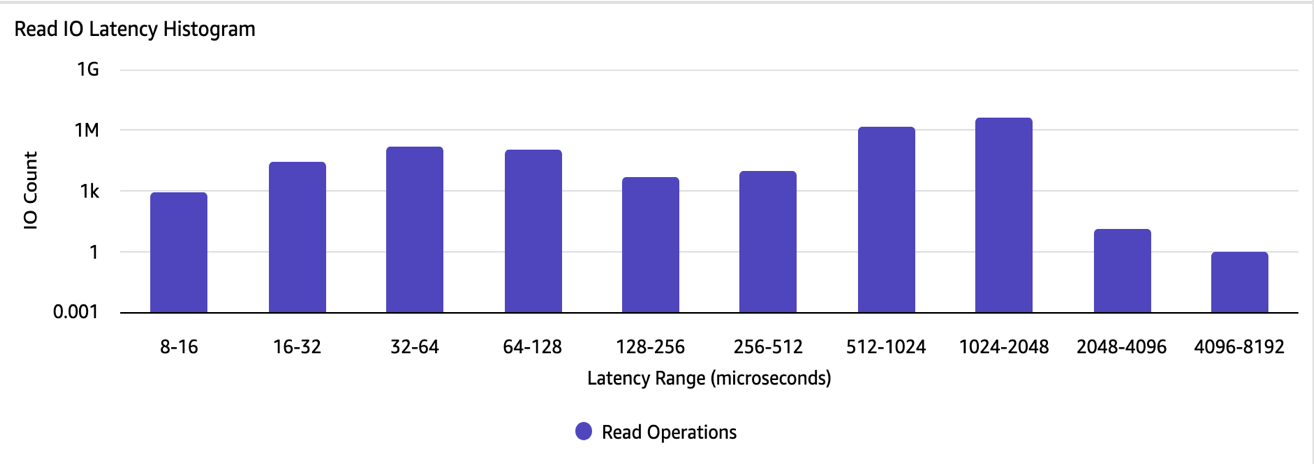
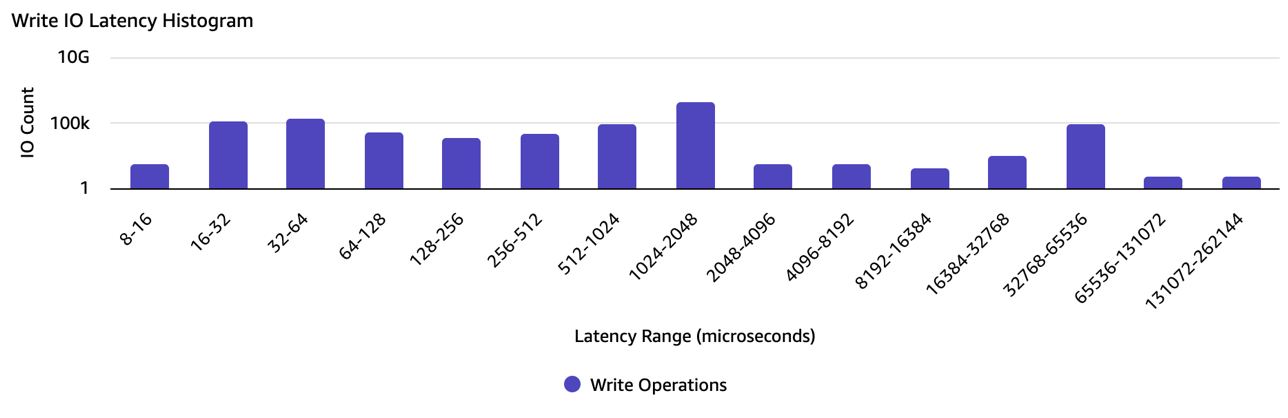
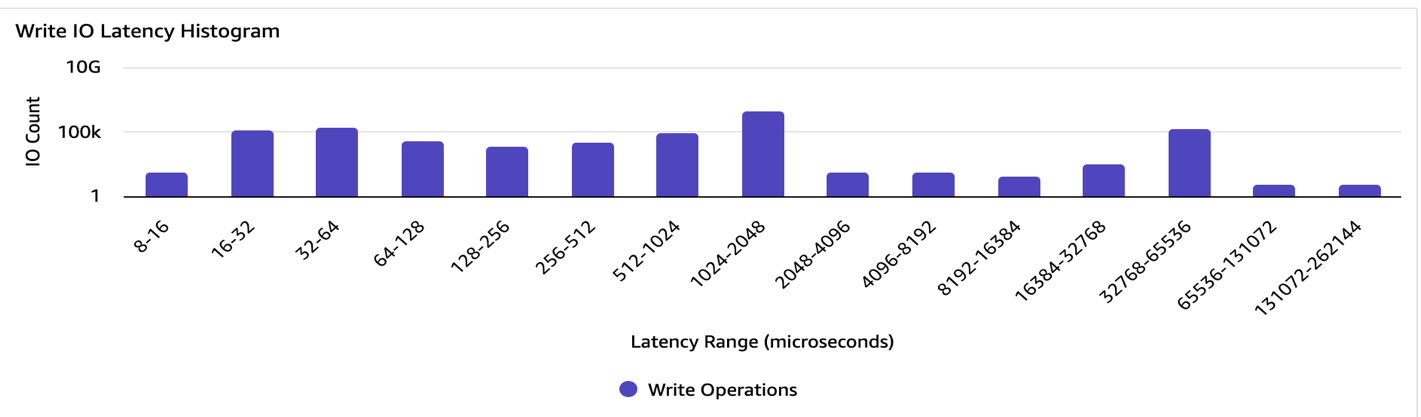
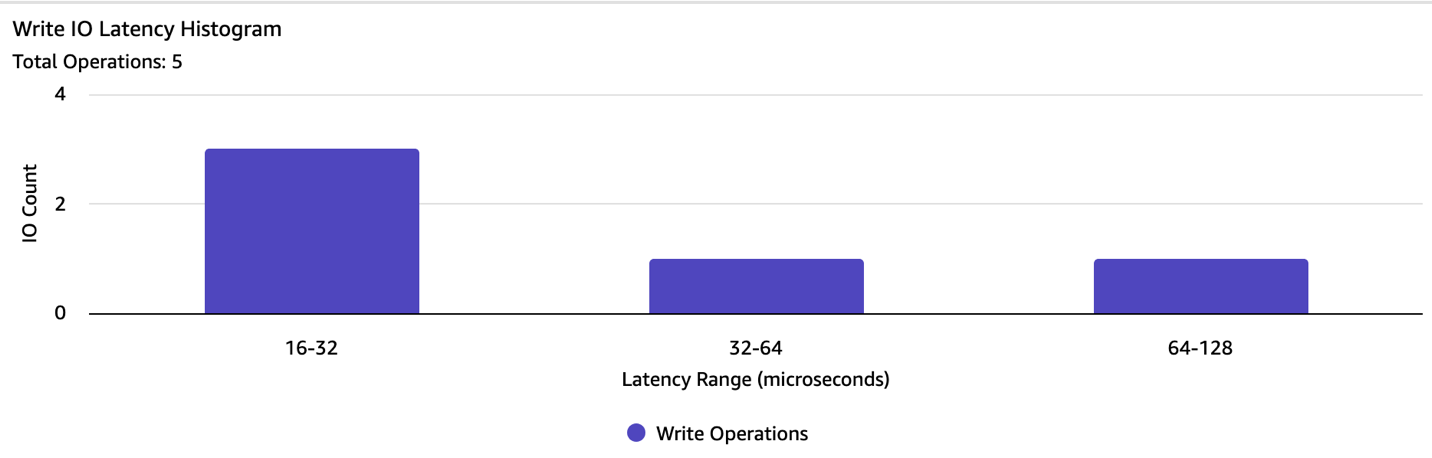
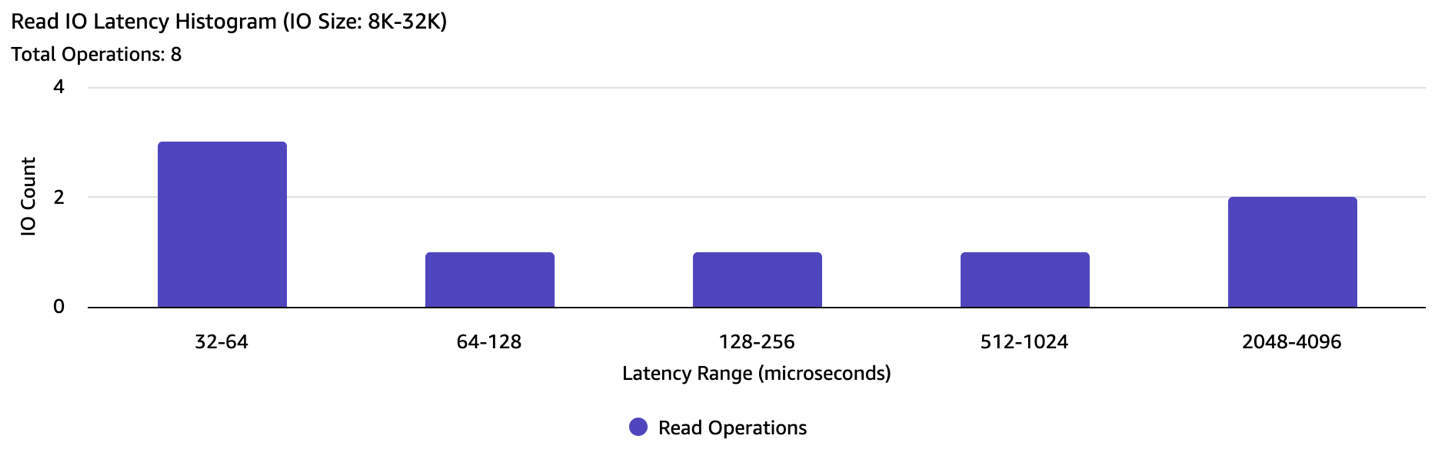
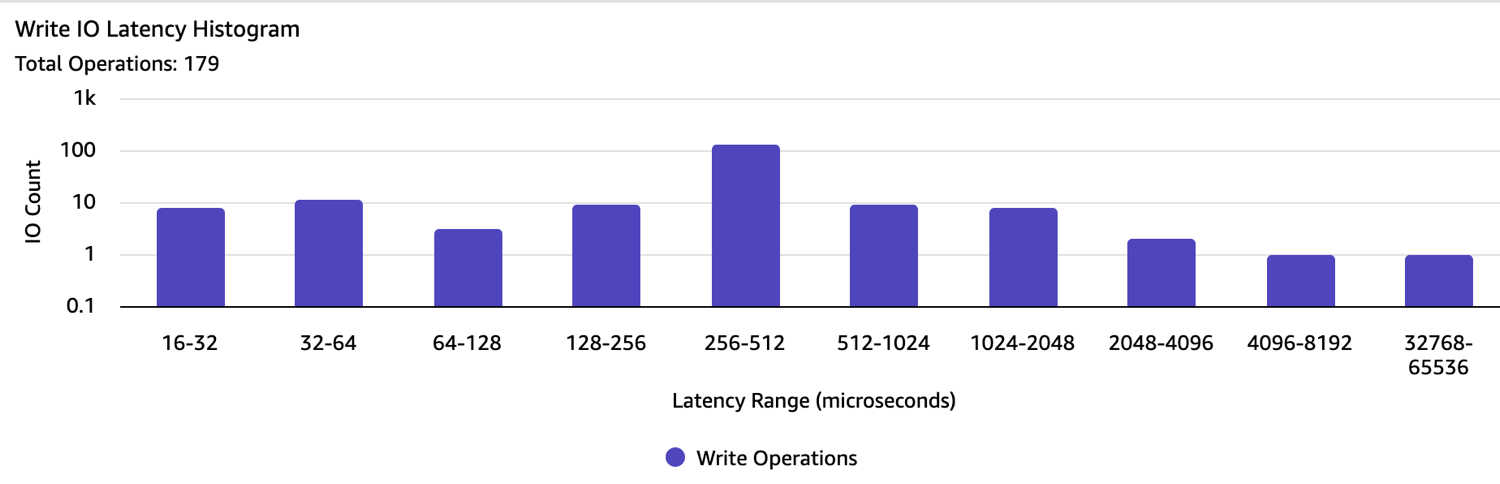
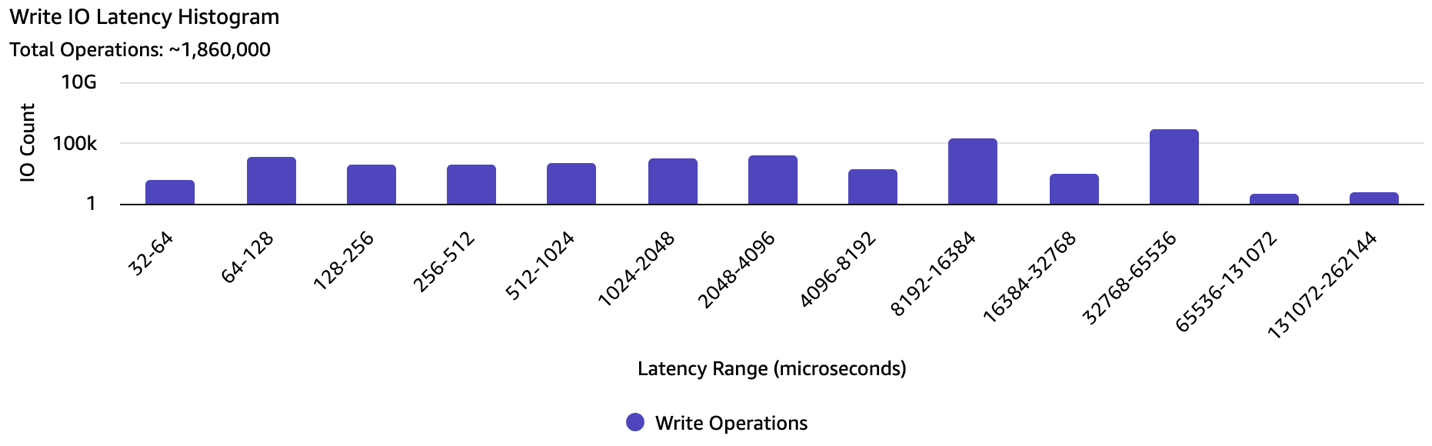
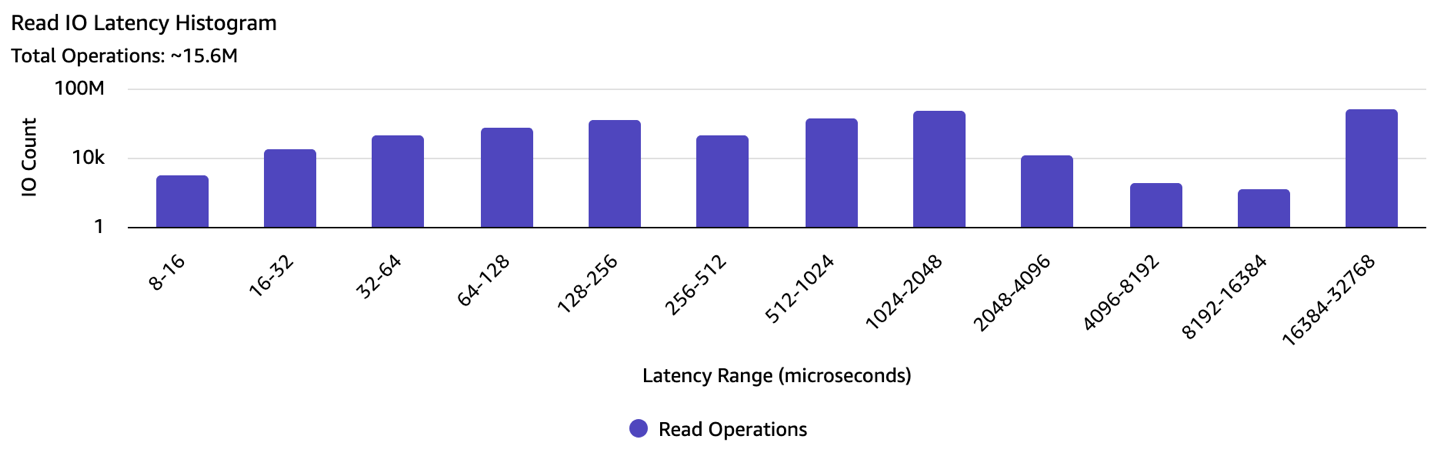
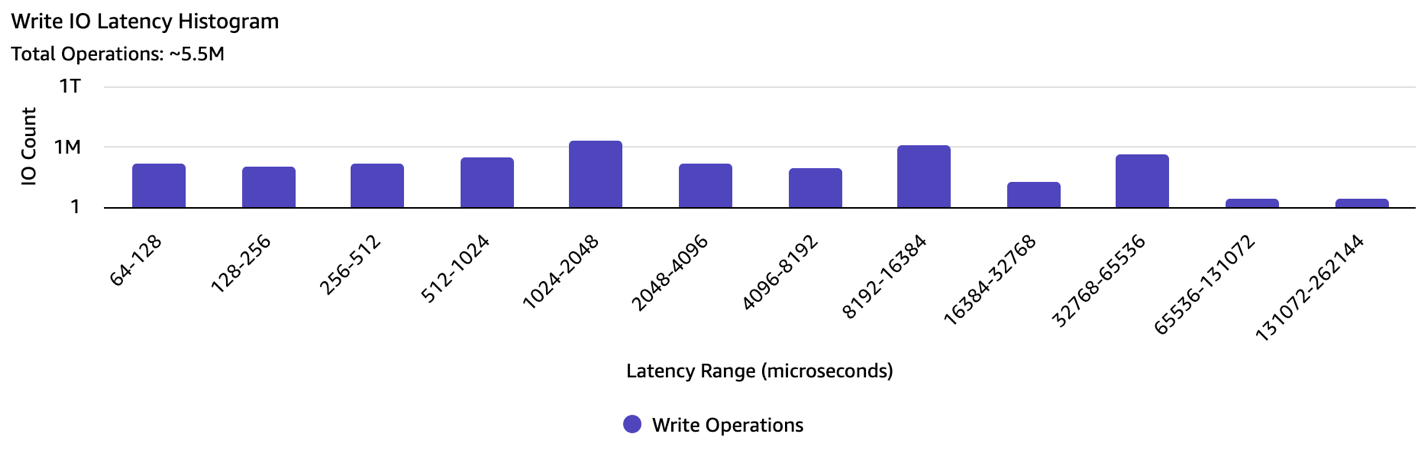
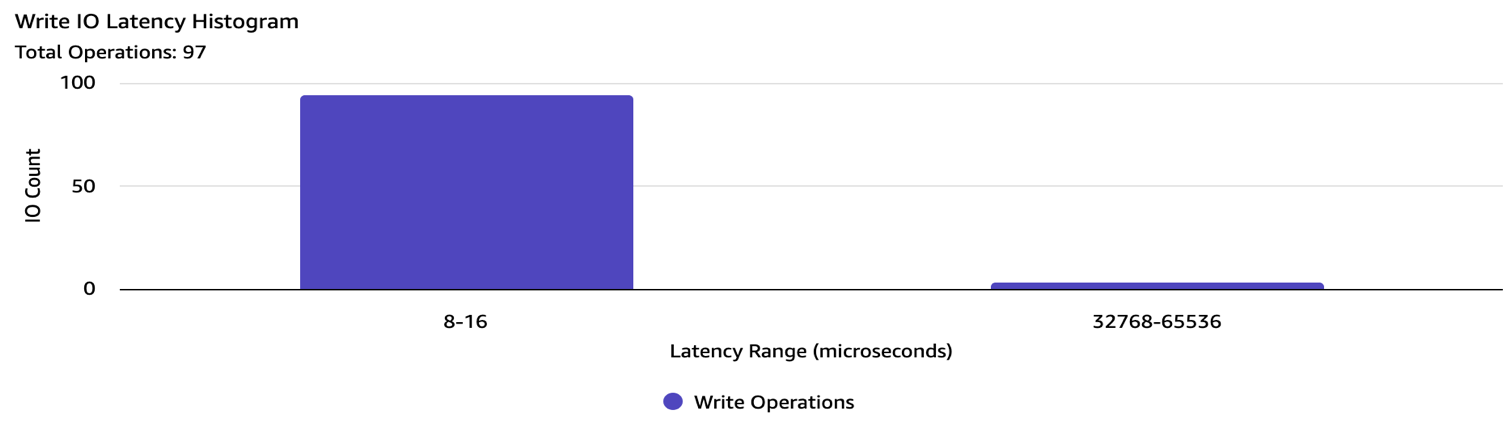
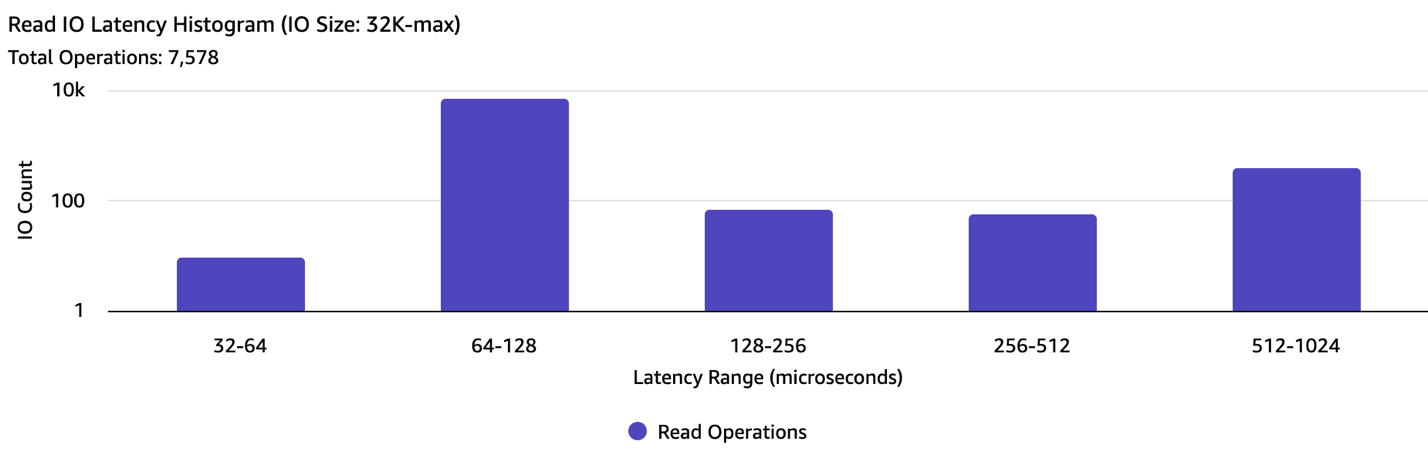
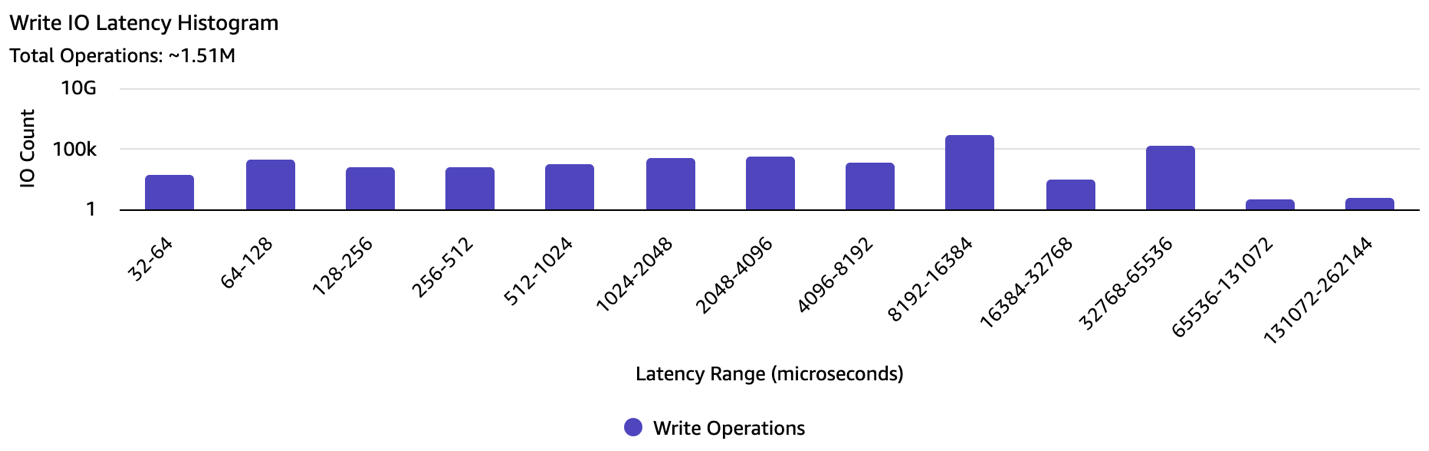
Also included in the following figures are read and write I/O latency histograms, with each row representing the total number of I/O operations completed so far within a specific bin of time (in microseconds).
These statistics are presented as cumulative counters up to the time at which the command is executed. The command can be run at the desired interval, for example, every 15 seconds, with each subsequent output reflecting the updated cumulative totals for the metrics. Calculating the difference in the statistics across the last two outputs allows you to derive insight into the instance storage profile over the given 15 second period.
Deriving insights from the Amazon Instance Storage/EBS volume detailed performance statistics
You have set up monitoring using these detailed performance statistics, now we can demonstrate the different ways you can use these statistics.
As mentioned in the preceding section, you can use the detailed statistics to view I/O latency histograms to observe the spread of I/O latency within the period. You can use the read/write operations and time spent statistics to calculate the average latency. Using the detailed statistics allows you to view the average latency at a sub-minute granularity.
Here are four examples for you to use the statistics to shed light on key performance metrics.
Scenario 1: Identifying unresponsive state of an EBS volume
In this scenario, we discuss how to use Amazon EBS detailed performance statistics to observe when an EBS volume isn’t responding to I/O operations. If you observe multiple intervals where your volume is unresponsive, then you can take actions, such as replacing the affected volume or stopping and restarting the instance to which the volume is attached. In most cases, when your volume becomes unresponsive, Amazon EBS automatically diagnoses and recovers your volume within a few minutes.
To identify if your volume is unresponsive, you can use the following steps to determine whether I/O disrupted on your volume:
Identify the EBS volume’s NVMe device to troubleshoot
Collect stats for the device at the desired intervals
Compare the stats to check if the EBS volume is unresponsive
Step 1: Identify the EBS volume’s NVMe device to troubleshoot
1. Identify the NVMe device associated with the EBS volume on the instance by using the nvme_amzn.exe tool.
.\nvme_amzn.exe
Step 2: Collect stats for the device at the desired intervals
1. Collect the Amazon EBS detailed performance statistics directly from the device by using the nvme_amzn.exe tool:
# EBS volume disk0
.\nvme_amzn.exe stats 0
Step 3: Compare the stats to check if the EBS volume is unresponsive
1. From the output, consider the following three fields for this scenario: Total Read Ops, Total Write Ops, and Queue Length.
2. Issue the same ebsnvme command after a desired interval (for example: after 15 seconds), so that you can compare how Total Read/Write I/Os have progressed at the Amazon EBS level.
3. From the detailed performance statistics collected approximately 15 seconds apart, we make the following key observations
Total Read Ops increased from 1421153 to 1423480, indicating 2327 Read operations completed in the 15 second span.
Total Write Ops increased from 13835137 to 13846338, indicating 11201 Read operations completed in the 15 second span.
Queue Length stayed between 0 and 6, indicating that the application was issuing I/Os to the EBS volume. If you see a gradual increase in the Queue Length, then it would reflect a buildup in queued I/Os.
This shows that the EBS volume is still driving I/Os that it is receiving, which rules out the EBS volume as the source of observed degradation in application performance. If we had seen an increase in the Queue Length along with 0 Read/Write Ops processed during the period, then it would reflect an unresponsive EBS volume.
Scenario 2: Identifying bottlenecks in storage performance on EBS
Amazon EBS detailed performance statistics can also be used to configure the appropriate performance characteristics for your EBS volume and EC2 instance based on the performance needs of your application. The EBS Volume Performance Exceeded and EC2 Instance EBS Performance Exceeded statistics indicate the duration for which your workload consistently attempted to drive IOPS or throughput that is greater than your volume or your instance’s provisioned performance in a given period. Exceeding either the volume’s or instance’s provisioned performance can result in elevated latency on your workload. For this scenario, consider the same application as the one used in scenario 1.
Complete the following steps to check if EBS volume performance is correctly provisioned:
1. Select the EBS volume’s NVMe device to check 2. Collect stats for the device at the desired intervals 3. Compare the stats to check if the EBS volume is exceeding provisioned performance
Step 1. Select the EBS volume’s NVMe device to check
1. This step is the same as Step 1 discussed previously in scenario 1.
Step 2. Collect stats for the device at the desired intervals
1. Similar to Step 2 discussed in scenario 1, access the detailed performance statistics across two points in time.
2. Consider the EBS Volume Performance Exceeded and EC2 Instance EBS Performance Exceeded statistics from the EBS NVMe device.
Step 3: Compare the stats to check if the EBS volume is exceeding provisioned performance
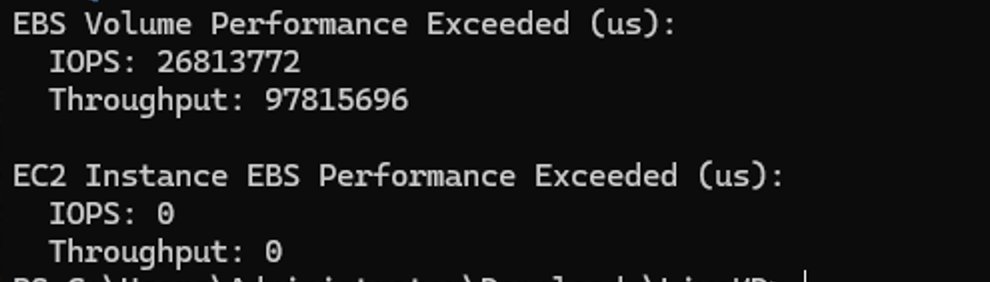
1. In the following example output, you can see the EBS Volume Performance Exceeded statistic increasing by 26813772 microseconds. This shows the workload running on EBS volume vol-EXAMPLEabcd1234 has attempted to drive more IOPS than provisioned on the underlying EBS volume, which can impact the volume’s I/O latency. We recommend that you increase the performance of your volume to make sure that you have sufficient provisioned performance for your application’s needs.
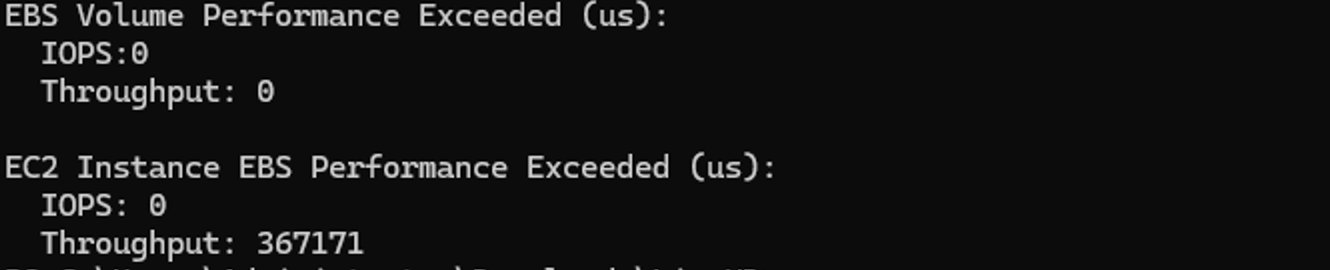
2. In the following example output, driving a different workload on the instance allows us to see that the volume has exceeded the provisioned IOPS performance at the attached EC2 instance level. In this case, up-sizing to a larger instance size can improve the performance of your application.
3. A synthetic load generator for Oracle called Silly Little Oracle Benchmark (SLOB) could also be used to simulate workloads on Oracle databases, while monitoring the Amazon EBS statistics to see which volume or instance is becoming the bottleneck.
It’s important to have the right instance and volume configurations to avoid performance bottlenecks to your application. Refer to the EBS volume types documentation for more information on the different EBS volume types, and the Amazon EBS-optimized documentation to understand how to select the optimal combination of EC2 instance and EBS volume suited for your application. These statistics are available at up to a one-second granularity, which allows you to effectively perform these checks in real-time and initiate volume modifications to optimize volume characteristics as needed.
Scenario 3: Identifying bottlenecks in storage performance on instance storage volume
Amazon Instance Storage detailed performance statistics can be used to configure the appropriate performance characteristics for your application. The “EC2 Instance local storage Performance Exceeded” statistics indicate the duration for which your workload consistently attempted to drive IOPS or throughput that is greater than your rate limit in a given period. Exceeding the throttle value can result in elevated latency on your workload.
For example, i3en.xlarge can support up to 85,000 read IOPS, 65,000 write IOPS, 634,765 KiB/S for read and 317,382 KiB/S for write. By using the detailed IO metrics, you can more efficiently determine if the instance meets your requirements.
Complete the following steps to check if the device meets your application needs:
Select the instance storage device to check.
Collect stats for the device at the desired intervals
Compare the stats to check if the instance storage is exceeding the throttled value
Step 1. Select the Instance Storage NVMe device to check
Use the nvme_amzn tool and identify the NVMe device associated with the instance storage.
Step 2: Collect stats for the device at the desired intervals
Step 3: Compare the stats to check if the instance storage is exceeding throttle value
Take the following scenario as an example. At the very beginning, after the instance launch, both the IOPS and Throughput under “EC2 Instance local storage Performance Exceeded (us)” are 0s.
You start your applications and find that the application write does not meet your expectation. You can check the IO metrics afterwards. You see a lot of IO falls into the 1 ms to 2 ms range, which is unexpected.
By further checking the “EC2 Instance local storage Performance Exceeded (us)”. You found that the IO reached the allowed upper limit for up to 8 seconds, which indicates the i3en.xlarge would not meet your expectations. Select a larger instance size to address this.
It’s important to have the right instance size to avoid performance bottlenecks to your application. Refer to the ec2-instance-type-specifications documentation for more information on the different instance storage size to understand how to select the optimal instance size suited for your application. This tool helps you to effectively perform these checks in real-time.
Scenario 4: Identifying which block size caused the long latency on instance storage volume
You may have a mixed workload:
Data (either read or write) pattern with different block sizes like 4K and 128K.
Mixed read and write data pattern.
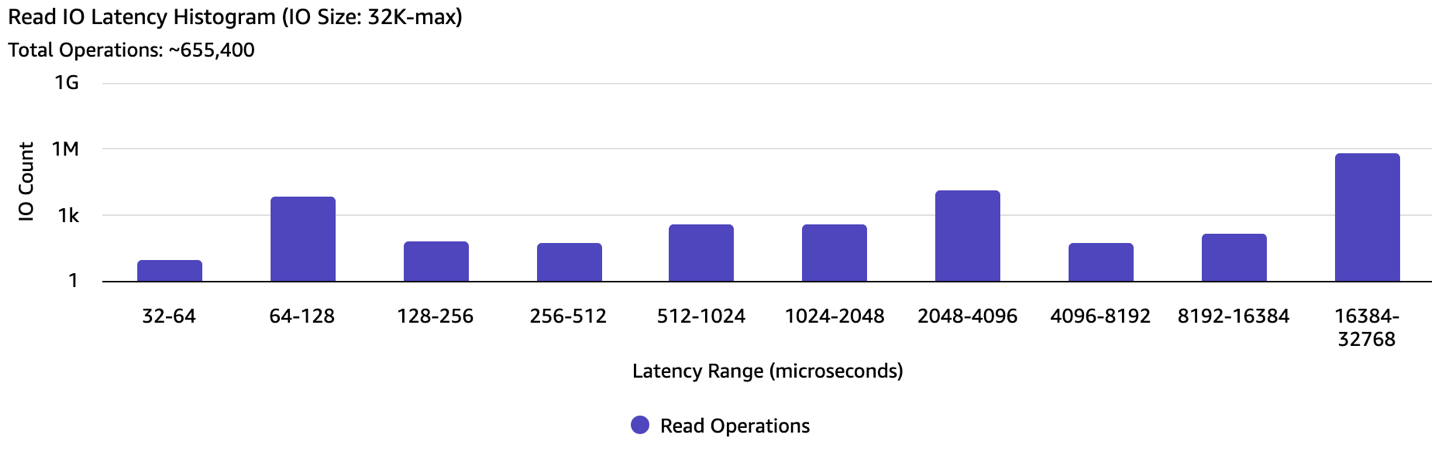
By using the --detail/-d switch from the NVMe CLI, you can identify the issue quickly and readjust the workload.
Example 1: High write latency from a workload
By further looking at the histogram of the block size range larger than 32 KiB, you can see that the larger IO caused high application latency, while other block sizes (like 8K) show no latency abnormality.
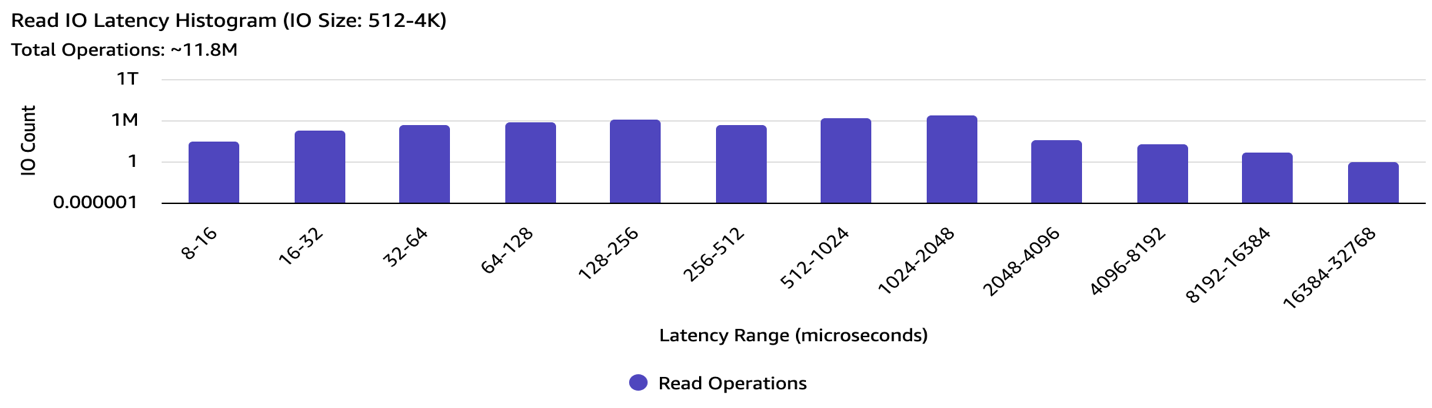
Example 2: Mixed read and write traffic
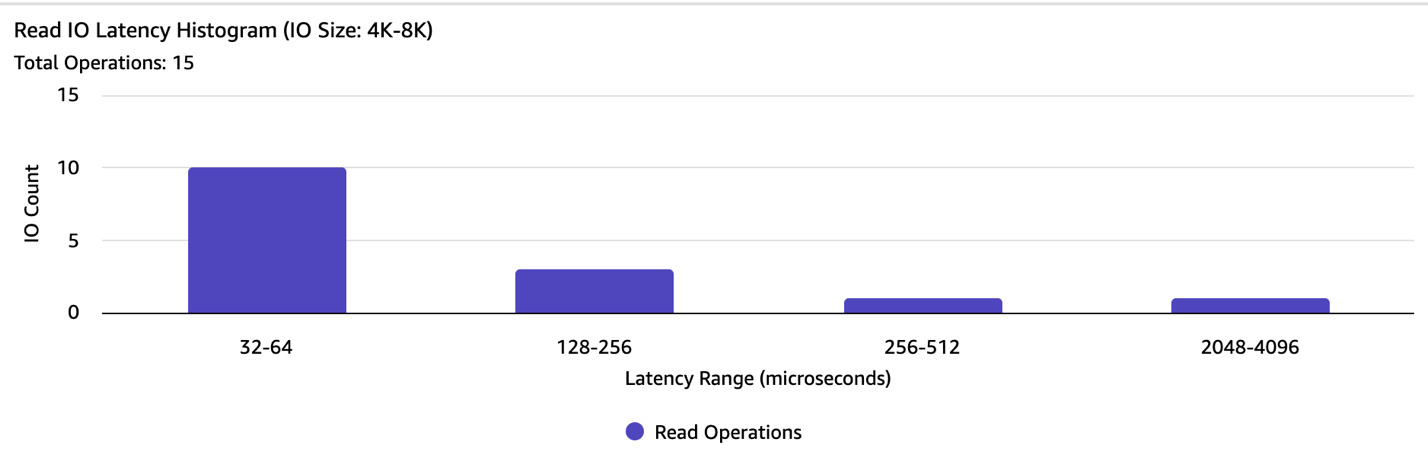
Some users will have a mix of read and write traffic. For example, some applications will do light read traffic (for example to read out some metadata) and heavy write. This may inadvertently impact the read latency. For example, an application is doing a read operation with a single IO of small block size. However, the user experiences high read latency. Examining the histogram breakdown, you could reasonably believe the heavy larger IO write may interfere with the read.
The detailed IO histogram for IO size larger than 512B but less than or equal to 4KB
The detailed IO histogram for IO size larger than 32 KiB
The user should consider smoothing out the write pattern to alleviate the read latency.
Cleaning up
If you created an EC2 instance and EBS volume for this exercise, then terminate and delete the appropriate instance and volumes to avoid future costs.
Conclusion
In this post, we presented a solution for accessing high-resolution performance statistics for Amazon EBS volumes and EC2 Instance Store at the instance level. These detailed metrics provide a real-time view into your underlying storage performance at sub-minute granularity, helping you to quickly root cause disruptions to your applications.
This approach also helps you identify performance bottlenecks caused by workloads exceeding your provisioned IOPS or throughput limits on Amazon EC2, EBS volumes, or EC2 Instance Store. Combined with Amazon CloudWatch metrics, which provide volume-level insights at one-minute granularity, these tools help give you the visibility you need to confidently diagnose and resolve storage-related performance issues.
When downsizing an Amazon Elastic Compute Cloud (Amazon EC2) instance, teams often evaluate CPU and memory utilization but overlook the instance’s Amazon Elastic Block Store (Amazon EBS) performance limits for throughput and IOPS. Smaller Amazon EBS-optimized instance types have lower baselines and rely on burst credits to handle peaks. If your workload’s I/O pattern drains those credits faster than the instance can refill them, the instance will throttle your workload to baseline. This post applies to burstable EBS-optimized instances with baselines below their maximum.
This post shows how to pull your instance’s Amazon EBS metrics from Amazon CloudWatch, simulate the burst credit balance against a target instance type’s limits, and help evaluate whether the downsize might be appropriate before making the change.
Solution overview
The analysis compares your workload’s actual I/O pattern against the target instance type’s Amazon EBS limits.
Measure your current Amazon EBS usage. Pull instance-level throughput and IOPS from Amazon CloudWatch at 5-minute granularity. You need at least two weeks of data to capture weekly patterns. Four weeks is better if your workload has monthly cycles. While you pull data, check whether your current instance already hits its Amazon EBS-optimized performance limits.
Compare against the target instance’s limits. Look up the baseline and burst ceiling for your target instance type. Simulate the burst credit balance across your observation window: for each 5-minute interval, calculate whether credits are draining or refilling, and track whether the balance ever hits zero. If it does, you will experience throttling on the smaller instance.
Monitor after the move. Watch InstanceEBSThroughputExceededCheck and InstanceEBSIOPSExceededCheck for immediate throttle detection. Track EBSByteBalance% and EBSIOBalance% to gauge how much headroom remains for workload growth.
Note: These balance metrics are only available on burstable instance sizes where the baseline is lower than the maximum.
Prerequisites
An AWS account with permissions for cloudwatch:GetMetricData and ec2:DescribeInstanceTypes. The instance must be Amazon EBS-optimized (AWS enables EBS-optimization by default on most current-generation instance types).
Note: AWS doesn’t provide these instance-level Amazon CloudWatch metrics in AWS Outposts, AWS Local Zones, or AWS Wavelength Zones.
Pulling instance-level Amazon EBS metrics from Amazon CloudWatch
Amazon CloudWatch provides Amazon EBS metrics at the instance level in the AWS/EC2 namespace, using the InstanceId dimension. Here are the metrics that you need:
Metric
What it measures
EBSReadBytes
Total read bytes in the period
EBSWriteBytes
Total write bytes in the period
EBSReadOps
Total read operations in the period
EBSWriteOps
Total write operations in the period
EBSIOBalance%
IOPS burst credit balance (0-100%)
EBSByteBalance%
Throughput burst credit balance (0-100%)
InstanceEBSIOPSExceededCheck
1 if instance hit IOPS limit, 0 otherwise
InstanceEBSThroughputExceededCheck
1 if instance hit throughput limit, 0 otherwise
The first four metrics are the inputs for the simulation. The rest are useful context:
EBSIOBalance% and EBSByteBalance% show how much of the burst credit pool remains, as a percentage. On the current (larger) instance, these should sit at or near 100 percent. If they’re dipping, the workload is already consuming burst credits at the current size, and a downsize will make it worse.
Note: These metrics only appear on instances where the baseline is lower than the maximum.
InstanceEBSIOPSExceededCheck and InstanceEBSThroughputExceededCheck are binary: 1 means the instance hit its EBS-optimized performance limit within the last minute. If either is firing on the current instance, the workload is already throttling and should be addressed before considering a downsize.
Pull these at 5-minute granularity for at least two weeks (four if your workload has monthly cycles). Amazon CloudWatch retains 5-minute data points for 63 days, so that’s your upper bound. You can retrieve the data through the AWS Command Line Interface (AWS CLI) (GetMetricData API), the Amazon CloudWatch console, or any AWS SDK. The metrics live in the AWS/EC2 namespace with your InstanceId as the dimension.
Use the Maximum statistic for the four I/O metrics and Minimum for the balance percentages. Maximum captures the highest 1-minute data point within each 5-minute window, which is the conservative choice for the simulation inputs. The Sum statistic gives a more precise total for each interval, but Maximum is the intentionally conservative choice. It assumes the peak 1-minute rate held for the full 5-minute window, which overstates actual consumption. Minimum on the balance metrics captures the lowest point the balance hit within each window, so you see the actual dips rather than averaging them away. For the ExceededCheck metrics, use Maximum (you want to know if the limit was hit at any point in the window).
Combine read and write values to get totals per interval. To convert to per-second rates:
The division by 60 (not by the period length) is intentional. The Maximum statistic for a 5-minute period returns the highest 1-minute aggregate within that window, not a 5-minute total. Dividing by 60 converts that 1-minute peak to a per-second rate. The additional divisions by 1,024 convert bytes to mebibytes to match the units in describe-instance-types.
Comparing actual usage against target limits
From the Amazon EBS-optimized instances documentation, find the baseline and maximum (burst ceiling) for both IOPS and throughput on your target instance type. You can also pull these programmatically:
This returns the baseline and maximum bandwidth (MB/s) and IOPS for the instance type. Note that BandwidthInMbps is megabits per second (network-style units), while ThroughputInMBps is megabytes per second. The throughput values are what you compare against your Amazon CloudWatch data.
BaselineThroughputInMBps is the sustained rate the instance can deliver indefinitely. MaximumThroughputInMBps is the burst ceiling, the absolute maximum the instance can deliver while it has burst credits. Same relationship for IOPS. IOPS and throughput have separate burst budgets, tracked by EBSIOBalance% and EBSByteBalance% respectively.
How burst credits work
The instance maintains a credit pool for each budget (IOPS and throughput). The pool capacity is:
credit_pool = (burst_ceiling - baseline) * 1800
The 1800 comes from 30 minutes (1800 seconds) of burst at the maximum rate, which AWS provisions as the pool size for burstable Amazon EBS-optimized instances. Credits drain when usage exceeds baseline and refill when usage is below baseline, at a rate of baseline – effective_usage per second, where effective_usage is min(actual_usage, burst_ceiling). The instance cannot deliver more than the ceiling regardless of credit balance, so credits drain at the ceiling rate, not the requested rate. The pool is capped at its maximum and floored at zero. When credits hit zero, your workload is throttled to baseline performance. AWS resets the pool to full every 24 hours, giving you at least 30 minutes of burst capacity per day.
With the time series data and the target limits, you can simulate what the credit balance would look like on the smaller instance. For each 5-minute interval in your observation window:
Where interval_seconds is 300 for 5-minute data or 60 for 1-minute data.
When actual usage is below baseline, credits accumulate. When above, they drain. Run this across the full observation window, resetting the pool to full at the start of each 24-hour period to model the AWS top-off guarantee. Start each day with a full pool, then drain and refill through the day’s intervals. If the balance hits zero on any day, the workload will throttle on the smaller instance.
Run the simulation twice: once for IOPS, once for throughput. Throttling happens if either pool hits zero.
A Python script that pulls Amazon CloudWatch data for a given instance ID, looks up the target instance type’s Amazon EBS limits, and runs this simulation end-to-end is available at sample-ec2-ebs-burst-analyzer repository.
This simulation is an approximation
It models credit behavior at 5-minute (or 1-minute) granularity using Amazon CloudWatch aggregates, not the actual per-second I/O stream. Two factors make the simulation more conservative than reality, and two can make reality worse than the simulation.
The Maximum statistic returns the highest 1-minute total within each 5-minute window. The simulation applies that peak rate across the full 300-second interval. This overestimates credit drain by up to 5x for any given interval, because the other 4 minutes likely had lower usage. The tradeoff is intentional. If the simulation says the workload fits, the result is reliable. If it says the workload doesn’t fit, the actual situation might be better than predicted. In that case, re-run with the Average statistic for a less conservative check, or pull 1-minute data (available for the most recent 15 days in Amazon CloudWatch) for higher fidelity.
Working in the other direction, two things can make the real situation worse than the simulation predicts. If the downsize also reduces memory, database workloads (SQL Server buffer pool, PostgreSQL shared_buffers, Oracle SGA) will generate more disk I/O than what you measured because the smaller cache forces more page reads from Amazon EBS. Account for this by including additional headroom in the burst credit budget. And I/O spikes that last milliseconds don’t show up in 5-minute Amazon CloudWatch data. If EBSByteBalance% or EBSIOBalance% are trending down on the current instance but your throughput metrics look fine, the workload is microbursting.
What to look for in the results
The simulation produces two outputs per budget (IOPS and throughput): the low-water mark (lowest credit balance across the observation window) and the number of intervals where the balance hit zero.
IOPS credit balance (EBSIOBalance%) – If the simulated low-water mark stays well above zero, the workload’s IOPS pattern fits within the target’s burst budget. A low-water mark of 90 percent means the workload barely touches the IOPS burst pool. A low-water mark of 40 percent means it fits today but has limited room for IOPS growth.
Throughput credit balance (EBSByteBalance%) – Same logic for throughput. Check this independently because a workload can be comfortable on IOPS but tight on throughput, or the reverse.
Intervals at zero – If either balance hits zero on any day, the workload will throttle to baseline on this instance type.
Peak usage vs. burst ceiling – The ceiling is the absolute maximum regardless of credit balance. If your peak throughput exceeds MaximumThroughputInMBps or peak IOPS exceeds MaximumIops, the instance will cap I/O at the ceiling rate during those intervals. This doesn’t mean the workload doesn’t fit overall (credits might still be fine), but the application will experience reduced I/O during those peaks. A handful of brief spikes may be acceptable. Sustained ceiling breaches are a stronger signal to size up.
Throttled intervals – The most direct measure of impact. A throttled interval is one where the credit balance is at zero and usage exceeds baseline. During these intervals, the instance cannot deliver what the workload is asking for. A few throttled intervals during a nightly batch may be tolerable. Dozens per day during business hours is a problem.
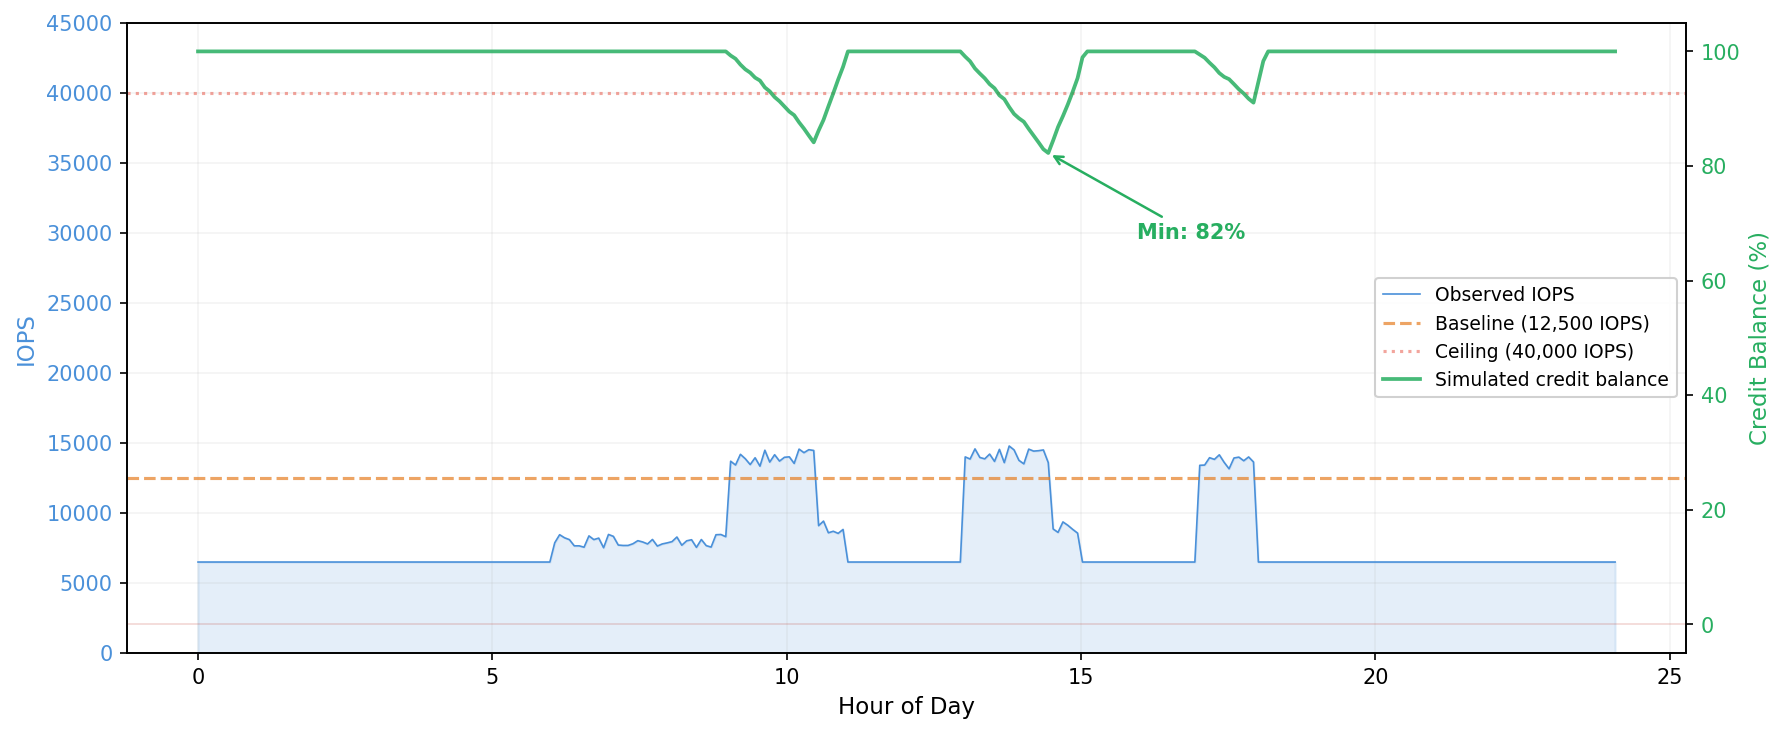
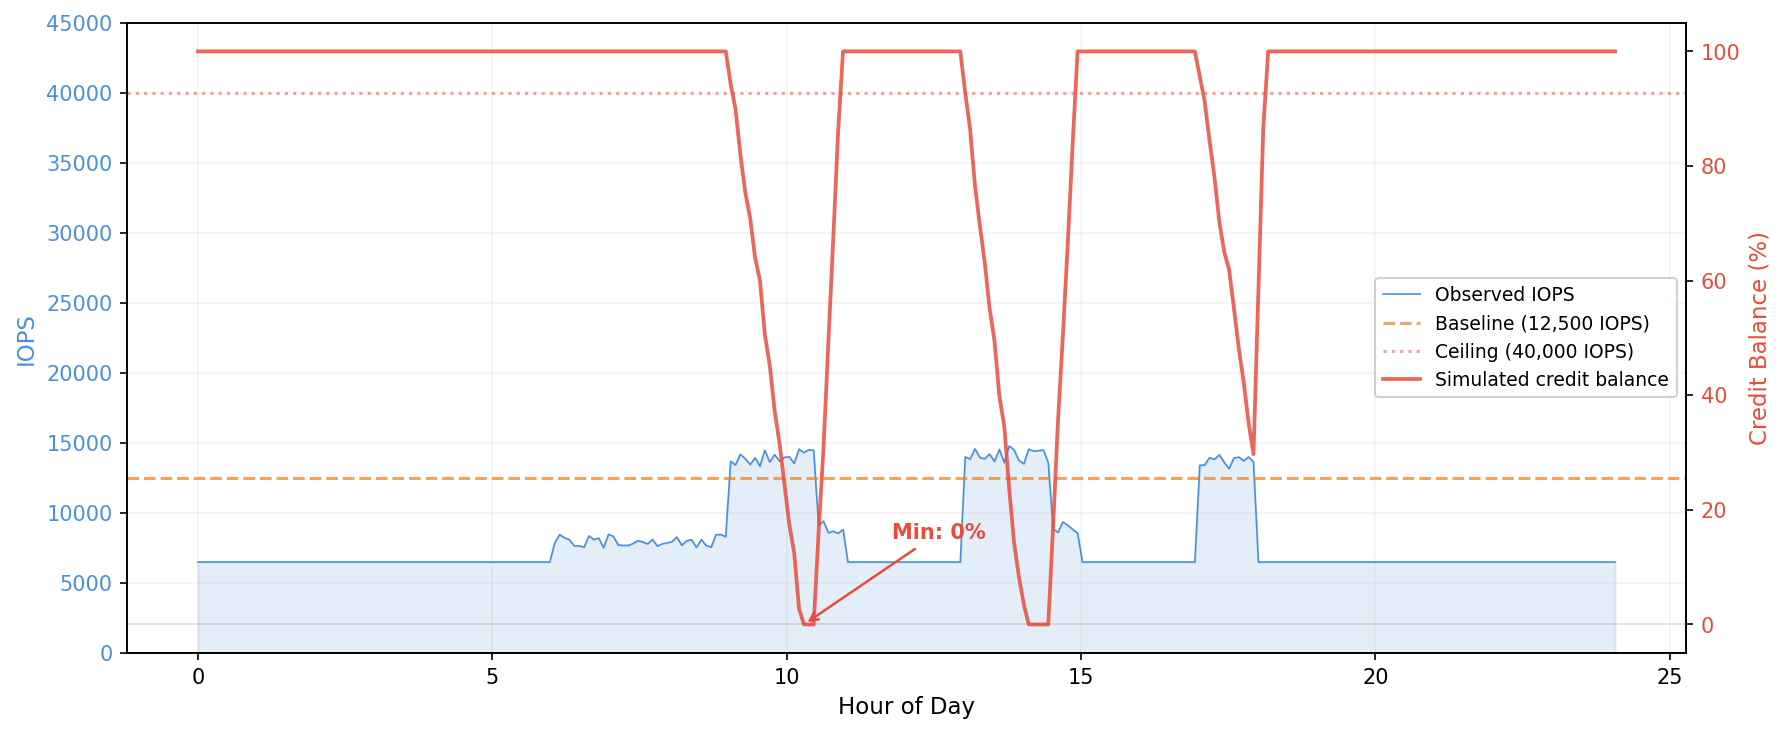
The following two figures show what these outcomes look like. In the first, the workload bursts above baseline during business hours but credits never fully deplete. The minimum balance stays at 82 percent, well above zero. This workload is safe to downsize.
In the second figure, the same workload runs on a smaller instance type with a lower burst pool. Credits deplete within the first burst window and stay near zero for most of the business day. This workload would throttle on the smaller instance.
The following servers are from a customer running SQL Server on EC2. We simulated the burst credit balance for each against the proposed target instance type, using 28 days of Amazon CloudWatch data at 5-minute granularity with the Maximum statistic.
Server A: fits comfortably (current: c6in.4xlarge; proposed: r6i.large)
Simulating the credit balance across 28 days with a daily pool reset:
IOPS
Throughput
Credit pool
65,520,000
2,103,750 MB
Low-water mark
52,084,325 (79.5%)
1,656,415 MB (78.7%)
Intervals at zero
0
0
On the worst day for throughput, here’s what the simulation looks like during the evening burst window, showing how credits drain and recover interval by interval:
Time
Throughput (MB/s)
Net credit change
Balance
Balance %
22:00
154.25
-21,900
1,854,076
88.1%
22:05
22.57
+17,603
1,871,679
89.0%
22:10
452.16
-111,273
1,760,406
83.7%
22:15
427.89
-103,991
1,656,415
78.7%
22:20
30.99
+15,077
1,671,492
79.5%
At 22:10 and 22:15, throughput spiked above 400 MB/s, well above the 81.25 MB/s baseline but still under the 1,250 MB/s burst ceiling. Each interval drained roughly 100,000 credits. The pool hit its low-water mark of 78.7 percent at 22:15, then immediately began recovering as throughput dropped. By 23:55, the pool was back to 100 percent.
Assessment: fits, with roughly 20 percent headroom on the worst day.
Server B: fits but tight (same workload as Server A; proposed: r5.large)
Same workload, same burst pattern, but the r5.large has a smaller credit pool, so the same spikes drain a larger percentage. The throughput low-water mark drops from 78.7 percent to 51.5 percent. The same evening burst window that used 20 percent of the r6i.large pool now consumes nearly half the r5.large pool:
Time
Throughput (MB/s)
Net credit change
Balance
Balance %
22:00
154.25
-21,900
672,826
72.9%
22:05
22.57
+17,603
690,429
74.8%
22:10
452.16
-111,273
579,156
62.8%
22:15
427.89
-103,991
475,165
51.5%
22:20
30.99
+15,077
490,242
53.1%
This still fits, but with limited margin. Any workload growth (more users, larger databases, additional backup jobs) could push the balance toward zero. Separately, a single IOPS interval reached 20,226, exceeding the r5.large burst ceiling of 18,750. The instance can only deliver up to the ceiling while credits remain, so the application received 18,750 IOPS during that interval. That single spike would not cause sustained throttling, but combined with the tight throughput margins, it confirms this workload is at the boundary of what r5.large can handle.
Assessment: fits today, but not a safe long-term choice.
Server C: ceiling breach (current: c6in.4xlarge; proposed: r6i.xlarge)
Peak throughput: 1,502.94 MB/s. This exceeds the 1,250 MB/s burst ceiling. During those peak intervals, the instance would cap throughput at 1,250 MB/s while credits remain. If credits are exhausted, throughput drops to the 156.25 MB/s baseline. The credit simulation might still show the workload fits (credits never hit zero), but the application would experience reduced I/O during those peaks. For this customer, the peaks coincided with production SQL Server activity, so even brief throttling wasn’t acceptable, and a larger instance type was needed.
Assessment: workload will be throttled during peak intervals. Whether that’s acceptable depends on the application’s sensitivity to I/O latency.
Monitoring after the resize
The pre-migration analysis uses historical data from the larger instance. After you resize, real metrics replace the simulation. Monitor the following three layers:
InstanceEBSThroughputExceededCheck and InstanceEBSIOPSExceededCheck = 1 means the instance is actively throttling. This is the definitive signal. Alarm on Sum > 0 over 3 consecutive 1-minute periods to filter out single-second spikes that resolve on their own.
EBSByteBalance% and EBSIOBalance% trending downward over days or weeks means the workload is growing into the instance’s limits. You’re not throttling yet, but you’re on a trajectory. An instance that dips to 90 percent nightly and recovers is in a different position than one that dips to 40 percent and barely recovers before the next burst. Neither instance is throttling, but the first has headroom while the second doesn’t.
EBSByteBalance% and EBSIOBalance% stay at 100 percent means the workload never exceeds baseline. The instance has unused capacity, and you might even be able to go smaller.
If the workload has weekly patterns, allow at least one full week of data before drawing conclusions.
Conclusion
In this post, we showed how to simulate the EBS-optimized instance burst credit balance against a target instance type’s limits before downsizing an Amazon EC2 instance. The approach pulls Amazon CloudWatch metrics at 5-minute granularity, compares actual throughput and IOPS against the target’s baseline and burst ceiling, and tracks whether the credit balance would hit zero during the observation window.
This covers the Amazon EBS dimension of a right-sizing decision. A complete evaluation also considers CPU utilization, memory usage, and network throughput against the target instance’s limits. For workloads where Amazon EBS utilization is well below baseline, the burst credit simulation might not be necessary.
Amazon Elastic Kubernetes Service (Amazon EKS) on AWS Outposts brings the power of managed Kubernetes to your on-premises infrastructure. Use Amazon EKS on Outposts rack to create hybrid cloud deployments that maintain consistent AWS experiences across environments. As organizations increasingly adopt edge computing and hybrid architectures, storage optimization and performance tuning become critical for successful workload deployment.
Outposts extend AWS infrastructure, services, APIs, and tools to virtually any datacenter, co-location space, or on-premises facility. In this blog post you will learn about your storage options and their performance characteristics which is essential for building resilient, high-performing applications using Amazon EKS on Outposts.
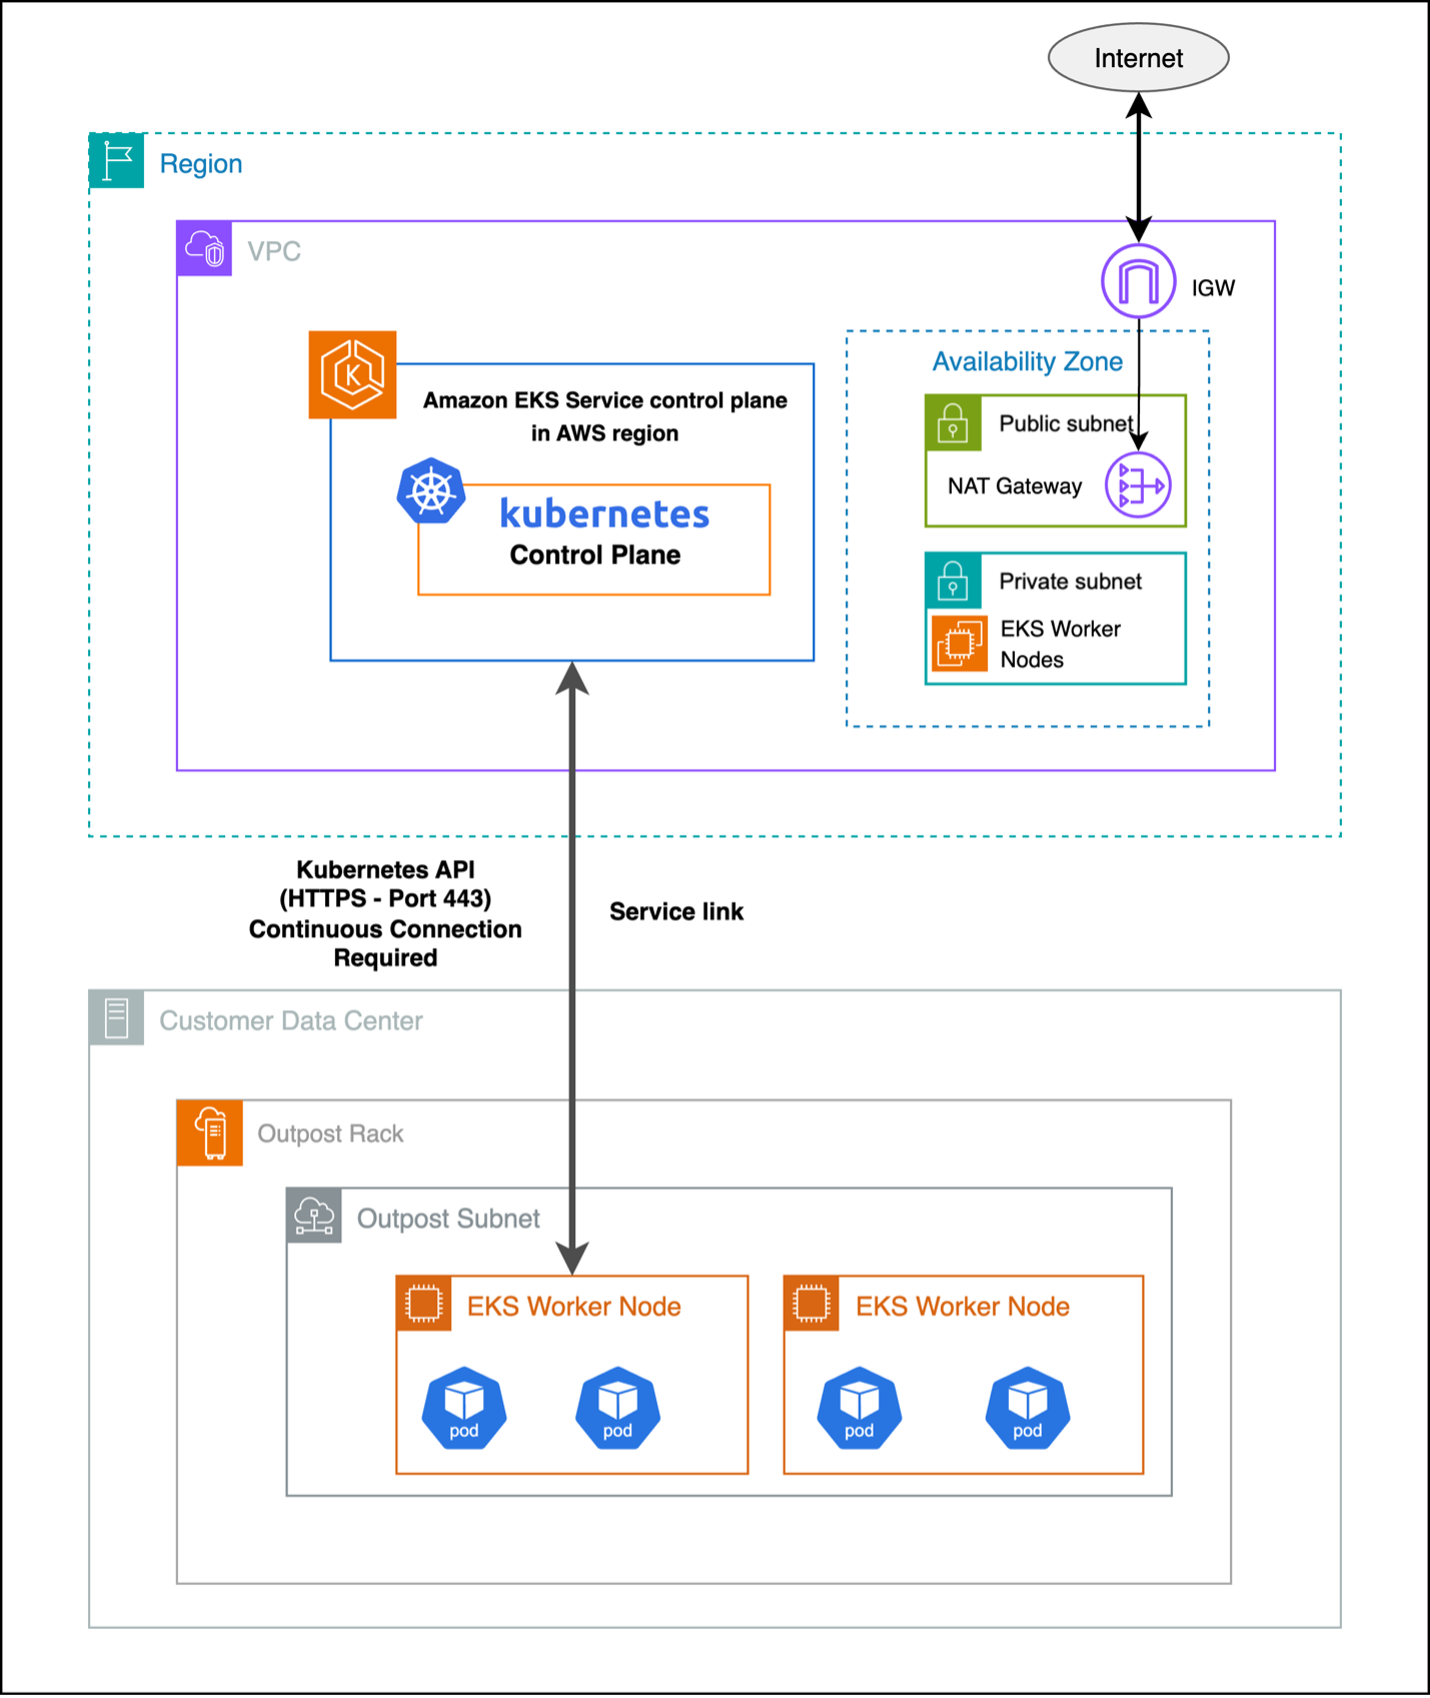
Amazon EKS extended clusters on Outposts provide a powerful solution for organizations seeking to use the benefits of Kubernetes while maintaining certain workloads on-premises, as shown in the following figure. This hybrid architecture allows businesses to extend their EKS clusters from the AWS Cloud to their own data centers or edge locations using Outposts. The Kubernetes control plane remains in the AWS Region, providing centralized management and benefiting from the AWS infrastructure in the cloud and on the Outpost.
Outposts is designed to be a connected service, and needs reliablenetwork connectivity to the AWS Region using the Outposts service link.
Figure 1 : Extended cluster
Amazon EKS local cluster architecture
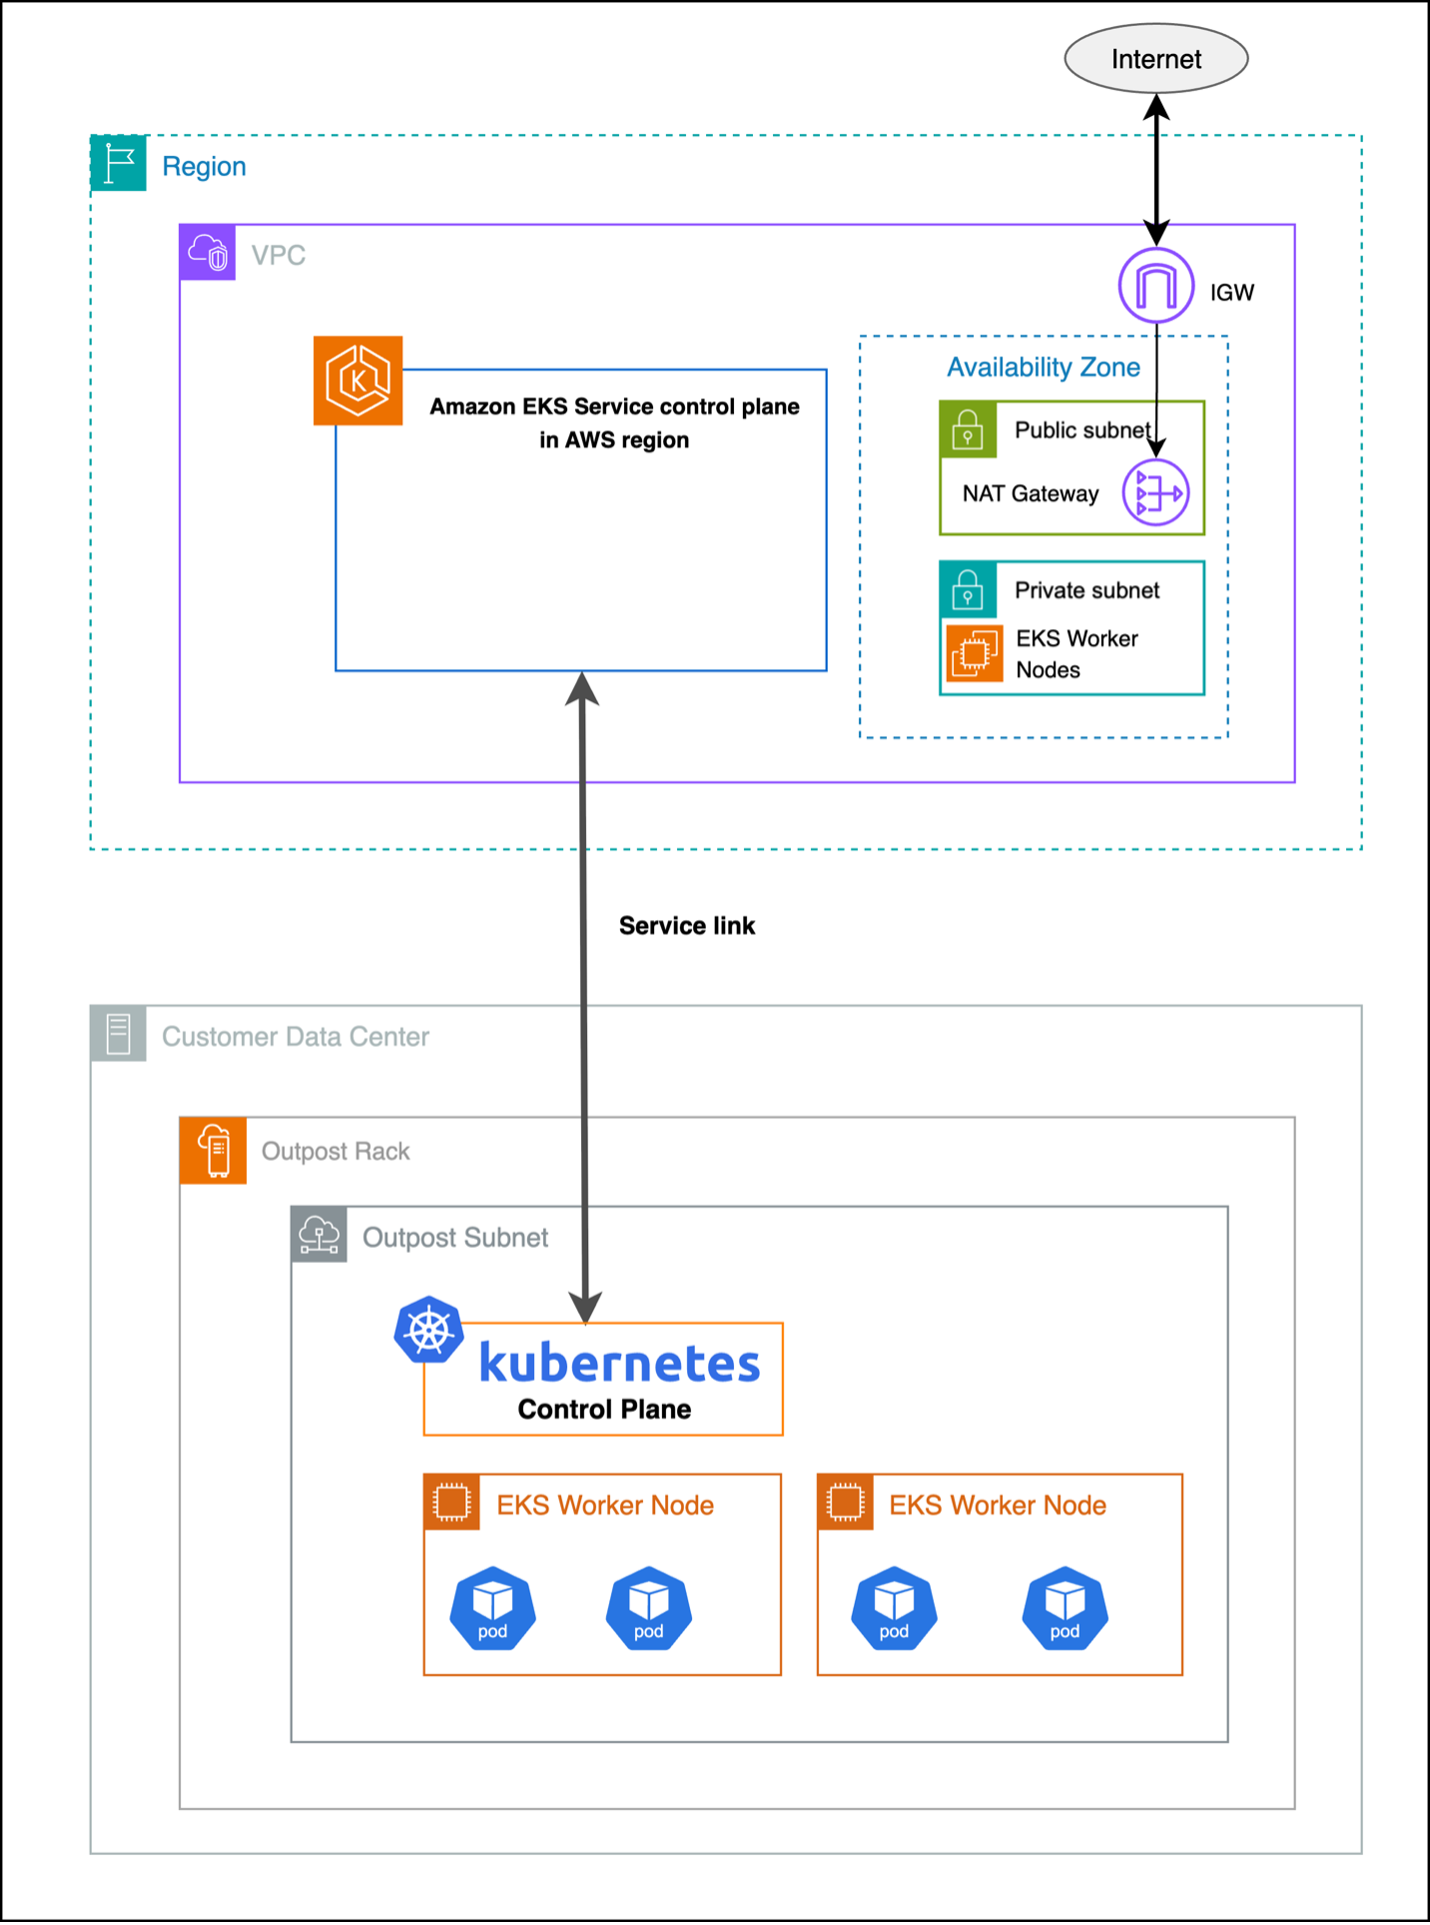
Amazon EKS local clusters deploy the Kubernetes control plane on your Outpost, as shown in the following figure. This provides greater network resilience against outages as cluster operations run entirely on the Outposts and reduces the dependency on network connectivity to the AWS Region. Having the Kubernetes control plane hosted on your Outpost also reduces latency for cluster operations.
Figure 2: Local cluster
Storage options for Amazon EKS extended clusters on Outposts
Persistent Volumes (PV) and Persistent Volume Claims (PVC) serve as a critical abstraction layer in Kubernetes, separating the storage consumption details from storage provisioning, and allowing administrators to manage storage resources independently from how applications consume them. PVs and PVCs make sure of data persistence across pod restarts and rescheduling events, making them essential for applications that need to maintain state, such as databases, file storage systems, and other data-intensive workloads. The abstraction provided by PV and PVC enables platform-agnostic storage management, where applications can request storage through PVCs without needing to know the underlying storage implementation details. PVs and PVCs support dynamic provisioning through Storage Classes, allowing for automated storage allocation based on application demands, while also providing features such as access modes, capacity management, and reclaim policies to effectively manage the storage lifecycle in a Kubernetes cluster.
Integrating Amazon EBS with Amazon EKS
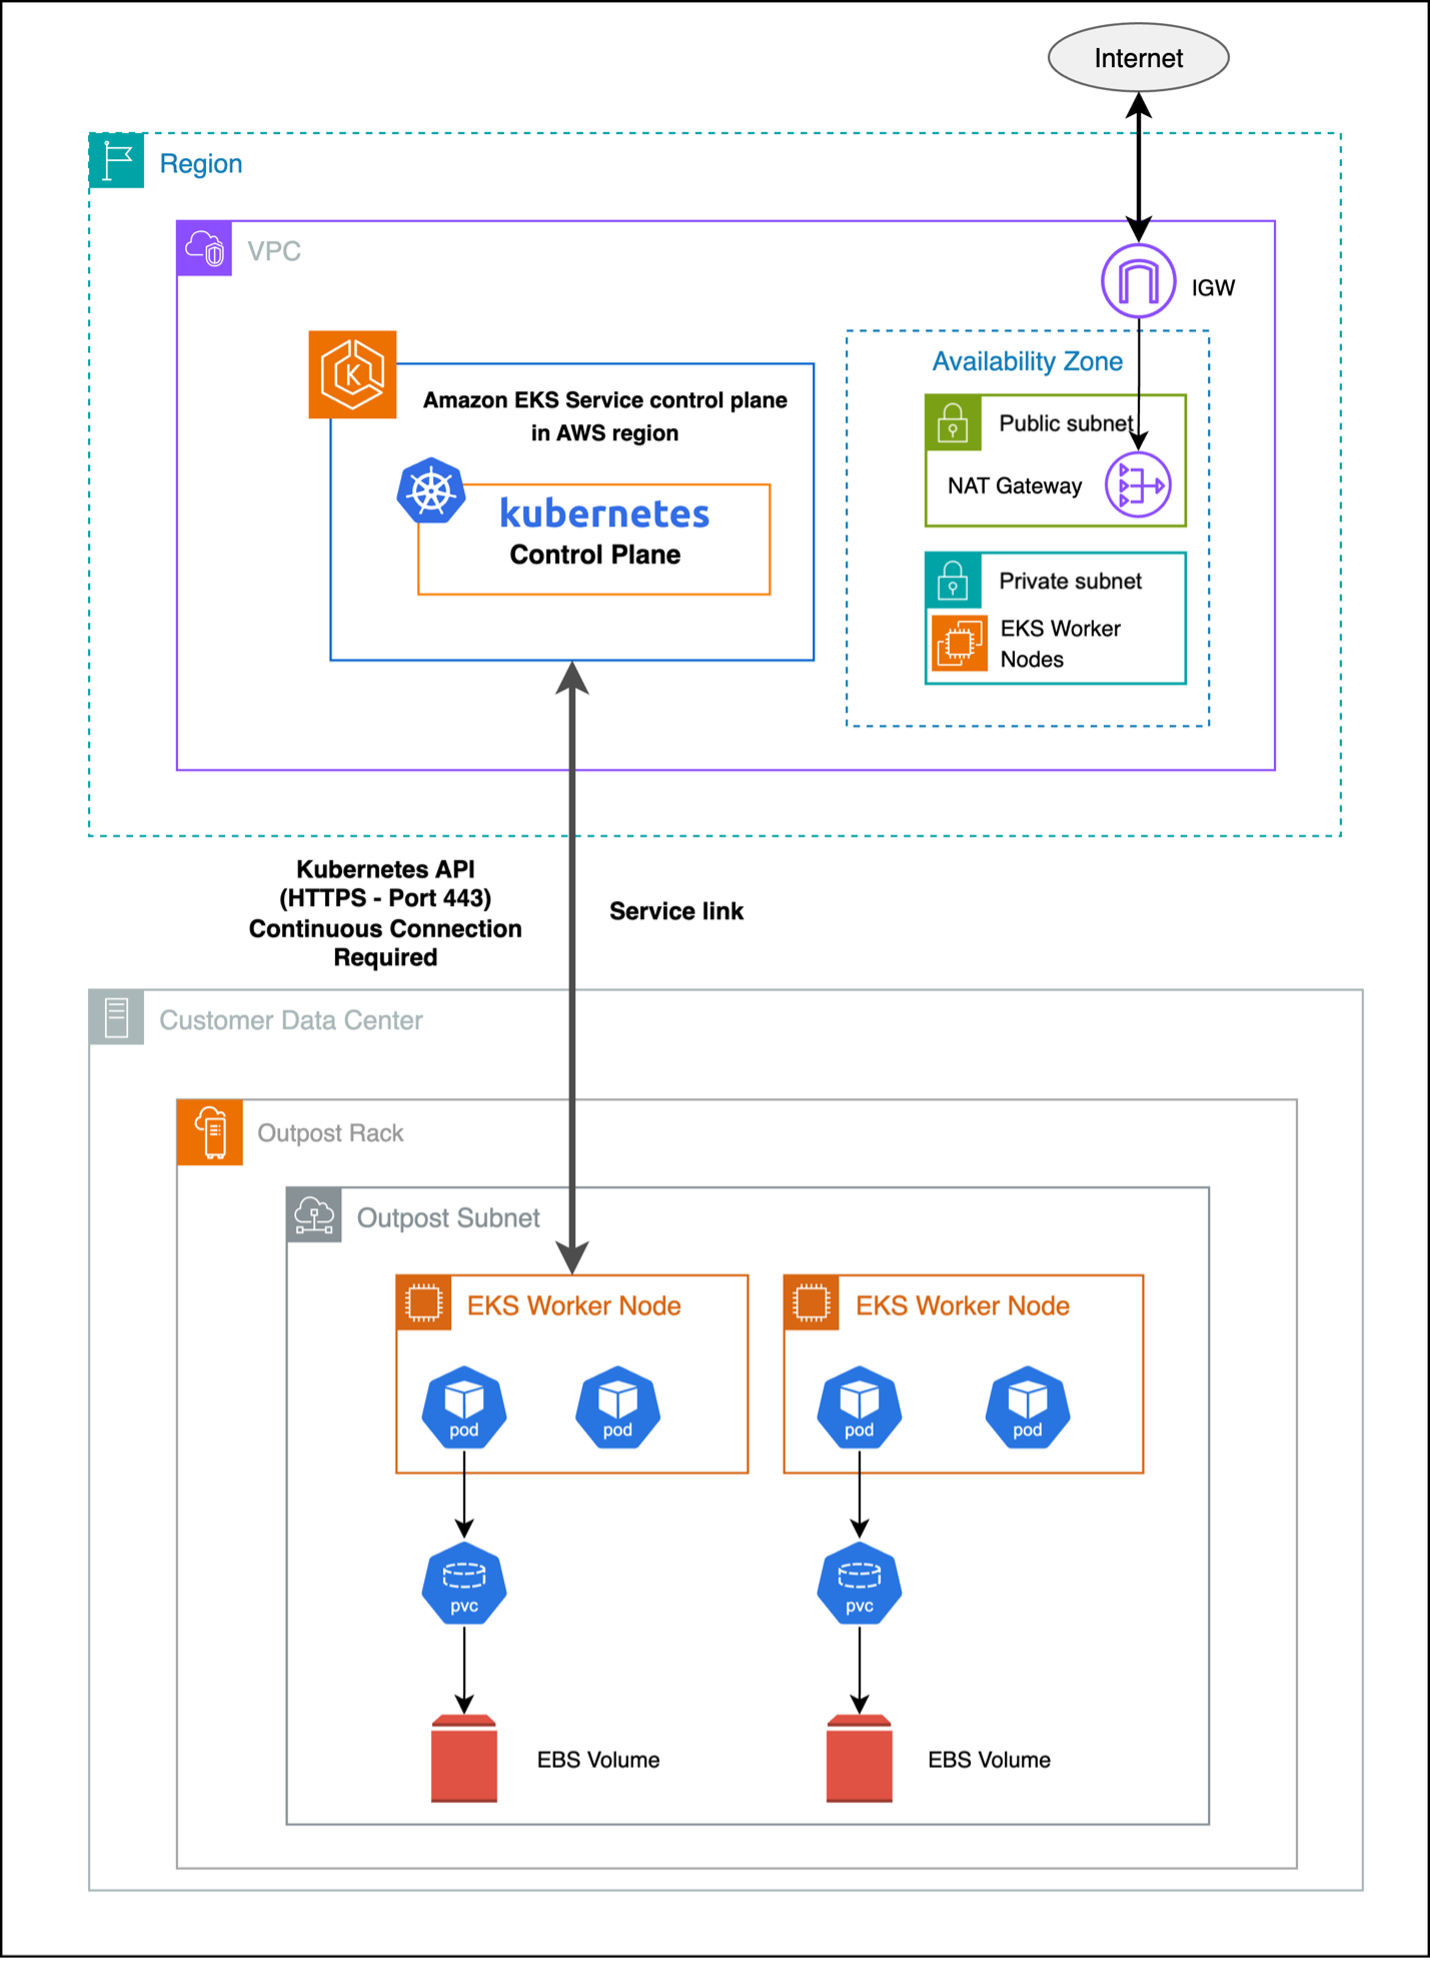
Amazon Elastic Block Store (Amazon EBS) provides high-performance block storage that’s ideal for low-latency applications providing consistent performance. When deployed on Outposts racks, EBS volumes are stored on the Outposts hardware, providing significant performance advantages over network-attached storage solutions, as shown in the following figure.
Figure 3 : Integrating Amazon EBS with Amazon EKS on Outposts
Benefits and use cases
Storage: EBS volumes on Outposts racks provide data access without dependency on external connectivity.
Performance: Local storage delivers consistent latency and high IOPS/throughput.
Cost: On-premises storage eliminates data transfer costs and reduces bandwidth needs, lowering the total cost of ownership.
Implementation considerations
Consider the following when using EBS on Outposts rack:
EBS volumes on Outposts are tied to a single rack and the availability zone the Outpost is homed to, needing applications to address single-point-of-failure risks.
Protect data using EBS snapshots in the parent Region and schedule regular backups.
Capacity on Outposts is finite, monitor Outposts storage usage and plan expansions proactively to avoid insufficient capacity errors.
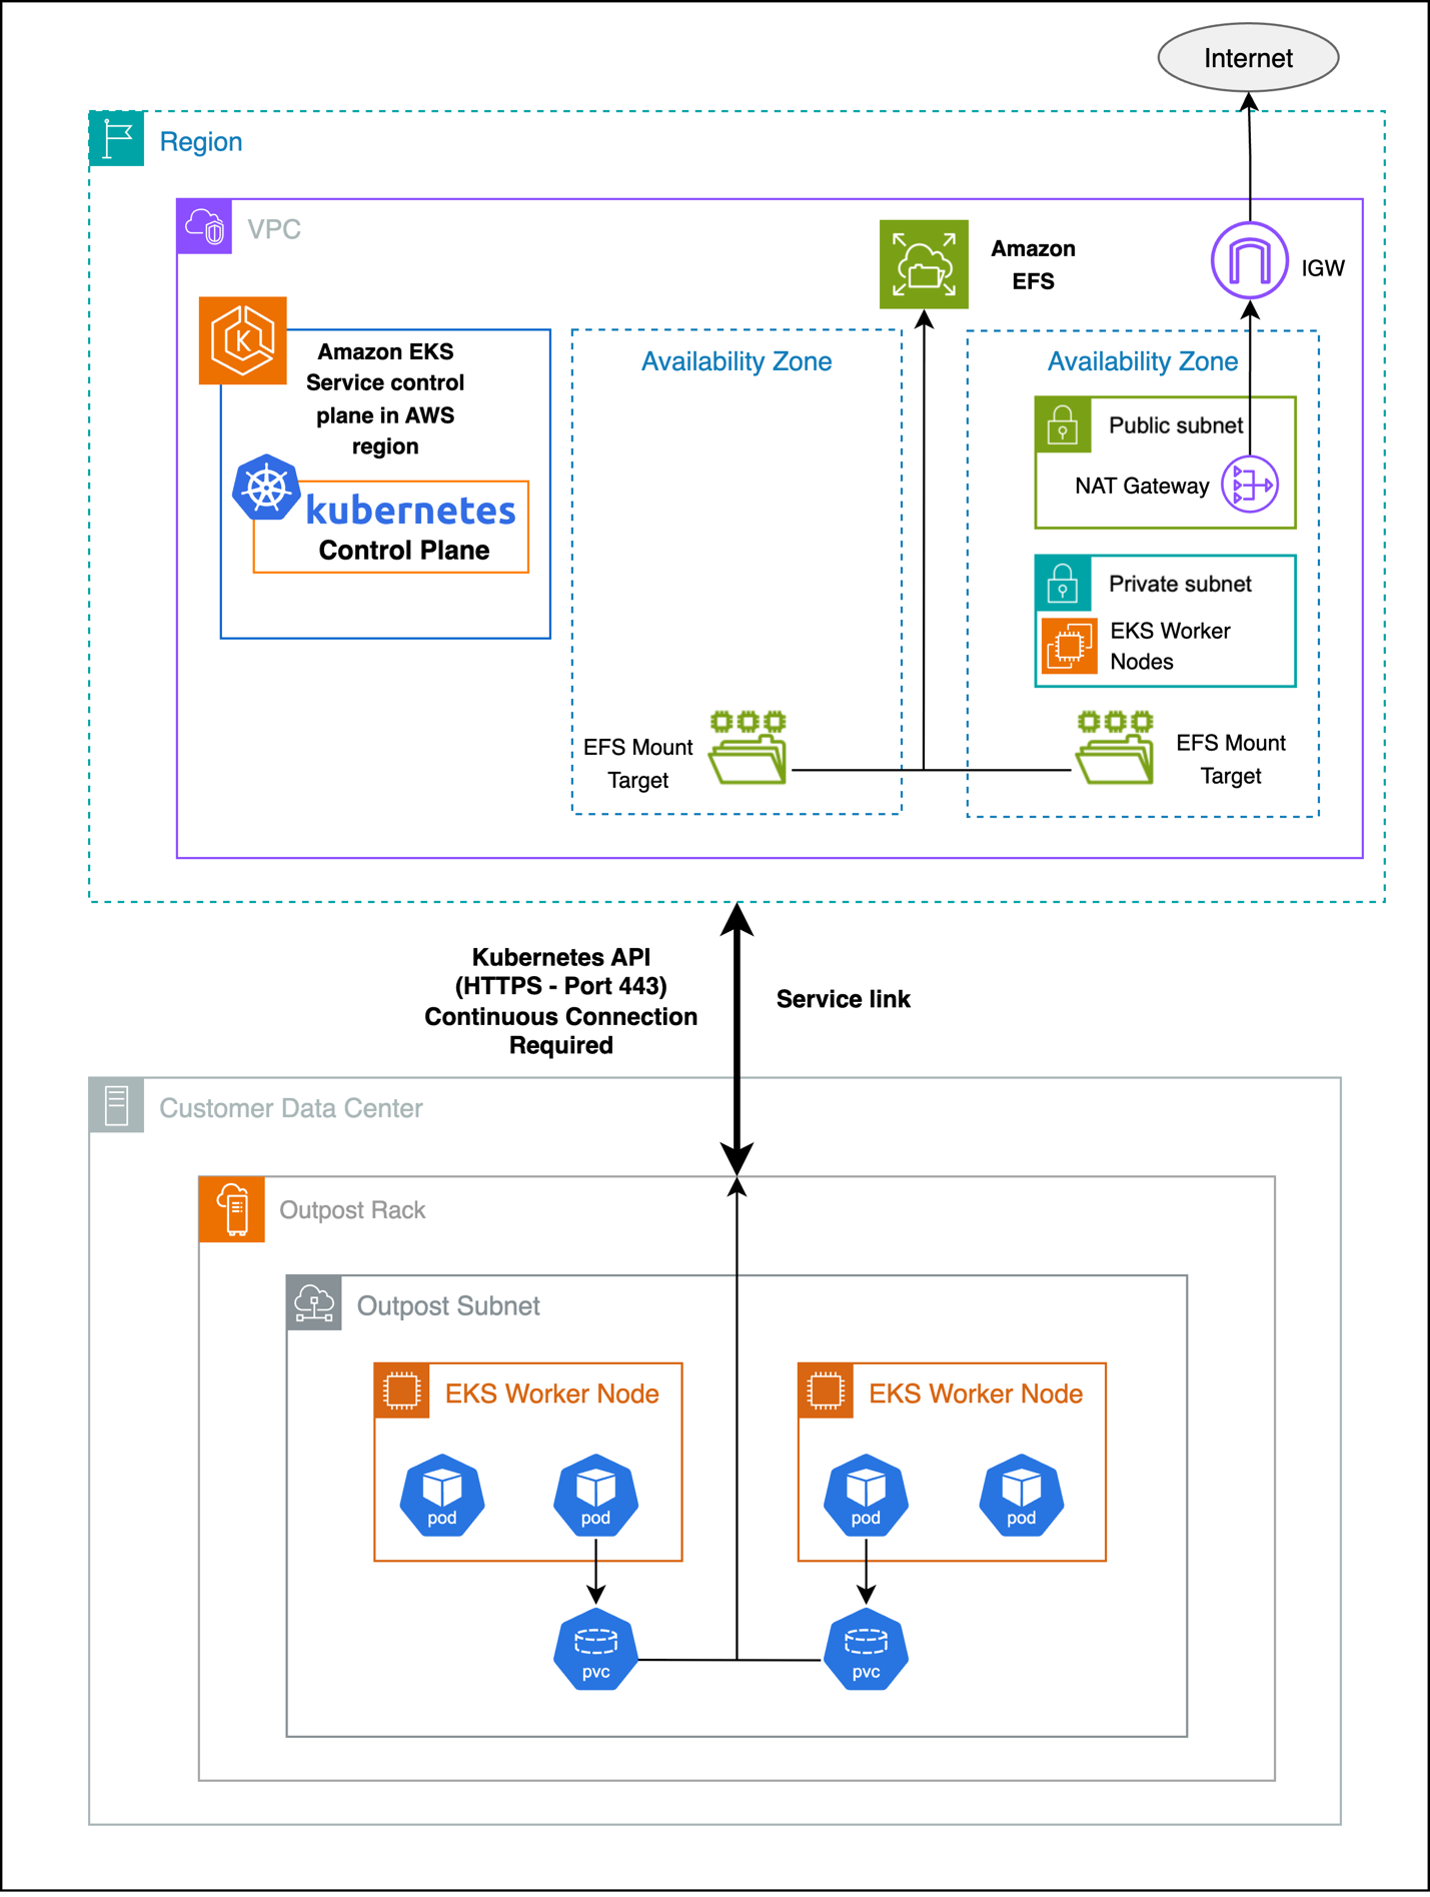
Amazon Elastic File System (Amazon EFS) provides scalable, shared file storage that can be accessed across multiple AWS Availability Zones (AZs) and on-premises environments. Although Amazon EFS with Amazon EKS on Outposts maintains the same setup procedures as standard cloud deployments, there is a critical dependency on the service link connection between your Outposts and the AWS Region. Amazon EFS is not a locally supported service on Outposts, so connectivity to the AWS Region is required to use this service with your Outpost.
Amazon EFS allows multiple pods to concurrently access shared file systems. It is well-suited for applications that need collaborative data access, content management, and distributed processing workloads.
Amazon EFS as a persistent storage solution for Amazon EKS extended cluster instances
Amazon EFS as a PV for your Amazon EKS extended cluster operates through a hybrid architecture where the Amazon EFS file system resides in the Region, but mount points can be created on the worker nodes running on Outposts subnets through the service link as shown in the following figure.
Figure 4 : Amazon EFS as a persistent storage solution for extended clusters
Benefits and use cases
Shared storage capabilities: multiple pods can access a centralized file system, enabling shared data, code, and assets across instances.
Scalability: storage capacity and performance automatically scale with usage, eliminating manual provisioning and upfront planning.
Compliance: Amazon EFS provides full file system features and compatibility for traditional applications, such as locking, permissions, and directory structure.
Challenges and limitations
Consider the following when using Amazon EFS with Outposts:
Network latency: file access involves network traversal to Amazon EFS in the Region, adding more latency and making small or metadata operations potentially slow for latency-sensitive applications.
Throughput: aggregate throughput is restricted by the available bandwidth on the service link between the Outposts and AWS Region. This impacts concurrent access and large file transfers during peak usage.
Dependency on AWS Region connectivity: Amazon EFS needs continuous connectivity to the parent Region. Disruptions may affect file system availability, operations, and disaster recovery processes.
Data Transfer charges: Since EFS is in AWS Parent region and EKS worker nodes and pods are in Outpost additional charges are applicable.
Deploying pods on extended clusters using Amazon EFS as PV
Refer to Use Elastic File System Storage with Amazon EFS for deployment guidance. Note, Create Amazon EFS mount targets in subnets that are in the same Availability Zone (AZ) as the Outposts subnets.
Amazon S3 with Amazon EKS extended cluster
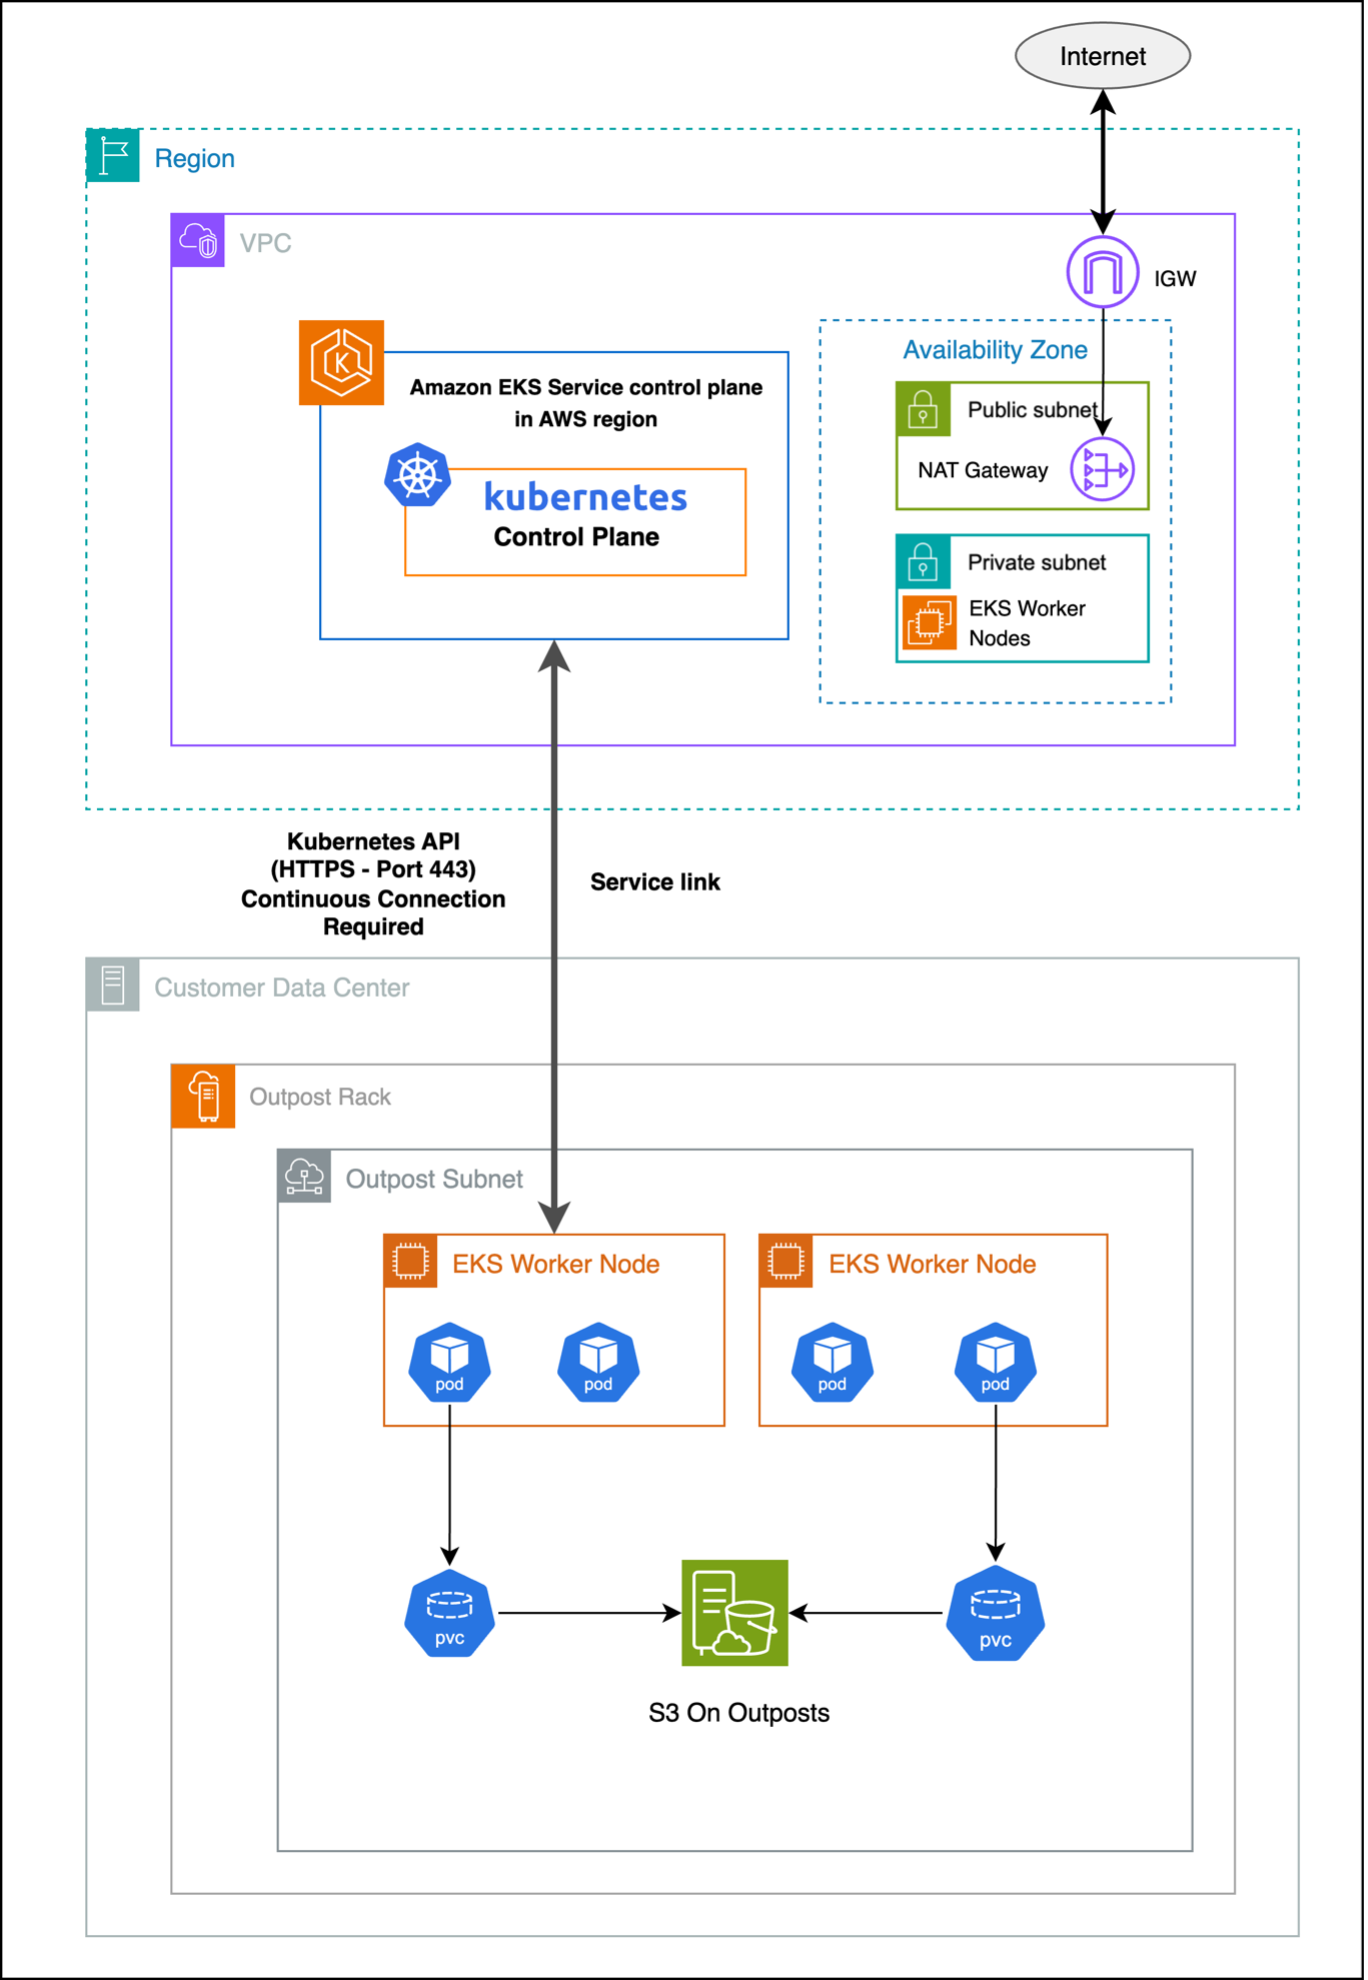
Amazon Simple Storage Service (Amazon S3) on Outposts delivers local object storage on your Outposts, allowing applications to use Amazon S3 APIs for storing and retrieving data while keeping it onsite. It is ideal for workloads that need Amazon S3 compatibility, low latency access to object data, and local data residency.
You should use Amazon S3 access point Amazon Resource Names (ARNs) and not bucket ARNs for proper integration with Amazon EKS workloads.
Figure 5 : Amazon S3 with Amazon EKS extended cluster on Outposts
Benefits and use cases
Data archiving and compliance: Enables cost-effective, locally retained storage for logs, audit trails, regulatory compliance, backups, and sensitive healthcare data with strict residency requirements.
Content distribution and media: Provides ultra-low latency local storage for serving static content, media streaming, digital asset management, and gaming asset delivery.
Data lake and analytics: Supports local data processing for analytics, ETL, machine learning (ML), real-time Internet of Things (IoT) data handling, and business intelligence with reduced latency and transfer costs.
Application integration: Seamlessly integrates with Amazon S3 compatible apps for backup, synchronization, microservices storage, API-driven workflows, and container image management on-premises.
Optimizing performance starts with selecting the right storage type for your workload: Amazon EBS for low-latency, high-throughput block storage; Amazon EFS for shared POSIX-compliant file systems; and Amazon S3 for scalable object storage with API compatibility. Ensure proper volume sizing, monitor usage proactively, and configure CPU and memory requests accurately to balance performance and efficiency—auto scaling and QoS classes can further optimize resource management. Improve data locality by using local storage, apply caching with intelligent eviction, and design for efficient, asynchronous, and compressed data access patterns.
Monitoring and observability
Monitoring key performance metrics is essential to maintain storage efficiency and application reliability. For Amazon EBS, track IOPS, throughput, latency, burst balance, queue depth, and snapshot performance to avoid degradation—see the Amazon CloudWatch metrics for Amazon EBS for the full list. For Amazon EFS, monitor total I/O, throughput, client connections, metadata operations, burst credits, and Regional data transfers to support effective capacity planning—refer to CloudWatch metrics for Amazon EFS. For Amazon S3, observe request and error rates, data transfer, storage usage, latency, multipart upload efficiency, and access patterns to optimize performance and cost—see Metrics and dimensions.
Security considerations
Strong security practices are critical for Amazon EKS on Outposts. Use AWS Key Management Service (AWS KMS) for Amazon EBS encryption, encrypt Amazon EFS data at rest and in transit, and enable server- or client-side encryption for Amazon S3. Enforce TLS for all data transfers and apply key rotation with compliance controls. Implement least privilege IAM policies, scoped roles, and Kubernetes Role-Based Access Control (RBAC) for granular pod access. Secure traffic with security groups and NACLs, and maintain audit logs for all storage operations.
Cost optimization strategies
Manage storage costs by right-sizing volumes, automating lifecycle policies, selecting appropriate storage classes, monitoring data transfer, and using de-duplication and compression where applicable. Lower operational expenses through automated backups, infrastructure as code (IaC), monitoring automation, leveraging managed services, applying cost allocation tags, and conducting regular usage reviews.
Conclusion
Amazon EKS on Outposts empowers organizations to build hybrid applications with storage options that align to performance, compliance, and data residency needs. By selecting the right storage solution for each workload and leveraging Outposts’ local infrastructure, you can reduce latency, minimize network dependencies, and maintain consistency across environments. As Outposts capabilities continue to evolve, they offer a strong foundation for modern, resilient, and cost-efficient hybrid cloud architectures.
Reach out to your AWS account team, or fill out this form to learn more about running containarized applications on Outposts.
In Part 1 of this two-part series, we shared an overview of some of the most important 2021 Amazon Web Services (AWS) Security service and feature launches. In this follow-up, we’ll dive deep into additional launches that are important for security professionals to be aware of and understand across all AWS services. There have already been plenty in the first half of 2022, so we’ll highlight those soon, as well.
AWS Identity
You can use AWS Identity Services to build Zero Trust architectures, help secure your environments with a robust data perimeter, and work toward the security best practice of granting least privilege. In 2021, AWS expanded the identity source options, AWS Region availability, and support for AWS services. There is also added visibility and power in the permission management system. New features offer new integrations, additional policy checks, and secure resource sharing across AWS accounts.
AWS Single Sign-On
For identity management, AWS Single Sign-On (AWS SSO) is where you create, or connect, your workforce identities in AWS once and manage access centrally across your AWS accounts in AWS Organizations. In 2021, AWS SSO announced new integrations for JumpCloud and CyberArk users. This adds to the list of providers that you can use to connect your users and groups, which also includes Microsoft Active Directory Domain Services, Okta Universal Directory, Azure AD, OneLogin, and Ping Identity.
For access management, there have been a range of feature launches with AWS Identity and Access Management (IAM) that have added up to more power and visibility in the permissions management system. Here are some key examples.
IAM made it simpler to relate a user’s IAM role activity to their corporate identity. By setting the new source identity attribute, which persists through role assumption chains and gets logged in AWS CloudTrail, you can find out who is responsible for actions that IAM roles performed.
IAM added support for policy conditions, to help manage permissions for AWS services that access your resources. This important feature launch of service principal conditions helps you to distinguish between API calls being made on your behalf by a service principal, and those being made by a principal inside your account. You can choose to allow or deny the calls depending on your needs. As a security professional, you might find this especially useful in conjunction with the aws:CalledVia condition key, which allows you to scope permissions down to specify that this account principal can only call this API if they are calling it using a particular AWS service that’s acting on their behalf. For example, your account principal can’t generally access a particular Amazon Simple Storage Service (Amazon S3) bucket, but if they are accessing it by using Amazon Athena, they can do so. These conditions can also be used in service control policies (SCPs) to give account principals broader scope across an account, organizational unit, or organization; they need not be added to individual principal policies or resource policies.
Another very handy new IAM feature launch is additional information about the reason for an access denied error message. With this additional information, you can now see which of the relevant access control policies (for example, IAM, resource, SCP, or VPC endpoint) was the cause of the denial. As of now, this new IAM feature is supported by more than 50% of all AWS services in the AWS SDK and AWS Command Line Interface, and a fast-growing number in the AWS Management Console. We will continue to add support for this capability across services, as well as add more features that are designed to make the journey to least privilege simpler.
IAM Access Analyzer also launched the ability to generate fine-grained policies based on analyzing past AWS CloudTrail activity. This feature provides a great new capability for DevOps teams or central security teams to scope down policies to just the permissions needed, making it simpler to implement least privilege permissions. IAM Access Analyzer launched further enhancements to expand policy checks, and the ability to generate a sample least-privilege policy from past activity was expanded beyond the account level to include an analysis of principal behavior within the entire organization by analyzing log activity stored in AWS CloudTrail.
AWS Resource Access Manager
AWS Resource Access Manager (AWS RAM) helps you securely share your resources across unrelated AWS accounts within your organization or organizational units (OUs) in AWS Organizations. Now you can also share your resources with IAM roles and IAM users for supported resource types. This update enables more granular access using managed permissions that you can use to define access to shared resources. In addition to the default managed permission defined for each shareable resource type, you now have more flexibility to choose which permissions to grant to whom for resource types that support additional managed permissions. Additionally, AWS RAM added support for global resource types, enabling you to provision a global resource once, and share that resource across your accounts. A global resource is one that can be used in multiple AWS Regions; the first example of a global resource is found in AWS Cloud WAN, currently in preview as of this publication. AWS RAM helps you more securely share an AWS Cloud WAN core network, which is a managed network containing AWS and on-premises networks. With AWS RAM global resource sharing, you can use the Cloud WAN core network to centrally operate a unified global network across Regions and accounts.
AWS Directory Service
AWS Directory Service for Microsoft Active Directory, also known as AWS Managed Microsoft Active Directory (AD), was updated to automatically provide domain controller and directory utilization metrics in Amazon CloudWatch for new and existing directories. Analyzing these utilization metrics helps you quantify your average and peak load times to identify the need for additional domain controllers. With this, you can define the number of domain controllers to meet your performance, resilience, and cost requirements.
Amazon Cognito
Amazon Cognitoidentity pools (federated identities) was updated to enable you to use attributes from social and corporate identity providers to make access control decisions and simplify permissions management in AWS resources. In Amazon Cognito, you can choose predefined attribute-tag mappings, or you can create custom mappings using the attributes from social and corporate providers’ access and ID tokens, or SAML assertions. You can then reference the tags in an IAM permissions policy to implement attribute-based access control (ABAC) and manage access to your AWS resources. Amazon Cognito also launched a new console experience for user pools and now supports targeted sign out through refresh token revocation.
Governance, control, and logging services
There were a number of important releases in 2021 in the areas of governance, control, and logging services.
This approach provides a powerful new middle ground between the older security models of prevention (which provide developers only an access denied message, and often can’t distinguish between an acceptable and an unacceptable use of the same API) and a detect and react model (when undesired states have already gone live). The Cfn-Guard 2.0 model gives builders the freedom to build with IaC, while allowing central teams to have the ability to reject infrastructure configurations or changes that don’t conform to central policies—and to do so with completely custom error messages that invite dialog between the builder team and the central team, in case the rule is unnuanced and needs to be refined, or if a specific exception needs to be created.
For example, a builder team might be allowed to provision and attach an internet gateway to a VPC, but the team can do this only if the routes to the internet gateway are limited to a certain pre-defined set of CIDR ranges, such as the public addresses of the organization’s branch offices. It’s not possible to write an IAM policy that takes into account the CIDR values of a VPC route table update, but you can write a Cfn-Guard 2.0 rule that allows the creation and use of an internet gateway, but only with a defined and limited set of IP addresses.
AWS Systems Manager Incident Manager
An important launch that security professionals should know about is AWS Systems Manager Incident Manager. Incident Manager provides a number of powerful capabilities for managing incidents of any kind, including operational and availability issues but also security issues. With Incident Manager, you can automatically take action when a critical issue is detected by an Amazon CloudWatch alarm or Amazon EventBridge event. Incident Manager runs pre-configured response plans to engage responders by using SMS and phone calls, can enable chat commands and notifications using AWS Chatbot, and runs automation workflows with AWS Systems Manager Automation runbooks. The Incident Manager console integrates with AWS Systems Manager OpsCenter to help you track incidents and post-incident action items from a central place that also synchronizes with third-party management tools such as Jira Service Desk and ServiceNow. Incident Manager enables cross-account sharing of incidents using AWS RAM, and provides cross-Region replication of incidents to achieve higher availability.
Amazon Simple Storage Service (Amazon S3) is one of the most important services at AWS, and its steady addition of security-related enhancements is always big news. Here are the 2021 highlights.
Access Points aliases
Amazon S3 introduced a new feature, Amazon S3 Access Points aliases. With Amazon S3 Access Points aliases, you can make the access points backwards-compatible with a large amount of existing code that is programmed to interact with S3 buckets rather than access points.
To understand the importance of this launch, we have to go back to 2019 to the launch of Amazon S3 Access Points. Access points are a powerful mechanism for managing S3 bucket access. They provide a great simplification for managing and controlling access to shared datasets in S3 buckets. You can create up to 1,000 access points per Region within each of your AWS accounts. Although bucket access policies remain fully enforced, you can delegate access control from the bucket to its access points, allowing for distributed and granular control. Each access point enforces a customizable policy that can be managed by a particular workgroup, while also avoiding the problem of bucket policies needing to grow beyond their maximum size. Finally, you can also bind an access point to a particular VPC for its lifetime, to prevent access directly from the internet.
With the 2021 launch of Access Points aliases, Amazon S3 now generates a unique DNS name, or alias, for each access point. The Access Points aliases look and acts just like an S3 bucket to existing code. This means that you don’t need to make changes to older code to use Amazon S3 Access Points; just substitute an Access Points aliases wherever you previously used a bucket name. As a security team, it’s important to know that this flexible and powerful administrative feature is backwards-compatible and can be treated as a drop-in replacement in your various code bases that use Amazon S3 but haven’t been updated to use access point APIs. In addition, using Access Points aliases adds a number of powerful security-related controls, such as permanent binding of S3 access to a particular VPC.
S3 Bucket Keys were launched at the end of 2020, another great launch that security professionals should know about, so here is an overview in case you missed it. S3 Bucket Keys are data keys generated by AWS KMS to provide another layer of envelope encryption in which the outer layer (the S3 Bucket Key) is cached by S3 for a short period of time. This extra key layer increases performance and reduces the cost of requests to AWS KMS. It achieves this by decreasing the request traffic from Amazon S3 to AWS KMS from a one-to-one model—one request to AWS KMS for each object written to or read from Amazon S3—to a one-to-many model using the cached S3 Bucket Key. The S3 Bucket Key is never stored persistently in an unencrypted state outside AWS KMS, and so Amazon S3 ultimately must always return to AWS KMS to encrypt and decrypt the S3 Bucket Key, and thus, the data. As a result, you still retain control of the key hierarchy and resulting encrypted data through AWS KMS, and are still able to audit Amazon S3 returning periodically to AWS KMS to refresh the S3 Bucket Keys, as logged in CloudTrail.
Returning to our review of 2021, S3 Bucket Keys gained the ability to use Amazon S3 Inventory and Amazon S3 Batch Operations automatically to migrate objects from the higher cost, slightly lower-performance SSE-KMS model to the lower-cost, higher-performance S3 Bucket Keys model.
To understand this launch, we need to go in time to the origins of Amazon S3, which is one of the oldest services in AWS, created even before IAM was launched in 2011. In those pre-IAM days, a storage system like Amazon S3 needed to have some kind of access control model, so Amazon S3 invented its own: Amazon S3 access control lists (ACLs). Using ACLs, you could add access permissions down to the object level, but only with regard to access by other AWS account principals (the only kind of identity that was available at the time), or public access (read-only or read-write) to an object. And in this model, objects were always owned by the creator of the object, not the bucket owner.
After IAM was introduced, Amazon S3 added the bucket policy feature, a type of resource policy that provides the rich features of IAM, including full support for all IAM principals (users and roles), time-of-day conditions, source IP conditions, ability to require encryption, and more. For many years, Amazon S3 access decisions have been made by combining IAM policy permissions and ACL permissions, which has served customers well. But the object-writer-is-owner issue has often caused friction. The good news for security professionals has been that a deny by either type of access control type overrides an allow by the other, so there were no security issues with this bi-modal approach. The challenge was that it could be administratively difficult to manage both resource policies—which exist at the bucket and access point level—and ownership and ACLs—which exist at the object level. Ownership and ACLs might potentially impact the behavior of only a handful of objects, in a bucket full of millions or billions of objects.
With the features released in 2021, Amazon S3 has removed these points of friction, and now provides the features needed to reduce ownership issues and to make IAM-based policies the only access control system for a specified bucket. The first step came in 2020 with the ability to make object ownership track bucket ownership, regardless of writer. But that feature applied only to newly-written objects. The final step is the 2021 launch we’re highlighting here: the ability to disable at the bucket level the evaluation of all existing ACLs—including ownership and permissions—effectively nullifying all object ACLs. From this point forward, you have the mechanisms you need to govern Amazon S3 access with a combination of S3 bucket policies, S3 access point policies, and (within the same account) IAM principal policies, without worrying about legacy models of ACLs and per-object ownership.
Additional database and storage service features
AWS Backup Vault Lock
AWS Backup added an important new additional layer for backup protection with the availability of AWS Backup Vault Lock. A vault lock feature in AWS is the ability to configure a storage policy such that even the most powerful AWS principals (such as an account or Org root principal) can only delete data if the deletion conforms to the preset data retention policy. Even if the credentials of a powerful administrator are compromised, the data stored in the vault remains safe. Vault lock features are extremely valuable in guarding against a wide range of security and resiliency risks (including accidental deletion), notably in an era when ransomware represents a rising threat to data.
ACM Private CA achieved FedRAMP authorization for six additional AWS Regions in the US.
Additional certificate customization now allows administrators to tailor the contents of certificates for new use cases, such as identity and smart card certificates; or to securely add information to certificates instead of relying only on the information present in the certificate request.
Additional capabilities were added for sharing CAs across accounts by using AWS RAM to help administrators issue fully-customized certificates, or revoke them, from a shared CA.
Integration with Kubernetes provides a more secure certificate authority solution for Kubernetes containers.
Online Certificate Status Protocol (OCSP) provides a fully-managed solution for notifying endpoints that certificates have been revoked, without the need for you to manage or operate infrastructure yourself.
Network and application protection
We saw a lot of enhancements in network and application protection in 2021 that will help you to enforce fine-grained security policies at important network control points across your organization. The services and new capabilities offer flexible solutions for inspecting and filtering traffic to help prevent unauthorized resource access.
AWS WAF
AWS WAF launched AWS WAF Bot Control, which gives you visibility and control over common and pervasive bots that consume excess resources, skew metrics, cause downtime, or perform other undesired activities. The Bot Control managed rule group helps you monitor, block, or rate-limit pervasive bots, such as scrapers, scanners, and crawlers. You can also allow common bots that you consider acceptable, such as status monitors and search engines. AWS WAF also added support for custom responses, managed rule group versioning, in-line regular expressions, and Captcha. The Captcha feature has been popular with customers, removing another small example of “undifferentiated work” for customers.
AWS Shield Advanced
AWS Shield Advanced now automatically protects web applications by blocking application layer (L7) DDoS events with no manual intervention needed by you or the AWS Shield Response Team (SRT). When you protect your resources with AWS Shield Advanced and enable automatic application layer DDoS mitigation, Shield Advanced identifies patterns associated with L7 DDoS events and isolates this anomalous traffic by automatically creating AWS WAF rules in your web access control lists (ACLs).
Amazon CloudFront
In other edge networking news, Amazon CloudFront added support for response headers policies. This means that you can now add cross-origin resource sharing (CORS), security, and custom headers to HTTP responses returned by your CloudFront distributions. You no longer need to configure your origins or use custom Lambda@Edge or CloudFront Functions to insert these headers.
Following Route 53 Resolver’s much-anticipated launch of DNS logging in 2020, the big news for 2021 was the launch of its DNS Firewall capability. Route 53 Resolver DNS Firewall lets you create “blocklists” for domains you don’t want your VPC resources to communicate with, or you can take a stricter, “walled-garden” approach by creating “allowlists” that permit outbound DNS queries only to domains that you specify. You can also create alerts for when outbound DNS queries match certain firewall rules, allowing you to test your rules before deploying for production traffic. Route 53 Resolver DNS Firewall launched with two managed domain lists—malware domains and botnet command and control domains—enabling you to get started quickly with managed protections against common threats. It also integrated with Firewall Manager (see the following section) for easier centralized administration.
AWS Network Firewall and Firewall Manager
Speaking of AWS Network Firewall and Firewall Manager, 2021 was a big year for both. Network Firewall added support for AWS Managed Rules, which are groups of rules based on threat intelligence data, to enable you to stay up to date on the latest security threats without writing and maintaining your own rules. AWS Network Firewall features a flexible rules engine enabling you to define firewall rules that give you fine-grained control over network traffic. As of the launch in late 2021, you can enable managed domain list rules to block HTTP and HTTPS traffic to domains identified as low-reputation, or that are known or suspected to be associated with malware or botnets. Prior to that, another important launch was new configuration options for rule ordering and default drop, making it simpler to write and process rules to monitor your VPC traffic. Also in 2021, Network Firewall announced a major regional expansion following its initial launch in 2020, and a range of compliance achievements and eligibility including HIPAA, PCI DSS, SOC, and ISO.
Elastic Load Balancing now supports forwarding traffic directly from Network Load Balancer (NLB) to Application Load Balancer (ALB). With this important new integration, you can take advantage of many critical NLB features such as support for AWS PrivateLink and exposing static IP addresses for applications that still require ALB.
The AWS Networking team also made Amazon VPC private NAT gateways available in both AWS GovCloud (US) Regions. The expansion into the AWS GovCloud (US) Regions enables US government agencies and contractors to move more sensitive workloads into the cloud by helping them to address certain regulatory and compliance requirements.
Compute
Security professionals should also be aware of some interesting enhancements in AWS compute services that can help improve their organization’s experience in building and operating a secure environment.
Amazon Elastic Compute Cloud (Amazon EC2) launched the Global View on the console to provide visibility to all your resources across Regions. Global View helps you monitor resource counts, notice abnormalities sooner, and find stray resources. A few days into 2022, another simple but extremely useful EC2 launch was the new ability to obtain instance tags from the Instance Metadata Service (IMDS). Many customers run code on Amazon EC2 that needs to introspect about the EC2 tags associated with the instance and then change its behavior depending on the content of the tags. Prior to this launch, you had to associate an EC2 role and call the EC2 API to get this information. That required access to API endpoints, either through a NAT gateway or a VPC endpoint for Amazon EC2. Now, that information can be obtained directly from the IMDS, greatly simplifying a common use case.
Amazon EC2 launched sharing of Amazon Machine Images (AMIs) with AWS Organizations and Organizational Units (OUs). Previously, you could share AMIs only with specific AWS account IDs. To share AMIs within AWS Organizations, you had to explicitly manage sharing of AMIs on an account-by-account basis, as they were added to or removed from AWS Organizations. With this new feature, you no longer have to update your AMI permissions because of organizational changes. AMI sharing is automatically synchronized when organizational changes occur. This feature greatly helps both security professionals and governance teams to centrally manage and govern AMIs as you grow and scale your AWS accounts. As previously noted, this feature was also added to EC2 Image Builder. Finally, Amazon Data Lifecycle Manager, the tool that manages all your EBS volumes and AMIs in a policy-driven way, now supports automatic deprecation of AMIs. As a security professional, you will find this helpful as you can set a timeline on your AMIs so that, if the AMIs haven’t been updated for a specified period of time, they will no longer be considered valid or usable by development teams.
Looking ahead
In 2022, AWS continues to deliver experiences that meet administrators where they govern, developers where they code, and applications where they run. We will continue to summarize important launches in future blog posts. If you’re interested in learning more about AWS services, join us for AWS re:Inforce, the AWS conference focused on cloud security, identity, privacy, and compliance. AWS re:Inforce 2022 will take place July 26–27 in Boston, MA. Registration is now open. Register now with discount code SALxUsxEFCw to get $150 off your full conference pass to AWS re:Inforce. For a limited time only and while supplies last. We look forward to seeing you there!
To stay up to date on the latest product and feature launches and security use cases, be sure to read the What’s New with AWS announcements (or subscribe to the RSS feed) and the AWS Security Blog.
If you have feedback about this post, submit comments in the Comments section below. If you have questions about this post, contact AWS Support.
Want more AWS Security news? Follow us on Twitter.
The collective thoughts of the interwebz
Manage Consent
To provide the best experiences, we use technologies like cookies to store and/or access device information. Consenting to these technologies will allow us to process data such as browsing behavior or unique IDs on this site. Not consenting or withdrawing consent, may adversely affect certain features and functions.
Functional
Always active
The technical storage or access is strictly necessary for the legitimate purpose of enabling the use of a specific service explicitly requested by the subscriber or user, or for the sole purpose of carrying out the transmission of a communication over an electronic communications network.
Preferences
The technical storage or access is necessary for the legitimate purpose of storing preferences that are not requested by the subscriber or user.
Statistics
The technical storage or access that is used exclusively for statistical purposes.The technical storage or access that is used exclusively for anonymous statistical purposes. Without a subpoena, voluntary compliance on the part of your Internet Service Provider, or additional records from a third party, information stored or retrieved for this purpose alone cannot usually be used to identify you.
Marketing
The technical storage or access is required to create user profiles to send advertising, or to track the user on a website or across several websites for similar marketing purposes.