In the dynamic landscape of modern web applications and organizations, access control is critical. Defining who can do what within your Cloudflare account ensures security and efficient workflow management. In order to help meet your organizational needs, whether you are a single developer, a small team, or a larger enterprise, we’re going to cover two changes that we have developed to make it easier to do user management, and best practices on how to use these features, alongside existing features in order to scope everything appropriately into your account, in order to ensure security while you are working with others.
What are roles?
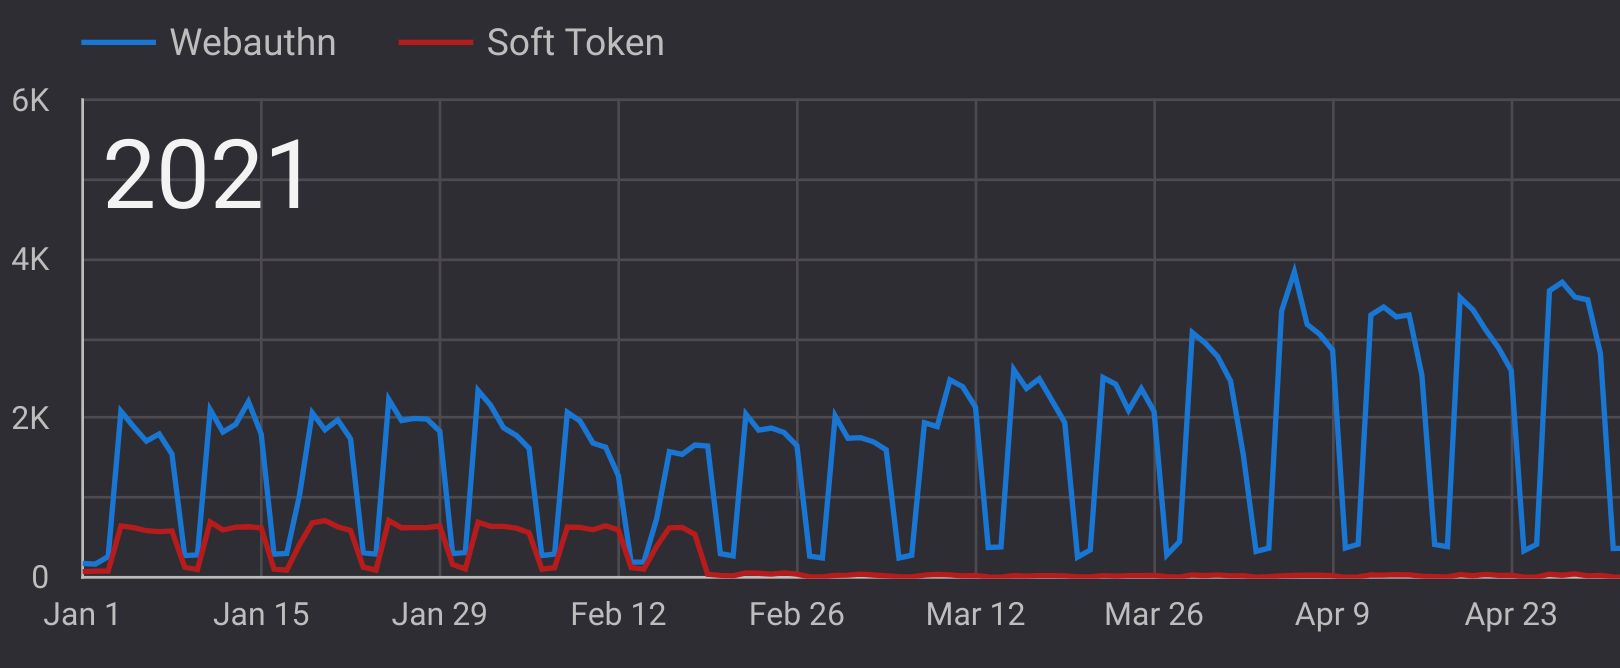
In the preceding year, Cloudflare has expanded our list of roles available to everyone from 1 to over 60, and we are continuing to build out more, better roles. We have also made domain scoping a capability for all users. This prompts the question, what are roles, and why do they exist?
Roles are a set of permissions that exist in a bundle with a name. Every API call that is made to Cloudflare has a required set of permissions, otherwise an API call will return with a 403. We generally group permissions into a role to allow access to a set of capabilities that allow the use of a Cloudflare Product, or that represent everything needed to fulfill a job function.
As of today, we have two entities that we can assign roles: the first entity is a user, representing a profile, or an actor, which we generally require an email address to represent.
The second entity is a token, which represents delegation of a subset of a user’s permissions to be used for programmatic purposes.
What is scope?
Permissions are useless without an appropriate actor, and a scope. For every action a user can take, they must be directed to the appropriate resource, which is what we refer to as a scope.
When a user first signs up to Cloudflare, they are provided a Cloudflare user, as well as an account. Accounts can be shared with others. Accounts act as our traditional resource boundary, and granting permissions at the account level means that those permissions apply to all zones, and all other resources within the account.
Within accounts however, there are zones, R2 Buckets, Workers, and other resources. We are working on expanding the types of scopes that can be set, and as of now, you can scope access to a selective number of zones, or create tokens that only allow access into specified R2 buckets.
While our list of available roles is going to continue to grow, I want to go into some detail about how to use the roles right now, and how to use them to their full potential
What are the different types of roles and scopes we have today?
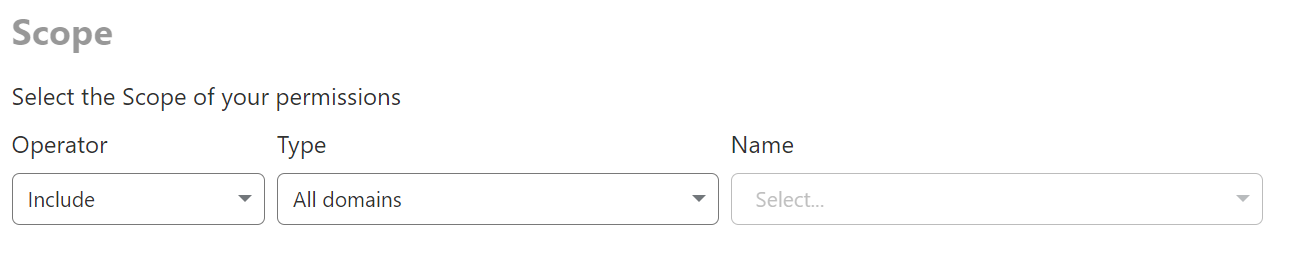
For most of the Cloudflare users and use cases out there, our traditional role model at the account level is the easiest to use. These roles can be viewed by selecting the scope of All domains.
As of today, there are 40+ Roles available at the account level. These provide access to a capability across the whole account, with no further scoping. Once these roles are provided to a user, they are able to complete a limited set of actions across any zones in your account. We intend to cover off more capabilities in this list, and will continue to add more roles.
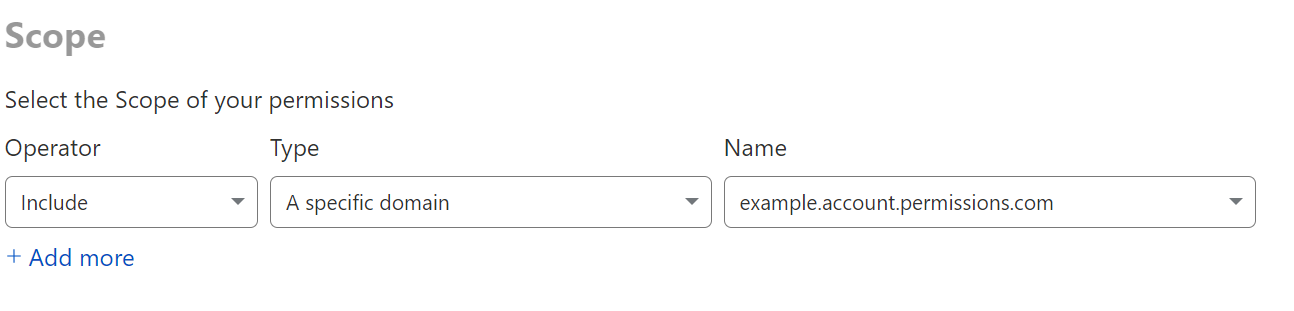
When you want to grant access to a specific zone, or list of zones, the best way to go about that is to use a domain scoped role.
A single domain can be added similar to the above, and granting explicit scope to a domain implicitly denies access to other domains.
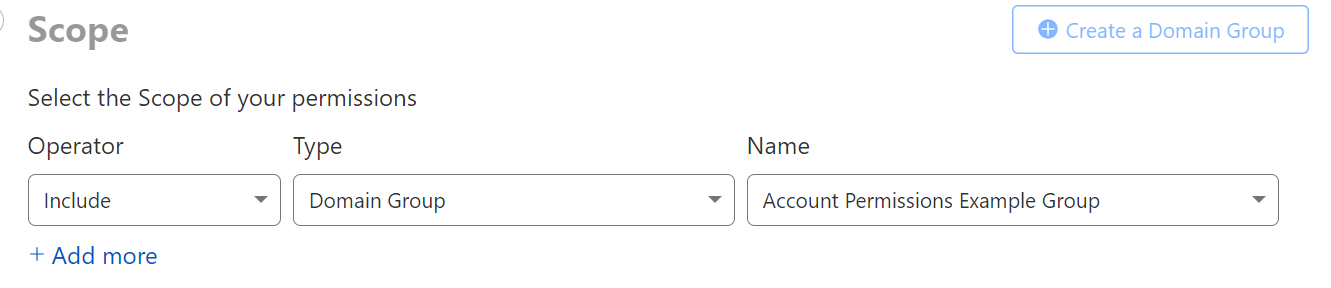
If you are looking to grant access to multiple domains simultaneously, in order to represent all staging zones for example, you can place them into a domain group. These can be revisited and edited within the Configurations → Lists page under Manage Account.
Best practices for creating domain groups is to group a set of similar domains together, such that you can reuse it for every user on your account.
Other best practices when assigning memberships
It is always best practice to explicitly define what you are granting access to, as Cloudflare’s permissioning system defers to a fail closed design. If you do not grant access to it, they will not have access to it.
We model all the different types of roles in an additive capacity, and we’re going to move forward with creating more capability specific roles. Multiple roles can be assigned given a scope. We recommend against explicitly “excluding” objects, because it can lead to some complex permission processing.
An example of this may be your organization’s billing administrator. You may want to grant them both Billing and Analytics, but exclude them from web administration activities by explicitly granting them those two roles.
Exciting changes you will see from us soon include the capability to “stack” multiple sets of policies on top of one another. We are currently rolling this out, and some users will already have the ability to define a set of permissions for one set of domains, and an increased set of permissions for another.
This will come in handy if you are managing multiple environments within one account, and want to grant differing levels of access to say a development and staging domain.
We also recognize that Cloudflare has many resources beyond Accounts and zones, and we are currently experimenting with adding scoping to other objects. As of today, you can specify R2 Tokens to only access certain buckets, and I look forward to adding this capability to more resources.
Best practices when delegating access to tokens
Memberships and users tend to use Cloudflare in an interactive capacity, but many organizations use Cloudflare programmatically.
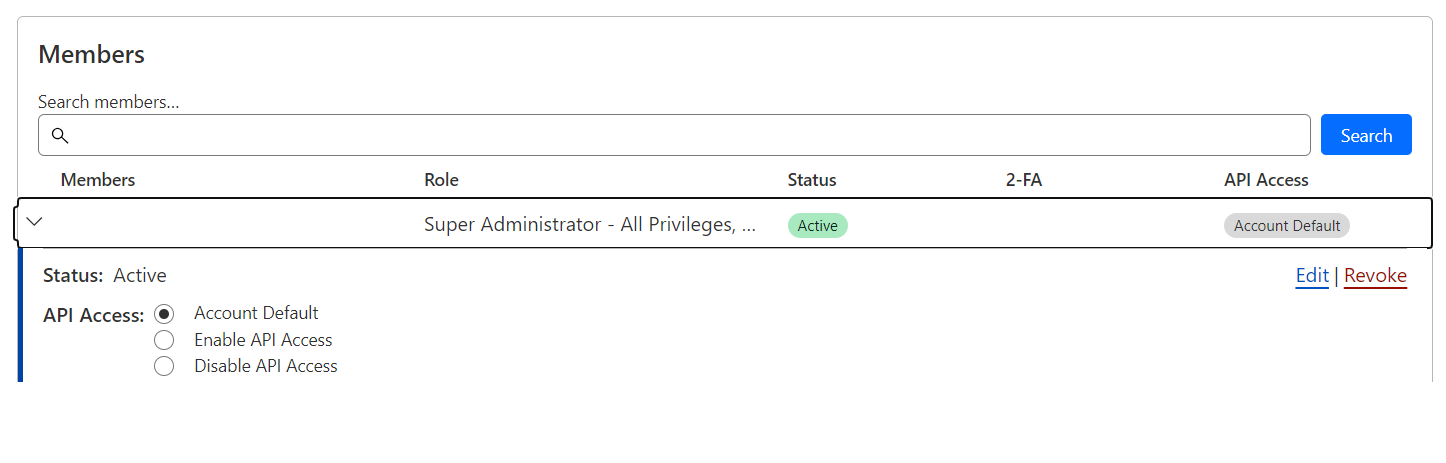
A new capability we are rolling out to all users soon is the capability to limit API access: on your account as a whole, or on a per-user basis.
All programmatic access to Cloudflare at this time is managed at a per-user basis, representing a delegation of that user’s access to their set of accounts. Programmatic access is always bounded by a user’s access, and many of our user’s service accounts have a wide set of access that is split into context specific tokens.
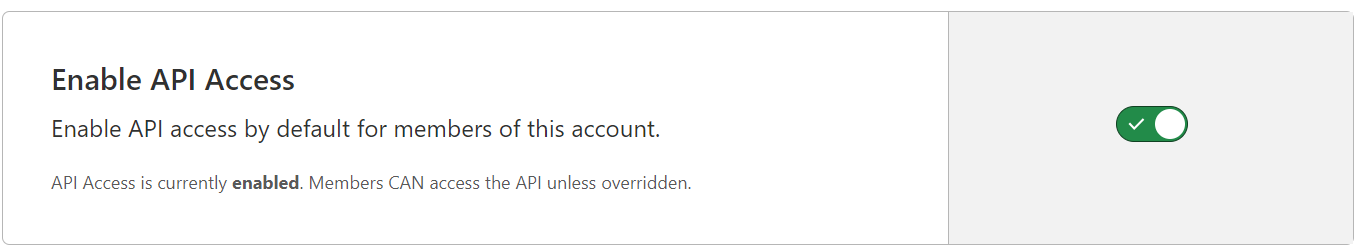
As a Super administrator, if you want to restrict programmatic access to your account, this toggle will become available on the members page.
We recommend keeping this functionality turned off, unless you explicitly want to grant the ability to use the API to specific users, which can also be controlled via a dropdown per user. We have seen some organizations use this capability to centralize the creation of API Tokens into a single service user.
Cloudflare recommends the use of API Tokens wherever possible. API tokens have the ability to be scoped down to a smaller subset of a user’s access, instead of granting access to all of it.
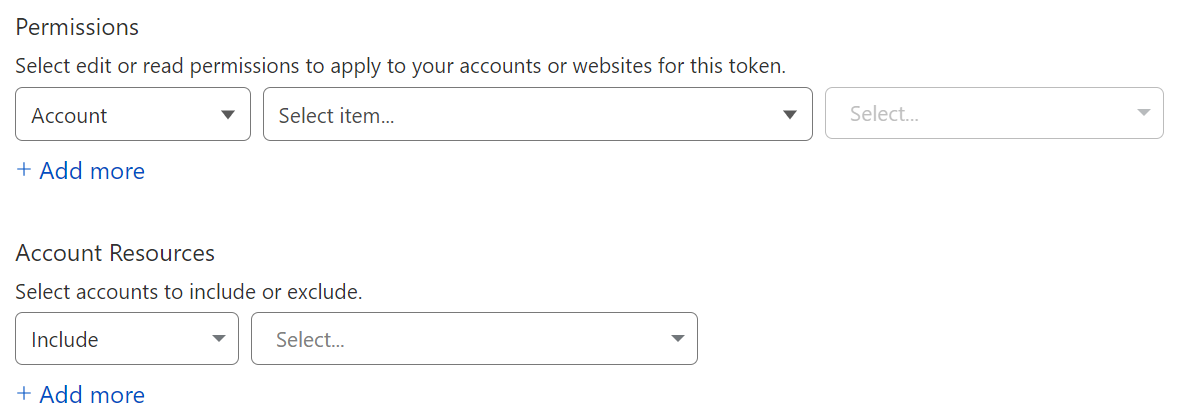
When building out a set of permissions for an API Token, we have the same scoping capability that was visible in membership roles.
Account Scoping:
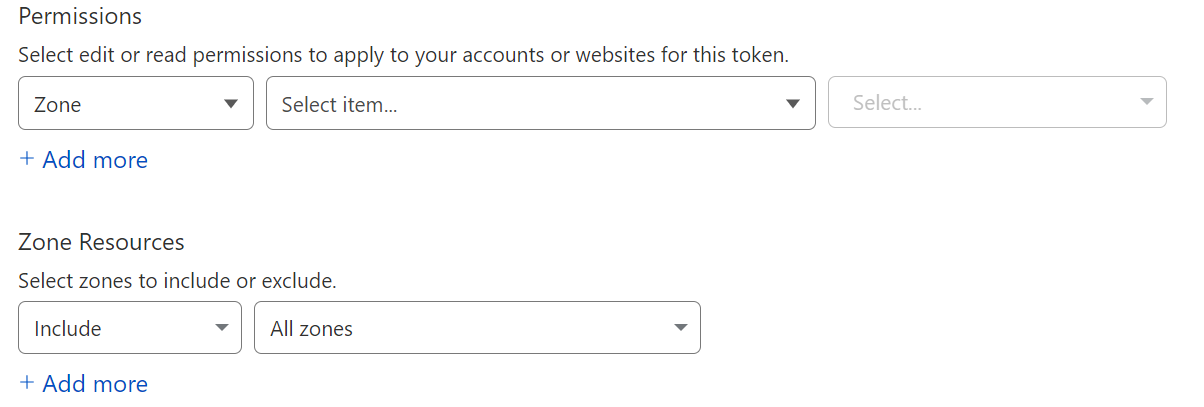
Domain/Zone Scoping:
Cloudflare’s roles are meant to provide the flexibility to provide the least amount of privilege possible, in order to keep your Cloudflare resources safe. Recent improvements have included a number of capability specific roles, as well as the ability to lock down API Access. Future improvements will include the ability to grant multiple policies to individual users, as well as more scopes.
What’s next
All users are able to use our new roles, and there will be several rolling improvements, including the capability to lock down API access, as well as assign multiple policies to users.
Since our founding, Cloudflare has helped customers save on costs, increase security, and boost performance and reliability by migrating legacy hardware functions to the cloud. More recently, our customers have been asking about whether this transition can also improve the environmental impact of their operations.
We are excited to share an independent report published this week that found that switching enterprise network services from on premises devices to Cloudflare services can cut related carbon emissions up to 96%, depending on your current network footprint. The majority of these gains come from consolidating services, which improves carbon efficiency by increasing the utilization of servers that are providing multiple network functions.
And we are not stopping there. Cloudflare is also proud to announce that we have applied to set carbon reduction targets through the Science Based Targets initiative (SBTi) in order to help continue to cut emissions across our operations, facilities, and supply chain.
As we wrap up the hottest summer on record, it's clear that we all have a part to play in understanding and reducing our carbon footprint. Partnering with Cloudflare on your network transformation journey is an easy way to get started. Come join us today!
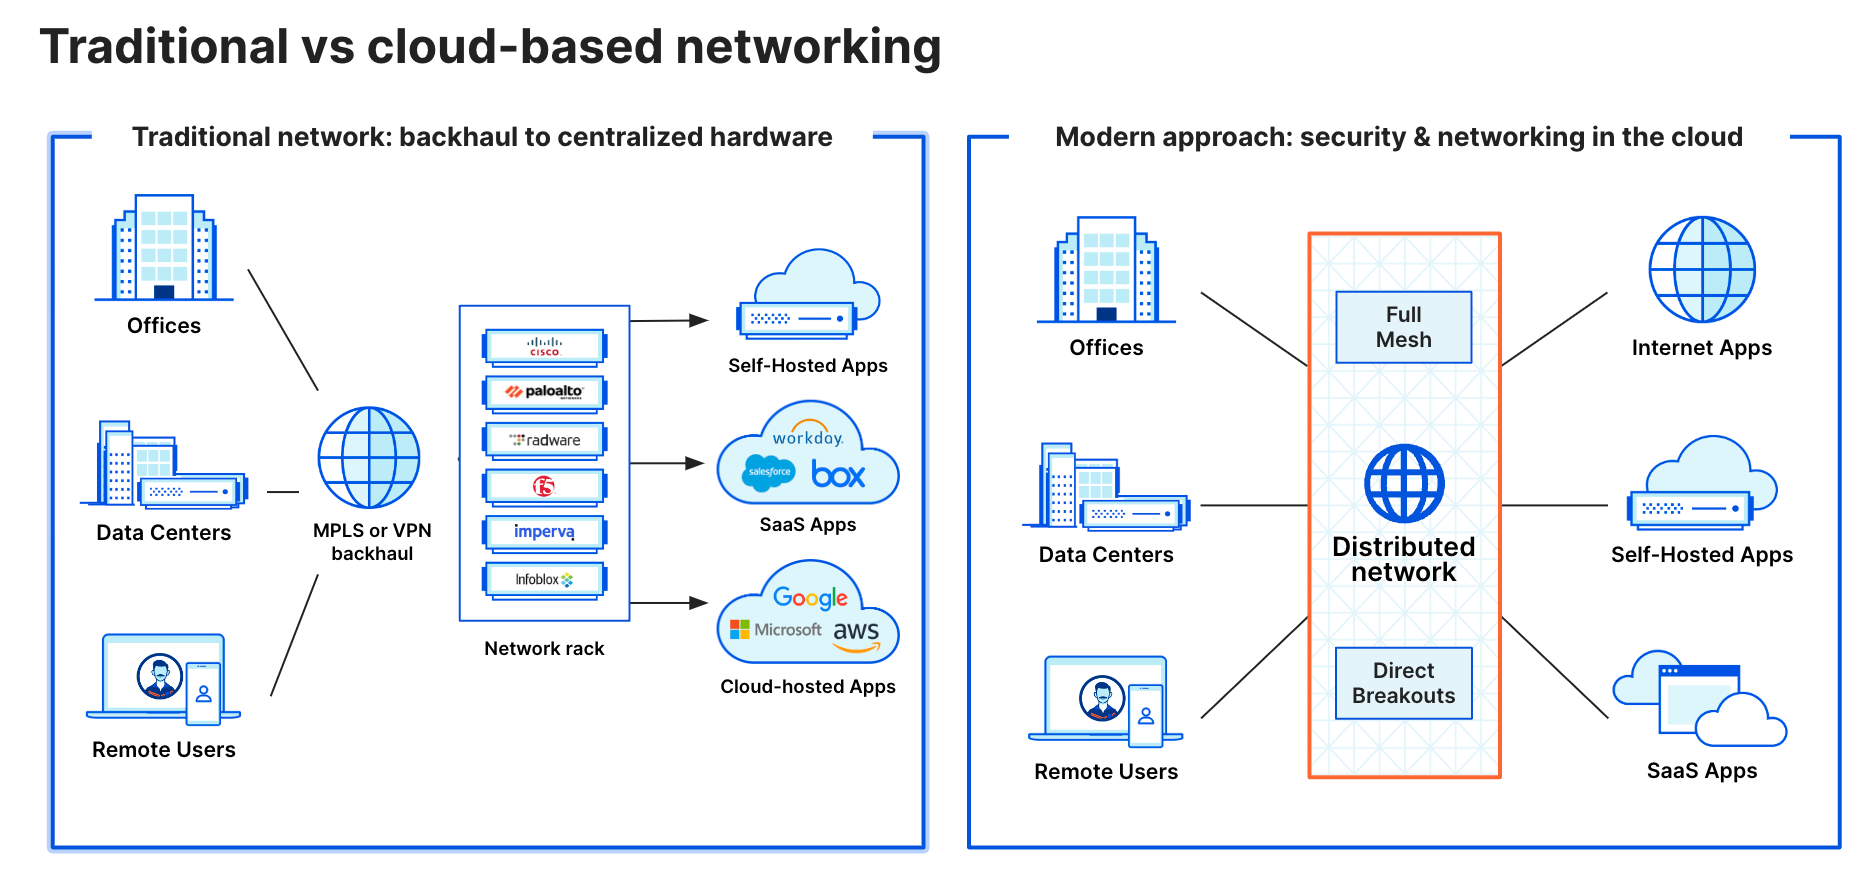
Traditional vs. cloud-based networking and security
Historically, corporate networks relied on dedicated circuits and specialized hardware to connect and secure their infrastructure. Companies built or rented space in data centers that were physically located within or close to major office locations, and hosted business applications on servers in these data centers. Employees in offices connected to these applications through the local area network (LAN) or over private wide area network (WAN) links from branch locations. A stack of security hardware in each data center, including firewalls, intrusion detection systems, DDoS mitigation appliances, VPN concentrators, and more enforced security for all traffic flowing in and out.
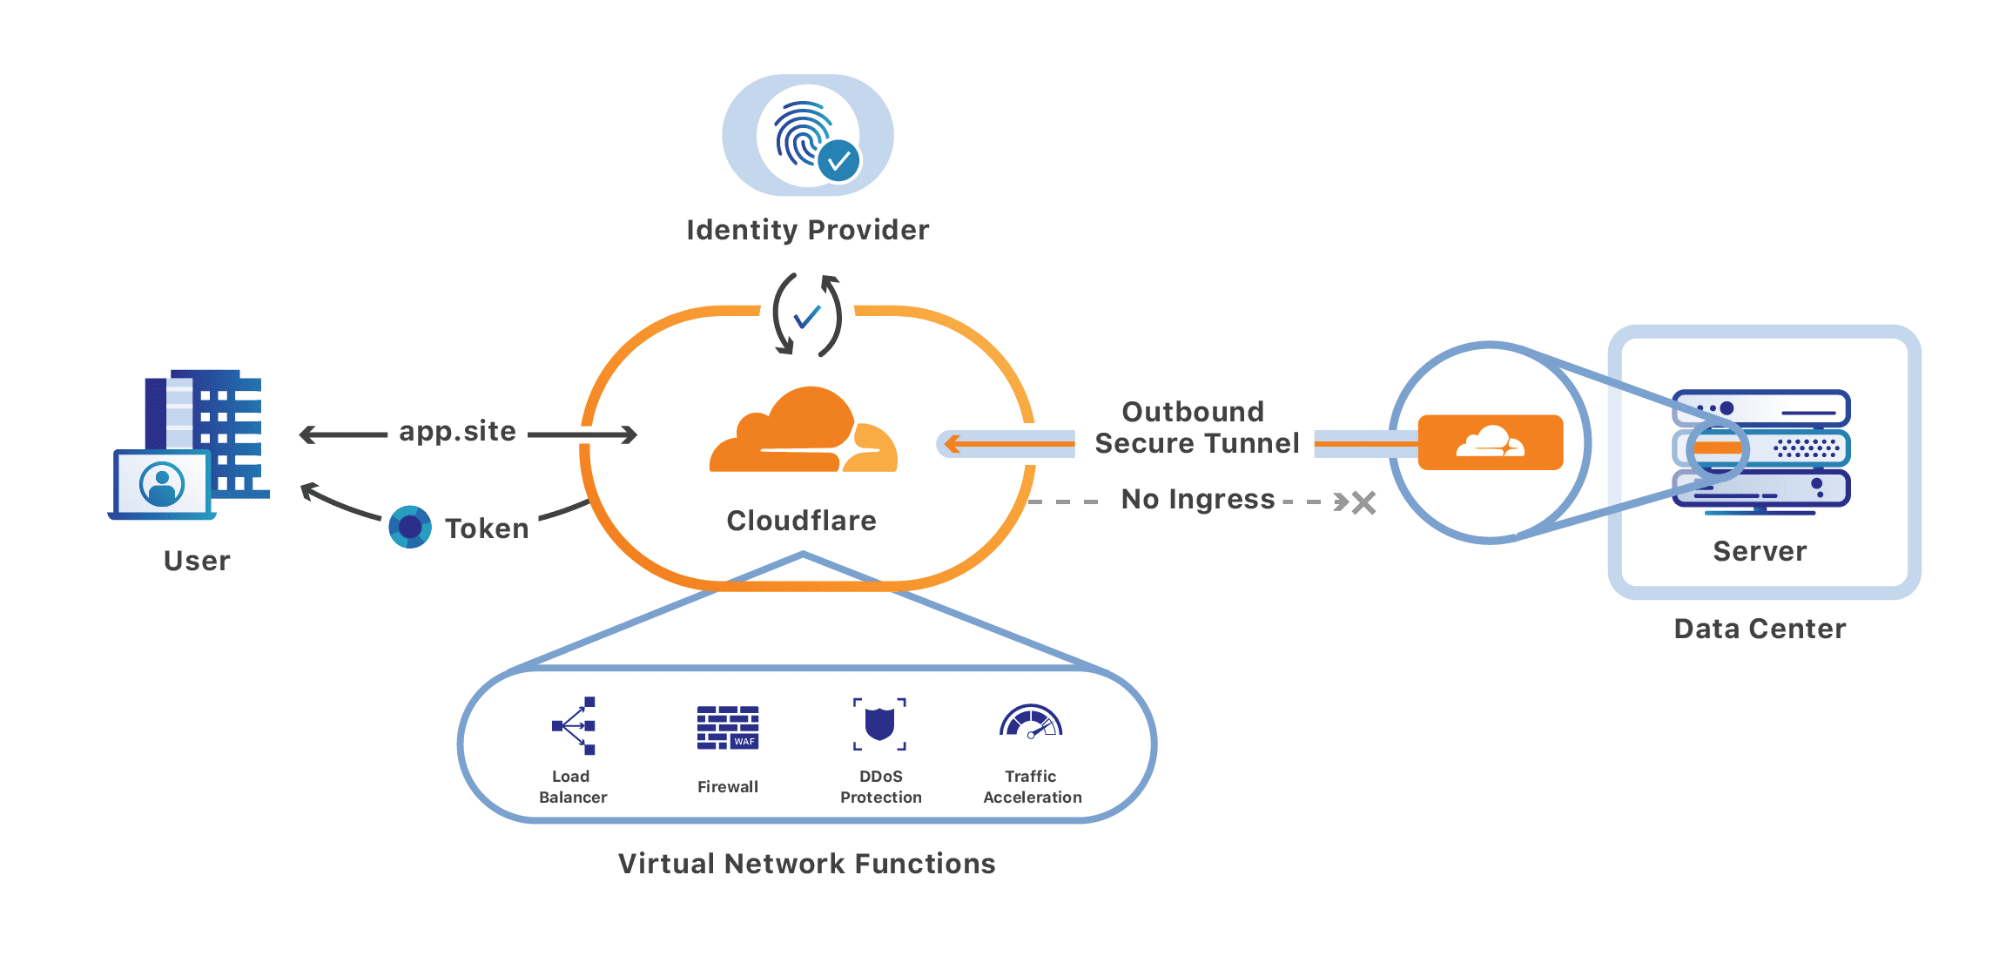
This architecture model broke down when applications shifted to the cloud and users left the office, requiring a new approach to connecting and securing corporate networks. Cloudflare’s model, which aligns with the SASE framework, shifts network and security functions from on premises hardware to our distributed global network.
Traditional vs. cloud-based networking and security architecture
This approach improves performance by enforcing policy close to where users are, increases security with Zero Trust principles, and saves costs by delivering functions more efficiently. We are now excited to report that it materially reduces the total power consumption of the services required to connect and secure your organization, which reduces carbon emissions.
Reduced carbon emissions through cloud migration and consolidation
An independent study published this week by Analysys Mason outlines how shifting networking and security functions to the cloud, and particularly consolidating services in a unified platform, directly improves the sustainability of organizations’ network, security, and IT operations. You can read the full study here, but here are a few key points.
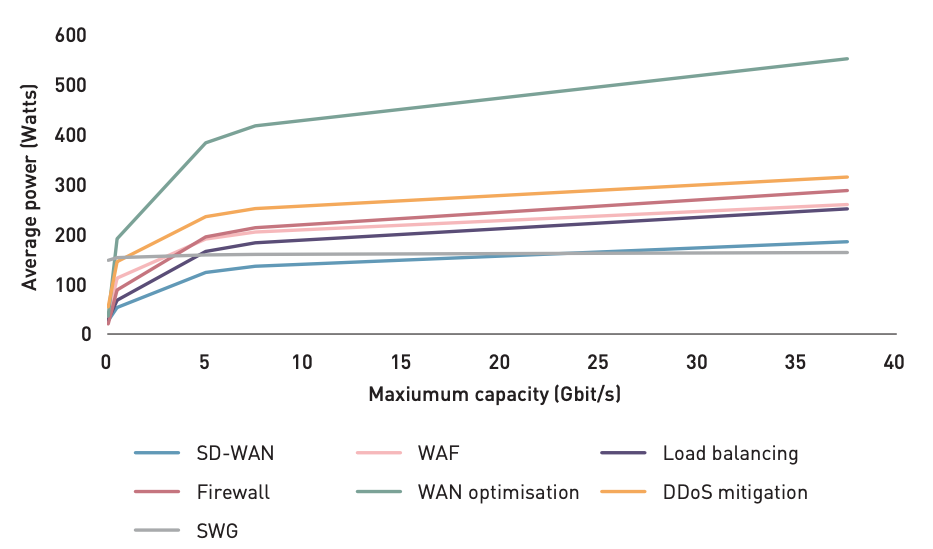
The study compared a typical hardware stack deployed in an enterprise data center or IT closet, and its associated energy consumption, to the energy consumption of comparable functions delivered by Cloudflare’s global network. The stack used for comparison included network firewall and WAF, DDoS mitigation, load balancing, WAN optimization, and SD-WAN. Researchers analyzed the average power consumption for devices with differing capacity and found that higher-capacity devices only consume incrementally more energy:
Power consumption across representative networking and security hardware devices with varying traffic capacity
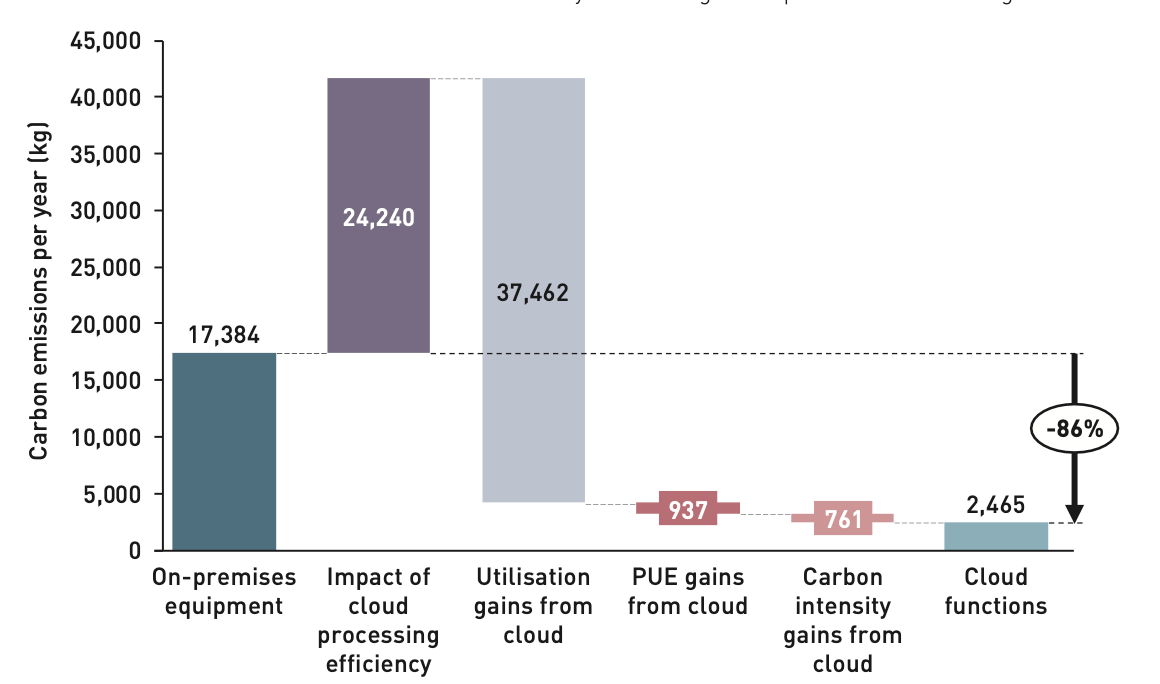
The study noted that specialized hardware is more efficient per watt of electricity consumed at performing specific functions — in other words, a device optimized for intrusion detection will perform intrusion detection functions using less power per request processed than a generic server designed to host multiple different workloads. This can be seen in the bar labeled “impact of cloud processing efficiency” in the graph below.
However, these gains are only relevant when a specialized hardware device is consistently utilized close to its capacity, which most appliances in corporate environments are not. Network, security, and IT teams intentionally provision devices with higher capacity than they will need the majority of the time in order to be able to gracefully handle spikes or peaks.
For example, a security engineer might have traditionally specced a DDoS protection appliance that can handle up to 10 Gbps of traffic in case an attack of that size came in, but the vast majority of the time, the appliance is processing far less traffic (maybe only tens or hundreds of Mbps). This means that it is actually much more efficient for those functions to run on a generic device that is also running other kinds of processes and therefore can operate at a higher baseline utilization, using the same power to get more work done. These benefits are shown in the “utilization gains from cloud” bar in the following graph.
There are also some marginal efficiency gains from other aspects of cloud architecture, such as improved power usage effectiveness (PUE) and carbon intensity of data centers optimized for cloud workloads vs. traditional enterprise infrastructure. These are represented on the right of the graph below.
The analysis shows that processing efficiency in the cloud is lower than specialized on-premises equipment; however, utilization gains through shared cloud services combined with expected PUE and carbon intensity yield potentially 86% emissions savings for large enterprises.
Researchers compared multiple examples of enterprise IT environments, from small to large traffic volume and complexity, and found that these factors contribute to overall carbon emissions reduction of 78-96% depending on the network analyzed.
One of the most encouraging parts of this study was that it did not include Cloudflare's renewable energy or offset purchases in its findings. A number of studies have concluded that migrating various applications and compute functions from on premises hardware to the cloud can significantly cut carbon emissions. But, those studies also relied in part on carbon accounting benefits like renewable energy or carbon offsets to demonstrate those savings.
Cloudflare also powers its operations with 100% renewable energy and purchases high-quality offsets to account for its annual emissions footprint. Meaning, the emissions savings of potentially switching to Cloudflare are likely even higher than those reported.
Overall, consolidating and migrating to Cloudflare’s services and retiring legacy hardware can substantially reduce energy consumption and emissions. And while you are at it, make sure to consider sustainable end-of-life practices for those retired devices — we will even help you recycle them!
Cloudflare is joining the Science Based Targets initiative (SBTi)
We're incredibly proud that Cloudflare is helping move the Internet toward a zero emissions future. But, we know that we can do more.
Cloudflare is thrilled to announce that we have submitted our application to join SBTi and set science-based carbon reduction targets across our facilities, operations, and supply chain.
SBTi is one of the world's most ambitious corporate climate action commitments. It requires companies to achieve verifiable emissions reductions across their operations and supply chain without the use of carbon offsets. Companies' short- and long-term reduction goals must be consistent with the Paris Climate Agreement goal of limiting global warming to 1.5 degrees above pre-industrial levels.
Once approved, Cloudflare will work over the next 24 months with SBTi to develop and validate our short and long term reduction targets. Stay tuned to our blog and our Impact page for updates as we go.
Cloudflare's commitment to SBTi reduction targets builds on our ongoing commitments to 100% renewable energy, to offset or remove historic carbon emissions associated with powering our network by 2025, and reforestation efforts.
As we have said before, Cloudflare's original goal was not to reduce the Internet's environmental impact. But, that has changed.
Come join Cloudflare today and help us work towards a zero emissions Internet.
Stream Live lets users easily scale their live-streaming apps and websites to millions of creators and concurrent viewers while focusing on the content rather than the infrastructure — Stream manages codecs, protocols, and bit rate automatically.
For Speed Week this year, we introduced a closed beta of Low-Latency HTTP Live Streaming (LL-HLS), which builds upon the high-quality, feature-rich HTTP Live Streaming (HLS) protocol. Lower latency brings creators even closer to their viewers, empowering customers to build more interactive features like chat and enabling the use of live-streaming in more time-sensitive applications like live e-learning, sports, gaming, and events.
Today, in celebration of Birthday Week, we’re opening this beta to all customers with even lower latency. With LL-HLS, you can deliver video to your audience faster, reducing the latency a viewer may experience on their player to as little as three seconds. Low Latency streaming is priced the same way, too: $1 per 1,000 minutes delivered, with zero extra charges for encoding or bandwidth.
Broadcast with latency as low as three seconds.
LL-HLS is an extension of the HLS standard that allows us to reduce glass-to-glass latency — the time between something happening on the broadcast end and a user seeing it on their screen. That includes factors like network conditions and transcoding for HLS and adaptive bitrates. We also include client-side buffering in our understanding of latency because we know the experience is driven by what a user sees, not when a byte is delivered into a buffer. Depending on encoder and player settings, broadcasters' content can be playing on viewers' screens in less than three seconds.
On the left, OBS Studio broadcasting from my personal computer to Cloudflare Stream. On the right, watching this livestream using our own built-in player playing LL-HLS with three second latency!
Same pricing, lower latency. Encoding is always free.
Our addition of LL-HLS support builds on all the best parts of Stream including simple, predictable pricing. You never have to pay for ingress (broadcasting to us), compute (encoding), or egress. This allows you to stream with peace of mind, knowing there are no surprise fees and no need to trade quality for cost. Regardless of bitrate or resolution, Stream costs \$1 per 1,000 minutes of video delivered and \$5 per 1,000 minutes of video stored, billed monthly.
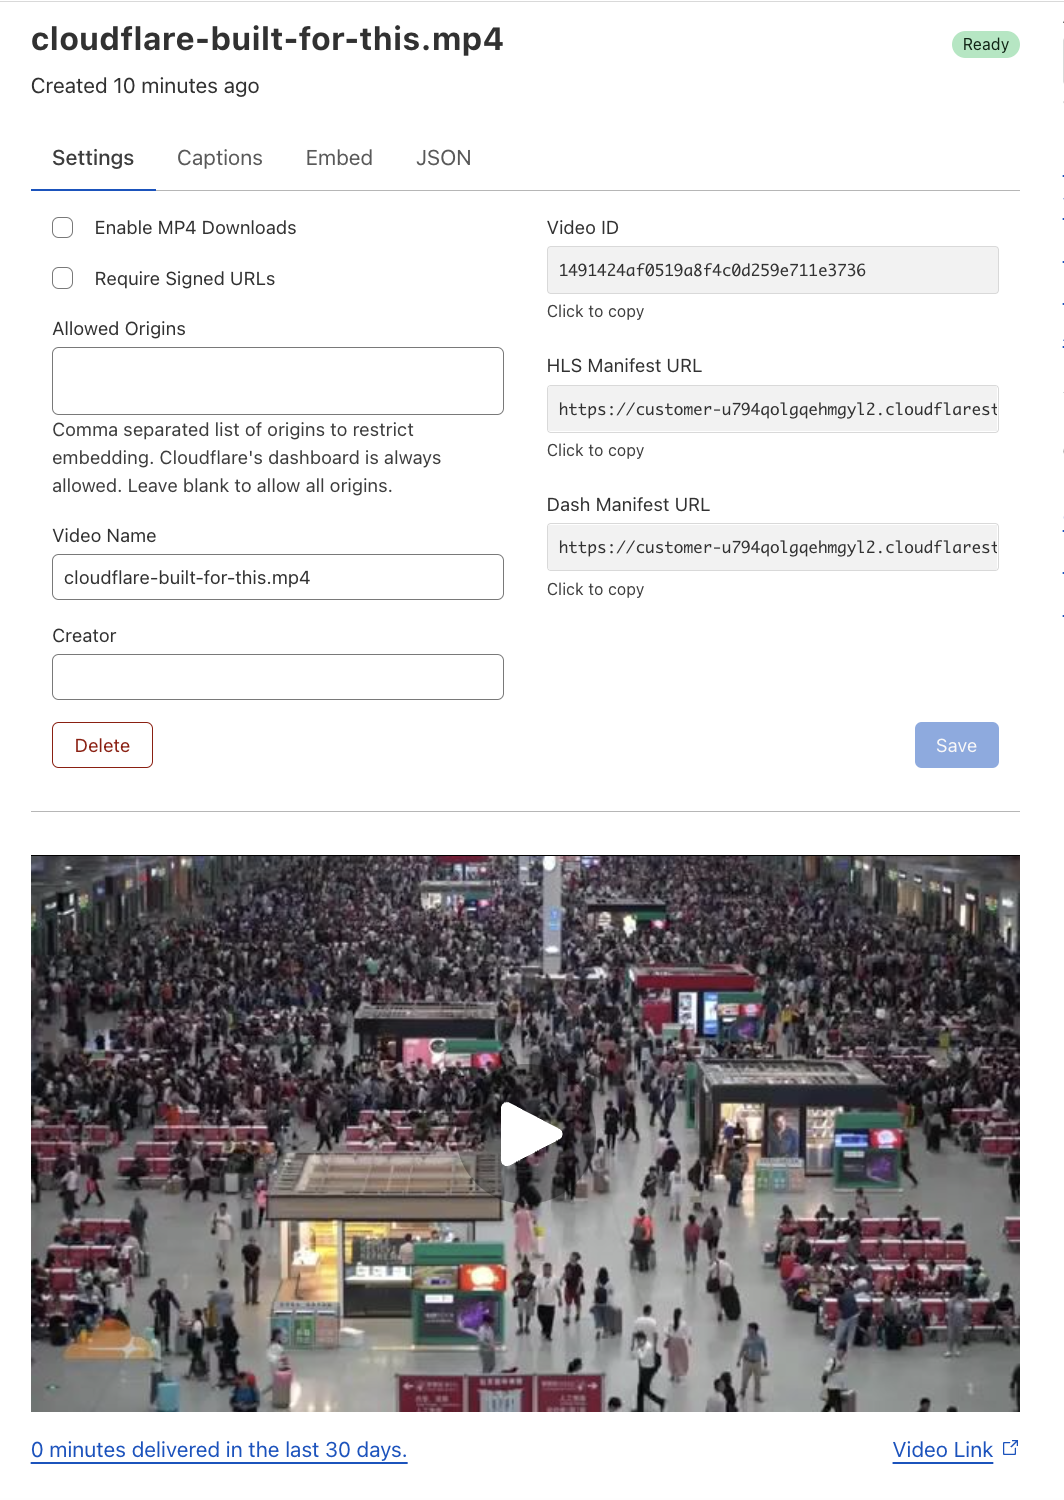
Stream also provides both a built-in web player or HLS/DASH manifests to use in a compatible player of your choosing. This enables you or your users to go live using the same protocols and tools that broadcasters big and small use to go live to YouTube or Twitch, but gives you full control over access and presentation of live streams. We also provide access control with signed URLs and hotlinking prevention measures to protect your content.
Powered by the strength of the network
And of course, Stream is powered by Cloudflare's global network for fast delivery worldwide, with points of presence within 50ms of 95% of the Internet connected population, a key factor in our quest to slash latency. We ingest live video close to broadcasters and move it rapidly through Cloudflare’s network. We run encoders on-demand and generate player manifests as close to viewers as possible.
Getting started with LL-HLS
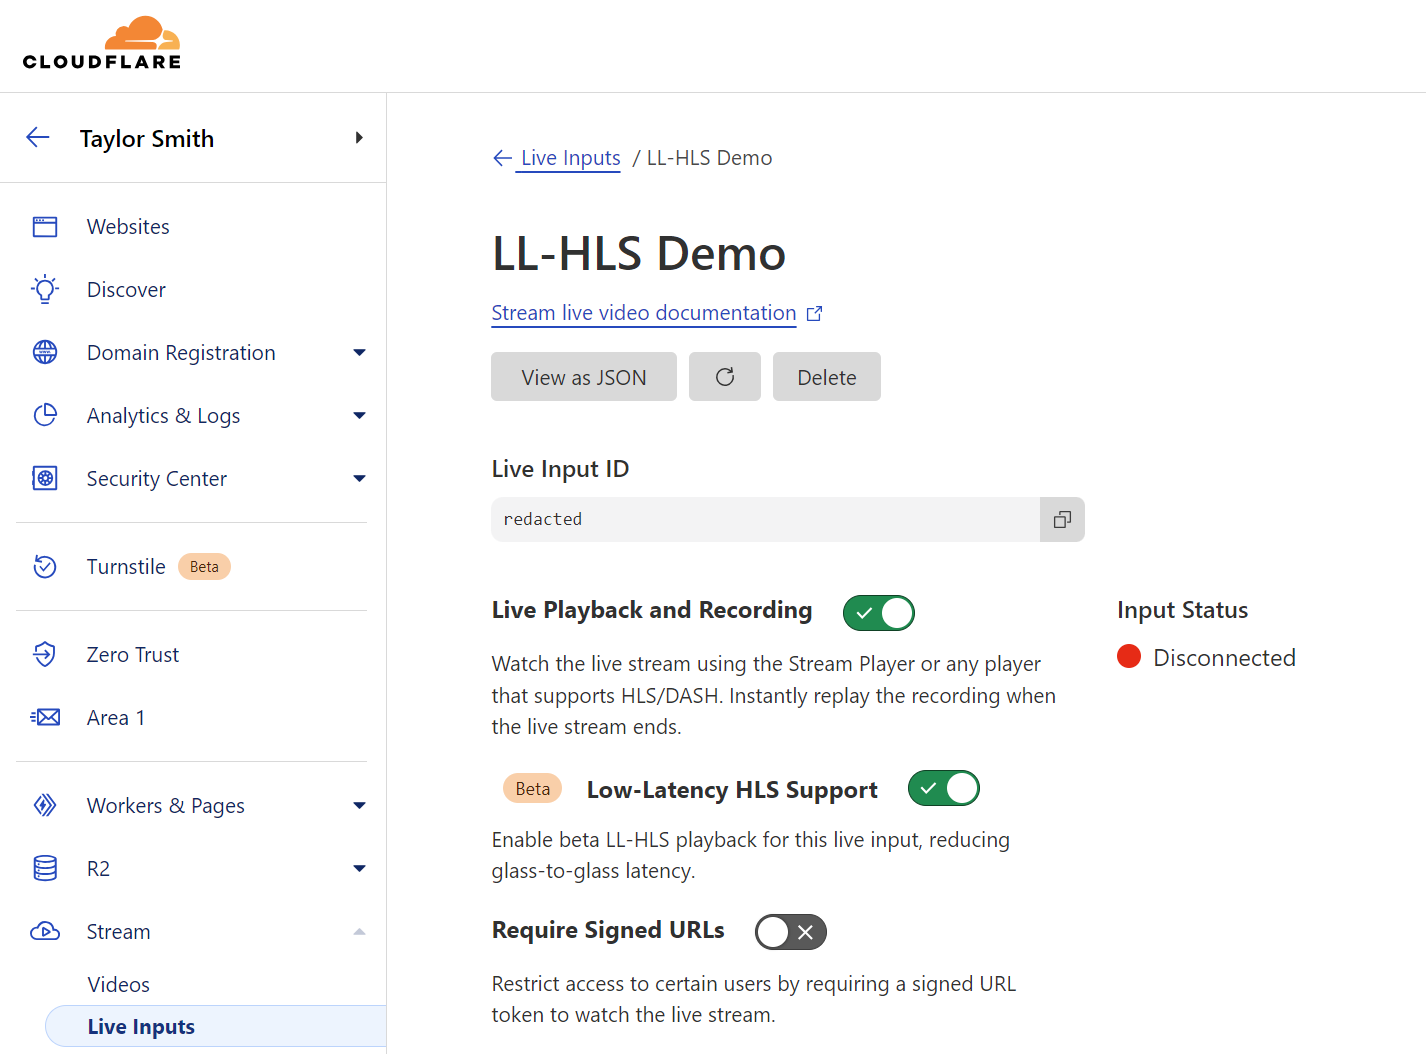
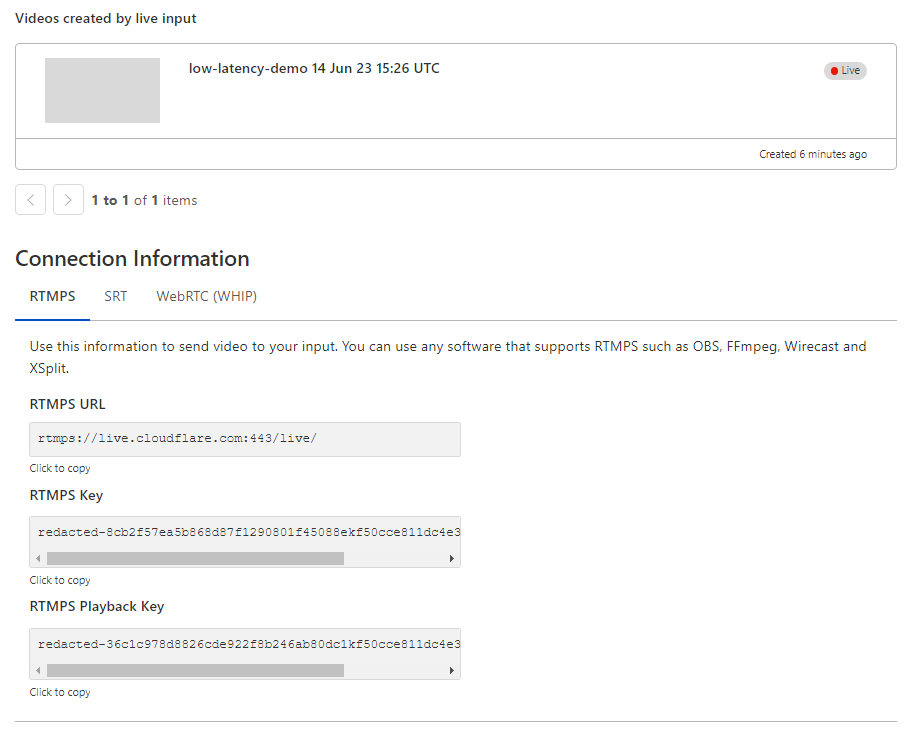
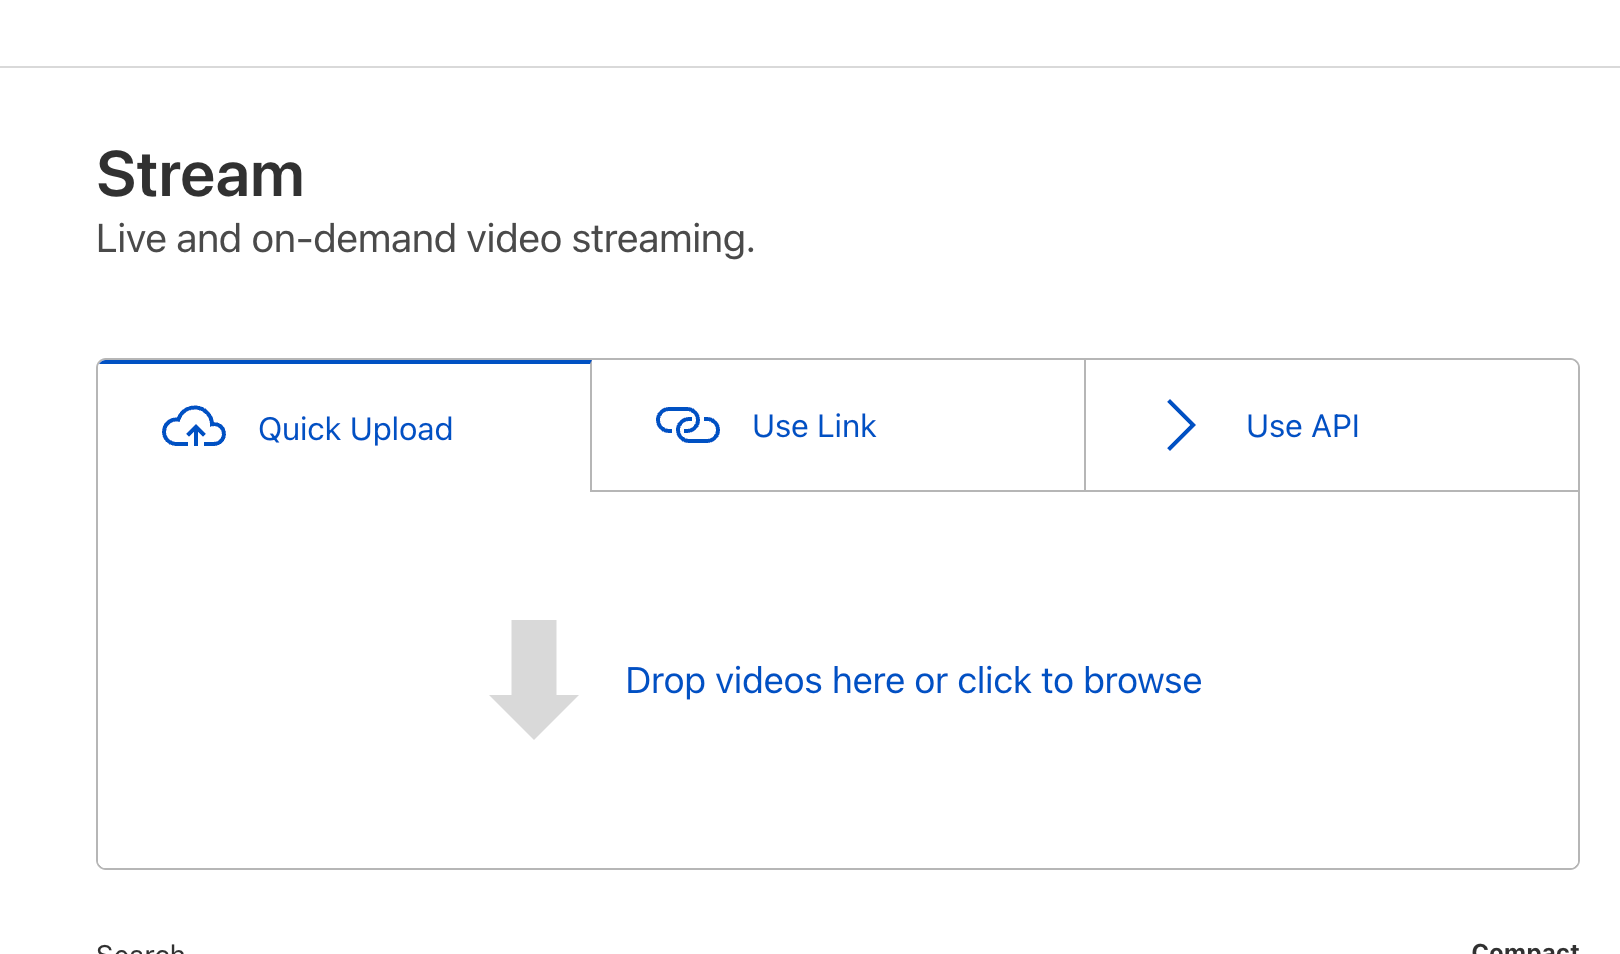
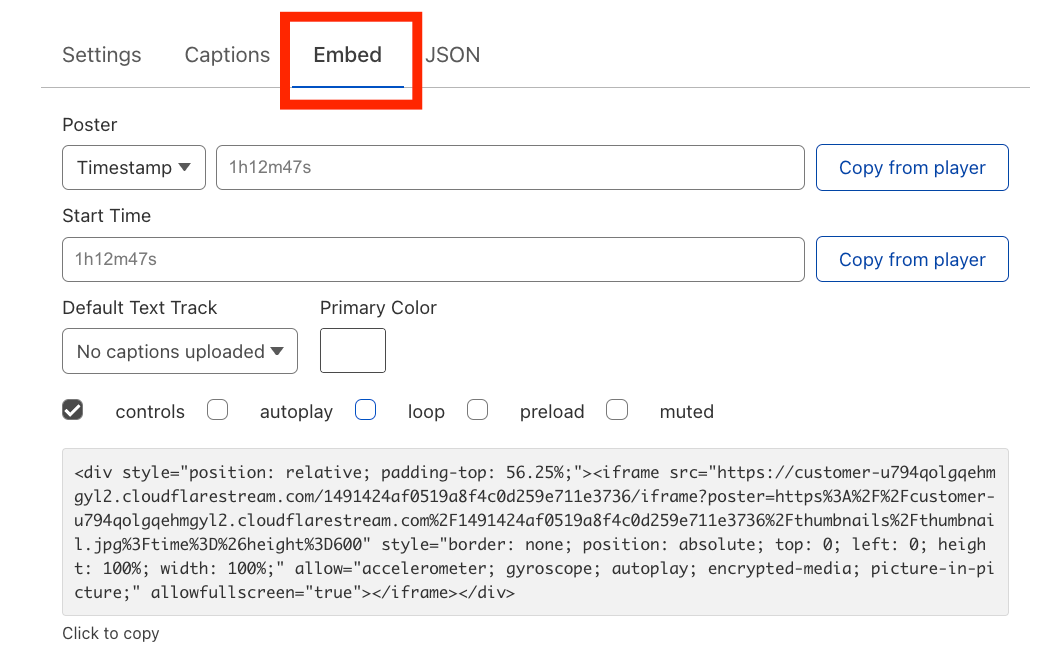
Getting started with Stream Live only takes a few minutes, and by using Live Outputs for restreaming, you can even test it without changing your existing infrastructure. First, create or update a Live Input in the Cloudflare dashboard. While in beta, Live Inputs will have an option to enable LL-HLS called “Low-Latency HLS Support.” Activate this toggle to enable the new pipeline.
Stream will automatically provide the RTMPS and SRT endpoints to broadcast your feed to us, just as before. For the best results, we recommend the following broadcast settings:
Codec: h264
GOP size / keyframe interval: 1 second
Optionally, configure a Live Output to point to your existing video ingest endpoint via RTMPS or SRT to test Stream while rebroadcasting to an existing workflow or infrastructure.
Stream will automatically provide RTMPS and SRT endpoints to broadcast your feed to us as well as an HTML embed for our built-in player.
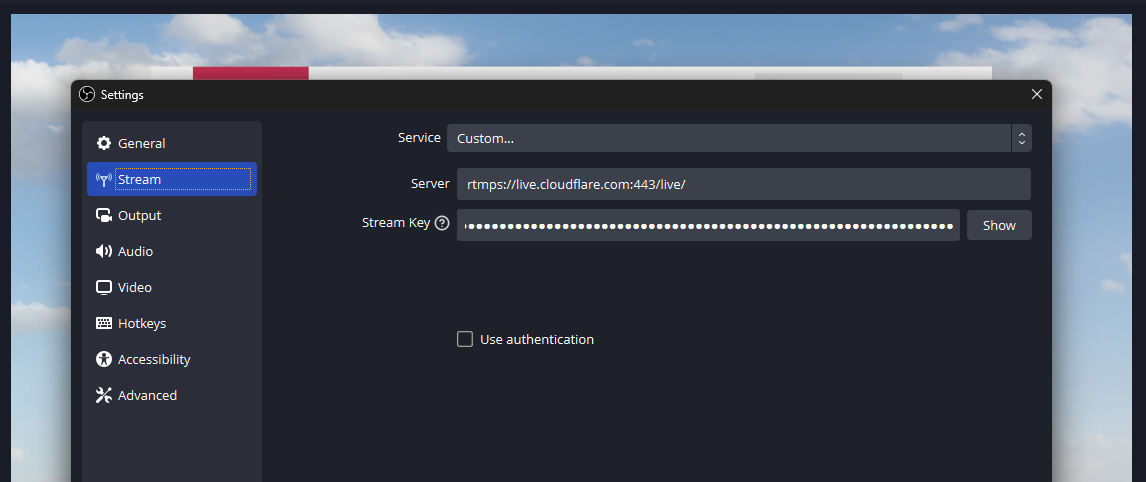
This connection information can be added easily to a broadcast application like OBS to start streaming immediately:
During the beta, our built-in player will automatically attempt to use low-latency for any enabled Live Input, falling back to regular HLS otherwise. If LL-HLS is being used, you’ll see “Low Latency” noted in the player.
During this phase of the beta, we are most closely focused on using OBS to broadcast and Stream’s built-in player to watch — which uses HLS.js under the hood for LL-HLS support. However, you may test the LL-HLS manifest in a player of your own by appending ?protocol=llhls to the end of the HLS manifest URL. This flag may change in the future and is not yet ready for production usage; watch for changes in DevDocs.
Sign up today
Low-Latency HLS is Stream Live’s latest tool to bring your creators and audiences together. All new and existing Stream subscriptions are eligible for the LL-HLS open beta today, with no pricing changes or contract requirements — all part of building the fastest, simplest serverless live-streaming platform. Join our beta to start test-driving Low-Latency HLS!
Picture this: you’re at an airport, and you’re going through an airport security checkpoint. There are a bunch of agents who are scanning your boarding pass and your passport and sending you through to your gate. All of a sudden, some of the agents go on break. Maybe there’s a leak in the ceiling above the checkpoint. Or perhaps a bunch of flights are leaving at 6pm, and a number of passengers turn up at once. Either way, this imbalance between localized supply and demand can cause huge lines and unhappy travelers — who just want to get through the line to get on their flight. How do airports handle this?
Some airports may not do anything and just let you suffer in a longer line. Some airports may offer fast-lanes through the checkpoints for a fee. But most airports will tell you to go to another security checkpoint a little farther away to ensure that you can get through to your gate as fast as possible. They may even have signs up telling you how long each line is, so you can make an easier decision when trying to get through.
At Cloudflare, we have the same problem. We are located in 300 cities around the world that are built to receive end-user traffic for all of our product suites. And in an ideal world, we always have enough computers and bandwidth to handle everyone at their closest possible location. But the world is not always ideal; sometimes we take a data center offline for maintenance, or a connection to a data center goes down, or some equipment fails, and so on. When that happens, we may not have enough attendants to serve every person going through security in every location. It’s not because we haven’t built enough kiosks, but something has happened in our data center that prevents us from serving everyone.
So, we built Traffic Manager: a tool that balances supply and demand across our entire global network. This blog is about Traffic Manager: how it came to be, how we built it, and what it does now.
The world before Traffic Manager
The job now done by Traffic Manager used to be a manual process carried out by network engineers: our network would operate as normal until something happened that caused user traffic to be impacted at a particular data center.
When such events happened, user requests would start to fail with 499 or 500 errors because there weren’t enough machines to handle the request load of our users. This would trigger a page to our network engineers, who would then remove some Anycast routes for that data center. The end result: by no longer advertising those prefixes in the impacted data center, user traffic would divert to a different data center. This is how Anycast fundamentally works: user traffic is drawn to the closest data center advertising the prefix the user is trying to connect to, as determined by Border Gateway Protocol. For a primer on what Anycast is, check out this reference article.
Depending on how bad the problem was, engineers would remove some or even all the routes in a data center. When the data center was again able to absorb all the traffic, the engineers would put the routes back and the traffic would return naturally to the data center.
As you might guess, this was a challenging task for our network engineers to do every single time any piece of hardware on our network had an issue. It didn’t scale.
Never send a human to do a machine’s job
But doing it manually wasn’t just a burden on our Network Operations team. It also resulted in a sub-par experience for our customers; our engineers would need to take time to diagnose and re-route traffic. To solve both these problems, we wanted to build a service that would immediately and automatically detect if users were unable to reach a Cloudflare data center, and withdraw routes from the data center until users were no longer seeing issues. Once the service received notifications that the impacted data center could absorb the traffic, it could put the routes back and reconnect that data center. This service is called Traffic Manager, because its job (as you might guess) is to manage traffic coming into the Cloudflare network.
Accounting for second order consequences
When a network engineer removes a route from a router, they can make the best guess at where the user requests will move to, and try to ensure that the failover data center has enough resources to handle the requests — if it doesn’t, they can adjust the routes there accordingly prior to removing the route in the initial data center. To be able to automate this process, we needed to move from a world of intuition to a world of data — accurately predicting where traffic would go when a route was removed, and feeding this information to Traffic Manager, so it could ensure it doesn’t make the situation worse.
Meet Traffic Predictor
Although we can adjust which data centers advertise a route, we are unable to influence what proportion of traffic each data center receives. Each time we add a new data center, or a new peering session, the distribution of traffic changes, and as we are in over 300 cities and 12,500 peering sessions, it has become quite difficult for a human to keep track of, or predict the way traffic will move around our network. Traffic manager needed a buddy: Traffic Predictor.
In order to do its job, Traffic Predictor carries out an ongoing series of real world tests to see where traffic actually moves. Traffic Predictor relies on a testing system that simulates removing a data center from service and measuring where traffic would go if that data center wasn’t serving traffic. To help understand how this system works, let’s simulate the removal of a subset of a data center in Christchurch, New Zealand:
First, Traffic Predictor gets a list of all the IP addresses that normally connect to Christchurch. Traffic Predictor will send a ping request to hundreds of thousands of IPs that have recently made a request there.
Traffic Predictor records if the IP responds, and whether the response returns to Christchurch using a special Anycast IP range specifically configured for Traffic Predictor.
Once Traffic Predictor has a list of IPs that respond to Christchurch, it removes that route containing that special range from Christchurch, waits a few minutes for the Internet routing table to be updated, and runs the test again.
Instead of being routed to Christchurch, the responses are instead going to data centers around Christchurch. Traffic Predictor then uses the knowledge of responses for each data center, and records the results as the failover for Christchurch.
This allows us to simulate Christchurch going offline without actually taking Christchurch offline!
But Traffic Predictor doesn’t just do this for any one data center. To add additional layers of resiliency, Traffic Predictor even calculates a second layer of indirection: for each data center failure scenario, Traffic Predictor also calculates failure scenarios and creates policies for when surrounding data centers fail.
Using our example from before, when Traffic Predictor tests Christchurch, it will run a series of tests that remove several surrounding data centers from service including Christchurch to calculate different failure scenarios. This ensures that even if something catastrophic happens which impacts multiple data centers in a region, we still have the ability to serve user traffic. If you think this data model is complicated, you’re right: it takes several days to calculate all of these failure paths and policies.
Here’s what those failure paths and failover scenarios look like for all of our data centers around the world when they’re visualized:
This can be a bit complicated for humans to parse, so let’s dig into that above scenario for Christchurch, New Zealand to make this a bit more clear. When we take a look at failover paths specifically for Christchurch, we see they look like this:
In this scenario we predict that 99.8% of Christchurch’s traffic would shift to Auckland, which is able to absorb all Christchurch traffic in the event of a catastrophic outage.
Traffic Predictor allows us to not only see where traffic will move to if something should happen, but it allows us to preconfigure Traffic Manager policies to move requests out of failover data centers to prevent a thundering herd scenario: where sudden influx of requests can cause failures in a second data center if the first one has issues. With Traffic Predictor, Traffic Manager doesn’t just move traffic out of one data center when that one fails, but it also proactively moves traffic out of other data centers to ensure a seamless continuation of service.
From a sledgehammer to a scalpel
With Traffic Predictor, Traffic Manager can dynamically advertise and withdraw prefixes while ensuring that every datacenter can handle all the traffic. But withdrawing prefixes as a means of traffic management can be a bit heavy-handed at times. One of the reasons for this is that the only way we had to add or remove traffic to a data center was through advertising routes from our Internet-facing routers. Each one of our routes has thousands of IP addresses, so removing only one still represents a large portion of traffic.
Specifically, Internet applications will advertise prefixes to the Internet from a /24 subnet at an absolute minimum, but many will advertise prefixes larger than that. This is generally done to prevent things like route leaks or route hijacks: many providers will actually filter out routes that are more specific than a /24 (for more information on that, check out this blog here). If we assume that Cloudflare maps protected properties to IP addresses at a 1:1 ratio, then each /24 subnet would be able to service 256 customers, which is the number of IP addresses in a /24 subnet. If every IP address sent one request per second, we’d have to move 4 /24 subnets out of a data center if we needed to move 1,000 requests per second (RPS).
But in reality, Cloudflare maps a single IP address to hundreds of thousands of protected properties. So for Cloudflare, a /24 might take 3,000 requests per second, but if we needed to move 1,000 RPS out, we would have no choice but to move a single /24 out. And that’s just assuming we advertise at a /24 level. If we used /20s to advertise, the amount we can withdraw gets less granular: at a 1:1 website to IP address mapping, that’s 4,096 requests per second for each prefix, and even more if the website to IP address mapping is many to one.
While withdrawing prefix advertisements improved the customer experience for those users who would have seen a 499 or 500 error — there may have been a significant portion of users who wouldn’t have been impacted by an issue who still were moved away from the data center they should have gone to, probably slowing them down, even if only a little bit. This concept of moving more traffic out than is necessary is called “stranding capacity”: the data center is theoretically able to service more users in a region but cannot because of how Traffic Manager was built.
We wanted to improve Traffic Manager so that it only moved the absolute minimum of users out of a data center that was seeing a problem and not strand any more capacity. To do so, we needed to shift percentages of prefixes, so we could be extra fine-grained and only move the things that absolutely need to be moved. To solve this, we built an extension of our Layer 4 load balancer Unimog, which we call Plurimog.
A quick refresher on Unimog and layer 4 load balancing: every single one of our machines contains a service that determines whether that machine can take a user request. If the machine can take a user request then it sends the request to our HTTP stack which processes the request before returning it to the user. If the machine can’t take the request, the machine sends the request to another machine in the data center that can. The machines can do this because they are constantly talking to each other to understand whether they can serve requests for users.
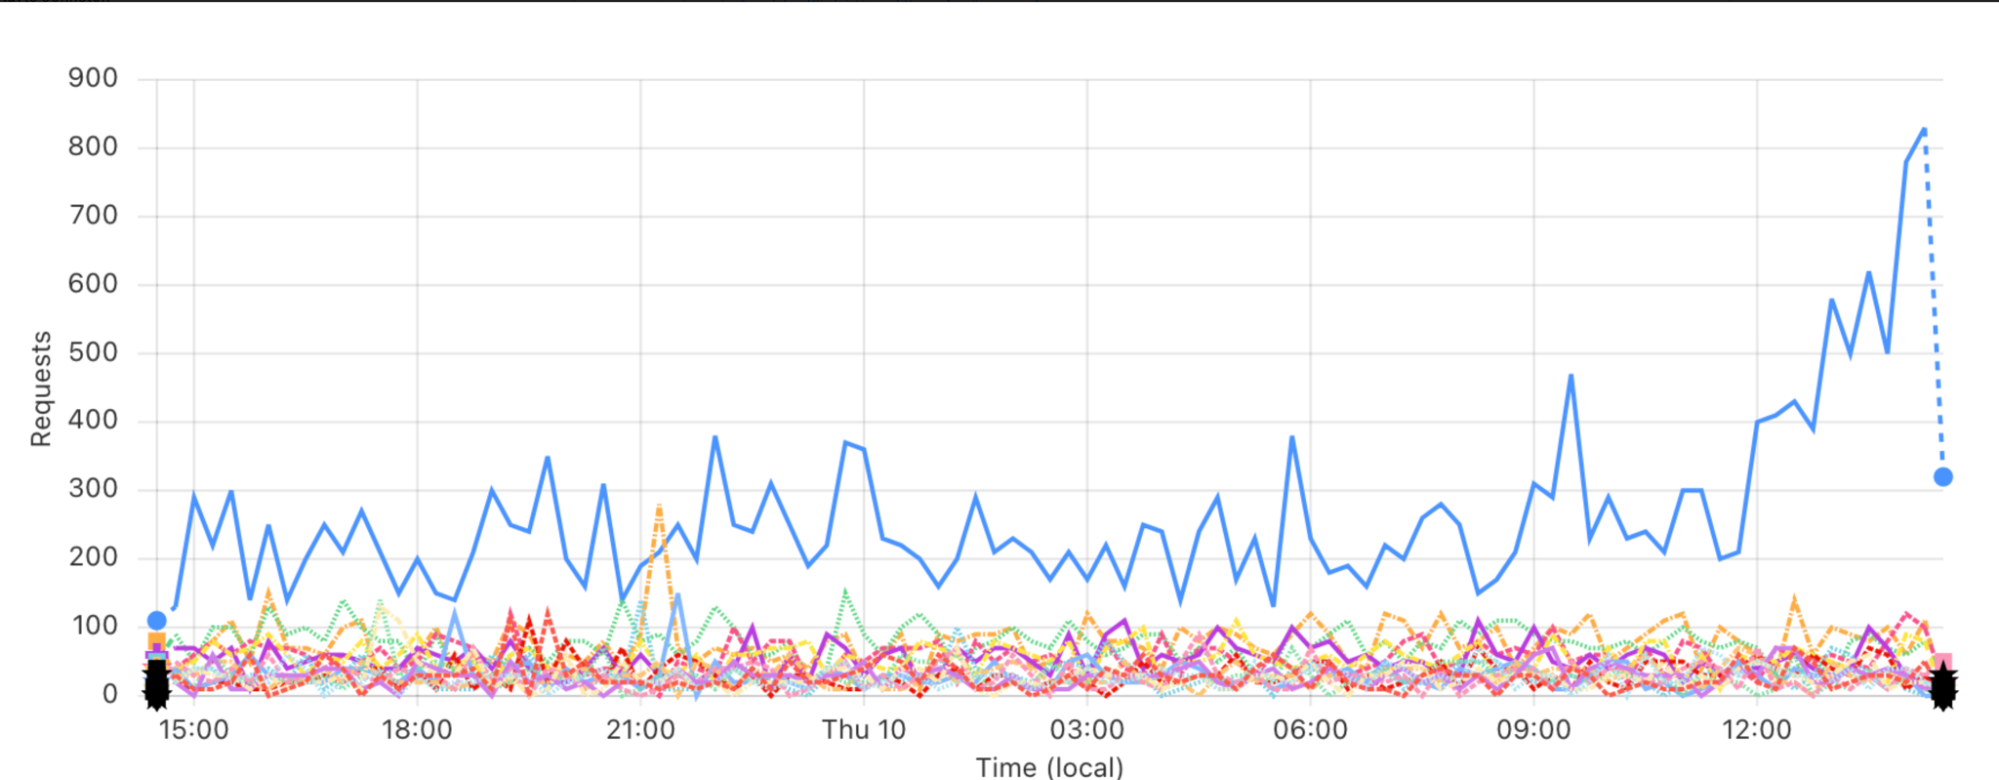
Plurimog does the same thing, but instead of talking between machines, Plurimog talks in between data centers and points of presence. If a request goes into Philadelphia and Philadelphia is unable to take the request, Plurimog will forward to another data center that can take the request, like Ashburn, where the request is decrypted and processed. Because Plurimog operates at layer 4, it can send individual TCP or UDP requests to other places which allows it to be very fine-grained: it can send percentages of traffic to other data centers very easily, meaning that we only need to send away enough traffic to ensure that everyone can be served as fast as possible. Check out how that works in our Frankfurt data center, as we are able to shift progressively more and more traffic away to handle issues in our data centers. This chart shows the number of actions taken on free traffic that cause it to be sent out of Frankfurt over time:
But even within a data center, we can route traffic around to prevent traffic from leaving the datacenter at all. Our large data centers, called Multi-Colo Points of Presence (MCPs) contain logical sections of compute within a data center that are distinct from one another. These MCP data centers are enabled with another version of Unimog called Duomog, which allows for traffic to be shifted between logical sections of compute automatically. This makes MCP data centers fault-tolerant without sacrificing performance for our customers, and allows Traffic Manager to work within a data center as well as between data centers.
When evaluating portions of requests to move, Traffic Manager does the following:
Traffic Manager identifies the proportion of requests that need to be removed from a data center or subsection of a data center so that all requests can be served.
Traffic Manager then calculates the aggregated space metrics for each target to see how many requests each failover data center can take.
Traffic Manager then identifies how much traffic in each plan we need to move, and moves either a proportion of the plan, or all of the plan through Plurimog/Duomog, until we've moved enough traffic. We move Free customers first, and if there are no more Free customers in a data center, we'll move Pro, and then Business customers if needed.
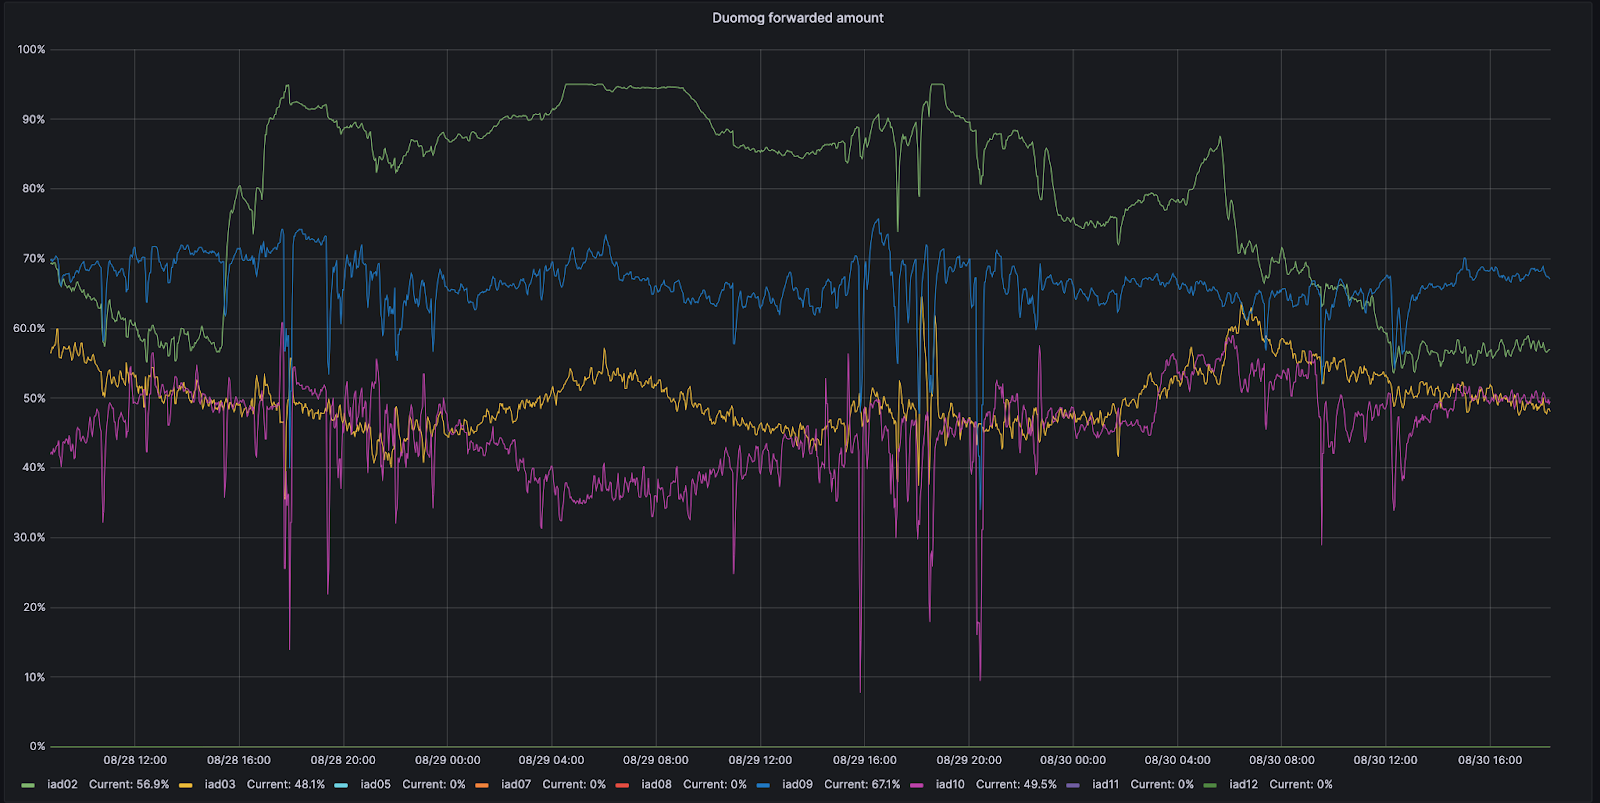
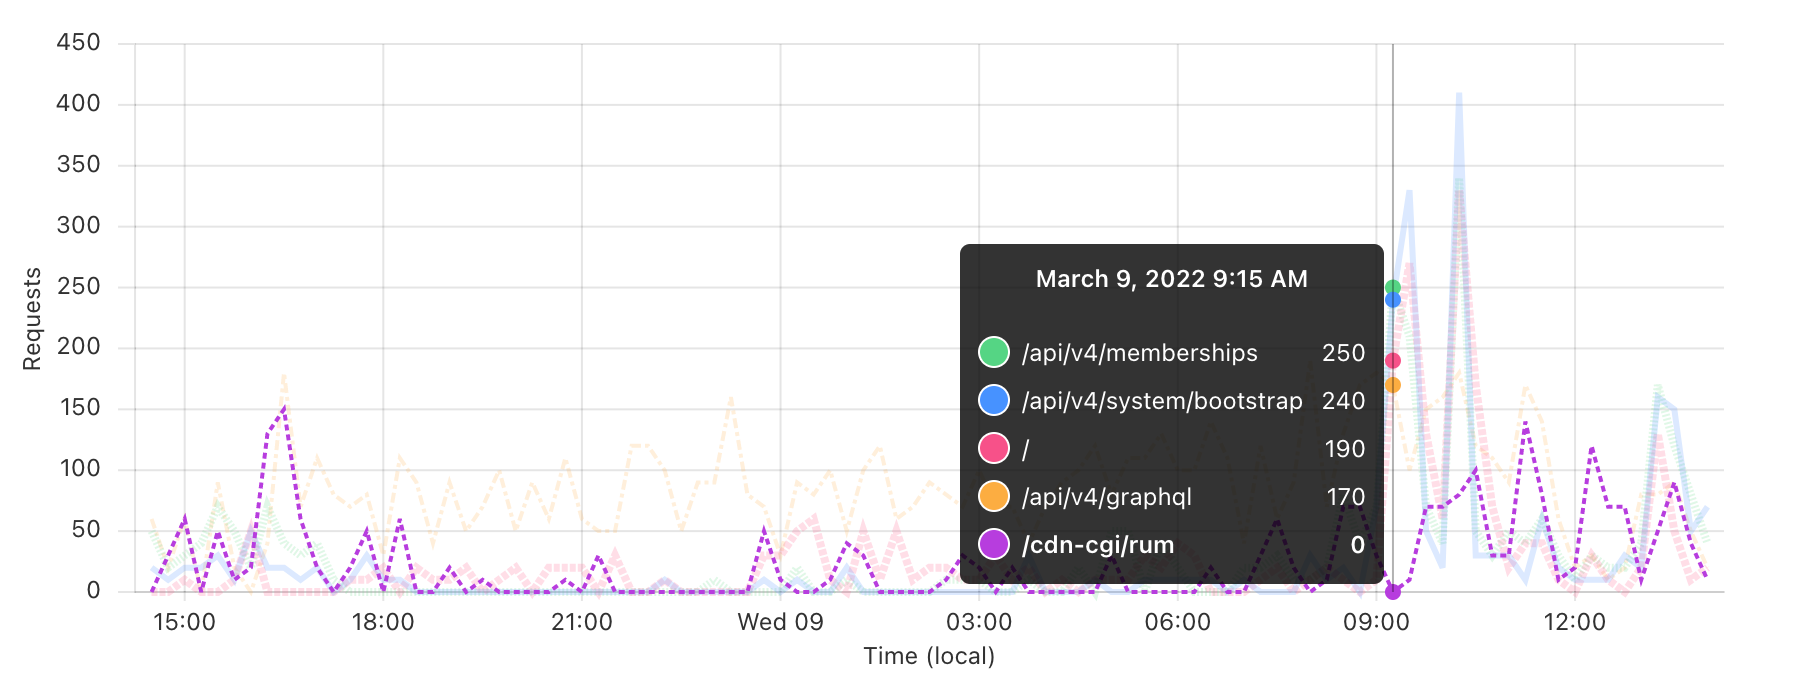
For example, let’s look at Ashburn, Virginia: one of our MCPs. Ashburn has nine different subsections of capacity that can each take traffic. On 8/28, one of those subsections, IAD02, had an issue that reduced the amount of traffic it could handle.
During this time period, Duomog sent more traffic from IAD02 to other subsections within Ashburn, ensuring that Ashburn was always online, and that performance was not impacted during this issue. Then, once IAD02 was able to take traffic again, Duomog shifted traffic back automatically. You can see these actions visualized in the time series graph below, which tracks the percentage of traffic moved over time between subsections of capacity within IAD02 (shown in green):
How does Traffic Manager know how much to move?
Although we used requests per second in the example above, using requests per second as a metric isn’t accurate enough when actually moving traffic. The reason for this is that different customers have different resource costs to our service; a website served mainly from cache with the WAF deactivated is much cheaper CPU wise than a site with all WAF rules enabled and caching disabled. So we record the time that each request takes in the CPU. We can then aggregate the CPU time across each plan to find the CPU time usage per plan. We record the CPU time in ms, and take a per second value, resulting in a unit of milliseconds per second.
CPU time is an important metric because of the impact it can have on latency and customer performance. As an example, consider the time it takes for an eyeball request to make it entirely through the Cloudflare front line servers: we call this the cfcheck latency. If this number goes too high, then our customers will start to notice, and they will have a bad experience. When cfcheck latency gets high, it’s usually because CPU utilization is high. The graph below shows 95th percentile cfcheck latency plotted against CPU utilization across all the machines in the same data center, and you can see the strong correlation:
So having Traffic Manager look at CPU time in a data center is a very good way to ensure that we’re giving customers the best experience and not causing problems.
After getting the CPU time per plan, we need to figure out how much of that CPU time to move to other data centers. To do this, we aggregate the CPU utilization across all servers to give a single CPU utilization across the data center. If a proportion of servers in the data center fail, due to network device failure, power failure, etc., then the requests that were hitting those servers are automatically routed elsewhere within the data center by Duomog. As the number of servers decrease, the overall CPU utilization of the data center increases. Traffic Manager has three thresholds for each data center; the maximum threshold, the target threshold, and the acceptable threshold:
Maximum: the CPU level at which performance starts to degrade, where Traffic Manager will take action
Target: the level to which Traffic Manager will try to reduce the CPU utilization to restore optimal service to users
Acceptable: the level below which a data center can receive requests forwarded from another data center, or revert active moves
When a data center goes above the maximum threshold, Traffic Manager takes the ratio of total CPU time across all plans to current CPU utilization, then applies that to the target CPU utilization to find the target CPU time. Doing it this way means we can compare a data center with 100 servers to a data center with 10 servers, without having to worry about the number of servers in each data center. This assumes that load increases linearly, which is close enough to true for the assumption to be valid for our purposes.
Target ratio equals current ratio:
Therefore:
Subtracting the target CPU time from the current CPU time gives us the CPU time to move:
For example, if the current CPU utilization was at 90% across the data center, the target was 85%, and the CPU time across all plans was 18,000, we would have:
This would mean Traffic Manager would need to move 1,000 CPU time:
Now we know the total CPU time needed to move, we can go through the plans, until the required time to move has been met.
What is the maximum threshold?
A frequent problem that we faced was determining at which point Traffic Manager should start taking action in a data center – what metric should it watch, and what is an acceptable level?
As said before, different services have different requirements in terms of CPU utilization, and there are many cases of data centers that have very different utilization patterns.
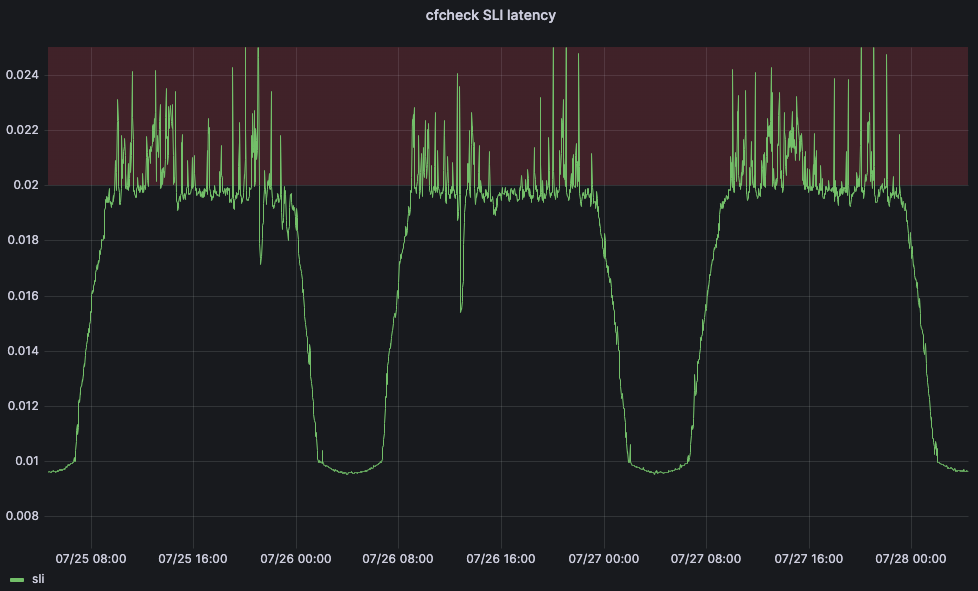
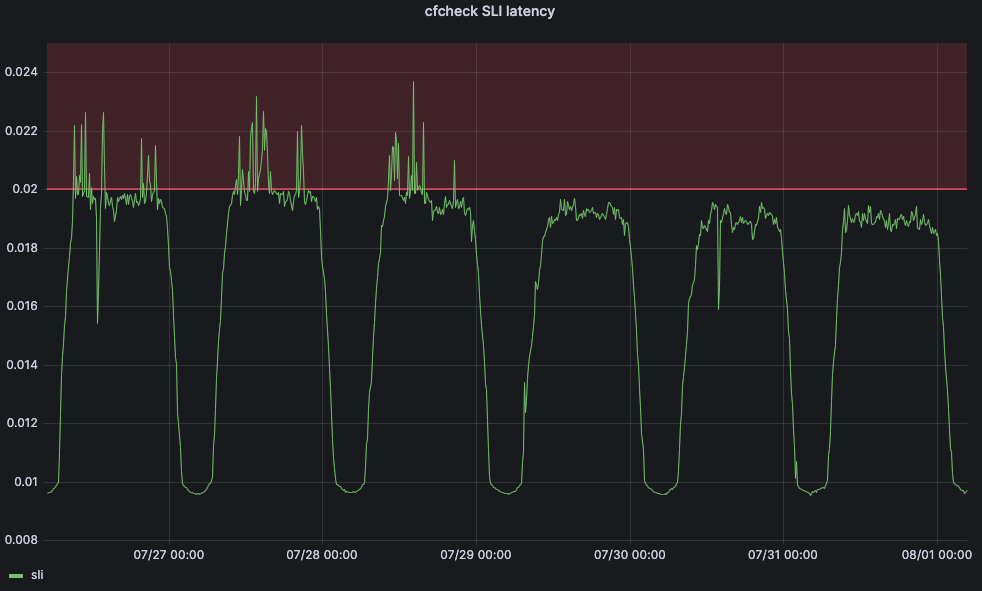
To solve this problem, we turned to machine learning. We created a service that will automatically adjust the maximum thresholds for each data center according to customer-facing indicators. For our main service-level indicator (SLI), we decided to use the cfcheck latency metric we described earlier.
But we also need to define a service-level objective (SLO) in order for our machine learning application to be able to adjust the threshold. We set the SLO for 20ms. Comparing our SLO to our SLI, our 95th percentile cfcheck latency should never go above 20ms and if it does, we need to do something. The below graph shows 95th percentile cfcheck latency over time, and customers start to get unhappy when cfcheck latency goes into the red zone:
If customers have a bad experience when CPU gets too high, then the goal of Traffic Manager’s maximum thresholds are to ensure that customer performance isn’t impacted and to start redirecting traffic away before performance starts to degrade. At a scheduled interval the Traffic Manager service will fetch a number of metrics for each data center and apply a series of machine learning algorithms. After cleaning the data for outliers we apply a simple quadratic curve fit, and we are currently testing a linear regression algorithm.
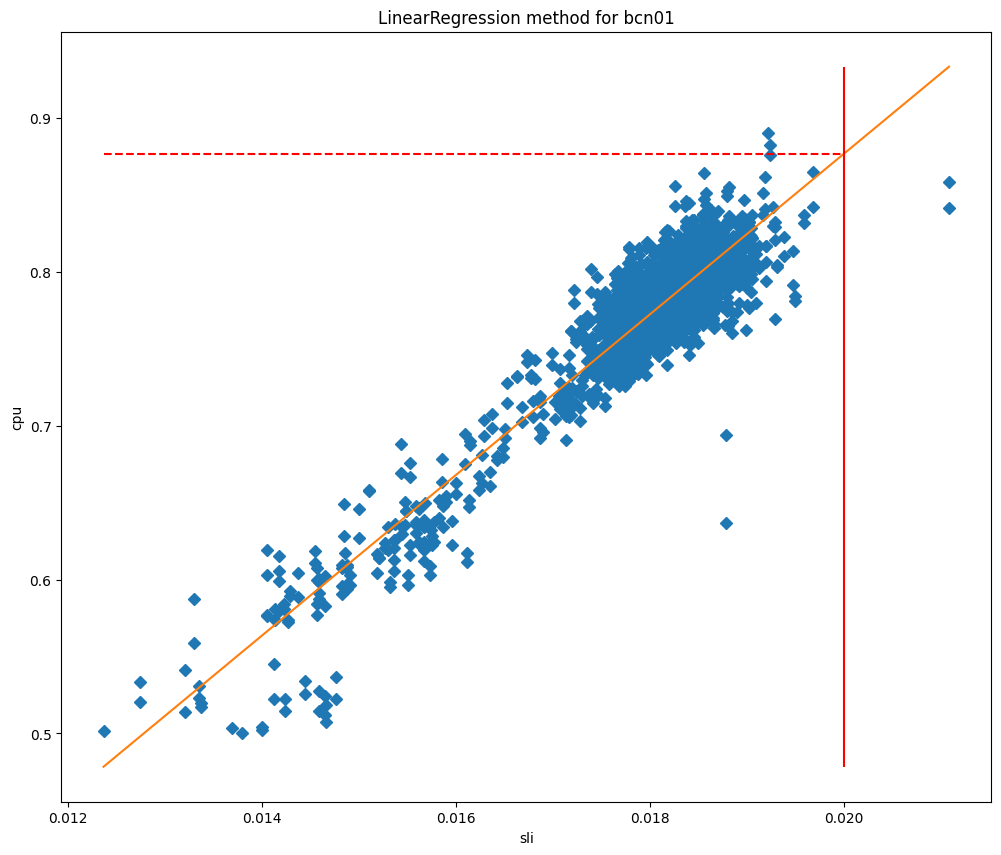
After fitting the models we can use them to predict the CPU usage when the SLI is equal to our SLO, and then use it as our maximum threshold. If we plot the cpu values against the SLI we can see clearly why these methods work so well for our data centers, as you can see for Barcelona in the graphs below, which are plotted against curve fit and linear regression fit respectively.
In these charts the vertical line is the SLO, and the intersection of this line with the fitted model represents the value that will be used as the maximum threshold. This model has proved to be very accurate, and we are able to significantly reduce the SLO breaches. Let’s take a look at when we started deploying this service in Lisbon:
Before the change, cfcheck latency was constantly spiking, but Traffic Manager wasn’t taking actions because the maximum threshold was static. But after July 29, we see that cfcheck latency has never hit the SLO because we are constantly measuring to make sure that customers are never impacted by CPU increases.
Where to send the traffic?
So now that we have a maximum threshold, we need to find the third CPU utilization threshold which isn’t used when calculating how much traffic to move – the acceptable threshold. When a data center is below this threshold, it has unused capacity which, as long as it isn’t forwarding traffic itself, is made available for other data centers to use when required. To work out how much each data center is able to receive, we use the same methodology as above, substituting target for acceptable:
Therefore:
Subtracting the current CPU time from the acceptable CPU time gives us the amount of CPU time that a data center could accept:
To find where to send traffic, Traffic Manager will find the available CPU time in all data centers, then it will order them by latency from the data center needing to move traffic. It moves through each of the data centers, using all available capacity based on the maximum thresholds before moving onto the next. When finding which plans to move, we move from the lowest priority plan to highest, but when finding where to send them, we move in the opposite direction.
To make this clearer let's use an example:
We need to move 1,000 CPU time from data center A, and we have the following usage per plan: Free: 500ms/s, Pro: 400ms/s, Business: 200ms/s, Enterprise: 1000ms/s.
We would move 100% of Free (500ms/s), 100% of Pro (400ms/s), 50% of Business (100ms/s), and 0% of Enterprise.
Nearby data centers have the following available CPU time: B: 300ms/s, C: 300ms/s, D: 1,000ms/s.
With latencies: A-B: 100ms, A-C: 110ms, A-D: 120ms.
Starting with the lowest latency and highest priority plan that requires action, we would be able to move all the Business CPU time to data center B and half of Pro. Next we would move onto data center C, and be able to move the rest of Pro, and 20% of Free. The rest of Free could then be forwarded to data center D. Resulting in the following action: Business: 50% → B, Pro: 50% → B, 50% → C, Free: 20% → C, 80% → D.
Reverting actions
In the same way that Traffic Manager is constantly looking to keep data centers from going above the threshold, it is also looking to bring any forwarded traffic back into a data center that is actively forwarding traffic.
Above we saw how Traffic Manager works out how much traffic a data center is able to receive from another data center — it calls this the available CPU time. When there is an active move we use this available CPU time to bring back traffic to the data center — we always prioritize reverting an active move over accepting traffic from another data center.
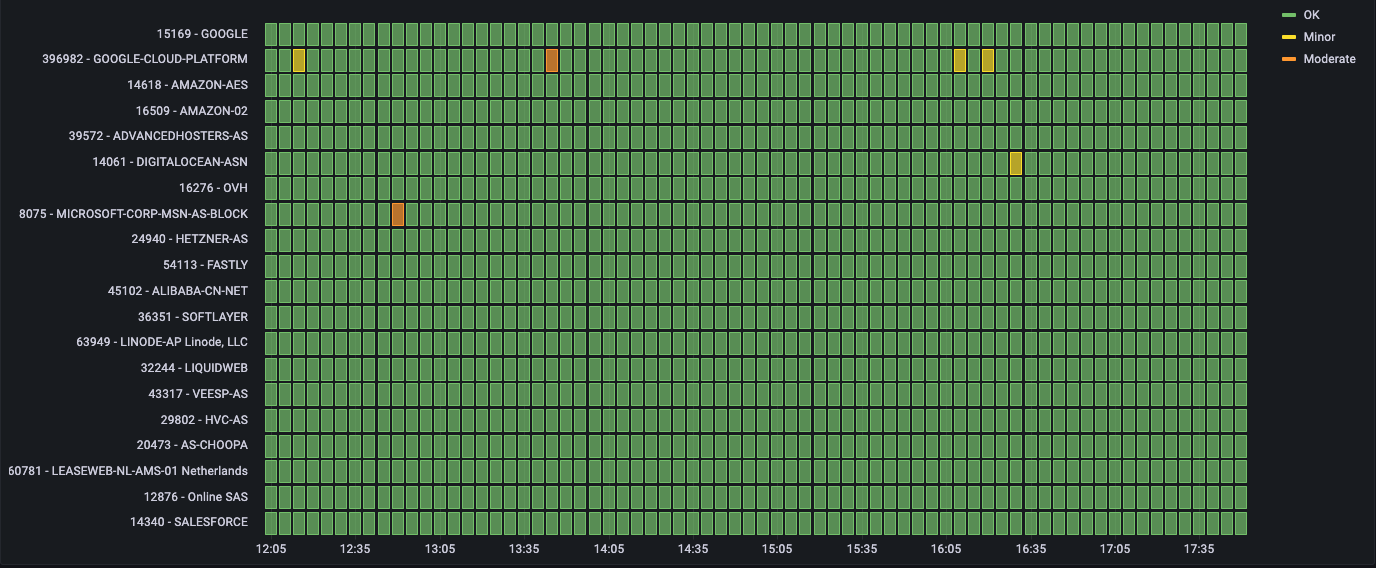
When you put this all together, you get a system that is constantly measuring system and customer health metrics for every data center and spreading traffic around to make sure that each request can be served given the current state of our network. When we put all of these moves between data centers on a map, it looks something like this, a map of all Traffic Manager moves for a period of one hour. This map doesn’t show our full data center deployment, but it does show the data centers that are sending or receiving moved traffic during this period:
Data centers in red or yellow are under load and shifting traffic to other data centers until they become green, which means that all metrics are showing as healthy. The size of the circles represent how many requests are shifted from or to those data centers. Where the traffic is going is denoted by where the lines are moving. This is difficult to see at a world scale, so let’s zoom into the United States to see this in action for the same time period:
Here you can see Toronto, Detroit, New York, and Kansas City are unable to serve some requests due to hardware issues, so they will send those requests to Dallas, Chicago, and Ashburn until equilibrium is restored for users and data centers. Once data centers like Detroit are able to service all the requests they are receiving without needing to send traffic away, Detroit will gradually stop forwarding requests to Chicago until any issues in the data center are completely resolved, at which point it will no longer be forwarding anything. Throughout all of this, end users are online and are not impacted by any physical issues that may be happening in Detroit or any of the other locations sending traffic.
Happy network, happy products
Because Traffic Manager is plugged into the user experience, it is a fundamental component of the Cloudflare network: it keeps our products online and ensures that they’re as fast and reliable as they can be. It’s our real time load balancer, helping to keep our products fast by only shifting necessary traffic away from data centers that are having issues. Because less traffic gets moved, our products and services stay fast.
But Traffic Manager can also help keep our products online and reliable because they allow our products to predict where reliability issues may occur and preemptively move the products elsewhere. For example, Browser Isolation directly works with Traffic Manager to help ensure the uptime of the product. When you connect to a Cloudflare data center to create a hosted browser instance, Browser Isolation first asks Traffic Manager if the data center has enough capacity to run the instance locally, and if so, the instance is created right then and there. If there isn’t sufficient capacity available, Traffic Manager tells Browser Isolation which the closest data center with sufficient available capacity is, thereby helping Browser Isolation to provide the best possible experience for the user.
Happy network, happy users
At Cloudflare, we operate this huge network to service all of our different products and customer scenarios. We’ve built this network for resiliency: in addition to our MCP locations designed to reduce impact from a single failure, we are constantly shifting traffic around on our network in response to internal and external issues.
But that is our problem — not yours.
Similarly, when human beings had to fix those issues, it was customers and end users who would be impacted. To ensure that you’re always online, we’ve built a smart system that detects our hardware failures and preemptively balances traffic across our network to ensure it’s online and as fast as possible. This system works faster than any person — not only allowing our network engineers to sleep at night — but also providing a better, faster experience for all of our customers.
And finally: if these kinds of engineering challenges sound exciting to you, then please consider checking out the Traffic Engineering team's open position on Cloudflare’s Careers page!
We are thrilled to introduce Cloudflare Fonts! In the coming weeks sites that use Google Fonts will be able to effortlessly load their fonts from the site’s own domain rather than from Google. All at a click of a button. This enhances both privacy and performance. It enhances users' privacy by eliminating the need to load fonts from Google’s third-party servers. It boosts a site's performance by bringing fonts closer to end users, reducing the time spent on DNS lookups and TLS connections.
Sites that currently use Google Fonts will not need to self-host fonts or make complex code changes to benefit – Cloudflare Fonts streamlines the entire process, making it a breeze.
Fonts and privacy
When you load fonts from Google, your website initiates a data exchange with Google's servers. This means that your visitors' browsers send requests directly to Google. Consequently, Google has the potential to accumulate a range of data, including IP addresses, user agents (formatted descriptions of the browser and operating system), the referer (the page on which the Google font is to be displayed) and how often each IP makes requests to Google. While Google states that they do not use this data for targeted advertising or set cookies, any time you can prevent sharing your end user’s personal data unnecessarily is a win for privacy.
With Cloudflare Fonts, when you serve fonts directly from your own domain. This means no font requests are sent to third-party domains like Google, which some privacy regulators have found to be a problem in the past. Our pro-privacy approach means your end user’s IP address and other data are not sent to another domain. All that information stays within your control, within your domain. In addition, because Cloudflare Fonts eliminates data transmission to third-party servers like Google's, this can enhance your ability to comply with any potential data localization requirements.
Faster Google Font delivery through Cloudflare
Now that we have established that Cloudflare Fonts can improve your privacy, let's flip to the other side of the coin – how Cloudflare Fonts will improve your performance.
To do this, we first need to delve into how Google Fonts affects your website's performance. Subsequently, we'll explore how Cloudflare Fonts addresses and rectifies these performance challenges.
Google Fonts is a fantastic resource that offers website owners a range of royalty-free fonts for website usage. When you decide on the fonts you would like to incorporate, it’s super easy to integrate. You just add a snippet of HTML to your site. You then add styles to apply these fonts to various parts of your page:
But this ease of use comes with a performance penalty.
Upon loading your webpage, your visitors' browser fetches the CSS file as soon as the HTML starts to be parsed. Then, when the browser starts rendering the page and identifies the need for fonts in different text sections, it requests the required font files.
This is where the performance problem arises. Google Fonts employs a two-domain system: the CSS resides on one domain – fonts.googleapis.com – while the font files reside on another domain – fonts.gstatic.com.
This separation results in a minimum of four round trips to the third-party servers for each resource request. These round trips are DNS lookup, socket connection establishment, TLS negotiation (for HTTPS), and the final round trip for the actual resource request. Ultimately, getting a font from Google servers to a browser requires eight round trips.
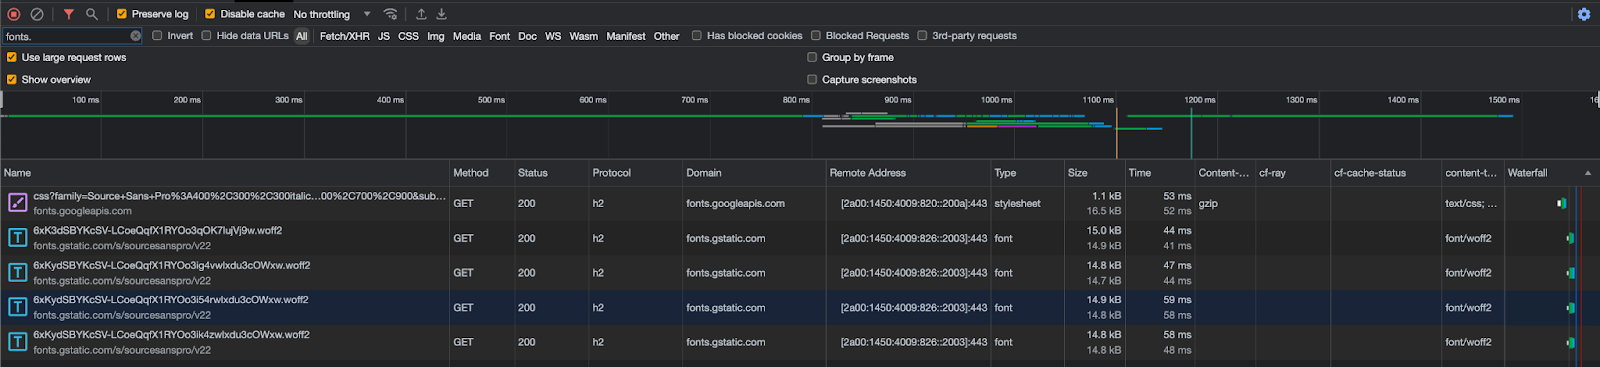
Users can see this. If they are using Google Fonts they can open their network tab and filter for these Google domains.
You can visually see the impact of the extra DNS request and TLS connection that these requests add to your website experience. For example on my WordPress site that natively uses Google Fonts as part of the theme adds an extra ~150ms.
Fast fonts
Cloudflare Fonts streamlines this process, by reducing the number of round trips from eight to one. Two sets of DNS lookups, socket connections and TLS negotiations to third-parties are no longer required because there is no longer a third-party server involved in serving the CSS or the fonts. The only round trip involves serving the font files directly from the same domain where the HTML is hosted. This approach offers an additional advantage: it allows fonts to be transmitted over the same HTTP/2 or HTTP/3 connection as other page resources, benefiting from proper prioritization and preventing bandwidth contention.
The eagle-eyed amongst you might be thinking “Surely it is still two round trips – what about the CSS request?”. Well, with Cloudflare Fonts, we have also removed the need for a separate CSS request. This means there really is only one round-trip – fetching the font itself.
To achieve both the home-routing of font requests and the removal of the CSS request, we rewrite the HTML as it passes through Cloudflare’s global network. The CSS response is embedded, and font URL transformations are performed within the embedded CSS.
These transformations adjust the font URLs to align with the same domain as the HTML content. These modified responses seamlessly pass through Cloudflare's caching infrastructure, where they are automatically cached for a substantial performance boost. In the event of any cache misses, we use Fontsource and NPM to load these fonts and cache them within the Cloudflare infrastructure. This approach ensures that there's no inadvertent data exposure to Google's infrastructure, maintaining both performance and data privacy.
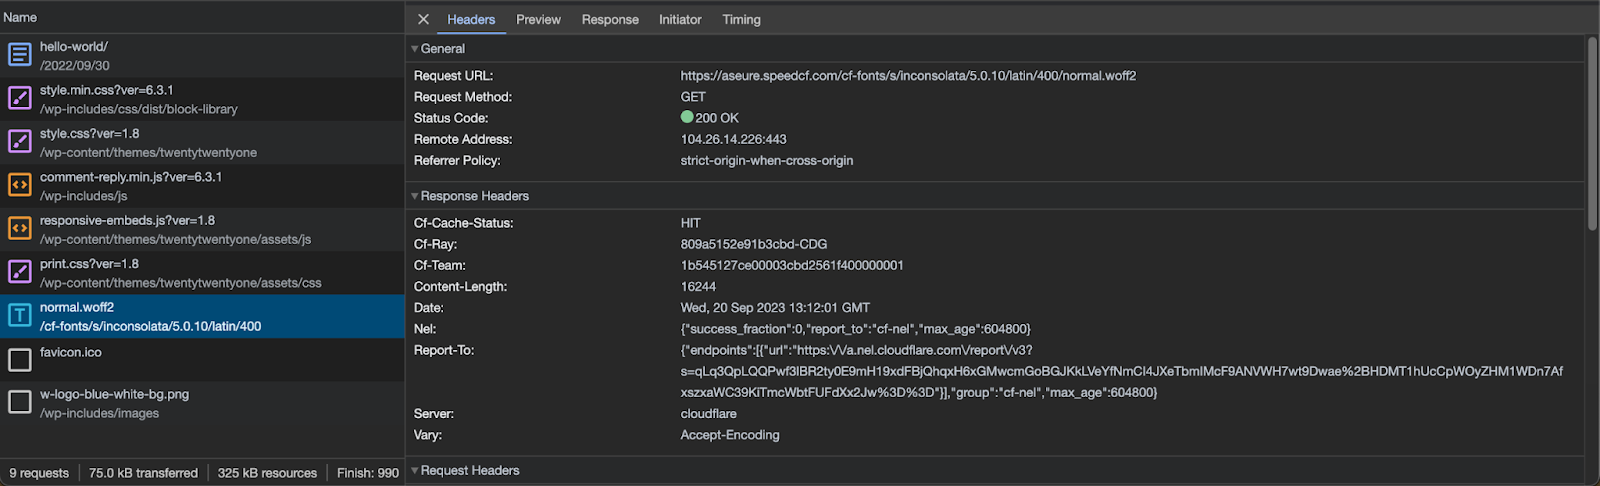
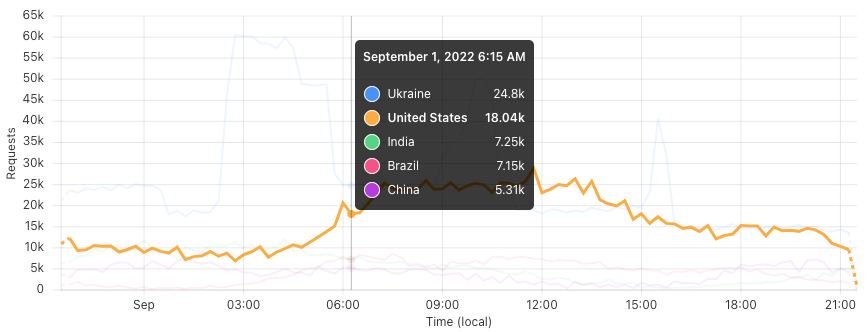
With Cloudflare Fonts enabled, you are able to see within your Network Tab that font files are now loaded from your own hostname from the /cf-fonts path and served from Cloudflare’s closest cache to the user, as indicated by the cf-cache-status: HIT.
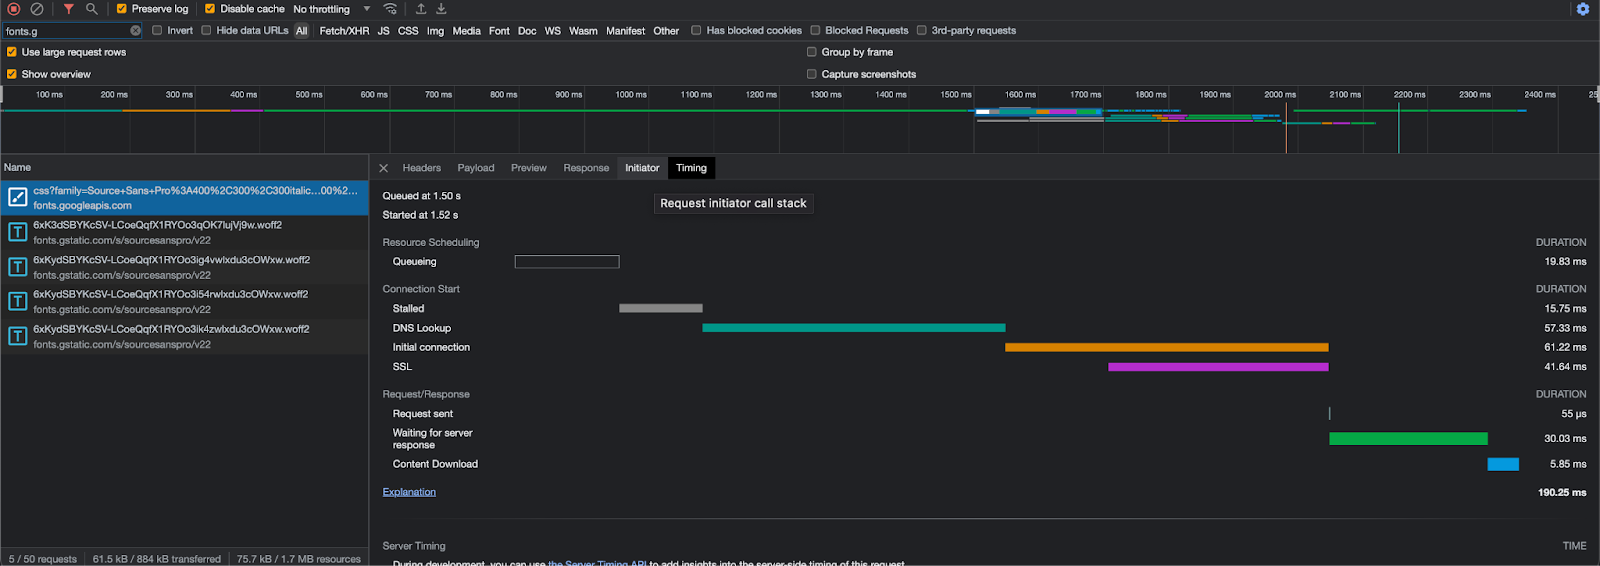
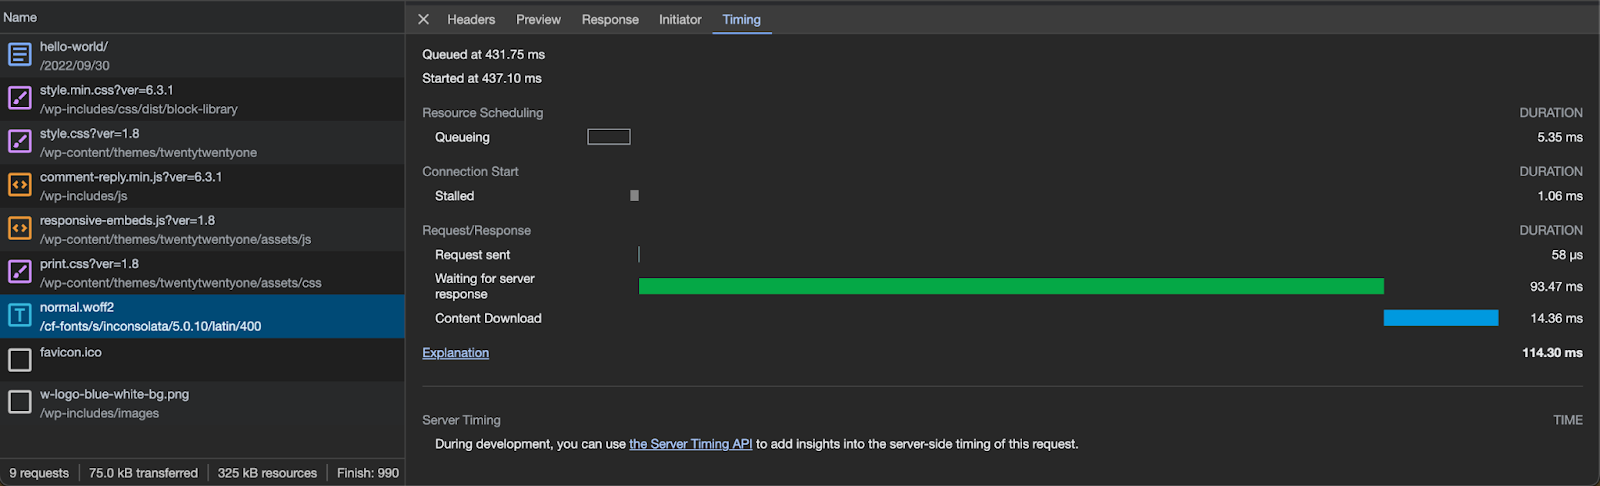
Additionally, you can notice that the timings section in the browser no longer needs an extra DNS lookup for the hostname or the setup of a TLS connection. This happens because the content is served from your hostname, and the browser has already cached the DNS response and has an open TLS connection.
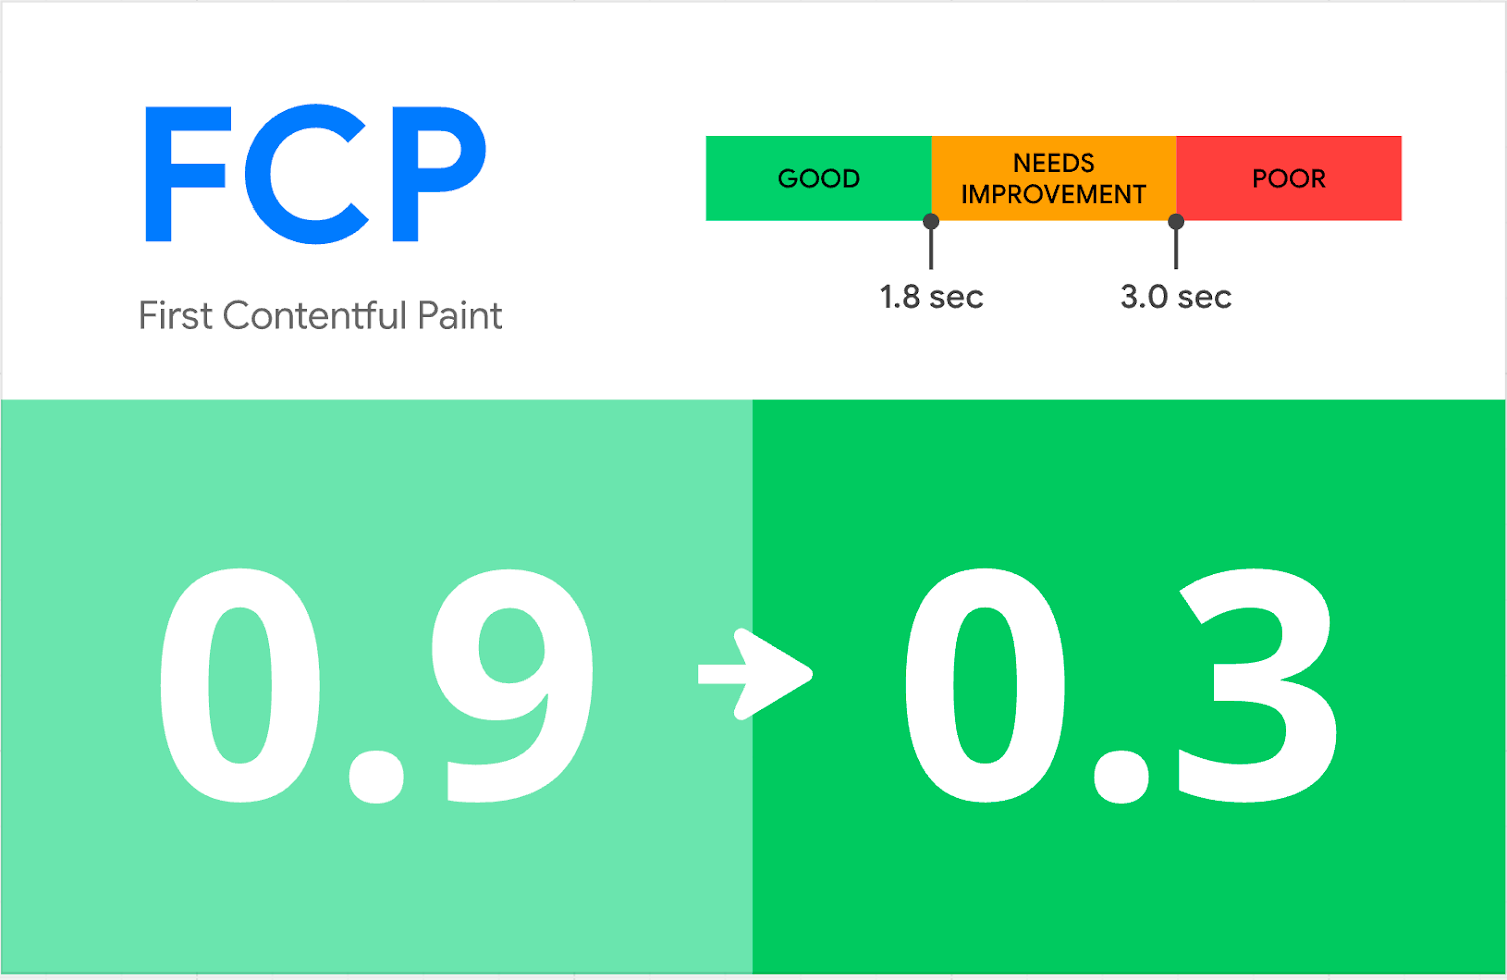
Finally, you can see the real-world performance benefits of Cloudflare Fonts. We conducted synthetic Google Lighthouse tests before enabling Cloudflare Fonts on a straightforward page that displays text. First Contentful Paint (FCP), which represents the time it takes for the first content element to appear on the page, was measured at 0.9 seconds in the Google fonts tests. After enabling Cloudflare Fonts, the First Contentful Paint (FCP) was reduced to 0.3 seconds, and our overall Lighthouse performance score improved from 98 to a perfect 100 out of 100.
Making Cloudflare Fonts fast with ROFL
In order to make Cloudflare Fonts this performant, we needed to make blazing-fast HTML alterations as responses stream through Cloudflare’s network. This has been made possible by leveraging one of Cloudflare’s more recent technologies.
Earlier this year, we finished rewriting one of Cloudflare's oldest components, which played a crucial role in dynamically altering HTML content. But as described in this blog post, a new solution was required to replace the old – A memory-safe solution, able to scale to Cloudflare’s ever-increasing load.
This new module is known as ROFL (Response Overseer for FL). It now powers various Cloudflare products that need to alter HTML as it streams, such as Email Obfuscation, Rocket Loader, and HTML Minification.
ROFL was developed entirely in Rust. This decision was driven by Rust's memory safety, performance, and security. The memory-safety features of Rust are indispensable to ensure airtight protection against memory leaks while we process a staggering volume of requests, measuring in the millions per second. Rust's compiled nature allows us to finely optimize our code for specific hardware configurations, delivering impressive performance gains compared to interpreted languages.
ROFL paved the way for the development of Cloudflare Fonts. The performance of ROFL allows us to rewrite HTML on-the-fly and modify the Google Fonts links quickly, safely and efficiently. This speed helps us reduce any additional latency added by processing the HTML file and improve the performance of your website.
Unlock the power of Cloudflare Fonts today! 🚀
Cloudflare Fonts will be available to all Cloudflare customers in October. If you're using Google Fonts, you will be able to supercharge your site's privacy and speed. By enabling this feature, you can seamlessly enhance your website's performance while safeguarding your user’s privacy.
Today, we are excited to announce Cloudflare Trace! Cloudflare Trace is available to all our customers. Cloudflare Trace enables you to understand how HTTP requests traverse your zone's configuration and what Cloudflare Rules are being applied to the request.
For many Cloudflare customers, the journey their customers' traffic embarks on through the Cloudflare ecosystem was a mysterious black box. It's a complex voyage, routed through various products, each capable of introducing modification to the request.
Consider this scenario: your web traffic could get blocked by WAF Custom Rules or Managed Rules (WAF); it might face rate limiting, or undergo modifications via Transform Rules, Where a Cloudflare account has many admins, modifying different things it can be akin to a game of "hit and hope," where the outcome of your web traffic's journey is uncertain as you are unsure how another admins rule will impact the request before or after yours. While Cloudflare's individual products are designed to be intuitive, their interoperation, or how they work together, hasn't always been as transparent as our customers need it to be. Cloudflare Trace changes this.
Running a trace
Cloudflare Trace allows users to set a number of request variables, allowing you to tailor your trace precisely to your needs. A basic trace will require users to define two settings. A URL that is being proxied through Cloudflare and an HTTP method such as GET. However, customers can also set request headers, add a request body and even set a bot score to allow users to validate the correct behavior of their security rules.
Once a trace is initiated, the dashboard returns a visualization of the products that were matched on a request, such as Configuration Rules, Transform Rules, and Firewall Rules, along with the specific rules inside these phases that were applied. Customers can then view further details of the filters and actions the specific rule undertakes. Clicking the rule id will take you directly to that specific rule in the Cloudflare Dashboard, allowing you to edit filters and actions if needed.
The user interface also generates a programmatic version of the trace that can be used by customers to run traces via a command line. This enables customers to use tools like jq to further investigate the extensive details returned via the trace output.
The life of a Cloudflare request
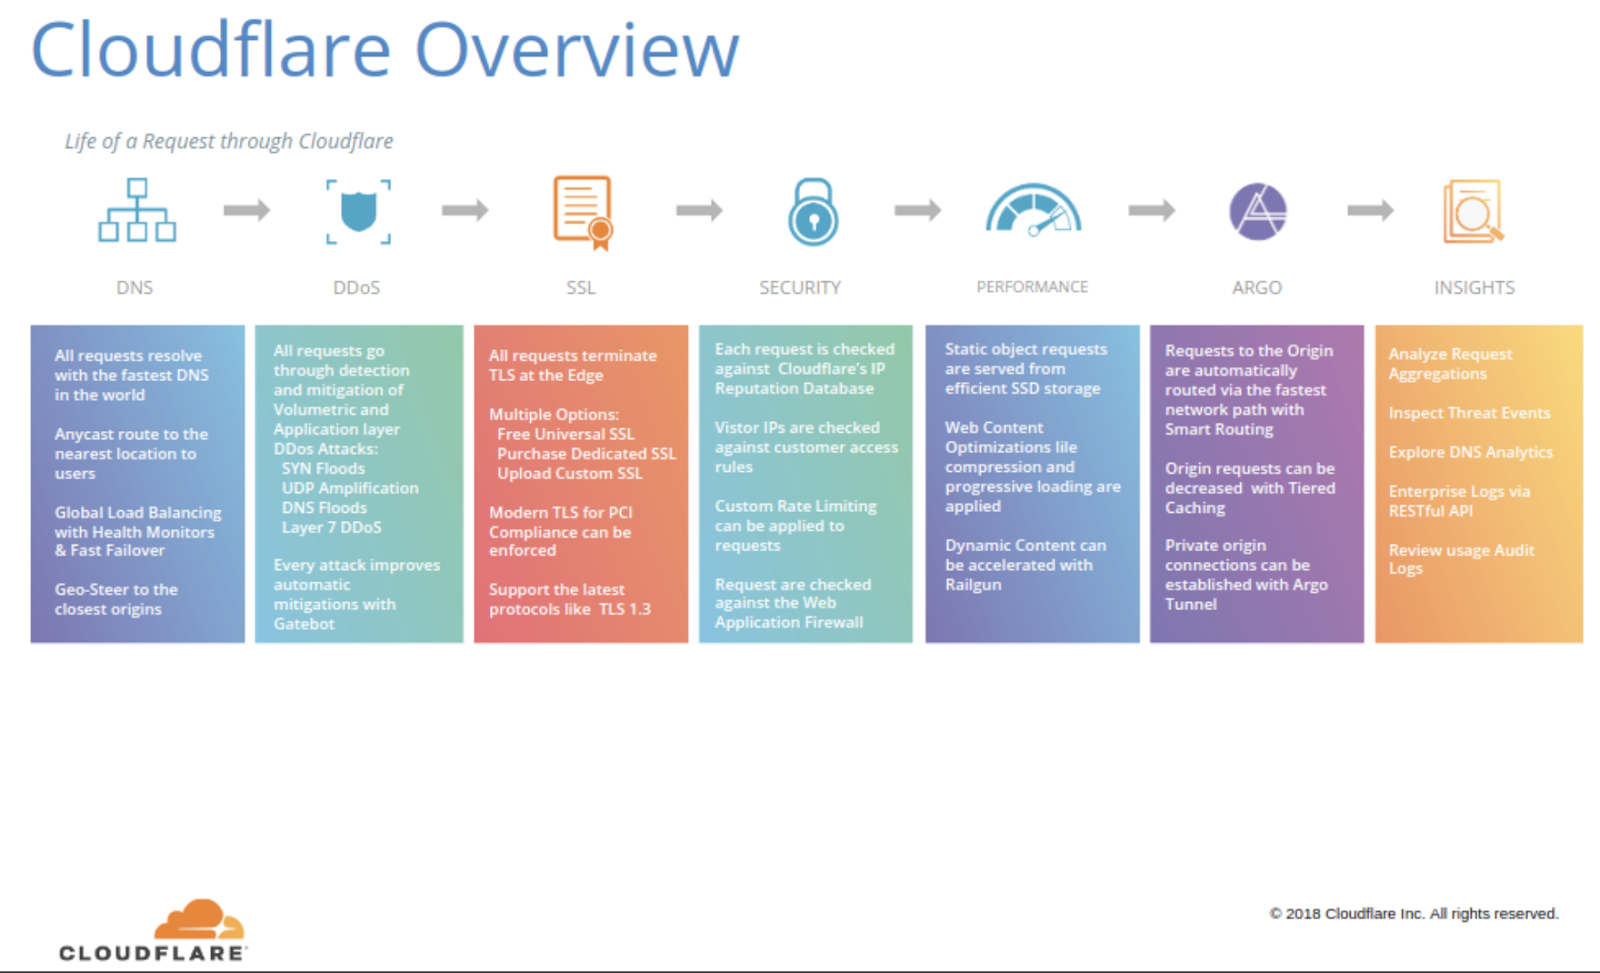
Understanding the intricate journey that your traffic embarks on within Cloudflare can be a challenging task for many of our customers and even for Cloudflare employees. This complexity often leads to questions within our Cloudflare Community or direct inquiries to our support team. Internally, over the past 13 years at Cloudflare, numerous individuals have attempted to explain this journey through diagrams. We maintain an internal Wiki page titled 'Life of a Request Museum.' This page archives all the attempts made over the years by some of the first Cloudflare engineers, heads of product, and our marketing team, where the following image was used in our 2018 marketing slides.
The "problem" (a rather positive one) is that Cloudflare is innovating so rapidly. New products are being added, code is removed, and existing products are continually enhanced. As a result, a diagram created just a few weeks ago can quickly become outdated and challenging to keep up to date.
Finding a happy medium
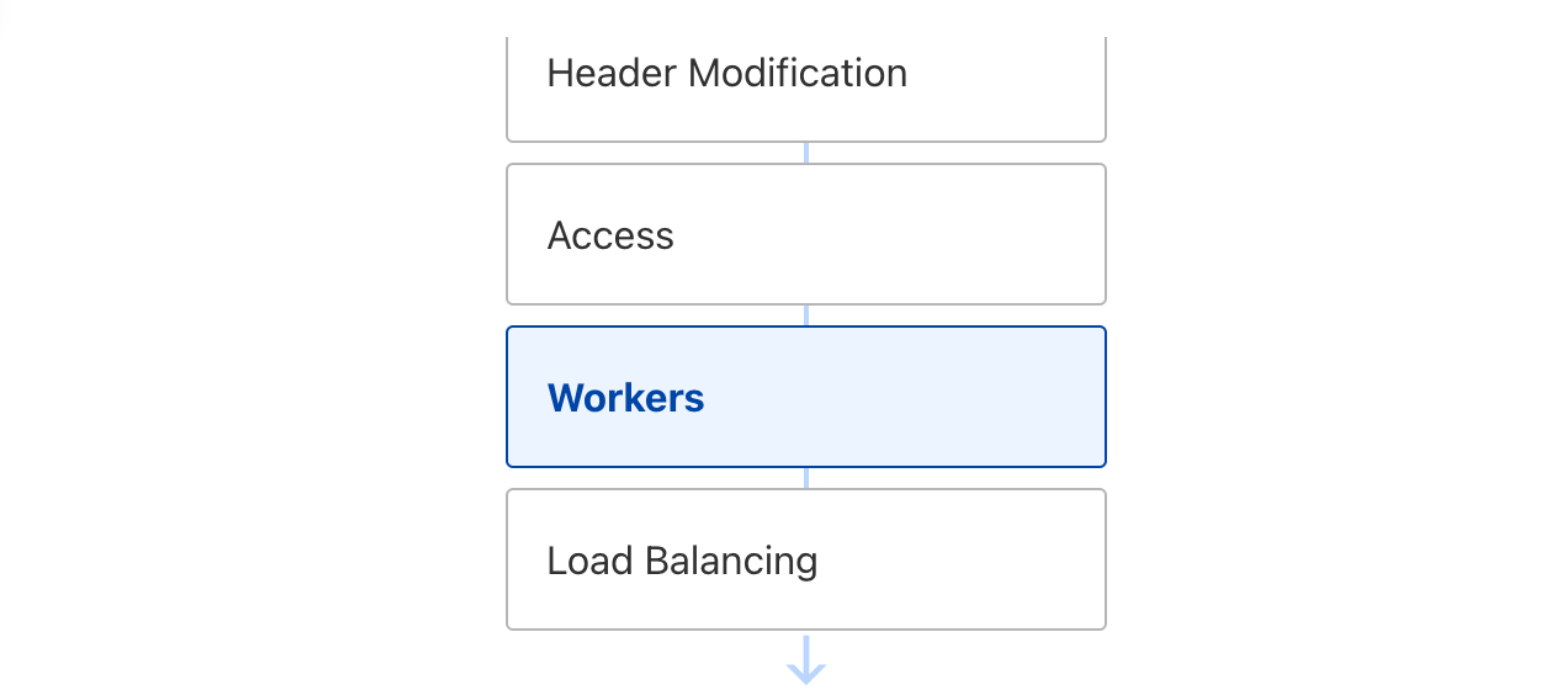
However, customers still want to understand, “The life of a request.” Striking the ideal balance between providing just enough detail without overwhelming our users posed a problem akin to the Goldilocks principle. One of our first attempts to detail the ordering of Cloudflare products was Traffic Sequence, a straightforward dashboard illustration that provides a basic, high-level overview of the interactions between Cloudflare products. While it does not detail every intricacy, it helps our customers understand the order and flow of products that interacted with an HTTP request and was a welcome addition to the Cloudflare dashboard.
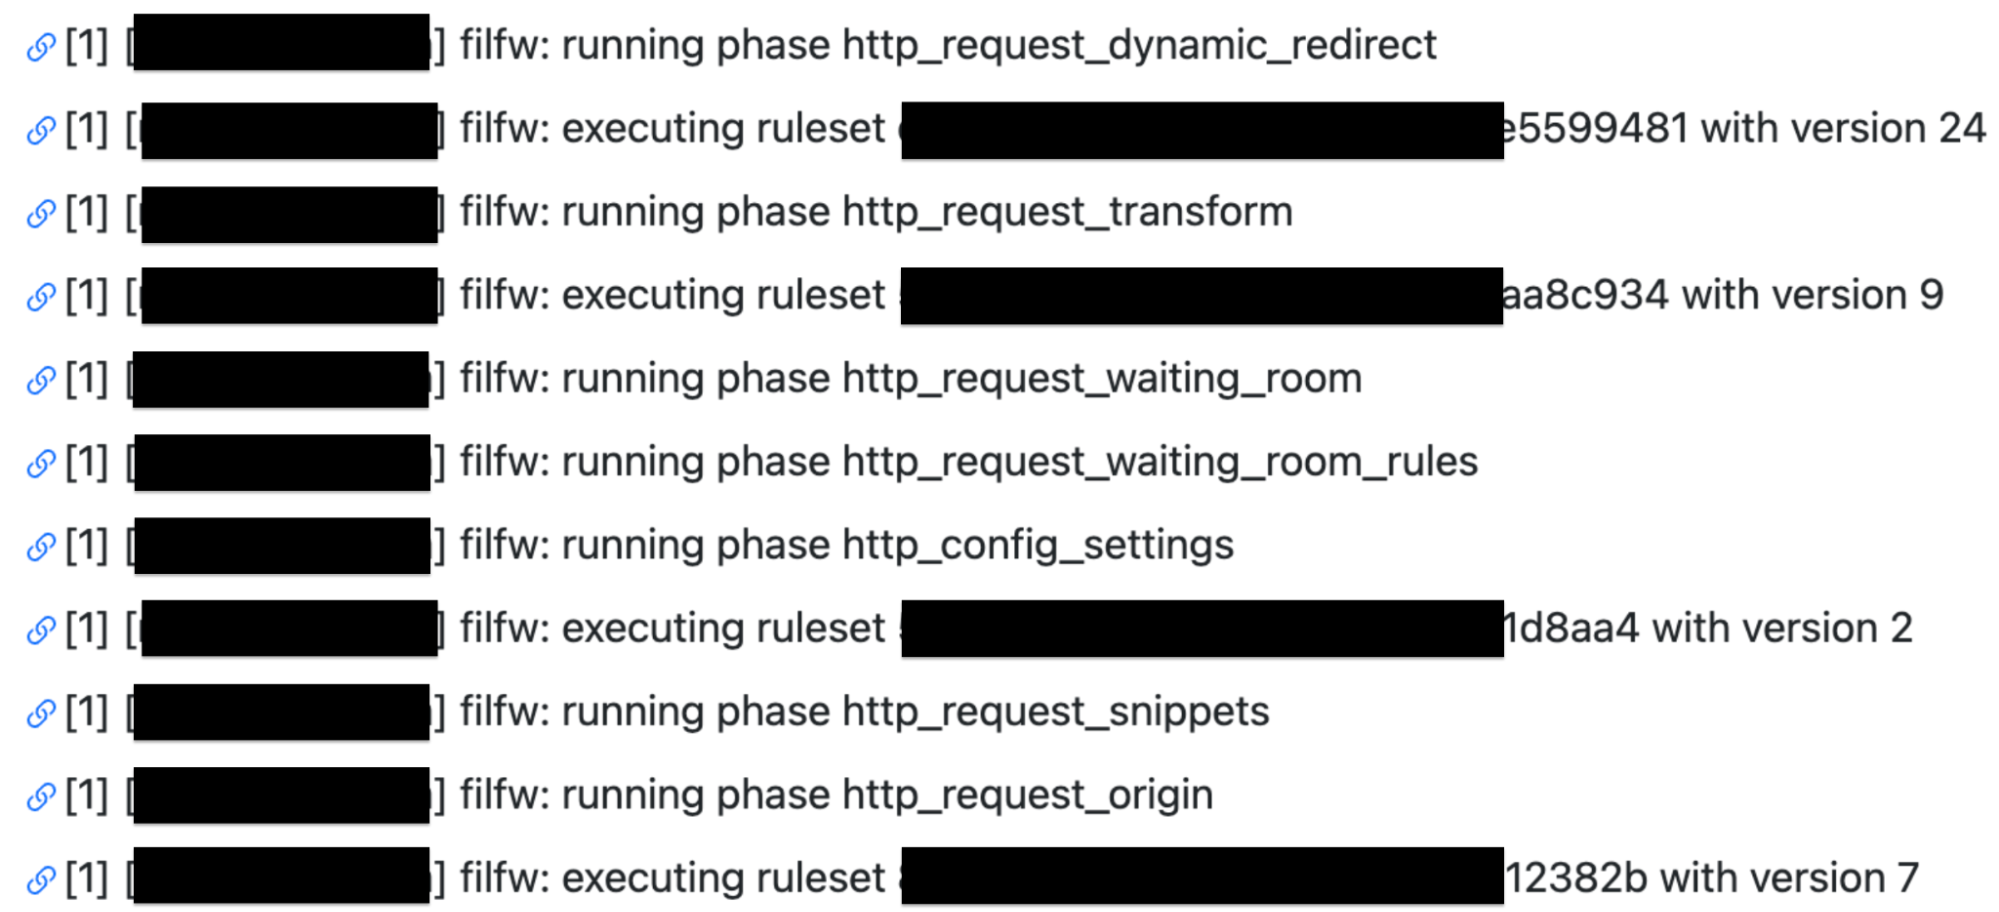
However, customers still requested further insights and details. Especially around debugging issues. Internally Cloudflare teams utilize a number of self created products to trace a request. One of these products is Flute. This product gives a verbose output of all rules, Cloudflare features and codepaths a request undertakes. This allows our engineers and support teams to investigate an issue and identify if something is awry. For example in the following Flute trace image you can see how a request for my domain is evaluated against Single Redirects, Waiting Room, Configuration Settings, Snippets and Origin Rules.
The Flute tool became one of the key focal points in the development of Cloudflare Trace. However, it can be quite intricate and packed with extensive details, potentially leading to more questions than solutions if copied verbatim and exposed to our customers.
To understand the happy medium in developing Cloudflare Trace. We closely collaborated with our Support team to gain a deeper understanding of the challenges our customers faced specifically around Cloudflare Rulesets. The primary challenge centered around understanding which rules were applicable to specific requests. Customers often raised queries, and in certain instances, these inquiries had to be escalated for further investigation into the reasons behind a request's specific behavior. By empowering our customers to independently investigate and comprehend these issues, we identified a second area where Cloudflare Trace proves invaluable—by reducing the workload of our support team and enabling them to operate more efficiently while focusing on other support tickets.
For customers encountering genuine problems, they have the capability to export the JSON response of a trace, which can then be directly uploaded to a support ticket. This streamlined process significantly reduces the time required to investigate and resolve support tickets.
Trace examples
Cloudflare Trace has been available via API for the last nine months. We have been working with a number of customers and stakeholders to understand where tracing is beneficial and solving customer problems. Here are some of the real world examples that we have solved using Cloudflare Trace.
Transform Rules inconsistently matching
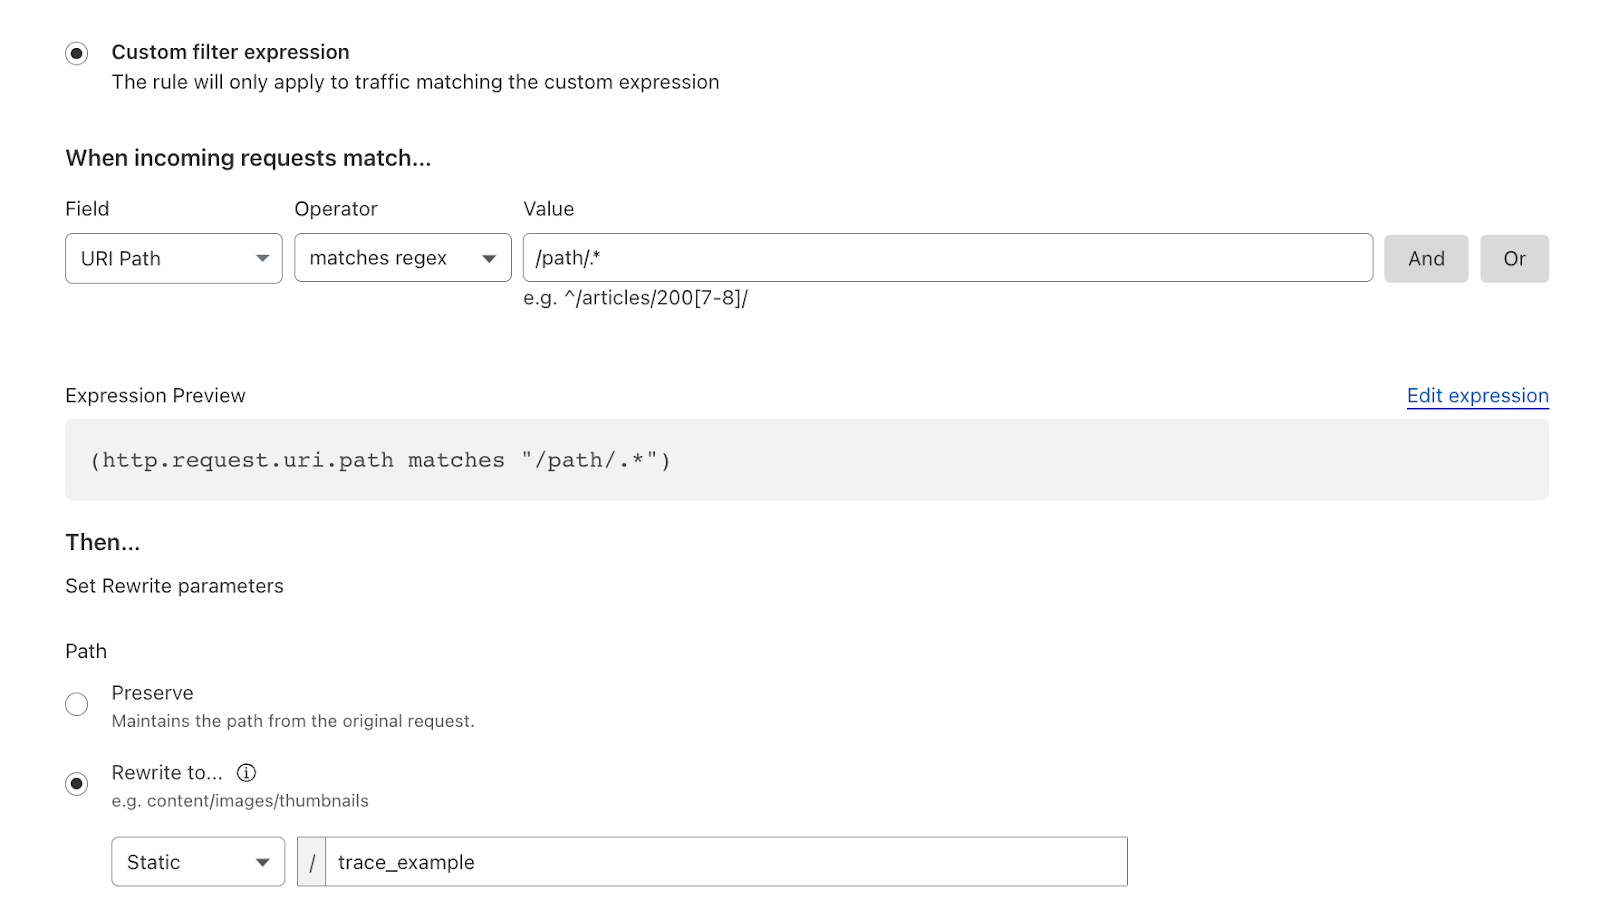
A customer encountered an issue while attempting to rewrite a URL to their origin for specific paths using Transform rules. The Cloudflare account created a filter that employed regex to match against a specific path.
A systems administrator monitoring their web server observed in their logs that the URLs for a small percentage of requests were not transforming correctly, causing disruptions to the application. They decided to investigate by comparing a correctly functioning request with one that was not, and subsequently conducted traces.
In the problematic trace, only one rule matched the trace parameters and was setting incorrect parameters.
Whereas on the other URL the rule that contained the regex matched as intended and set the correct URL parameters.
This allowed the sysadmin to pinpoint the problem: the regex was specifically designed to handle requests with subdirectories, but it failed to address cases where requests directly targeted the root or a non-subdirectory path. After identifying this issue within the traces, the sysadmin updated the filter. Subsequently, both cases matched successfully, leading to the resolution of the problem.
What origin?
When a request encounters a Cloudflare ruleset, such as Origin Rules, all the rules are evaluated, and any rule that is matched is applied in sequential order of priority. This means that multiple settings could be applied from different rules. For example, a Host Header could be set in rule 1, and a DNS origin could be assigned in rule 3. This means that the request will exit the Origin Rules phase with a new Host Header and be routed to a different origin. Cloudflare Trace allows users to easily see all the rules that matched and altered the request.
Tracing the future
Cloudflare Trace will be available to all our customers over this coming week. And located within the Account section of your Cloudflare Dashboard for all plans. We are excited to introduce additional features and products to Cloudflare Trace in the coming months. In the future will also be developing scheduling and alerts, which will enable you to monitor if a newly deployed rule is impacting the critical path of your application. As with all our products, we value your feedback. Within the Trace dashboard, you'll find a form for providing feedback and feature requests to help us enhance the product before its general release.
Having been at Cloudflare since it was tiny it’s hard to believe that we’re hitting our teens! But here we are 13 years on from launch. Looking back to 2010 it was the year of iPhone 4, the first iPad, the first Kinect, Inception was in cinemas, and TiK ToK was hot (well, the Kesha song was). Given how long ago all that feels, I'd have a hard time predicting the next 13 years, so I’ll stick to predicting the future by creating it (with a ton of help from the Cloudflare team).
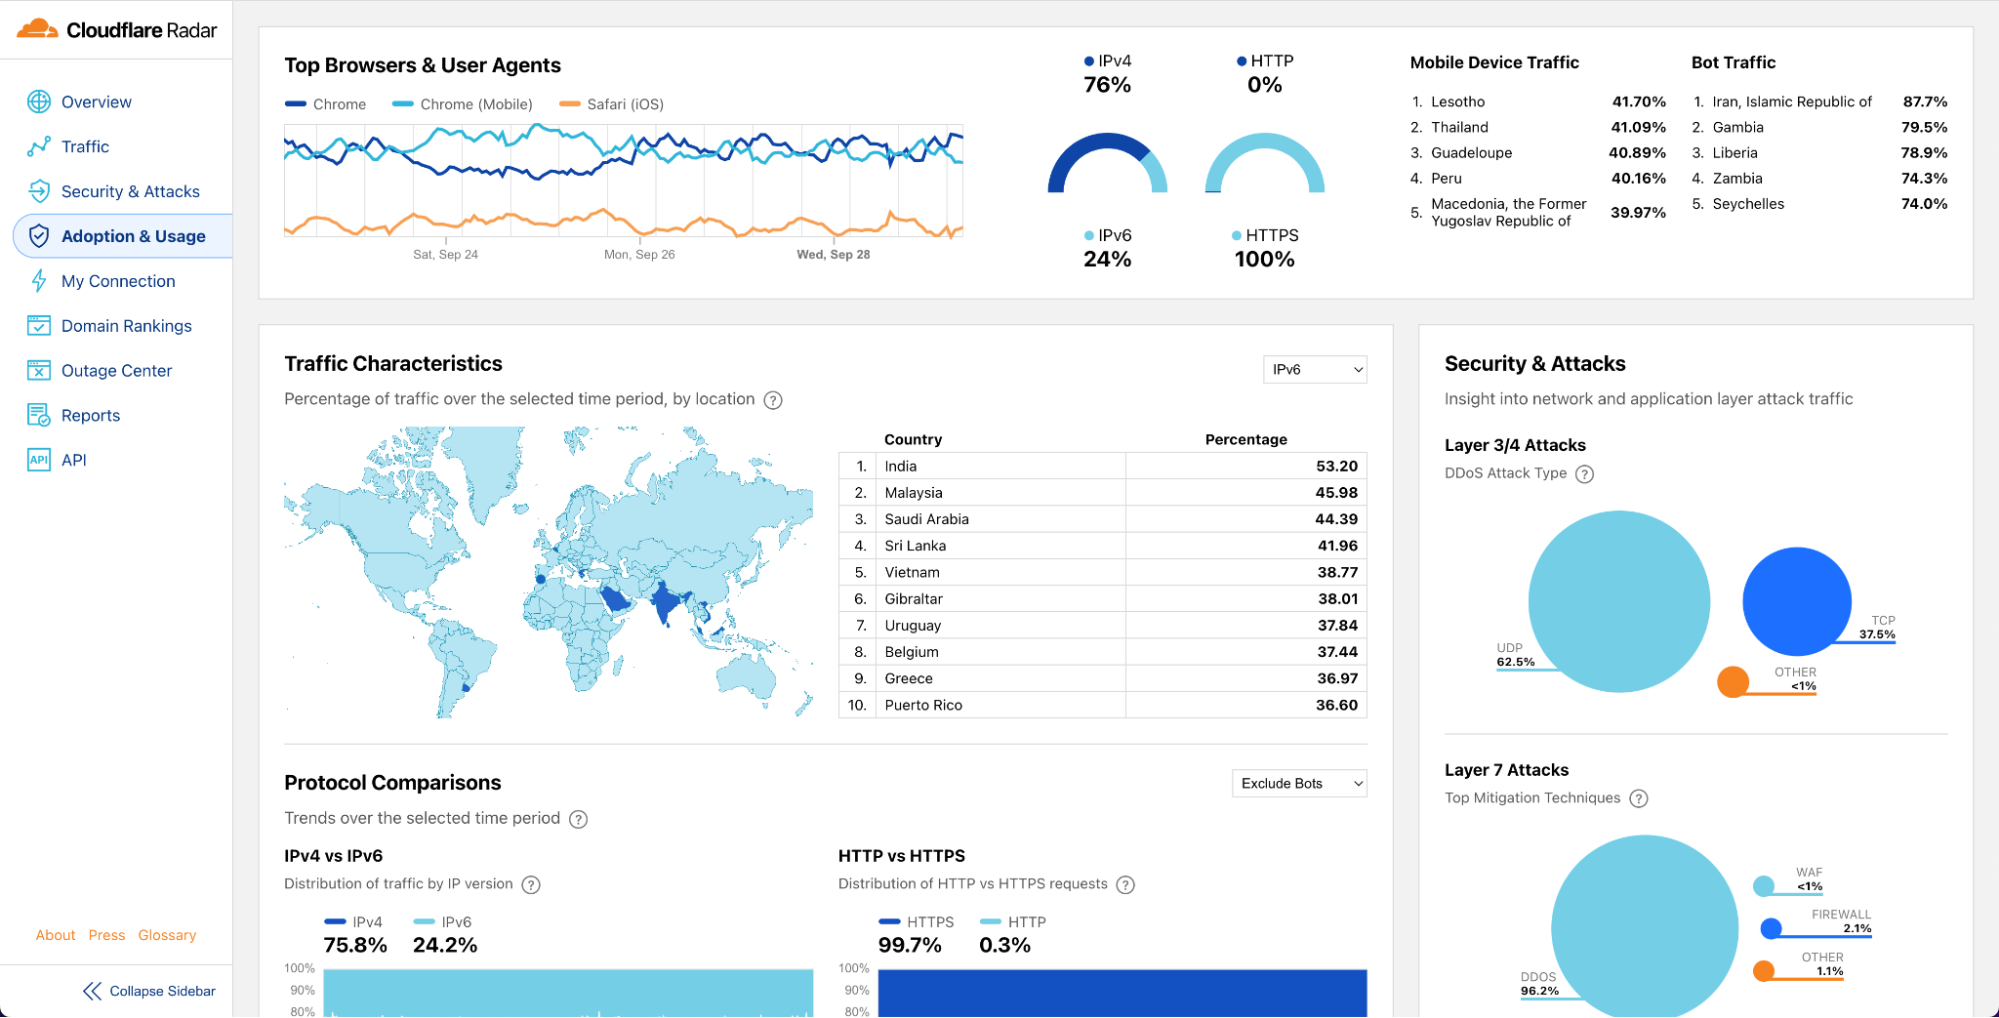
Building the future is, in part, what Birthday Week is about. Over the past 13 years we’ve announced things like Universal SSL (doubling the size of the encrypted web overnight and helping to usher in the largely encrypted web we all use; Cloudflare Radar shows that worldwide 99% of HTTP requests are encrypted), or Cloudflare Workers (helping change the way people build and scale applications), or unmetered DDoS protection (to help with the scourge of DDoS).
This year will be no different.
Winding back to the year I joined Cloudflare we made our first Birthday Week announcement: our automatic IPv6 gateway. Fast-forward to today and Cloudflare Radar says that 37% of connections to Cloudflare use IPv6, so this year there’s a special offer to help make IPv6 ever more widespread and counter those who’d try to bind us to IPv4. So let’s build an IPv6 future together.
Last year we announced Turnstile, our privacy-preserving replacement for CAPTCHAs. This year we’ll be closing a big privacy hole in the encrypted Internet and showing how cryptography can be used to make measurements anonymous and private. Plus even more encrypted, anonymous connections from your computer to the Internet. And there’s more on what’s next for Turnstile itself, and helping make fonts faster and more private too. So let’s build a privacy-preserving Internet together.
AI, of course, is a huge topic and one quarter of all this week's blog posts are about AI, machine learning, GPUs, and all things building, managing, and measuring applications that use AI and machine learning. If it’s not obvious already, it will be after this week: the future involves AI everywhere, on device, in the cloud, and deep inside the Cloudflare global network.
Cloudflare WARP wasn’t a Birthday Week announcement (it was one of our April 1 releases like 1.1.1.1) but this year we’ll be switching from Star Trek to Star Wars with a new product called Hyperdrive. You’ll have to wait until Thursday to read all about it. But if you love databases, you’ll want to make the jump to lightspeed with us.
Speaking of speed… speed! It’s not all AI, privacy, and cool products. We also need to continue our mission to explore strange new worlds help make everyone’s use of the Internet faster. So, we’ll update you on our network performance, talk about how we keep our network running smoothly in face of ever-changing Internet weather, help you stream with low latency, and use caching in new smart ways.
Lastly, we’ll be talking about the impact of Cloudflare on the climate and our climate commitments. Helping with climate change is yet another thing we need to do together.
And, of course, there’s much more than just that. But I wouldn’t want to spoil the birthday surprise by unwrapping the blogs early.
Almost a teen. With Cloudflare’s 12th birthday last Tuesday, we’re officially into our thirteenth year. And what a birthday we had!
36 announcements ranging from SIM cards to post quantum encryption via hardware keys and so much more. Here’s a review of everything we announced this week.
We’re bringing Zero Trust security controls to the humble SIM card, rethinking how mobile device security is done, with the Cloudflare SIM: the world’s first Zero Trust SIM.
We’ve been defending customers from Internet of Things botnets for years now, and it’s time to turn the tides: we’re bringing the same security behind our Zero Trust platform to IoT.
Increasing the scope, eligibility and products we include under our Startup Plan, enabling more developers and startups to build the next big thing on top of Cloudflare.
workerd, the JavaScript/Wasm runtime based on the same code that powers Cloudflare Workers. workerd is open source under the Apache License version 2.0.
A new product that lets developers build real-time audio/video apps. Cloudflare Calls exposes a set of APIs to build video conferencing, screen sharing, and group calling apps on our network.
Queues is a global message queuing service that allows applications to reliably send and receive messages using Cloudflare Workers. It offers at-least once message delivery, supports batching of messages, and charges no bandwidth egress fees.
Configuration Rules enable new use-cases that previously were impossible without writing custom code in a Cloudflare Worker, including A/B testing configuration, enabling features for a set of file extensions and much more.
A new product which allows for overriding the host header, the Server Name Indication (SNI), destination port and DNS resolution of matching HTTP requests.
Users can redirect visitors to another webpage or website based upon hundreds of options such as the visitor’s country of origin or language, without having to write a single line of code.
Turnstile is an invisible alternative to CAPTCHA. Anyone, anywhere on the Internet, who wants to replace CAPTCHA on their site will be able to call a simple API, without having to be a Cloudflare customer or sending traffic through the Cloudflare global network.
Magic Network Monitoring will be available to everyone, and now features a powerful analytics dashboard, self-serve configuration, and a step-by-step onboarding wizard.
The Botnet Threat Feed will give ISPs threat intelligence on their own IP addresses that have participated in HTTP DDoS attacks as observed from the Cloudflare network — allowing them to reduce their abuse-driven costs, and ultimately reduce the amount and force of DDoS attacks across the Internet.
Privacy Edge, including Code Auditability, Privacy Gateway, Privacy Proxy, and Cooperative Analytics, is a suite of products that make it easy for site owners and developers to build privacy into their products, by default.
Our first release of quick search for the Cloudflare dashboard, a beta version of our first ever cross-dashboard search tool to help you navigate our products and features.
An exclusive program for Cloudflare customers that makes hardware keys more accessible and economical than ever. This program is made possible through a new collaboration with Yubico, the industry’s leading hardware security key vendor and provides Cloudflare customers with exclusive “Good for the Internet” pricing.
Today, we are announcing that Free, Pro and Business plans include Rate Limiting rules without extra charges, including an updated version that is built on the powerful ruleset engine and allows building rules like in Custom Rules.
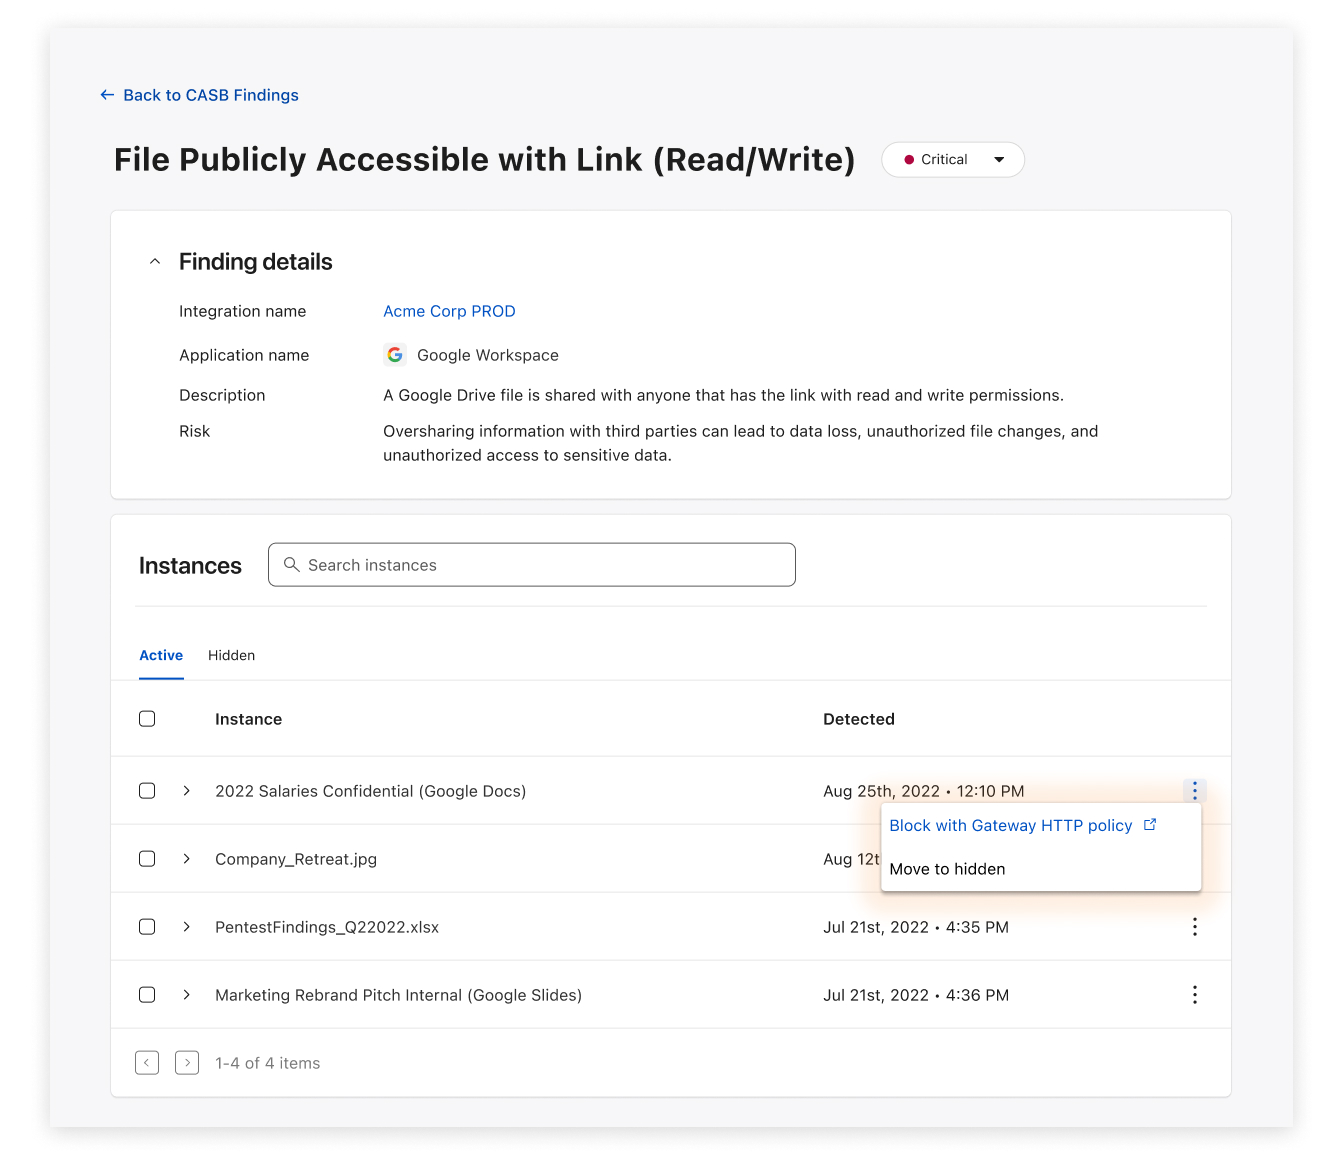
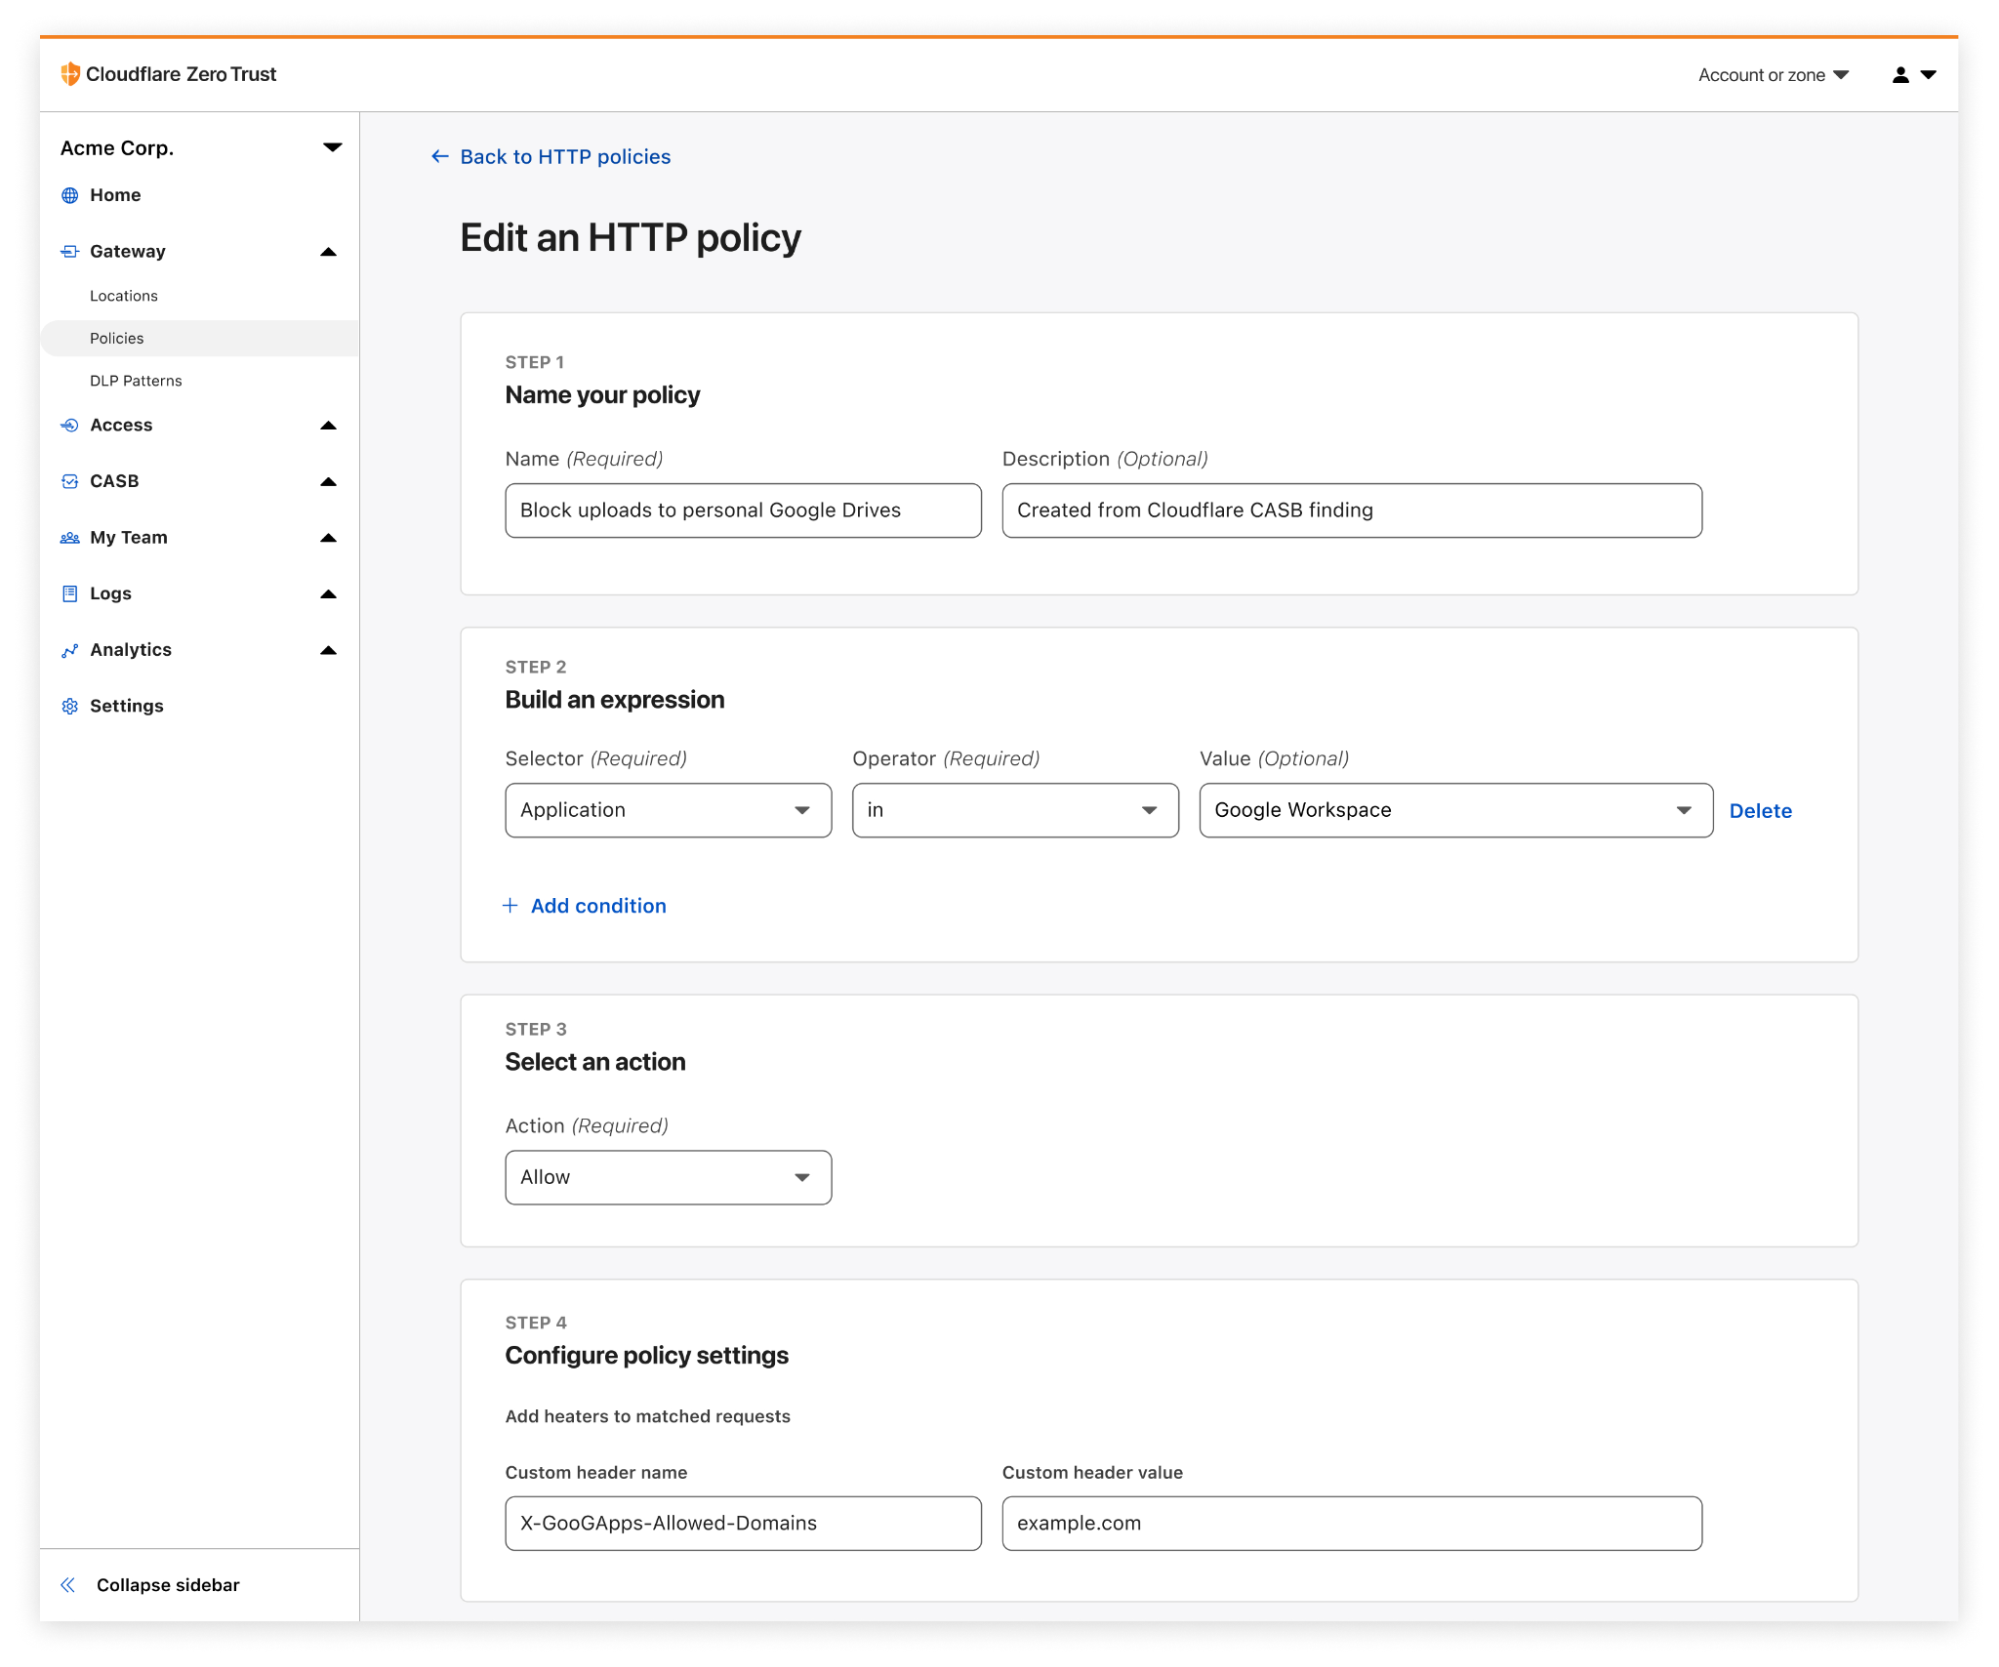
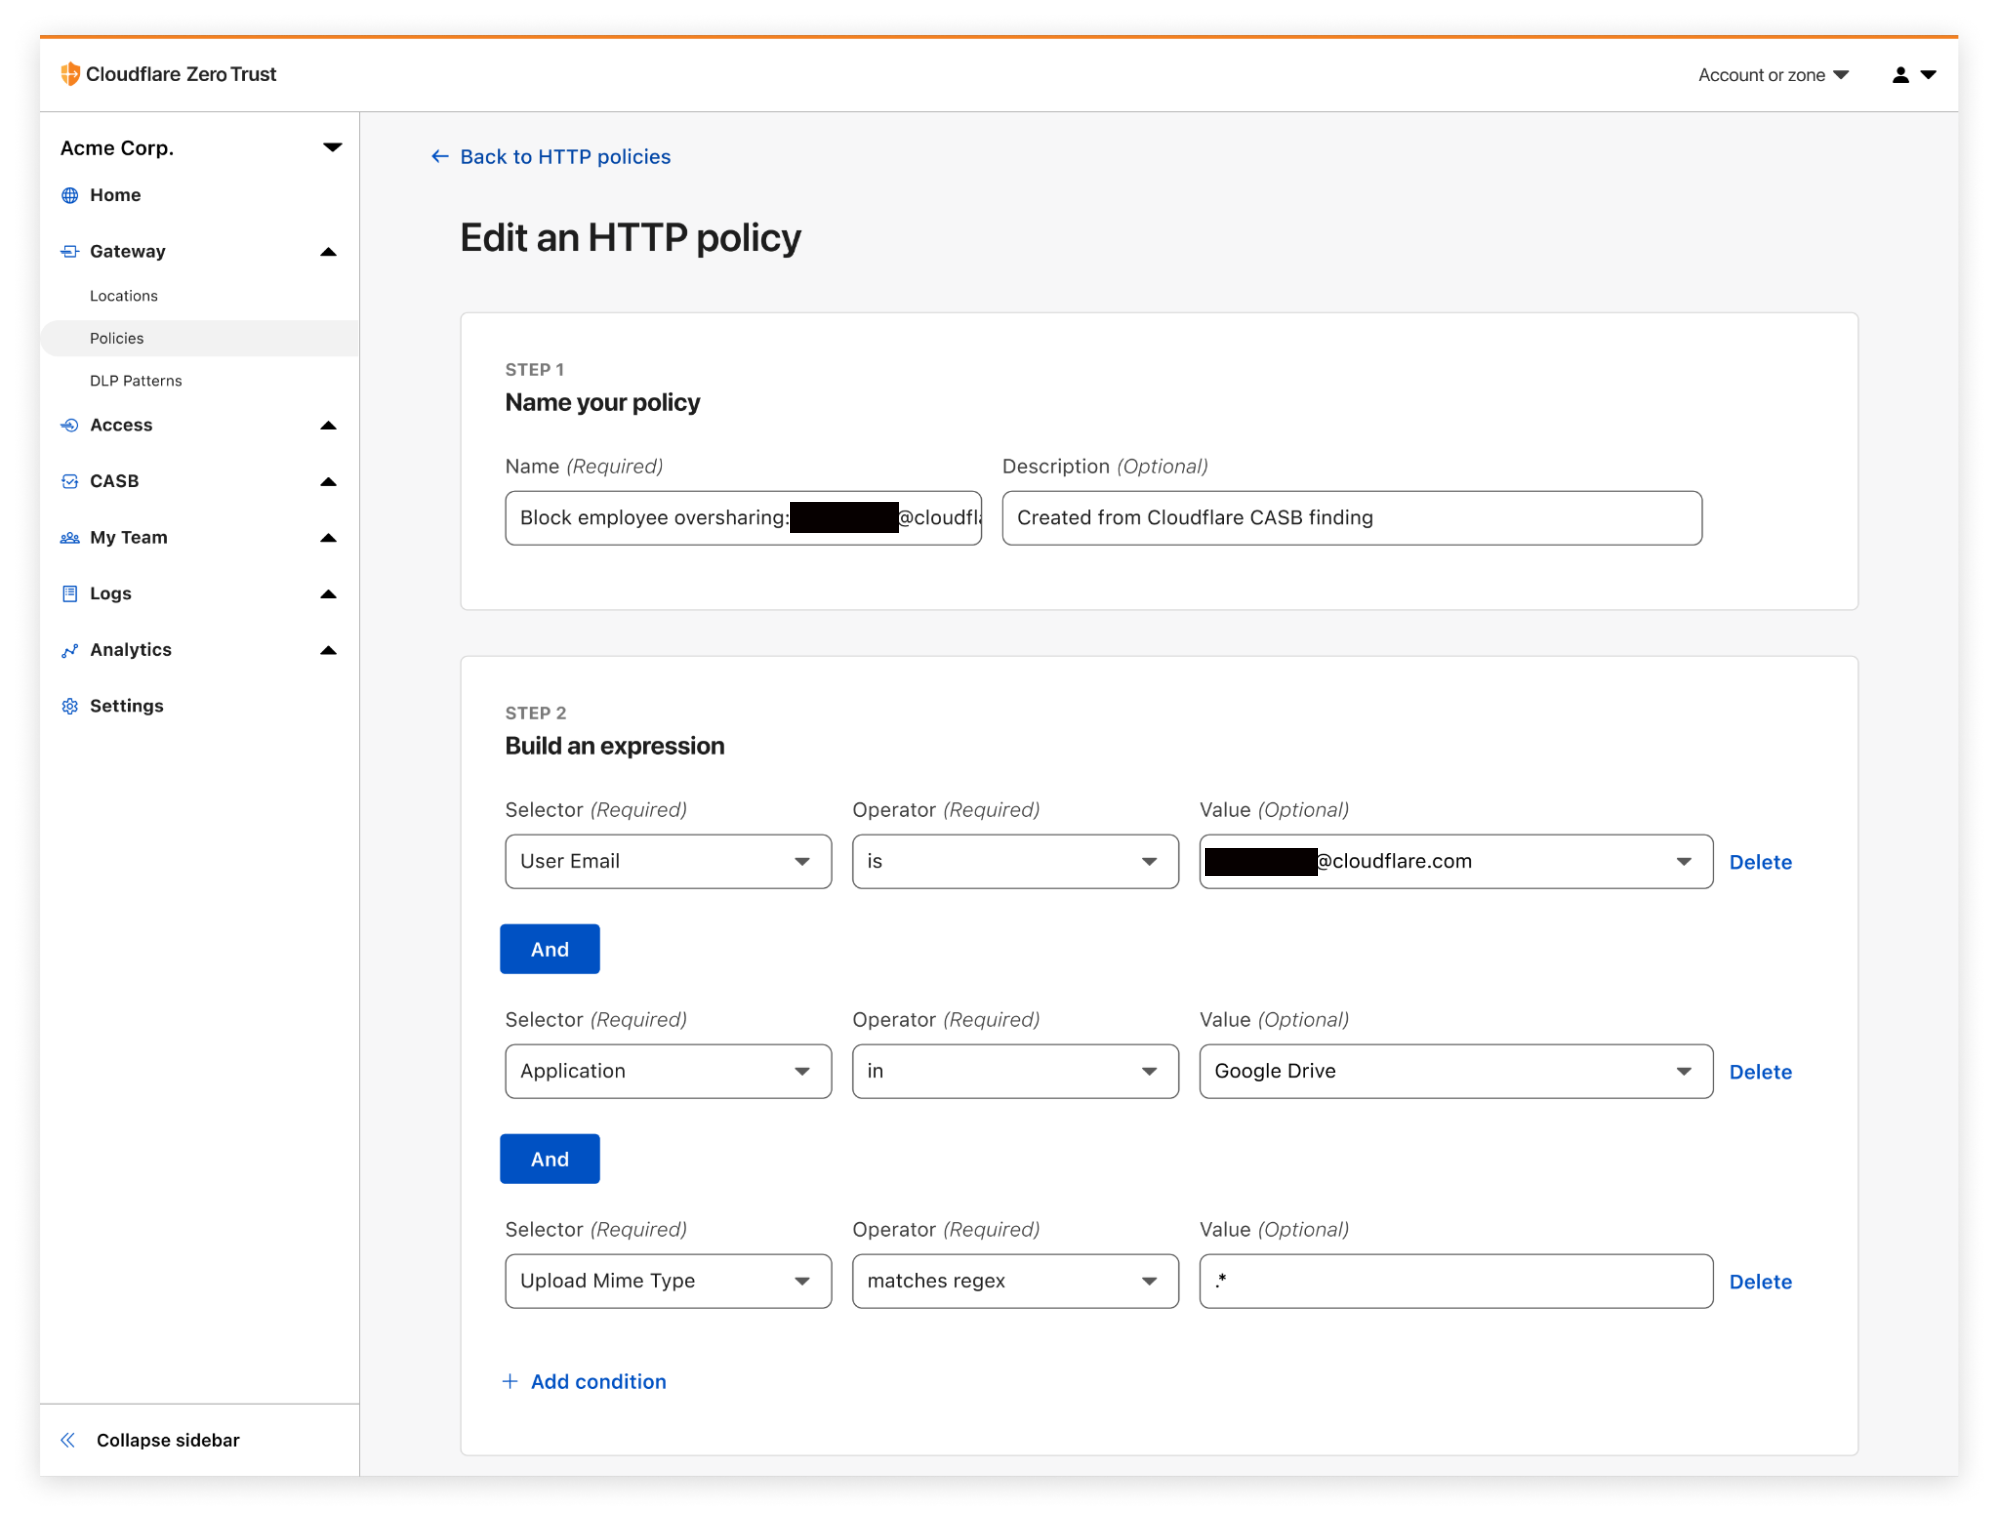
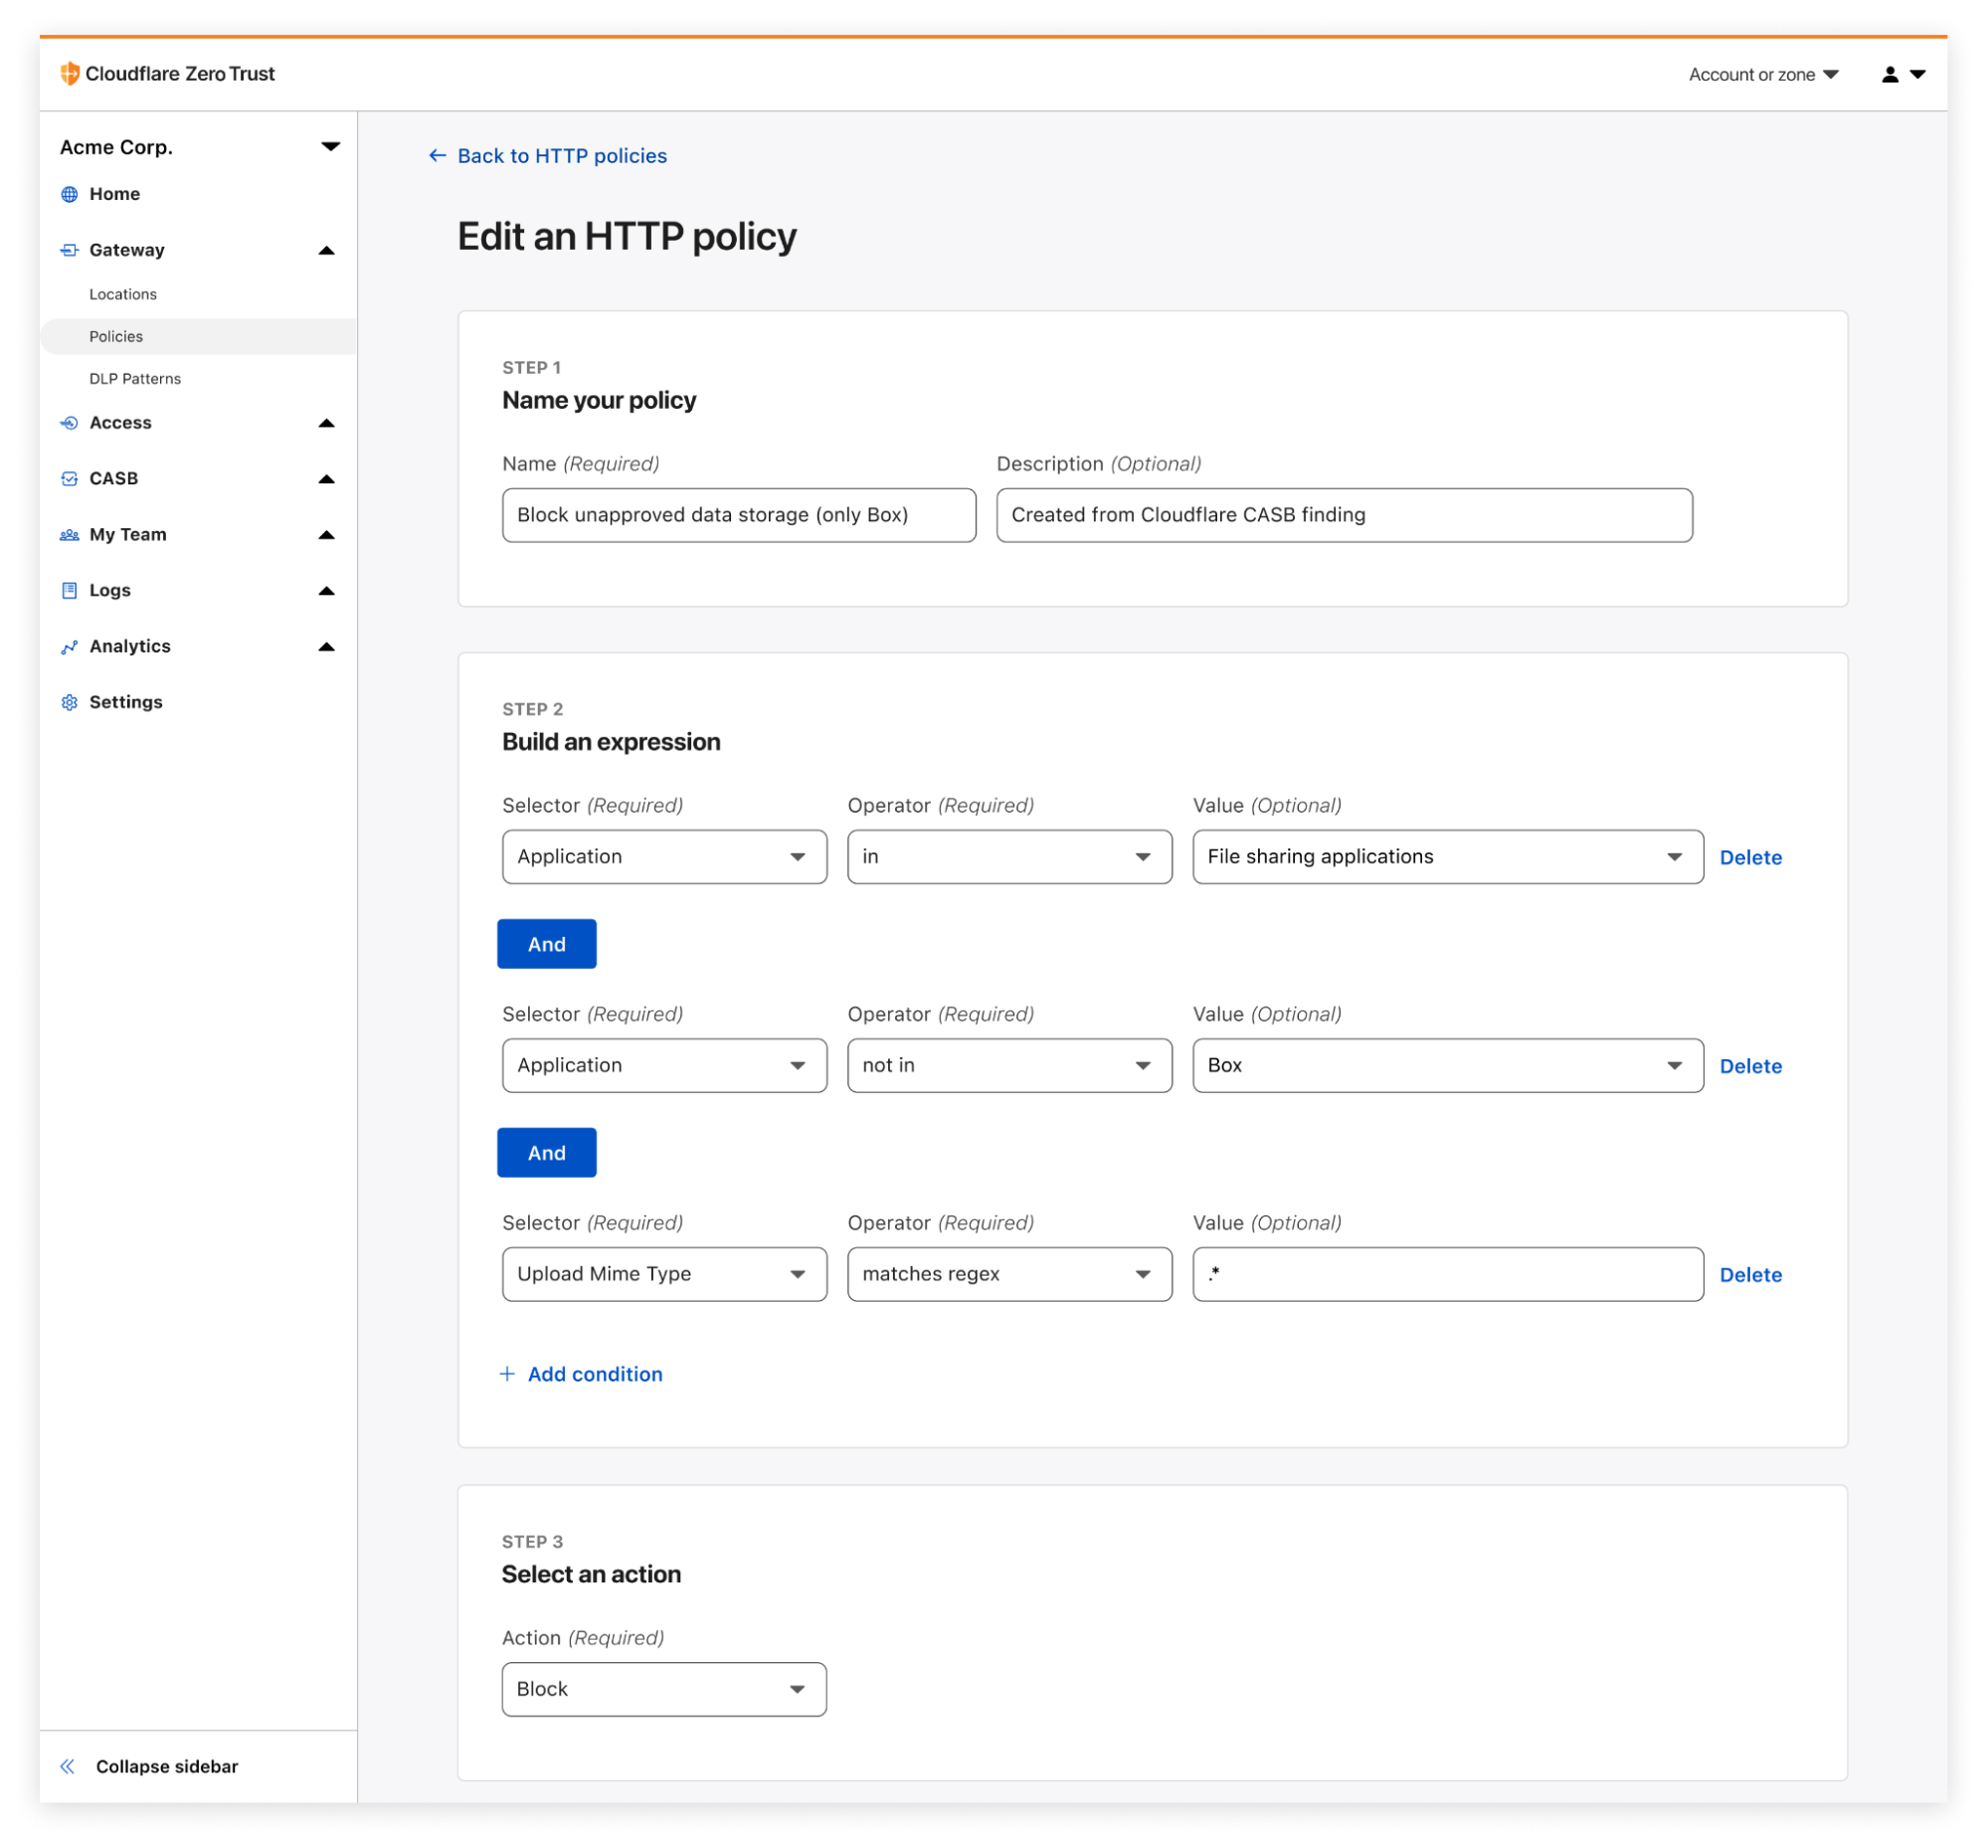
When CASB, Cloudflare’s API-driven SaaS security scanning tool, discovers a problem, it’s now possible to easily create a corresponding Gateway policy in as few as three clicks.
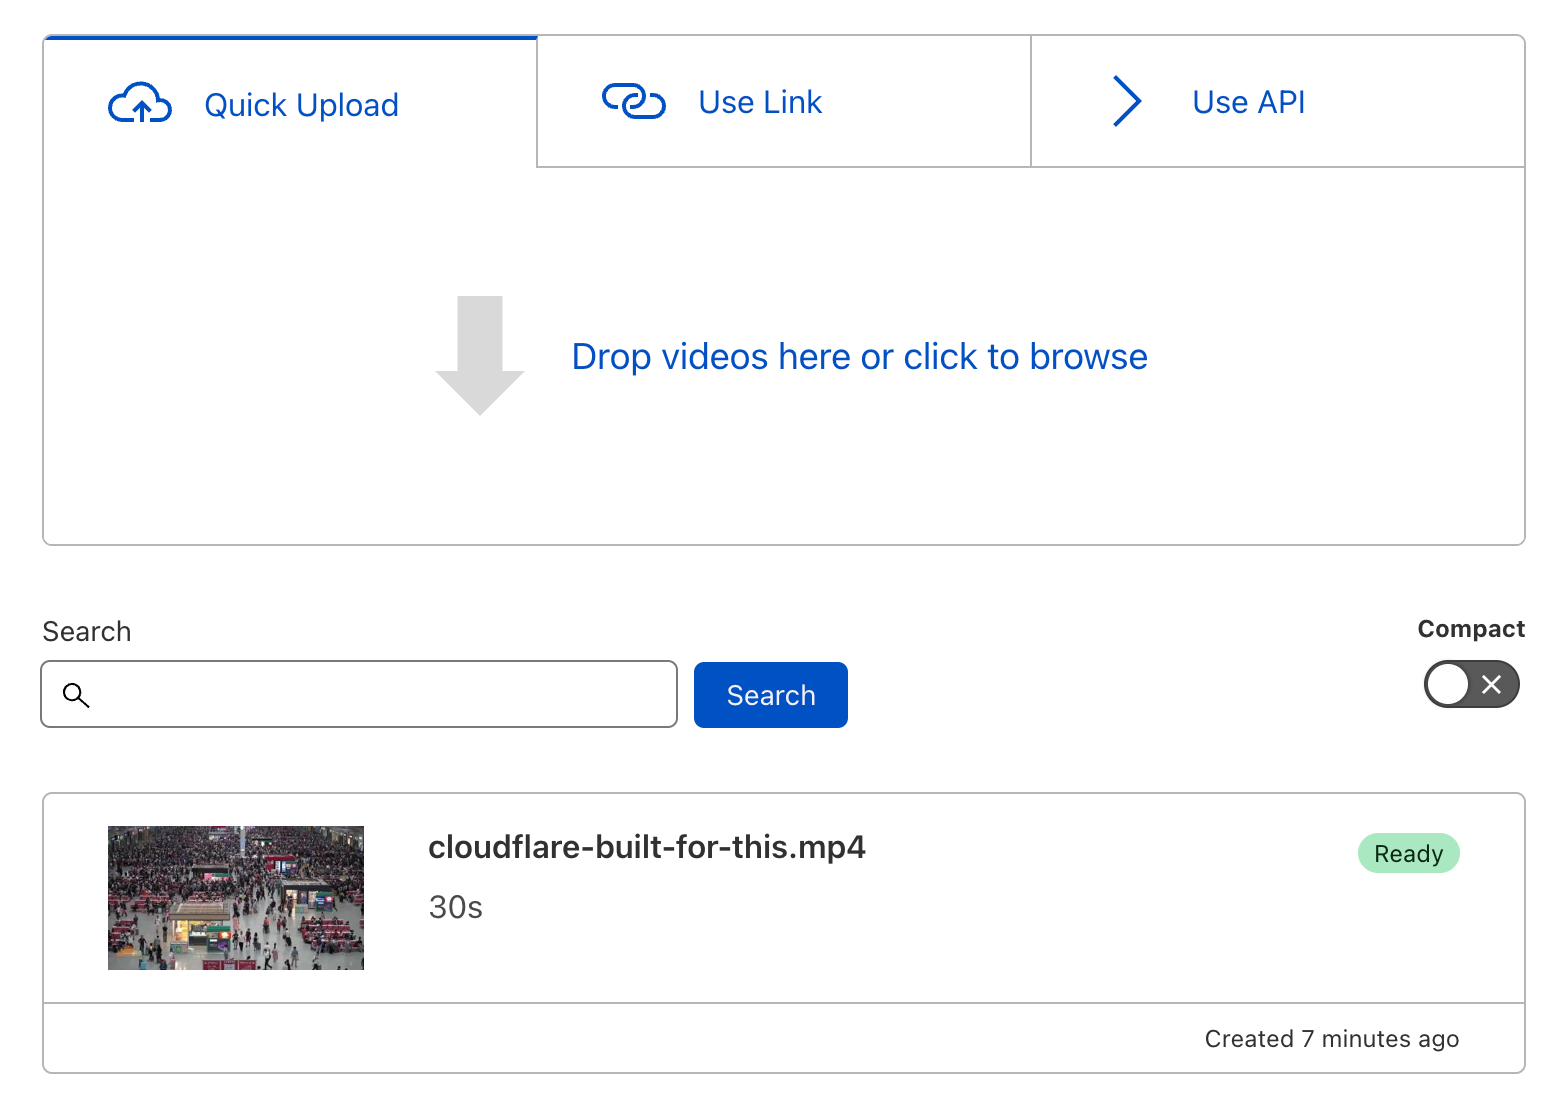
Beginning December 1, 2022, if you have a Business or Pro subscription, you will receive a complimentary allocation of Cloudflare Stream, including up to 100 minutes of video content and deliver up to 10,000 minutes of video content each month at no additional cost.
Workers Analytics Engine is a new way for developers to store and analyze time series analytics about anything using Cloudflare Workers, and it’s now in open beta!
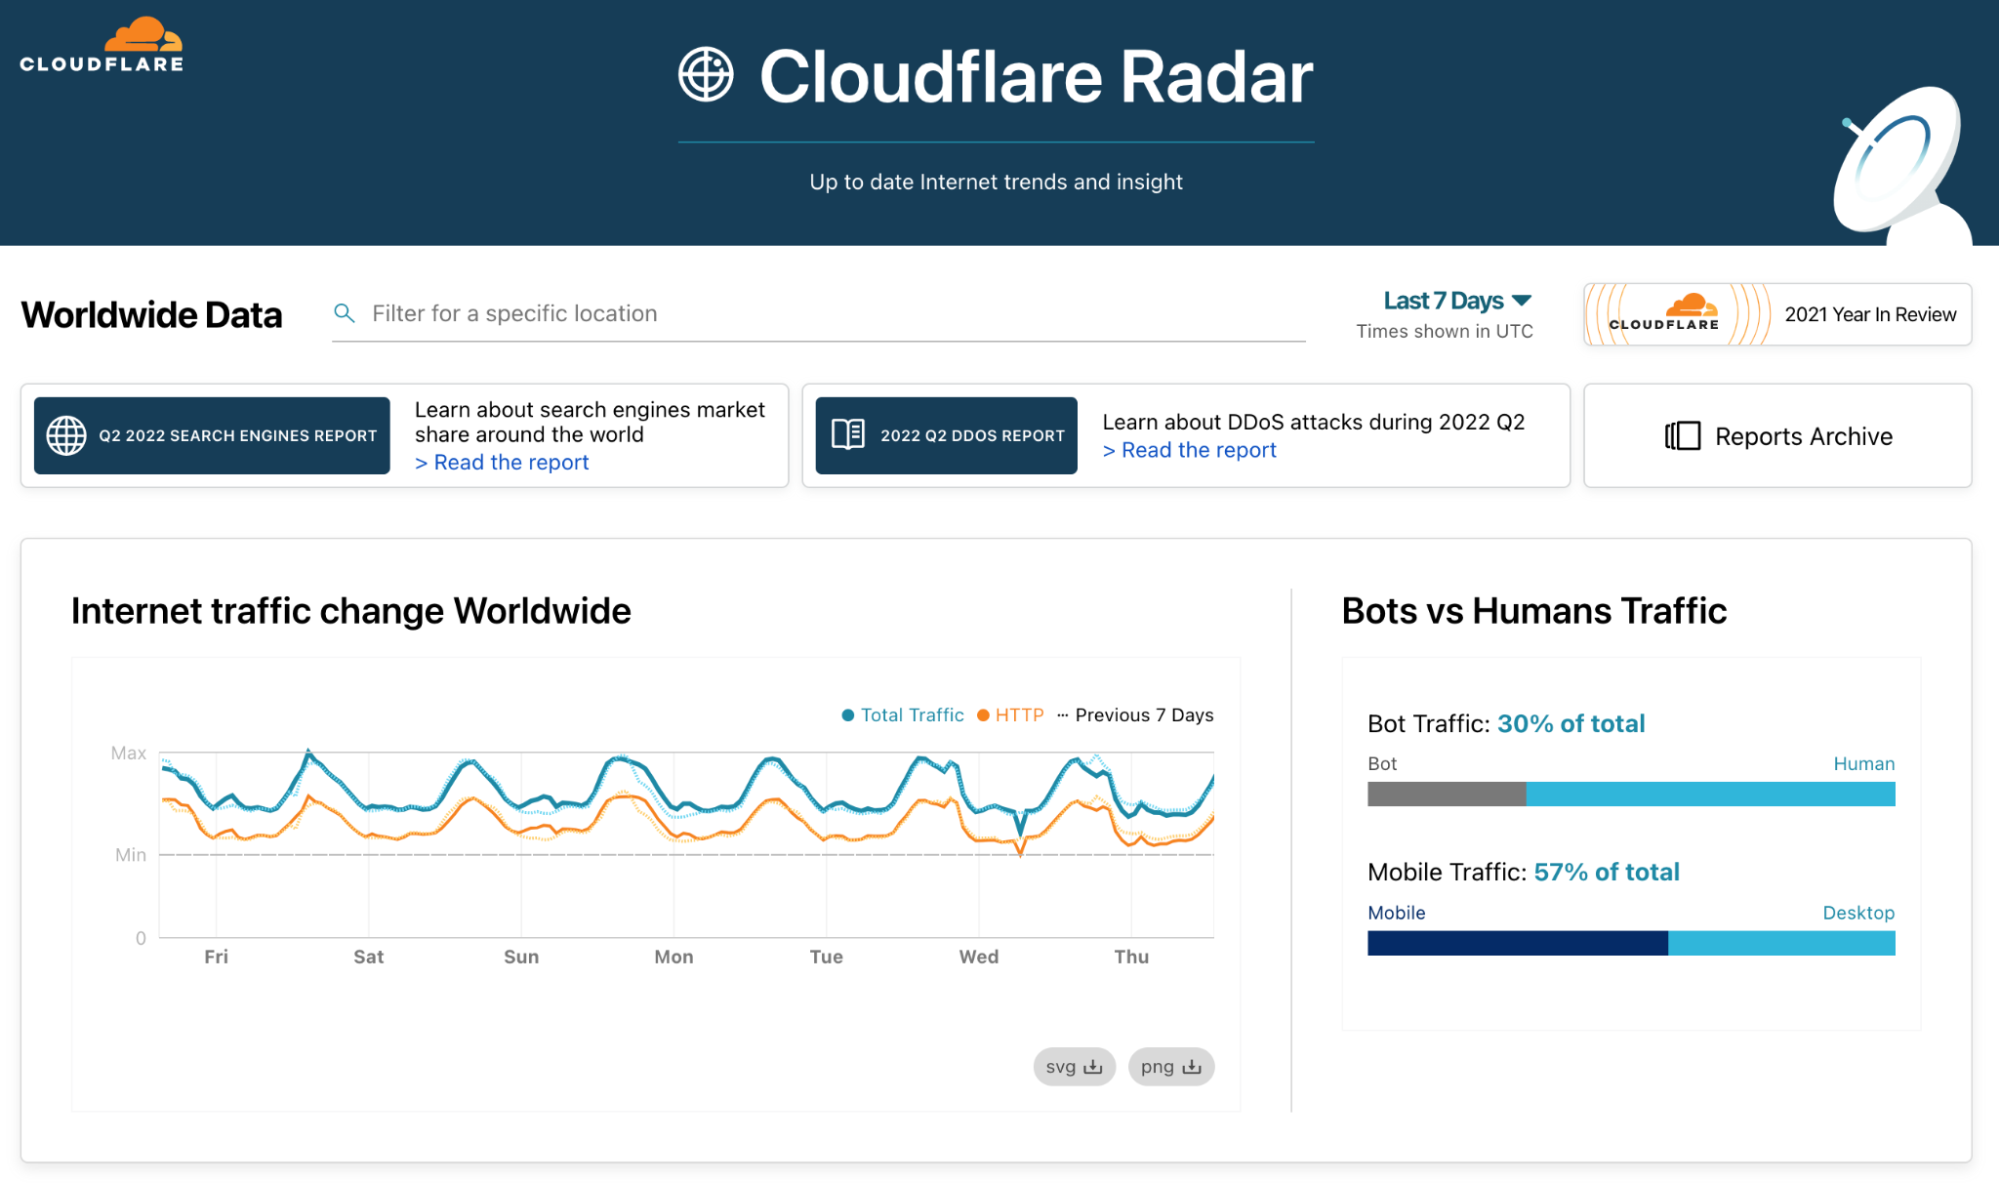
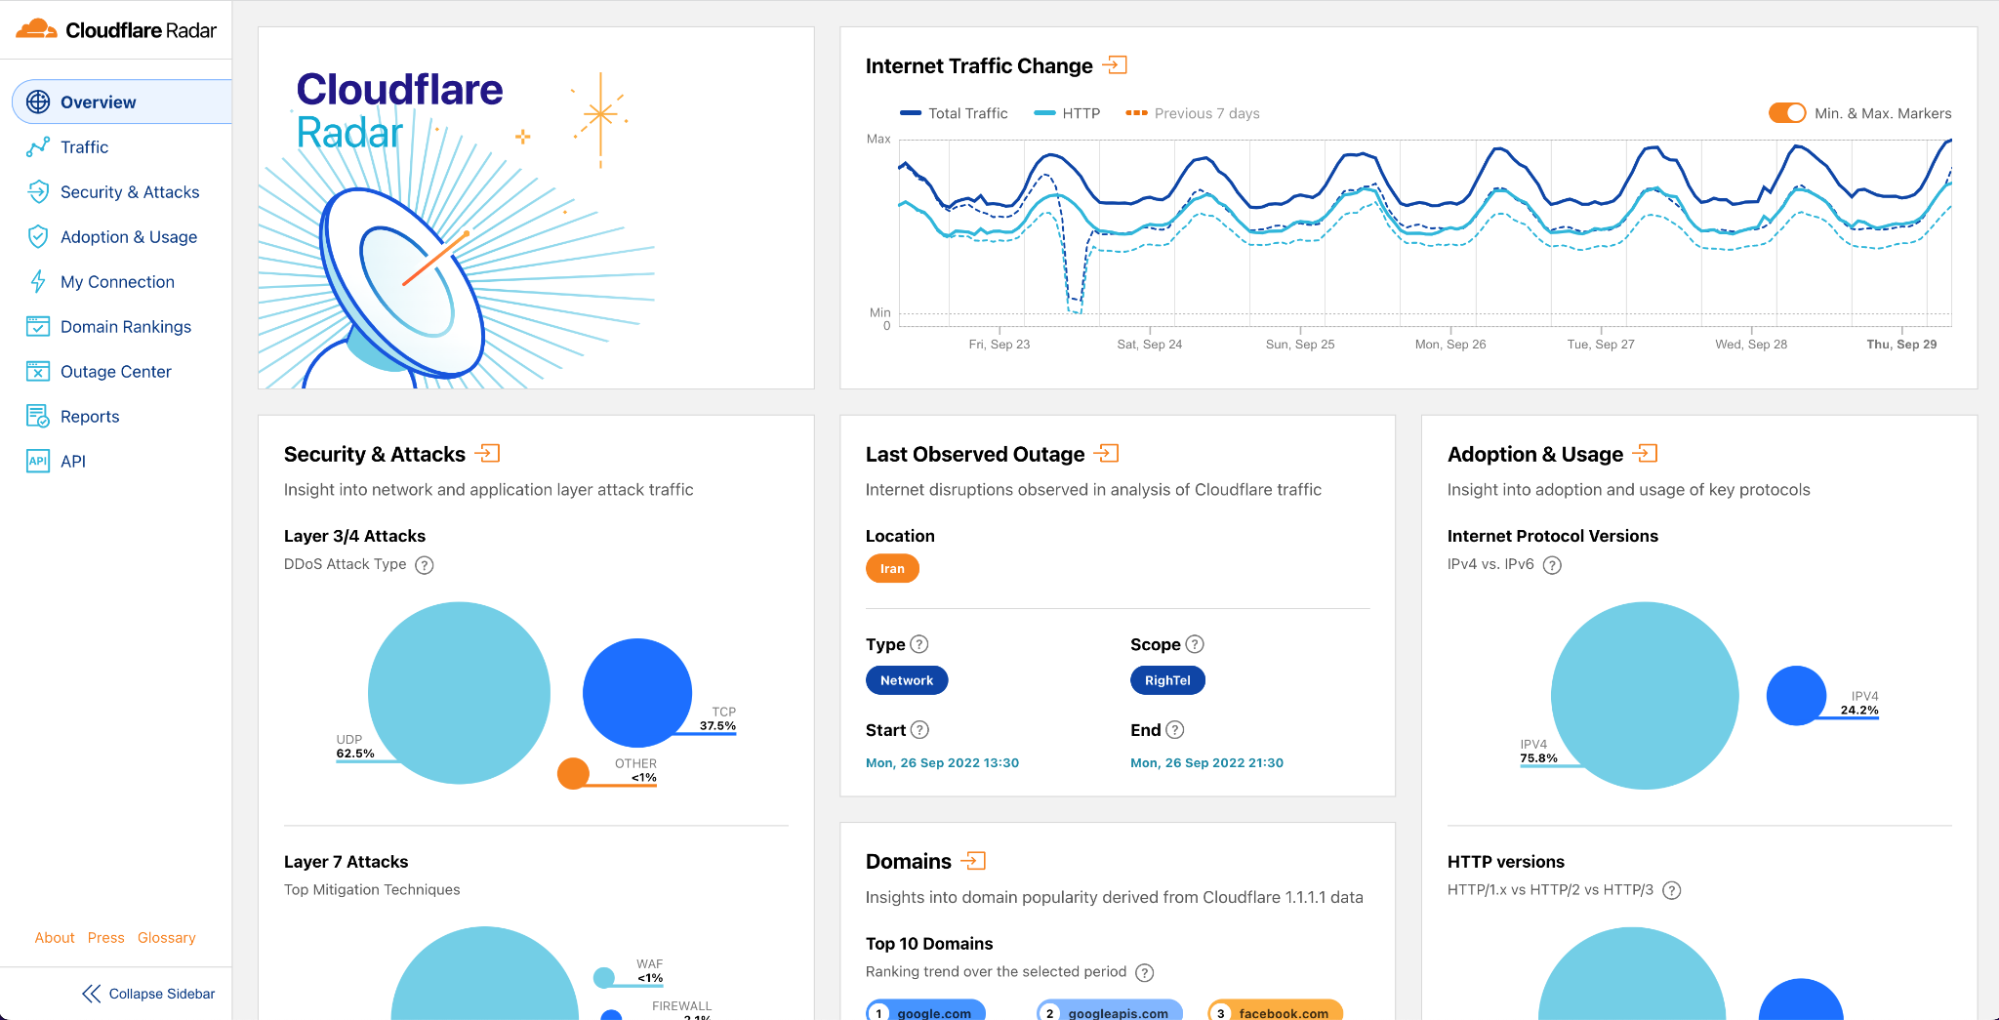
On the second anniversary of Cloudflare Radar, we are launching Cloudflare Radar 2.0 in beta. It makes it easier to find insights and explore data, see more insights, and share them with others.
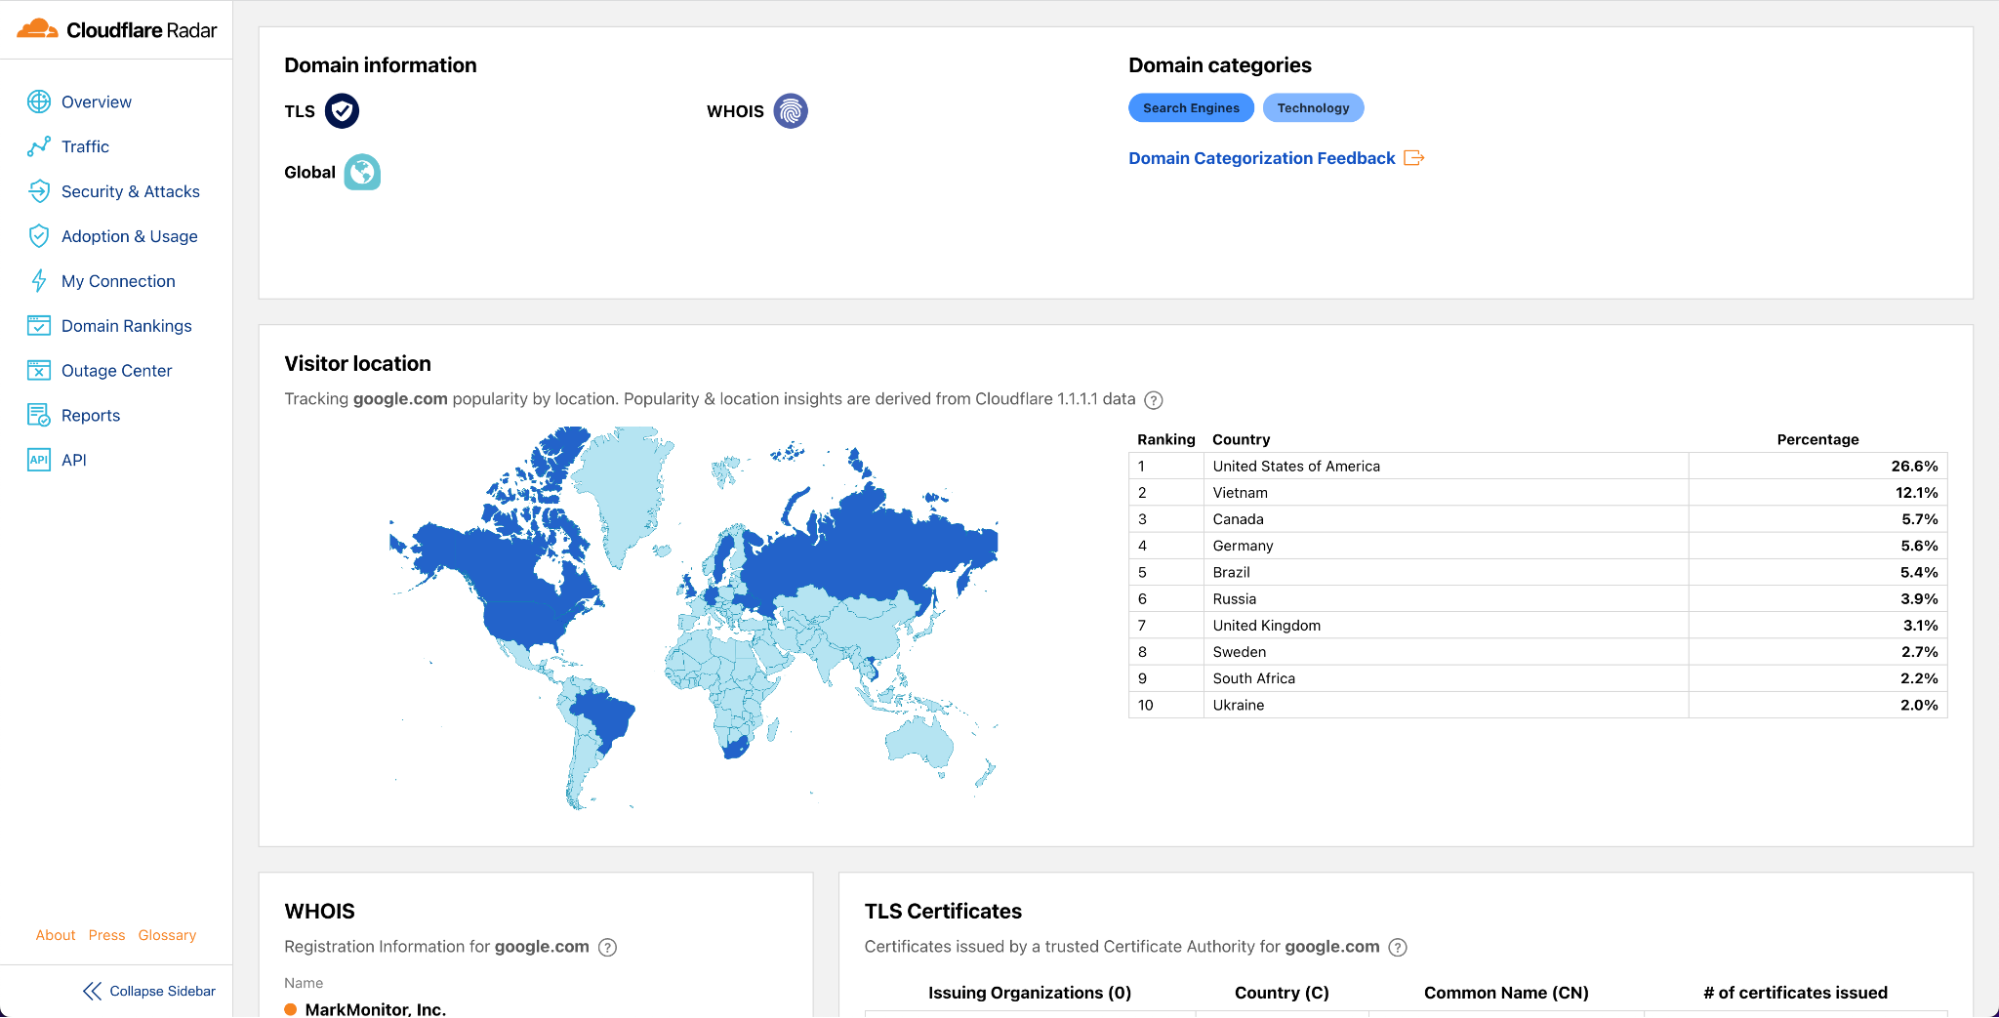
Radar Domain Rankings is a new dataset for exploring the most popular domains on the Internet. The dataset aims to identify the top most popular domains based on how people use the Internet globally, without tracking individuals’ Internet use.
One More Thing
We had so much over the week that we had to add just one more day, with a big focus on cryptography: not only how clients connect to our network, but also how Cloudflare connects to customer origins.
As a beta service, all websites and APIs served through Cloudflare support post-quantum hybrid key agreement. This is on by default; no need for an opt-in. This means that if your browser/app supports it, the connection to our network is also secure against any future quantum computer.
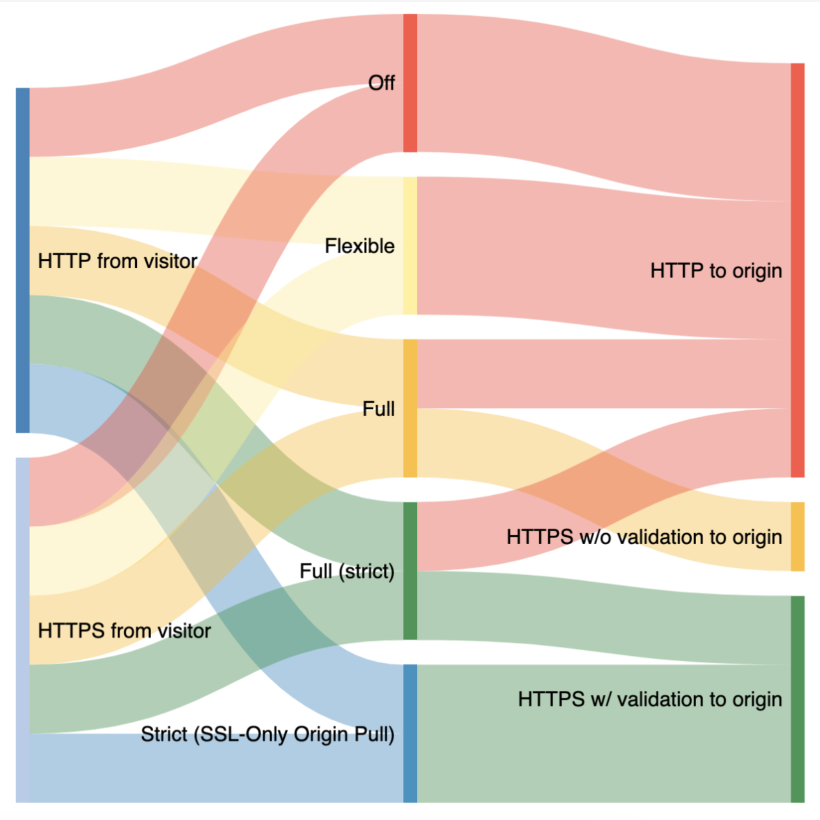
Cloudflare will automatically find the most secure connection possible to origin servers and use it automatically.
Next
And that’s it for Birthday Week 2022. But it’s not over for Cloudflare Innovation Weeks this year; stay tuned for a week of developer goodies coming soon.
There is an expiration date on the cryptography we use every day. It’s not easy to read, but somewhere between 15 or 40 years, a sufficiently powerful quantum computer is expected to be built that will be able to decrypt essentially any encrypted data on the Internet today.
Luckily, there is a solution: post-quantum (PQ) cryptography has been designed to be secure against the threat of quantum computers. Just three months ago, in July 2022, after a six-year worldwide competition, the US National Institute of Standards and Technology (NIST), known for AES and SHA2, announced which post-quantum cryptography they will standardize. NIST plans to publish the final standards in 2024, but we want to help drive early adoption of post-quantum cryptography.
Starting today, as a beta service, all websites and APIs served through Cloudflare support post-quantum hybrid key agreement. This is on by default1; no need for an opt-in. This means that if your browser/app supports it, the connection to our network is also secure against any future quantum computer.
We offer this post-quantum cryptography free of charge: we believe that post-quantum security should be the new baseline for the Internet.
Deploying post-quantum cryptography seems like a no-brainer with quantum computers on the horizon, but it’s not without risks. To start, this is new cryptography: even with years of scrutiny, it is not inconceivable that a catastrophic attack might still be discovered. That is why we are deploying hybrids: a combination of a tried and tested key agreement together with a new one that adds post-quantum security.
We are primarily worried about what might seem mere practicalities. Even though the protocols used to secure the Internet are designed to allow smooth transitions like this, in reality there is a lot of buggy code out there: trying to create a post-quantum secure connection might fail for many reasons — for example a middlebox being confused about the larger post-quantum keys and other reasons we have yet to observe because these post-quantum key agreements are brand new. It’s because of these issues that we feel it is important to deploy post-quantum cryptography early, so that together with browsers and other clients we can find and work around these issues.
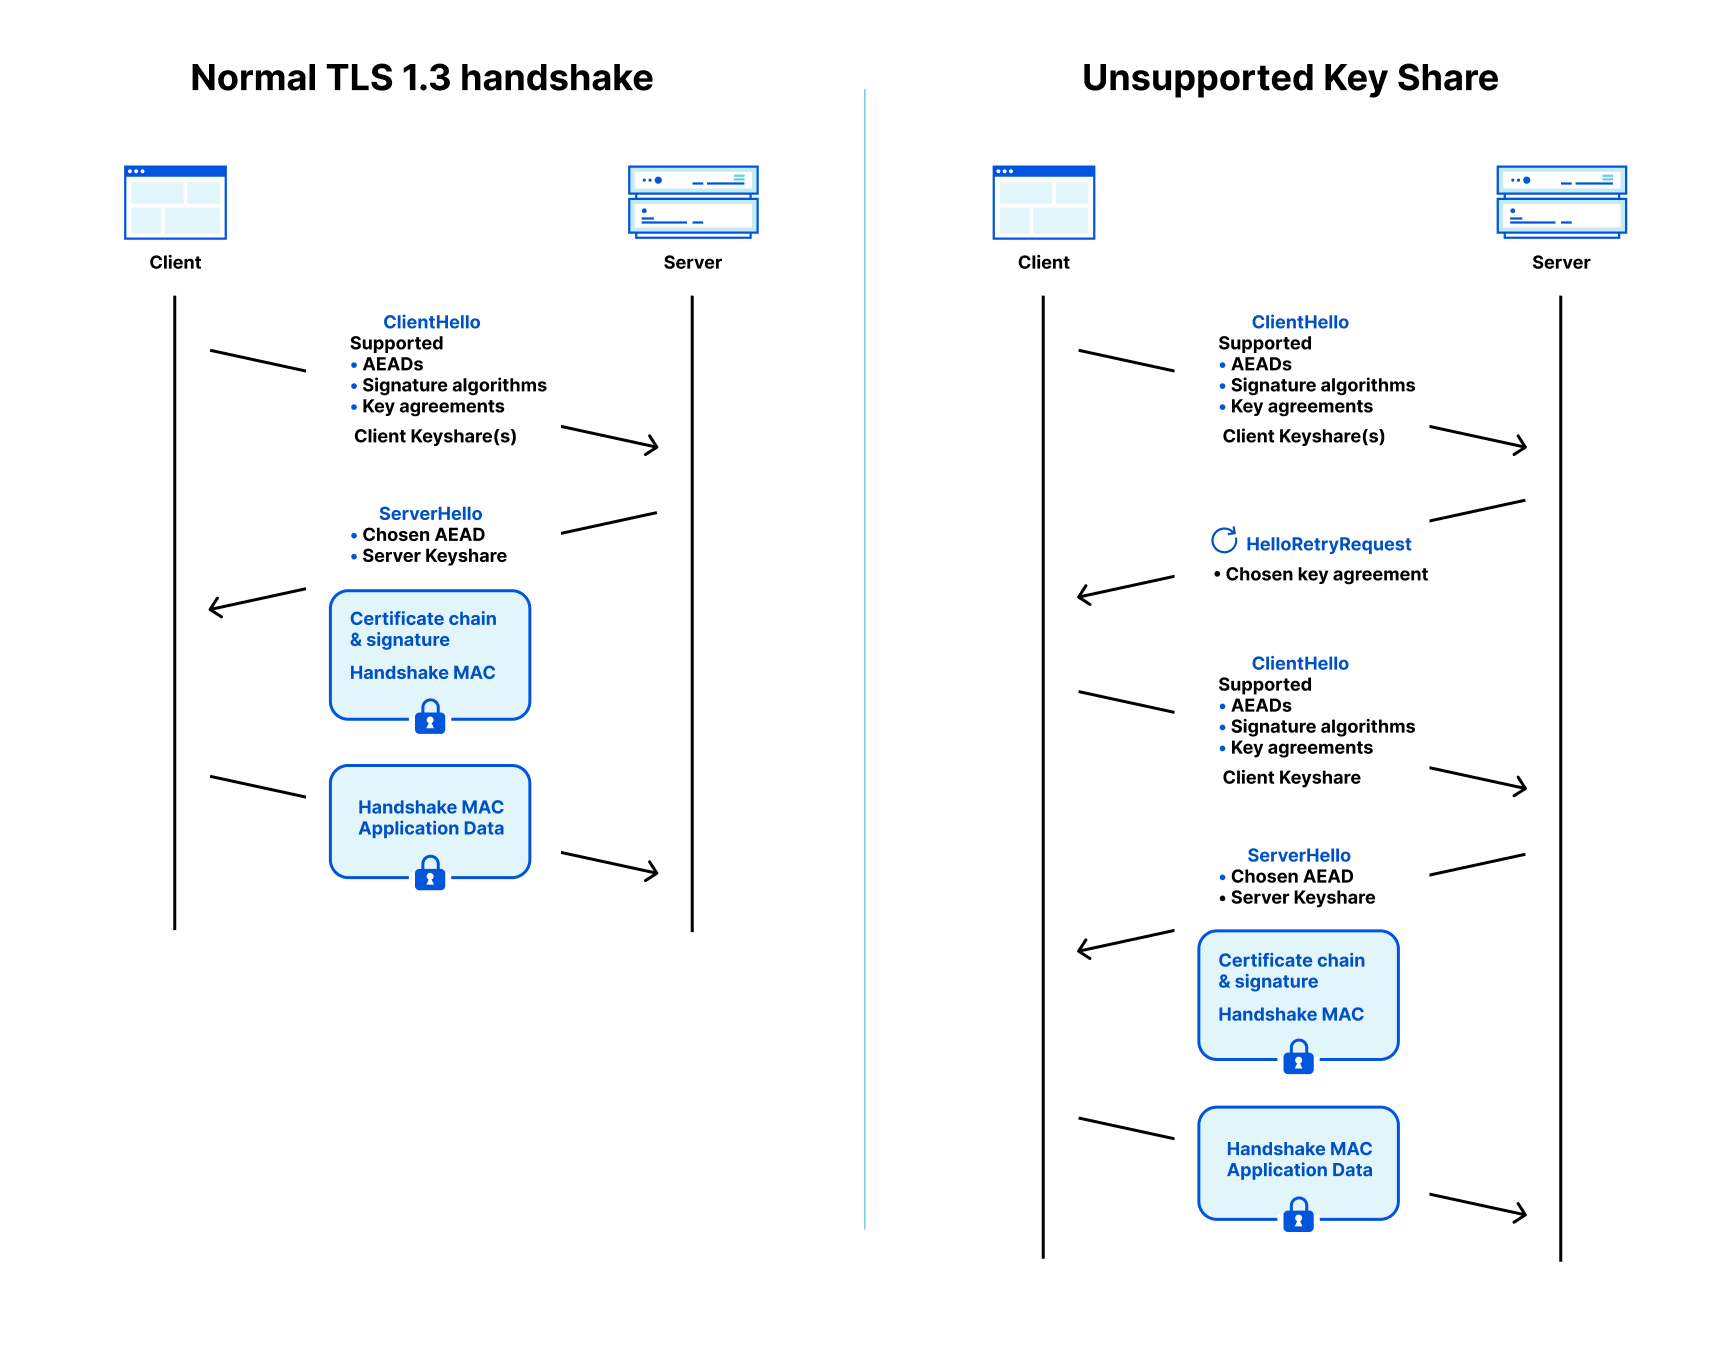
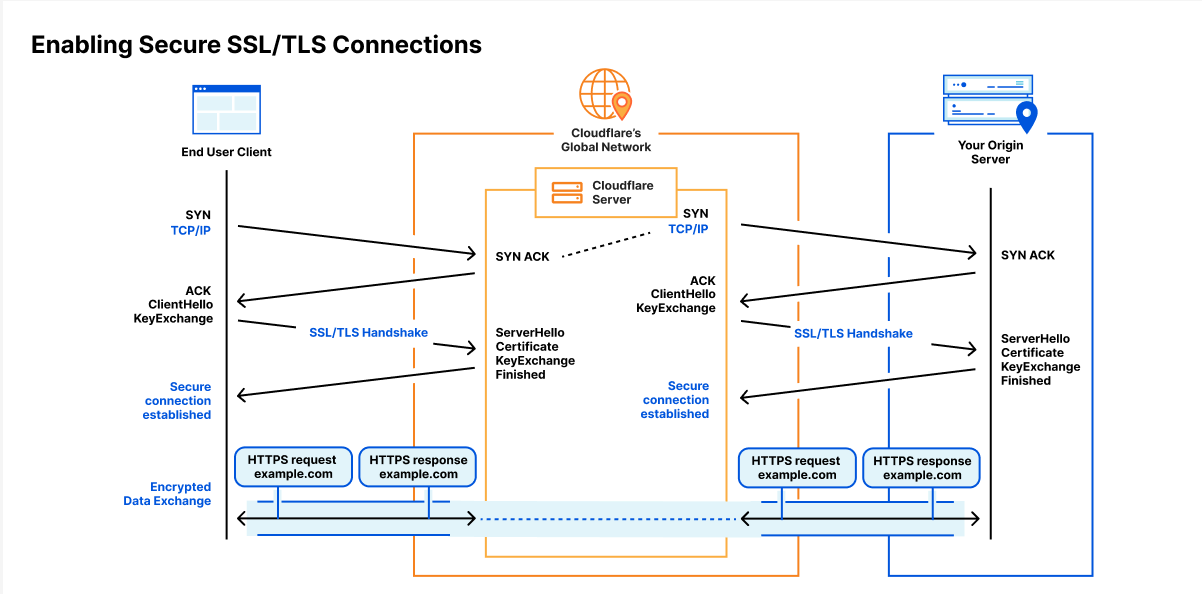
In this blog post we will explain how TLS, the protocol used to secure the Internet, is designed to allow a smooth and secure migration of the cryptography it uses. Then we will discuss the technical details of the post-quantum cryptography we have deployed, and how, in practice, this migration might not be that smooth at all. We finish this blog post by explaining how you can build a better, post-quantum secure, Internet by helping us test this new generation of cryptography.
TLS: Transport Layer Security
When you’re browsing a website using a secure connection, whether that’s using HTTP/1.1 or QUIC, you are using the Transport Layer Security (TLS) protocol under the hood. There are two major versions of TLS in common use today: the new TLS 1.3 (~90%) and the older TLS 1.2 (~10%), which is on the decline.
TLS 1.3 is a huge improvement over TLS 1.2: it’s faster, more secure, simpler and more flexible in just the right places. This makes it easier to add post-quantum security to TLS 1.3 compared to 1.2. For the moment, we will leave it at that: we’ve only added post-quantum support to TLS 1.3.
So, what is TLS all about? The goal is to set up a connection between a browser and website such that
Confidentiality and integrity, no one can read along or tamper with the data undetected.
Authenticity you know you’re connected to the right website; not an imposter.
Building blocks: AEAD, key agreement and signatures
Three different types of cryptography are used in TLS to reach this goal.
Symmetric encryption, or more precisely Authenticated Encryption With Associated Data (AEAD), is the workhorse of cryptography: it’s used to ensure confidentiality and integrity. This is a straight-forward kind of encryption: there is a single key that is used to encrypt and decrypt the data. Without the right key you cannot decrypt the data and any tampering with the encrypted data results in an error while decrypting.
In TLS 1.3, ChaCha20-Poly1305 and AES128-GCM are in common use today. What about quantum attacks? At first glance, it looks like we need to switch to 256-bit symmetric keys to defend against Grover’s algorithm. In practice, however, Grover’s algorithm doesn’t parallelize well, so the currently deployed AEADs will serve just fine.
So if we can agree on a shared key to use with symmetric encryption, we’re golden. But how to get to a shared key? You can’t just pick a key and send it to the server: anyone listening in would know the key as well. One might think it’s an impossible task, but this is where the magic of asymmetric cryptography helps out:
A key agreement, also called key exchange or key distribution, is a cryptographic protocol with which two parties can agree on a shared key without an eavesdropper being able to learn anything. Today the X25519 Elliptic Curve Diffie–Hellman protocol (ECDH) is the de facto standard key agreement used in TLS 1.3. The security of X25519 is based on the discrete logarithm problem for elliptic curves, which is vulnerable to quantum attacks, as it is easily solved by a cryptographically relevant quantum computer using Shor’s algorithm. The solution is to use a post-quantum key agreement, such as Kyber.
A key agreement only protects against a passive attacker. An active attacker, that can intercept and modify messages (MitM), can establish separate shared keys with both the server and the browser, re-encrypting all data passing through. To solve this problem, we need the final piece of cryptography.
With a digitalsignature algorithm, such as RSA or ECDSA, there are two keys: a public and a private key. Only with the private key, one can create a signature for a message. Anyone with the corresponding public key can check whether a signature is indeed valid for a given message. These digital signatures are at the heart of TLS certificates that are used to authenticate websites. Both RSA and ECDSA are vulnerable to quantum attacks. We haven’t replaced those with post-quantum signatures, yet. The reason is that authentication is less urgent: we only need to have them replaced by the time a sufficiently large quantum computer is built, whereas any data secured by a vulnerable key agreement today can be stored and decrypted in the future. Even though we have more time, deploying post-quantum authentication will be quite challenging.
So, how do these building blocks come together to create TLS?
High-level overview of TLS 1.3
A TLS connection starts with a handshake which is used to authenticate the server and derive a shared key. The browser (client) starts by sending a ClientHello message that contains a list of the AEADs, signature algorithms, and key agreement methods it supports. To remove a roundtrip, the client is allowed to make a guess of what the server supports and start the key agreement by sending one or more client keyshares. That guess might be correct (on the left in the diagram below) or the client has to retry (on the right).
Protocol flow for server-authenticated TLS 1.3 with a supported client keyshare on the left and a HelloRetryRequest on the right.
Key agreement
Before we explain the rest of this interaction, let’s dig into the key agreement: what is a keyshare? The way the key agreement for Kyber and X25519 work is different: the first is a Key Encapsulation Mechanism (KEM), while the latter is a Diffie–Hellman (DH) style agreement. The latter is more flexible, but for TLS it doesn’t make a difference.
The shape of a KEM and Diffie–Hellman key agreement in TLS-compatible handshake is the same.
In both cases the client sends a client keyshare to the server. From this client keyshare the server generates the shared key. The server then returns a server keyshare with which the client can also compute the shared key.
Going back to the TLS 1.3 flow: when the server receives the ClientHello message it picks an AEAD (cipher), signature algorithm and client keyshare that it supports. It replies with a ServerHello message that contains the chosen AEAD and the server keyshare for the selected key agreement. With the AEAD and shared key locked in, the server starts encrypting data (shown with blue boxes).
Authentication
Together with the AEAD and server keyshare, the server sends a signature, the handshake signature, on the transcript of the communication so far together with a certificate (chain) for the public key that it used to create the signature. This allows the client to authenticate the server: it checks whether it trusts the certificate authority (e.g. Let’s Encrypt) that certified the public key and whether the signature verifies for the messages it sent and received so far. This not only authenticates the server, but it also protects against downgrade attacks.
Downgrade protection
We cannot upgrade all clients and servers to post-quantum cryptography at once. Instead, there will be a transition period where only some clients and some servers support post-quantum cryptography. The key agreement negotiation in TLS 1.3 allows this: during the transition servers and clients will still support non post-quantum key agreements, and can fall back to it if necessary.
This flexibility is great, but also scary: if both client and server support post-quantum key agreement, we want to be sure that they also negotiate the post-quantum key agreement. This is the case in TLS 1.3, but it is not obvious: the keyshares, the chosen keyshare and the list of supported key agreements are all sent in plain text. Isn’t it possible for an attacker in the middle to remove the post-quantum key agreements? This is called a downgrade attack.
This is where the transcript comes in: the handshake signature is taken over all messages received and sent by the server so far. This includes the supported key agreements and the key agreement that was picked. If an attacker changes the list of supported key agreements that the client sends, then the server will not notice. However, the client checks the server’s handshake signature against the list of supported key agreements it has actually sent and thus will detect the mischief.
The downgrade attack problems are muchmorecomplicated for TLS 1.2, which is one of the reasons we’re hesitant to retrofit post-quantum security in TLS 1.2.
Wrapping up the handshake
The last part of the server’s response is “server finished”, a message authentication code (MAC) on the whole transcript so far. Most of the work has been done by the handshake signature, but in other operating modes of TLS without handshake signature, such as session resumption, it’s important.
With the chosen AEAD and server keyshare, the client can compute the shared key and decrypt and verify the certificate chain, handshake signature and handshake MAC. We did not mention it before, but the shared key is not used directly for encryption. Instead, for good measure, it’s mixed together with communication transcripts, to derive several specific keys for use during the handshake and the main connection afterwards.
To wrap up the handshake, the client sends its own handshake MAC, and can then proceed to send application-specific data encrypted with the keys derived during the handshake.
Hello! Retry Request?
What we just sketched is the desirable flow where the client sends a keyshare that is supported by the server. That might not be the case. If the server doesn’t accept any key agreements advertised by the client, then it will tell the client and abort the connection.
If there is a key agreement that both support, but for which the client did not send a keyshare, then the server will respond with a HelloRetryRequest (HRR) message requesting a keyshare of a specific key agreement that the client supports as shown on the diagram on the right. In turn, the client responds with a new ClientHello with the selected keyshare.
If there is a key agreement that both support, but for which the client did not send a keyshare, then the server will respond with a HelloRetryRequest (HRR) message requesting a keyshare of a specific key agreement that the client supports as shown on the diagram on the right. In turn, the client responds with a new ClientHello with the selected keyshare.
This is not the whole story: a server is also allowed to send a HelloRetryRequest to request a different key agreement that it prefers over those for which the client sent shares. For instance, a server can send a HelloRetryRequest to a post-quantum key agreement if the client supports it, but didn’t send a keyshare for it.
HelloRetryRequests are rare today. Almost every server supports the X25519 key-agreement and almost every client (98% today) sends a X25519 keyshare. Earlier P-256 was the de facto standard and for a long time many browsers would send both a P-256 and X25519 keyshare to prevent a HelloRetryRequest. As we will discuss later, we might not have the luxury to send two post-quantum keyshares.
That’s the theory
TLS 1.3 is designed to be flexible in the cryptography it uses without sacrificing security or performance, which is convenient for our migration to post-quantum cryptography. That is the theory, but there are some serious issues in practice — we’ll go into detail later on. But first, let’s check out the post-quantum key agreements we’ve deployed.
What we deployed
Today we have enabled support for the X25519Kyber512Draft00 and X25519Kyber768Draft00 key agreements using TLS identifiers 0xfe30 and 0xfe31 respectively. These are exactly the same key agreements we enabled on a limited number of zones this July.
These two key agreements are a combination, a hybrid, of the classical X25519 and the new post-quantum Kyber512 and Kyber768 respectively and in that order. That means that even if Kyber turns out to be insecure, the connection remains as secure as X25519.
Kyber, for now, is the only key agreement that NIST has selected for standardization. Kyber is very light on the CPU: it is faster than X25519 which is already known for its speed. On the other hand, its keyshares are much bigger:
Size keyshares(in bytes)
Ops/sec (higher is better)
Algorithm
PQ
Client
Server
Client
Server
Kyber512
✅
800
768
50,000
100,000
Kyber768
✅
1,184
1,088
31,000
70,000
X25519
❌
32
32
17,000
17,000
Size and CPU performance compared between X25519 and Kyber. Performance varies considerably by hardware platform and implementation constraints and should be taken as a rough indication only.
Kyber is expected to change in minor, but backwards incompatible ways, before final standardization by NIST in 2024. Also, the integration with TLS, including the choice and details of the hybrid key agreement, are not yet finalized by the TLS working group. Once they are, we will adopt them promptly.
Because of this, we will not support the preliminary key agreements announced today for the long term; they’re provided as a beta service. We will post updates on our deployment on pq.cloudflareresearch.com and announce it on the IETF PQC mailing list.
Now that we know how TLS negotiation works in theory, and which key agreements we’re adding, how could it fail?
Where things might break in practice
Protocol ossification
Protocols are often designed with flexibility in mind, but if that flexibility is not exercised in practice, it’s often lost. This is called protocol ossification. The roll-out of TLS 1.3 was difficult because of several instances of ossification. One poignant example is TLS’ version negotiation: there is a version field in the ClientHello message that indicates the latest version supported by the client. A new version was assigned to TLS 1.3, but in testing it turned out that many servers would not fallback properly to TLS 1.2, but crash the connection instead. How do we deal with ossification?
Workaround
Today, TLS 1.3 masquerades itself as TLS 1.2 down to including many legacy fields in the ClientHello. The actual version negotiation is moved into a new extension to the message. A TLS 1.2 server will ignore the new extension and ignorantly continue with TLS 1.2, while a TLS 1.3 server picks up on the extension and continues with TLS 1.3 proper.
Protocol grease
How do we prevent ossification? Having learnt from this experience, browsers will regularly advertise dummy versions in this new version field, so that misbehaving servers are caught early on. This is not only done for the new version field, but in many other places in the TLS handshake, and presciently also for the key agreement identifiers. Today, 40% of browsers send two client keyshares: one X25519 and another a bogus 1-byte keyshare to keep key agreement flexibility.
This behavior is standardized in RFC 8701: Generate Random Extensions And Sustain Extensibility (GREASE) and we call it protocol greasing, as in “greasing the joints” from Adam Langley’s metaphor of protocols having rusty joints in need of oil.
This keyshare grease helps, but it is not perfect, because it is the size of the keyshare that in this case causes the most concern.
Fragmented ClientHello
Post-quantum keyshares are big. The two Kyber hybrids are 832 and 1,216 bytes. Compared to that, X25519 is tiny with only 32 bytes. It is not unlikely that some implementations will fail when seeing such large keyshares.
Our biggest concern is with the larger Kyber768 based keyshare. A ClientHello with the smaller 832 byte Kyber512-based keyshare will just barely fit in a typical network packet. On the other hand, the larger 1,216 byte Kyber768-keyshare will typically fragment the ClientHello into two packets.
Assembling packets together isn’t free: it requires you to keep track of the partial messages around. Usually this is done transparently by the operating system’s TCP stack, but optimized middleboxes and load balancers that look at each packet separately, have to (and might not) keep track of the connections themselves.
QUIC The situation for HTTP/3, which is built on QUIC, is particularly interesting. Instead of a simple port number chosen by the client (as in TCP), a QUIC packet from the client contains a connection ID that is chosen by the server. Think of it as “your reference” and “our reference” in snailmail. This allows a QUIC load-balancer to encode the particular machine handling the connection into the connection ID.
When opening a connection, the QUIC client doesn’t know which connection ID the server would like and sends a random one instead. If the client needs multiple initial packets, such as with a big ClientHello, then the client will use the same random connection ID. Even though multiple initial packets are allowed by the QUIC standard, a QUIC load balancer might not expect this, and won’t be able to refer to an underlying TCP connection.
Performance
Aside from these hard failures, soft failures, such as performance degradation are also of concern: if it’s too slow to load, a website might as well have been broken to begin with.
Back in 2019 in a joint experiment with Google, we deployed two post-quantum key agreements: CECPQ2, based on NTRU-HRSS, and CECPQ2b, based on SIKE. NTRU-HRSS is very similar to Kyber: it’s a bit larger and slower. Results from 2019 are very promising: X25519+NTRU-HRSS (orange line) is hard to distinguish from X25519 on its own (blue line).
We will continue to keep a close eye on performance, especially on the tail performance: we want a smooth transition for everyone, from the fastest to the slowest clients on the Internet.
How to help out
The Internet is a very heterogeneous system. To find all issues, we need sufficient numbers of diverse testers. We are working with browsers to add support for these key agreements, but there may not be one of these browsers in every network.
So, to help the Internet out, try and switch a small part of your traffic to Cloudflare domains to use these new key agreement methods. We have open-sourced forks for BoringSSL, Go and quic-go. For BoringSSL and Go, check out the sample code here. If you have any issues, please let us know at [email protected]. We will be discussing any issues and workarounds at the IETF TLS working group.
Outlook
The transition to a post-quantum secure Internet is urgent, but not without challenges. Today we have deployed a preliminary post-quantum key agreement on all our servers — a sizable portion of the Internet — so that we can all start testing the big migration today. We hope that come 2024, when NIST puts a bow on Kyber, we will all have laid the groundwork for a smooth transition to a Post-Quantum Internet.
….. 1We only support these post-quantum key agreements in protocols based on TLS 1.3 including HTTP/3. There is one exception: for the moment we disable these hybrid key exchanges for websites in FIPS-mode.
Undoubtedly, one of the big themes in IT for the next decade will be the migration to post-quantum cryptography. From tech giants to small businesses: we will all have to make sure our hardware and software is updated so that our data is protected against the arrival of quantum computers. It seems far away, but it’s not a problem for later: any encrypted data captured today (not protected by post-quantum cryptography) can be broken by a sufficiently powerful quantum computer in the future.
Luckily we’re almost there: after a tremendous worldwide effort by the cryptographic community, we know what will be the gold standard of post-quantum cryptography for the next decades. Release date: somewhere in 2024. Hopefully, for most, the transition will be a simple software update then, but it will not be that simple for everyone: not all software is maintained, and it could well be that hardware needs an upgrade as well. Taking a step back, many companies don’t even have a full list of all software running on their network.
For Cloudflare Tunnel customers, this migration will be much simpler: introducing Post-QuantumCloudflare Tunnel. In this blog post, first we give an overview of how Cloudflare Tunnel works and explain how it can help you with your post-quantum migration. Then we’ll explain how to get started and finish with the nitty-gritty technical details.
Cloudflare Tunnel
With Cloudflare Tunnel you can securely expose a server sitting within an internal network to the Internet by running the cloudflared service next to it. For instance, after having installed cloudflared on your internal network, you can expose your on-prem webapp on the Internet under, say example.com, so that remote workers can access it from anywhere,
Life of a Cloudflare Tunnel request.
How does it work? cloudflared creates long-running connections to two nearby Cloudflare data centers, for instance San Francisco (connection 3) and one other. When your employee visits your domain, they connect (1) to a Cloudflare server close to them, say in Frankfurt. That server knows that this is a Cloudflare Tunnel and that your cloudflared has a connection to a server in San Francisco, and thus it relays (2) the request to it. In turn, via the reverse connection, the request ends up at cloudflared, which passes it (4) to the webapp via your internal network.
In essence, Cloudflare Tunnel is a simple but convenient tool, but the magic is in what you can do on top with it: you get Cloudflare’s DDoS protection for free; fine-grained access control with Cloudflare Access (even if the application didn’t support it) and request logs just to name a few. And let’s not forget the matter at hand:
Post-quantum tunnels
Our goal is to make it easy for everyone to have a fully post-quantum secure connection from users to origin. For this, Post-Quantum Cloudflare Tunnel is a powerful tool, because with it, your users can benefit from a post-quantum secure connection without upgrading your application (connection 4 in the diagram).
Today, we make two important steps towards this goal: cloudflared2022.9.1 adds the --post-quantum flag, that when given, makes the connection from cloudflared to our network (connection 3) post-quantum secure.
Also today, we have announced support for post-quantum browser connections (connection 1).
We aren’t there yet: browsers (and other HTTP clients) do not support the post-quantum security offered by our network, yet, and we still have to make the connections between our data centers (connection 2) post-quantum secure.
An attacker only needs to have access to one vulnerable connection, but attackers don’t have access everywhere: with every connection we make post-quantum secure, we remove one opportunity for compromise.
We are eager to make post-quantum tunnels the default, but for now it is a beta feature. The reason is that the cryptography used and its integration into the network protocol are not yet final. Making post-quantum the default now, would require users to update cloudflared more often than we can reasonably expect them to.
Getting started
Are frequent updates to cloudflared not a problem for you? Then please do give post-quantum Cloudflare Tunnel a try. Make sure you’re on at least 2022.9.1 and simply run cloudflared with the --post-quantum flag:
$ cloudflared tunnel run --post-quantum tunnel-name
2022-09-23T11:44:42Z INF Starting tunnel tunnelID=[...]
2022-09-23T11:44:42Z INF Version 2022.9.1
2022-09-23T11:44:42Z INF GOOS: darwin, GOVersion: go1.19.1, GoArch: amd64
2022-09-23T11:44:42Z INF Settings: map[post-quantum:true pq:true]
2022-09-23T11:44:42Z INF Generated Connector ID: [...]
2022-09-23T11:44:42Z INF cloudflared will not automatically update if installed by a package manager.
2022-09-23T11:44:42Z INF Initial protocol quic
2022-09-23T11:44:42Z INF Using experimental hybrid post-quantum key agreement X25519Kyber768Draft00
2022-09-23T11:44:42Z INF Starting metrics server on 127.0.0.1:53533/metrics
2022-09-23T11:44:42Z INF Connection [...] registered connIndex=0 ip=[...] location=AMS
2022-09-23T11:44:43Z INF Connection [...] registered connIndex=1 ip=[...] location=AMS
2022-09-23T11:44:44Z INF Connection [...] registered connIndex=2 ip=[...] location=AMS
2022-09-23T11:44:45Z INF Connection [...] registered connIndex=3 ip=[...] location=AMS
If you run cloudflaredas a service, you can turn on post-quantum by adding post-quantum: true to the tunnel configuration file. Conveniently, the cloudflared service will automatically update itself if not installed by a package manager.
If, for some reason, creating a post-quantum tunnel fails, you’ll see an error message like
2022-09-22T17:30:39Z INF Starting tunnel tunnelID=[...]
2022-09-22T17:30:39Z INF Version 2022.9.1
2022-09-22T17:30:39Z INF GOOS: darwin, GOVersion: go1.19.1, GoArch: amd64
2022-09-22T17:30:39Z INF Settings: map[post-quantum:true pq:true]
2022-09-22T17:30:39Z INF Generated Connector ID: [...]
2022-09-22T17:30:39Z INF cloudflared will not automatically update if installed by a package manager.
2022-09-22T17:30:39Z INF Initial protocol quic
2022-09-22T17:30:39Z INF Using experimental hybrid post-quantum key agreement X25519Kyber512Draft00
2022-09-22T17:30:39Z INF Starting metrics server on 127.0.0.1:55889/metrics
2022-09-22T17:30:39Z INF

===================================================================================
You are hitting an error while using the experimental post-quantum tunnels feature.

Please check:

   https://pqtunnels.cloudflareresearch.com

for known problems.
===================================================================================


2022-09-22T17:30:39Z ERR Failed to create new quic connection error="failed to dial to edge with quic: CRYPTO_ERROR (0x128): tls: handshake failure" connIndex=0 ip=[...]
When the post-quantum flag is given, cloudflared will not fall back to a non post-quantum connection.
What to look for
The setup phase is the crucial part: once established, the tunnel is the same as a normal tunnel. That means that performance and reliability should be identical once the tunnel is established.
The post-quantum cryptography we use is very fast, but requires roughly a kilobyte of extra data to be exchanged during the handshake. The difference will be hard to notice in practice.
Our biggest concern is that some network equipment/middleboxes might be confused by the bigger handshake. If the post-quantum Cloudflare Tunnel isn’t working for you, we’d love to hear about it. Contact us at [email protected] and tell us which middleboxes or ISP you’re using.
Under the hood
When the --post-quantum flag is given, cloudflared restricts itself to the QUIC transport for the tunnel connection to our network and will only allow the post-quantum hybrid key exchanges X25519Kyber512Draft00 and X25519Kyber768Draft00 with TLS identifiers 0xfe30 and 0xfe31 respectively. These are hybrid key exchanges between the classical X25519 and the post-quantum secure Kyber. Thus, on the off-chance that Kyber turns out to be insecure, we can still rely on the non-post quantum security of X25519. These are the same key exchanges supported on our network.
cloudflared randomly picks one of these two key exchanges. The reason is that the latter usually requires two initial packets for the TLS ClientHello whereas the former only requires one. That allows us to test whether a fragmented ClientHello causes trouble.
When cloudflared fails to set up the post-quantum connection, it will report the attempted key exchange, cloudflared version and error to pqtunnels.cloudflareresearch.com so that we have visibility into network issues. Have a look at that page for updates on our post-quantum tunnel deployment.
The control connection and authentication of the tunnel between cloudflared and our network are not post-quantum secure yet. This is less urgent than the store-now-decrypt-later issue of the data on the tunnel itself.
We have open-sourced support for these post-quantum QUIC key exchanges in Go.
Outlook
In the coming decade the industry will roll out post-quantum data protection. Some cases will be as simple as a software update and others will be much more difficult. Post-Quantum Cloudflare Tunnel will secure the connection between Cloudflare’s network and your origin in a simple and user-friendly way — an important step towards the Post-Quantum Internet, so that everyone may continue to enjoy a private and secure Internet.
In 2014, Cloudflare set out to encrypt the Internet by introducing Universal SSL. It made getting an SSL/TLS certificate free and easy at a time when doing so was neither free, nor easy. Overnight millions of websites had a secure connection between the user’s browser and Cloudflare.
But getting the connection encrypted from Cloudflare to the customer’s origin server was more complex. Since Cloudflare and all browsers supported SSL/TLS, the connection between the browser and Cloudflare could be instantly secured. But back in 2014 configuring an origin server with an SSL/TLS certificate was complex, expensive, and sometimes not even possible.
And so we relied on users to configure the best security level for their origin server. Later we added a service that detects and recommends the highest level of security for the connection between Cloudflare and the origin server. We also introduced free origin server certificates for customers who didn’t want to get a certificate elsewhere.
Today, we’re going even further. Cloudflare will shortly find the most secure connection possible to our customers’ origin servers and use it, automatically. Doing this correctly, at scale, while not breaking a customer’s service is very complicated. This blog post explains how we are automatically achieving that highest level of security possible for those customers who don’t want to spend time configuring their SSL/TLS set up manually.
Why configuring origin SSL automatically is so hard
When we announced Universal SSL, we knew the backend security of the connection between Cloudflare and the origin was a different and harder problem to solve.
In order to configure the tightest security, customers had to procure a certificate from a third party and upload it to their origin. Then they had to indicate to Cloudflare that we should use this certificate to verify the identity of the server while also indicating the connection security capabilities of their origin. This could be an expensive and tedious process. To help alleviate this high set up cost, in 2015 Cloudflare launched a beta Origin CA service in which we provided free limited-function certificates to customer origin servers. We also provided guidance on how to correctly configure and upload the certificates, so that secure connections between Cloudflare and a customer’s origin could be established quickly and easily.
What we discovered though, is that while this service was useful to customers, it still required a lot of configuration. We didn’t see the change we did with Universal SSL because customers still had to fight with their origins in order to upload certificates and test to make sure that they had configured everything correctly. And when you throw things like load balancers into the mix or servers mapped to different subdomains, handling server-side SSL/TLS gets even more complicated.
Around the same time as that announcement, Let’s Encrypt and other services began offering certificates as a public CA for free, making TLS easier and paving the way for widespread adoption. Let’s Encrypt and Cloudflare had come to the same conclusion: by offering certificates for free, simplifying server configuration for the user, and working to streamline certificate renewal, they could make a tangible impact on the overall security of the web.
The announcements of free and easy to configure certificates correlated with an increase in attention on origin-facing security. Cloudflare customers began requesting more documentation to configure origin-facing certificates and SSL/TLS communication that were performant and intuitive. In response, in 2016 we announced the GA of origin certificate authority to provide cheap and easy origin certificates along with guidance on how to best configure backend security for any website.
The increased customer demand and attention helped pave the way for additional features that focused on backend security on Cloudflare. For example, authenticated origin pull ensures that only HTTPS requests from Cloudflare will receive a response from your origin, preventing an origin response from requests outside of Cloudflare. Another option, Cloudflare Tunnel can be set up to run on the origin servers, proactively establishing secure and private tunnels to the nearest Cloudflare data center. This configuration allows customers to completely lock down their origin servers to only receive requests routed through our network. For customers unable to lock down their origins using this method, we still encourage adopting the strongest possible security when configuring how Cloudflare should connect to an origin server.
Cloudflare currently offers five options for SSL/TLS configurability that we use when communicating with origins:
In Off mode, as you might expect, traffic from browsers to Cloudflare and from Cloudflare to origins are not encrypted and will use plain text HTTP.
In Flexible mode, traffic from browsers to Cloudflare can be encrypted via HTTPS, but traffic from Cloudflare to the site’s origin server is not. This is a common selection for origins that cannot support TLS, even though we recommend upgrading this origin configuration wherever possible. A guide for upgrading can be found here.
In Full mode, Cloudflare follows whatever is happening with the browser request and uses that same option to connect to the origin. For example, if the browser uses HTTP to connect to Cloudflare, we’ll establish a connection with the origin over HTTP. If the browser uses HTTPS, we’ll use HTTPS to communicate with the origin; however we will not validate the certificate on the origin to prove the identity and trustworthiness of the server.
In Full (strict) mode, traffic between Cloudflare follows the same pattern as in Full mode, however Full (strict) mode adds validation of the origin server’s certificate. The origin certificate can either be issued by a public CA like Let’s Encrypt or by Cloudflare Origin CA.
In Strict mode, traffic from the browser to Cloudflare that is HTTP or HTTPS will always be connected to the origin over HTTPS with a validation of the origin server’s certificate.
What we have found in a lot of cases is that when customers initially signed up for Cloudflare, the origin they were using could not support the most advanced versions of encryption, resulting in origin-facing communication using unencrypted HTTP. These default values persisted over time, even though the origin has become more capable. We think the time is ripe to re-evaluate the entire concept of default SSL/TLS levels.
That’s why we will reduce the configuration burden for origin-facing security by automatically managing this on behalf of our customers. Cloudflare will provide a zero configuration option for how we will communicate with origins: we will simply look at an origin and use the most-secure option available to communicate with it.
Re-evaluating default SSL/TLS modes is only the beginning. Not only will we automatically upgrade sites to their best security setting, we will also open up all SSL/TLS modes to all plan levels. Historically, Strict mode was reserved for enterprise customers only. This was because we released this mode in 2014 when few people had origins that were able to communicate over SSL/TLS, and we were nervous about customers breaking their configurations. But this is 2022, and we think that Strict mode should be available to anyone who wants to use it. So we will be opening it up to everyone with the launch of the automatic upgrades.
How will automatic upgrading work?
To upgrade the origin-facing security of websites, we first need to determine the highest security level the origin can use. To make this determination, we will use the SSL/TLS Recommender tool that we released a year ago.
The recommender performs a series of requests from Cloudflare to the customer’s origin(s) to determine if the backend communication can be upgraded beyond what is currently configured. The recommender accomplishes this by:
Crawling the website to collect links on different pages of the site. For websites with large numbers of links, the recommender will only examine a subset. Similarly, for sites where the crawl turns up an insufficient number of links, we augment our results with a sample of links from recent visitors requests to the zone. All of this is to get a representative sample to where requests are going in order to know how responses are served from the origin.
The crawler uses the user agent Cloudflare-SSLDetector and has been added to Cloudflare’s list of known “good bots”.
Next, the recommender downloads the content of each link over both HTTP and HTTPS. The recommender makes only idempotent GET requests when scanning origin servers to avoid modifying server resource state.
Following this, the recommender runs a content similarity algorithm to determine if the content collected over HTTP and HTTPS matches.
If the content that is downloaded over HTTP matches the content downloaded over HTTPS, then it’s known that we can upgrade the security of the website without negative consequences.
If the website is already configured to Full mode, we will perform a certificate validation (without the additional need for crawling the site) to determine whether it can be updated to Full (strict) mode or higher.
If it can be determined that the customer’s origin is able to be upgraded without breaking, we will upgrade the origin-facing security automatically.
But that’s not all. Not only are we removing the configuration burden for services on Cloudflare, but we’re also providing more precise security settings by moving from per-zone SSL/TLS settings to per-origin SSL/TLS settings.
The current implementation of the backend SSL/TLS service is related to an entire website, which works well for those with a single origin. For those that have more complex setups however, this can mean that origin-facing security is defined by the lowest capable origin serving a part of the traffic for that service. For example, if a website uses img.example.com and api.example.com, and these subdomains are served by different origins that have different security capabilities, we would not want to limit the SSL/TLS capabilities of both subdomains to the least secure origin. By using our new service, we will be able to set per-origin security more precisely to allow us to maximize the security posture of each origin.
The goal of this is to maximize the origin-facing security of everything on Cloudflare. However, if any origin that we attempt to scan blocks the SSL recommender, has a non-functional origin, or opts-out of this service, we will not complete the scans and will not be able to upgrade security. Details on how to opt-out will be provided via email announcements soon.
Opting out
There are a number of reasons why someone might want to configure a lower-than-optimal security setting for their website. One common reason customers provide is a fear that having higher security settings will negatively impact the performance of their site. Others may want to set a suboptimal security setting for testing purposes or to debug some behavior. Whatever the reason, we will provide the tools needed to continue to configure the SSL/TLS mode you want, even if that’s different from what we think is the best.
When is this going to happen?
We will begin to roll this change out before the end of the year. If you read this and want to make sure you’re at the highest level of backend security already, we recommend Full (strict) or Strict mode. If you prefer to wait for us to automatically upgrade your origin security for you, please keep your eyes peeled to your inbox for the date we will begin rolling out this change for your group.
At Cloudflare, we believe that the Internet needs to be secure and private. If you’d like to help us achieve that, we’re hiring across the engineering organization.
Back in June 2022, we announced an upcoming feature that would allow for Cloudflare Zero Trust users to easily create prefilled HTTP policies in Cloudflare Gateway (Cloudflare’s Secure Web Gateway solution) via issues identified by CASB, a new Cloudflare product that connects, scans, and monitors your SaaS apps – like Google Workspace and Microsoft 365 – for security issues.
With Cloudflare’s 12th Birthday Week nearing its end, we wanted to highlight, in true Cloudflare fashion, this new feature in action.
What is CASB? What is Gateway?
To quickly recap, Cloudflare’s API-driven CASB offers IT and security teams a fast, yet effective way to connect, scan, and monitor their SaaS apps for security issues, like file exposures, misconfigurations, and Shadow IT. In just a few clicks, users can see an exhaustive list of security issues that may be affecting the security of their SaaS apps, including Google Workspace, Microsoft 365, Slack, and GitHub.
Cloudflare Gateway, our Secure Web Gateway (SWG) offering, allows teams to monitor and control the outbound connections originating from endpoint devices. For example, don’t want your employees to access gambling and social media websites on company devices? Just block access to them in our easy-to-use Zero Trust dashboard.
The problems at hand
As we highlighted in our first post, Shadow IT – or unapproved third-party applications being used by employees – continues to be one of the biggest pain points for IT administrators in the cloud era. When employees grant access to external services without the consent of their IT or security department, they risk granting bad actors access to some of the company’s most sensitive data stored in these SaaS applications.
Another major issue affecting the security of data stored in the cloud is file exposure in the form of oversharing. When an employee shares a highly sensitive Google Doc to someone via a public link, would your IT or security team know about it? And even if they do, do they have a way to minimize the risk and block access to it?
With these two products now being used by customers around the world, we’re excited to share how visibility and basic awareness of SaaS security issues doesn’t have to be the end of it. What are admins supposed to do next?
Gateway + CASB: blocking identified threats in three (yes, three) clicks
Now, when CASB discovers a problem (which we call a Finding), it’s now possible to easily create a corresponding Gateway policy in as few as three clicks.
This means users can now automatically generate fine-grained Gateway policies to prevent specific inappropriate behavior from continuing, while still allowing for expected access and usage that meets company policy.
Example 1: Block employees from uploading to their personal Google Drive
A common use case we heard during CASB’s beta program was the tendency for employees to upload corporate data – documents, spreadsheets, files, folders, etc. – to their personal Google Drive (or similar) accounts, presenting the risk of intellectual property making its way out of a secure corporate environment. With Gateway and CASB working together, IT administrators can now directly block upload activity from anywhere other than their corporate tenant of Google Drive or Microsoft OneDrive.
Example 2: Restrict repeat oversharers from uploading and downloading files
A great existing use case of Cloudflare CASB has been the ability to identify employees that are habitual oversharers of files in their corporate Google or Microsoft tenants – sharing files to anyone that has the link, sharing files with emails outside their company, etc.
Now when these employees are identified, CASB admins can create Gateway policies to block specific users from further upload and download activity until the behavior has been addressed.
Example 3: Prevent file uploads to unapproved, Shadow IT applications
To address the concern of Shadow IT, CASB-originating Gateway policies can be customized, including being able to restrict upload and download events to only the SaaS applications your organization uses. Let’s say your company uses Box as its file storage solution; in just a few clicks, you can use an identified CASB Finding to create a Gateway policy that blocks activity to any file sharing application other than Box. This gives IT and security admins the peace of mind that their files will only end up in the approved cloud application they use.
Get started today with the Cloudflare Zero Trust
Ultimately, the power of Cloudflare Zero Trust comes from its existence as a single, unified platform that draws strength from its combination of products and features. As we continue our work towards bringing these new and exciting offerings to market, we believe that it’s just as important to highlight their synergies and associated use cases, this time from Cloudflare Gateway and CASB.
For those not already using Cloudflare Zero Trust, don’t hesitate to get started today – see the platform yourself with 50 free seats by signing up here.
For those who already know and love Cloudflare Zero Trust, reach out to your Cloudflare sales contact to get started with CASB and Gateway. We can’t wait to hear what interesting and exciting use cases you discover from this new cross-product functionality.
Historically, Cloudflare has covered large-scale Internet outages with timely blog posts, such as those published for Iran, Sudan, Facebook, and Syria. While we still explore such outages on the Cloudflare blog, throughout 2022 we have ramped up our monitoring of Internet outages around the world, posting timely information about those outages to @CloudflareRadar on Twitter.
Furthermore, this initial release is also laying the groundwork for the CROC to become a first stop and key resource for civil society organizations, journalists/news media, and impacted parties to get information on, or corroboration of, reported or observed Internet outages.
What information does the CROC contain?
At launch, the CROC includes summary information about observed outage events. This information includes:
Location: Where was the outage?
ASN: What autonomous system experienced a disruption in connectivity?
Type: How broad was the outage? Did connectivity fail nationwide, or at a sub-national level? Did just a single network provider have an outage?
Scope: If it was a sub-national/regional outage, what state or city was impacted? If it was a network-level outage, which one?
Cause: Insight into the likely cause of the outage, based on publicly available information. Historically, some have been government directed shutdowns, while others are caused by severe weather or natural disasters, or by infrastructure issues such as cable cuts, power outages, or filtering/blocking.
Start time: When did the outage start?
End time: When did the outage end?
Using the CROC
Radar pages, including the main landing page, include a card displaying information about the most recently observed outage, along with a link to the CROC. The CROC will also be linked from the left-side navigation bar
Within the CROC, we have tried to keep the interface simple and easily understandable. Based on the selected time period, the global map highlights locations where Internet outages have been observed, along with a tooltip showing the number of outages observed during that period. Similarly, the table includes information (as described above) about each observed outage, along with a link to more information. The linked information may be a Twitter post, a blog post, or a custom Radar graph.
As mentioned in the Radar 2.0 launch blog post, we launched an associated API alongside the new site. Outage information is available through this API as well — in fact, the CROC is built on top of this API. Interested parties, including civil society organizations, data journalists, or others, can use the API to integrate the available outage data with their own data sets, build their own related tools, or even develop a custom interface.
Information about the related API endpoint and how to access it can be found in the Cloudflare API documentation.
We recognize that some users may want to download the whole list of observed outages for local consumption and analysis. They can do so by clicking the “Download CSV” link below the table.
The status page the Internet needs (coming soon)
Today’s launch of the Cloudflare Radar Outage Center is just the beginning, as we plan to improve it over time. This includes increased automation of outage detection, enabling us to publish more timely information through both the API and the CROC tool, which is important for members of the community that track and respond to Internet outages. We are also exploring how we can use synthetic monitoring in combination with other network-level performance and availability information to detect outages of popular consumer and business applications/platforms.
And anyone who uses a cloud platform provider (such as AWS) will know that those companies’ status pages take a surprisingly long time to update when there’s an outage. It’s very common to experience difficulty accessing a service, see hundreds of messages on Twitter and message boards about a service being down, only to go to the cloud platform provider’s status page and see everything green and “All systems normal”.
For the last few months we’ve been monitoring the performance of cloud platform providers to see if we can detect when they go down and provide our own, real time status page for them. We believe we can and Cloudflare Radar Outage Center will be extended to include cloud service providers and give the Internet the status page it needs.
If you have questions about the CROC, or suggestions for features that you would like to see, please reach out to us on Twitter at @CloudflareRadar.
Cloudflare Radar was launched two years ago to give everyone access to the Internet trends, patterns and insights Cloudflare uses to help improve our service and protect our customers.
Until then, these types of insights were only available internally at Cloudflare. However, true to our mission of helping build a better Internet, we felt everyone should be able to look behind the curtain and see the inner workings of the Internet. It’s hard to improve or understand something when you don’t have clear visibility over how it’s working.
On Cloudflare Radar you can find timely graphs and visualizations on Internet traffic, security and attacks, protocol adoption and usage, and outages that might be affecting the Internet. All of these can be narrowed down by timeframe, country, and Autonomous System (AS). You can also find interactive deep dive reports on important subjects such as DDoS and the Meris Botnet. It’s also possible to search for any domain name to see details such as SSL usage and which countries their visitors are coming from.
Since launch, Cloudflare Radar has been used by NGOs to confirm the Internet disruptions their observers see in the field, by journalists looking for Internet trends related to an event in a country of interest or at volume of cyberattacks as retaliation to political sanctions, by analysts looking at the prevalence of new protocols and technologies, and even by brand PR departments using Cloudflare Radar data to analyze the online impact of a major sports event.
Cloudflare Radar has clearly become an important tool for many and, most importantly, we find it has helped shed light on parts of the Internet that deserve more attention and investment.
Introducing Cloudflare Radar 2.0
What has made Cloudflare Radar so valuable is that the data and insights it contains are unique and trustworthy. Cloudflare Radar shows aggregate data from across the massive spectrum of Internet traffic we see every day, presenting you with datasets you won’t find elsewhere.
However, there were still gaps. Today, on the second anniversary of Cloudflare Radar, we are launching Cloudflare Radar 2.0 in beta. It will address three common pieces of feedback from users:
Ease of finding insights and data. The way information was structured on Cloudflare Radar made finding information daunting for some people. We are redesigning Cloudflare Radar so that it becomes a breeze.
Number of insights. We know many users have wanted to see insights about other important parts of the Internet, such as email. We have also completely redesigned the Cloudflare Radar backend so that we can quickly add new insights over the coming months (including insights into email).
Sharing insights.The options for sharing Cloudflare Radar insights were limited. We will now provide you the options you want, including downloadable and embeddable graphs, sharing to social media platforms, and an API.
Finding insights and data
On a first visit to the redesigned Cloudflare Radar homepage one will notice:
Prominent and intuitive filtering capabilities on the top bar. A global search bar is also coming soon.
Content navigation on the sidebar.
Content cards showing glanceable and timely information.
The content you find on the homepage are what we call “quick bytes”. Those link you to more in-depth content for that specific topic, which can also be found through the sidebar navigation.
At the top of the page you can search for a country, autonomous system number (ASN), domain, or report to navigate to a home page for that specific content. For example, the domain page for google.com:
The navigation sidebar allows you to find more detailed insights and data related to Traffic, Security & Attacks, Adoption & Usage, and Domains. (We will be adding additional topic areas in the future.) It also gives you quick access to the Cloudflare Radar Outage Center, a tool for tracking Internet disruptions around the world and to which we are dedicating a separate blog post, and to Radar Reports, which are interactive deep dive reports on important subjects such as DDoS and the Meris Botnet.
Within these topic pages (such as the one for Adoption & Usage shown above), you will find the quick bytes for the corresponding topic at the top, and quick bytes for related topics on the right. The quick bytes on the right allow you to quickly glance at and navigate to related sections.
In the middle of the page are the more detailed charts for the topic you’re exploring.
Sharing insights
Cloudflare Radar’s reason to exist is to make Internet insights available to everyone, but historically we haven’t been as flexible as our users would want. People could download a snapshot of the graph, but not much more.
With Cloudflare Radar 2.0 we will be introducing three major new ways of using Radar insights and data:
Social share. Cloudflare Radar 2.0 charts have a more modern and clean look and feel, and soon you’ll be able to share them directly on the social media platform of your choice. No more dealing with low quality screenshots.
Embeddable charts. The beautiful charts will also be able to be embedded directly into your webpage or blog – it will work just like a widget, always showing up-to-date information.
API. If you like the data on Cloudflare Radar but want to manipulate it further for analysis, visualization, or for posting your own charts, you’ll have the Cloudflare Radar API available to you starting today.
Note: The API is available today. To use the Cloudflare API you need an API token or key (more details here). Embedding charts and sharing directly to social are new features to be released later this year.
Technology changes
Cloudflare Radar 2.0 was built on a new technology stack; we will write a blog post about why and how we did it soon. A lot changed: we now have proper GraphQL data endpoints and a public API, the website runs on top of Cloudflare Pages and Workers, and we’re finally doing server-side rendering using Remix. We adopted SVG whenever possible, built our reusable data visualization components system, and are using Cosmos for visual TDD. These foundational changes will provide a better UX/UI to our users and give us speed when iterating and improving Cloudflare Radar in the future.
We hope you find this update valuable, and recommend you keep an eye on radar.cloudflare.com to see the new insights and topics we’ll be adding regularly. If you have any feedback, please send it to us through the Cloudflare Community.
Beginning December 1, 2022, if you have a Business or Pro subscription, you will receive a complimentary allocation of Cloudflare Stream. Here’s what this means:
All Cloudflare customers with a Biz or Pro domain will be able to store up to 100 minutes of video content and deliver up to 10,000 minutes of video content each month at no additional cost
If you need additional storage or delivery beyond the complimentary allocation, you will be able to upgrade to a paid Stream subscription from the Stream Dashboard.
Cloudflare Stream simplifies storage, encoding and playback of videos. You can use the free allocation of Cloudflare Stream for various use cases, such as background/hero videos, e-commerce product videos, how-to guides and customer testimonials.
Upload videos with no code
To upload your first video Stream, simply visit the Stream Dashboard and drag-and-drop the video file:
Once you upload a video, Stream will store and encode your video. Stream automatically optimizes your video uploads by creating multiple versions of it at different quality levels. This happens behind-the-scenes and requires no extra effort from your side. The Stream Player automatically selects the optimal quality level based on your website visitor’s Internet connection using a technology called adaptive-bit rate encoding.
Your uploaded video will appear on the Dashboard:
Click on the video in the list of videos to watch a preview, change settings or to grab the embed code:
Built-in Stream Player
Stream provides an embed code that can be used to place your uploaded videos onto your website. The embed code can be found under the Embed tab:
To include the video on your website, simply copy-and-paste the embed code.
You’ll notice in the screenshot above that the Embed tab lets you customize the viewing experience. It supports the following optional properties:
Poster: The “poster image” is what appears on the video player before the user has started playing the video. By default, the poster image is set to the first frame in the video. However, you can change it by specifying another point in time or by specifying a URL to an image.
Start Time: Let’s say you have a 10-minute instructional video and your customer writes in with a question that is answered in that video at the 8-minute mark. You can use the Start Time property to have the video playback begin at the 8-minute mark, so your customer with a specific question does not need to watch 8 minutes of the video wondering “when will it answer my question?”. Instead, you can share a link with the customer that begins the video playback at the 8-minute mark.
Default Text Track: You can upload caption files for multiple languages for a given video. By default, captions are turned off. But if you want the captions to always render when the video plays, you can choose the default language from the Default Text Track dropdown.
Primary Color: You can choose your brand’s primary color and have it applied to various elements within the player, including the play button and the seek bar. Here is an example of the Stream Player with the Primary Color property configured to the Cloudflare orange:
Much, much more…
We live in a video-first world. Many Cloudflare customers already upload their videos to free video hosting services for marketing purposes. However, when you embed a video on your website that is hosted on a free video sharing service, your users often have to engage with unwelcomed ads and pixel trackers. Our hope is that by offering a free tier of Stream to Biz and Pro customers, you can use video to show off your products in a way that respects your users’ privacy and reflects your brand identity.
In addition to the features described in this announcement, Cloudflare Stream includes many more features including:
Dynamic Thumbnail Generation
Multi-language Captions
Live Streaming
Analytics
For a comprehensive list of features and how to use them, check out the Cloudflare Stream Docs.
At Cloudflare, we believe the Internet should be accessible to everyone. And today, we’re happy to announce a more inclusive Cloudflare dashboard experience for our users with disabilities. Recent improvements mean our dashboard now adheres to industry accessibility standards, including Web Content Accessibility Guidelines (WCAG) 2.1 AA and Section 508 of the Rehabilitation Act.
Over the past several months, the Cloudflare team and our partners have been hard at work to make the Cloudflare dashboard1 as accessible as possible for every single one of our current and potential customers. This means incorporating accessibility features that comply with the latest Web Content Accessibility Guidelines (WCAG) and Section 508 of the US’s federal Rehabilitation Act. We are invested in working to meet or exceed these standards; to demonstrate that commitment and share openly about the state of accessibility on the Cloudflare dashboard, we have completed the Voluntary Product Accessibility Template (VPAT), a document used to evaluate our level of conformance today.
Conformance with a technical and legal spec is a bit abstract–but for us, accessibility simply means that as many people as possible can be successful users of the Cloudflare dashboard. This is important because each day, more and more individuals and businesses rely upon Cloudflare to administer and protect their websites.
For individuals with disabilities who work on technology, we believe that an accessible Cloudflare dashboard could mean improved economic and technical opportunities, safer websites, and equal access to tools that are shaping how we work and build on the Internet.
For designers and developers at Cloudflare, our accessibility remediation project has resulted in an overhaul of our component library. Our newly WCAG-compliant components expedite and simplify our work building accessible products. They make it possible for us to deliver on our commitment to an accessible dashboard going forward.
Our Journey to an Accessible Cloudflare Dashboard
In 2021, we initiated an audit with third party experts to identify accessibility challenges in the Cloudflare dashboard. This audit came back with a daunting 213-page document—a very, very long list of compliance gaps.
We learned from the audit that there were many users we had unintentionally failed to design and build for in Cloudflare dashboard user interfaces. Most especially, we had not done well accommodating keyboard users and screen reader users, who often rely upon these technologies because of a physical impairment. Those impairments include low vision or blindness, motor disabilities (examples include tremors and repetitive strain injury), or cognitive disabilities (examples include dyslexia and dyscalculia).
As a product and engineering organization, we had spent more than a decade in cycles of rapid growth and product development. While we’re proud of what we have built, the audit made clear to us that there was a great need to address the design and technical debt we had accrued along the way.
One year, four hundred Jira tickets, and over 25 new, accessible web components later, we’re ready to celebrate our progress with you. Major categories of work included:
Forms: We re-wrote our internal form components with accessibility and developer experience top of mind. We improved form validation and error handling, labels, required field annotations, and made use of persistent input descriptions instead of placeholders. Then, we deployed those component upgrades across the dashboard.
Data visualizations: After conducting a rigorous re-evaluation of their design, we re-engineered charts and graphs to be accessible to keyboard and screen reader users. See below for a brief case study.
Heading tags: We corrected page structure throughout the dashboard by replacing all our heading tags (<h1>, <h2>, etc.) with a technique we borrowed from Heydon Pickering. This technique is an approach to heading level management that uses React Context and basic arithmetic.
SVGs: We reworked how we create SVGs (Scalable Vector Graphics), so that they are labeled properly and only exposed to assistive technology when useful.
Node modules: We jumped several major versions of old, inaccessible node modules that our UI components depend upon (and we broke many things along the way).
Color: We overhauled our use of color, and contributed a new volume of accessible sequential colors to our design system.
Bugs: We squashed a lot of bugs that had made their way into the dashboard over the years. The most common type of bug we encountered related to incorrect or unsemantic use of HTML elements—for example, using a <div> where we should have used a <td> (table data) or <tr> (table row) element within a table.
Case Study: Accessibility Work On Cloudflare Dashboard Data & Analytics
The Cloudflare dashboard is replete with analytics and data visualizations designed to offer deep insight into users’ websites’ performance, traffic, security, and more. Making those data visualizations accessible proved to be among the most complex and interdisciplinary issues we faced in the remediation work.
An example of a problem we needed to solve related to WCAG success criterion 1.4.1, which pertains to the use of color. 1.4.1 specifies that color cannot be the only means by which to convey information, such as the differentiation between two items compared in a chart or graph.
Our charts were clearly nonconforming with this standard, using color alone to represent different data being compared. For example, a typical graph might have used the color blue to show the number of requests to a website that were 200 OK, and the color orange to show 403 Forbidden, but failed to offer users another way to discern between the two status codes.
Our UI team went to work on the problem, and chose to focus our effort first on the Cloudflare dashboard time series graphs.
Interestingly, we found that design patterns recommended even by accessibility experts created wholly unusable visualizations when placed into the context of real world data. Examples of such recommended patterns include using different line weights, patterns (dashed, dotted or other line styles), and terminal glyphs (symbols set at the beginning and end of the lines) to differentiate items being compared.
We tried, and failed, to apply a number of these patterns; you can see the evolution of this work on our time series graph component in the three different images below.
v.1
Here is an early attempt at using both terminal glyphs and patterns to differentiate data in a time series graph. You can see that the terminal glyphs pile up and become indistinguishable; the differences among the line patterns are very hard to discern. This code never made it into production.
v.2
In this version, we eliminated terminal glyphs but kept line patterns. Additionally, we faded the unfocused items in the graph to help bring highlighted data to the forefront. This latter technique made it into our final solution.
v.3
Here we eliminated patterns altogether, simplified the user interface to only use the fading technique on unfocused items, and put our new, sequentially accessible colors to use. Finally, a visual design solution approved by accessibility and data visualization experts, as well as our design and engineering teams.
After arriving at our design solution, we had some engineering work to do.
In order to meet WCAG success criterion 2.1.1, we rewrote our time series graphs to be fully keyboard accessible by adding focus handling to every data point, and enabling the traversal of data using arrow keys.
Navigating time series data points by keyboard on the Cloudflare dashboard.
We did some fine-tuning, specifically to support screen readers: we eliminated auditory “chartjunk” (unnecessary clutter or information in a chart or graph) and cleaned up decontextualized data (a scenario in which numbers are exposed to and read by a screen reader, but contextualizing information, like x- and y-axis labels, is not).
And lastly, to meet WCAG 1.1.1, we engineered new UI component wrappers to make chart and graph data downloadable in CSV format. We deployed this part of the solution across all charts and graphs, not just the time series charts like those shown above. No matter how you browse and interact with the web, we hope you’ll notice this functionality around the Cloudflare dashboard and find value in it.
Making all of this data available to low vision, keyboard, and assistive technology users was an interesting challenge for us, and a true team effort. It necessitated a separate data visualization report conducted by another, more specialized team of third party experts, deep collaboration between engineering and design, and many weeks of development.
Applying this thorough treatment to all data visualizations on the Cloudflare dashboard is our goal, but still work in progress. Please stay tuned for more accessible updates to our chart and graph components.
Conclusion
There’s a lot of nuance to accessibility work, and we were novices at the beginning: researching and learning as we were doing. We also broke a lot of things in the process, which (as any engineering team knows!) can be stressful.
Overall, our team’s biggest challenge was figuring out how to complete a high volume of cross-functional work in the shortest time possible, while also setting a foundation for these improvements to persist over time.
As a frontend engineering and design team, we are very grateful for having had the opportunity to focus on this problem space and to learn from truly world-class accessibility experts along the way.
Accessibility matters to us, and we know it does to you. We’re proud of our progress, and there’s always more to do to make Cloudflare more usable for all of our customers. This is a critical piece of our foundation at Cloudflare, where we are building the most secure, performant and reliable solutions for the Internet. Stay tuned for what’s next!
Not using Cloudflare yet? Get started today and join us on our mission to build a better Internet.
1All references to “dashboard” in this post are specific to the primary user authenticated Cloudflare web platform. This does not include Cloudflare’s product-specific dashboards, marketing, support, educational materials, or third party integrations.
Workers Analytics Engine (or for short, Analytics Engine) is a new way for developers to store and analyze time series analytics about anything using Cloudflare Workers, and it’s now in open beta! Analytics Engine is really good at gathering time-series data for really high cardinality and high-volume data sets from Cloudflare Workers. At Cloudflare, we use Analytics Engine to provide insight into how our customers use Cloudflare products.
Log, log, logging!
As an example, Analytics Engine is used to observe the backend that powers Instant Logs. Instant Logs allows Cloudflare customers to stream a live session of the HTTP logs for their domain to the Cloudflare dashboard. The backend for Instant Logs is built on Cloudflare Workers.
Briefly, the Instant Logs backend works by receiving requests from each Cloudflare server that processes a customer’s HTTP traffic. These requests contain the HTTP logs for the customer’s HTTP traffic. The Instant Logs backend then forwards these HTTP logs to the customer’s browser via a WebSocket.
In order to ensure that the HTTP logs are being delivered smoothly to a customer’s browser, we need to track the request rates across all active Instant Logs sessions. We also need to track the request rates across all Cloudflare data centers, since Instant Logs is built on Cloudflare Workers, and Cloudflare Workers is built on Cloudflare’s massive network. As a result, the data set for the Instant Logs backend has really massive cardinality!
“Traditional” metrics systems like Prometheus are poorly suited to serving high cardinality data. Fortunately, this is exactly the problem that Analytics Engine is designed to solve. So, we sent all the Instant Logs backend request logs to Analytics Engine. Log, log, logging!
Using the Analytics Engine API (which has a SQL interface), we can visualize the Instant Logs backend request rates for the top sessions and top data centers over the previous month. “Zooming in” to an interesting period is also really fast. We’ve designed Analytics Engine so that queries always respond within the window of interactivity (more on this later). This makes it well-suited for interactive debugging with a dashboard tool (in this case we’re using Grafana).
What we learned in closed beta
We received a lot of great feedback during the closed beta. Developers were excited about the SQL API, ease of integration with Workers, the ability to query data in Grafana (with more integrations in future), and our simple pricing model (free!). However, there were a number of things that we needed to fix before moving on to the open beta phase.
Developers were supportive of our choice to use SQL (the world’s language for data) as the interface for the Analytics Engine API. However, when developers used the Analytics Engine API, they found that the error messages were opaque and difficult to debug. For the open beta, we have rewritten the API from the ground-up to provide much improved error messaging.
Before: > SELECT column_that_does_not_exist FROM your_dataset FORMAT JSON Sorry, we were unable to evaluate your query
After: > SELECT column_that_does_not_exist FROM your_dataset FORMAT JSON cannot select unknown column: "column_that_does_not_exist"
In addition to understanding what went wrong, developers also wanted to understand what the API is capable of doing. For the open beta, we’ve written a comprehensive SQL reference for Analytics Engine. We also have a few “How To” guides, including information on how to hook up the API to Grafana.
ABR and Analytics Engine
Analytics Engine uses Cloudflare’s ABR technology to make queries fast. This means that every query is satisfied by a resolution of the data that matches the query. For example, if we are looking at data for the last month, we might use a lower resolution version of the Analytics Engine data than if we are looking at the last hour. The lower resolution data will provide the correct answer, but will respond within the window of interactivity. By using multiple, different resolutions of the same data, ABR provides consistent response times.
To account for the different resolutions of data, each event carries with it information about the resolution of data that the event comes from. This information is encoded in the _sample_interval column. For example, if an event comes from a resolution of the data which is 1% of the original data, its _sample_interval will be set to 100. To reconstruct the number of events in the original data, we can use the query:
SELECT sum(_sample_interval) AS count FROM dataset
For the open beta, we are exposing _sample_interval directly to developers. In the future, we’ll make it easier to work with this field by providing convenience functions which automatically take into account varying resolutions of the data. We also want to provide the ability to understand the confidence level of the estimates that these functions return.
Coming soon
This is just the beginning for Workers Analytics Engine. Internally, there has been high demand for the ability to define alerts based on the data captured by Analytics Engine. This is also something that we want developers to be able to do.
As in the closed beta, fields are accessed via names that have 1-based indexing (blob1, blob2, double1, double2, etc.). In the future, we will allow developers to attach names to fields, and these names will be available to use to retrieve data via the SQL API.
Something we want to provide is a rich UX in the Cloudflare dashboard (imagine something like Grafana in the Cloudflare dashboard). Ultimately, we don’t want developers to have to set up their own infrastructure for exploring data captured with Analytics Engine.
Conclusion
Try Workers Analytics Engine today! Please let us know if you have any ideas or more advanced use cases that aren’t supported. We’re discussing everything about the Analytics Engine in our discord channel too – join the conversation!
The Internet is a living organism. Technology changes, shifts in human behavior, social events, intentional disruptions, and other occurrences change the Internet in unpredictable ways, even to the trained eye.
Cloudflare Radar has long been the place to visit for accessing data and getting unique insights into how people and organizations are using the Internet across the globe, as well as those unpredictable changes to the Internet.
One of the most popular features on Radar has always been the “Most Popular Domains,” with both global and country-level perspectives. Domain usage signals provide a proxy for user behavior over time and are a good representation of what people are doing on the Internet.
Today, we’re going one step further and launching a new dataset called Radar Domain Rankings (Beta). Domain Rankings is based on aggregated 1.1.1.1 resolver data that is anonymized in accordance with our privacy commitments. The dataset aims to identify the top most popular domains based on how people use the Internet globally, without tracking individuals’ Internet use.
There are a few reasons why we’re doing this now. One is obviously to improve our Radar features with better data and incorporate new learnings. But also, ranking lists are used all over the Internet in all sorts of systems. One of the most used and trusted sources of domain rankings was Alexa, but that service was recently deprecated. We believe we are in a good position to provide a strong alternative.
Let’s see how we built it.
Differences in domain names
Before we dig into the data science behind Domain Rankings, it’s important to understand what a domain and DNS are. Internet domain names are human-readable dot-separated letters, digits and hyphens that correspond to a network resource, like a server or a website. However, your computer and applications don’t know what to do with a domain name; they need IP addresses to send and receive information over the network. DNS is the system that converts, or resolves, a domain name into an IP address. Think of it as an Internet phonebook for domain names.
Note: This is a simplification. A new standard called Internationalized Domain Names, or IDN, allows using Unicode strings in domain names.
Each dot defines a new hierarchy level, reading right to left. Domains can have multiple levels of depth. The highest level corresponds to country code top-level domains (ccTLDs) like .uk, .fr or .pt, or generic top-level domains (gTLDs) like .com, .org, or .net. These are normally assigned to and managed by either country-level entities or administrative organizations operating a registry.
Then there are the second-level domains like cloudflare.com or google.com. These are normally purchased and registered by individuals or organizations, which are then free to create and manage as many hostnames and hierarchy levels as they want.
Unfortunately, however, there are exceptions. For instance, many countries use second-level domain registration. One such example is the United Kingdom, where commercial domains can only be registered under the .co.uk hierarchy. That’s why Google in the UK isn’t google.uk, but rather google.co.uk.
But that’s not all. Some countries use 3rd level domain registrations. One example is Japan, which offers Regional Domain registration under cities like *.aisai.aichi.jp.
Projects like the Public Suffix List are a good starting point for understanding the variations involved, and how they affect validations and assumptions in other systems, such as cookies in web browsers.
Domain Rankings takes some of this nuance into account to inform the definition of our current ruleset:
We boil everything down to second-level domains, such as cloudflare.com or google.com.
However, if the second level is .edu, .com, .org, .gov, .net, .gov, .net, .co or .mil, then we use third-level domains.
We don’t distinguish between what we think is a website or an infrastructure system. A domain represents an Internet-available resource.
We will also semi-automate, curate and maintain a list of domains that map to popular platforms and services in the future. Example: fb.audio, fb.com, fb.watch, all map to a “facebook” platform.
Defining popularity
Definitions are important. We established what we consider a domain, but what does domain popularity mean exactly? Our research showed that the volume of traffic generated to a given domain doesn’t really work as a proxy for what we perceive as popular. Instead, Domain Rankings looks at the size of the population of users that look up a domain per unit of time. The more people who are interested in a domain, the more popular it is.
Sounds pretty straightforward, right? Well, it’s not. Our databases don’t have cookies, IPs, or other tracking artifacts, and we strip information that leads to identifying an individual from all of our data, by design.
The good news, however, is that we do a very good job at identifying automated traffic (for instance, you can read about Bot Management and how we use Machine Learning to detect bots in HTTP traffic in our blog) and we found we could develop a reasonable proxy for the unique users metric without sacrificing privacy (using other data points that we store for a limited period of time, like the ASN and high-level geolocation information of the request or the Cloudflare data center that served it).
Domain Rankings’ popularity metric is best described as the estimated relative size of the user population that accesses a domain over some period of time.
Our approach
We announced 1.1.1.1, our privacy-first consumer DNS resolver in 2018, and over the years it’s grown to become one of the top DNS services in the world. 1.1.1.1 is also part of a Research Agreement with APNIC in which we collaborate with them doing public research and DNS data insights.
The data we collect from it honors our privacy commitments, and is aggregated and stripped of any information that could lead to identifying or tracking users. We conducted a privacy examination by a Big Four accounting firm to determine whether the 1.1.1.1 resolver was effectively configured to meet our privacy commitments. You can read more about it in this blog, and the full report is publicly available on our compliance page.
Even without this personally identifying information, the resulting collection is vast and representative of Internet activity.
The 1.1.1.1 service is used in many ways. Regular (human) Internet users use it as their DNS resolver, either because they explicitly configured it in their devices, or their ISP did, or because they use WARP, or their browser uses 1.1.1.1 under the hood. However, servers and cloud infrastructure, IoT devices, home routers, and bots also use 1.1.1.1 extensively, which creates a lot of challenges for us when trying to identify human traffic.
We’ve been using DNS data to calculate the top and trending domains found on both the global and country pages on Cloudflare Radar. It’s been quite a learning experience trying to improve these lists. We have implemented aggregations, counts, filters, handling exceptions, and tried reducing noise, and yet they’re far from perfect. We felt that there had to be a better way.
We’ve spent the last six months building a variety of machine learning models to help us predict the rank of a domain.
Building the model was no easy feat. We experimented with multiple regression types first, to know exactly what the model was doing, and then more complex algorithms to get better performance. We played with different datasets, changed the population groups, variables (features), and combinations of variables, and used synthetic data.
After evaluation, one of our first conclusions was that building a model that could produce good results for the highest ranked domains and the long tail would be difficult.
The paper “A Long Way to the Top: Significance, Structure, and Stability of Internet Top Lists” describes this problem well. “The ranking of domains in the long tail should be based on significantly smaller and hence less reliable numbers.” Talking to our Research Team who submitted the collaboration paper “Toppling Top Lists: Evaluating the Accuracy of Popular Website Lists” to IMC 2022, got us to the same conclusion: the most popular domains (like google.com and facebook.com) have feature values disproportionally higher than the lower-ranked domains.
Therefore, we selected the two models that performed best. One model was trained on the population with the highest feature values, uses more features, and is used to generate the ordered top 100 domain list. A second model was trained on a more general group of domains, uses fewer features, and is used to get the top one million most popular domains, which we then divide into ranking buckets.
These buckets are ranked, but each bucket’s contents are intentionally unordered. For example, the second bucket of 10,000 most popular domains includes the set of domains that rank from 10,001 to 20,000, but give no further indication of the individual ranking of domains in that bucket. Given the size of some of these buckets and the window of time we use to populate them, they will inherently be exposed to more instability, too. We feel this is a good compromise between the described natural uncertainties of our long tail model and providing a reasonable idea of how close to the top a domain is.
Results
It’s important to mention there is no global view that can establish the perfect rank, and there’s no easy mechanism to confirm if a ranking is, ultimately, good. Data-driven results are always subject to some bias and skewing, related to the context of the organizations and systems that collect them. Sometimes all that can be done is to be transparent about potential sources of bias. The geographical distribution of customers and users, product characteristics, platform features, and behavioral diversity play an essential role in the final result. We are presenting the Cloudflare view, what we see.
Having said this, Cloudflare sits in a privileged position and handles a significant amount of Internet traffic. We have plenty of signals we can extract from our aggregated data, and believe that makes it possible to generate high quality domain rankings.
Domain Rankings are available today. You can head up to the Domains page and check it out:
Ordered list of the top 100 most popular domains globally and per country, based on our first model. Last 24 hours, updated daily.
Unordered global most popular domains datasets divided into buckets of the following sizes: 200, 500, 1,000, 2,000, 5,000, 10,000, 20,000, 50,000, 100,000, 200,000, 500,000, 1,000,000. Last 7 days, updated weekly.
Next steps
We will keep improving Domain Rankings and monitoring the results. Anyone can access them on Cloudflare Radar, read the results, and download the CSV files.
Feel free to explore our Domain Rankings and share feedback with us.
Cloudflare’s security architecture a few years ago was a classic “castle and moat” VPN architecture. Our employees would use our corporate VPN to connect to all the internal applications and servers to do their jobs. We enforced two-factor authentication with time-based one-time passcodes (TOTP), using an authenticator app like Google Authenticator or Authy when logging into the VPN but only a few internal applications had a second layer of auth. That architecture has a strong looking exterior, but the security model is weak. We recently detailed the mechanics of a phishing attack we prevented, which walks through how attackers can phish applications that are “secured” with second factor authentication methods like TOTP. Happily, we had long done away with TOTP and replaced it with hardware security keys and Cloudflare Access. This blog details how we did that.
The solution to the phishing problem is through a multi-factor authentication (MFA) protocol called FIDO2/WebAuthn. Today, all Cloudflare employees log in with FIDO2 as their secure multi-factor and authenticate to our systems using our own Zero Trust products. Our newer architecture is phish proof and allows us to more easily enforce the least privilege access control.
A little about the terminology of security keys and what we use
In 2018, we knew we wanted to migrate to phishing-resistant MFA. We had seen evilginx2 and the maturity around phishing push-based mobile authenticators, and TOTP. The only phishing-resistant MFA that withstood social engineering and credential stealing attacks were security keys that implement FIDO standards. FIDO-based MFA introduces new terminology, such as FIDO2, WebAuthn, hard(ware) keys, security keys, and specifically, the YubiKey (the name of a well-known manufacturer of hardware keys), which we will reference throughout this post.
CTAP1(U2F) and CTAP2 refers to the client to authenticator protocol which details how software or hardware devices interact with the platform performing the WebAuthn protocol.
FIDO2 is the collection of these two protocols being used for authentication. The distinctions aren’t important, but the nomenclature can be confusing.
The most important thing to know is all of these protocols and standards were developed to create open authentication protocols that are phishing-resistant and can be implemented with a hardware device. In software, they are implemented with Face ID, Touch ID, Windows Assistant, or similar. In hardware a YubiKey or other separate physical device is used for authentication with USB, Lightning, or NFC.
FIDO2 is phishing-resistant because it implements a challenge/response that is cryptographically secure, and the challenge protocol incorporates the specific website or domain the user is authenticating to. When logging in, the security key will produce a different response on example.net than when the user is legitimately trying to log in on example.com.
At Cloudflare, we’ve issued multiple types of security keys to our employees over the years, but we currently issue two different FIPS-validated security keys to all employees. The first key is a YubiKey 5 Nano or YubiKey 5C Nano that is intended to stay in a USB slot on our employee laptops at all times. The second is the YubiKey 5 NFC or YubiKey 5C NFC that works on desktops and on mobile either through NFC or USB-C.
In late 2018 we distributed security keys at a whole company event. We asked all employees to enroll their keys, authenticate with them, and ask questions about the devices during a short workshop. The program was a huge success, but there were still rough edges and applications that didn’t work with WebAuthn. We weren’t ready for full enforcement of security keys and needed some middle-ground solution while we worked through the issues.
The beginning: selective security key enforcement with Cloudflare Zero Trust
We have thousands of applications and servers we are responsible for maintaining, which were protected by our VPN. We started migrating all of these applications to our Zero Trust access proxy at the same time that we issued our employees their set of security keys.
Cloudflare Access allowed our employees to securely access sites that were once protected by the VPN. Each internal service would validate a signed credential to authenticate a user and ensure the user had signed in with our identity provider. Cloudflare Access was necessary for our rollout of security keys because it gave us a tool to selectively enforce the first few internal applications that would require authenticating with a security key.
We used Terraform when onboarding our applications to our Zero Trust products and this is the Cloudflare Access policy where we first enforced security keys. We set up Cloudflare Access to use OAuth2 when integrating with our identity provider and the identity provider informs Access about which type of second factor was used as part of the OAuth flow.
In our case, swk is a proof of possession of a security key. If someone logged in and didn’t use their security key they would be shown a helpful error message instructing them to log in again and press on their security key when prompted.
Selective enforcement instantly changed the trajectory of our security key rollout. We began enforcement on a single service on July 29, 2020, and authentication with security keys massively increased over the following two months. This step was critical to give our employees an opportunity to familiarize themselves with the new technology. A window of selective enforcement should be at least a month to account for people on vacation, but in hindsight it doesn’t need to be much longer than that.
What other security benefits did we get from moving our applications to use our Zero Trust products and off of our VPN? With legacy applications, or applications that don’t implement SAML, this migration was necessary for enforcement of role based access control and the principle of the least privilege. A VPN will authenticate your network traffic but all of your applications will have no idea who the network traffic belongs to. Our applications struggled to enforce multiple levels of permissions and each had to re-invent their own auth scheme.
When we onboarded to Cloudflare Access we created groups to enforce RBAC and tell our applications what permission level each person should have.
Here’s a site where only members of the ACL-CFA-CFDATA-argo-config-admin-svc group have access. It enforces that the employee used their security key when logging in, and no complicated OAuth or SAML integration was needed for this. We have over 600 internal sites using this same pattern and all of them enforce security keys.
The end of optional: the day Cloudflare dropped TOTP completely
In February 2021, our employees started to report social engineering attempts to our security team. They were receiving phone calls from someone claiming to be in our IT department, and we were alarmed. We decided to begin requiring security keys to be used for all authentication to prevent any employees from being victims of the social engineering attack.
After disabling all other forms of MFA (SMS, TOTP etc.), except for WebAuthn, we were officially FIDO2 only. “Soft token” (TOTP) isn’t perfectly at zero on this graph though. This is caused because those who lose their security keys or become locked out of their accounts need to go through a secure offline recovery process where logging in is facilitated through an alternate method. Best practice is to distribute multiple security keys for employees to allow for a back-up, in case this situation arises.
Now that all employees are using their YubiKeys for phishing-resistant MFA are we finished? Well, what about SSH and non-HTTP protocols? We wanted a single unified approach to identity and access management so bringing security keys to arbitrary other protocols was our next consideration.
Using security keys with SSH
To support bringing security keys to SSH connections we deployed Cloudflare Tunnel to all of our production infrastructure. Cloudflare Tunnel seamlessly integrates with Cloudflare Access regardless of the protocol transiting the tunnel, and running a tunnel requires the tunnel client cloudflared. This means that we could deploy the cloudflared binary to all of our infrastructure and create a tunnel to each machine, create Cloudflare Access policies where security keys are required, and ssh connections would start requiring security keys through Cloudflare Access.
In practice these steps are less intimidating than they sound and the Zero Trust developer docs have a fantastic tutorial on how to do this. Each of our servers have a configuration file required to start the tunnel. Systemd invokes cloudflared which uses this (or similar) configuration file when starting the tunnel.
When an operator needs to SSH into our infrastructure they use the ProxyCommand SSH directive to invoke cloudflared, authenticate using Cloudflare Access, and then forward the SSH connection through Cloudflare. Our employees’ SSH configurations have an entry that looks kind of like this, and can be generated with a helper command in cloudflared:
It’s worth noting that OpenSSH has supported FIDO2 since version 8.2, but we’ve found there are benefits to having a unified approach to access control where all access control lists are maintained in a single place.
What we’ve learned and how our experience can help you
There’s no question after the past few months that the future of authentication is FIDO2 and WebAuthn. In total this took us a few years, and we hope these learnings can prove helpful to other organizations who are looking to modernize with FIDO-based authentication.
If you’re interested in rolling out security keys at your organization, or you’re interested in Cloudflare’s Zero Trust products, reach out to [email protected]. Although we’re happy that our preventative efforts helped us resist the latest round of phishing and social engineering attacks, our security team is still growing to help prevent whatever comes next.
Cloudflare’s mission is to help build a better Internet. Pair that with our core belief that security is something that should be accessible to everyone and the outcome is a better and safer Internet for all. Previously, our FREE and PAYGO customers didn’t have the flexibility to give someone control of just part of their account, they had to give access to everything.
Starting today, role based access controls (RBAC), and all of our additional roles will be rolled out to users on every plan! Whether you are a small business or even a single user, you can ensure that you can add users only to parts of Cloudflare you deem appropriate.
Why should I limit access?
It is good practice with security in general to limit access to what a team member needs to do a job. Restricting access limits the overall threat surface if a given user was compromised, and ensures that you limit the surface that mistakes can be made.
If a malicious user was able to gain access to an account, but it only had read access, you’ll find yourself with less of a headache than someone who had administrative access, and could change how your site operates. Likewise, you can prevent users outside their role from accidentally making changes to critical features like firewall or DNS configuration.
What are roles?
Roles are a grouping of permissions that make sense together. At Cloudflare, this means grouping permissions together by access to a product suite.
Cloudflare is a critical piece of infrastructure for customers, and roles ensure that you can give your team the access they need, scoped to what they’ll do, and which products they interact with.
Once enabled for Role Based Access Controls, by going to “Manage Account” and “Members” in the left sidebar, you’ll have the following list of roles available, which each grant access to disparate subsets of the Cloudflare offering.
Role Name
Role Description
Administrator
Can access the full account, except for membership management and billing.
Administrator Read Only
Can access the full account in read-only mode.
Analytics
Can read Analytics.
Audit Logs Viewer
Can view Audit Logs.
Billing
Can edit the account’s billing profile and subscriptions.
Cache Purge
Can purge the edge cache.
Cloudflare Access
Can edit Cloudflare Access policies.
Cloudflare Gateway
Can edit Cloudflare Gateway and read Access.
Cloudflare Images
Can edit Cloudflare Images assets
Cloudflare Stream
Can edit Cloudflare Stream media.
Cloudflare Workers Admin
Can edit Cloudflare Workers.
Cloudflare Zero Trust
Can edit Cloudflare Zero Trust.
Cloudflare Zero Trust PII
Can access Cloudflare Zero Trust PII.
Cloudflare Zero Trust Read Only
Can access Cloudflare for Zero Trust read only mode.
Cloudflare Zero Trust Reporting
Can access Cloudflare for Zero Trust reporting data.
DNS
Can edit DNS records.
Firewall
Can edit WAF, IP Firewall, and Zone Lockdown settings.
HTTP Applications
Can view and edit HTTP Applications
HTTP Applications Read
Can view HTTP Applications
Load Balancer
Can edit Load Balancers, Pools, Origins, and Health Checks.
Log Share
Can edit Log Share configuration.
Log Share Reader
Can read Enterprise Log Share.
Magic Network Monitoring
Can view and edit MNM configuration
Magic Network Monitoring Admin
Can view, edit, create, and delete MNM configuration
Magic Network Monitoring Read-Only
Can view MNM configuration
Network Services Read (Magic)
Grants read access to network configurations for Magic services.
Network Services Write (Magic)
Grants write access to network configurations for Magic services.
SSL/TLS, Caching, Performance, Page Rules, and Customization
Can edit most Cloudflare settings except for DNS and Firewall.
Trust and Safety
Can view and request reviews for blocks
Zaraz Admin
Can edit Zaraz configuration.
Zaraz Readonly
Can read Zaraz configuration.
If you find yourself on a team that is growing, you may want to grant firewall and DNS access to a delegated network admin, billing access to your bookkeeper, and Workers access to your developer.
Each of these roles provides specific access to a portion of your Cloudflare account, scoping them to the appropriate set of products. Even Super Administrator is now available, allowing you to provide this access to somebody without handing over your password and 2FA.
How to use our roles
The first step to using RBAC is an analysis and review of the duties and tasks of your team. When a team member primarily interacts with a specific part of the Cloudflare offering, start off by giving them only access to that part(s). Our roles are built in a way that allows multiple to be assigned to a single user, such that when they require more access, you can grant them an additional role.
Rollout
At this point in time, we will be rolling out RBAC over the next few weeks. When the roles become available in your account, head over to our documentation to learn about each of the roles in detail.
The collective thoughts of the interwebz
Manage Consent
To provide the best experiences, we use technologies like cookies to store and/or access device information. Consenting to these technologies will allow us to process data such as browsing behavior or unique IDs on this site. Not consenting or withdrawing consent, may adversely affect certain features and functions.
Functional
Always active
The technical storage or access is strictly necessary for the legitimate purpose of enabling the use of a specific service explicitly requested by the subscriber or user, or for the sole purpose of carrying out the transmission of a communication over an electronic communications network.
Preferences
The technical storage or access is necessary for the legitimate purpose of storing preferences that are not requested by the subscriber or user.
Statistics
The technical storage or access that is used exclusively for statistical purposes.The technical storage or access that is used exclusively for anonymous statistical purposes. Without a subpoena, voluntary compliance on the part of your Internet Service Provider, or additional records from a third party, information stored or retrieved for this purpose alone cannot usually be used to identify you.
Marketing
The technical storage or access is required to create user profiles to send advertising, or to track the user on a website or across several websites for similar marketing purposes.