Tag Archives: contributed

Introducing bidirectional event integrations with Salesforce and Amazon EventBridge

Post Syndicated from James Beswick original https://aws.amazon.com/blogs/compute/introducing-bidirectional-event-integrations-with-salesforce-and-amazon-eventbridge/

This post is written by Alseny Diallo, Prototype Solutions Architect and Rohan Mehta, Associate Cloud Application Architect.

AWS now supports Salesforce as a partner event source for Amazon EventBridge, allowing you to send Salesforce events to AWS. You can also configure Salesforce with EventBridge API Destinations and send EventBridge events to Salesforce. These integrations enable you to act on changes to your Salesforce data in real-time and build custom applications with EventBridge and over 100 built-in sources and targets.

In this blog post, you learn how to set up a bidirectional integration between Salesforce and EventBridge and use cases for working with Salesforce events. You see an example application for interacting with Salesforce support case events with automated workflows for detecting sentiment with AWS AI/ML services and enriching support cases with customer order data.

Integration overview

Salesforce is a customer relationship management (CRM) platform that gives companies a single, shared view of customers across their marketing, sales, commerce, and service departments. Salesforce Event Relays for AWS enable bidirectional event flows between Salesforce and AWS through EventBridge.

Amazon EventBridge is a serverless event bus that makes it easier to build event-driven applications at scale using events generated from your applications, integrated software as a service (SaaS) applications, and AWS services. EventBridge partner event source integrations enable customers to receive events from over 30 SaaS applications and ingest them into their AWS applications.

Salesforce as a partner event source for EventBridge makes it easier to build event-driven applications that span customers’ data in Salesforce and applications running on AWS. Customers can send events from Salesforce to EventBridge and vice versa without having to write custom code or manage an integration.

EventBridge joins Amazon AppFlow as a way to integrate Salesforce with AWS. The Salesforce Amazon AppFlow integration is well suited for use cases that require ingesting large volumes of data, like a daily scheduled data transfer sending Salesforce records into an Amazon Redshift data warehouse or an Amazon S3 data lake. The Salesforce EventBridge integration is a good fit for real-time processing of changes to individual Salesforce records.

Use cases

Customers can act on new or modified Salesforce records through integrations with a variety of EventBridge targets, including AWS Lambda, AWS Step Functions, and API Gateway. The integration can enable use cases across industries that must act on customer events in real time.

  • Retailers can automatically unify their Salesforce data with AWS data sources. When a new customer support case is created in Salesforce, enrich the support case with recent order data from that customer retrieved from an orders database running on AWS.
  • Media and entertainment providers can augment their omnichannel experiences with AWS AI/ML services to increase customer engagement. When a new customer account is created in Salesforce, use Amazon Personalize and Amazon Simple Email Service to send a welcome email with personalized media recommendations.
  • Insurers can automate form processing workflows. When a new insurance claim form PDF is uploaded to Salesforce, extract the submitted information with Amazon Textract and orchestrate processing the claim information with AWS Step Functions.

Solution overview

The example application shows how the integration can enhance customer support experiences by unifying support tickets with customer order data, detecting customer sentiment, and automating support case workflows.

Reference architecture

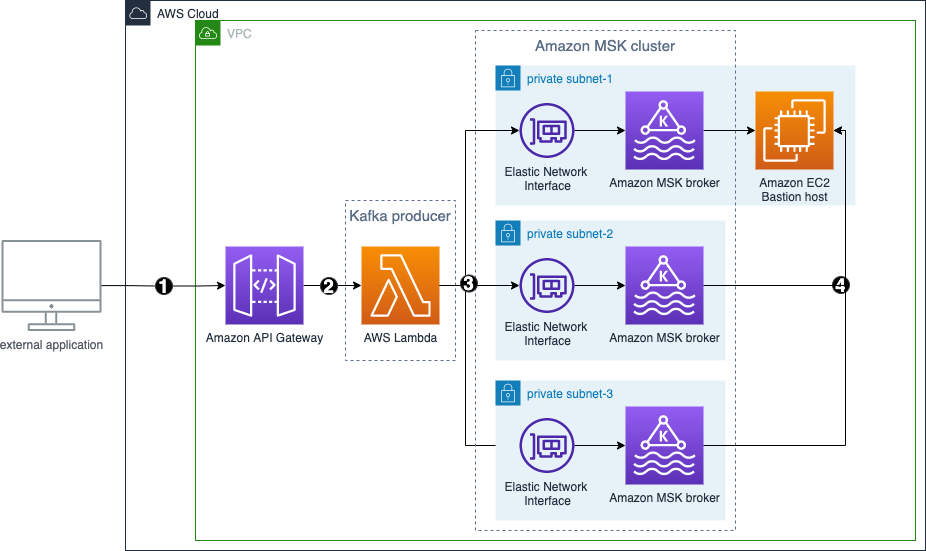
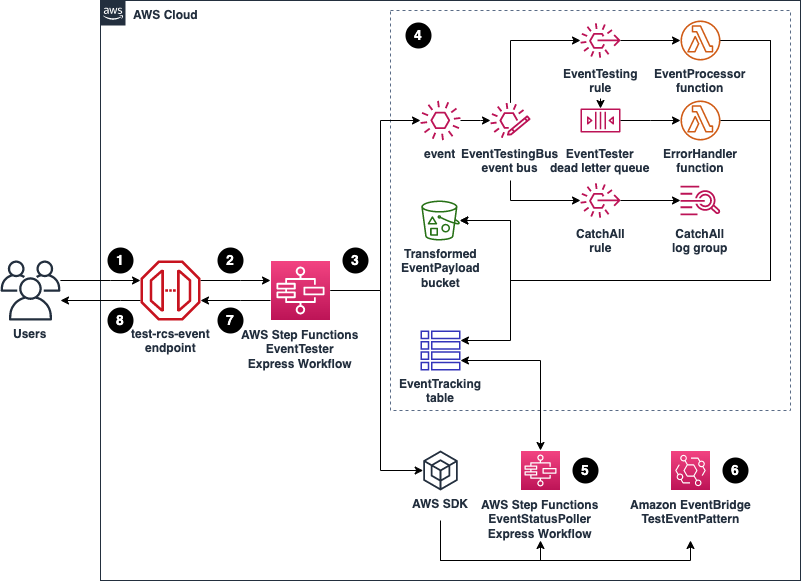
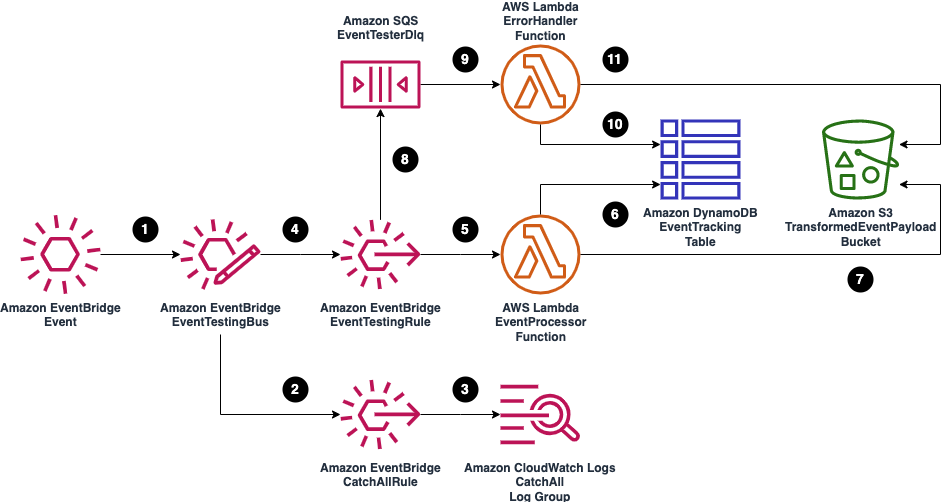
  1. A new case is created in Salesforce and an event is sent to an EventBridge partner event bus.
  2. If the event matches the EventBridge rule, the rule sends the event to both the Enrich Case and Case Processor Workflows in parallel.
  3. The Enrich Case Workflow uses the Customer ID in the event payload to query the Orders table for the customer’s recent order. If this step fails, the event is sent to an Amazon SQS dead letter queue.
  4. The Enrich Case Workflow publishes a new event with the customer’s recent order to an EventBridge custom event bus.
  5. The Case Processor Workflow performs sentiment analysis on the support case content and sends a customized text message to the customer. See the diagram below for details on the workflow.
  6. The Case Processor Workflow publishes a new event with the sentiment analysis results to the custom event bus.
  7. EventBridge rules match the events published to the associated rules: CaseProcessorEventRule and EnrichCaseAppEventRule.
  8. These rules send the events to EventBridge API Destinations. API Destinations sends the events to Salesforce HTTP endpoints to create two Salesforce Platform Events.
  9. Salesforce data is updated with the two Platform Events:
    1. The support case record is updated with the customer’s recent order details and the support case sentiment.
    2. If the support case sentiment is negative, a task is created for an agent to follow up with the customer.

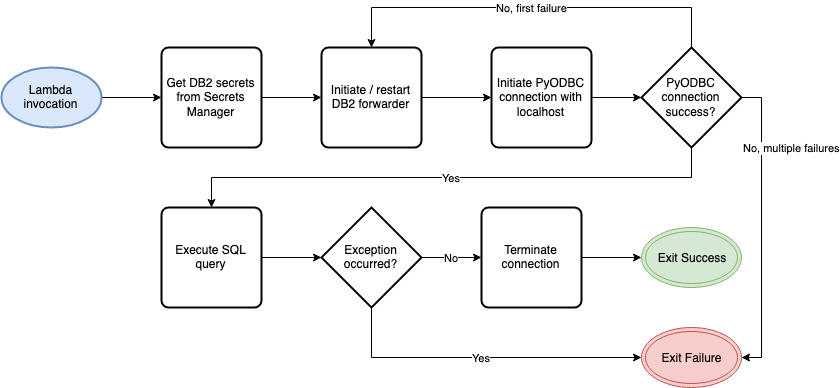
The Case Processor workflow uses Step Functions to process the Salesforce events.

Case processor workflow

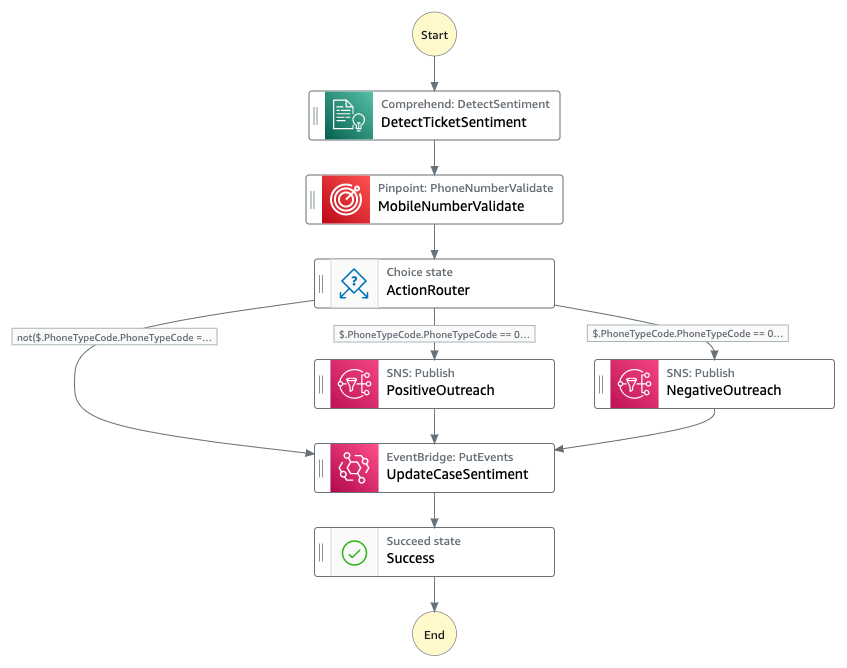
  1. Detect the sentiment of the customer feedback using Amazon Comprehend. This is positive, negative, or neutral.
  2. Check if the customer phone number is a mobile number and can receive SMS using Amazon Pinpoint’s mobile number validation endpoint.
  3. If the customer did not provide a mobile number, bypass the SMS steps and put an event with the detected sentiment onto the custom event bus.
  4. If the customer provided a mobile number, send them an SMS with the appropriate message based on the sentiment of their case.
    1. If sentiment is positive or neutral, the message is thanking the customer for their feedback.
    2. If the sentiment is negative, the message offers additional support.
  5. The state machine then puts an event with the sentiment analysis results onto the custom event bus.

Prerequisites

Environment setup

  1. Follow the instructions here to set up your Salesforce Event Relay. Once you have an event bus created with the partner event source, proceed to step 2.
  2. Copy the ARN of the event bus.
  3. Create a Salesforce Connected App. This is used for the API Destinations configuration to send updates back into Salesforce.
  4. You can create a new user within Salesforce with appropriate API permissions to update records. The user name and password is used by the API Destinations configuration.
  5. The example provided by Salesforce uses a Platform Event called “Carbon Comparison”. For this sample app, you create three custom platform events with the following configurations:
    1. Customer Support Case (Salesforce to AWS):
      Customer support case
    2. Processed Support Case (AWS to Salesforce):
      Processed Support case
    3. Enrich Case (AWS to Salesforce):
      Enrich case example
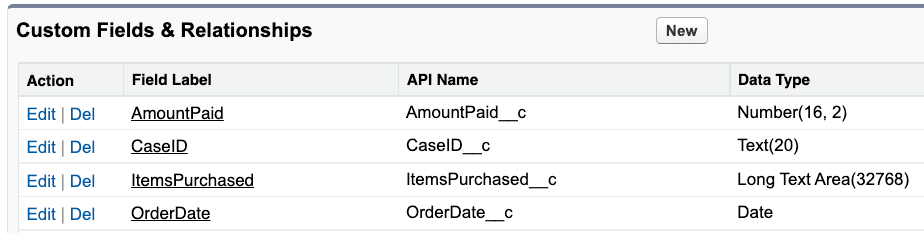
  6. This example application assumes that a custom Sentiment field is added to the Salesforce Case record type. See this link for how to create custom fields in Salesforce.
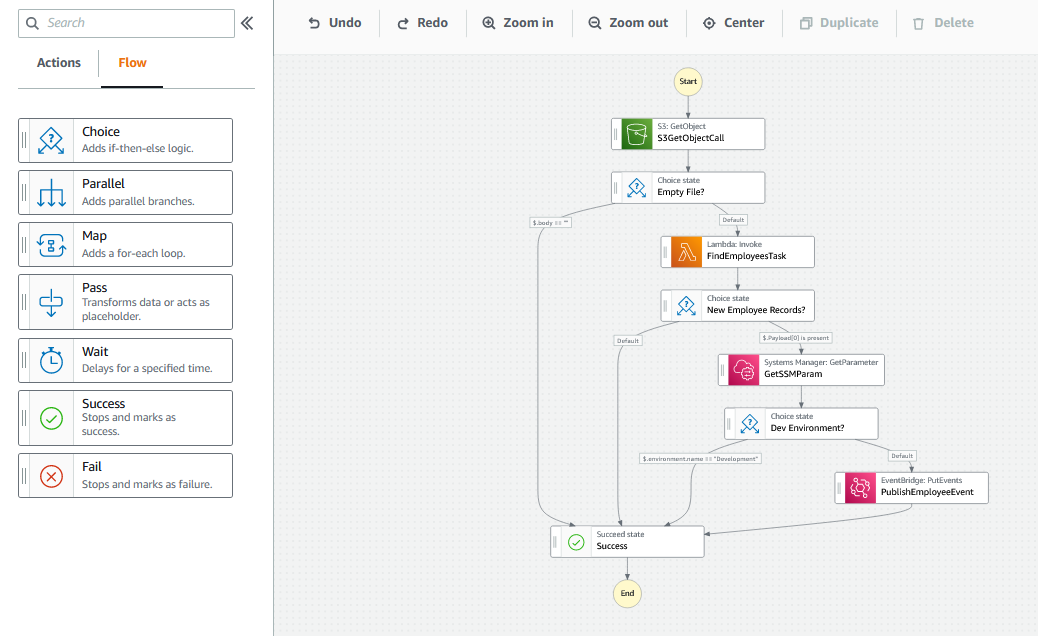
  7. The example application uses Salesforce Flows to trigger outbound platform events and handle inbound platform events. See this link for how to use Salesforce Flows to build event driven applications on Salesforce.
  8. Clone the AWS SAM template here.
    sam build
    sam deploy —guided

    For the parameter prompts, enter:

  • SalesforceOauthClientId and SalesforceOauthClientSecret: Use the values created with the Connected App in step 3.
  • SalesforceUsername and SalesforcePassword: Use the values created for the new user in step 4.
  • SalesforceOauthUrl: Salesforce URL for OAuth authentication
  • SalesforceCaseProcessorEndpointUrl: Salesforce URL for creating a new Processed Support Case Platform Event object, in this case: https://MyDomainName.my.salesforce.com/services/data/v54.0/sobjects/Processed_Support_Case__e
  • SFEnrichCaseEndpointUrl: Salesforce URL for creating a new Enrich Case Platform Event object, in this case: https://MyDomainName.my.salesforce.com/services/data/v54.0/sobjects/Enrich_Case__e
  • SalesforcePartnerEventBusArn: Use the value from step 2.
  • SalesforcePartnerEventPattern: The detail-type value should be the API name of the custom platform event, in thiscase: {“detail-type”: [“Customer_Support_Case__e”]}

Conclusion

This blog shows how to act on changes to your Salesforce data in real-time using the new Salesforce partner event source integration with EventBridge. The example demonstrated how your Salesforce data can be processed and enriched with custom AWS applications and updates sent back to Salesforce using EventBridge API Destinations.

To learn more about EventBridge partner event sources and API Destinations, see the EventBridge Developer Guide. For more serverless resources, visit Serverless Land.

Estimating cost for Amazon SQS message processing using AWS Lambda

Post Syndicated from James Beswick original https://aws.amazon.com/blogs/compute/estimating-cost-for-amazon-sqs-message-processing-using-aws-lambda/

This post was written by Sabha Parameswaran, Senior Solutions Architect.

AWS Lambda enables fully managed asynchronous messaging processing through integration with Amazon SQS. This blog post helps estimate the cost and performance benefits when using Lambda to handle millions of messages per day by using a simulated setup.

Overview

Lambda supports asynchronous handling of messages using SQS integration as an event source and can scale for handling millions of messages per day. Customers often ask about the cost of implementing a Lambda-based messaging solution.

There are multiple variables like Lambda function runtime, individual message size, batch size for consuming from SQS, processing latency per message (depending on the backend services invoked), and function memory size settings. These can determine the overall performance and associated cost of a Lambda-based messaging solution.

This post provides cost estimation using these variables, along with guidance around optimization. The estimates focus on consuming from standard queues and not FIFO queues.

SQS event source

The Lambda event source mapping supports integration for SQS. Lambda users specify the SQS queue to consume messages. Lambda internally polls the queue and invokes the function synchronously with an event containing the queue messages.

The configuration controls in Lambda for consuming messages from an SQS queue are:

  • Batch size: The maximum number of records that can be batched as one event delivered to the consuming Lambda function. The maximum batch size is 10,000 records.
  • Batch window: The maximum time (in seconds) to gather records as a single batch. A larger batch window size means waiting longer for a larger SQS batch of messages before passing to the Lambda function.
  • SQS content filtering: Selecting only the messages that match a defined content criteria. This can reduce cost by removing unwanted or irrelevant messages. Lambda now supports content filtering (for SQS, Kinesis, and DynamoDB) and developers can use the filtering capabilities to avoid processing SQS messages, reducing unnecessary invocations and associated cost.

Lambda sends as many records in a single batch as allowed by the batch size, as long as it’s earlier than the batch window value, and smaller than the maximum payload size of 6 MB. Having large batch sizes means that a single Lambda invocation can handle more messages rather than multiple Lambda invocations to handle smaller batches (which translates to setting higher concurrency limits).

The cost and time to process might vary based on the actual number of messages in the batch. A larger batch size can imply longer processing but requires lower concurrency (number of concurrent Lambda invocations).

Lambda configurations

Lambda function costs are calculated based on memory used and time spent (in GB-second) in execution of a function. Aside from the event source configuration, there are several other Lambda function configurations that impact cost and performance:

  • Processor type: Lambda functions provide options to choose between x86 and Arm/Graviton processors. The newer Arm/Graviton processors can yield a higher performance and lower cost compared to x86 based on the workload. Compare the options and run tests before selecting.
  • Memory allotted: This is directly proportional to the CPU allotted to the function and translates to price for each invocation. Higher memory can lead to faster execution but also higher cost. The optimal memory required for a small batch versus large batch can vary based on the workload, size of incoming messages, transformations, requirements to store intermediate, or final results. Optimal tuning of the memory configurations is key to ensuring right cost versus performance. See the AWS Lambda Power Tuning documentation for more details on identifying the optimal memory versus performance for a fixed batch size and then extrapolate the memory settings for larger batch sizes.
  • Lambda function runtime: Some runtimes have a smaller memory footprint and may be more cost effective than others that are memory intensive. Choosing the runtime affects the memory allocation.
  • Function performance: This can be considered as TPS – total number of requests completed per second. Or conversely measured as time to complete one request. The performance – time to finish a function execution can be dependent on the event containing the batch of messages; bigger batches mean more time to complete an event and complexity and dependencies (performance of the backend that needs to be invoked) of the message processing. The calculations are based on the assumption that the Lambda function and related dependencies have been optimized and tuned to scale linearly with various batch sizes and number of invocations.
  • Concurrency: Number of concurrent Lambda function executions. Concurrency is important for scaling of Lambda functions, allowing users to delegate the capacity planning and scaling to thee Lambda service.

The higher the concurrency, the more workloads it can process in a shorter time, allowing better performance, but this does not change the overall cost. Concurrency is not equivalent to TPS: it is more of a scaling factor in overall TPS. For example, a workload comprised of a set of messages takes 20 seconds to complete. 100 workloads would mean 2000 seconds to complete. With a concurrency of 10, it takes 200 seconds. With a concurrency of 100, the time drops to 20 seconds as each of the 100 workloads are handled concurrently. But each function essentially runs for the same duration and memory, regardless of concurrency. So the cost remains the same, as it is measured in GB-hours (memory multiplied by time). But the performance view differs. So, the cost estimations do not consider the concurrency settings of Lambda functions as the workloads have to be processed either sequential or concurrently.

Assumptions

The cost estimation tool presented helps users estimate monthly Lambda function costs for processing SQS standard queue messages based on the following assumptions:

  • The system has reached steady state and has millions of messages available to be consumed per day in standard queues. The number of messages per day remains constant throughout the entire month.
  • Since it’s a steady state, there are no associated Lambda function cold start delays.
  • All SQS messages that need to be processed successfully have already met the filter criteria. Also, no poison messages that have to be re-tried repeatedly. Messages are not going to be rejected, unacknowledged, or reprocessed.
  • The workload scales linearly in performance versus batch size. All the associated dependencies can scale linearly and a batch of N messages should take the same time as N x a single message with a fixed overhead per function invocation irrespective of the batch size. For example, a function’s overhead is 50 ms irrespective of the batch size. Processing a single message takes 20 ms. So a batch of 20 messages should take 490 ms (50 + 20*20) versus a batch of 5 messages takes 150 ms (50 + 5*20).
  • Function memory increases in steps, based on increasing the batch size. For example, 100 messages uses a 256 MB of baseline memory. Every additional 500 messages require additional 128 MB of memory. A sliding window of memory to batch size:
Batch size Memory
1–100 256 MB
100–600 384 MB
600–1100 512 MB
1100–1600 640 MB

Lambda uses SQS APIs internally to poll and dequeue the messages. The costs for the polling and dequeue operations using SQS APIs are not included as part of the estimations. The internal SQS dequeue portion is outside the control of the Lambda developer and the cost estimates only cover the message processing using Lambda. Also, the tool does not consider any reprocessing or duplicate processing of messages due to exceptions or errors that can vary the cost.

Using the cost estimation tool

The estimator tool is a Python-based command line program that takes in an input properties file that specifies the various input parameters to come up with Lambda function cost versus performance estimations for various batch sizes, messages per day, etc. The tool does take into account the eligible monthly free tier for Lambda function executions.

Pre-requisites: Running the tool requires Python 3.9 and installation of Plotly package (5.7.+) or creating and using Docker images.

To run the tool:

  1. Clone the repo:
    git clone https://github.com/aws-samples/aws-lambda-sqs-cost-estimator
  2. Install the tool:
    cd aws-lambda-sqs-cost-estimator/code
    pip3 install -r requirements.txt
  3. Edit the input.prop file and run the tool to generate cost estimations:
    python3 LambdaPlotly.py

This shows the cost estimates on a local browser instance. Running the code as a Docker image is also supported. Refer to the GitHub repo for additional instructions.

  1. Clone the repo and build the Docker container:
    git clone https://github.com/aws-samples/aws-lambda-sqs-cost-estimator
    cd aws-lambda-sqs-cost-estimator/code
    docker build -t lambda-dash .
  2. Edit the input.prop file and run the tool to generate cost estimations:
    docker run -it -v `pwd`:/app -p 8080:8080 lambda-dash
  3. Navigate to http://0.0.0.0:8080/app in a browser to view the generated cost estimate plot.

There are various input parameters for the cost estimations specified inside the input.prop file. Tune the input parameters as needed:

Parameter Description Sample value (units not included)
base_lambda_memory_mb Baseline memory for the Lambda function (in MB) 128
warm_latency_ms Invocation time for Lambda handler method (going with warm start) irrespective of batch size in the incoming event payload in ms 20
process_per_message_ms Time to process a single message (linearly scales with number of messages per batch in event payload) in ms 10
max_batch_size Maximum batch size per event payload processed by a single Lambda instance 1000 (max is 10000)
batch_memory_overhead_mb Additional memory for processing increments in batch size (in MB) 128
batch_increment Increments of batch size for increased memory 300

The following is sample input.prop file content:

base_lambda_memory_mb=128

# Total process time for N messages in batch = warm_latency_ms + (process_per_message_ms * N)

# Time spent in function initialization/warm-up

warm_latency_ms=20

# Time spent for processing each message in milliseconds

process_per_message_ms=10

# Max batch size

max_batch_size=1000

# Additional lambda memory X mb required for managing/parsing/processing N additional messages processed when using variable batch sizes

#batch_memory_overhead_mb=X

#batch_increment=N

batch_memory_overhead_mb=128

batch_increment=300

The tool generates a page with plot graphs and tables with 3 sections:

Cost example

There is an accompanying interactive legend showing cost and batch size. The top section shows a graph of cost versus message volumes versus batch size:

cost versus message volumes vs Batch size

The second section shows the actual cost variation for different batch sizes for 10 million messages:

actual cost variation for different batch sizes for 10 million messages.

The third section shows the memory and time required to process with different batch sizes:

memory and time required to process with different batch sizes

The various control input parameters used for graph generation are shown at the bottom of the page.

Double-clicking on a specific batch size or line on the right-hand legend displays that specific plot with its pricing details.

specific plot to be displayed with its pricing details

You can modify the input parameters with different settings for memory, batch sizes, memory for increased batches and rerun the program to create different cost estimations. You can also export the generated graphs as PNG image files for reference.

Conclusion

You can use Lambda functions to handle fully managed asynchronous processing of SQS messages. Estimating the cost and optimal setup depends on leveraging the various configurations of SQS and Lambda functions. The cost estimator tool presented in this blog should help you understand these configurations and their impact on the overall cost and performance of the Lambda function-based messaging solutions.

For more serverless learning resources, visit Serverless Land.

Introducing tiered pricing for AWS Lambda

Post Syndicated from Sam Dengler original https://aws.amazon.com/blogs/compute/introducing-tiered-pricing-for-aws-lambda/

This blog post is written by Heeki Park, Principal Solutions Architect, Serverless.

AWS Lambda charges for on-demand function invocations based on two primary parameters: invocation requests and compute duration, measured in GB-seconds. If you configure additional ephemeral storage for your function, Lambda also charges for ephemeral storage duration, measured in GB-seconds.

AWS continues to find ways to help customers reduce cost for running on Lambda. In February 2020, AWS announced that AWS Lambda would participate in Compute Savings Plans. In December 2020, AWS announced 1 ms billing granularity to help customers save on cost for their Lambda function invocations. With that pricing change, customers whose function duration is less than 100 ms pay less for those function invocations. In September 2021, AWS announced Graviton2 support for running your function on ARM and potential improvements for price performance for compute.

Today, AWS introduces tiered pricing for Lambda. With tiered pricing, customers who run large workloads on Lambda can automatically save on their monthly costs. Tiered pricing is based on compute duration measured in GB-seconds. The tiered pricing breaks down as follows:

Compute duration (GB-seconds) Architecture New tiered discount
0 – 6 billion x86 Same as today
6 – 15 billion x86 10%
Anything over 15 billion x86 20%
0 – 7.5 billion arm64 Same as today
7.5 – 18.75 billion arm64 10%
Anything over 18.75 billion arm64 20%

The Lambda pricing page lists the pricing for all Regions and architectures.

Tiered pricing discount example

Consider a financial services provider who provides on-demand stock portfolio analysis. The customers pay per portfolio analyzed and find the service valuable for providing them insight into the performance of those assets. The application is built using Lambda, runs on x86, and is optimized to use 2048 MB (2 GB) of memory with an average function duration of 60 seconds. This current month resulted in 75 million function invocations.

Without tiered pricing, this workload costs the following:

Monthly request charges: 75M * $0.20/million = $15.00
Monthly compute duration (seconds): 75M * 60 seconds = 4.5B seconds
Monthly compute (GB-seconds): 4.5B seconds * 2 GB = 9B GB-seconds
Monthly compute duration charges: 9B GB-s * $0.0000166667/GB-s = $150,000.30
Total monthly charges = request charges + compute duration charges = $15.00 + $150,000.30 = $150,015.30

With tiered pricing, the portion of compute duration that exceeds 6B GB-seconds receives an automatic discount as follows:

Monthly request charges: 75M * $0.20/million = $15.00
Monthly compute duration (seconds): 75M * 60 seconds = 4.5B seconds
Monthly compute (GB-seconds): 4.5B seconds * 2GB = 9B GB-seconds
Monthly compute duration charge (tier 1): 6B Gb-s * $0.0000166667/GB-s = $100,000.20
Monthly compute duration charge (tier 2): 3B Gb-s * $0.0000150000/GB-s = $45,000.09
Monthly compute duration charges (post-discount): $100,000.20 + $45,000.09 = $145,000.29.
Total monthly charges = request charges + compute duration charges = $15.00 + $145,000.29 = $145,015.29 ($5,000.01 cost savings)

Tiered pricing discount example with increased growth

The service is successful and usage in the following month quadruples, resulting in 300 million function invocations.

Without tiered pricing, this workload costs the following:

Monthly request charges: 300M * $0.20/million = $60.00
Monthly compute duration (seconds): 300M * 60 seconds = 18B seconds
Monthly compute (GB-seconds): 18B seconds * 2GB = 36B GB-seconds
Monthly compute duration charges: 36B GB-s * $0.0000166667/GB-s = $600,001.20
Total monthly charges = request charges + compute duration charges = $60.00 + $600,001.20 = $600,061.20

With tiered pricing, the compute duration portion now also exceeds 15B GB-seconds and receives an automatic discount as follows:

Monthly request charges: 300M * $0.20/million = $60.00
Monthly compute duration (seconds): 300M * 60 seconds = 18B seconds
Monthly compute (GB-seconds): 18B seconds * 2GB = 36B GB-seconds
Monthly compute duration charge (tier 1): 6B GB-s * $0.0000166667/GB-s = $100,000.02
Monthly compute duration charge (tier 2): 9B GB-s * $0.0000150000/GB-s = $135,000.27
Monthly compute duration charge (tier 3): 21B GB-s * $0.0000133333/GB-s = $280,000.56
Monthly compute duration charges (post-discount): $100,000.02 + $135,000.27 + $280,000.56 = $515,001.03.
Total monthly charges = request charges + compute duration charges = $60.00 + $515,001.03 = $515,061.03 ($85,000.17 cost savings)

Tiered pricing discount example with decreased growth

Alternatively, customers used the service less frequently than expected. As a result, usage in the following month is one-third the prior month’s usage, resulting in 25 million function invocations.

Without tiered pricing, this workload costs the following:

Monthly request charges: 25M * $0.20/million = $5.00
Monthly compute duration (seconds): 25M * 60 seconds = 1.5B seconds
Monthly compute (GB-seconds): 1.5B seconds * 2GB = 3B GB-seconds
Monthly compute duration charges: 3B GB-s * $0.0000166667/GB-s = $50,000.10
Total monthly charges = request charges + compute duration charges = $5.00 + $50,000.10 = $50,005.10

When considering tiered pricing, the compute duration portion is under 6B GB-s and is priced without any additional pricing discounts. In this case, the financial services provider did not grow the business as expected or take advantage of tiered pricing. However, they did take advantage of Lambda’s pay-as-you-go model, paying only for the compute that this application used.

Summary and other considerations

Tiered pricing for Lambda applies to the compute duration portion of your on-demand function invocations. It is specific to the architecture (x86 or arm64) and is bucketed by the Region. Refer to the previous table for the specific pricing tiers.

For example, consider a function that is using x86 architecture, deployed in both us-east-1 and us-west-2. Usage in us-east-1 is bucketed and priced separately from usage in us-west-2. If there is a function using arm64 architecture in us-east-1 and us-west-2, that function is also in a separate bucket.

The cost for invocation requests remains the same. The discount applies only to on-demand compute duration and does not apply to provisioned concurrency. Customers who also purchase Compute Savings Plans (CSPs) can take advantage of both, where Lambda applies tiered pricing first, followed by CSPs.

Conclusion

With tiered pricing for Lambda, you can save on the compute duration portion of your monthly Lambda bills. This allows you to architect, build, and run large-scale applications on Lambda and take advantage of these tiered prices automatically.

For more information on tiered pricing for Lambda, see: https://aws.amazon.com/lambda/pricing/.

Using certificate-based authentication for iOS applications with Amazon SNS

Post Syndicated from Sam Dengler original https://aws.amazon.com/blogs/compute/using-certificate-based-authentication-for-ios-applications-with-amazon-sns/

This blog post is written by Yashlin Naidoo, Arnav Thakur, Kim Read, Guilherme Silva.

Amazon SNS enables you to send notifications to a mobile push endpoint using a platform application endpoint by dispatching the notification on your application’s behalf. Push notifications for iOS apps are sent using Apple Push Notification Service (APNs).

To send push notifications using SNS for APNS certificate-based authentication, you must provide a set of credentials for connecting to the Apple Push Notification Service (see prerequisites for push). SNS supports using certificate-based authentication (.p12), in addition to the new token-based authentication (.p8).

Certificate-based authentication uses a provider certificate to establish a secure connection between your provider and APNs. These certificates are tied to a single application and are used to send notifications to this application. This approach can be useful when you haven’t migrated to the new token-based authentication.

For new applications, we recommend using token-based authentication as it provides improved security. It removes the need for yearly renewal of the certificates and can also be shared amongst multiple applications. To learn about how to use token-based authentication, visit Token-Based authentication for iOS applications with Amazon SNS in the AWS Compute Blog.

This blog shows step-by-step instructions on how to build an iOS application. You learn how to create a new certificate from your Apple developer account, and set up a platform application and endpoint in the SNS console. Next, you will learn how to test your application by sending a push notification via SNS to your device. Finally, you view the push notification delivered to your device.

Setting up your iOS application

This section will go over:

  • Creating an iOS application.
  • Creating a .p12 certificate to upload to SNS.

Prerequisites:

Creating an iOS application

  1. Create a new XCode project. Select iOS as the platform.

    New XCode project

    New XCode project

  2. Select your Apple Developer Account team and organization identifier.

    Select your Apple Developer Account team

    Select your Apple Developer Account team

  3. In your project, go to Signing & Capabilities. Under signing, ensure that “Automatically manage signing” is checked and your team is selected.

    Signing & Capabilities

    Signing & Capabilities

  4. To add the push notification capability to your application, select “+” and select Push Notifications.
    Add push notification capability

    Add push notification capability

    This step creates resources on your Apple Developer Account (the App ID and adds Push notification capability to it). You can also verify this in your Apple Developer Account.

  5. Add the following code to AppDelegate.swift:
        import UIKit
        import UserNotifications
    
        @main
        class AppDelegate: UIResponder, UIApplicationDelegate {
    
        func application(_ application: UIApplication, didFinishLaunchingWithOptions launchOptions: [UIApplication.LaunchOptionsKey: Any]?) -> Bool {
        // Override point for customization after application launch
    
        //Call to register for push notifications when launched
        registerForPushNotifications()
    
        return true
        }
    
        // MARK: UISceneSession Lifecycle
    
        func application(_ application: UIApplication, configurationForConnecting connectingSceneSession: UISceneSession, options: UIScene.ConnectionOptions) -> UISceneConfiguration {
        // Called when a new scene session is being created.
        // Use this method to select a configuration to create the new scene with.
        return UISceneConfiguration(name: "Default Configuration", sessionRole: connectingSceneSession.role)
        }
    
        func application(_ application: UIApplication, didDiscardSceneSessions sceneSessions: Set<UISceneSession>) {
        // Called when the user discards a scene session.
        // If any sessions were discarded while the application was not running, this will be called shortly after application:didFinishLaunchingWithOptions.
        // Use this method to release any resources that were specific to the discarded scenes, as they will not return.
        }
    
        func getNotificationSettings() {
        UNUserNotificationCenter.current().getNotificationSettings { settings in
        print("Notification settings: \(settings)")
    
        guard settings.authorizationStatus == .authorized else { return }
        DispatchQueue.main.async {
        UIApplication.shared.registerForRemoteNotifications()
        }
    
        }
        }
    
        func registerForPushNotifications() {
        //1 this handles all notification-related activities in the app including push notifications
        UNUserNotificationCenter.current()
    
        //2 this requests authorization to send the types of notifications specifies in the options
        .requestAuthorization(
        options: [.alert, .sound, .badge]) { [weak self] granted, _ in
        print("Permission granted: \(granted)")
        guard granted else { return }
        self?.getNotificationSettings()
        }
    
        }
    
        func application(
        _ application: UIApplication,
        didRegisterForRemoteNotificationsWithDeviceToken deviceToken: Data
        ) {
        let tokenParts = deviceToken.map { data in String(format: "%02.2hhx", data) }
        let token = tokenParts.joined()
        print("Device Token: \(token)")
        }
    
        func application(
        _ application: UIApplication,
        didFailToRegisterForRemoteNotificationsWithError error: Error
        ) {
        print("Failed to register: \(error)")
        }
    
        }
  6. Build and run the application on an iPhone. Note that the push notification feature does not work with a simulator.
  7. On your phone, select “Allow” when prompted to allow push notifications.

    Allow push notifications

    Allow push notifications

  8. The debugger prints “Permission granted: true” if successful and returns the Device Token.

    Device token

    Device token

You have now configured an iOS application that can receive push notifications. Next, use the application to test sending push notifications with SNS using certificate-based authentication.

Creating a .p12 certificate to upload to SNS

After completing the previous step, you need:

  • An app identifier
  • A certificate signing request (CSR)
  • An SSL certificate

Create an identifier

  1. Log in to your Apple Developer Account.
  2. Choose Certificates, Identifiers & Profiles.
  3. In the Identifiers section, choose the Add button (+).
  4. In the Register a new identifier section, choose App IDs and select Continue.
  5. In the Select a type section, choose App, and select Continue.
  6. For Description, type the application description.
  7. For Bundle ID, use the Bundle ID assigned to your application. You can find this ID under Signing & Capabilities of your application in XCode (see step 3 under “Creating an application”).
  8. Under Capabilities, choose Push Notifications.
  9. Select Continue. In the Confirm your App ID panel, check that all values were entered correctly. The identifier should match your app ID and bundle ID.
  10. Select Register to register the new app ID.

Create a certificate signing request (CSR)

  1. Open Keychain Access located in /Applications/Utilities or search for it on Finder.
  2. Once opened, choose the tab Keychain Access Tab (next to the Apple icon). Navigate to Certificate Assistant and choose Request a Certificate from a Certificate Authority.
  3. Enter the Username, Email Address, Common Name and leave CA Email Address empty.
  4. Choose Saved to disk and choose Continue.

Create a certificate

  1. Log in to your Apple Developer Account.
  2. Choose Certificates, Identifiers & Profiles.
  3. In the Certificate section, select Create new certificate.
  4. Under services, choose your certificate: Apple Push Notification service SSL (Sandbox)/Apple Push Notification service SSL (Sandbox & Production).
  5. Keep Platform as iOS and choose App ID (Identifier) created previously.
  6. Upload the Certificate Signing Request created in the previous step and Download your certificate.

Create .p12 certificate to upload to SNS

  1. Once your certificate.cer file is downloaded (for example, “aps_development.cer”), open it to show in keychain access. Find Apple Development iOS Push Services: (Your Identifier Name/App ID Name) and ensure that the file is placed in the “Login” folder.
  2. Right-click and choose Export as file format .p12 and choose Save. Optionally, set a password.

Creating a new platform application using APNs certificate-based authentication

Prerequisites

To implement APNs certificate-based authentication from SNS, you must have:

  • An Apple Developer Account
  • An iOS mobile application

For creating a new SNS Platform Application that is used to store Push Notification Platform credentials, configurations and related configurations:

  1. Navigate to the SNS Console. Expand the Mobile menu and choose Create platform application.
  2. For the Application name field, enter an application name such as “myfirstiOSapp”. For Push Notification Platform, select Apple iOS/ VoIP/ macOS.

    Create platform application

    Create platform application

  3. Under the Apple Credentials section:
    1. If your application is in development, select the radio button for Used for development in sandbox. If your application is in production, uncheck Used for development in sandbox.
    2. For Push service, choose iOS and for Authentication method, choose Certificate.
    3. Under Certificate, select Choose file to upload the .p12 certificate file.
    4. If you configured a password while creating the certificate, enter this in the Certificate Password field.
    5. Choose Load Credentials from File to extract the Certificate and private key components.
  4. Event Notifications, Delivery Status Logging – Optional: Refer to the guide for enabling Delivery Status logs and the guide to set up Mobile Event related Notifications. More on this step can also be found in the best practices guide.

    Enter Apple credentials

    Enter Apple credentials

  5. Choose Create Platform Application. This creates a certificate-based authentication APNs Platform Application for iOS.

    Create platform application

    Create platform application

Creating a new platform endpoint using APNs token-based authentication

To send Push Notifications using SNS, a platform endpoint resource is created to store the destination address of the corresponding iOS application that is associated with the SNS platform application.

A destination address of a user’s device with the iOS application installed is identified by an unique device token. It is obtained once the app has registered successfully with APNs to receive push notifications. The details of the device token captured in the Platform Endpoint resource along with the configurations in the SNS Platform application are used in conjunction by the service to deliver a push notification message.

In the following steps, you create a new platform endpoint for a destination device that has the iOS application installed and is capable of receiving push notifications.

  1. Open your Platform Application. Choose Create Application Endpoint.

    Application endpoints list

    Application endpoints list

  2. Locate the Device token in the application logs of the iOS app provisioned earlier. Enter it in the Device Token Field.
  3. To store any additional arbitrary data for the endpoint, you can include in the User data field and choose Create application endpoint.

    Create application endpoint

    Create application endpoint

  4. Choose Create application endpoint and the details are shown on the console.

    Application endpoint detail

    Application endpoint detail

Testing a push notification from your device

In this section, you test sending a push notification to your device.

  1. From the SNS console, navigate to your platform endpoint and choose Publish message.
  2. Enter a message to send. This example uses a custom payload that allows you to provide additional APNs headers.

    Publish message

    Publish message

  3. Choose Publish message.
  4. The push notification is delivered to your device.

    Notification

    Notification

Conclusion

Developers send mobile push notifications for APNs certificate-based authentication by using a .p12 certificate to authenticate an Apple device endpoint. Certificate-based authentication ensures a secure connection through TLS (Transport Layer Security). The provider (SNS) initiates the request to APNs and validation from the provider and APNS is required to complete the secure connection.

Certificates expire annually and must be renewed to ensure that SNS can continue to deliver to the endpoint. In this post, you learn how to create an iOS application for APNs certificate-based authentication and integrate it with SNS to send push notifications to your device using a .p12 certificate to authenticate your application with the mobile endpoint.

To learn more about APNs certificate-based authentication with Amazon SNS, visit the Amazon SNS Developer Guide.

For more serverless learning resources, visit Serverless Land.

Using AWS Lambda to run external transactions on Db2 for IBM i

Post Syndicated from James Beswick original https://aws.amazon.com/blogs/compute/using-aws-lambda-to-run-external-transactions-on-db2-for-ibm-i/

This post is written by Basil Lin, Cloud Application Architect, and Jud Neer, Delivery Practice Manager.

Db2 for IBM i (Db2) is a relational database management system that can pose connectivity challenges with cloud environments because of a lack of native support. However, by using Docker on Amazon ECR and AWS Lambda container images, you can transfer data between the two environments with a serverless architecture.

While mainframe modernization solutions are helping customers migrate from on-premises technologies to agile cloud solutions, a complete migration is not always immediately possible. AWS offers broad modernization support from rehosting to refactoring, and platform augmentation is a common scenario for customers getting started on their cloud journey.

Db2 is a common database in on-premises workloads. One common use case of platform augmentation is maintaining Db2 as the existing system-of-record while rehosting applications in AWS. To ensure Db2 data consistency, a change data capture (CDC) process must be able to capture any database changes as SQL transactions. A mechanism then runs these transactions on the existing Db2 database.

While AWS provides CDC tools for multiple services, converting and running these changes for Db2 requires proprietary IBM drivers. Conventionally, you can implement this by hosting a stream-processing application on a server. However, this approach relies on traditional server architecture. This may be less efficient, incur higher overhead, and may not meet availability requirements.

To avoid these issues, you can build this transaction mechanism using a serverless architecture. This blog post’s approach uses ECR and Lambda to externalize and run serverless, on-demand transactions on Db2 for IBM i databases.

Overview

The solution you deploy relies on a Lambda container image to run SQL queries on Db2. While you provide your own Lambda invocation methods and queries, this solution includes the drivers and connection code required to interface with Db2. The following architecture diagram shows this generic solution with no application-specific triggers:

Architecture diagram

This solution builds a Docker image containerized with Db2 interfacing code. The code consists of a Lambda handler to run the specified database transactions, a base class that helps create database Python functions via Open Database Connectivity (ODBC), and finally a forwarder class to establish encrypted connections with the target database.

Deployment scripts create the Docker image, deploy the image to ECR, and create a Lambda function from the image. Lambda then runs your queries on your target Db2 database. This solution does not include the Lambda invocation trigger, the Amazon VPC, and the AWS Direct Connect connection as part of the deployment, but these components may be necessary depending on your use case. The README in the sample repository shows the complete deployment prerequisites.

To interface with Db2, the Lambda function establishes an ODBC session using a proprietary IBM driver. This enables the use of high-level ODBC functions to manipulate the Db2 database management system.

Even with the proprietary driver, ODBC does not properly support TLS encryption with Db2. During testing, enabling the TLS encryption option can cause issues with database connectivity. To work around this limitation, a forwarding package captures all ODBC traffic and forwards packets using TLS encryption to the database. The forwarder opens a local socket listener on port 8471 for unencrypted loopback connections. Once the Lambda function initializes an unencrypted ODBC connection locally, the forwarding package then captures, encrypts, and forwards all ODBC calls to the target Db2 database. This method allows Lambda to form encrypted connections with your target database while still using ODBC to control transactions.

With secure connectivity in place, you can invoke the Lambda function. The function starts the forwarder and retrieves Db2 access credentials from AWS Secrets Manager, as shown in the following diagram. The function then attempts an ODBC loopback connection to send transactions to the forwarder.

Flow process

If the connection is successful, the Lambda function runs the queries, and the forwarder sends the queries to the target Db2. However, if the connection fails, it makes a second connection attempt. The second attempt consists of both restarting the forwarder module and the loopback connection. If the second attempt fails again, the function errors out.

After the transactions complete, a cleanup process runs and the function exits with a success status, unless an exception occurs during the function invocation. If an exception arises during the transaction, the function exits with a failure status. This is an important consideration when building retry mechanisms. You must review Lambda exit statuses to prevent default AWS retry mechanisms from causing unintended invocations.

To simplify deployment, the solution contains scripts you can use. Once you provide AWS credentials, the deployment script deploys a base set of infrastructure into AWS, including the ECR repository for the Docker images and the Secrets Manager secret for the Db2 configuration details.

The deployment script also asks for Db2 configuration details. After you finish entering these, the script sends the information to AWS to configure the previously deployed secret.

Once the secret configuration is complete, the script then builds and pushes a base Docker image to the deployed ECR repository. This base image contains a few basic Python prerequisite libraries necessary for the final code, and also the RPM driver for interfacing with Db2 via ODBC.

Finally, the script builds the solution infrastructure and deploys it into the AWS Cloud. Using the base image in ECR, it creates a Lambda function from a new Docker container image containing the SQL queries and the ODBC transaction code. After deployment, the solution is ready for testing and customization for your use case.

Prerequisites

Before deployment, you must have the following:

  1. The cloned code repository locally.
  2. A local environment configured for deployment.
  3. Amazon VPC and networking configured with Db2 access.

You can find detailed prerequisites and associated instructions in the README file.

Deploying the solution

The deployment creates an ECR repository, a Secrets Manager secret, a Lambda function built from a base container image uploaded to the ECR repo, and associated elastic network interfaces (ENIs) for VPC access.

Because of the complexity of the deployment, a combination of Bash and Python scripts automates the process by automatically deploying infrastructure templates, building and pushing container images, and prompting for input where required. Refer to the README included in the repository for detailed instructions.

To deploy:

  1. Ensure you have met the prerequisites.
  2. Open the README file in the repository and follow the deployment instructions
    1. Configure your local AWS CLI environment.
    2. Configure the project environment variables file.
    3. Run the deployment scripts.
  3. Test connectivity by invoking the deployed Lambda function
  4. Change infrastructure and code for specific queries and use cases

Cleanup

To avoid incurring additional charges, ensure that you delete unused resources. The README contains detailed instructions. You may either manually delete the resources provisioned through the AWS Management Console, or use the automated cleanup script in the repository. The deletion of resources may take up to 45 minutes to complete because of the ENIs created for Lambda in your VPC.

Conclusion

In this blog post, you learn how to run external transactions securely on Db2 for IBM i databases using a combination of Amazon ECR and AWS Lambda. By using Docker to package the driver, forwarder, and custom queries, you can execute transactions from Lambda, allowing modern architectures to interface directly with Db2 workloads. Get started by cloning the GitHub repository and following the deployment instructions.

For more serverless learning resources, visit Serverless Land.

Migrating mainframe JCL jobs to serverless using AWS Step Functions

Post Syndicated from James Beswick original https://aws.amazon.com/blogs/compute/migrating-mainframe-jcl-jobs-to-serverless-using-aws-step-functions/

This post is written by Raghuveer Reddy Talakola, Sr. Modernization Architect, Sanjay Rao, Sr. Mainframe Consultant, and Aneel Murari, Solution Architect.

JCL (Job Control Language) is a scripting language used to program batch jobs on mainframe systems. A JCL can contain one to many job control statements. It can be challenging to understand the condition code parameter checking syntax, which determines the order and conditions under which these statements are run.

If a JCL fails midway through execution, mainframe programmers have no visual aids to help them understand the flow of the JCL. They must examine text-based execution logs to manually correlate condition codes in the logs with condition check rules attached to JCL statements to understand the root cause of failure.

This post explains how AWS Step Functions can make it easier to maintain batch jobs migrated from mainframes to AWS.

Overview

The sample application shows how to use AWS Step Functions to address typical challenges when maintaining a batch workflow built using JCL. The sample business case validates a feed of new employee information against an existing employee database. It identifies discrepancies between the feed and the database and sends out notifications if it finds any.

The mainframe JCL supplied with this blog has seven steps. Each step applies condition code rules to check codes emitted by previous steps to decide if it must run. The Step Functions example achieves the same result. Using its graphical user interface, you can develop each step as an independent task, and link them visually. This makes it easier to understand how to decouple, reorder, or scale tasks if needed.

Visual tools for workflow analysis

A JCL controls its flow by using condition code checking or/and using IF-ELSE statements. A JCL condition code check defines the rules under which its associated JCL step will not run. Developers may code compound rules, double negatives, or triple or more negative conditions into the flow.

Example of condition code check in JCL What it means
//STEPTS2 EXEC PGM=XYZ,COND=(4,GT,STEPTST) Do not execute PGM XYZ if previous step STEPTST ended execution with a code greater than 4
//STEPTS3 EXEC PGM=XYZ,COND=EVEN Execute PGM XYZ even if all the previous steps failed

//STEPTS5 EXEC PGM=XYZ,

COND=((6,EQ),(8,GT))

Do not execute PGM XYZ if any of the preceding steps exited with return code 6 or a code greater than 8

The sample JCL illustrates the complexity of setting up a batch workflow using JCL condition code:

  1. The first step of this JCL deletes files from a previous run. If it ends with code 0, the second JCL step extracts employee data from Db2 using a COBOL program and ends with a return code 0 if it is successful or 4 if no records were found.
  2. The next step coded with condition check (4,LT), runs if all preceding steps ended with codes less than 5. It checks the external extract and emits a condition code of 8 if the external extract is empty.
  3. The next step compares the 2 files if the extract validation step produced a return code of zero.
  4. If this comparison step detects some records that are missing in the employee Db2 database, it creates a file with missing records. If that file is empty, it sets a return code of 8, which ends the program. If the mismatch file has data, it copies the mismatch file over to another system for processing.

With Step Functions, you define the same workflow more easily by using the Amazon States Language (ASL). The Step Functions console provided a graphical representation of that state machine to visualize the application logic using a drag and drop interface.

Step Functions Workflow Studio

  1. The first task fetches the employee file from Amazon S3. It does not need a cleanup task as S3 supports versioning.
  2. If the fetched file is not empty, control passes to the step that runs business logic code inside an AWS Lambda function to validate the employee feed.
  3. The workflow retrieves an environment variable from an external parameter store. This step shows how environment parameters can be externalized in a Step Functions workflow.
  4. It publishes an event to Amazon EventBridge to trigger the external processing needed if discrepancies are found and conditions are met.
  5. The final step is a Succeeded state that marks flow completion.

The following image compares the sample JCL that is converted to a Step Functions workflow:

Sample JCL and Step Functions

Using a graphical interface instead of job control statements

In JCL, you define a batch process with a series of job control statements, which run a program, utility, or a nested procedure in a text editor. There is no visual aid. If a batch process becomes complex, it’s harder to understand the dependencies between the steps.

Step Functions makes it simpler for you to set up tasks, which are the equivalents of steps in JCL. It provides you with a graphical user interface (GUI) that enables you to configure and drag-and-drop steps into a state machine.

Decoupling tasks instead of deleting and commenting of code

To disable or change a step in a JCL, you examine the condition code logic associated with all preceding and succeeding steps of the job. Any mistake in editing these codes can lead to unintended consequences.

With Step Functions, removing or changing a step can be done using the visual editor or by updating the ASL code. This can help improve your agility and make it easier to implement change.

Using Parameter Store instead of editing parameters in code

To make JCL behave differently based on parameters, you must edit dynamic variables known as JCL Symbols inside the JCL or in control cards to affect the behavior change. The following JCL code sample shows a parameter called REGN coded to value DEV. At runtime, this REGN parameter is substituted by DEV in every statement that references this parameter. To reuse this JCL in production, you can change the value assigned to REGN to say PROD.

//   SET REGN=DEV
//    -------
//******************************************************************
//*  RUN  Db2 COBOL Batch Program 
//******************************************************************
//EXTRDB2 EXEC PGM=IKJEFT01,COND=(0,NE)                                
//    -------
//FILEOUT  DD DSN=&REGN..AWS.APG.STEPDB2,                             
//******************************************************************
//*  RUN  VSAM COBOL Batch Program 
//******************************************************************
//    -------
//FILE2    DD DSN=&REGN..AWS.APG.STEPVSM,                             

In Step Functions, configuration parameters can be decoupled from state machine code by managing them in an external data source such as the Amazon DynamoDB, AWS Systems Manager Parameter Store. In the Step Functions workflow, the following step demonstrates retrieving a configuration from Parameter Store and using it to perform branching logic:

Workflow example

Independent scaling of steps versus splitting and cloning JCLs

When a JCL takes a long time to run, mainframe programmers split the job into multiple jobs or steps. Each job is a replica addressing different ranges of data.

With Step Functions, you can run a step or a group of steps concurrently by using a parallel state or map state, without creating multiple jobs that do the same thing. This can help make maintenance easier.

Improved observability and automated retry

If a JCL fails, there are no visual aids to help debug the errors. On the mainframe, you must log into the mainframe and run through several screens of text on SDSF (System Display and Search Facility) to find the cause of the failure.

Step Functions provide visual information on failures, automated retry capabilities, and native integration with AWS services. This can make it easier to understand and recover from failed jobs compared with reading through lengthy logs.

JCL example

Workflow visualization

Benefits for developers

Step Functions provides the following improvements over jobs written in JCL or migrated from JCL.

  • Visual analysis: Step Functions provide a graphical console that shows the status of each task in a visual presentation that developers and support staff can understand and debug more easily than a failed JCL.
  • Decoupling: You can update each component in the workflow independently, unlike in a JCL, where changing a step requires redeployment of the entire batch job to production.
  • Low code: Step Functions are defined with minimal code. The workflow editor can be used to drag and drop different steps and visually edit the workflows.
  • Independent scaling of steps: Step Functions is a serverless solution, and each step can scale independently. This opens up the possibility of scaling up resources for steps that are resource-intensive.
  • Automated retry capabilities: You can configure Step Functions to retry steps and recover from failures. This is much simpler than coding restart conditions in the JCL.
  • Improved logging and visibility: Step Functions can integrate with observability tools like Amazon CloudWatch and AWS X-Ray.

Conclusion

This conversion example shows how Step Functions can help you rewrite complex batch processes written in JCL to serverless workflows. It also shows how such a conversion provides maintenance and monitoring features that make it easier to simplify and scale these batch processes.

To learn more, download the sample JCL and Step Functions workflow from the GitHub repository. To learn more about our AWS Mainframe migration and modernization services, go here.

For more serverless learning resources, visit Serverless Land.

Scaling AWS Lambda permissions with Attribute-Based Access Control (ABAC)

Post Syndicated from Julian Wood original https://aws.amazon.com/blogs/compute/scaling-aws-lambda-permissions-with-attribute-based-access-control-abac/

This blog post is written by Chris McPeek, Principal Solutions Architect.

AWS Lambda now supports attribute-based access control (ABAC), allowing you to control access to Lambda functions within AWS Identity and Access Management (IAM) using tags. With ABAC, you can scale an access control strategy by setting granular permissions with tags without requiring permissions updates for every new user or resource as your organization scales.

This blog post shows how to use tags for conditional access to Lambda resources. You can control access to Lambda resources using ABAC by using one or more tags within IAM policy conditions. This can help you scale permissions in rapidly growing environments. To learn more about ABAC, see What is ABAC for AWS, and AWS Services that work with IAM.

Each tag in AWS is a label comprising a user-defined key and value. Customers often use tags with Lambda functions to define keys such as cost center, environment, project, and teams, along with values that map to these keys. This helps with discovery and cost allocation, especially in accounts that may have many Lambda functions. AWS best practices for tagging are included in Tagging AWS resources.

You can now use these same tags, or create new ones, and use them to grant conditional IAM access to Lambda functions more easily. As projects start and finish, employees move to different teams, and applications grow, maintaining access to resources can become cumbersome. ABAC helps developers and security administrators work together to maintain least privilege access to their resources more effectively by using the same tags on IAM roles and Lambda functions. Security administrators can allow or deny access to Lambda API actions when the IAM role tags match the tags on a Lambda function, ensuring least privilege. As developers add additional Lambda functions to the project, they simply apply the same tag when they create a new Lambda function, which grants the same security credentials.

ABAC in Lambda

Using ABAC with Lambda is similar to developing ABAC policies when working with other services. To illustrate how to use ABAC with Lambda, consider a scenario where two new developers join existing projects called Project Falcon and Project Eagle. Project Falcon uses ABAC for authorization using the tag key project-name and value falcon. Project Eagle uses the tag key project-name and value eagle.

Projects Falcon and Eagle tags

Projects Falcon and Eagle tags

The two new developers need access to the Lambda console. The security administrator creates the following policy to allow the developers to list the existing functions that are available using ListFunction. The GetAccountSettings permission allows them to retrieve Lambda-specific information about their account.

{
"Version": "2012-10-17",
"Statement": [
    {
    "Sid": "AllResourcesLambdaNoTags",
    "Effect": "Allow",
    "Action": [
        "lambda:ListFunctions",
        "lambda:GetAccountSettings"
    ],
    "Resource": "*"
    }
]
}

Condition key mappings

The developers then need access to Lambda actions that are part of their projects. The Lambda actions are API calls such as InvokeFunction or PutFunctionConcurrency (see the following table). IAM condition keys are then used to refine the conditions under which an IAM policy statement applies.

Lambda supports the existing global context key:

  • "aws:PrincipalTag/${TagKey}": Control what the IAM principal (the person making the request) is allowed to do based on the tags that are attached to their IAM user or role.

As part of ABAC support, Lambda now supports three additional condition keys:

  • "aws:ResourceTag/${TagKey}": Control access based on the tags that are attached to Lambda functions.
  • "aws:RequestTag/${TagKey}": Require tags to be present in a request, such as when creating a new function.
  • "aws:TagKeys": Control whether specific tag keys can be used in a request.

For more details on these condition context keys, see AWS global condition context keys.

When using condition keys in IAM policies, each Lambda API action supports different tagging condition keys. The following table maps each condition key to its Lambda actions.

Condition keys supported Description Lambda actions
aws:ResourceTag/${TagKey} Set this tag value to allow or deny user actions on resources with specific tags.
lambda:AddPermission
lambda:CreateAlias
lambda:CreateFunctionUrlConfig
lambda:DeleteAlias
lambda:DeleteFunction
lambda:DeleteFunctionCodeSigningConfig
lambda:DeleteFunctionConcurrency
lambda:DeleteFunctionEventInvokeConfig
lambda:DeleteFunctionUrlConfig
lambda:DeleteProvisionedConcurrencyConfig
lambda:DisableReplication
lambda:EnableReplication
lambda:GetAlias
lambda:GetFunction
lambda:GetFunctionCodeSigningConfig
lambda:GetFunctionConcurrency
lambda:GetFunctionConfiguration
lambda:GetFunctionEventInvokeConfig
lambda:GetFunctionUrlConfig
lambda:GetPolicy
lambda:GetProvisionedConcurrencyConfig
lambda:InvokeFunction
lambda:InvokeFunctionUrl
lambda:ListAliases
lambda:ListFunctionEventInvokeConfigs
lambda:ListFunctionUrlConfigs
lambda:ListProvisionedConcurrencyConfigs
lambda:ListTags
lambda:ListVersionsByFunction
lambda:PublishVersion
lambda:PutFunctionCodeSigningConfig
lambda:PutFunctionConcurrency
lambda:PutFunctionEventInvokeConfig
lambda:PutProvisionedConcurrencyConfig
lambda:RemovePermission
lambda:UpdateAlias
lambda:UpdateFunctionCode
lambda:UpdateFunctionConfiguration
lambda:UpdateFunctionEventInvokeConfig
lambda:UpdateFunctionUrlConfig

aws:ResourceTag/${TagKey}
aws:RequestTag/${TagKey}

aws:TagKeys
Set this tag value to allow or deny user requests to create a Lambda function. lambda:CreateFunction
aws:ResourceTag/${TagKey}
aws:RequestTag/${TagKey}

aws:TagKeys
Set this tag value to allow or deny user requests to add or update tags. lambda:TagResource
aws:ResourceTag/${TagKey}
aws:TagKeys
Set this tag value to allow or deny user requests to remove tags. lambda:UntagResource

Security administrators create conditions that only permit the action if the tag matches between the role and the Lambda function.
In this example, the policy grants access to all Lambda function API calls when a project-name tag exists and matches on both the developer’s IAM role and the Lambda function.

{
"Version": "2012-10-17",
"Statement": [
    {
    "Sid": "AllActionsLambdaSameProject",
    "Effect": "Allow",
    "Action": [
        "lambda:InvokeFunction",
        "lambda:UpdateFunctionConfiguration",
        "lambda:CreateAlias",
        "lambda:DeleteAlias",
        "lambda:DeleteFunction",
        "lambda:DeleteFunctionConcurrency", 
        "lambda:GetAlias",
        "lambda:GetFunction",
        "lambda:GetFunctionConfiguration",
        "lambda:GetPolicy",
        "lambda:ListAliases", 
        "lambda:ListVersionsByFunction",
        "lambda:PublishVersion",
        "lambda:PutFunctionConcurrency",
        "lambda:UpdateAlias",
        "lambda:UpdateFunctionCode"
    ],
    "Resource": "arn:aws:lambda:*:*:function:*",
    "Condition": {
        "StringEquals": {
        "aws:ResourceTag/project-name": "${aws:PrincipalTag/project-name}"
        }
    }
    }
]
}

In this policy, Resource is wild-carded as "*" for all Lambda functions. The condition limits access to only resources that have the same project-name key and value, without having to list each individual Amazon Resource Name (ARN).

The security administrator creates an IAM role for each developer’s project, such as falcon-developer-role or eagle-developer-role. Since the policy references both the function tags and the IAM role tags, she can reuse the previous policy and apply it to both of the project roles. Each role should have the tag key project-name with the value set to the project, such as falcon or eagle. The following shows the tags for Project Falcon:

Tags for Project Falcon

Tags for Project Falcon

The developers now have access to the existing Lambda functions in their respective projects. The developer for Project Falcon needs to create additional Lambda functions for only their project. Since the project-name tag also authorizes who can access the function, the developer should not be able to create a function without the correct tags. To enforce this, the security administrator applies a new policy to the developer’s role using the RequestTag condition key to specify that a project-name tag exists:

{
"Version": "2012-10-17",
"Statement": [
    {
    "Sid": "AllowLambdaTagOnCreate",
    "Effect": "Allow",
    "Action": [
        "lambda:CreateFunction",
        “lambda:TagResource”
    ]
    "Resource": "arn:aws:lambda:*:*:function:*",
    "Condition": {
        "StringEquals": {,
            “aws:RequestTag/project-name”: “${aws:PrincipalTag/project-name}”
        },
        "ForAllValues:StringEquals": {
            "aws:TagKeys": [
                 “project-name”
            ]
        }
    }
    }
]
}

To create the functions, the developer must add the key project-name and value falcon to the tags. Without the tag, the developer cannot create the function.

Project Falcon tags

Project Falcon tags

Because Project Falcon is using ABAC, by tagging the Lambda functions during creation, they did not need to engage the security administrator to add additional ARNs to the IAM policy. This provides flexibility to the developers to support their projects. This also helps scale the security administrators’ function by no longer needing to coordinate which resources need to be added to IAM policies to maintain least privilege access.

The project must then add a manager who requires read access to projects as long as they are also in the organization labeled birds and cost-center : it.

Organization and Cost Center tags

Organization and Cost Center tags

The security administrator creates a new IAM policy called manager-policy with the following statements:

{
"Version": "2012-10-17",
"Statement": [
    {
    "Sid": "AllActionsLambdaManager",
    "Effect": "Allow",
    "Action": [
        "lambda:GetAlias",
        "lambda:GetFunction",
        "lambda:GetFunctionConfiguration",
        "lambda:GetPolicy",
        "lambda:GetPolicy",
        "lambda:ListAliases", 
        "lambda:ListVersionsByFunction"
    ],
    "Resource": "arn:aws:lambda:*:*:function:*",
    "Condition": {
        "StringEquals": {
            “aws:ResourceTag/organization”: “${aws:PrincipalTag/organization}”,
            “aws:ResourceTag/cost-center”: “$}aws:PrincipalTag/cost-center}”
        }
    }
    }
]
}

The security administrator attaches the policy to the manager’s role along with the tag organization:birds, and cost-center:it. If any of the projects change organization, the manager no longer has access, even if the cost-center remains IT.

In this policy, the condition ensures both the cost-center and organization tags exist for the function and the values are equal to the tags in the manager’s role. Even if the cost-center tag matches for both the Lambda function and the manager’s role, yet the manager’s organization tag doesn’t match, IAM denies access to the Lambda function. Tags themselves are only a key:value pair with no relationship to other tags. You can use multiple tags, as in this example, to more granularly define Lambda function permissions.

Conclusion

You can now use attribute-based access control (ABAC) with Lambda to control access to functions using tags. This allows you to scale your access controls by simplifying the management of permissions while still maintaining least privilege security best practices. Security administrators can coordinate with developers on a tagging strategy and create IAM policies with ABAC condition keys. This then gives freedom to developers to grow their applications by adding tags to functions, without needing a security administrator to update individual IAM policies.

Attribute-based Access Control (ABAC) for Lambda functions support is also available through many AWS Lambda Partners such as Lumigo, Pulumi and Vertical Relevance.

For additional documentation on ABAC with Lambda see Attribute-based access control for Lambda.

Introducing Amazon CodeWhisperer in the AWS Lambda console (In preview)

Post Syndicated from Julian Wood original https://aws.amazon.com/blogs/compute/introducing-amazon-codewhisperer-in-the-aws-lambda-console-in-preview/

This blog post is written by Mark Richman, Senior Solutions Architect.

Today, AWS is launching a new capability to integrate the Amazon CodeWhisperer experience with the AWS Lambda console code editor.

Amazon CodeWhisperer is a machine learning (ML)–powered service that helps improve developer productivity. It generates code recommendations based on their code comments written in natural language and code.

CodeWhisperer is available as part of the AWS toolkit extensions for major IDEs, including JetBrains, Visual Studio Code, and AWS Cloud9, currently supporting Python, Java, and JavaScript. In the Lambda console, CodeWhisperer is available as a native code suggestion feature, which is the focus of this blog post.

CodeWhisperer is currently available in preview with a waitlist. This blog post explains how to request access to and activate CodeWhisperer for the Lambda console. Once activated, CodeWhisperer can make code recommendations on-demand in the Lambda code editor as you develop your function. During the preview period, developers can use CodeWhisperer at no cost.

Amazon CodeWhisperer

Amazon CodeWhisperer

Lambda is a serverless compute service that runs your code in response to events and automatically manages the underlying compute resources for you. You can trigger Lambda from over 200 AWS services and software as a service (SaaS) applications and only pay for what you use.

With Lambda, you can build your functions directly in the AWS Management Console and take advantage of CodeWhisperer integration. CodeWhisperer in the Lambda console currently supports functions using the Python and Node.js runtimes.

When writing AWS Lambda functions in the console, CodeWhisperer analyzes the code and comments, determines which cloud services and public libraries are best suited for the specified task, and recommends a code snippet directly in the source code editor. The code recommendations provided by CodeWhisperer are based on ML models trained on a variety of data sources, including Amazon and open source code. Developers can accept the recommendation or simply continue to write their own code.

Requesting CodeWhisperer access

CodeWhisperer integration with Lambda is currently available as a preview only in the N. Virginia (us-east-1) Region. To use CodeWhisperer in the Lambda console, you must first sign up to access the service in preview here or request access directly from within the Lambda console.

In the AWS Lambda console, under the Code tab, in the Code source editor, select the Tools menu, and Request Amazon CodeWhisperer Access.

Request CodeWhisperer access in Lambda console

Request CodeWhisperer access in Lambda console

You may also request access from the Preferences pane.

Request CodeWhisperer access in Lambda console preference pane

Request CodeWhisperer access in Lambda console preference pane

Selecting either of these options opens the sign-up form.

CodeWhisperer sign up form

CodeWhisperer sign up form

Enter your contact information, including your AWS account ID. This is required to enable the AWS Lambda console integration. You will receive a welcome email from the CodeWhisperer team upon once they approve your request.

Activating Amazon CodeWhisperer in the Lambda console

Once AWS enables your preview access, you must turn on the CodeWhisperer integration in the Lambda console, and configure the required permissions.

From the Tools menu, enable Amazon CodeWhisperer Code Suggestions

Enable CodeWhisperer code suggestions

Enable CodeWhisperer code suggestions

You can also enable code suggestions from the Preferences pane:

Enable CodeWhisperer code suggestions from Preferences pane

Enable CodeWhisperer code suggestions from Preferences pane

The first time you activate CodeWhisperer, you see a pop-up containing terms and conditions for using the service.

CodeWhisperer Preview Terms

CodeWhisperer Preview Terms

Read the terms and conditions and choose Accept to continue.

AWS Identity and Access Management (IAM) permissions

For CodeWhisperer to provide recommendations in the Lambda console, you must enable the proper AWS Identity and Access Management (IAM) permissions for either your IAM user or role. In addition to Lambda console editor permissions, you must add the codewhisperer:GenerateRecommendations permission.

Here is a sample IAM policy that grants a user permission to the Lambda console as well as CodeWhisperer:

{
  "Version": "2012-10-17",
  "Statement": [{
      "Sid": "LambdaConsolePermissions",
      "Effect": "Allow",
      "Action": [
        "lambda:AddPermission",
        "lambda:CreateEventSourceMapping",
        "lambda:CreateFunction",
        "lambda:DeleteEventSourceMapping",
        "lambda:GetAccountSettings",
        "lambda:GetEventSourceMapping",
        "lambda:GetFunction",
        "lambda:GetFunctionCodeSigningConfig",
        "lambda:GetFunctionConcurrency",
        "lambda:GetFunctionConfiguration",
        "lambda:InvokeFunction",
        "lambda:ListEventSourceMappings",
        "lambda:ListFunctions",
        "lambda:ListTags",
        "lambda:PutFunctionConcurrency",
        "lambda:UpdateEventSourceMapping",
        "iam:AttachRolePolicy",
        "iam:CreatePolicy",
        "iam:CreateRole",
        "iam:GetRole",
        "iam:GetRolePolicy",
        "iam:ListAttachedRolePolicies",
        "iam:ListRolePolicies",
        "iam:ListRoles",
        "iam:PassRole",
        "iam:SimulatePrincipalPolicy"
      ],
      "Resource": "*"
    },
    {
      "Sid": "CodeWhispererPermissions",
      "Effect": "Allow",
      "Action": ["codewhisperer:GenerateRecommendations"],
      "Resource": "*"
    }
  ]
}

This example is for illustration only. It is best practice to use IAM policies to grant restrictive permissions to IAM principals to meet least privilege standards.

Demo

To activate and work with code suggestions, use the following keyboard shortcuts:

  • Manually fetch a code suggestion: Option+C (macOS), Alt+C (Windows)
  • Accept a suggestion: Tab
  • Reject a suggestion: ESC, Backspace, scroll in any direction, or keep typing and the recommendation automatically disappears.

Currently, the IDE extensions provide automatic suggestions and can show multiple suggestions. The Lambda console integration requires a manual fetch and shows a single suggestion.

Here are some common ways to use CodeWhisperer while authoring Lambda functions.

Single-line code completion

When typing single lines of code, CodeWhisperer suggests how to complete the line.

CodeWhisperer single-line completion

CodeWhisperer single-line completion

Full function generation

CodeWhisperer can generate an entire function based on your function signature or code comments. In the following example, a developer has written a function signature for reading a file from Amazon S3. CodeWhisperer then suggests a full implementation of the read_from_s3 method.

CodeWhisperer full function generation

CodeWhisperer full function generation

CodeWhisperer may include import statements as part of its suggestions, as in the previous example. As a best practice to improve performance, manually move these import statements to outside the function handler.

Generate code from comments

CodeWhisperer can also generate code from comments. The following example shows how CodeWhisperer generates code to use AWS APIs to upload files to Amazon S3. Write a comment describing the intended functionality and, on the following line, activate the CodeWhisperer suggestions. Given the context from the comment, CodeWhisperer first suggests the function signature code in its recommendation.

CodeWhisperer generate function signature code from comments

CodeWhisperer generate function signature code from comments

After you accept the function signature, CodeWhisperer suggests the rest of the function code.

CodeWhisperer generate function code from comments

CodeWhisperer generate function code from comments

When you accept the suggestion, CodeWhisperer completes the entire code block.

CodeWhisperer generates code to write to S3.

CodeWhisperer generates code to write to S3.

CodeWhisperer can help write code that accesses many other AWS services. In the following example, a code comment indicates that a function is sending a notification using Amazon Simple Notification Service (SNS). Based on this comment, CodeWhisperer suggests a function signature.

CodeWhisperer function signature for SNS

CodeWhisperer function signature for SNS

If you accept the suggested function signature. CodeWhisperer suggest a complete implementation of the send_notification function.

CodeWhisperer function send notification for SNS

CodeWhisperer function send notification for SNS

The same procedure works with Amazon DynamoDB. When writing a code comment indicating that the function is to get an item from a DynamoDB table, CodeWhisperer suggests a function signature.

CodeWhisperer DynamoDB function signature

CodeWhisperer DynamoDB function signature

When accepting the suggestion, CodeWhisperer then suggests a full code snippet to complete the implementation.

CodeWhisperer DynamoDB code snippet

CodeWhisperer DynamoDB code snippet

Once reviewing the suggestion, a common refactoring step in this example would be manually moving the references to the DynamoDB resource and table outside the get_item function.

CodeWhisperer can also recommend complex algorithm implementations, such as Insertion sort.

CodeWhisperer insertion sort.

CodeWhisperer insertion sort.

As a best practice, always test the code recommendation for completeness and correctness.

CodeWhisperer not only provides suggested code snippets when integrating with AWS APIs, but can help you implement common programming idioms, including proper error handling.

Conclusion

CodeWhisperer is a general purpose, machine learning-powered code generator that provides you with code recommendations in real time. When activated in the Lambda console, CodeWhisperer generates suggestions based on your existing code and comments, helping to accelerate your application development on AWS.

To get started, visit https://aws.amazon.com/codewhisperer/. Share your feedback with us at [email protected].

For more serverless learning resources, visit Serverless Land.

Creating a serverless Apache Kafka publisher using AWS Lambda

Post Syndicated from James Beswick original https://aws.amazon.com/blogs/compute/creating-a-serverless-apache-kafka-publisher-using-aws-lambda/

This post is written by Philipp Klose, Global Solution Architect, and Daniel Wessendorf, Global Solution Architect.

Streaming data and event-driven architectures are becoming more popular for many modern systems. The range of use cases includes web tracking and other logs, industrial IoT, in-game player activity, and the ingestion of data for modern analytics architecture.

One of the most popular technologies in this spaece is Apache Kafka. This is an open-source distributed event streaming platform used by many customers for high-performance data pipelines, streaming analytics, data integration, and mission-critical applications.

Kafka is based on a simple but powerful pattern. The Kafka cluster itself is a highly available broker that receives messages from various producers. The received messages are stored in topics, which are the primary storage abstraction.

Various consumers can subscribe to a Kafka topic and consume messages. In contrast to classic queuing systems, the consumers do not remove the message from the topic but store the individual reading position on the topic. This allows for multiple different patterns for consumption (for example, fan-out or consumer-groups).

Producer and consumer

Producer and consumer libraries for Kafka are available in various programming languages and technologies. This blog post focuses on using serverless and cloud-native technologies for the producer side.

Overview

This example walks you through how to build a serverless real-time stream producer application using Amazon API Gateway and AWS Lambda.

For testing, this blog includes a sample AWS Cloud Development Kit (CDK) application. This creates a demo environment, including an Amazon Managed Streaming for Apache Kafka (MSK) cluster and a bastion host for observing the produced messages on the cluster.

The following diagram shows the architecture of an application that pushes API requests to a Kafka topic in real time, which you build in this blog post:

Architecture overview

  1. An external application calls an Amazon API Gateway endpoint
  2. Amazon API Gateway forwards the request to a Lambda function
  3. AWS Lambda function behaves as a Kafka producer and pushes the message to a Kafka topic
  4. A Kafka “console consumer” on the bastion host then reads the message

The demo shows how to use Lambda Powertools for Java to streamline logging and tracing, and an IAM authenticator to simplify the cluster authentication process. The following sections take you through the steps to deploy, test, and observe the example application.

Prerequisites

The example has the following prerequisites:

Example walkthrough

  1. Clone the project GitHub repository. Change directory to subfolder serverless-kafka-iac:
    git clone https://github.com/aws-samples/serverless-kafka-producer
    cd serverless-kafka-iac
    
  2. Configure environment variables:
    export CDK_DEFAULT_ACCOUNT=$(aws sts get-caller-identity --query 'Account' --output text)
    export CDK_DEFAULT_REGION=$(aws configure get region)
    
  3. Prepare the virtual Python environment:
    python3 -m venv .venv
    source .venv/bin/activate
    pip3 install -r requirements.txt
    
  4. Bootstrap your account for CDK usage:
    cdk bootstrap aws://$CDK_DEFAULT_ACCOUNT/$CDK_DEFAULT_REGION
  5. Run ‘cdk synth’ to build the code and test the requirements:
    cdk synth
  6. Run ‘cdk deploy’ to deploy the code to your AWS account:
    cdk deploy --all

Testing the example

To test the example, log into the bastion host and start a consumer console to observe the messages being added to the topic. You generate messages for the Kafka topics by sending calls via API Gateway from your development machine or AWS Cloud9 environment.

  1. Use AWS System Manager to log into the bastion host. Use the KafkaDemoBackendStack.bastionhostbastion Output-Parameter to connect or via the system manager console.
    aws ssm start-session --target <Bastion Host Instance Id> 
    sudo su ec2-user
    cd /home/ec2-user/kafka_2.13-2.6.3/bin/
    
  2. Create a topic named messages on the MSK cluster:
    ./kafka-topics.sh --bootstrap-server $ZK --command-config client.properties --create --replication-factor 3 --partitions 3 --topic messages
  3. Open a Kafka consumer console on the bastion host to observe incoming messages:
    ./kafka-console-consumer.sh --bootstrap-server $ZK --topic messages --consumer.config client.properties
    
  4. Open another terminal on your development machine to create test requests using the “ServerlessKafkaProducerStack.kafkaproxyapiEndpoint” output parameter of the CDK stack. Append “/event” for the final URL. Use curl to send the API request:
    curl -X POST -d "Hello World" <ServerlessKafkaProducerStack.messagesapiendpointEndpoint>
  5. For load testing the application, it is important to calibrate the parameters. You can use a tool like Artillery to simulate workloads. You can find a sample artillery script in the /load-testing folder from step 1.
  6. Observe the incoming request in the bastion host terminal.

All components in this example integrate with AWS X-Ray. With AWS X-Ray, you can trace the entire application, which is useful to identify bottlenecks when load testing. You can also trace method execution at the Java method level.

Lambda Powertools for java allows you to accelerate this process by adding the @Trace annotation to see traces on method level in X-Ray.

To trace a request end to end:

  1. Navigate to the CloudWatch console.
  2. Open the Service map.
  3. Select a component to investigate (for example, the Lambda function where you deployed the Kafka producer). Choose View traces.
    X-Ray console
  4. Select a single Lambda method invocation and investigate further at the Java method level.
    X-Ray detail

Cleaning up

In the subdirectory “serverless-kafka-iac”, delete the test infrastructure:

cdk destroy –all

Implementation of a Kafka producer in Lambda

Kafka natively supports Java. To stay open, cloud native, and without third-party dependencies, the producer is written in that language. Currently, the IAM authenticator is only available to Java. In this example, the Lambda handler receives a message from an Amazon API Gateway source and pushes this message to an MSK topic called “messages”.

Typically, Kafka producers are long-living and pushing a message to a Kafka topic is an asynchronous process. As Lambda is ephemeral, you must enforce a full flush of a submitted message until the Lambda function ends, by calling producer.flush().

    @Override
    @Tracing
    @Logging(logEvent = true)
    public APIGatewayProxyResponseEvent 
    handleRequest(APIGatewayProxyRequestEvent input, Context context) {
        APIGatewayProxyResponseEvent response = createEmptyResponse();
        try {

            String message = getMessageBody(input);

            KafkaProducer<String, String> producer = createProducer();

            ProducerRecord<String, String> record = new ProducerRecord<String, String>(TOPIC_NAME, context.getAwsRequestId(), message);

            Future<RecordMetadata> send = producer.send(record);
            producer.flush();

            RecordMetadata metadata = send.get();
            log.info(String.format(“Send message was send to partition %s”, metadata.partition()));

            log.info(String.format(“Message was send to partition %s”, metadata.partition()));

            return response.withStatusCode(200).withBody(“Message successfully pushed to kafka”);
        } catch (Exception e) {
            log.error(e.getMessage(), e);
            return response.withBody(e.getMessage()).withStatusCode(500);
        }
    }

    @Tracing
    private KafkaProducer<String, String> createProducer() {
        if (producer == null) {
            log.info(“Connecting to kafka cluster”);
            producer = new KafkaProducer<String, String>(kafkaProducerProperties.getProducerProperties());
        }
        return producer;
    }

Connect to Amazon MSK using IAM Auth

This example uses IAM authentication to connect to the respective Kafka cluster. See the documentation here, which shows how to configure the producer for connectivity.

Since you configure the cluster via IAM, grant “Connect” and “WriteData” permissions to the producer, so that it can push messages to Kafka.

{
    “Version”: “2012-10-17”,
    “Statement”: [
        {            
            “Effect”: “Allow”,
            “Action”: [
                “kafka-cluster:Connect”
            ],
            “Resource”: “arn:aws:kafka:region:account-id:cluster/cluster-name/cluster-uuid “
        }
    ]
}


{
    “Version”: “2012-10-17”,
    “Statement”: [
        {            
            “Effect”: “Allow”,
            “Action”: [
                “kafka-cluster:Connect”,
                “kafka-cluster: DescribeTopic”,
            ],
            “Resource”: “arn:aws:kafka:region:account-id:topic/cluster-name/cluster-uuid/topic-name“
        }
    ]
}

This shows the Kafka excerpt of the IAM policy, which must be applied to the Kafka producer.

When using IAM authentication, be aware of the current limits of IAM Kafka authentication, which affect the number of concurrent connections and IAM requests for a producer. Read https://docs.aws.amazon.com/msk/latest/developerguide/limits.html and follow the recommendation for authentication backoff in the producer client:

        Map<String, String> configuration = Map.of(
                “key.serializer”, “org.apache.kafka.common.serialization.StringSerializer”,
                “value.serializer”, “org.apache.kafka.common.serialization.StringSerializer”,
                “bootstrap.servers”, getBootstrapServer(),
                “security.protocol”, “SASL_SSL”,
                “sasl.mechanism”, “AWS_MSK_IAM”,
                “sasl.jaas.config”, “software.amazon.msk.auth.iam.IAMLoginModule required;”,
                “sasl.client.callback.handler.class”, “software.amazon.msk.auth.iam.IAMClientCallbackHandler”,
                “connections.max.idle.ms”, “60”,
                “reconnect.backoff.ms”, “1000”
        );

Elaboration on implementation

Each Kafka broker node can handle a maximum of 20 IAM authentication requests per second. The demo setup has three brokers, which result in 60 requests per second. Therefore, the broker setup limits the number of concurrent Lambda functions to 60.

To reduce IAM authentication requests from the Kafka producer, place it outside of the handler. For frequent calls, there is a chance that Lambda reuses the previously created class instance and only re-executes the handler.

For bursting workloads with a high number of concurrent API Gateway requests, this can lead to dropped messages. While for some workloads, this might be tolerable, for others this might not be the case.

In these cases, you can extend the architecture with a buffering technology like Amazon SQS or Amazon Kinesis Data Streams between API Gateway and Lambda.

To reduce latency, you can reduce cold start times for Java by changing the tiered compilation level to “1” as described in this blog post. Provisioned Concurrency ensures that polling Lambda functions are ready before requests arrive.

Conclusion

In this post, you learn how to create a serverless integration Lambda function between API Gateway and Apache Managed Streaming for Apache Kafka (MSK). We show how to deploy such an integration with the CDK.

The general pattern is suitable for many use cases that need an integration between API Gateway and Apache Kafka. It may have cost benefits over containerized implementations in use cases with sparse, low-volume input streams, and unpredictable or spiky workloads.

For more serverless learning resources, visit Serverless Land.

Simplifying serverless best practices with AWS Lambda Powertools for TypeScript

Post Syndicated from Julian Wood original https://aws.amazon.com/blogs/compute/simplifying-serverless-best-practices-with-aws-lambda-powertools-for-typescript/

This blog post is written by Sara Gerion, Senior Solutions Architect.

Development teams must have a shared understanding of the workloads they own and their expected behaviors to deliver business value fast and with confidence. The AWS Well-Architected Framework and its Serverless Lens provide architectural best practices for designing and operating reliable, secure, efficient, and cost-effective systems in the AWS Cloud.

Developers should design and configure their workloads to emit information about their internal state and current status. This allows engineering teams to ask arbitrary questions about the health of their systems at any time. For example, emitting metrics, logs, and traces with useful contextual information enables situational awareness and allows developers to filter and select only what they need.

Following such practices reduces the number of bugs, accelerates remediation, and speeds up the application lifecycle into production. They can help mitigate deployment risks, offer more accurate production-readiness assessments and enable more informed decisions to deploy systems and changes.

AWS Lambda Powertools for TypeScript

AWS Lambda Powertools provides a suite of utilities for AWS Lambda functions to ease the adoption of serverless best practices. The AWS Hero Yan Cui’s initial implementation of DAZN Lambda Powertools inspired this idea.

Following the community’s adoption of AWS Lambda Powertools for Python and AWS Lambda Powertools for Java, we are excited to announce the general availability of the AWS Lambda Powertools for TypeScript.

AWS Lambda Powertools for TypeScript provides a suite of utilities for Node.js runtimes, which you can use in both JavaScript and TypeScript code bases. The library follows a modular approach similar to the AWS SDK v3 for JavaScript. Each utility is installed as standalone NPM package.

Today, the library is ready for production use with three observability features: distributed tracing (Tracer), structured logging (Logger), and asynchronous business and application metrics (Metrics).

You can instrument your code with Powertools in three different ways:

  • Manually. It provides the most granular control. It’s the most verbose approach, with the added benefit of no additional dependency and no refactoring to TypeScript Classes.
  • Middy middleware. It is the best choice if your existing code base relies on the Middy middleware engine. Powertools offers compatible Middy middleware to make this integration seamless.
  • Method decorator. Use TypeScript method decorators if you prefer writing your business logic using TypeScript Classes. If you aren’t using Classes, this requires the most significant refactoring.

The examples in this blog post use the Middy approach. To follow the examples, ensure that middy is installed:

npm i @middy/core

Logger

Logger provides an opinionated logger with output structured as JSON. Its key features include:

  • Capturing key fields from the Lambda context, cold starts, and structure logging output as JSON.
  • Logging Lambda invocation events when instructed (disabled by default).
  • Printing all the logs only for a percentage of invocations via log sampling (disabled by default).
  • Appending additional keys to structured logs at any point in time.
  • Providing a custom log formatter (Bring Your Own Formatter) to output logs in a structure compatible with your organization’s Logging RFC.

To install, run:

npm install @aws-lambda-powertools/logger

Usage example:

import { Logger, injectLambdaContext } from '@aws-lambda-powertools/logger';
 import middy from '@middy/core';

 const logger = new Logger({
    logLevel: 'INFO',
    serviceName: 'shopping-cart-api',
});

 const lambdaHandler = async (): Promise<void> => {
     logger.info('This is an INFO log with some context');
 };

 export const handler = middy(lambdaHandler)
     .use(injectLambdaContext(logger));

In Amazon CloudWatch, the structured log emitted by your application looks like:

{
     "cold_start": true,
     "function_arn": "arn:aws:lambda:eu-west-1:123456789012:function:shopping-cart-api-lambda-prod-eu-west-1",
     "function_memory_size": 128,
     "function_request_id": "c6af9ac6-7b61-11e6-9a41-93e812345678",
     "function_name": "shopping-cart-api-lambda-prod-eu-west-1",
     "level": "INFO",
     "message": "This is an INFO log with some context",
     "service": "shopping-cart-api",
     "timestamp": "2021-12-12T21:21:08.921Z",
     "xray_trace_id": "abcdef123456abcdef123456abcdef123456"
 }

Logs generated by Powertools can also be ingested and analyzed by any third-party SaaS vendor that supports JSON.

Tracer

Tracer is an opinionated thin wrapper for AWS X-Ray SDK for Node.js.

Its key features include:

  • Auto-capturing cold start and service name as annotations, and responses or full exceptions as metadata.
  • Automatically tracing HTTP(S) clients and generating segments for each request.
  • Supporting tracing functions via decorators, middleware, and manual instrumentation.
  • Supporting tracing AWS SDK v2 and v3 via AWS X-Ray SDK for Node.js.
  • Auto-disable tracing when not running in the Lambda environment.

To install, run:

npm install @aws-lambda-powertools/tracer

Usage example:

import { Tracer, captureLambdaHandler } from '@aws-lambda-powertools/tracer';
 import middy from '@middy/core'; 

 const tracer = new Tracer({
    serviceName: 'shopping-cart-api'
});

 const lambdaHandler = async (): Promise<void> => {
     /* ... Something happens ... */
 };

 export const handler = middy(lambdaHandler)
     .use(captureLambdaHandler(tracer));
AWS X-Ray segments and subsegments emitted by Powertools

AWS X-Ray segments and subsegments emitted by Powertools

Example service map generated with Powertools

Example service map generated with Powertools

Metrics

Metrics create custom metrics asynchronously by logging metrics to standard output following the Amazon CloudWatch Embedded Metric Format (EMF). These metrics can be visualized through CloudWatch dashboards or used to trigger alerts.

Its key features include:

  • Aggregating up to 100 metrics using a single CloudWatch EMF object (large JSON blob).
  • Validating your metrics against common metric definitions mistakes (for example, metric unit, values, max dimensions, max metrics).
  • Metrics are created asynchronously by the CloudWatch service. You do not need any custom stacks, and there is no impact to Lambda function latency.
  • Creating a one-off metric with different dimensions.

To install, run:

npm install @aws-lambda-powertools/metrics

Usage example:

import { Metrics, MetricUnits, logMetrics } from '@aws-lambda-powertools/metrics';
 import middy from '@middy/core';

 const metrics = new Metrics({
    namespace: 'serverlessAirline', 
    serviceName: 'orders'
});

 const lambdaHandler = async (): Promise<void> => {
     metrics.addMetric('successfulBooking', MetricUnits.Count, 1);
 };

 export const handler = middy(lambdaHandler)
     .use(logMetrics(metrics));

In CloudWatch, the custom metric emitted by your application looks like:

{
     "successfulBooking": 1.0,
     "_aws": {
     "Timestamp": 1592234975665,
     "CloudWatchMetrics": [
         {
         "Namespace": "serverlessAirline",
         "Dimensions": [
             [
             "service"
             ]
         ],
         "Metrics": [
             {
             "Name": "successfulBooking",
             "Unit": "Count"
             }
         ]
     },
     "service": "orders"
 }

Serverless TypeScript demo application

The Serverless TypeScript Demo shows how to use Lambda Powertools for TypeScript. You can find instructions on how to deploy and load test this application in the repository.

Serverless TypeScript Demo architecture

Serverless TypeScript Demo architecture

The code for the Get Products Lambda function shows how to use the utilities. The function is instrumented with Logger, Metrics and Tracer to emit observability data.

// blob/main/src/api/get-products.ts
import { APIGatewayProxyEvent, APIGatewayProxyResult} from "aws-lambda";
import { DynamoDbStore } from "../store/dynamodb/dynamodb-store";
import { ProductStore } from "../store/product-store";
import { logger, tracer, metrics } from "../powertools/utilities"
import middy from "@middy/core";
import { captureLambdaHandler } from '@aws-lambda-powertools/tracer';
import { injectLambdaContext } from '@aws-lambda-powertools/logger';
import { logMetrics, MetricUnits } from '@aws-lambda-powertools/metrics';

const store: ProductStore = new DynamoDbStore();
const lambdaHandler = async (event: APIGatewayProxyEvent): Promise<APIGatewayProxyResult> => {

  logger.appendKeys({
    resource_path: event.requestContext.resourcePath
  });

  try {
    const result = await store.getProducts();

    logger.info('Products retrieved', { details: { products: result } });
    metrics.addMetric('productsRetrieved', MetricUnits.Count, 1);

    return {
      statusCode: 200,
      headers: { "content-type": "application/json" },
      body: `{"products":${JSON.stringify(result)}}`,
    };
  } catch (error) {
      logger.error('Unexpected error occurred while trying to retrieve products', error as Error);

      return {
        statusCode: 500,
        headers: { "content-type": "application/json" },
        body: JSON.stringify(error),
      };
  }
};

const handler = middy(lambdaHandler)
    .use(captureLambdaHandler(tracer))
    .use(logMetrics(metrics, { captureColdStartMetric: true }))
    .use(injectLambdaContext(logger, { clearState: true, logEvent: true }));

export {
  handler
};

The Logger utility adds useful context to the application logs. Structuring your logs as JSON allows you to search on your structured data using Amazon CloudWatch Logs Insights. This allows you to filter out the information you don’t need.

For example, use the following query to search for any errors for the serverless-typescript-demo service.

fields resource_path, message, timestamp
| filter service = 'serverless-typescript-demo'
| filter level = 'ERROR'
| sort @timestamp desc
| limit 20
CloudWatch Logs Insights showing errors for the serverless-typescript-demo service.

CloudWatch Logs Insights showing errors for the serverless-typescript-demo service.

The Tracer utility adds custom annotations and metadata during the function invocation, which it sends to AWS X-Ray. Annotations allow you to search for and filter traces by business or application contextual information such as product ID, or cold start.

You can see the duration of the putProduct method and the ColdStart and Service annotations attached to the Lambda handler function.

putProduct trace view

putProduct trace view

The Metrics utility simplifies the creation of complex high-cardinality application data. Including structured data along with your metrics allows you to search or perform additional analysis when needed.

In this example, you can see how many times per second a product is created, deleted, or queried. You could configure alarms based on the metrics.

Metrics view

Metrics view

Code examples

You can use Powertools with many Infrastructure as Code or deployment tools. The project contains source code and supporting files for serverless applications that you can deploy with the AWS Cloud Development Kit (AWS CDK) or AWS Serverless Application Model (AWS SAM).

The AWS CDK lets you build reliable and scalable applications in the cloud with the expressive power of a programming language, including TypeScript. The AWS SAM CLI is that makes it easier to create and manage serverless applications.

You can use the sample applications provided in the GitHub repository to understand how to use the library quickly and experiment in your own AWS environment.

Conclusion

AWS Lambda Powertools for TypeScript can help simplify, accelerate, and scale the adoption of serverless best practices within your team and across your organization.

The library implements best practices recommended as part of the AWS Well-Architected Framework, without you needing to write much custom code.

Since the library relieves the operational burden needed to implement these functionalities, you can focus on the features that matter the most, shortening the Software Development Life Cycle and reducing the Time To Market.

The library helps both individual developers and engineering teams to standardize their organizational best practices. Utilities are designed to be incrementally adoptable for customers at any stage of their serverless journey, from startup to enterprise.

To get started with AWS Lambda Powertools for TypeScript, see the official documentation. For more serverless learning resources, visit Serverless Land.

Optimizing Node.js dependencies in AWS Lambda

Post Syndicated from James Beswick original https://aws.amazon.com/blogs/compute/optimizing-node-js-dependencies-in-aws-lambda/

This post is written by Richard Davison, Senior Partner Solutions Architect.

AWS Lambda offers support for Node.js versions 12, 14 and recently announced version 16. Since Node.js parses, optimizes and runs JavaScript on-the-fly, it can provide fast startup and low overhead in a serverless environment.

Node.js reads and parses all dependencies and sources that are required or imported from the entry point. Consequently, it’s important to keep the dependencies to a minimum and optimize the ones in use.

This post shows how to bundle and minify Lambda function code to optimize performance and stay up to date with the latest version of your dependencies.

Understanding Node.js module resolution

When you require or import a resource in your code, Node.js tries to resolve that resource by either the file- or directory name, or in the node_modules directory. Once it finds the resource, it is loaded from disk, parsed and run.

If that file or dependency in turn contains other imports or require statements, the process repeats, which causes disk reads. The more dependencies and files that are imported in a function, the longer it takes to initialize.

This only impacts imported and used code. Including files in a project that are not imported or used has minimal effect on startup performance.

You should also evaluate what’s being imported. Even though modern JavaScript bundlers such as esbuild, Rollup, or WebPack uses tree shaking and dead code elimination, importing dependencies via wildcard, global-, or top-level imports can result in larger bundles.

Use path imports if your library supports it:

//es6
import DynamoDB from "aws-sdk/clients/dynamodb"
//es5
const DynamoDB = require("aws-sdk/clients/dynamodb")

Avoid wildcard imports:

//es6
import {* as AWS} from "aws-sdk"
//es5
const AWS = require("aws-sdk")

Avoid top-level imports:

//es6
import AWS from "aws-sdk"
//es5
const AWS = require("aws-sdk")

AWS SDK for JavaScript v3

The documentation shows that all Node.js runtimes share the same AWS SDK for JavaScript version. To control the version of the SDK that you depend on, you must provide it yourself. Consider using AWS SDK V3, which uses a modular architecture with a separate package for each service.

This has many benefits, including faster installations and smaller deployment sizes. It also includes many frequently requested features, such as a first-class TypeScript support and a new middleware stack. Since there is a separate package for each service, top-level import is not possible, which further increases startup performance.

By providing your own AWS SDK, it can also be bundled and minified during the build process, which can result in cold start reduction.

Bundle and minify Node.js Lambda functions

You can bundle and minify Lambda functions by using esbuild. This is one of the fastest JavaScript bundlers available, often 10-100x faster than alternatives like WebPack or Parcel.

To use esbuild:

1. Add esbuild to your dev dependencies using npm or yarn:

  • npm: npm i esbuild --save-dev
  • yarn: yarn add esbuild --dev

2. Create a “build” script in the script section of the package.json file:

 "scripts": {
    "build": "rm -rf dist && esbuild ./src/* --entry-names=[dir]/[name]/index --bundle --minify --sourcemap --platform=node --target=node16.14 --outdir=dist",
 }

This script first removes the dist directory and then runs esbuild with the following command-line arguments:

  • ./src/* First, specify the entry points of the application. esbuild creates one bundle (when the bundle option is enabled) for each entry point provided, containing only the dependencies it uses.
  • --entry-names=[dir]/[name]/index specifies that esbuild should create bundles in the same directory as its entry point and in a directory with the same name as the entry point. The bundle is then named index.js.
  • --bundle indicates that you want to bundle all dependencies and source code in a single file.
  • --minify is used to minify the code.
  • --sourcemap is used to create a source map file, which is essential for debugging minified code. Since the minified code is different from your source code, a source map enables a JavaScript debugger to map the minified code to the original source code. Generating source maps helps debugging but increases the size. Note that source maps must be registered to be applied. To register source maps in a Lambda function, use the NODE_OPTIONS environment variable with the following value: --enable-source-maps
  • --platform=node and --target=node16.14 are used to indicate the ECMAScript version to target. By using a bundler, you can often compile newer JavaScript features and syntaxes to earlier standards. Since Lambda now supports Node.js 16, set the target to node16.14. For reference, use https://node.green/ to compare Node.js versions with ECMAScript features.
  • --outdir=dist indicates that all files should be placed in the dist directory.

Build

Run the build script by running yarn build or npm run build.

Package and deploy

To package your Lambda functions, navigate to the dist directory and zip the contents of each respective directory. Note that one zip file per function should be created, only containing index.js and index.js.map. You may also clone the sample project.

If you are already using the AWS CDK, consider using the NodejsFunction construct. This construct abstracts away the bundle procedure and internally uses esbuild to bundle the code:

const nodeJsFunction = new lambdaNodejs.NodejsFunction(
  this,
  "NodeJsFunction",
  {
    runtime: lambda.Runtime.NODEJS_16_X,
    handler: "main",
    entry: "../path/to/your/entry.js_or_ts",
  }
);

Build and deploy sample project

Once all the sources have been bundled you may have noticed that they have small file sizes compared to zipping node_modules and the source files. Your package may be more than 100x smaller. They will also initialize faster.

  1. Clone the sample project and, install the dependencies, build the project and package the application by running the following commands:
    npm install
    npm run build
    npm run package
    npm run package:unbundled

    This produces zip artifacts in the dist directory as well as in the project root. Comparing the size difference between dist/ddbHandler.zip and unoptimized.zip, the unbundled artifact is more than ten times larger. When unpacked, the code size with dependencies is more than 19 Mb compared to 2.1 Mb for the bundled and minified example.

    This is significant in the ddbHandler example because of the AWS SDK DynamoDB dependencies, which contains multiple files and resources.

  2. To deploy the application, run:
    npm run deploy

Comparing and measuring the results

After deployment, you can also see a significant cold start performance improvement. You can load test the Lambda functions using Artillery. Replace the url from the deployment output:

Load test unbundled

artillery run -t "https://{YOUR_ID_HERE}.execute-api.eu-west-1.amazonaws.com" -v '{ "url": "/x86/v2-top-level-unbundled" }' loadtest.yml

Load test bundled

artillery run -t "https://{YOUR_ID_HERE}.execute-api.eu-west-1.amazonaws.com" -v '{ "url": "/x86/v3" }' loadtest.yml

View results in CloudWatch Insights by selecting the two functions’ log groups and running the following query:

Logs Insights

filter @type = "REPORT"
| parse @log /\d+:\/aws\/lambda\/[\w\d]+-(?<function>[\w\d]+)-[\w\d]+/
| stats
count(*) as invocations,
pct(@duration+greatest(@initDuration,0), 0) as p0,
pct(@duration+greatest(@initDuration,0), 25) as p25,
pct(@duration+greatest(@initDuration,0), 50) as p50,
pct(@duration+greatest(@initDuration,0), 75) as p75,
pct(@duration+greatest(@initDuration,0), 90) as p90,
pct(@duration+greatest(@initDuration,0), 95) as p95,
pct(@duration+greatest(@initDuration,0), 99) as p99,
pct(@duration+greatest(@initDuration,0), 100) as p100
group by function, ispresent(@initDuration) as coldstart
| sort by function, coldstart

The cold start invocations for DdbV3X86 run in 551 ms versus DdbVZTopLevelX86Unbundled, which run in 945 ms (p90). The minified and bundled v3 version has about 1.7x faster cold starts, while also providing faster performance during warm invocations.

Performance results

Conclusion

In this post, you learn how to improve Node.js cold start performance by up to 70% by bundling and minifying your code. You also learned how to provide a different version of AWS SDK for JavaScript and that dependencies and how they are imported affects the performance of Node.js Lambda functions. To achieve the best performance, use AWS SDK V3, bundle and minify your code, and avoid top-level imports.

For more serverless learning resources, visit Serverless Land.

Building a low-code speech “you know” counter using AWS Step Functions

Post Syndicated from Julian Wood original https://aws.amazon.com/blogs/compute/building-a-low-code-speech-you-know-counter-using-aws-step-functions/

This post is written by Doug Toppin, Software Development Engineer, and Kishore Dhamodaran, Solutions Architect.

In public speaking, filler phrases can distract the audience and reduce the value and impact of what you are telling them. Reviewing recordings of presentations can be helpful to determine whether presenters are using filler phrases. Instead of manually reviewing prior recordings, automation can process media files and perform a speech-to-text function. That text can then be processed to report on the use of filler phrases.

This blog explains how to use AWS Step Functions, Amazon EventBridge, Amazon Transcribe and Amazon Athena to report on the use of the common phrase “you know” in media files. These services can automate and reduce the time required to find the use of filler phrases.

Step Functions can automate and chain together multiple activities and other Amazon services. Amazon Transcribe is a speech to text service that uses media files as input and produces textual transcripts from them. Athena is an interactive query service that makes it easier to analyze data in Amazon S3 using standard SQL. Athena enables the use of standard SQL to query data in S3.

This blog shows a low-code, configuration driven approach to implementing this solution. Low-code means writing little or no custom software to perform a function. Instead, you use a configuration drive approach using service integrations where state machine tasks call AWS services using existing SDKs, APIs, or interfaces. A configuration driven approach in this example is using Step Functions’ Amazon States Language (ASL) to tie actions together rather than writing traditional code. This requires fewer details for data management and error handling combined with a visual user interface for composing the workflow. As the actions and logic are clearly defined with the visual workflow, this reduces maintenance.

Solution overview

The following diagram shows the solution architecture.

SolutionOverview

Solution Overview

  1. You upload a media file to an Amazon S3 Media bucket.
  2. The media file upload to S3 triggers an EventBridge rule.
  3. The EventBridge rule starts the Step Functions state machine execution.
  4. The state machine invokes Amazon Transcribe to process the media file.
  5. The transcription output file is stored in the Amazon S3 Transcript bucket.
  6. The state machine invokes Athena to query the textual transcript for the filler phrase. This uses the AWS Glue table to describe the format of the transcription results file.
  7. The filler phrase count determined by Athena is returned and stored in the Amazon S3 Results bucket.

Prerequisites

  1. An AWS account and an AWS user or role with sufficient permissions to create the necessary resources.
  2. Access to the following AWS services: Step Functions, Amazon Transcribe, Athena, and Amazon S3.
  3. Latest version of the AWS Serverless Application Model (AWS SAM) CLI, which helps developers create and manage serverless applications in the AWS Cloud.
  4. Test media files (for example, the Official AWS Podcast).

Example walkthrough

  1. Clone the GitHub repository to your local machine.
  2. git clone https://github.com/aws-samples/aws-stepfunctions-examples.git
  3. Deploy the resources using AWS SAM. The deploy command processes the AWS SAM template file to create the necessary resources in AWS. Choose you-know as the stack name and the AWS Region that you want to deploy your solution to.
  4. cd aws-stepfunctions-examples/sam/app-low-code-you-know-counter/
    sam deploy --guided

Use the default parameters or replace with different values if necessary. For example, to get counts of a different filler phrase, replace the FillerPhrase parameter.

GlueDatabaseYouKnowP Name of the AWS Glue database to create.
AthenaTableName Name of the AWS Glue table that is used by Athena to query the results.
FillerPhrase The filler phrase to check.
AthenaQueryPreparedStatementName Name of the Athena prepared statement used to run SQL queries on.
AthenaWorkgroup Athena workgroup to use
AthenaDataCatalog The data source for running the Athena queries
SAM Deploy

SAM Deploy

Running the filler phrase counter

  1. Navigate to the Amazon S3 console and upload an mp3 or mp4 podcast recording to the bucket named bucket-{account number}-{Region}-you-know-media.
  2. Navigate to the Step Functions console. Choose the running state machine, and monitor the execution of the transcription state machine.
  3. State Machine Execution

    State Machine Execution

  4. When the execution completes successfully, select the QueryExecutionSuccess task to examine the output and see the filler phrase count.
  5. State Machine Output

    State Machine Output

  6. Amazon Transcribe produces the transcript text of the media file. You can examine the output in the Results bucket. Using the S3 console, navigate to the bucket, choose the file matching the media file name and use ‘Query with S3 Select’ to view the content.
  7. If the transcription job does not execute, the state machine reports the failure and exits.
  8. State Machine Fail

    State Machine Fail

Exploring the state machine

The state machine orchestrates the transcription processing:

State Machine Explore

State Machine Explore

The StartTranscriptionJob task starts the transcription job. The Wait state adds a 60-second delay before checking the status of the transcription job. Until the status of the job changes to FAILED or COMPLETED, the choice state continues.

When the job successfully completes, the AthenaStartQueryExecutionUsingPreparedStatement task starts the Athena query, and stores the results in the S3 results bucket. The AthenaGetQueryResults task retrieves the count from the resultset.

The TranscribeMediaBucket holds the media files to be uploaded. The configuration sends the upload notification event to EventBridge:

      
   NotificationConfiguration:
     EventBridgeConfiguration:
       EventBridgeEnabled: true
	  

The TranscribeResultsBucket has an associated policy to provide access to Amazon Transcribe. Athena stores the output from the queries performed by the state machine in the AthenaQueryResultsBucket .

When a media upload occurs, the YouKnowTranscribeStateMachine uses Step Functions’ native event integration to trigger an EventBridge rule. This contains an event object similar to:

{
  "version": "0",
  "id": "99a0cb40-4b26-7d74-dc59-c837f5346ac6",
  "detail-type": "Object Created",
  "source": "aws.s3",
  "account": "012345678901",
  "time": "2022-05-19T22:21:10Z",
  "region": "us-east-2",
  "resources": [
    "arn:aws:s3:::bucket-012345678901-us-east-2-you-know-media"
  ],
  "detail": {
    "version": "0",
    "bucket": {
      "name": "bucket-012345678901-us-east-2-you-know-media"
    },
    "object": {
      "key": "Podcase_Episode.m4a",
      "size": 202329,
      "etag": "624fce93a981f97d85025e8432e24f48",
      "sequencer": "006286C2D604D7A390"
    },
    "request-id": "B4DA7RD214V1QG3W",
    "requester": "012345678901",
    "source-ip-address": "172.0.0.1",
    "reason": "PutObject"
  }
}

The state machine allows you to prepare parameters and use the direct SDK integrations to start the transcription job by calling the Amazon Transcribe service’s API. This integration means you don’t have to write custom code to perform this function. The event triggering the state machine execution contains the uploaded media file location.


  StartTranscriptionJob:
	Type: Task
	Comment: Start a transcribe job on the provided media file
	Parameters:
	  Media:
		MediaFileUri.$: States.Format('s3://{}/{}', $.detail.bucket.name, $.detail.object.key)
	  TranscriptionJobName.$: "$.detail.object.key"
	  IdentifyLanguage: true
	  OutputBucketName: !Ref TranscribeResultsBucket
	Resource: !Sub 'arn:${AWS::Partition}:states:${AWS::Region}:${AWS::AccountId}:aws-sdk:transcribe:startTranscriptionJob'

The SDK uses aws-sdk:transcribe:getTranscriptionJob to get the status of the job.


  GetTranscriptionJob:
	Type: Task
	Comment: Retrieve the status of an Amazon Transcribe job
	Parameters:
	  TranscriptionJobName.$: "$.TranscriptionJob.TranscriptionJobName"
	Resource: !Sub 'arn:${AWS::Partition}:states:${AWS::Region}:${AWS::AccountId}:aws-sdk:transcribe:getTranscriptionJob'
	Next: TranscriptionJobStatus

The state machine uses a polling loop with a delay to check the status of the transcription job.


  TranscriptionJobStatus:
	Type: Choice
	Choices:
	- Variable: "$.TranscriptionJob.TranscriptionJobStatus"
	  StringEquals: COMPLETED
	  Next: AthenaStartQueryExecutionUsingPreparedStatement
	- Variable: "$.TranscriptionJob.TranscriptionJobStatus"
	  StringEquals: FAILED
	  Next: Failed
	Default: Wait

When the transcription job completes successfully, the filler phrase counting process begins.

An Athena prepared statement performs the query with the transcription job name as a runtime parameter. The AWS SDK starts the query and the state machine execution pauses, waiting for the results to return before progressing to the next state:

athena:startQueryExecution.sync

When the query completes, Step Functions uses the SDK integration to retrieve the results using athena:getQueryResults:

athena:getQueryResults

It creates an Athena prepared statement to pass the transcription jobname as a parameter for the query execution:

  ResultsQueryPreparedStatement:
    Type: AWS::Athena::PreparedStatement
    Properties:
      Description: Create a statement that allows the use of a parameter for specifying an Amazon Transcribe job name in the Athena query
      QueryStatement: !Sub >-
        select cardinality(regexp_extract_all(results.transcripts[1].transcript, '${FillerPhrase}')) AS item_count from "${GlueDatabaseYouKnow}"."${AthenaTableName}" where jobname like ?
      StatementName: !Ref AthenaQueryPreparedStatementName
      WorkGroup: !Ref AthenaWorkgroup

There are several opportunities to enhance this tool. For example, adding support for multiple filler phrases. You could build a larger application to upload media and retrieve the results. You could take advantage of Amazon Transcribe’s real-time transcription API to display the results while a presentation is in progress to provide immediate feedback to the presenter.

Cleaning up

  1. Navigate to the Amazon Transcribe console. Choose Transcription jobs in the left pane, select the jobs created by this example, and choose Delete.
  2. Cleanup Delete

    Cleanup Delete

  3. Navigate to the S3 console. In the Find buckets by name search bar, enter “you-know”. This shows the list of buckets created for this example. Choose each of the radio buttons next to the bucket individually and choose Empty.
  4. Cleanup S3

    Cleanup S3

  5. Use the following command to delete the stack, and confirm the stack deletion.
  6. sam delete

Conclusion

Low-code applications can increase developer efficiency by reducing the amount of custom code required to build solutions. They can also enable non-developer roles to create automation to perform business functions by providing drag-and-drop style user interfaces.

This post shows how a low-code approach can build a tool chain using AWS services. The example processes media files to produce text transcripts and count the use of filler phrases in those transcripts. It shows how to process EventBridge data and how to invoke Amazon Transcribe and Athena using Step Functions state machines.

For more serverless learning resources, visit Serverless Land.

Sending Amazon EventBridge events to private endpoints in a VPC

Post Syndicated from James Beswick original https://aws.amazon.com/blogs/compute/sending-amazon-eventbridge-events-to-private-endpoints-in-a-vpc/

This post is written by Emily Shea, Senior GTM Specialist, Event-Driven Architectures.

Building with events can help you accelerate feature velocity and build scalable, fault tolerant applications. You can achieve loose coupling in your application using asynchronous communication via events. Loose coupling allows each development team to build and deploy independently and each component to scale and fail without impacting the others. This approach is referred to as event-driven architecture.

Amazon EventBridge helps you build event-driven architectures. You can publish events to the EventBridge event bus and EventBridge routes those events to targets. You can write rules to filter events and only send them to the interested targets. For example, an order fulfillment service may only be interested in events of type ‘new order created.’

EventBridge is serverless, so there is no infrastructure to manage and the service scales automatically. EventBridge has native integrations with over 100 AWS services and over 40 SaaS providers.

Amazon EventBridge has a native integration with AWS Lambda, and many AWS customers use events to trigger Lambda functions to process events. You may also want to send events to workloads running on Amazon EC2 or containerized workloads deployed with Amazon ECS or Amazon EKS. These services are deployed into an Amazon Virtual Private Cloud, or VPC.

For some use cases, you may be able to expose public endpoints for your VPC. You can use EventBridge API destinations to send events to any public HTTP endpoint. API destinations include features like OAuth support and rate limiting to control the number of events you are sending per second.

However, some customers are not able to expose public endpoints for security or compliance purposes. This tutorial shows you how to send EventBridge events to a private endpoint in a VPC using a Lambda function to relay events. This solution deploys the Lambda function connected to the VPC and uses IAM permissions to enable EventBridge to invoke the Lambda function. Learn more about Lambda VPC connectivity here.

In this blog post, you learn how to send EventBridge events to a private endpoint in a VPC. You set up an example application with an EventBridge event bus, a Lambda function to relay events, a Flask application running in an EKS cluster to receive events behind an Application Load Balancer (ALB), and a secret stored in Secrets Manager for authenticating requests. This application uses EKS and Secrets Manager to demonstrate sending and authenticating requests to a containerized workload, but the same pattern applies for other container orchestration services like ECS and your preferred secret management solution.

Continue reading for the full example application and walkthrough. If you have an existing application in a VPC, you can deploy just the event relay portion and input your VPC details as parameters.

Solution overview

Architecture

  1. An event is sent to the EventBridge bus.
  2. If the event matches a certain pattern (ex, if ‘detail-type’ is ‘inbound-event-sent’), an EventBridge rule uses EventBridge’s input transformer to format the event as an HTTP call.
  3. The EventBridge rule pushes the event to a Lambda function connected to the VPC and a CloudWatch Logs group for debugging.
  4. The Lambda function calls Secrets Manager and retrieves a secret key. It appends the secret key to the event headers and then makes an HTTP call to the ALB URL endpoint.
  5. ALB routes this HTTP call to a node group in the EKS cluster. The Flask application running on the EKS cluster calls Secret Manager, confirms that the secret key is valid, and then processes the event.
  6. The Lambda function receives a response from ALB.
    1. If the Flask application fails to process the event for any reason, the Lambda function raises an error. The function’s failure destination is configured to send the event and the error message to an SQS dead letter queue.
    2. If the Flask application successfully processes the event and the ‘return-response-event’ flag in the event was set to ‘true’, then the Lambda function publishes a new ‘outbound-event-sent’ event to the same EventBridge bus.
  7. Another EventBridge rule matches detail-type ‘outbound-event-sent’ events and routes these to the CloudWatch Logs group for debugging.

Prerequisites

To run the application, you must install the AWS CLI, Docker CLI, eksctl, kubectl, and AWS SAM CLI.

To clone the repository, run:

git clone https://github.com/aws-samples/eventbridge-events-to-vpc.git

Creating the EKS cluster

  1. In the example-vpc-application directory, use eksctl to create the EKS cluster using the config file.
    cd example-vpc-application
    eksctl create cluster --config-file eksctl_config.yaml

    This takes a few minutes. This step creates an EKS cluster with one node group in us-east-1. The EKS cluster has a service account with IAM permissions to access the Secrets Manager secret you create later.

  2. Use your AWS account’s default Amazon Elastic Container Registry (ECR) private registry to store the container image. First, follow these instructions to authenticate Docker to ECR. Next, run this command to create a new ECR repository. The create-repository command returns a repository URI (for example, 123456789.dkr.ecr.us-east-1.amazonaws.com/events-flask-app).
    aws ecr create-repository --repository-name events-flask-app 

    Use the repository URI in the following commands to build, tag, and push the container image to ECR.

    docker build --tag events-flask-app .
    docker tag events-flask-app:latest {repository-uri}:1
    docker push {repository-uri}:1
  3. In the Kuberenetes deployment manifest file (/example-vpc-application/manifests/deployment.yaml), fill in your repository URI and container image version (for example, 123456789.dkr.ecr.us-east-1.amazonaws.com/events-flask-app:1)

Deploy the Flask application and Application Load Balancer

  1. Within the example-vpc-application directory, use kubectl to apply the Kubernetes manifest files. This step deploys the ALB, which takes time to create and you may receive an error message during the deployment (‘no endpoints available for service “aws-load-balancer-webhook-service”‘). Rerun the same command until the ALB is deployed and you no longer receive the error message.
    kubectl apply --kustomize manifests/
  2. Once the deployment is completed, verify that the Flask application is running by retrieving the Kubernetes pod logs. The first command retrieves a pod name to fill in for the second command.
    kubectl get pod --namespace vpc-example-app
    kubectl logs --namespace vpc-example-app {pod-name} --follow

    You should see the Flask application outputting ‘Hello from my container!’ in response to GET request health checks.

    Hello message

Get VPC and ALB details

Next, you retrieve the security group ID, private subnet IDs, and ALB DNS Name to deploy the Lambda function connected to the same VPC and private subnet and send events to the ALB.

  1. In the AWS Management Console, go to the VPC dashboard and find Subnets. Copy the subnet IDs for the two private subnets (for example, subnet name ‘eksctl-events-cluster/SubnetPrivateUSEAST1A’).
    Subnets
  2. In the VPC dashboard, under Security, find the Security Groups tab. Copy the security group ID for ‘eksctl-events-cluster/ClusterSharedNodeSecurityGroup’.
    Security groups
  3. Go to the EC2 dashboard. Under Load Balancing, find the Load Balancer tab. There is a load balancer associated with your VPC ID. Copy the DNS name for the load balancer, adding ‘http://’ as a prefix (for example, http://internal-k8s-vpcexamp-vpcexamp-c005e07d1a-1074647274.us-east-1.elb.amazonaws.com).
    Load balancer

Create the Secrets Manager VPC endpoint

You need a VPC endpoint for your application to call Secrets Manager.

  1. In the VPC dashboard, find the Endpoints tab and choose Create Endpoint. Select Secrets Manager as the service, and then select the VPC, private subnets, and security group that you copied in the previous step. Choose Create.VPC endpoint

Deploy the event relay application

Deploy the event relay application using the AWS Serverless Application Model (AWS SAM) CLI:

  1. Open a new terminal window and navigate to the event-relay directory. Run the following AWS SAM CLI commands to build the application and step through a guided deployment.
    cd event-relay
    sam build
    sam deploy --guided

    The guided deployment process prompts for input parameters. Enter ‘event-relay-app’ as the stack name and accept the default Region. For other parameters, submit the ALB and VPC details you copied: Url (ALB DNS name), security group ID, and private subnet IDs. For the Secret parameter, pass any value.The AWS SAM template saves this value as a Secrets Manager secret to authenticate calls to the container application. This is an example of how to pass secrets in the event relay HTTP call. Replace this with your own authentication method in production environments.

  2. Accept the defaults for the remaining options. For ‘Deploy this changeset?’, select ‘y’. Here is an example of the deployment parameters.
    Parameters

Test the event relay application

Both the Flask application in a VPC and the event relay application are now deployed. To test the event relay application, keep the Kubernetes pod logs from a previous step open to monitor requests coming into the Flask application.

  1. You can open a new terminal window and run this AWS CLI command to put an event on the bus, or go to the EventBridge console, find your event bus, and use the Send events UI.
    aws events put-events \
    --entries '[{"EventBusName": "event-relay-bus" ,"Source": "eventProducerApp", "DetailType": "inbound-event-sent", "Detail": "{ \"event-id\": \"123\", \"return-response-event\": true }"}]'

    When the event is relayed to the Flask application, a POST request in the Kubernetes pod logs confirms that the application processed the event.

    Terminal response

  2. Navigate to the CloudWatch Logs groups in the AWS Management Console. In the ‘/aws/events/event-bus-relay-logs’ group, there are logs for the EventBridge events. In ‘/aws/lambda/EventRelayFunction’ stream, the Lambda function relays the inbound event and puts a new outbound event on the EventBridge bus.
  3. You can test the SQS dead letter queue by creating an error. For example, you can manually change the Lambda function code in the console to pass an incorrect value for the secret. After sending a test event, navigate to the SQS queue in the console and poll for messages. The message shows the error message from the Flask application and the full event that failed to process.

Cleaning up

In the VPC dashboard in the AWS Management Console, find the Endpoints tab and delete the Secrets Manager VPC endpoint. Next, run the following commands to delete the rest of the example application. Be sure to run the commands in this order as some of the resources have dependencies on one another.

sam delete --stack-name event-relay-app
kubectl --namespace vpc-example-app delete ingress vpc-example-app-ingress

From the example-vpc-application directory, run this command.

eksctl delete cluster --config-file eksctl_config.yaml

Conclusion

Event-driven architectures and EventBridge can help you accelerate feature velocity and build scalable, fault tolerant applications. This post demonstrates how to send EventBridge events to a private endpoint in a VPC using a Lambda function to relay events and emit response events.

To learn more, read Getting started with event-driven architectures and visit EventBridge tutorials on Serverless Land.

Managing multi-tenant APIs using Amazon API Gateway

Post Syndicated from James Beswick original https://aws.amazon.com/blogs/compute/managing-multi-tenant-apis-using-amazon-api-gateway/

This post is written by Satish Mane, Solutions Architect.

Many ISVs provide platforms as a service in a multi-tenant environment. You can achieve multi-tenancy by partitioning the platform based on customer identifiers such as customer ID or account ID. The architecture for multi-tenant environments is often composed of authentication, authorization, a service layer, queues, and databases.

The primary focus of these architectures is to simplify the addition of more features. The multi-tenant design pattern has opened up new challenges and opportunities for software vendors thanks to microservice architectures gaining popularity. The challenge in a multi-tenant environment is that excessive load by a single customer, because of many requests to an API, can affect the entire platform.

This blog post looks at how to protect and monetize multi-tenant APIs using Amazon API Gateway. It describes a multi-tenant architecture design pattern based on a custom tenant ID to onboard customers. A tenant in a multi-tenant platform represents the customer having a group of users with common access, but individuals having specific permissions to the platform.

Overview

This example protects multi-tenant platform REST APIs using Amazon Cognito, Amazon API Gateway, and AWS Lambda.

In the following sections, you learn how to use the API Gateway’s usage plans to protect and productize multi-tenant platforms. Usage plans enable throttling of excessive API requests and apply an API usage quota policy. The user authenticates using Amazon Cognito to get a JSON Web Token (JWT) that is passed to API Gateway for authorization.

The multi-tenant platform that exposes REST APIs has clients such as a mobile app, a web application, and API clients that consume the REST APIs. This post focuses on protecting REST APIs with Amazon Cognito as the security layer for authenticating users and issuing tokens using OpenID Connect. The token contains the customer identity information, such as the tenant ID to which the users belong. API Gateway throttles the requests from a tenant only after the limit defined in the usage plans exceeds.

Architecture

This architecture shows the flow of user requests:

  1. The client application sends a request to Amazon Cognito using the /oauth/authorize or /login API. Amazon Cognito authenticates the user credentials.
  2. Amazon Cognito redirects using an authorization code grant and prompts the user to enter credentials. After authentication, it returns the authorization code.
  3. It then passes the authorization code to obtain a JWT from Amazon Cognito.
  4. Upon successful authentication, Amazon Cognito returns a JWT, such as acccess_token, id_token, refresh_token. The access/id token stores information about the granted permissions including tenant ID to which this user belongs to.
  5. The client application invokes the REST API that is deployed in API Gateway. The API request passes the JWT as a bearer token in the API request Authorization header.
  6. Since the tenant ID is hidden in the encrypted JWT token, the Lambda authorizer function validates and decodes the token, and extracts the tenant ID from the JWT.
  7. The Lambda token authorizer function returns an IAM policy along with tenant ID from the decoded token to which a user belongs.
  8. The application’s REST API is configured with usage plans against a custom API key, which is the tenant ID in API Gateway. API Gateway evaluates the IAM policy and looks up the usage policy using the API key. It throttles API requests if the number of requests exceed the throttle or quota limits in the usage policy.
  9. If the number of API requests is within the limit, then API Gateway sends requests to the downstream application REST API. This could be deployed using containers, Lambda, or an Amazon EC2 instance.

Customer (tenant) onboarding

There are multiple ways to set up multi-tenant applications. You can either create tenant-specific pools or add tenant ID as a custom attribute in each user profile. This blog uses the latter approach. The tenant ID is added to the JWT after successful authentication.

Since, tenant ID is an API key in API Gateway, the length of tenant ID must be a minimum of 20 characters. You can define the structure of tenant ID such as <customer id>-<random string>. As part of tenant onboarding, you can automate configuring the API key and usage plans in API Gateway using CDK APIs. Here, you configure the API key and usage plan as part of the solution deployment itself.

Authentication and authorization

You need a user pool and application client enabled with the authorization code mechanism for authenticating users. API Gateway can verify JWT OAuth tokens against single Amazon Cognito user pools. To get tenant information (tenant ID), use a custom Lambda authorizer function in API Gateway to verify the token, extract the tenant id, and return to API Gateway.

API Gateway usage plans

API Gateway supports the usage plan feature for REST APIs only. This solution uses an integration point as a MOCK integration type. You can use the usage plan to set the throttle and quota limit that are associated with API keys. API keys can be generated or you can use a custom key. To enforce usage plans for each tenant separately, use tenant ID as a prefix to a uniquely generated value to prepare the custom API key.

Configure API Gateway to integrate API key and Usage plan

You need to enable REST API to use the API key and set the source to AUTHORIZER. There are two ways to accept API keys for every incoming request. You can supply it as part of the incoming request HEADER or via a custom authorizer Lambda function. This example uses a custom authorizer Lambda function to retrieve the API key that is extracted from the JWT received through an incoming API request. Customers only pass encrypted JWTs in the request authorization header. These steps are automated using the AWS CDK.

Pre-requisites

Deploying the example

The example source code is available on GitHub. To deploy and configure solution:

  1. Clone the repository to your local machine.
    git clone https://github.com/aws-samples/api-gateway-usage-policy-based-api-protection
  2. Prepare the deployment package.
    cdk synth
    npm run build
    npm install --prefix aws-usage-policy-stack/lambda/src
  3. Configure the user pool in Amazon Cognito.
    npx cdk deploy CognitoStack
  4. Open the AWS Management Console and navigate to Amazon Cognito. Choose Manage user pool and select your user pool. Note down the pool ID under general settings.
    User pool
  5. Create a user with a tenant ID.
    aws cognito-idp admin-create-user --user-pool-id <REPLACE WITH COGNITO POOL ID> --username <REPLACE WITH USERNAME> \
    --user-attributes Name="given_name",Value="<REPLACE WITH FIRST NAME>" Name="family_name",Value="<REPLACE WITH LAST NAME>" " Name="custom:tenant_id",Value="<REPLACE WITH CUSTOMER ID>" \
    --temporary-password change1t
    
  6. To simplify testing the OAuth flow, use https://openidconnect.net/. In the configuration, set the JWKS well known URI.
    https://cognito-idp.<REPLACE WITH AWS REGION>.amazonaws.com/<REPLACE WITH COGNITO POOL ID>/.well-known/openid-configuration
  7. Test the OAuth flow with https://openidconnect.net/ to fetch the JWT ID token. Save the token in a text editor for later use.
  8. Open aws-usage-policy-stack/app.ts in an IDE and replace “NOT_DEFINED” with the 20-character long tenant ID from the previous section.
  9. Configure the user pool in API Gateway and create the Lambda function:
    npx cdk deploy ApigatewayStack
  10. After successfully deploying the API Gateway stack, open the AWS Management Console and select API Gateway. Locate ProductRestApi in the name column and note its ID.
    API Gateway console

Testing the example

Test the example using the following curl command. It throttles the requests to the deployed API based on defined limits and quotas. The following thresholds are preset: API quota limit of 5 requests/day, throttle limit of 10 requests/second, and a burst limit of 2 requests/second.

To simulate the scenario and start throttling requests.

  1. Open a terminal window.
  2. Install the curl utility if necessary.
  3. Run the following command six times after replacing placeholders with the correct values.
    curl -H "Authorization: Bearer <REPLACE WITH ID_TOKEN received in step 7 of Deploy Amazon Cognito Resources>" -X GET https://<REPLACE WITH REST API ID noted in step 10 of Deploy Amazon API Gateway resources>.execute-api.eu-west-1.amazonaws.com/dev/products.

You receive the message {“message”: “Limit Exceeded”} after you run the command for the sixth time. To repeat the tests, navigate to the API Gateway console. Change the quota limits in the usage plan and run the preceding command again. You can monitor HTTP/2 429 exceptions (Limit Exceeded) in API Gateway dashboard.

API Gateway console

Any changes to usage plan limits do not need redeployment of the API in API Gateway. You can change limits dynamically. Changes take a few seconds to become effective.

Cleaning up

To avoid incurring future charges, clean up the resources created. To delete the CDK stack, use the following command. Since there are multiple stacks, you must explicitly specify the name of the stacks.

cdk destroy CognitoStack ApigatewayStack

Conclusion

This post covers the API Gateway usage plan feature to protect multi-tenant APIs from excessive request loads and also as a product offering that enforces customer specific usage quotas.

To learn more about Amazon API Gateway, refer to Amazon API Gateway documentation. For more serverless learning resources, visit Serverless Land.

Combining Amazon AppFlow with AWS Step Functions to maximize application integration benefits

Post Syndicated from James Beswick original https://aws.amazon.com/blogs/compute/combining-amazon-appflow-with-aws-step-functions-to-maximize-application-integration-benefits/

This post is written by Ahmad Aboushady, Senior Technical Account Manager and Kamen Sharlandjiev, Senior Specialist Solution Architect, Integration.

In this blog post, you learn how to orchestrate AWS service integrations to reduce the manual steps in your workflow. The example uses AWS Step Functions SDK integration to integrate Amazon AppFlow and AWS Glue catalog without writing custom code. It automatically uses Amazon EventBridge to trigger Step Functions every time a new Amazon AppFlow flow finishes running.

Amazon AppFlow enables customers to transfer data securely between software as a service (SaaS) applications, like Salesforce, SAP, Zendesk, Slack, ServiceNow, and multiple AWS services.

An everyday use case of Amazon AppFlow is creating a customer-360 by integrating marketing, customer support, and sales data. For example, analyze the revenue impact of different marketing channels by synchronizing the revenue data from Salesforce with marketing data from Adobe Marketo.

This involves setting up flows to ingest data from different data sources and SaaS applications to AWS Data Lake based on Amazon S3. It uses AWS Glue to crawl and catalog this data. Customers use this catalog to access data quickly in several ways.

For example, they query the data using Amazon Athena or Amazon QuickSight for visualizations, business intelligence and anomaly detection. You can create those data flows quickly with no code required. However, to complete the next set of requirements, customers often go through multiple manual steps of provisioning and configuring different AWS resources. One such step requires creating AWS Glue crawler and running it with every Amazon AppFlow flow execution.

Step Functions can help us automate this process. This is a low-code workflow orchestration service that offers a visual workflow designer. You can quickly build workflows using the built-in drag-and-drop interface available in the AWS Management Console.

You can follow this blog and build your end-to-end state machine using the Step Functions Workflow Studio, or use the AWS Serverless Application Model (AWS SAM) template to deploy the example. The Step Functions state machine uses SDK integration with other AWS Services, so you don’t need to write any custom integration code.

Overview

The following diagram depicts the workflow with the different states in the state machine. You can group these into three phases: preparation, processing, and configuration.

  • The preparation phase captures all the configuration parameters and collects information about the metadata of the data, ingested by Amazon AppFlow.
  • The processing phase generates the AWS Glue table definition and sets the required parameters based on the destination file type. It iterates through the different columns and adds them as part of the table definition.
  • The last phase provides the Glue Catalog resources by creating or updating an existing AWS Glue table. With each Amazon AppFlow flow execution, the state machine determines if a new Glue table partition is required.

Workflow architecture

Preparation phase

The first state, “SetDatabaseAndContext”, is a pass state where you set the configuration parameters used in later states. Set the AWS Glue database and table name and capture the details of the data flow. You can do this by using the parameters filter to build a new JSON payload using parts of the state input similar to:

"Parameters": {
        "Config": {
          "Database": "<Glue-Database-Name>",
          "TableName.$": "$.detail['flow-name']",
          "detail.$": "$.detail"
        }
}

The following state, “DatabaseExist?” is an AWS SDK integration using a “GetDatabase” call to AWS Glue to ensure that the database exists. Here, the state uses error handling to intercept exception messages from the SDK call. This feature splits the workflow and adds an extra step if needed.

In this case, the SDK call returns an exception if the database does not exist, and the workflow invokes the “CreateDatabase” state. It moves to the “CleanUpError” state to clean up any errors and set the configuration parameters accordingly. Afterwards, with the database in place, the workflow continues to the next state: “DescribeFlow”. This returns the metadata of the Amazon AppFlow flow. Part of this metadata is the list of the object fields, which you must create in the Glue table and partitions.

Here is an error handling state that catches exceptions and routes the flow to execute an extra step:

"Catch": [
  {
    "ErrorEquals": [
      "States.ALL"
    ],
    "Comment": "Create Glue Database",
    "Next": "CreateDatabase",
    "ResultPath": "$.error"
  }
]

In the next state, “DescribeFlow”, you use the AWS SDK integration to get the Amazon AppFlow flow configuration. This uses the Amazon AppFlow “DescribeFlow API call. It moves to “S3AsDestination?”, which is a choice state to check if S3 is a destination for the flow. Amazon AppFlow allows you to bring data into different purpose-built data stores, such as S3, Amazon Redshift, or external SaaS or data warehouse applications. This automation can only continue if the configured destination is S3.

The choice definition is:

"Choices": [
  {
    "Variable": "$.FlowConfig.DestinationFlowConfigList[0].ConnectorType",
    "StringEquals": "S3",
    "Next": "GenerateTableDefinition"
  }
],
"Default": "S3NotDestination"

Processing phase

The following state generates the base AWS Glue table definition based on the destination file type. Then it uses a map state to iterate and transform the Amazon AppFlow schema output into what the AWS Glue Data Catalog expects as input.

Next, add the “GenerateTableDefinition” state and use the parameters filter to build a new JSON payload output. Finally, use the information from the “DescribeFlow” state similar to:

"Parameters": {
  "Config.$": "$.Config",
  "FlowConfig.$": "$.FlowConfig",
  "TableInput": {
    "Description": "Created by AmazonAppFlow",
    "Name.$": "$.Config.TableName",
    "PartitionKeys": [
      {
        "Name": "partition_0",
        "Type": "string"
      }
    ],
    "Retention": 0,
    "Parameters": {
      "compressionType": "none",
      "classification.$": "$.FlowConfig.DestinationFlowConfigList[0].DestinationConnectorProperties['S3'].S3OutputFormatConfig.FileType",
      "typeOfData": "file"
    },
    "StorageDescriptor": {
      "BucketColumns": [],
      "Columns.$": "$.FlowConfig.Tasks[?(@.TaskType == 'Map')]",
      "Compressed": false,
      "InputFormat": "org.apache.hadoop.mapred.TextInputFormat",
      "Location.$": "States.Format('{}/{}/', $.Config.detail['destination-object'], $.FlowConfig.FlowName)",
      "NumberOfBuckets": -1,
      "OutputFormat": "org.apache.hadoop.hive.ql.io.HiveIgnoreKeyTextOutputFormat",
      "SortColumns": [],
      "StoredAsSubDirectories": false
    },
    "TableType": "EXTERNAL_TABLE"
  }
}

The following state, “DestinationFileFormatEvaluator”, is a choice state to change the JSON payload according to the destination file type. Amazon AppFlow supports different file type conversions when S3 is the destination of your data. These formats are CSV, Parquet, and JSON Lines. AWS Glue uses various serialization libraries according to the file type.

You iterate within a map state to transform the AWS Glue table schema and set the column type to a known AWS Glue format. If the file type is unrecognized or does not have an equivalent in Glue, default this field to string. The map state configuration is defined as:

"Iterator": {
        "StartAt": "KnownFIleFormat?",
        "States": {
          "KnownFIleFormat?": {
            "Type": "Choice",
            "Choices": [
              {
                "Or": [
                  {
                    "Variable": "$.TaskProperties.SOURCE_DATA_TYPE",
                    "StringEquals": "boolean"
                  },
                  {
                    "Variable": "$.TaskProperties.SOURCE_DATA_TYPE",
                    "StringEquals": "double"
                  },
                  .
                  .
                  .
                  .
                  {
                    "Variable": "$.TaskProperties.SOURCE_DATA_TYPE",
                    "StringEquals": "timestamp"
                  }
                ],
                "Next": "1:1 mapping"
              }
            ],
            "Default": "Cast to String"
          },
          "1:1 mapping": {
            "Type": "Pass",
            "End": true,
            "Parameters": {
              "Name.$": "$.DestinationField",
              "Type.$": "$.TaskProperties.SOURCE_DATA_TYPE"
            }
          },
          "Cast to String": {
            "Type": "Pass",
            "End": true,
            "Parameters": {
              "Name.$": "$.DestinationField",
              "Type": "string"
            }
          }
        }
      },
"ItemsPath": "$.TableInput.StorageDescriptor.Columns",
"ResultPath": "$.TableInput.StorageDescriptor.Columns",

Configuration phase

The next stage in the workflow is “TableExist?”, which checks if the Glue table exists. If the state machine detects any error because the table does not exist, it moves to the “CreateTable” state. Alternatively, it goes to the “UpdateTable” state.

Both states use the AWS SDK integration to create or update the AWS Glue table definition using the “TableInput” parameter. AWS Glue operates with partitions. Every time you have new data stored in a new S3 prefix, you must update the table and add a new partition showing where the data sits.

You need an extra step to check if Amazon AppFlow has stored the data into a new S3 prefix or an existing one. In the “AddPartition?” State, you must review and determine the next step of your workflow. For example, you must validate that the flow executed successfully and processed data.

A choice state helps with those checks:

"And": [
            {
              "Variable": "$.Config.detail['execution-id']",
              "IsPresent": true
            },
            {
              "Variable": "$.Config.detail['status']",
              "StringEquals": "Execution Successful"
            },
            {
              "Not": {
                "Variable": "$.Config.detail['num-of-records-processed']",
                "StringEquals": "0"
              }
            }
          ]

Amazon AppFlow supports different types of flow execution. With scheduled flows, you can regularly configure Amazon AppFlow to hydrate a data lake by bringing only new data since its last execution. Sometimes, after a successful flow execution, there is no new data to ingest. The workflow concludes and moves to the success state in such cases. However, if there is new data, the state machine continues to the next state, “SingleFileAggregation?”.

Amazon AppFlow supports different file aggregation strategies and allows you to aggregate all ingested records into a single or multiple files. Depending on your flow configuration, it may store your data in a different S3 prefix with each flow execution.

In this state, you check this configuration to decide if you need a new partition for your AWS Glue table.

"Variable": "$.FlowConfig.DestinationFlowConfigList[0].DestinationConnectorProperties.S3.S3OutputFormatConfig.AggregationConfig.AggregationType",
"StringEquals": "SingleFile"

If the data flow aggregates all records into a single file per flow execution, it stores all data into a single S3 prefix. In this case, there is a single partition in your AWS Glue table. You must create that single partition the first time this state machine executes for a specific flow.

Use the AWS SDK integration to get the table partition from the AWS Glue in the “IsPartitionExist?” state. Conclude the workflow and move to the “Success” state if the partition exists. Otherwise, create that single partition in another state, “CreateMainPartition”.

If the flow run does not aggregate files, every flow run generates multiple files into a new S3 prefix. In this case, you add a new partition to the AWS Glue table. A pass state, “ConfigureDestination”, configures the required parameters for the partition creation:

"Parameters": {
        "InputFormat.$": "$.TableInput.StorageDescriptor.InputFormat",
        "OutputFormat.$": "$.TableInput.StorageDescriptor.OutputFormat",
        "Columns.$": "$.TableInput.StorageDescriptor.Columns",
        "Compressed.$": "$.TableInput.StorageDescriptor.Compressed",
        "SerdeInfo.$": "$.TableInput.StorageDescriptor.SerdeInfo",
        "Location.$": "States.Format('{}{}', $.TableInput.StorageDescriptor.Location, $.Config.detail['execution-id'])"
      },
 "ResultPath": "$.TableInput.StorageDescriptor"

Next, move to the “CreateNewPartition” state to use the AWS SDK integration to create a new partition to the Glue table similar to:

"Parameters": {
        "DatabaseName.$": "$.Config.Database",
        "TableName.$": "$.Config.TableName",
        "PartitionInput": {
          "Values.$": "States.Array($.Config.detail['execution-id'])",
          "StorageDescriptor.$": "$.TableInput.StorageDescriptor"
        }
      },
"Resource": "arn:aws:states:::aws-sdk:glue:createPartition"

This concludes the workflow with a “Succeed” state after configuring the AWS Glue table in response to the new Amazon AppFlow flow run.

Conclusion

This blog post explores how to integrate Amazon AppFlow and AWS Glue using Step Functions to automate your business requirements. You can use AWS Lambda to simplify the configuration phase and reduce state transitions or create complex checks, filters, or even data cleansing and preparation.

This approach allows you to tailor the schema conversion to your business requirements. Use this AWS SAM template, to deploy this example. This provides the Step Functions workflow described in this post and the EventBridge rule to trigger the state machine after each Amazon AppFlow flow run. The template also includes all required IAM roles and permissions.

For more serverless learning resources, visit Serverless Land.

Optimizing your AWS Lambda costs – Part 2

Post Syndicated from James Beswick original https://aws.amazon.com/blogs/compute/optimizing-your-aws-lambda-costs-part-2/

This post is written by Chris Williams, Solutions Architect and Thomas Moore, Solutions Architect, Serverless.

Part 1 of this blog series looks at optimizing AWS Lambda costs through right-sizing a function’s memory, and code tuning. We also explore how using Graviton2, Provisioned Concurrency and Compute Savings Plans can offer a reduction in per-millisecond billing.

Part 2 continues to explore cost optimization techniques for Lambda with a focus on architectural improvements and cost-effective logging.

Event filtering

A common serverless architecture pattern is Lambda reading events from a queue or a stream, such as Amazon SQS or Amazon Kinesis Data Streams. This uses an event source mapping, which defines how the Lambda service handles incoming messages or records from the event source.

Event filtering

Sometimes you don’t want to process every message in the queue or stream because the data is not relevant. For example, if IoT vehicle data is sent to a Kinesis Stream and you only want to process events where tire_pressure is < 32, then the Lambda code may look like this:

def lambda_handler(event, context):
   if(event[“tire_pressure”] >=32):
      return

# business logic goes here

This is inefficient as you are paying for Lambda invocations and execution time when there is no business value beyond filtering.

Lambda now supports the ability to filter messages before invocation, simplifying your code and reducing costs. You only pay for Lambda when the event matches the filter criteria and triggers an invocation.

Filtering is supported for Kinesis Streams, Amazon DynamoDB Streams and SQS by specifying filter criteria when setting up the event source mapping. For example, using the following AWS CLI command:

aws lambda create-event-source-mapping \
--function-name fleet-tire-pressure-evaluator \
--batch-size 100 \
--starting-position LATEST \
--event-source-arn arn:aws:kinesis:us-east-1:123456789012:stream/fleet-telemetry \
--filter-criteria '{"Filters": [{"Pattern": "{\"tire_pressure\": [{\"numeric\": [\"<\", 32]}]}"}]}'

After applying the filter, Lambda is only invoked when tire_pressure is less than 32 in messages received from the Kinesis Stream. In this example, it may indicate a problem with the vehicle and require attention.

For more information on how to create filters, refer to examples of event pattern rules in EventBridge, as Lambda filters messages in the same way. Event filtering is explored in greater detail in the Lambda event filtering launch blog.

Avoid idle wait time

Lambda function duration is one dimension used for calculating billing. When function code makes a blocking call, you are billed for the time that it waits to receive a response.

This idle wait time can grow when Lambda functions are chained together, or a function is acting as an orchestrator for other functions. For customers who have workflows such as batch operations or order delivery systems, this adds management overhead. Additionally, it may not be possible to complete all workflow logic and error handling within the maximum Lambda timeout of 15 minutes.

Instead of handling this logic in function code, re-architect your solution to use AWS Step Functions as an orchestrator of the workflow. When using a standard workflow, you are billed for each state transition within the workflow rather than the total duration of the workflow. In addition, you can move support for retries, wait conditions, error workflows and callbacks into the state condition allowing your Lambda functions to focus on business logic.

The following example shows an example Step Functions state machine, where a single Lambda function is split into multiple states. During the wait period, there is no charge. You are only billed on state transition.

State machine

Direct integrations

If a Lambda function is not performing custom logic when it integrates with other AWS services, it may be unnecessary and could be replaced by a lower-cost direct integration.

For example, you may be using API Gateway together with a Lambda function to read from a DynamoDB table:

With Lambda

This could be replaced using a direct integration, removing the Lambda function:

Without Lambda

API Gateway supports transformations to return the output response in a format the client expects. This avoids having to use a Lambda function to do the transformation. You can find more detailed instructions on creating an API Gateway with an AWS service integration in the documentation.

You can also benefit from direct integration when using Step Functions. Today, Step Functions supports over 200 AWS services and 9,000 API actions. This gives greater flexibility for direct service integration and in many cases removes the need for a proxy Lambda function. This can simplify Step Function workflows and may reduce compute costs.

Reduce logging output

Lambda automatically stores logs that the function code generates through Amazon CloudWatch Logs. This may be useful for understanding what is happening within your application in near real-time. CloudWatch Logs includes a charge for the total data ingested throughout the month. Therefore, reducing output to include only necessary information can help reduce costs.

When you deploy workloads into production, review the logging level of your application. For example, in a pre-production environment, debug logs can be beneficial in providing additional information to tune the function. Within your production workloads, you may disable debug level logs and use a logging library (such as the Lambda Powertools Python Logger). You can define a minimum logging level to output by using an environment variable, which allows configuration outside of the function code.

Structuring your log format enforces a standard set of information through a defined schema, instead of allowing variable formats or large volumes of text. Defining structures such as error codes and adding accompanying metrics leads to a reduction in the volume of text that repeats throughout your logs. This also improves the ability to filter logs for specific error types and reduces the risk of a mistyped character in a log message.

Use Cost-Effective Storage for Logs

Once CloudWatch Logs ingests data, by default it is persisted forever with a per-GB monthly storage fee. As log data ages, it typically becomes less valuable in the immediate time frame, and is instead reviewed historically on an ad-hoc basis. However, the storage pricing within CloudWatch Logs remains the same.

To avoid this, set retention policies on your CloudWatch Logs log groups to delete old log data automatically. This retention policy applies to both your existing and future log data.

Some applications logs may need to persist for months or years for compliance or regulatory requirements. Instead of keeping the logs in CloudWatch Logs, export them to Amazon S3. By doing this, you can take advantage of lower-cost storage object classes while factoring in any expected usage patterns for how or when data is accessed.

Conclusion

Cost optimization is an important part of creating well-architected solutions and this is no different when using serverless. This blog series explores some best practice techniques to help reduce your Lambda bill.

If you are already running AWS Lambda applications in production today, some techniques are easier to implement than others. For example, you can purchase Savings Plans with zero code or architecture changes, whereas avoiding idle wait time will require new services and code changes. Evaluate which technique is right for your workload in a development environment before applying changes to production.

If you are still in the design and development stages, use this blog series as a reference to incorporate these cost optimization techniques at an early stage. This ensures that your solutions are optimized from day one.

To get hands-on implementing some of the techniques discussed, take the Serverless Optimization Workshop.

For more serverless learning resources, visit Serverless Land.

Optimizing your AWS Lambda costs – Part 1

Post Syndicated from James Beswick original https://aws.amazon.com/blogs/compute/optimizing-your-aws-lambda-costs-part-1/

This post is written by Chris Williams, Solutions Architect and Thomas Moore, Solutions Architect, Serverless.

When you develop and architect solutions, cost-optimization should always be part of the process. This is no different for serverless applications that have been developed using AWS Lambda.

Your workloads may vary in terms of complexity, usage patterns, and technology. However, the following advice is applicable to all customers when deciding how to prioritize cost optimization with the tradeoffs of developing the application:

  • Efficient code makes better use of resources.
  • Consider the downstream services in architectural decisions.
  • Optimization should be a continuous cycle of improvement.
  • Prioritize changes that make the greatest improvements first.

The Optimizing your AWS Lambda costs blog series reviews operational and architectural guidance. It can be applied to existing Lambda functions and those that you develop in the future.

Introduction to Lambda pricing

Lambda pricing is calculated as a combination of:

  • Total number of requests
  • Total duration of invocations
  • Configured memory allocated

When you optimize Lambda functions, each of these components impacts the total monthly cost. This pricing applies after you exceed the AWS Free Tier that is offered for Lambda.

Right-Sizing

Right-sizing is a good starting point in the process of cost optimization. This exercise helps to identify the lowest cost for applications without affecting performance or requiring code changes.

For Lambda, this is accomplished by configuring the memory for a function, ranging anywhere from 128 MB up to 10,240 MB (10 GB). By adjusting the memory configuration, you also adjust the amount of vCPU that is available to the function during invocation. Tuning these settings provides memory- or CPU-bound applications with access to additional resources during the execution, which may lead to an overall reduced duration of invocation.

Identifying the optimal configuration for your Lambda functions may be manually intensive, especially if changes are made frequently. The AWS Lambda Power Tuning tool provides a solution powered by AWS Step Functions that can help identify the appropriate configuration. It analyzes a set of memory configurations against an example payload.

In the following example, as the memory increases for this Lambda function, the total invocation time improves. This leads to a reduction in the cost for the total execution without affecting the original performance of the function. For this function, the optimal memory configuration for the function is 512 MB, as this is where the resource utilization is most efficient for the total cost of each invocation. This varies per function, and using the tool on your Lambda functions can identify if they benefit from right-sizing.

Power Tuning results

This exercise should be completed regularly, especially if code is released frequently. Once you have identified the appropriate memory setting for your Lambda functions, you should add right-sizing to your processes. The AWS Lambda Power Tuning tool generates programmatic output that can be used by your CI/CD workflows during the release of new code, allowing the automation of memory configuration.

Performance efficiency

A key component to Lambda pricing is the total duration of the invocation. The longer the function takes to run, the more it costs and the higher the latency in your application. For this reason, it is important to ensure the code you write is as efficient as possible and follows the Lambda best practices.

At a high level, to optimize code :

  • Minimize deployment package size to its runtime necessities. This reduces the amount of time it takes for the package to be downloaded and unpacked.
  • Minimize the complexity of dependencies. Simpler frameworks often load faster.
  • Take advantage of execution reuse. Initialize SDK clients and database connections outside the function handler, and cache static assets locally in the /tmp directory. Subsequent invocations can reuse open connections and resources in memory and in /tmp.
  • Follow general coding performance best practices for your chosen language and runtime.

To help visualize the components of your application and identify performance bottlenecks, use AWS X-Ray with Lambda. You can enable X-Ray active tracing on new and existing functions by editing the function configuration. For example, with the AWS CLI:

aws lambda update-function-configuration --function-name my-function \
--tracing-config Mode=Active

The AWS X-Ray SDK can be used to trace all AWS SDK calls inside Lambda functions. This helps to identify any bottlenecks in the application performance. The X-Ray SDK for Python can be used to capture data for other libraries such as requests, sqlite3, and httplib, as shown in the following example:

Segments timeline

Amazon CodeGuru Profiler is another tool that can help with code optimization. It uses machines learning algorithms to help find the most expensive lines of code and suggests ways to improve efficiency. It can be enabled on existing Lambda functions by enabling code profiling in the function configuration.

The CodeGuru console shows the results as a series of visualizations and recommendations.

Code Guru recommendations

Use these tools together with the documented best practices to evaluate your code’s performance when developing your serverless applications. Efficient code often means faster applications and reduced costs.

AWS Graviton2

In September 2021, Lambda functions powered by Arm-based AWS Graviton2 processors became generally available. Graviton2 functions are designed to deliver up to 19% better performance at 20% lower cost than x86. In addition to the lower billing cost when using Arm, you could also see a reduction in the function duration due to the CPU performance improvement, reducing costs even further.

You can configure both new and existing functions to target the AWS Graviton2 processor. Functions are invoked in the same way and integrations with services, applications and tools are not affected by the architecture change. Many functions only need the configuration change to take advantage of the price/performance of Graviton2. Others may require repackaging to use Arm-specific dependencies.

It’s always recommended to test your workloads before making the change. To see how much your code benefits from using Graviton2, use the Lambda Power Tuning tool to compare against x86. The tool allows you to compare two results on the same chart:

AWS Lambda Power Tuning Results

Provisioned concurrency

Where customers are looking to reduce their Lambda function cold starts or avoid burst throttling, provisioned concurrency provides execution environments that are ready to be invoked. It can also reduce total Lambda cost when there is a consistent volume of traffic. This is because the provisioned concurrency pricing model offers a lower total price when it is fully used.

Similar to the standard Lambda function pricing, there are price components for total requests, total duration, and memory configuration. In addition, there is the cost of each provisioned concurrency environment (based on its memory configuration). When this execution environment is fully utilized, the combined cost of the invocation and the execution environment can offer up to 16% savings on duration cost when compared to the regular on-demand pricing.

If you cannot maximize usage in an execution environment, provisioned concurrency can still offer a lower total price per invocation. In the following example, once it’s consumed for more than 60% of the available time, it becomes cheaper than using the on-demand pricing model. The savings increase in line with capacity usage.

PC vs on-demand comparison

To identify the invocation baseline of a Lambda function, look at the average concurrent execution metrics per hour over the previous 24 hours. This helps you to find a consistent baseline throughout the day where you are consistently using multiple execution environments.

For Lambda functions where peak invocation levels are only expected during particular windows of time, take advantage of a scheduled scaling action. Where traffic patterns are not easy to determine, you can implement Application Auto Scaling to adjust based on the current level of utilization.

Compute savings plans

AWS Savings Plans is a flexible pricing model offering lower prices compared to on-demand pricing, in exchange for a specific usage commitment (measured in $/hour) for a one- or three-year period.

Compute Savings Plans include Amazon EC2, AWS Fargate and Lambda. Lambda usage for duration and provisioned concurrency are charged at a discounted Savings Plans rate of up to 17% for a 1- or 3-year term.

You can implement Savings Plans without any function code or configuration changes. They can be a simpler way to save money for Lambda-based workloads. Before deciding to use a savings plan, analyze previous patterns to understand any variations in your month to month usage.

Conclusion

This blog post explains how Lambda pricing works and how right-sizing applications and tuning them for performance efficiency offers a more cost-efficient utilization model. The results can also reduce latency, creating a better experience for your end users.

The post explores how architectural changes such as moving to Graviton2 and configuring provisioned concurrency can provide cost reductions for the same operations. Finally, you can use Compute Savings Plans to add an additional cost reduction once you establish a baseline of usage per month.

Part 2 introduces further optimization opportunities for reducing Lambda invocations, moving to an asynchronous model, and reducing logging costs.

For more serverless learning resources, visit Serverless Land.

Testing Amazon EventBridge events using AWS Step Functions

Post Syndicated from James Beswick original https://aws.amazon.com/blogs/compute/testing-amazon-eventbridge-events-using-aws-step-functions/

This post is written by Siarhei Kazhura, Solutions Architect and Riaz Panjwani, Solutions Architect.

Amazon EventBridge is a serverless event bus that can be used to ingest and process events from a variety of sources, such as AWS services and SaaS applications. With EventBridge, developers can build loosely coupled and independently scalable event-driven applications.

It can be useful to know with EventBridge when events are not able to reach the desired destination. This can be caused by multiple factors, such as:

  1. Event pattern does not match the event rule
  2. Event transformer failure
  3. Event destination expects a different payload (for example, API destinations) and returns an error

EventBridge sends metrics to Amazon CloudWatch, which allows for the detection of failed invocations on a given event rule. You can also use EventBridge rules with a dead-letter queue (DLQ) to identify any failed event deliveries. The messages delivered to the queue contain additional metadata such as error codes, error messages, and the target ARN for debugging.

However, understanding why events fail to deliver is still a manual process. Checking CloudWatch metrics for failures, and then the DLQ takes time. This is evident when developing new functionality, when you must constantly update the event matching patterns and event transformers, and run tests to see if they provide the desired effect. EventBridge sandbox functionality can help with manual testing but this approach does not scale or help with automated event testing.

This post demonstrates how to automate testing for EventBridge events. It uses AWS Step Functions for orchestration, along with Amazon DynamoDB and Amazon S3 to capture the results of your events, Amazon SQS for the DLQ, and AWS Lambda to invoke the workflows and processing.

Overview

Using the solution provided in this post, users can track events from its inception to delivery and identify where any issues or errors are occurring. This solution is also customizable, and can incorporate integration tests against events to test pattern matching and transformations.

Reference architecture

At a high level:

  1. The event testing workflow is exposed via an API Gateway endpoint, and users can send a request.
  2. This request is validated and routed to a Step Functions EventTester workflow, which performs the event test.
  3. The EventTester workflow creates a sample event based on the received payload, and performs multiple tests on the sample event.
  4. The sample event is matched against the rule that is being tested. The results are stored in an Amazon DynamoDB EventTracking table, and the transformed event payload is stored in the TransformedEventPayload Amazon S3 bucket.
  5. The EventTester workflow has an embedded AWS Step Functions workflow called EventStatusPoller. The EventStatusPoller workflow polls the EventTracking table.
  6. The EventStatusPoller workflow has a customizable 10-second timeout. If the timeout is reached, this may indicate that the event pattern does not match. EventBridge tests if the event does not match against a given pattern, using the AWS SDK for EventBridge.
  7. After completing the tests, the response is formatted and sent back to the API Gateway. By default, the timeout is set to 15 seconds.
  8. API Gateway processes the response, strips the unnecessary elements, and sends the response back to the issuer. You can use this response to verify if the test event delivery is successful, or identify the reason a failure occurred.

EventTester workflow

After an API call, this event is sent to the EventTester express workflow. This orchestrates the automated testing, and returns the results of the test.

EventTester workflow

In this workflow:

1. The test event is sent to EventBridge to see if the event matches the rule and can be transformed. The result is stored in a DynamoDB table.
2. The PollEventStatus synchronous Express Workflow is invoked. It polls the DynamoDB table until a record with the event ID is found or it reaches the timeout. The configurable timeout is 15 seconds by default.
3. If a record is found, it checks the event status.

From here, there are three possible states. In the first state, if the event status has succeeded:

4. The response from the PollEventStatus workflow is parsed and the payload is formatted.
5. The payload is stored in an S3 bucket.
6. The final response is created, which includes the payload, the event ID, and the event status.
7. The execution is successful, and the final response is returned to the user.

In the second state, if no record is found in the table and the PollEventStatus workflow reaches the timeout:

8. The most likely explanation for reaching the timeout is that the event pattern does not match the rule, so the event is not processed. You can build a test to verify if this is the issue.
9. From the EventBridge SDK, the TestEventPattern call is made to see if the event pattern matches the rule.
10. The results of the TestEventPattern call are checked.
11. If the event pattern does not match the rule, then the issue has been successfully identified and the response is created to be sent back to the user. If the event pattern matches the rule, then the issue has not been identified.
12. The response shows that this is an unexpected error.

In the third state, this acts as a catch-all to any other errors that may occur:

13. The response is created with the details of the unexpected error.
14. The execution has failed, and the final response is sent back to the user.

Event testing process

The following diagram shows how events are sent to EventBridge and their results are captured in S3 and DynamoDB. This is the first step of the EventTester workflow:

Event testing process

When the event is tested:

  1. The sample event is received and sent to the EventBridge custom event bus.
  2. A CatchAll rule is triggered, which captures all events on the custom event bus.
  3. All events from the CatchAll rule are sent to a CloudWatch log group, which allows for an original payload inspection.
  4. The event is also propagated to the EventTesting rule. The event is matched against the rule pattern, and if successful the event is transformed based on the transformer provided.
  5. If the event is matched and transformed successfully, the Lambda function EventProcessor is invoked to process the transformed event payload. You can add additional custom code to this function for further testing of the event (for example, API integration with the transformed payload).
  6. The event status is updated to SUCCESS and the event metadata is saved to the EventTracking DynamoDB table.
  7. The transformed event payload is saved to the TransformedEventPayload S3 bucket.
  8. If there’s an error, EventBridge sends the event to the SQS DLQ.
  9. The Lambda function ErrorHandler polls the DLQ and processes the errors in batches.
  10. The event status is updated to ERROR and the event metadata is saved to the EventTracking DynamoDB table.
  11. The event payload is saved to the TransformedEventPayload S3 bucket.

EventStatusPoller workflow

EventStatusPoller workflow

When the poller runs:

  1. It checks the DynamoDB table to see if the event has been processed.
  2. The result of the poll is checked.
  3. If the event has not been processed, the workflow loops and polls the DynamoDB table again.
  4. If the event has been processed, the results of the event are passed to next step in the Event Testing workflow.

Visit Composing AWS Step Functions to abstract polling of asynchronous services for additional details.

Testing at scale

Testing at scale

The EventTester workflow uses Express Workflows, which can handle testing high volume event workloads. For example, you can run the solution against large volumes of historical events stored in S3 or CloudWatch.

This can be achieved by using services such as Lambda or AWS Fargate to read the events in batches and run tests simultaneously. To achieve optimal performance, some performance tuning may be required depending on the scale and events that are being tested.

To minimize the cost of the demo, the DynamoDB table is provisioned with 5 read capacity units and 5 write capacity units. For a production system, consider using on-demand capacity, or update the provisioned table capacity.

Event sampling

Event sampling

In this implementation, the EventBridge EventTester can be used to periodically sample events from your system for testing:

  1. Any existing rules that must be tested are provisioned via the AWS CDK.
  2. The sampling rule is added to an existing event bus, and has the same pattern as the rule that is tested. This filters out events that are not processed by the tested rule.
  3. SQS queue is used for buffering.
  4. Lambda function processes events in batches, and can optionally implement sampling. For example, setting a 10% sampling rate will take one random message out of 10 messages in a given batch.
  5. The event is tested against the endpoint provided. Note that the EventTesting rule is also provisioned via AWS CDK from the same code base as the tested rule. The tested rule is replicated into the EventTesting workflow.
  6. The result is returned to a Lambda function, and is then sent to CloudWatch Logs.
  7. A metric is set based on the number of ERROR responses in the logs.
  8. An alarm is configured when the ERROR metric crosses a provided threshold.

This sampling can complement existing metrics exposed for EventBridge via CloudWatch.

Solution walkthrough

To follow the solution walkthrough, visit the solution repository. The walkthrough explains:

  1. Prerequisites required.
  2. Detailed solution deployment walkthrough.
  3. Solution customization and testing.
  4. Cleanup process.
  5. Cost considerations.

Conclusion

This blog post outlines how to use Step Functions, Lambda, SQS, DynamoDB, and S3 to create a workflow that automates the testing of EventBridge events. With this example, you can send events to the EventBridge Event Tester endpoint to verify that event delivery is successful or identify the root cause for event delivery failures.

For more serverless learning resources, visit Serverless Land.

Building resilient private APIs using Amazon API Gateway

Post Syndicated from Eric Johnson original https://aws.amazon.com/blogs/compute/building-resilient-private-apis-using-amazon-api-gateway/

This post written by Giedrius Praspaliauskas, Senior Solutions Architect, Serverless.

Modern architectures meet recovery objectives (recovery time objective, RTO, and recovery point objective, RPO) by being resilient to routine and unexpected infrastructure disruptions. Depending on the recovery objectives and regulatory requirements, developers must choose the disaster recovery strategy. For more on disaster recovery strategies, see this whitepaper.

AWS’ global infrastructure enables customers to support applications with near zero RTO requirements. Customers can run workloads in multiple Regions, in a multi-site active/active manner, and serve traffic from all Regions. To do so, developers often must implement private multi-regional APIs for use by the applications.

This blog describes how to implement this solution using Amazon API Gateway and Amazon Route 53.

Overview

The first step is to build a REST API that uses private API Gateway endpoints with custom domain names as described in this sample. The next step is to deploy APIs in two AWS Regions and configure Route 53, following a disaster recovery strategy.
This architecture uses the following resources in each Region:

Two region architecture example

Two region architecture example

  • API Gateway with an AWS Lambda function as integration target.
  • Amazon Virtual Private Cloud (Amazon VPC) with two private subnets, used to deploy VPC endpoint and Network Load Balancers (NLB).
  • AWS Transit Gateway to establish connectivity between the two VPCs in different Regions.
  • VPC endpoint to access API Gateway from a private VPC.
  • Elastic network interfaces (ENIs) created by the VPC endpoint.
  • A Network Load Balancer with ENIs in its target group and a TLS listener with an AWS Certificate Manager (ACM) certificate, used as a facade for the API.
  • ACM issues and manages certificates used by the NLB TLS listener and API Gateway custom domain.
  • Route 53 with private hosted zones used for DNS resolution.
  • Amazon CloudWatch with alarms used for Route 53 health checks.

This sample implementation uses a Lambda function as an integration target, though it can target on-premises resources accessible via AWS Direct Connect, and applications running on Amazon EKS. For more information on best practices designing API Gateway private APIs, see this whitepaper.

This post uses AWS Transit Gateway with inter-Region peering to establish connectivity between the two VPCs. Depending on the networking needs and infrastructure already in place, you may tailor the architecture and use a different approach. Read this whitepaper for more information on available VPC-to-VPC connectivity options.

Implementation

Prerequisites

You can use existing infrastructure to deploy private APIs. Otherwise check the sample repository for templates and detailed instructions on how to provision the necessary infrastructure.

This post uses the AWS Serverless Application Model (AWS SAM) to deploy private APIs with custom domain names. Visit the documentation to install it in your environment.

Deploying private APIs into multiple Regions

To deploy private APIs with custom domain names and CloudWatch alarms for health checks into the two AWS Regions:

  1. Download the AWS SAM template file api.yaml from the sample repository. Replace default parameter values in the template with ones that match your environment or provide them during the deployment step.
  2. Navigate to the directory containing the template. Run following commands to deploy the API stack in the us-east-1 Region:
    sam build --template-file api.yaml
    sam deploy --template-file api.yaml --guided --stack-name private-api-gateway --region us-east-1
  3. Repeat the deployment in the us-west-2 Region. Update the parameters values in the template to match the second Region (or provide them as an input during the deployment step). Run the following commands:
    sam build --template-file api.yaml
    sam deploy --template-file api.yaml --guided --stack-name private-api-gateway --region us-west-2

Setting up Route 53

With the API stacks deployed in both Regions, create health checks to use them in Route 53:

  1. Navigate to Route 53 in the AWS Management Console. Use the CloudWatch alarms created in the previous step to create health checks (one per Region):
    Configuring the health check for region 1

    Configuring the health check for region 1

    Configuring the health check for region 2

    Configuring the health check for region 2

    This Route 53 health check uses the CloudWatch alarms that are based on a static threshold of the NLB healthy host count metric in each Region. In your implementation, you may need more sophisticated API health status tracking. It can use anomaly detection, include metric math, or use a composite state of the multiple alarms. Check this documentation article for more information on CloudWatch alarms. You can also use the approach documented in this blog post as an alternative. It will help you to create a health check solution that observes the state of the private resources and creates custom metrics that are more specific to your use case. For example, such metrics could include increased database transactions’ failure rate, number of timed out requests to a downstream legacy system, status of an external system that your workload depends on, etc.

  2. Create a private Route 53 hosted zone. Associate this with the VPCs where the client applications that access private APIs reside:

    Create a private hosted zone

    Create a private hosted zone

  3. Create Route 53 private zone alias records, pointing to the NLBs in both Regions and VPCs, using the same name for both records (for example, private.internal.example.com):

    Create alias records

    Create alias records

This post uses Route 53 latency-based routing for private DNS to implement resilient active-active private API architecture. Depending on your use case and disaster recovery strategy, you can change this approach and use geolocation-based routing, failover, or weighted routing. See the documentation for more details on supported routing policies for the records in a private hosted zone.

In this implementation, client applications that connect to the private APIs reside in the VPCs and can access Route 53 private hosted zones. You may also operate an application that runs on-premises and must access the private APIs. Read this blog post for more information on how to create DNS naming that spans the entire network.

Validating the configuration

To validate this implementation, I use a bastion instance in each of the VPCs. I connect to them using SSH or AWS Systems Manager Session Manager (see this documentation article for details).

  1. Run the following command from both bastion instances:
    dig +short private.internal.com

    The response should contain IP addresses of the NLB in one VPC:

    10.2.2.188
    10.2.1.211
  2. After DNS resolution verification, run the following command in each of the VPCs:
    curl -s -XGET https://private.internal.example.com/demo

    The response should include event data as the Lambda function received it.

  3. To simulate an outage, navigate to Route 53 in the AWS Management Console. Select the health check that corresponds to the Region where you received the response, and invert the health status:
  4. After a few minutes, retry the same DNS resolution and API response validation steps. This time, it routes all your requests to the remaining healthy API stack.

Cleaning Up

To avoid incurring further charges, delete all the resources that you have created in Route 53 records, health checks, and private hosted zones.

Run the following commands to delete API stacks in both Regions:

sam delete --stack-name private-api-gateway --region us-west-2
sam delete --stack-name private-api-gateway --region us-east-1

If you used the sample templates to provision the infrastructure, follow the steps listed in the Cleanup section of the sample repository instructions.

Conclusion

This blog post walks through implementing a multi-Regional private API using API Gateway with custom domain names. This approach allows developers to make their internal applications and workloads more resilient, react to disruptions, and meet their disaster recovery scenario objectives.

For additional guidance on such architectures, including multi-Region application architecture, see this solutionblog post, re:Invent presentation.

For more serverless learning resources, visit Serverless Land.

Node.js 16.x runtime now available in AWS Lambda

Post Syndicated from James Beswick original https://aws.amazon.com/blogs/compute/node-js-16-x-runtime-now-available-in-aws-lambda/

This post is written by Dan Fox, Principal Specialist Solutions Architect, Serverless.

You can now develop AWS Lambda functions using the Node.js 16 runtime. This version is in active LTS status and considered ready for general use. To use this new version, specify a runtime parameter value of nodejs16.x when creating or updating functions or by using the appropriate container base image.

The Node.js 16 runtime includes support for ES modules and top-level await that was added to the Node.js 14 runtime in January 2022. This is especially useful when used with Provisioned Concurrency to reduce cold start times.

This runtime version is supported by functions running on either Arm-based AWS Graviton2 processors or x86-based processors. Using the Graviton2 processor architecture option allows you to get up to 34% better price performance.

We recognize that customers have been waiting for some time for this runtime release. We hear your feedback and plan to release the next Node.js runtime version in a timelier manner.

AWS SDK for JavaScript

The Node.js 16 managed runtimes and container base images bundle the AWS JavaScript SDK version 2. Using the bundled SDK is convenient for a few use cases. For example, developers writing short functions via the Lambda console or inline functions via CloudFormation templates may find it useful to reference the bundled SDK.

In general, however, including the SDK in the function’s deployment package is good practice. Including the SDK pins a function to a specific minor version of the package, insulating code from SDK API or behavior changes. To include the SDK, refer to the SDK package and version in the dependency object of the package.json file. Use a package manager like npm or yarn to download and install the library locally before building and deploying your deployment package to the AWS Cloud.

Customers who take this route should consider using the JavaScript SDK, version 3. This version of the SDK contains modular packages. This can reduce the size of your deployment package, improving your function’s performance. Additionally, version 3 contains improved TypeScript compatibility, and using it will maximize compatibility with future runtime releases.

Language updates

With this release, Lambda customers can take advantage of new Node.js 16 language features, including:

Prebuilt binaries for Apple Silicon

Node.js 16 is the first runtime release to ship prebuilt binaries for Apple Silicon. Customers using M1 processors in Apple computers may now develop Lambda functions locally using this runtime version.

Stable timers promises API

The timers promises API offers timer functions that return promise objects, improving the functionality for managing timers. This feature is available for both ES modules and CommonJS.

You may designate your function as an ES module by changing the file name extension of your handler file to .mjs, or by specifying “type” as “module” in the function’s package.json file. Learn more about using Node.js ES modules in AWS Lambda.


  // index.mjs
  
  import { setTimeout } from 'timers/promises';

  export async function handler() {
    await setTimeout(2000);
    return;
  }

RegExp match indices

The RegExp match indices feature allows developers to get an array of the start and end indices of the captured string in a regular expression. Use the “/d” flag in your regular expression to access this feature.

  // handler.js
  
  exports.lambdaHandler = async () => {
    const matcher = /(AWS )(Lambda)/d.exec('AWS Lambda');
    console.log("match: " + matcher.indices[0]) // 0,10
    console.log("first capture group: " + matcher.indices[1]) // 0,4
    console.log("second capture group: " + matcher.indices[2]) // 4,10
  }

Working with TypeScript

Many developers using Node.js runtimes in Lambda develop their code using TypeScript. To better support TypeScript developers, we have recently published new documentation on using TypeScript with Lambda, and added beta TypeScript support to the AWS SAM CLI.

We are also working on a TypeScript version of Lambda PowerTools. This is a suite of utilities for Lambda developers to simplify the adoption of best practices, such as tracing, structured logging, custom metrics, and more. Currently, AWS Lambda Powertools for TypeScript is in beta developer preview.

Runtime updates

To help keep Lambda functions secure, AWS will update Node.js 16 with all minor updates released by the Node.js community when using the zip archive format. For Lambda functions packaged as a container image, pull, rebuild, and deploy the latest base image from DockerHub or the Amazon ECR Public Gallery.

Amazon Linux 2

The Node.js 16 managed runtime, like Node.js 14, Java 11, and Python 3.9, is based on an Amazon Linux 2 execution environment. Amazon Linux 2 provides a secure, stable, and high-performance execution environment to develop and run cloud and enterprise applications.

Conclusion

Lambda now supports Node.js 16. Get started building with Node.js 16 by specifying a runtime parameter value of nodejs16.x when creating your Lambda functions using the zip archive packaging format.

You can also build Lambda functions in Node.js 16 by deploying your function code as a container image using the Node.js 16 AWS base image for Lambda. You can read about the Node.js programming model in the AWS Lambda documentation to learn more about writing functions in Node.js 16.

For existing Node.js functions, review your code for compatibility with Node.js 16 including deprecations, then migrate to the new runtime by changing the function’s runtime configuration to nodejs16.x.

For more serverless learning resources, visit Serverless Land.