Post Syndicated from Eric Johnson original https://aws.amazon.com/blogs/compute/orchestrating-amazon-s3-glacier-deep-archive-object-retrieval-using-aws-step-functions/
This blog was written by Monica Cortes Sack, Solutions Architect, Oskar Neumann, Partner Solutions Architect, and Dhiraj Mahapatro, Principal Specialist SA, Serverless.
AWS Step Functions now support over 220 services and over 10,000 AWS API actions. This enables you to use the AWS SDK integration directly instead of writing an AWS Lambda function as a proxy.
One such service integration is with Amazon S3. Currently, you write scripts using AWS CLI S3 commands to achieve automation around running S3 tasks. For example, S3 integrates with AWS Transfer Family, builds a custom security check, takes action on S3 buckets on S3 object creations, or orchestrates a workflow around S3 Glacier Deep Archive object retrieval. These script executions do not provide an execution history or an easy way to validate the behavior.
Step Functions’ AWS SDK integration with S3 declaratively creates serverless workflows around S3 tasks without relying on those scripts. You can validate the execution history and behavior of a Step Functions workflow.
This blog highlights one of the S3 use cases. It shows how to orchestrate workflows around S3 Glacier Deep Archive object retrieval, cost estimation, and interaction with the requester using Step Functions. The demo application provides additional details on the entire architecture.
S3 Glacier Deep Archive is a storage class in S3 used for data that is rarely accessed. The service provides durable and secure long-term storage, trading immediate access for cost-effectiveness. You must restore archived objects before they are downloadable. It supports two options for object retrieval:
- Standard – Access objects within 12 hours of the start of the restoration process.
- Bulk – Access objects within 48 hours of the start of the restoration process.
Business use case
Consider a research institute that stores backups on S3 Glacier Deep Archive. The backups are maintained in S3 Glacier Deep Archive for redundancy. The institute has multiple researchers with one central IT team. When a researcher requests an object from S3 Glacier Deep Archive, the central IT team retrieves it and charges the corresponding research group for retrieval and data transfer costs.
Researchers are the end users and do not operate in the AWS Cloud. They run computing clusters on-premises and depend on the central IT team to provide them with the restored archive. A member of the research team requesting an object retrieval provides the following information to the central IT team:
- Object key to be restored.
- The number of days the researcher needs the object accessible for download.
- Researcher’s email address.
- Retrieve within 12 or 48 hours SLA. This determines whether “Standard” or “Bulk” retrieval respectively.
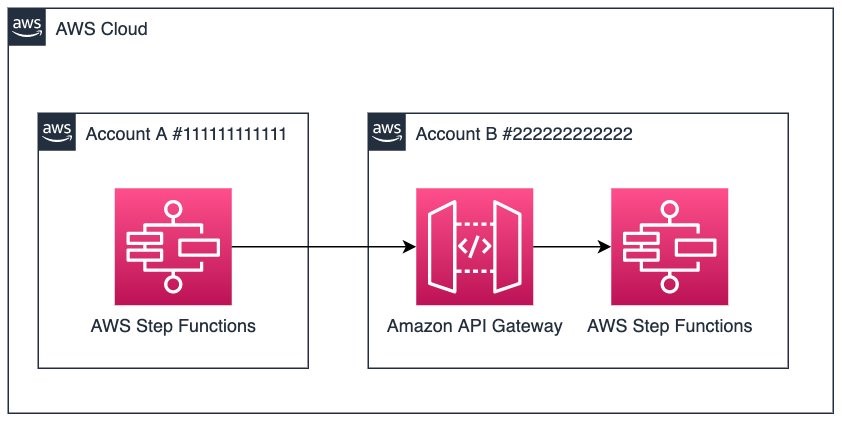
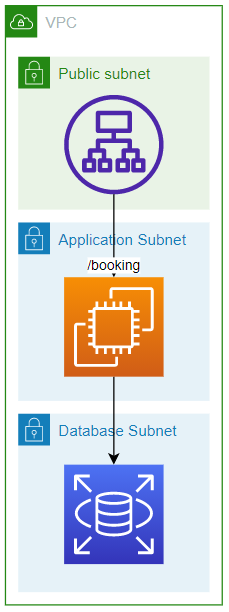
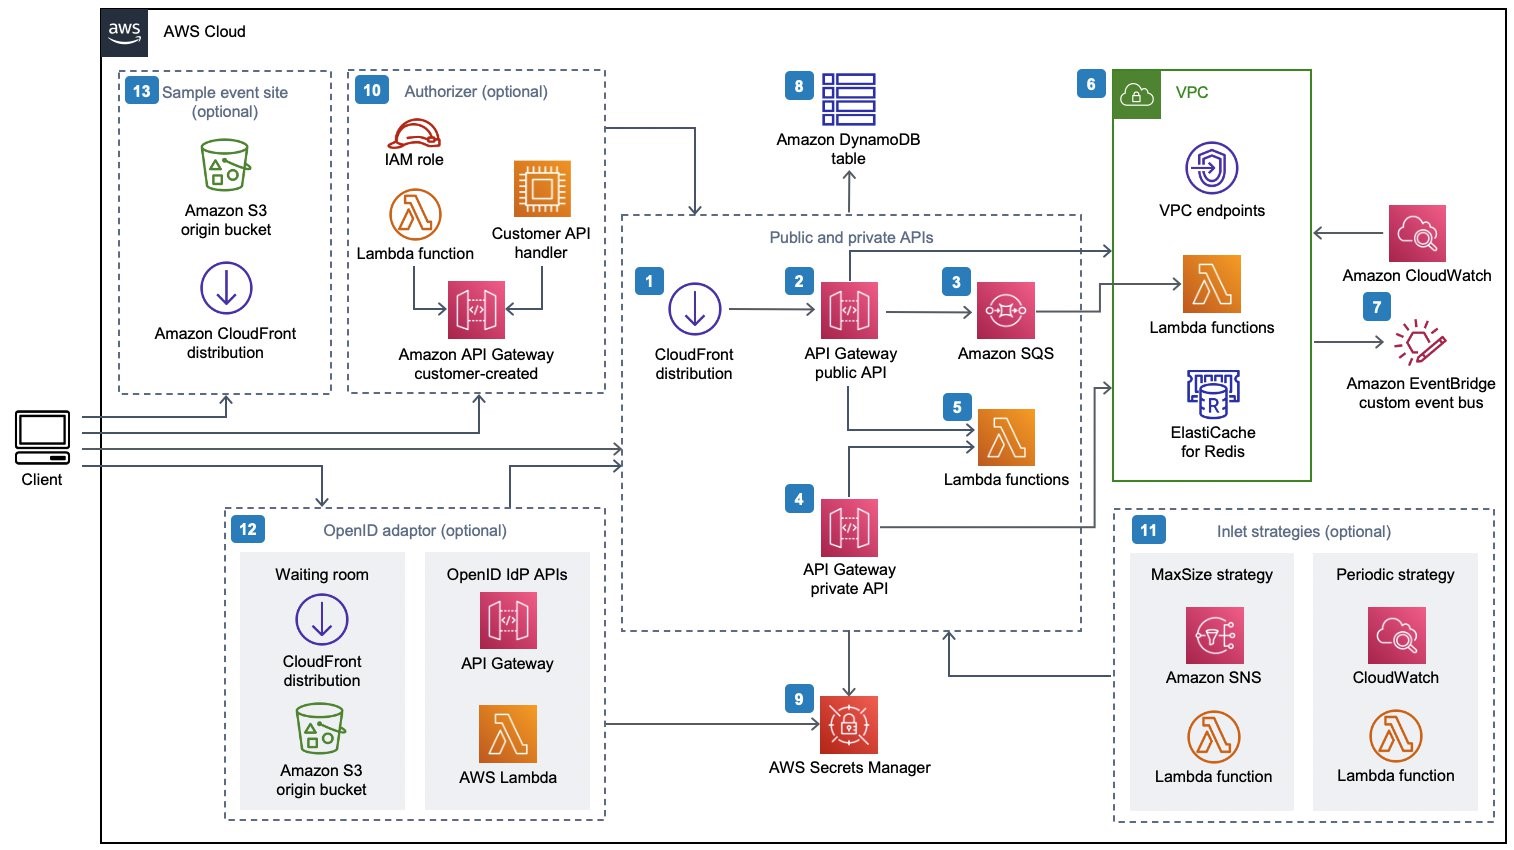
The following overall architecture explains the setup on AWS and the interaction between a researcher and the central IT team’s architecture.
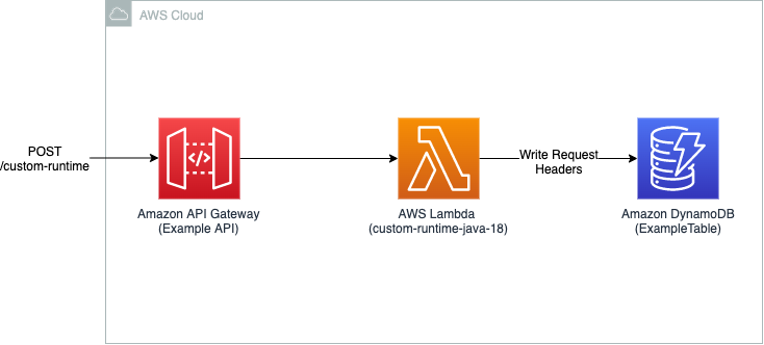
Architecture overview

Architecture diagram
- The researcher uses a front-end application to request object retrieval from S3 Glacier Deep Archive.
- Amazon API Gateway synchronously invokes AWS Step Functions Express Workflow.
- Step Functions initiates RestoreObject from S3 Glacier Deep Archive.
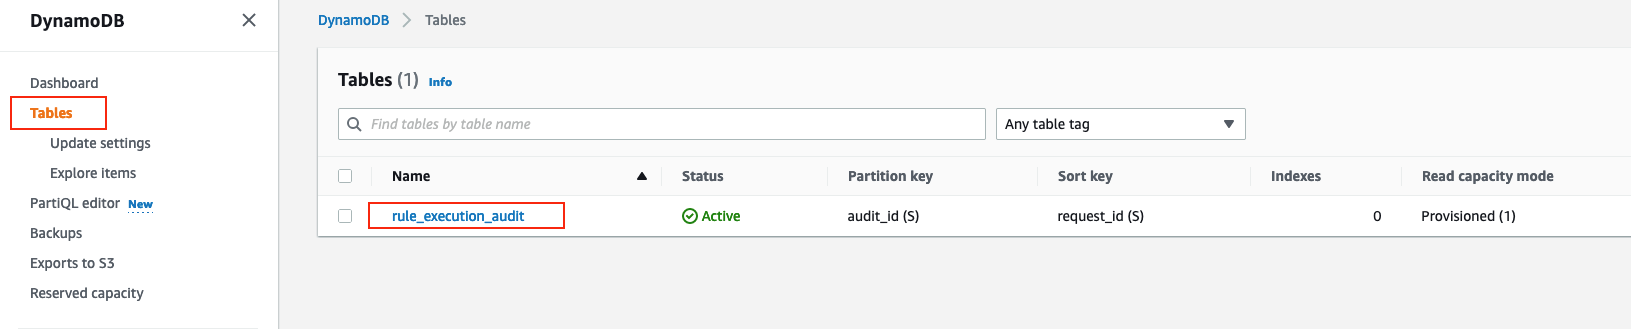
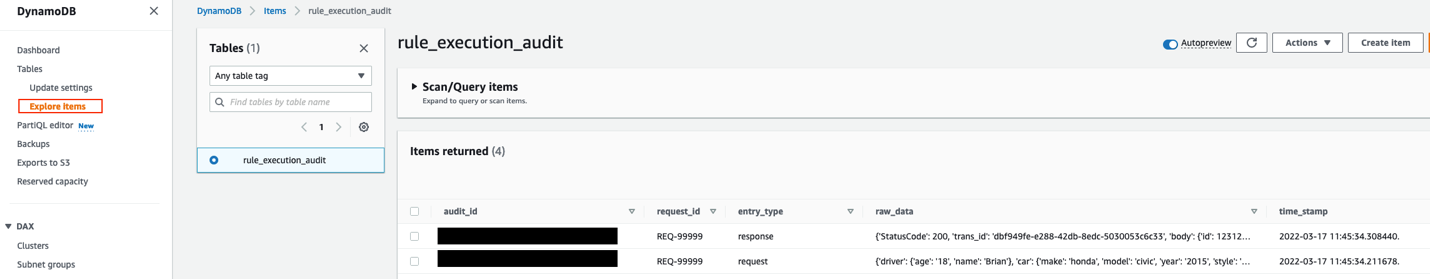
- Step Functions stores the metadata of this retrieval in an Amazon DynamoDB table.
- Step Functions uses Amazon SES to email the researcher about archive retrieval initiation.
- Upon completion, S3 sends the RestoreComplete event to Amazon EventBridge.
- EventBridge rule triggers another Step Functions for post-processing after the restore is complete.
- A Lambda function inside the Step Functions calculates the estimated cost (retrieval and data transfer out) and updates existing metadata in the DynamoDB table.
- Sync data from DynamoDB table using Amazon Athena Federated Queries to generate reports dashboard in Amazon QuickSight.
- Step Functions uses SES to email the researcher with cost details.
- Once the researcher receives an email, the researcher uses the front-end application to call the /download API endpoint.
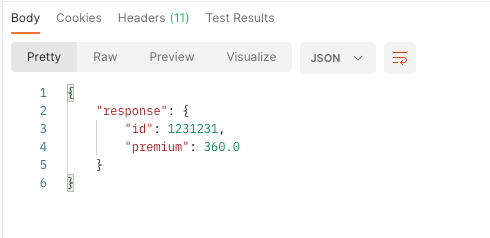
- API Gateway invokes a Lambda function that generates a pre-signed S3 URL of the retrieved object and returns it in the response.
Setup
- To run the sample application, you must install CDK v2, Node.js, and npm.
- To clone the repository, run:
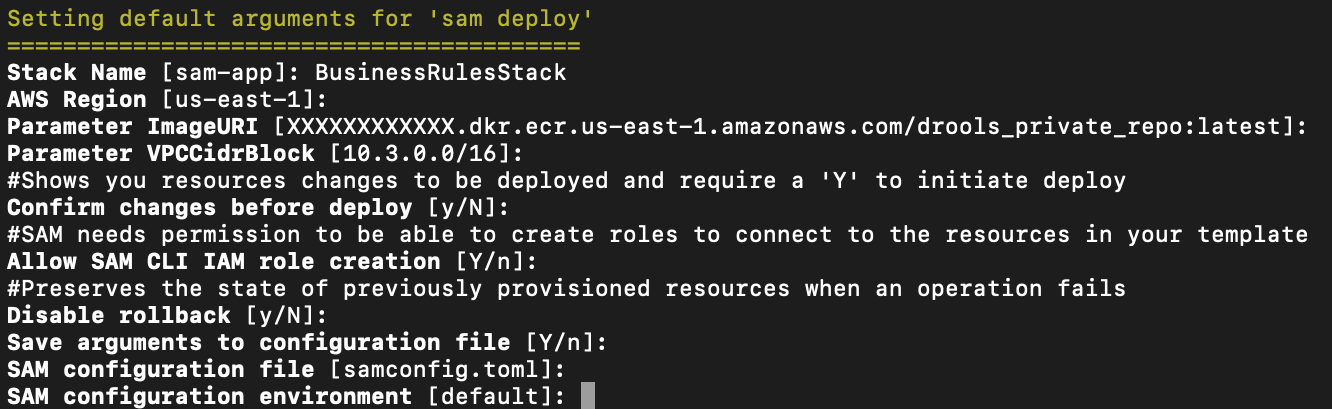
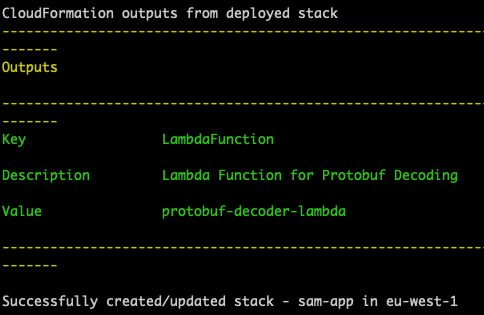
git clone https://github.com/aws-samples/aws-stepfunctions-examples.git cd cdk/app-glacier-deep-archive-retrieval - To deploy the application, run:
cdk deploy --all
Identifying workflow components
Starting the restore object workflow
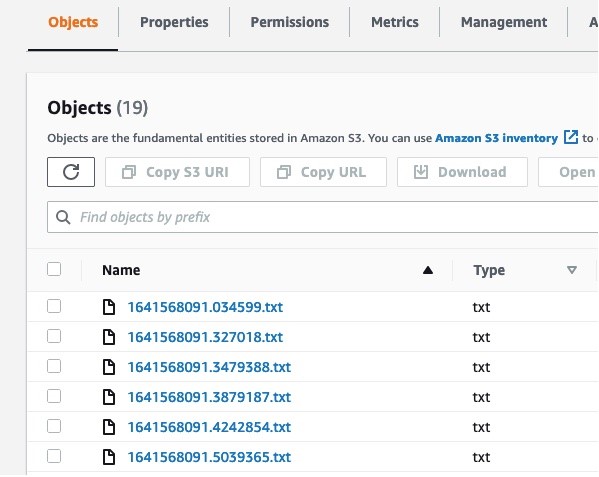
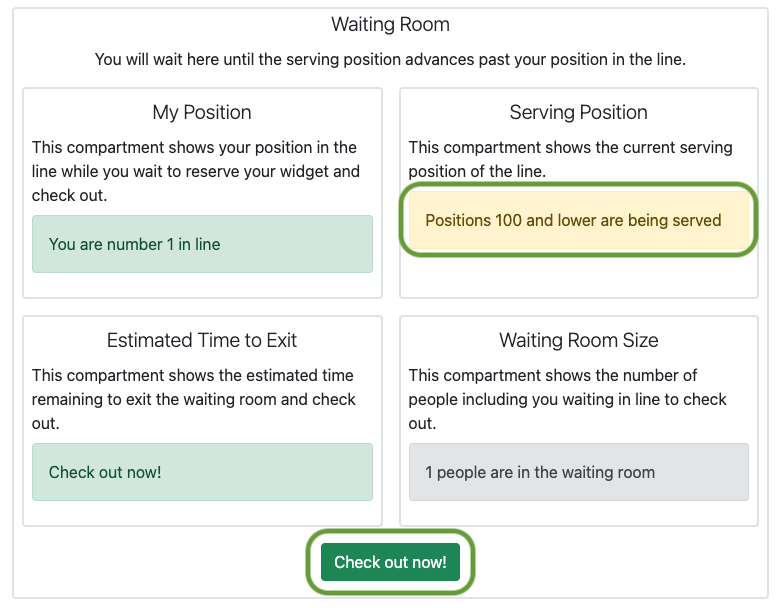
The first component is accepting the researcher’s request to start the archive retrieval process. The sample application created from the demo provides a basic front-end app that shows the files from an S3 bucket that has objects stored in S3 Glacier Deep Archive. The researcher retrieves file requests from the front-end application reached by the sample application’s Amazon CloudFront URL.

Glacier Deep Archive Retrieval menu
The front-end app asks the researcher for an email address, the number of days the researcher wants the object to be available for download, and their ETA on retrieval speed. Based on the retrieval speed, the researcher accepts either Standard or Bulk object retrieval. To test this, put objects in the data bucket under the S3 Glacier Deep Archive storage class and use the front-end application to retrieve them.

Item retrieval prompt
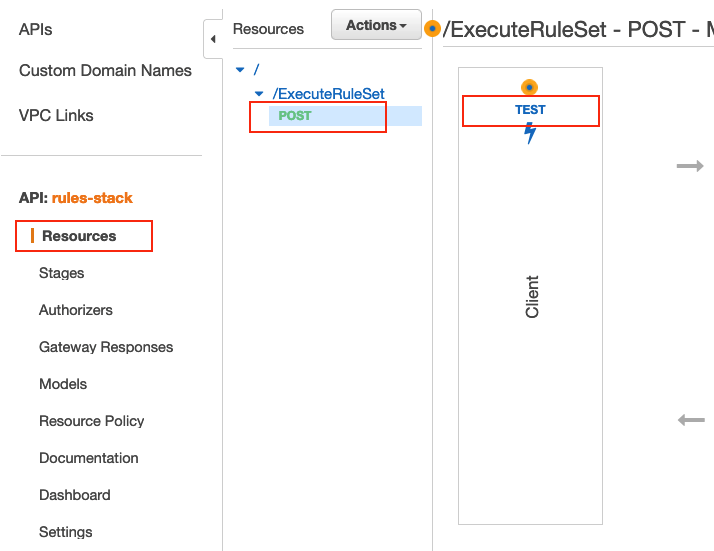
The researcher then chooses the Retrieve file. This action invokes an API endpoint provided by API Gateway. The API Gateway endpoint synchronously invokes a Step Functions Express Workflow. This validates the restore object request, gets the object metadata, and starts to restore the object from S3 Glacier Deep Archive.
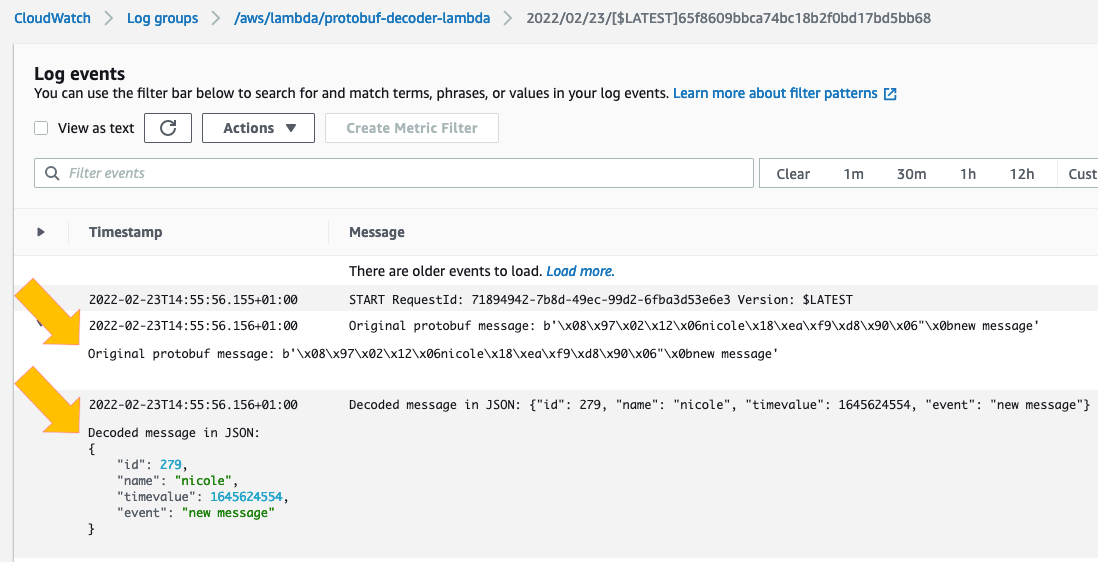
The state machine stores the metadata of the restore object AWS SDK call in a DynamoDB table for later use. You can use this metadata to build a dashboard in Amazon QuickSight for reporting and administration purposes. Finally, the state machine uses Amazon SES to email the researcher, notifying them about the restore object initiation process:
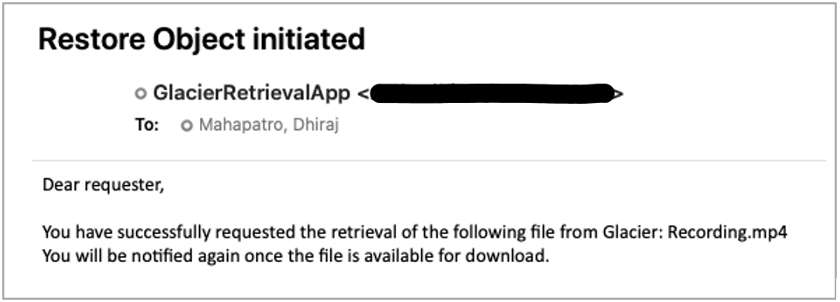
Restore object initiated
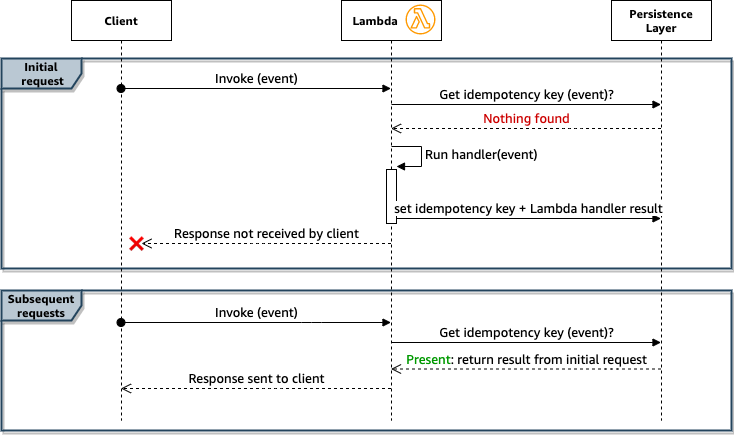
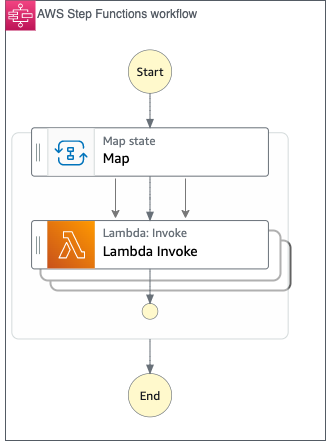
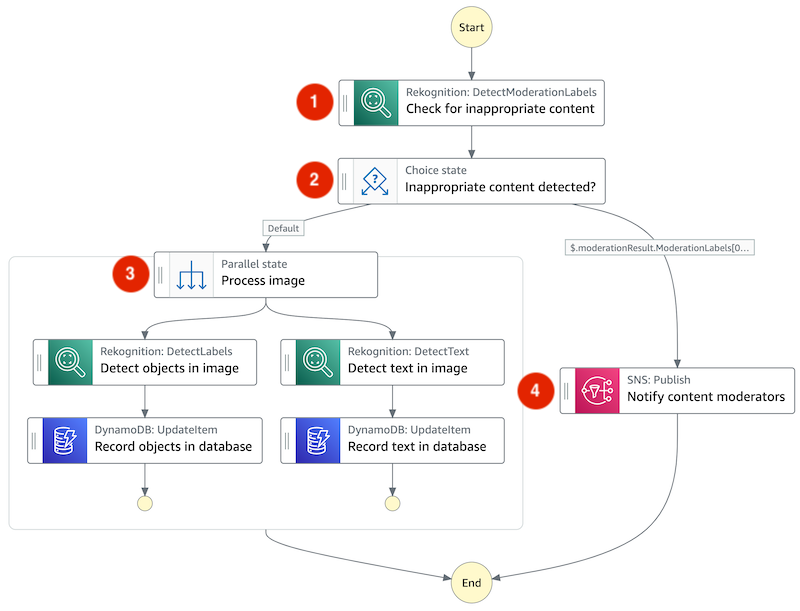
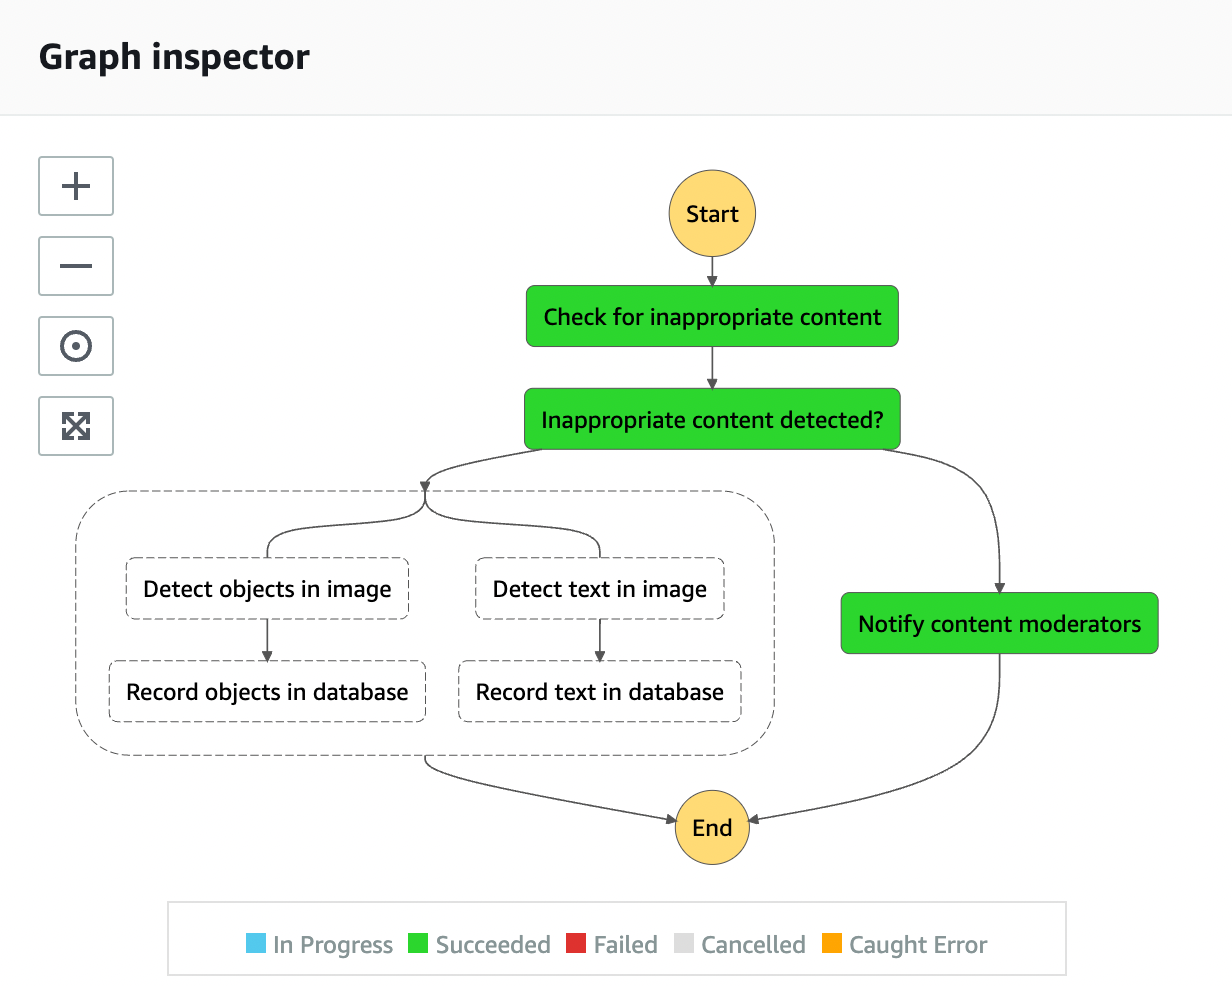
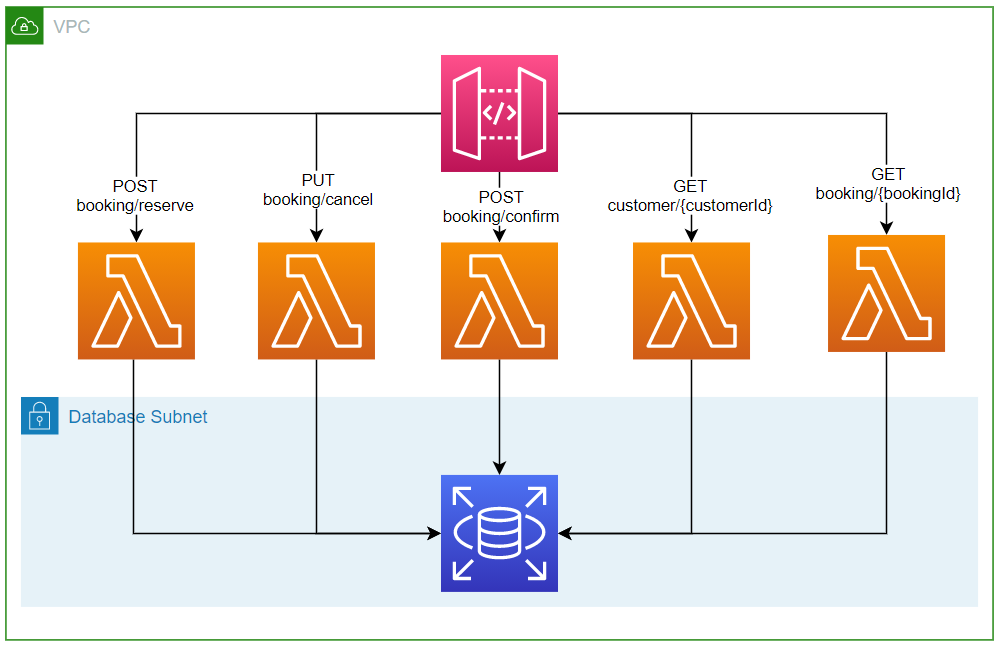
The following state machine shows the workflow:

Workflow diagram
The ability to use S3 APIs declaratively using AWS SDK from Step Functions makes it convenient to integrate with S3. This approach avoids writing a Lambda function to wrap the SDK calls. The following portion of the state machine definition shows the usage of S3 HeadObject and RestoreObject APIs:
"Get Object Metadata": {
    "Next": "Initiate Restore Object from Deep Archive",
    "Catch": [{
        "ErrorEquals": ["States.ALL"],
        "Next": "Bad Request"
    }],
    "Type": "Task",
    "ResultPath": "$.result.metadata",
    "Resource": "arn:aws:states:::aws-sdk:s3:headObject",
    "Parameters": {
        "Bucket": "glacierretrievalapp-databucket-abc123",
        "Key.$": "$.fileKey"
    }
},
"Initiate Restore Object from Deep Archive": {
    "Next": "Update restore operation metadata",
    "Type": "Task",
    "ResultPath": null,
    "Resource": "arn:aws:states:::aws-sdk:s3:restoreObject",
    "Parameters": {
        "Bucket": "glacierretrievalapp-databucket-abc123",
        "Key.$": "$.fileKey",
        "RestoreRequest": {
            "Days.$": "$.requestedForDays"
        }
    }
}
You can extend the previous workflow and build your own Step Functions workflows to orchestrate other S3 related workflows.
Processing after object restoration completion
S3 RestoreObject is a long-running process for S3 Glacier Deep Archive objects. S3 emits a RestoreCompleted event notification on the object restore completion to EventBridge. You set up an EventBridge rule to trigger another Step Functions workflow as a target for this event. This workflow takes care of the object restoration post-processing.
cfnDataBucket.addPropertyOverride('NotificationConfiguration.EventBridgeConfiguration.EventBridgeEnabled', true);An EventBridge rule triggers the following Step Functions workflow and passes the event payload as an input to the Step Functions execution:
new aws_events.Rule(this, 'invoke-post-processing-rule', {
  eventPattern: {
    source: ["aws.s3"],
    detailType: [
      "Object Restore Completed"
    ],
    detail: {
      bucket: {
        name: [props.dataBucket.bucketName]
      }
    }
  },
  targets: [new aws_events_targets.SfnStateMachine(this.stateMachine, {
    input: aws_events.RuleTargetInput.fromObject({
      's3Event': aws_events.EventField.fromPath('$')
    })
  })]
});
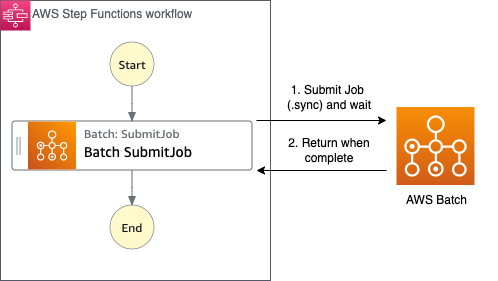
The Step Functions workflow gets object metadata from the DynamoDB table and then invokes a Lambda function to calculate the estimated cost. The Lambda function calculates the estimated retrieval and the data transfer costs using the contentLength of the retrieved object and the Price List API for the unit cost. The workflow then updates the calculated cost in the DynamoDB table.
The retrieval cost and the data transfer out cost are proportional to the size of the retrieved object. The Step Functions workflow also invokes a Lambda function to create the download API URL for object retrieval. Finally, it emails the researcher with the estimated cost and the download URL as a restoration completion notification.

Workflow studio diagram
The email notification to the researcher looks like:

Email example
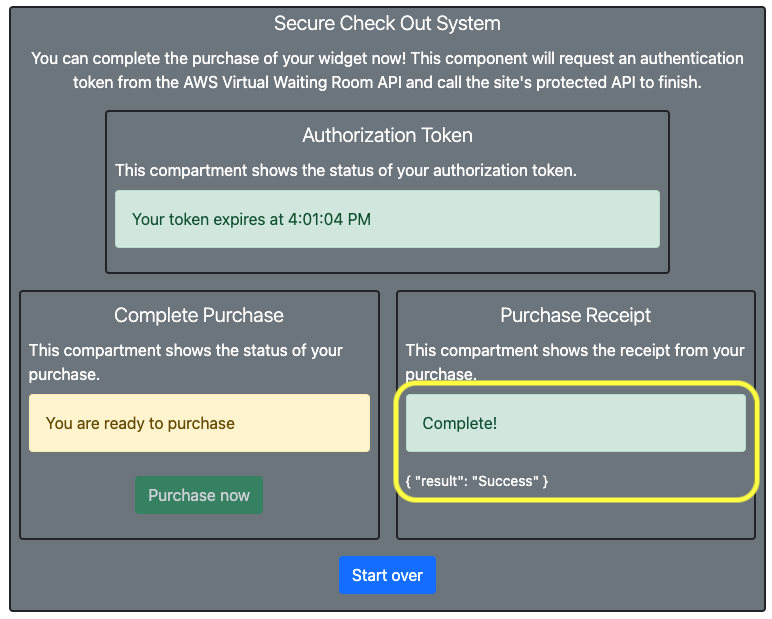
Downloading the restored object
Once the object restoration is complete, the researcher can download the object from the front-end application.

Front end retrieval menu
The researcher chooses the Download action, which invokes another API Gateway endpoint. The endpoint integrates with a Lambda function as a backend that creates a pre-signed S3 URL sent as a response to the browser.
Administering object restoration usage
This architecture also provides a view for the central IT team to understand object restoration usage. You achieve this by creating reports and dashboards from the metadata stored in DynamoDB.
The sample application uses Amazon Athena Federated Queries and Amazon Athena DynamoDB Connector to generate a reports dashboard in Amazon QuickSight. You can also use Step Functions AWS SDK integration with Amazon Athena and visualize the workflows in the Athena console.
The following QuickSight visualization shows the count of restored S3 Glacier Deep Archive objects by their contentType:

QuickSight visualization
Considerations
With the preceding approach, you should consider that:
- You must start the object retrieval in the same Region as the Region of the archived object.
- S3 Glacier Deep Archive only supports standard and bulk retrievals.
- You must enable the “Object Restore Completed” event notification on the S3 bucket with the S3 Glacier Deep Archive object.
- The researcher’s email must be verified in SES.
- Use a Lambda function for the Price List GetProducts API as the service endpoints are available in specific Regions.
Cleanup
To clean up the infrastructure used in this sample application, run:
cdk destroy --allConclusion
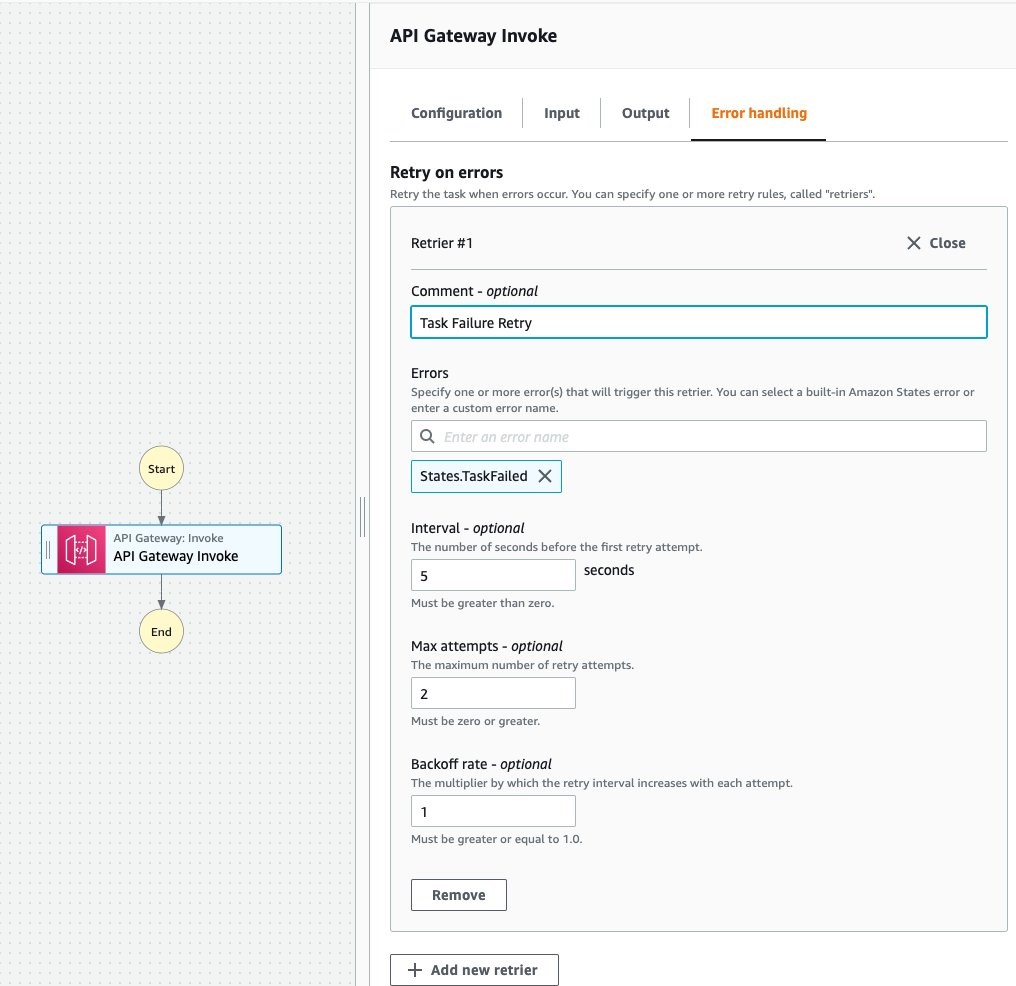
Step Functions’ AWS SDK integration opens up different opportunities to orchestrate a workflow. Step Functions provides native support for retries and error handling, which offloads the heavy lifting of handling them manually in scripts.
This blog shows one example use case with S3 Glacier Deep Archive. With AWS SDK integration in Step Functions, you can build any workflow orchestration using S3 or S3 control APIs. For example, a workflow to enforce AWS Key Management Service encryption based on an S3 event, or create static website hosting on-demand in a few steps.
With different S3 API calls available in Step Functions’ Workflow Studio, you can declaratively build a Step Functions workflow instead of imperatively calling each S3 API from a shell script or command line. Refer to the demo application for more details.
For more serverless learning resources, visit Serverless Land.