Post Syndicated from Julian Wood original https://aws.amazon.com/blogs/compute/serverless-icymi-q4-2025/
Stay current with the latest serverless innovations that can transform your applications. In this 31st quarterly recap, discover the most impactful AWS serverless launches, features, and resources from Q4 2025 that you might have missed.
In case you missed our last ICYMI, check out what happened in Q3 2025.

2025 Q4 calendar
Serverless at re:Invent 2025
This post covers the biggest serverless announcements from re:Invent 2025, highlighting key feature updates that can improve your applications, and shares valuable resources to keep you informed.
AWS re:Invent 2025 had more than 60,000 in-person attendees and more than 2 million online viewers for the keynotes. The event featured 3,500 sessions from 3,000 speakers, which included information on 530 AWS service and feature announcements.
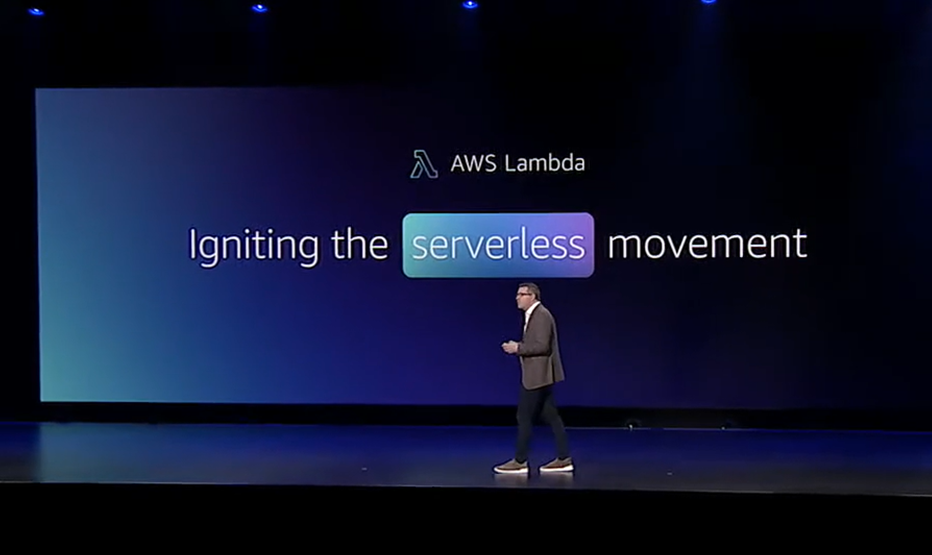
Keynote Igniting the serverless movement
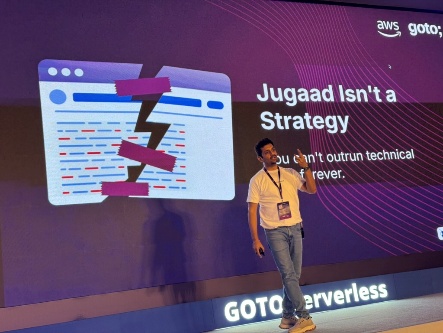
The serverless content consisted of two tracks: Containers and Serverless (CNS) and Application Integration (API). These tracks included 150 unique sessions watched in-person by more than 16,000 attendees. There were developer-focused experiences including a Road to re:Invent Hackathon, AWS Builder Loft, and Builders Arena. Serverlesspresso, the coffee shop powered by serverless technology, operated in two locations during the event: the Expo Hall and the certification lounge.

Serverless and developer community photo
Find a curated list of serverless videos on Serverless Land YouTube.
AWS Lambda durable functions
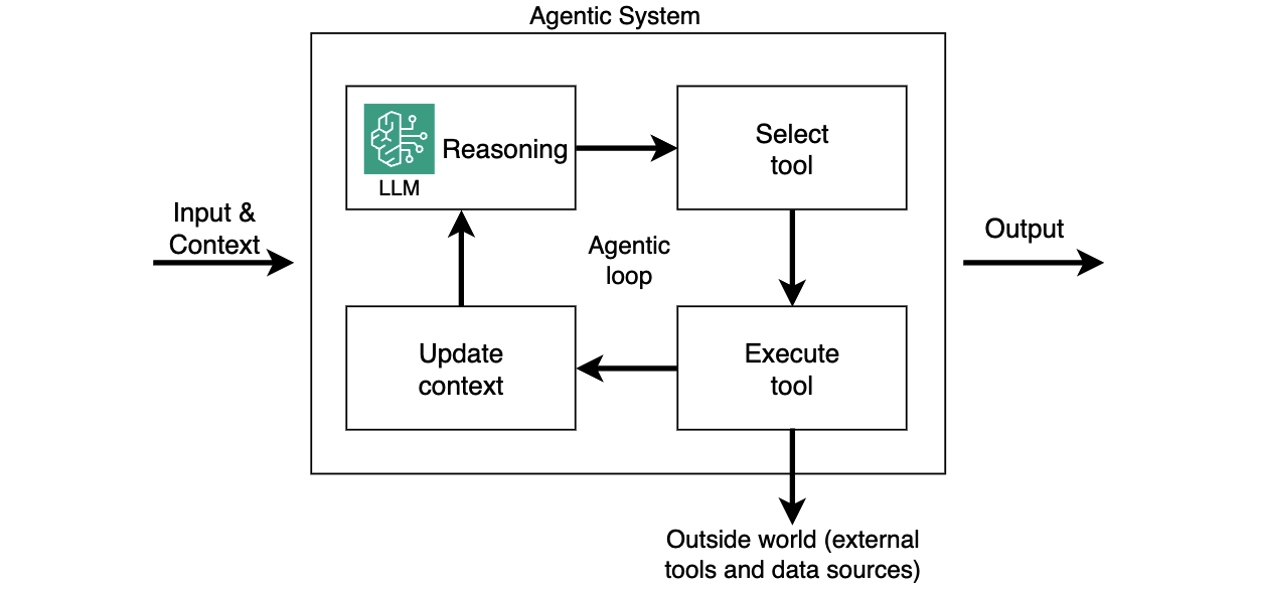
Managing state across multi-step serverless workflows has traditionally required complex external orchestration tools. AWS Lambda durable functions expand how developers can use Lambda. You can now build reliable multi-step applications and AI workflows directly within Lambda.
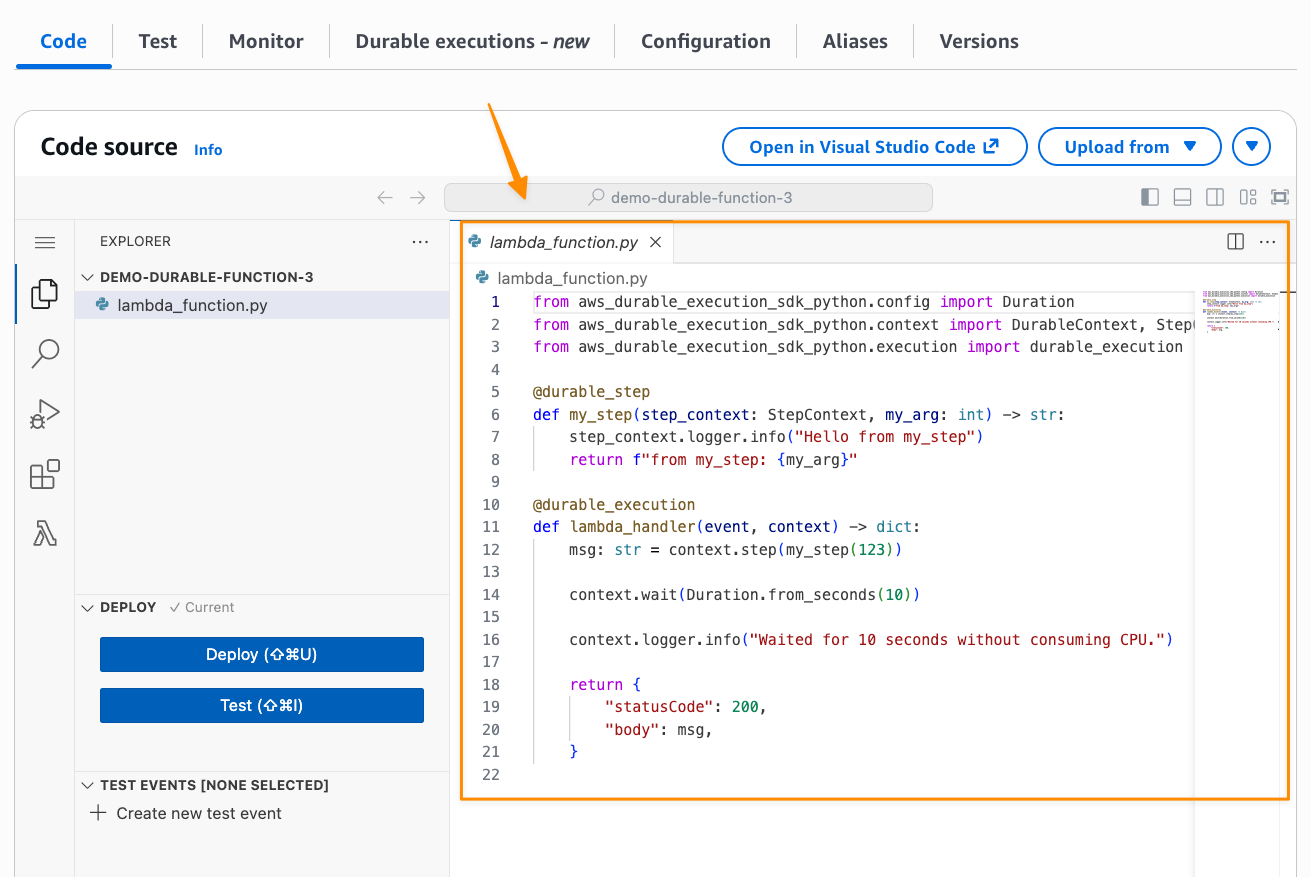
AWS Lambda durable functions code
Durable functions automatically checkpoint progress by saving the current state and completed steps at key points during execution. This allows them to suspend execution for up to one year during long-running tasks and recover from failures by resuming from the last checkpoint rather than restarting from the beginning, all without requiring additional infrastructure management.
Developers can now build in Python or TypeScript, wrap calls in steps with automatic retries and checkpointing. You can use waits to suspend execution for minutes, hours, or even up to a year without paying for idle compute. Durable functions use a replay mechanism to maintain state and handle failures gracefully. The replay mechanism works by re-executing your function code from checkpoints when recovering from failures, ensuring state consistency without data loss. This also means you don’t need complex external orchestration tools for many use cases. This can be helpful for AI workflows and multi-step applications where you need reliable state management without managing external infrastructure.
For more information, read the launch blog post and watch the re:Invent Breakout Session video: Deep Dive on AWS Lambda durable functions (CNS380)
AWS Lambda Managed Instances
Lambda now offers Lambda Managed Instances, a new compute option that combines Amazon EC2 flexibility with fully managed infrastructure. AWS automatically handles instance provisioning, scaling, and maintenance while allowing access to the full range of EC2 capabilities, including Graviton4, network-optimized instances, and other specialized compute options.
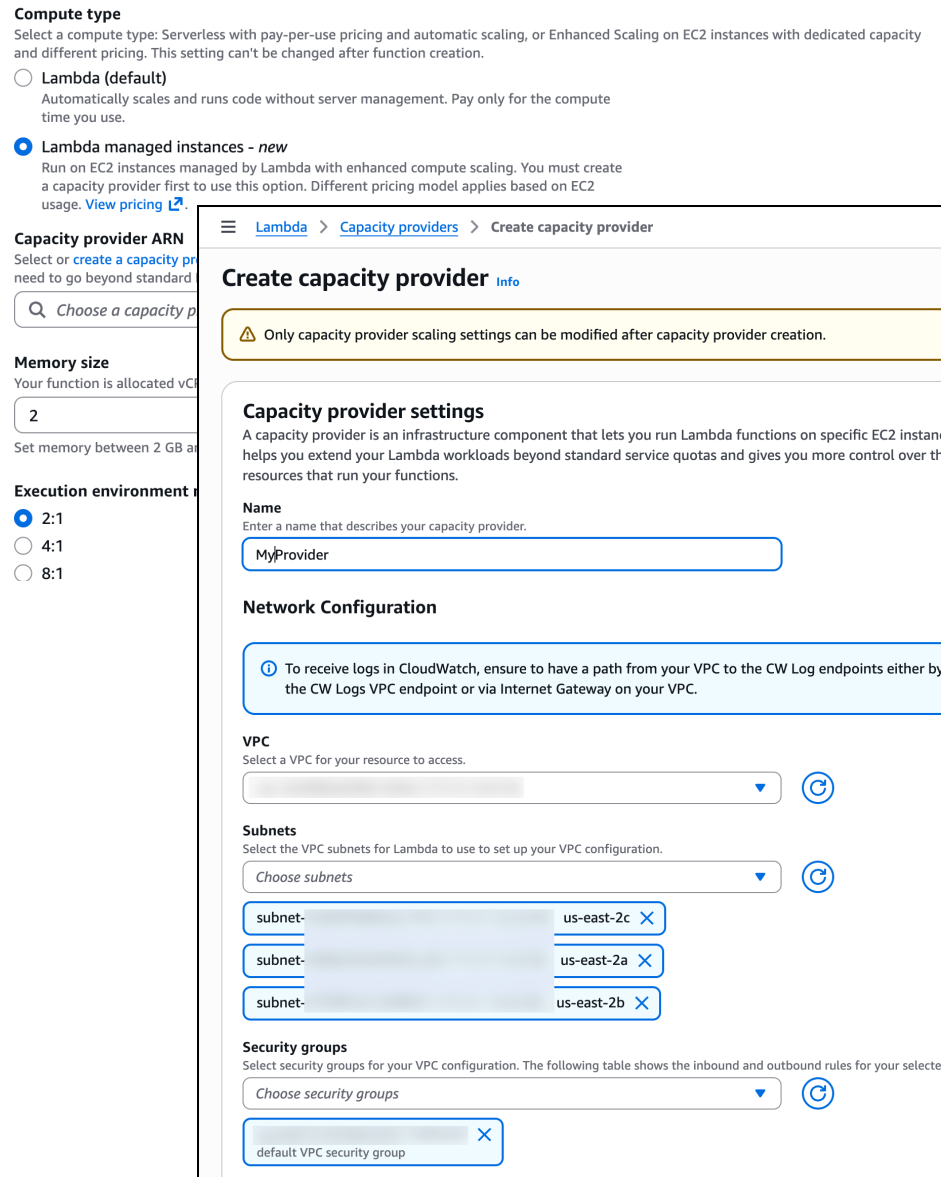
AWS Lambda Managed Instances configuration
Your functions run on dedicated EC2 capacity from your account, in your own Amazon Virtual Private Cloud (Amazon VPC). AWS still manages the operational overhead, including OS patching, load balancing, and auto-scaling. This gives you access to specialized hardware options while maintaining the serverless operational model. You can further improve costs by using EC2 pricing models, including Compute Savings Plans and Reserved Instances for Lambda workloads. Each instance can handle multiple concurrent requests, making this particularly valuable for high-volume, steady-state workloads where predictable pricing and specific hardware requirements matter.
For more information, read the launch blog post and watch the re:Invent Breakout Session video: Lambda Managed Instances: EC2 Power with Serverless Simplicity (CNS382).
Other Lambda announcements
Multi-tenant SaaS applications face challenges like data leakage between tenants and noisy neighbor effects where one tenant’s workload impacts others. They also struggle with implementing custom isolation mechanisms. Tenant isolation mode addresses these by processing function invocations in separate execution environments for each tenant. This manages tenant-level compute environment isolation automatically.

AWS Lambda tenant isolation
Lambda adds Provisioned Mode for Amazon SQS event-source mappings, providing predictable performance and reduced cold starts for high-throughput SQS processing workloads.
You can now send up to 1 MB of data in asynchronous Lambda invocations, increased from 256 KB, helping you build more complex data processing scenarios.
Lambda functions now support IPv6 networking, so you don’t need NAT Gateways when accessing the internet or other AWS services from VPC-connected functions.
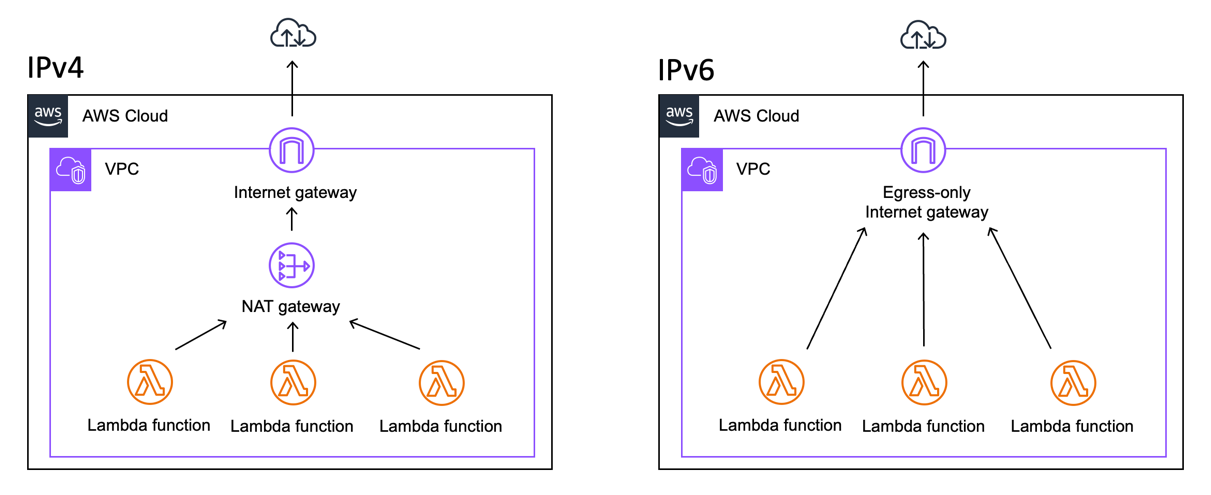
Lambda internet connectivity through a NAT Gateway (IPv4) and Lambda internet connectivity through an egress-only internet gateway (IPv6).
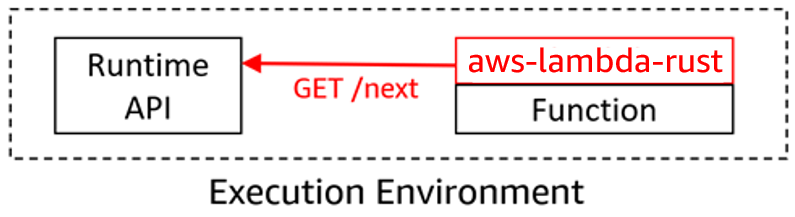
Lambda Rust support is now generally available, moving from experimental status. This is backed by AWS Support and the Lambda availability SLA.
Lambda has expanded its runtime support by adding Python 3.14, Node.js 24, and Java 25 as both managed runtimes and container base images, providing access to the latest language features and ensuring long-term support.
Amazon ECS
Amazon Elastic Container Service (Amazon ECS) Express Mode streamlines the deployment and management of containerized applications by automating the infrastructure setup that traditionally slows down developers.
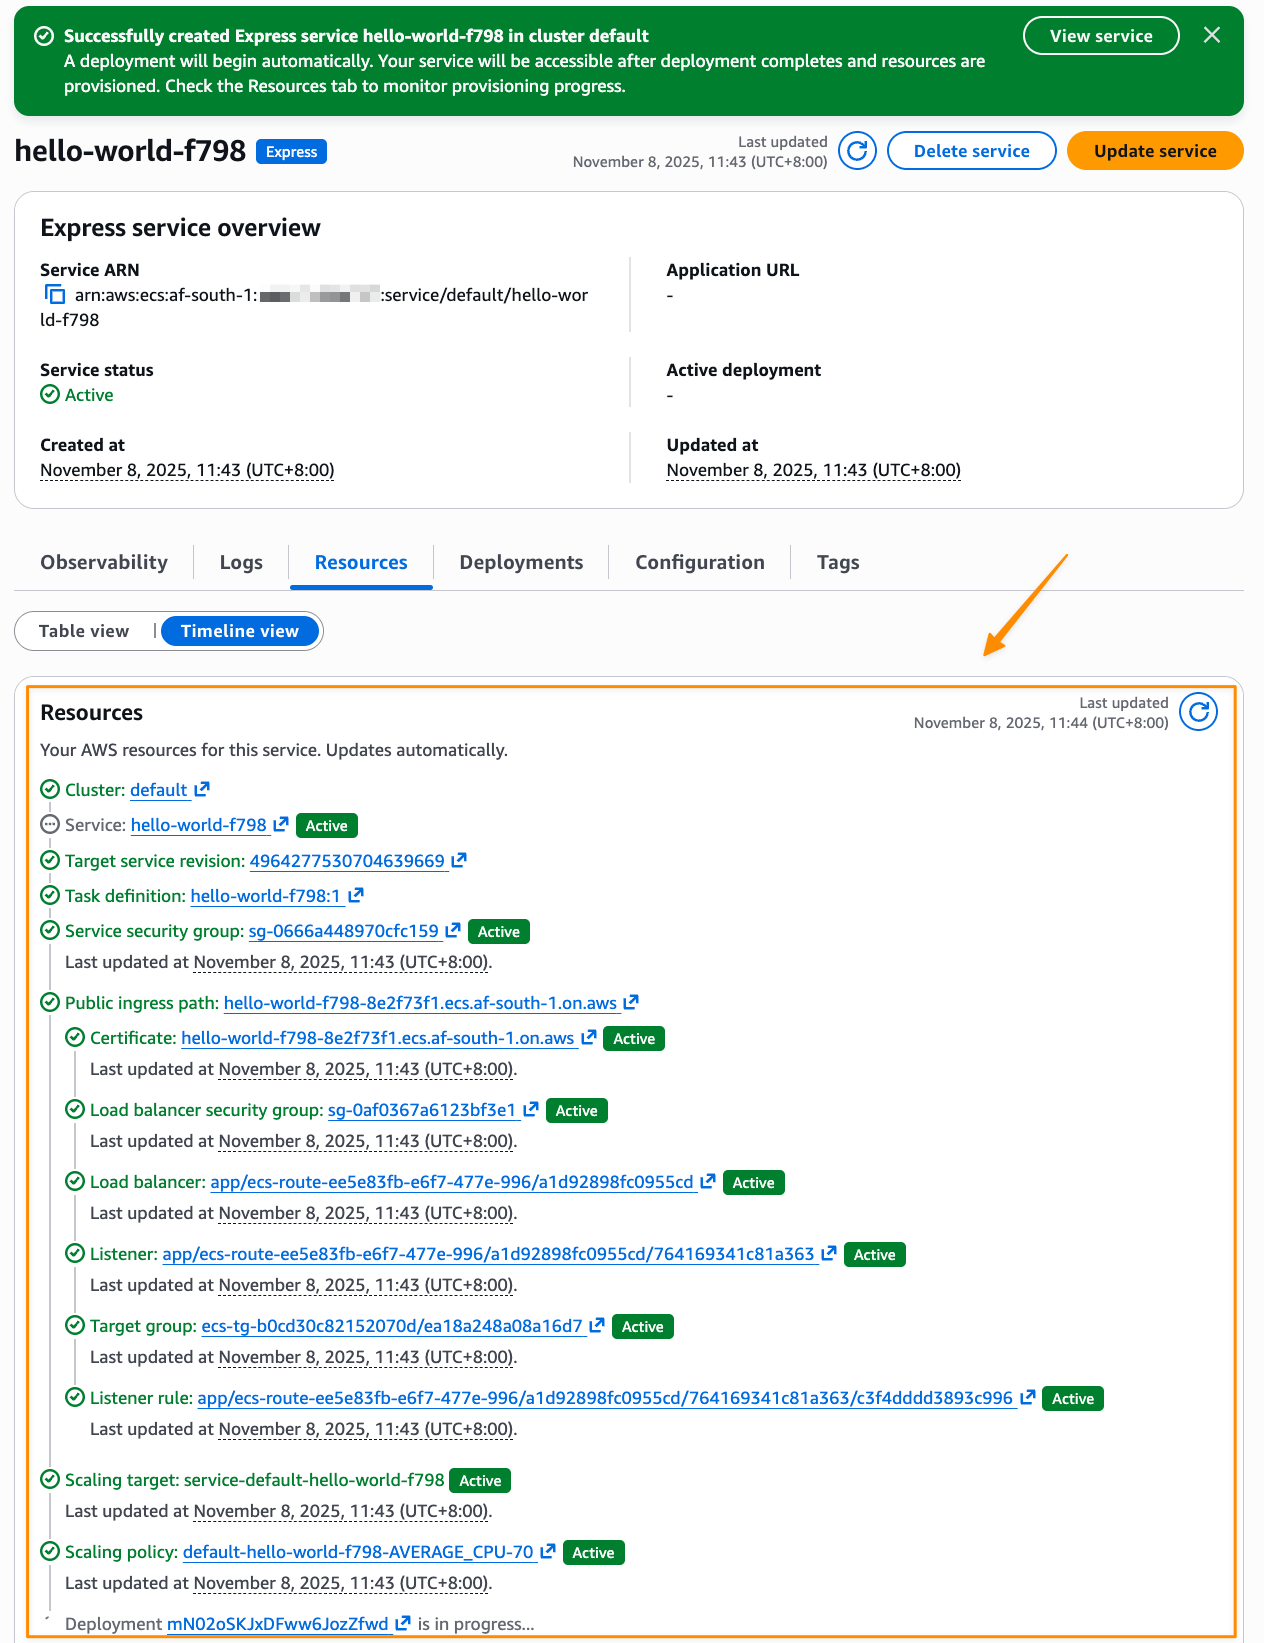
Amazon ECS Express Mode deployment
This means you can focus on building applications while deploying with confidence using AWS best practices. Express Mode lets you deploy production-ready containerized web applications and APIs with a single command. This automatically handles domains, networking, load balancing, AWS Identity and Access Management (IAM) roles, and auto-scaling through simplified APIs. When your applications evolve and require advanced features, you can seamlessly configure and access the full capabilities of the resources, including Amazon ECS. Learn more from the launch blog post.
Amazon ECS announced a public preview of a fully managed MCP server, enabling AI-powered experiences for development and operations. The Model Context Protocol (MCP) server provides enterprise-grade capabilities like automatic updates and patching, centralized security through AWS IAM integration, comprehensive audit logging via AWS CloudTrail, and the proven scalability, reliability, and support of AWS.
Amazon Elastic Container Registry (ECR) managed container image signing enhances your security posture and eliminates the operational overhead of setting up signing. Container image signing allows you to verify that images are from trusted sources. ECR automatically signs images as they are pushed using the identity of the entity pushing the image. Signing operations are logged through CloudTrail for full auditability.
Amazon API Gateway
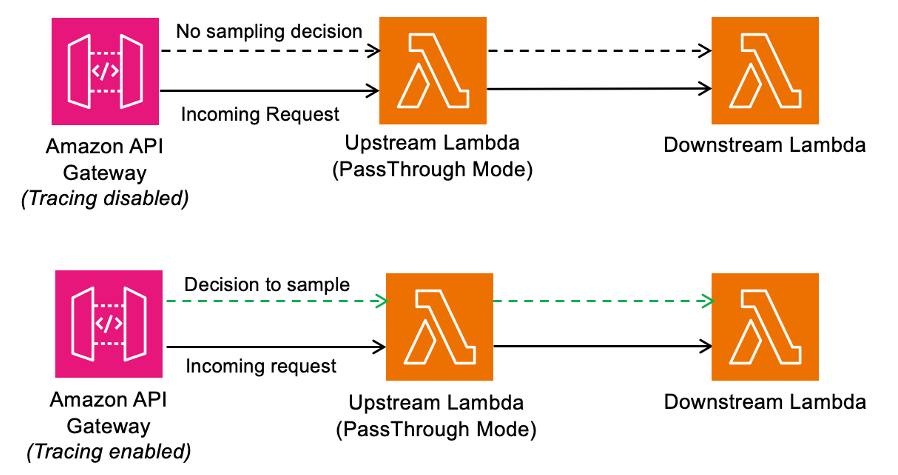
Amazon API Gateway allows you to improve the responsiveness of your REST APIs by progressively streaming response payloads back to the client. With this new capability, you can use streamed responses to enhance user experience when building LLM-driven applications (such as AI agents and chatbots), improve time-to-first-byte (TTFB) performance for web and mobile applications, stream large files, and perform long-running operations while reporting incremental progress using protocols such as server-sent events (SSE).
Amazon API Gateway streaming
API Gateway introduces private integration with Application Load Balancers (ALBs). You can use this to expose your VPC-based applications securely through REST APIs without exposing your ALBs to the public internet.
You can also now configure enhanced TLS security policies on API endpoints and custom domain names, providing you with greater control over the security posture of your APIs.
Amazon EventBridge
Amazon EventBridge introduced an enhanced visual rule builder that helps developers discover and subscribe to events from custom applications and over 200 AWS services. The console-based interface integrates the EventBridge schema registry with a comprehensive event catalog and intuitive drag-and-drop canvas that simplifies building event-driven applications. Developers can browse and search through events with readily available sample payloads and schemas without having to hunt through individual service documentation. The schema-aware visual builder guides developers through creating event filter patterns and rules, reducing syntax errors and accelerating development time.
EventBridge also allows targeting SQS fair queues.
AWS Step Functions
AWS Step Functions allows for enhanced local testing through the TestState API, providing programmatic access to comprehensive testing capabilities without deploying to AWS. This helps you build automated test suites that validate your workflow definitions locally on your development machines. Test error handling patterns, data transformations, and mock service integrations using your preferred testing frameworks.
There is also a new metrics dashboard, giving you visibility into your workflow operations at both the account and state machine levels.
Other announcements
Savings Plans flexible pricing model extends to AWS managed database services with the launch of Database Savings Plans. This helps reduce database costs by up to 35% when committing to a consistent amount of usage ($/hour) over a 1-year term. Savings automatically apply each hour to eligible usage across supported database services, and additional usage beyond the commitment is billed at on-demand rates.
Amazon DynamoDB now supports multi-attribute composite keys in global secondary indexes. You no longer need to concatenate values into synthetic keys manually, which sometimes results in the need to backfill data before adding new indexes. Instead, you can create primary keys using up to eight existing attributes, making it easier to model diverse access patterns and adapt to new query requirements.
Amazon Bedrock introduced AgentCore with quality evaluations and policy controls for deploying trusted AI agents at scale.
Bedrock also added 18 fully managed open weight models, expanding AI model options for developers.
The Strands Agents SDK is an open source framework that takes a model-driven approach to building and running AI agents in just a few lines of code. TypeScript support is now available in preview so you can choose between Python and TypeScript for building Strands Agents.
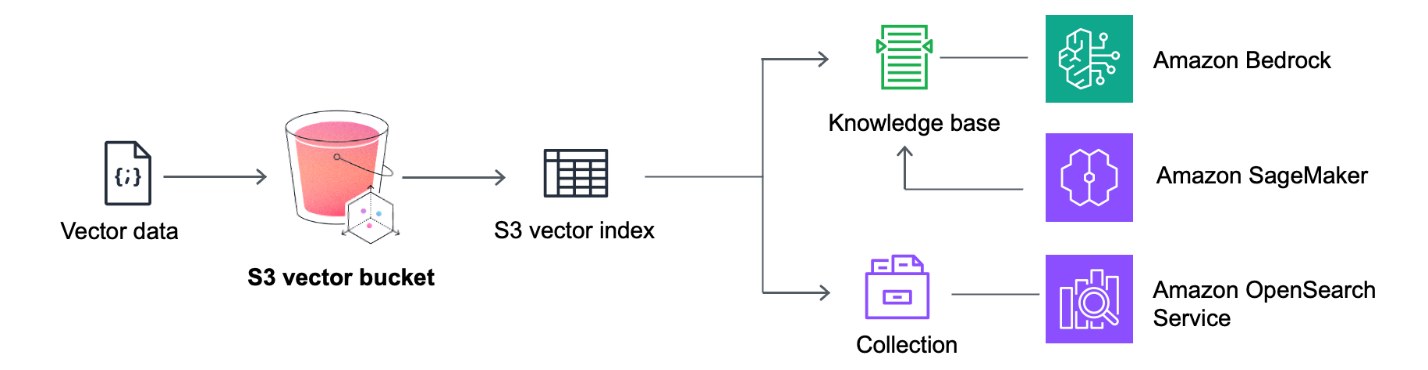
Amazon S3 Vectors became generally available. S3 Vectors delivers purpose-built, cost-optimized vector storage for AI agents, inference, Retrieval Augmented Generation (RAG), and semantic search at billion-vector scale.
Serverless blog posts
October
- Breaking down monolith workflows: Modularizing AWS Step Functions workflows
- Introducing AWS Lambda event source mapping tools in the AWS Serverless MCP Server
- Processing Amazon S3 objects at scale with AWS Step Functions Distributed Map S3 prefix
November
- AWS Lambda networking over IPv6
- Orchestrating big data processing with AWS Step Functions Distributed Map
- Optimizing nested JSON array processing using AWS Step Functions Distributed Map
- Improve API discoverability with the new Amazon API Gateway Portal
- Building responsive APIs with Amazon API Gateway response streaming
- Python 3.14 runtime now available in AWS Lambda
- Building serverless applications with Rust on AWS Lambda
- Handle unpredictable processing times with operational consistency when integrating asynchronous AWS services with an AWS Step Functions state machine
- AWS Lambda now supports Java 25
- Enhancing API security with Amazon API Gateway TLS security policies
- Improving throughput of serverless streaming workloads for Kafka
- Build scalable REST APIs using Amazon API Gateway private integration with Application Load Balancer
- Serverless strategies for streaming LLM responses
- Building multi-tenant SaaS applications with AWS Lambda’s new tenant isolation mode
- Orchestrating large-scale document processing with AWS Step Functions and Amazon Bedrock batch inference
- Node.js 24 runtime now available in AWS Lambda
Serverless Office Hours
Join our livestream every Tuesday at 11 AM PT for live discussions, Q&A sessions, and deep dives into serverless technologies. Episodes are available on-demand at serverlessland.com/office-hours.
October
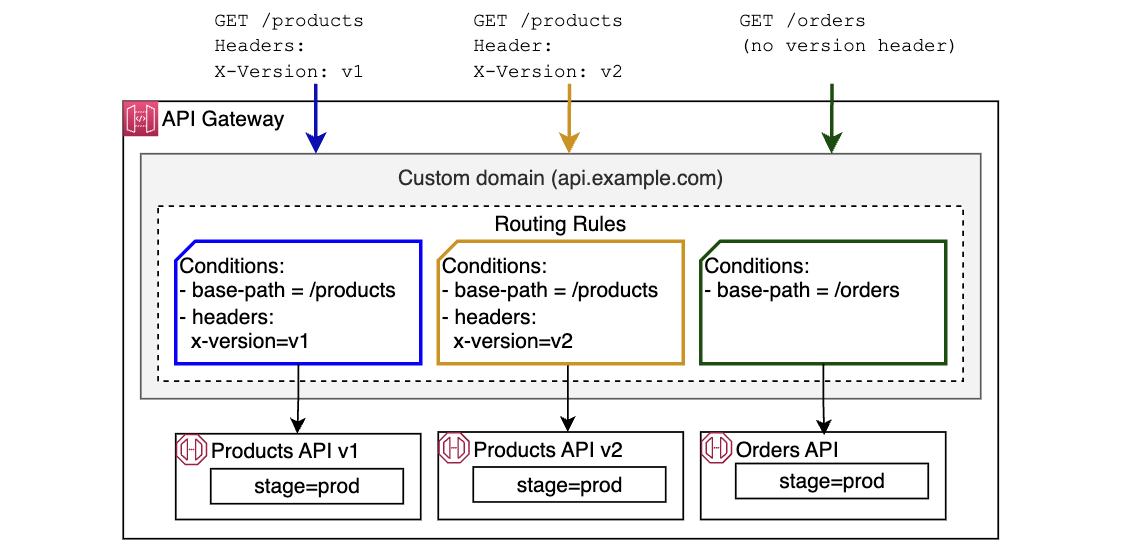
- Oct 7 – Amazon API Gateway Routing Rules
- Oct 14 – Amazon DynamoDB Global Tables
- Oct 21 – Building agents with Amazon Bedrock AgentCore
- Oct 28 – “What’s new with Observability
November
- Nov 4 – Getting your AI spec right!
- Nov 11 – Running Swift in AWS Lambda
- Nov 18 – What’s new in EventCatalog
- Nov 24 – pre:Invent 2025
December
- Dec 9 – AWS Lambda Managed Instances
- Dec 16 – AWS Lambda durable functions
Still looking for more?
The Serverless landing page has overall information about building serverless applications. The Lambda resources page contains case studies, webinars, whitepapers, customer stories, reference architectures, and even more Getting Started tutorials.
You can also follow the Serverless Developer Advocacy team to see the latest news, follow conversations, and interact with the team.
- Julian Wood: @julian_wood, https://www.linkedin.com/in/julianrwood/
- Eric Johnson: @edjgeek, https://www.linkedin.com/in/singledigit/
- Gunnar Grosch: @GunnarGrosch, https://se.linkedin.com/in/gunnargrosch
- Erik Hanchet: @ErikCH, https://www.linkedin.com/in/erikhanchett/
- Salih Gueler: @salihgueler, https://www.linkedin.com/in/salihgueler/
- Marcia Villalba: @mavi888uy, https://www.linkedin.com/in/marciavillalba
And finally, visit Serverless Land for all your serverless needs.