Tag Archives: Company

How GitHub’s Developer Experience team improved innerloop development

Post Syndicated from belaltaher8 original https://github.blog/2024-01-24-how-githubs-developer-experience-team-improved-innerloop-development/


Building confidence in new code before deploying is a crucial part of any good development loop. This is especially challenging when working in a distributed or microservice system with multiple teams operating on different services. This modular team structure gives rise to an important question: how can we provide teams with fast and reliable development cycles when testing and shipping requires them to test inside an ecosystem of other services? Optimizing the solution to this problem greatly improves engineering efficiency and can contribute to more successful outcomes for the organization as a whole.

This problem is one the Developer Experience (DX) team at GitHub grappled with again and again, ultimately delivering a solution we call “Hubber Codespace” (HCS). HCS is a tool that Hubbers (people who work at GitHub) can use to locally stand up the entire distributed GitHub ecosystem in any environment by simply querying an endpoint or adding a couple lines of configuration to their development containers.

In this post, we’ll tell you how we landed on the HCS solution to this common problem over some possible alternatives, and you’ll get a first-hand look at how GitHub’s developer-first mindset helped us deliver the best tool for Hubbers to ship code quickly and safely in our own distributed environment.

One big (un)-happy environment

To understand the problem we were trying to solve, we have to go back in time. There was a point at which GitHub was just a couple teams and a much simpler product. Back then, having a monorepo in which everyone iterated and built confidence in their changes made sense. Splitting responsibilities up across repositories would have added overhead that bogged down early Hubbers. Fast forward to today, and GitHub has grown into a big organization with hundreds of different teams. Now, the balancing act of evaluating between velocity vs. complexity can look very different.

Let’s consider these complexities a bit further. Different services can have entirely different sets of dependencies and even have dependencies on different versions of the same software (for example, one service requires Ruby 2.2 while another requires Ruby 2.4). In smaller collaborative settings, the engineers can easily reconcile these needs. But this complexity grows exponentially as more teams are introduced. Trying to provide a single environment in which these kinds of disparate services can run and interact in development becomes difficult to do. It can result in ad-hoc “hacks” in development loops like deleting a .ruby-version file depending on which service’s development loop you’re working through. These are the kinds of problems that you encounter when trying to work with a monorepo that contains the codebases for a set of disparate services.

So, we decided to design a new solution. Instead of bringing the developers to the ecosystem, what if we brought the ecosystem to the developers?

Enter HCS

This line of thinking led us to build HCS, a Docker-Compose project that does exactly that. In the post “How we build containerized services at GitHub using GitHub,” we detailed how we build containerized services that power microservices on the GitHub.com platform and many internal tools. Our task now was to take these containers and wire them up such that partner teams could spin up a full GitHub ecosystem on demand. This would allow them to test their changes in an integrated environment. Developers could see how their code behaves when introduced to GitHub’s distributed system, rather than only observing it in the isolated environment of the application being developed before deploying within the full system. In this way, developers could gain confidence that the services they were changing behaved correctly when interacting with their up and downstream dependencies.

When considering how to orchestrate all the required containers, a few solutions came to mind: Docker-Compose, an internal tool called Codespace-Compose that allows us to SSH tunnel between multiple codespaces, and Minikube. Any of these three solutions could solve the ecosystem problem and would have unique tradeoffs. Let’s look at some of those tradeoffs now.

Minikube offers a robust Kubernetes architecture, but we had concerns about the overall user experience. We ultimately decided against it as the issues we identified, such as networking complexity and long cycle times, could bog down development speed.

Codespace-Compose allows us to easily connect teams’ everyday development environments, but we reasoned that, since Codespace-Compose is an internal experiment without any SLA, we’d incur a maintenance cost on our own team by adopting this.

Docker-Compose seemed to fit our needs the best. It didn’t incur any additional maintenance burden since it’s publicly available and actively managed. It offers all the same benefits of Minikube without the long cycle time. Most importantly, using Docker in Docker in a codespace, which allows us to create docker containers on a host which is a docker container itself, is a well-paved path that has lots of prior art. Given all these considerations, we decided on orchestrating our containers using Docker-Compose.

After deciding on Docker-Compose as our orchestrator, the next steps were to figure out the interface. Docker-Compose already supplies end users with commands, but we wanted to optimize the UX around HCS. To do this, we built a user-friendly CLI in Golang with parallel versioning to HCS. This abstracted away all the complexity of using the two together. Simply download a specific release version for HCS, get the same version of the CLI binary, and you’re good to go!

CLI and release automation

Ensuring HCS is useful means ensuring a couple of things. One important goal is ease of use. Docker-Compose already offers an interface for end users, but considering some of the built in commands are long and use predictable options, we decided to wrap it in a custom Golang CLI. This abstracted many of the underlying details away, such as static file locations, formatting options, entrypoint commands, etc. to improve end-user experience. The code below shows this by juxtaposing the Docker-Compose commands with their equivalent HCS CLI command.

The following example compares the commands to start up the integrated environment provided by HCS.

# Start using Docker-Compose

docker compose --project-name hcs \
--file /workspaces/hubber-codespace-dist/docker-compose-hcs-actions.yml \
--file /workspaces/hubber-codespace-dist/docker-compose-hcs-base.yml \
--file /workspaces/hubber-codespace-dist/docker-compose-hcs-bg.yml \
--file /workspaces/hubber-codespace-dist/docker-compose-hcs-core.yml \
--file /workspaces/hubber-codespace-dist/docker-compose-hcs-volume.yml \
--file /workspaces/hubber-codespace-dist/docker-compose-hcs-test.yml \
--file /workspaces/hubber-codespace-dist/docker-compose-hcs-vendor.yml \
--profile full up -d --remove-orphans

# Start using CLI

hcs start

This next example compares how to get a shell to run commands from inside the various containers in GitHub’s distributed ecosystem. This allows developers to modularly interact with and make ephemeral changes to the system.

# Run command from inside a container in the system using Docker-Compose

docker compose --project-name hcs exec bash

# Run from inside a container using CLI

hcs shell

This example compares how to check the status of the containers in the project so end-users can easily see the health of the entire system.

# Status using Docker-Compose

docker compose --project-name hcs ps --format json

# Status using CLI

hcs status

In addition to this easy-to-use and ergonomic CLI, we had to ensure that HCS runs an up-to-date version of the GitHub ecosystem. GitHub is made up of so many different moving pieces that testing new changes on code that’s even a couple days old would not be sufficient to build confidence. When iterating directly on the monorepo, this was a non-issue since folks just fetched the main branch. For HCS, this required us to build automation that cuts releases on a frequent cron schedule. A release of HCS is a software artifact containing the compiled Golang binary for HCS and its CLI that can be pulled using the gh CLI.

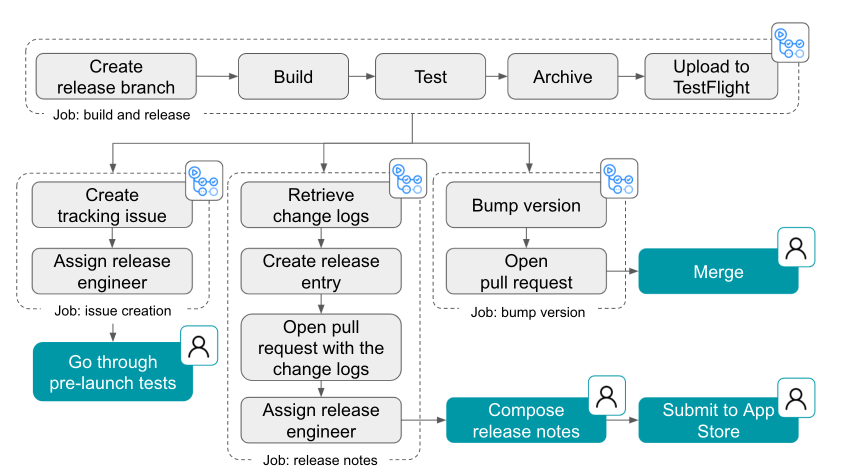
The diagram below illustrates how this process works.
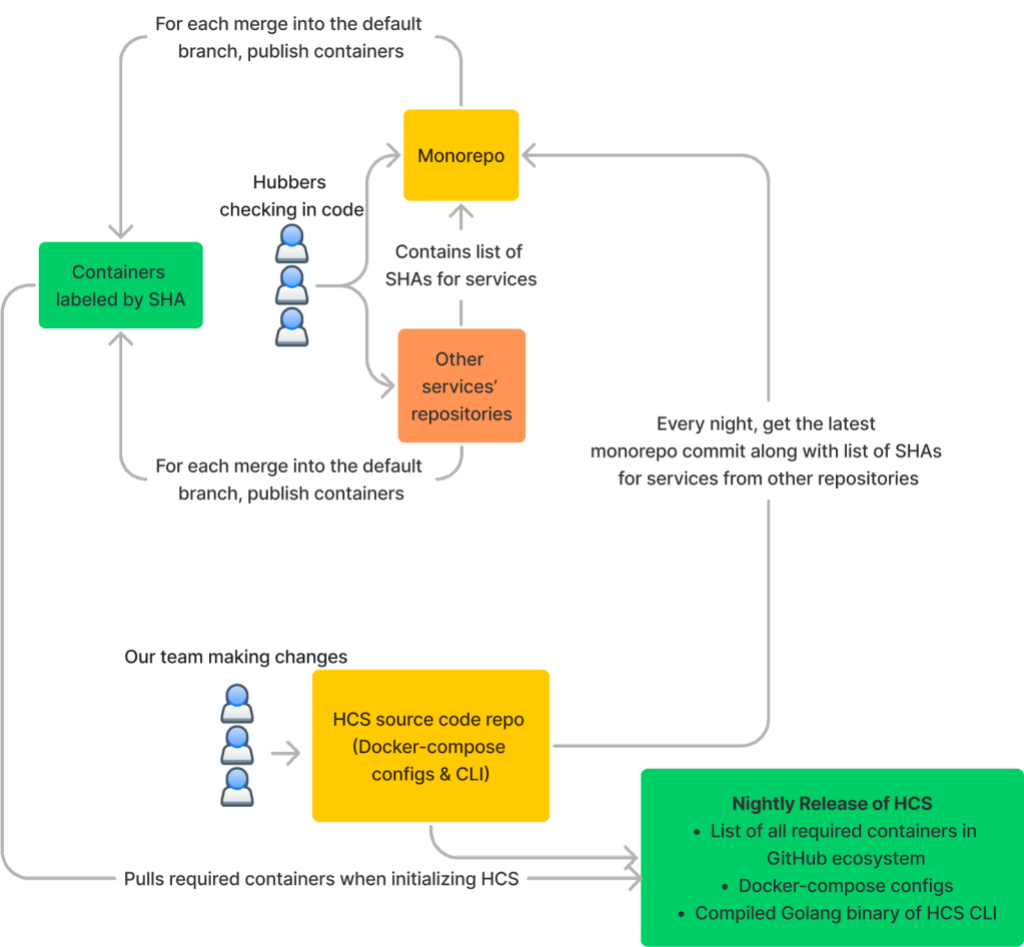
This diagram shows the nightly release cycle of HCS. HCS's repository gets SHAs from the monorepo and other service repositories. Then it publishes a release with all the SHAs, the Docker-Compose configs, and the CLI binary.

End-user experience

Using HCS directly in your codespace

We’ve recently made efforts to push all development at GitHub onto GitHub Codespaces. A codespace is a custom development container, or devcontainer, based on a configuration file in a repository. A repository can have multiple codespaces associated with it as long as each has a unique configuration file. On top of the obvious benefits of having a reproducible environment on demand to develop and iterate in, devcontainers offer features. This abstraction allows developers to easily add software to their environments. HCS is also consumable this way. The code block below shows the couple lines needed to bring this entire ecosystem to a partner team’s preferred environment (that is, their codespace).

{
…
  "features": {
    …
    "ghcr.io/devcontainers/features/github-cli:1": {
      "version": "latest"
    },
    //docker-in-docker required for hcs
    "ghcr.io/devcontainers/features/docker-in-docker:2": {},
    // Include the hubber-codespace feature
    "ghcr.io/github/hubber-codespace/hcs:1": {},
    "ghcr.io/devcontainers/features/go:1": {}
    …
  }
}

Now, teams can perform integration testing against the many other services in GitHub’s ecosystem from directly in the codespace where they were doing local development.

Release binary

Even with the push towards codespaces, not every context that requires an ecosystem will be a devcontainer. In light of this, we also gave end users the option to download the release directly from the GitHub API. The commands to do so can be seen below. With a couple simple commands, Hubbers now have everything they need to bring the entire GitHub ecosystem to whatever environment they want.

gh release download --repo github/hubber-codespace  -p hcs -D /tmp/

chmod +x /tmp/hcs

sudo mv /tmp/hcs /usr/local/bin

hcs init

hcs pull

hcs start

Testimonials

But don’t just take my word for it. Check out what our partner teams have had to say about HCS improving their development loop:

“HCS has improved our dev loop for [our service] by making it simple to test [it] against [the rest of GitHub’s ecosystem]. It’s turned what used to be a number of manual steps to clone our repository into the [monorepo environment] into two simple commands in our own codespace. This has made it much easier to validate our changes without having to deploy to a staging environment.”

“Given that we are a service operating outside GitHub but with a heavy reliance on the services running within GitHub, we’ve had to go through a lot of bells and whistles to ensure we can have a smooth development experience. In my four years working on [our service], HCS has been the most seamless experience in going from a blank devbox to breakpointing live running code for our service.”

Conclusion

Solving the ecosystem problem is always a balancing act. Luckily, thanks to GitHub’s push towards containerization, and tooling such as repository automation and publishing/consuming releases through the GitHub CLI, we were adequately equipped to develop a solution with HCS. Hubbers can now leverage a development loop that allows them to deploy with confidence, having tested their changes within GitHub’s complex multi-service system.

The post How GitHub’s Developer Experience team improved innerloop development appeared first on The GitHub Blog.

A developer’s guide to prompt engineering and LLMs

Post Syndicated from Albert Ziegler original https://github.blog/2023-07-17-prompt-engineering-guide-generative-ai-llms/


In a blog post authored back in 2011, Marc Andreessen warned that, “Software is eating the world.” Over a decade later, we are witnessing the emergence of a new type of technology that’s consuming the world with even greater voracity: generative artificial intelligence (AI). This innovative AI includes a unique class of large language models (LLM), derived from a decade of groundbreaking research, that are capable of out-performing humans at certain tasks. And you don’t have to have a PhD in machine learning to build with LLMs—developers are already building software with LLMs with basic HTTP requests and natural language prompts.

In this article, we’ll tell the story of GitHub’s work with LLMs to help other developers learn how to best make use of this technology. This post consists of two main sections: the first will describe at a high level how LLMs function and how to build LLM-based applications. The second will dig into an important example of an LLM-based application: GitHub Copilot code completions.

Others have done an impressive job of cataloging our work from the outside. Now, we’re excited to share some of the thought processes that have led to the ongoing success of GitHub Copilot.

Let’s jump in.

Everything you need to know about prompt engineering in 1600 tokens or less

You know when you’re tapping out a text message on your phone, and in the middle of the screen just above the keypad, there’s a button you can click to accept a suggested next word? That’s pretty much what an LLM is doing—but at scale.

A GIF show autocomplete functionalities in iOS.
An example of iMessage’s text prediction feature.

Instead of text on your phone, an LLM works to predict the next best group of letters, which are called “tokens.” And in the same way that you can keep tapping that middle button to complete your text message, the LLM completes a document by predicting the next word. It will continue to do that over and over, and it will only stop once it has reached a maximum threshold of tokens or once it has encountered a special token that signals “Stop! This is the end of the document.”

There’s an important difference, though. The language model in your phone is pretty simple—it’s basically saying, “Based only upon the last two words entered, what is the most likely next word?” In contrast, an LLM produces an output that’s more akin to being “based upon the full content of every document ever known to exist in the public domain, what is the most likely next token in your document?” By training such a large, well-architected model on an enormous dataset, an LLM can almost appear to have common sense such as understanding that a glass ball sitting on a table might roll off and shatter.

A screenshot of ChatGPT answering a question about the danger of setting a round glass ball on a small table.
Example of an LLM’s awareness or “common sense” due to its training.

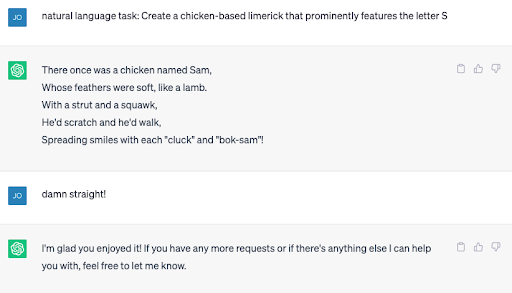
But be warned: LLMs will also sometimes confidently produce information that isn’t real or true, which are typically called “hallucinations” or “fabulations.” LLMs can also appear to learn how to do things they weren’t initially trained to do. Historically, natural language models have been created for one-off tasks, like classifying the sentiment of a tweet, extracting the business entities from an email, or identifying similar documents, but now you can ask AI tools like ChatGPT to perform a task that it was never trained to do.

A screenshot of ChatGPT answering a prompt to create a chicken-based limerick.
John conversing with ChatGPT about serious things.

Building applications using LLMs

A document completion engine is a far cry from the amazing proliferation of LLM applications that are springing up every day, running the gamut from conversational search, writing assistants, automated IT support, and code completion tools, like GitHub Copilot. But how is it possible that all of these tools can come from what is effectively a document completion tool? The secret is any application that uses an LLM is actually mapping between two domains: the user domain and the document domain.

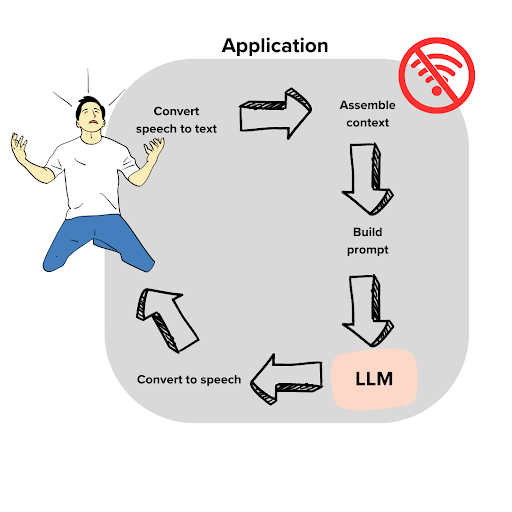
A graphic showing how LLMs work and the processes behind them to determine context before giving an answer.
Diagram of the user flow when communicating with an LLM, in this case, Dave’s user flow.

On the left is the user. His name is Dave, and he has a problem. It’s the day of his big World Cup watch party, and the Wi-Fi is out. If they don’t get it fixed soon, he’ll be the butt of his friends’ jokes for years. Dave calls his internet provider and gets an automated assistant. Ugh! But imagine that we are implementing the automated assistant as an LLM application. Can we help him?

The key here is to figure out how to convert from user domain into document domain. For one thing, we will need to transcribe the user’s speech into text. As soon as the automated support agent says “Please state the nature of your cable-related emergency,” Dave blurts out:

Oh it’s awful! It’s the World Cup finals. My TV was connected to my Wi-Fi, but I bumped the counter and the Wi-Fi box fell off and broke! Now, we can’t watch the game.

At this point, we have text, but it’s not of much use. Maybe you would imagine that this was part of a story and continue it, “I guess, I’ll call up my brother and see if we can watch the game with him.” An LLM with no context will similarly create the continuation of Dave’s story. So, let’s give the LLM some context and establish what type of document this is:

### ISP IT Support Transcript:

The following is a recorded conversation between an ISP customer, Dave Anderson, and Julia Jones, IT support expert. This transcript serves as an example of the excellent support provided by Comcrash to its customers.

*Dave: Oh it's awful! This is the big game day. My TV was connected to my Wi-Fi, but I bumped the counter and the Wi-Fi box fell off and broke! Now we can't watch the game.
*Julia:

Now, if you found this pseudo document on the ground, how would you complete it? Based on the extra context, you would see that Julia is an IT support expert, and apparently a really good one. You would expect the next words to be sage advice to help Dave with his problem. It doesn’t matter that Julia doesn’t exist, and this wasn’t a recorded conversation—what matters is that these extra words offer more context for what a completion might look like. An LLM does the same exact thing. After reading this partial document, it will do its best to complete Julia’s dialogue in a helpful manner.

But there’s more we can do to make the best document for the LLM. The LLM doesn’t know a whole lot about cable TV troubleshooting. (Well, it has read every manual and IT document ever published online, but stay with me here). Let’s assume that its knowledge is lacking in this particular domain. One thing we can do is search for extra content that might help Dave and place it into the document. Let’s assume that we have a complaints search engine that allows us to find documentation that has been helpful in similar situations in the past. Now, all we have to do is weave this information into our pseudo document in a natural place.

Continuing from above:

*Julia:(rifles around in her briefcase and pulls out the perfect documentation for Dave's request)
Common internet connectivity problems ...
<...here we insert 1 page of text that comes from search results against our customer support history database...>
(After reading the document, Julia makes the following recommendation)
*Julia:

Now, given this full body of text, the LLM is conditioned to make use of the implanted documentation, and in the context of “a helpful IT expert,” the model will generate a response. This reply takes into account the documentation as well as Dave’s specific request.

The last step is to move from the document domain into the user’s problem domain. For this example, that means just converting text to voice. And since this is effectively a chat application, we would go back and forth several times between the user and the document domain, making the transcript longer each time.

This, at the core of the example, is prompt engineering. In the example, we crafted a prompt with enough context for the AI to produce the best possible output, which in this case was providing Dave with helpful information to get his Wi-Fi up and running again. In the next section, we’ll take a look at how we at GitHub have refined our prompt engineering techniques for GitHub Copilot.

The art and science of prompt engineering

Converting between the user domain and document domain is the realm of prompt engineering—and since we’ve been working on GitHub Copilot for over two years, we’ve started to identify some patterns in the process.

These patterns have helped us formalize a pipeline, and we think it is an applicable template to help others better approach prompt engineering for their own applications. Now, we’ll demonstrate how this pipeline works by examining it in the context of GitHub Copilot, our AI pair programmer.

The prompt engineering pipeline for GitHub Copilot

From the very beginning, GitHub Copilot’s LLMs have been built on AI models from OpenAI that have continued to get better and better. But what hasn’t changed is the answer to the central question of prompt engineering: what kind of document is the model trying to complete?

The OpenAI models we use have been trained to complete code files on GitHub. Ignoring some filtering and stratification steps that don’t really change the prompt engineering game, this distribution is pretty much that of individual file contents according to the most recent commit to main at data collection time.

The document completion problem the LLM solves is about code, and GitHub Copilot’s task is all about completing code. But the two are very different.

Here are some examples:

  • Most files committed to main are finished. For one, they usually compile. Most of the time the user is typing, the code does not compile because of incompletions that will be fixed before a commit is pushed.
  • The user might even write their code in hierarchical order, method signatures first, then bodies rather than line by line or in a mixed style.
  • Writing code means jumping around. In particular, people’s edits often require them to jump up in the document and make a change there, for example, adding a parameter to a function. Strictly speaking, if Codex suggests using a function that has not been imported yet, no matter how much sense it might make, that’s a mistake. But as a GitHub Copilot suggestion, it would be useful.

The issue is that merely predicting the most likely continuation based on the text in front of the cursor to make a GitHub Copilot suggestion would be a wasted opportunity. That’s because it ignores an incredible wealth of context. We can use that context to guide the suggestion, like metadata, the code below the cursor, the content of imports, the rest of the repository, or issues, and create a strong prompt for the AI assistant.

Software development is a deeply interconnected, multimodal challenge, and the more of that complexity we can tame and present to the model, the better your completions are going to be.

Step 1: Gathering context

GitHub Copilot lives in the context of an IDE such as Visual Studio Code (VS Code), and it can use whatever it can get the IDE to tell it—only if the IDE is quick about it though. In an interactive environment like GitHub Copilot, every millisecond matters. GitHub Copilot promises to take care of the common coding tasks, and if it wants to do that, it needs to display its solution to the developer before they have started to write more code in their IDE. Our rough heuristics say that for every additional 10 milliseconds we take to come up with a suggestion, the chance it’ll arrive in time decreases by one percent.

So, what can we say quickly? Well, here’s an example. Consider this suggestion to a simple piece of Python:

A developer prompting GitHub Copilot to write a simple function in Python to compute Fibonacci numbers.

Wrong! Turns out the user actually wanted to write Ruby, like this:

A developer using GitHub Copilot to write a simple function to compute Fibonacci numbers in Ruby.

The two languages have similar enough syntax so that only a couple of lines can be ambiguous, especially when it’s toward the beginning of the file where much of what we encounter are boilerplate comments. But modern IDEs such as VS Code typically know what language the user is writing in. That makes language mix ups especially annoying to the user because they break the implicit expectation that “the computer should know” (after all, most IDEs highlight language syntax).

So, let’s put the language metadata into our pile of context we might want to include. In fact, let’s add the whole filename too. If it’s available, it usually implies the language through its extension, and additionally sets the tone for what to expect in that file—small, easy pieces of information that won’t turn the tide but are helpful to include.

On the other end of the spectrum, there’s the rest of the repository. Say you’ve got a file that defines an abstract class DataReader. And you have another that defines a subclass CsvReader. And you’re now writing a new file defining another subclass SqlReader. Chances are that to write the new file, you’ll want to check out both existing files as well because they communicate useful background into what you need to implement and how to do it. Typically, developers keep such files open in different tabs and switch to remind themselves of definitions, examples, similar patterns, or tests.

If the content of those two files is useful to you, chances are it would be useful to the AI as well. So, let’s add it as context! After all, the IDE knows what other files from the repository are open as tabs in the same window. The repository might have hundreds or even thousands of files, but only some will be open, and that is a strong hint that they might be useful to what they’re doing right now. Of course, “some” can mean a lot of things, so we don’t consider any more than the 20 most recent tabs.

Step 2: Snippeting

Irrelevant information in an LLM’s context decreases its accuracy. Additionally, source code tends to be long, so even a single file is not guaranteed to fit completely into an LLM’s context window (a problem that occurs roughly a fifth of the time). So, unless the user is very frugal about their tab usage, we simply cannot include all the tabs.

It’s important to be selective about what code to include from other files, so we cut files into (hopefully) natural, overlapping snippets that are no longer than 60 lines. Of course, we don’t want to actually include all overlapping snippets—that’s why we score them and take only the best. In this case, the “score” is meant to reflect relevance. To determine a snippet’s score, we use the Jaccard similarity, a stat that can be used to gauge the similarity or diversity of sample sets. (It’s also super fast to compute, which is great for reducing latency.)

Step 3: Dressing them up

Now we have some context we’d like to pass on to the model. But how? Codex and other models don’t offer an API where you can add other files, or where you can specify the document’s language and filename for that matter. They complete one single document. As mentioned above, you’ll need to inject your context into that document in a natural way.

The path and name might be easiest. Many files start with a preamble that gives some metadata, like author, project name, or filename. So, we’ll pretend this is happening here as well, and add a line at the very top that reads something like # filepath: foo/bar.py or // filepath: foo.bar.js, depending on comment syntax in the file’s language.

Sometimes the path isn’t known, like with new files that haven’t yet been saved. Even then, we could try to at least specify the language, provided the IDE is aware of it. For many languages, we have the opportunity to include shebang lines like #!/usr/bin/python or #!/usr/bin/node. That’s a neat trick that works pretty well at warding against mistaken language identity. But it’s also a bit dangerous since files with shebang lines are a biased subpopulation of all code. So, let’s do it for short files where the danger of mistaken language identity is high, and avoid it for larger or named files.

If comments work as a delivery system for tiny nuggets of information, like path or language, we can also make them work as delivery systems for the chunky deep dives that are 60 lines of related code.

Comments are versatile, and commented-out code exists all over GitHub. Let’s look at some of the most common examples:

  • Old code that doesn’t apply anymore
  • Deleted features
  • Earlier versions of current code
  • Example code specifically left there for documentation purposes
  • Code lifted from other parts of the codebase

Let’s take our inspiration from the last group of examples. Familiarity with groups (1) – (3) makes things a bit easier on the model, but our snippets aim to emulate groups (4) and (5):

# compare this snippet from utils/concatenate.py:

# def crazy_concat(a, b):

# return str(a) + str(b)[::-1]

Note that including the file name and path of the snippet source can be useful. And combined with the current file’s path, this might guide completions referencing imports.

Step 4: Prioritization

So far, we have grabbed many pieces of context from many sources: the text directly above the cursor, text below the cursor, text in other files, and metadata like language and file path.

In the vast majority of cases (around 95%), we have to make the tough choice of what we can or cannot include.

We make that choice by thinking of the items we might include as “wishes.” Each time we uncover a piece of context, like a commented out snippet from an open tab, we make a wish. Wishes come with some priority attached, for example, the shebang lines have rather low priorities. Snippets with a low similarity score are barely higher. In contrast, the lines directly above the cursor have maximum priority. Wishes also come with a desired position in the document. The shebang line needs to be the very first item, while the text directly above the cursor comes last—it should directly precede the LLM’s completion.

The fastest way of selecting which wishes to fill and which ones to discard is by sorting that wishlist by priority. Then, we can keep deleting the lowest priority wishes until what remains fits in the context window. We then sort again by the intended order in the document and paste everything together.

Step 5: The AI does its thing

Now that we’ve assembled an informative prompt, it’s time for the AI to come up with a useful completion. We have always faced a very delicate tradeoff here—GitHub Copilot needs to use a highly capable model because quality makes all the difference between a useful suggestion and a distraction. But at the same time, it needs to be a model capable of speed, because latency makes all the difference between a useful suggestion and not being able to provide a suggestion at all.

So, which AI should we choose to “do its thing” on the completion task: the fastest or the most accurate one? It’s hard to know in advance, so OpenAI developed a fleet of models in collaboration with GitHub. We put two different models in front of developers but found that people got the most mileage (in terms of accepted and retained completions) out of the much faster model. Since then, further optimizations have increased model speed significantly, so that the current version of GitHub Copilot is backed by an even more capable model.

Step 6: Now, over to you!

The generative AI produces a string, and if it’s not stopped, it keeps on producing and will keep going until it predicts the end of the file. That would waste time and compute resources, so you need to set up “stop” criteria.

The most common stop criterion is actually looking for the first line break. In many situations, it seems likely that a software developer wants the current line to be finished, but not more. But some of the most magical contributions by GitHub Copilot are when it suggests multiple lines of code all at once.

Multi-line completions feel natural when they’re about a single semantic unit, such as the body of a function, an if-branch, or a class. GitHub Copilot looks for cases where such a block is being started, either because the developer has just written the start, such as the header, if guard, or class declaration, or is currently writing the start. If the block body appears to be empty, it will attempt to make a suggestion for it, and only stop when the block appears to be done.

This is the point when the suggestion gets surfaced to the coder. And the rest, as they say, is ~~history~~ 10x development.

If you’re interested in learning more about prompt engineering in general and how you can refine your own techniques, check out our guide on getting started with GitHub Copilot.

Survey reveals AI’s impact on the developer experience

Post Syndicated from Inbal Shani original https://github.blog/2023-06-13-survey-reveals-ais-impact-on-the-developer-experience/


Developers today do more than just write and ship code—they’re expected to navigate a number of tools, environments, and technologies, including the new frontier of generative artificial intelligence (AI) coding tools. But the most important thing for developers isn’t story points or the speed of deployments. It’s the developer experience, which determines how efficiently and productively developers can exceed standards, enter a flow state, and drive impact.

I say this not only as GitHub’s chief product officer, but as a long-time developer who has worked across every part of the stack. Decades ago, when I earned my master’s in mechanical engineering, I became one of the first technologists to apply AI in the lab. Back then, it would take our models five days to process our larger datasets—which is striking considering the speed of today’s AI models. I yearned for tools that would make me more efficient and shorten my time to production. This is why I’m passionate about developer experience (DevEx) and have made it my focus as GitHub’s chief product officer.

Amid the rapid advancements in generative AI, we wanted to get a better understanding from developers about how new tools—and current workflows—are impacting the overall developer experience. As a starting point, we focused on some of the biggest components of the developer experience: developer productivity, team collaboration, AI, and how developers think they can best drive impact in enterprise environments.

To do so, we partnered with Wakefield Research to survey 500 U.S.-based developers at enterprise companies. In the following report, we’ll show how organizations can remove barriers to help enterprise engineering teams drive innovation and impact in this new age of software development. Ultimately, the way to innovate at scale is to empower developers by improving their productivity, increasing their satisfaction, and enabling them to do their best work—every day. After all, there can be no progress without developers who are empowered to drive impact.

Inbal Shani
Chief Product Officer // GitHub

Learn how generative AI is changing the developer experience

Discover how generative AI is changing software development in a pre-recorded session from GitHub.

Watch the video >

Why developer experience matters

At GitHub, we’re aware there’s often a significant gap between the day-to-day reality for most developers and “conversations about ‘what developers want.’”

With this survey, we wanted to better understand the typical experience for developers—and identify key ways companies can empower their developers and achieve greater success.

One big takeaway: It starts with investing in a great developer experience. And collaboration, as we learned from our research, is at the core of how developers want to work and what makes them most productive, satisfied, and impactful.

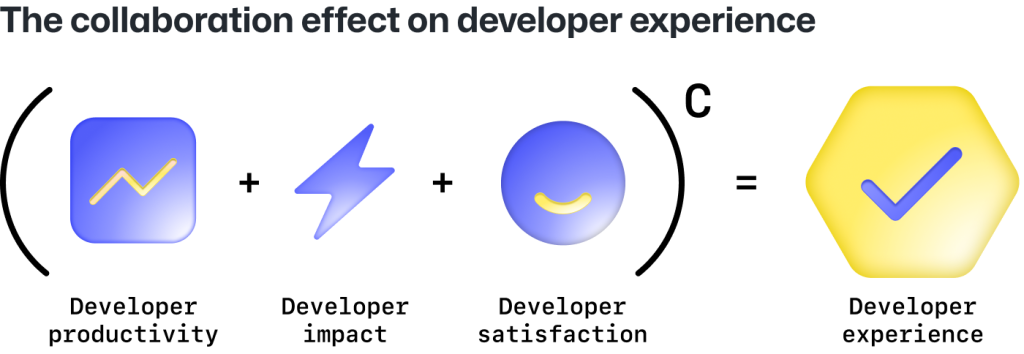
A diagram of a formula behind the developer experience that accounts for productivity, impact, satisfaction, and collaboration.
C = Collaboration, the multiplier across the entire developer experience.

DevEx is a formula that takes into account:

  • How simple and fast it is for a developer to implement a change on a codebase—or be productive.
  • How frictionless it is to move from idea through production to impact.
  • How positively or negatively the work environment, workflows, and tools affect developer satisfaction.

For leaders, developer experience is about creating a collaborative environment where developers can be their most productive, impactful, and satisfied at work. For developers, collaboration is one of the most important parts of the equation.

Current performance metrics fall short of developer expectations

Developers say performance metrics don’t meet expectations

The way developers are currently evaluated doesn’t align with how they think their performance should be measured.

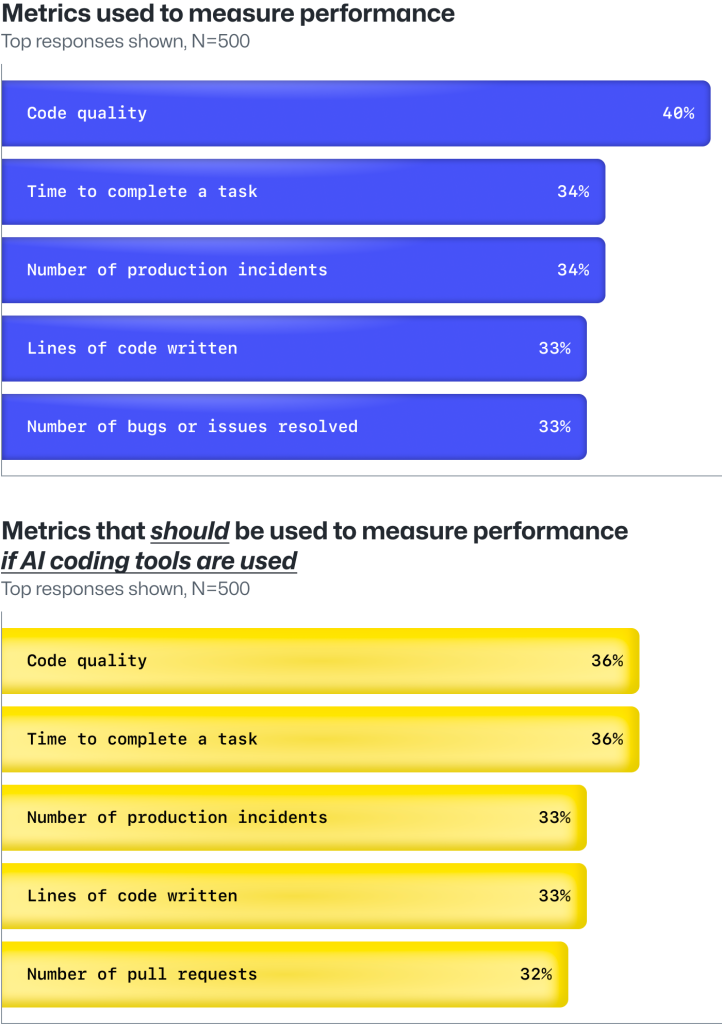
  • For instance, the developers we surveyed say they’re currently measured by the number of incidents they resolve. But developers believe that how they handle those bugs and issues is more important to performance. This aligns with the belief that code quality over code quantity should remain a top performance metric.
  • Developers also believe collaboration and communication should be just as important as code quality in terms of performance measures. Their ability to collaborate and communicate with others is essential to their job, but only 33% of developers report that their companies use it as a performance metric.
Key survey findings showing what developer say their managers use to measure their performance and what developers think will matter more when they start using AI coding tools.
Metrics currently used to measure performance, compared with metrics developers think should be used to measure their performance.
More than output quantity and efficiency, code quality and collaboration are the most
important performance metrics, according to the developers we surveyed.
Twitter logo LinkedIn logo
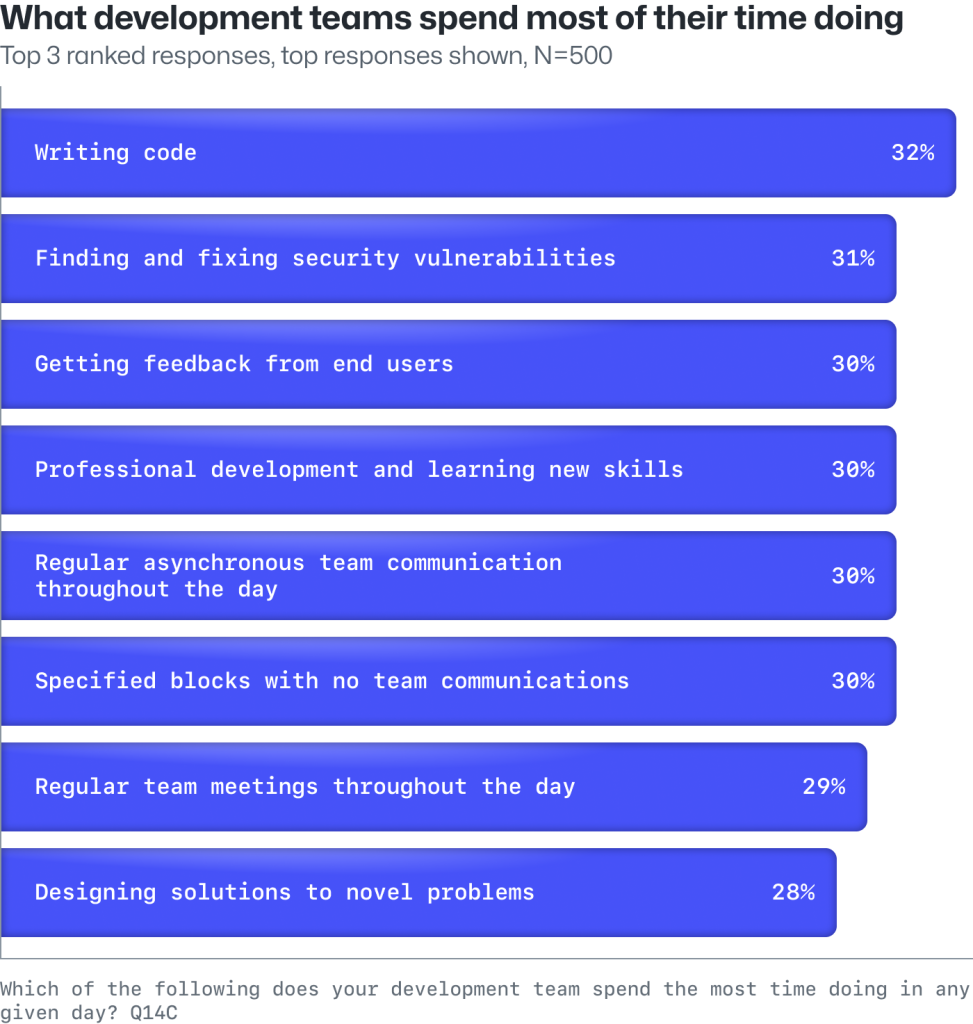
A chart showing what developers say their teams spend the most time doing at work.
The top ranked responses that developers say their teams are working the most on including writing code and finding and fixing security vulnerabilities.

Developers want more opportunities to upskill and drive impact

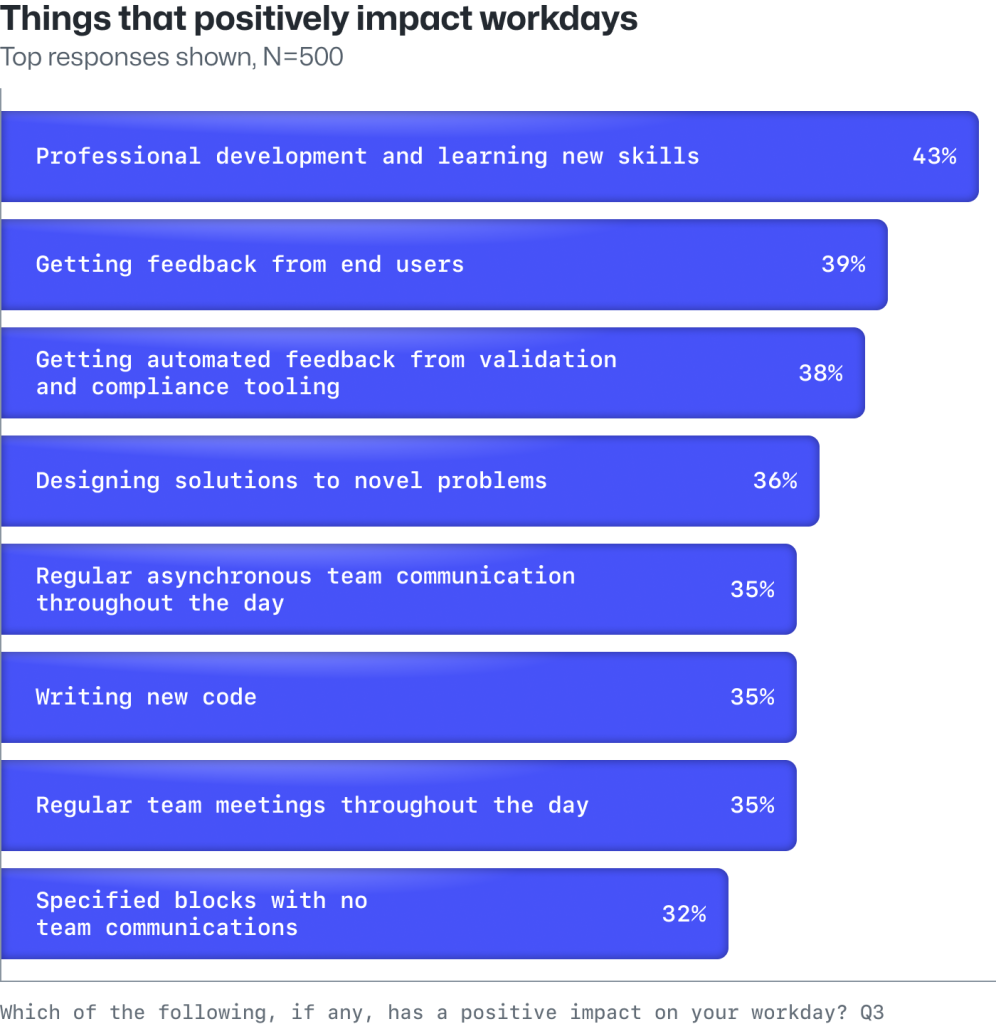
When developers are asked about what makes a positive impact on their workday, they rank learning new skills (43%), getting feedback from end users (39%), and automated tests (38%), and designing solutions to novel problems (36%) as top contenders.

A ranked list of the tasks 500 U.S.-based developers say have the most positive impact on their workdays.
The top tasks developers say positively impact their workdays.

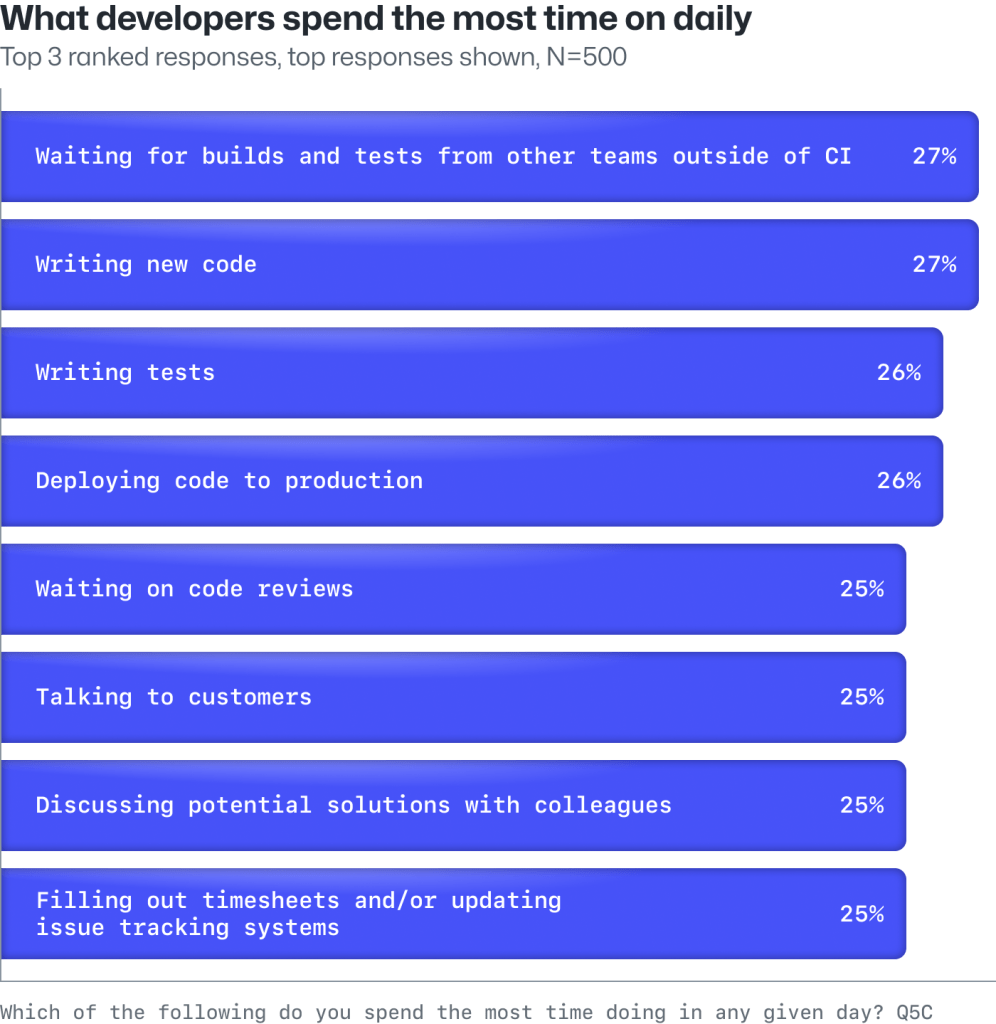
But developers say they’re spending most of their time writing code and tests, then waiting for that code to be reviewed or builds and tests to be executed.

On a typical day, the enterprise developers we surveyed report their teams are busy with a variety of tasks, including writing code, fixing security vulnerabilities, and getting feedback from end users, among other things. Developers also report that they spend a similar amount of time across these tasks, indicating that they’re stretched thin throughout the day.

A ranked list of the top tasks developers and software engineers say they spend the most time working on each day.
The tasks developers say they spend the most time working on each day.

Notably, developers say they spend the same amount of time waiting for builds and tests as they do writing new code.

  • This suggests that wait times for builds and tests are still a persistent problem despite investments in DevOps tools over the past decade.
  • Developers also continue to face obstacles, such as waiting on code review, builds, and test runs, which can hinder their ability to learn new skills and design solutions to novel problems, and our research suggests that these factors can have the biggest impact on their overall satisfaction.

Developers want feedback from end users, but face challenges

Developers say getting feedback from end users (39%) is the second-most important thing that positively impacts their workdays—but it’s often challenging for development teams to get that feedback directly.

  • Product managers and marketing teams often act as intermediaries, making it difficult for developers to directly receive end-user feedback.
  • Developers would ideally receive feedback from automated and validation tests to improve their work, but sometimes these tests are sent to other teams before being handed off to engineering teams.

The top two daily tasks for development teams include writing code (32%) and finding and fixing security vulnerabilities (31%).

  • This shows the increased importance developers have placed on security and underscores how companies are prioritizing security.
  • It also demonstrates the critical role that enterprise development teams play in meeting policy and board edicts around security.

The bottom line
Developers want to upskill, design solutions, get feedback from end users, and be evaluated on their communication skills. However, wait times on builds and tests, as well as the current performance metrics they’re evaluated on, are getting in the way.

Collaboration is the cornerstone of the developer experience

Developers thrive in collaborative environments

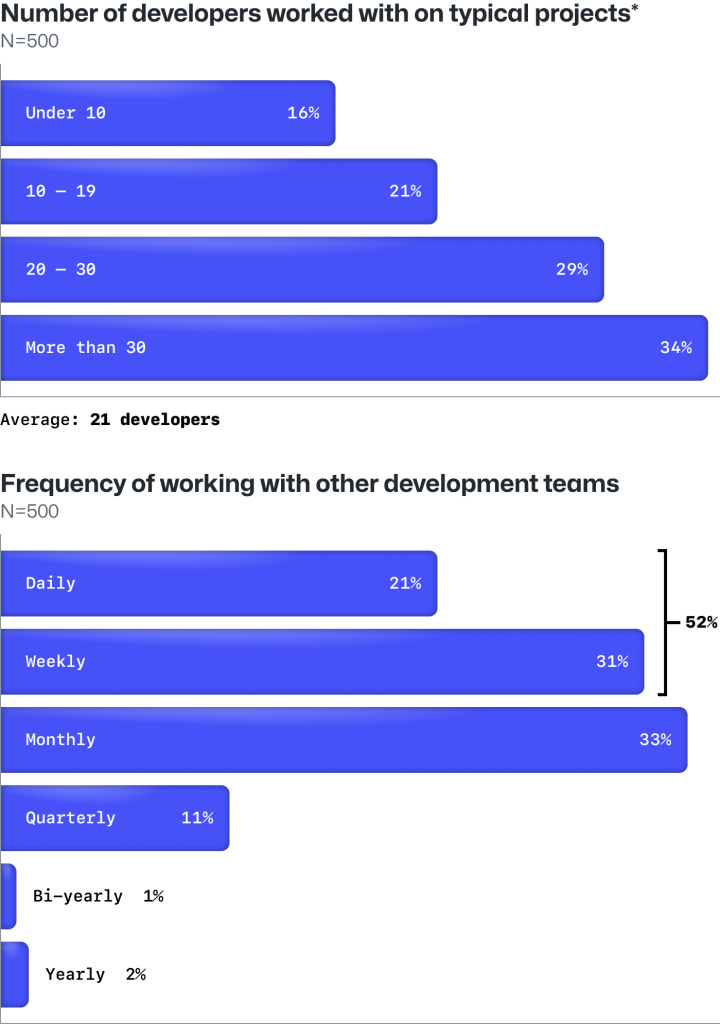
In our survey of enterprise engineers, developers say they work with an average of 21 other developers on a typical project—and 52% report working with other teams daily or weekly. Notably, they rank regular touchpoints as the most important factor for effective collaboration.

A survey finding that developers at enterprise companies often work with an average of 21 developers on other projects and often work on a daily or weekly basis with colleagues.
Developers in enterprise settings often work with an average of 21 other developers on a daily or weekly cadence.

But developers also have a holistic view of collaboration—it’s defined not only by talking and meeting with others, but also by uninterrupted work time, access to fully configured developer environments, and formal mentor-mentee relationships.

  • Specified blocks with no team communication give developers the time and space to write code and work towards team goals.
  • Access to fully configured developer environments promotes consistency throughout the development process. It also helps developers collaborate faster and avoid hearing the infamous line, “But it worked on my machine.”
  • Mentorships can help developers upskill and build interpersonal skills that are essential in a collaborative work environment.

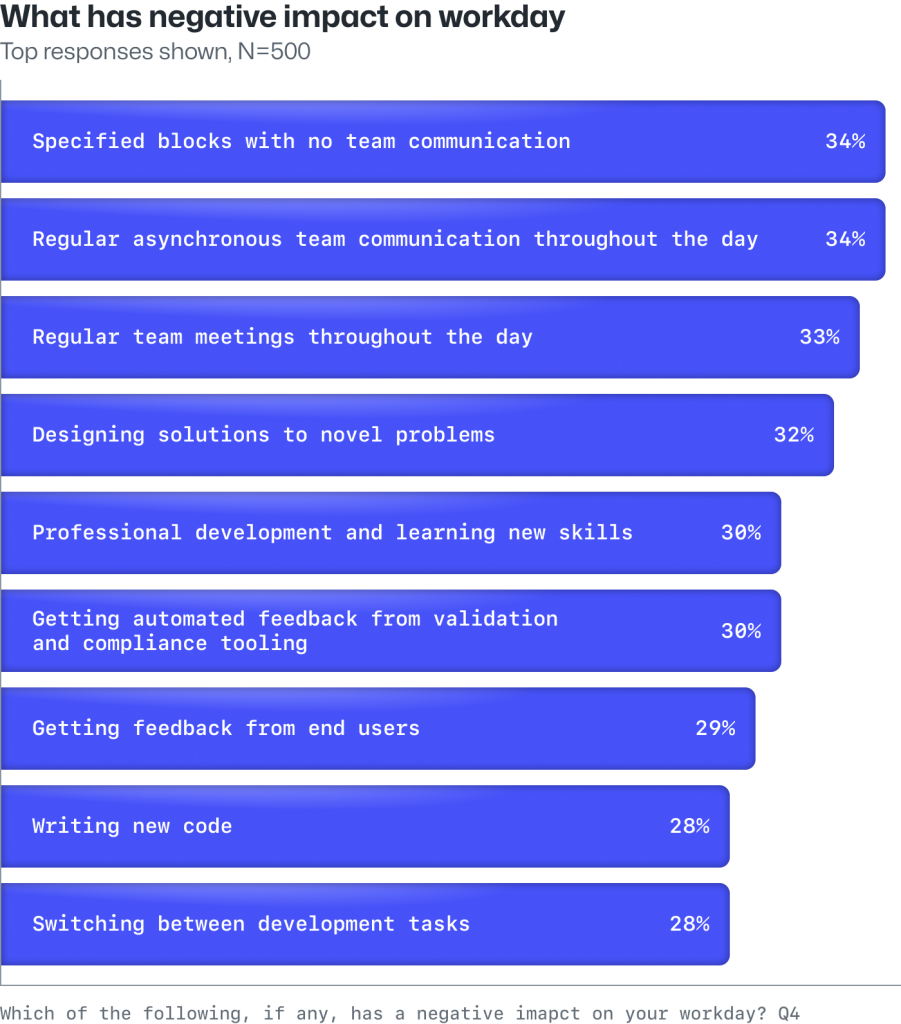
It’s important to note these factors can also negatively impact a developer’s work day—which suggests that ineffective meetings can serve to distract rather than help developers (something we’ve found in previous research).

The key factors developers in a survey say contribute most highly to effective team collaboration including meetings, dedicated time for individual work, and access to fully configured dev environments.

Our survey indicates the factors most important to effective collaboration are so critical that when they’re not done effectively, they have a noticeable, negative impact on a developer’s work.

A ranked list of the top tasks developers in a survey reported as having a negative impact on their overall workday experience.
The tasks developers say most often have a negative impact on their workday experience.
Developers work with an average of 21 people on any given project. They need the time and tools for success—including regular touchpoints, heads-down time, access to fully-configured dev environments, and formal mentor-mentee relationships.
Twitter logo LinkedIn logo

We wanted to learn more about how developers collaborate

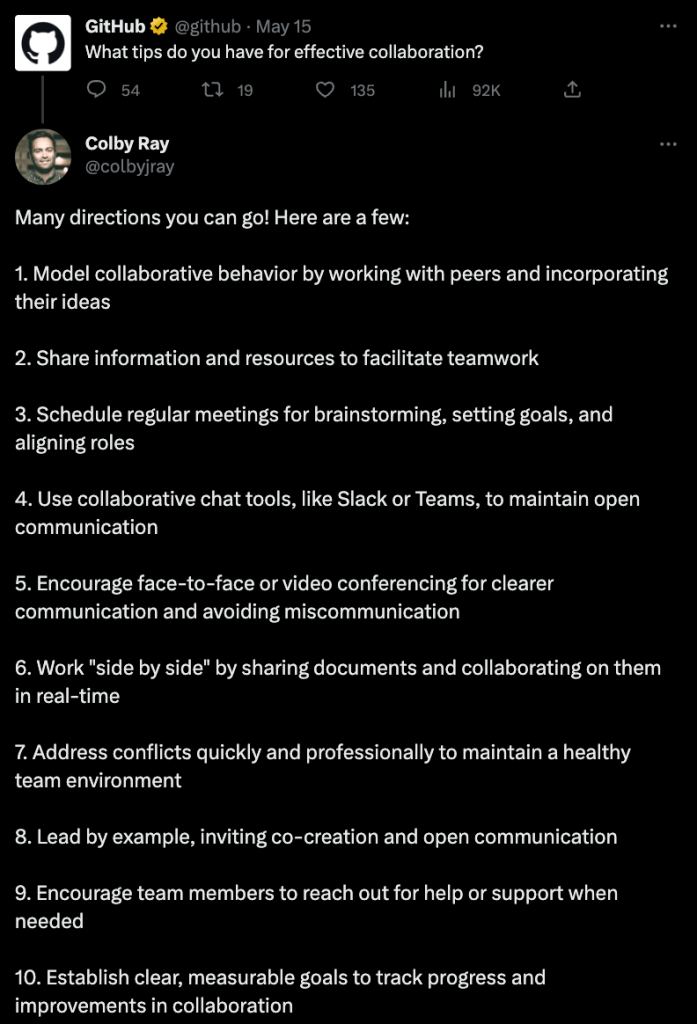
So, we sourced some answers from our followers on Twitter. We asked developers what tips they have for effective collaboration. Here’s what one developer had to say:

Twitter user Colby Ray had multiple points in response to our prompt. Click the image to read his tweet.

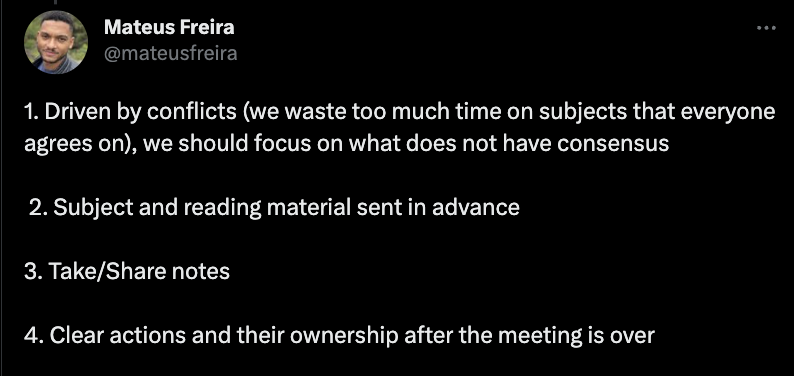
We also asked what makes for a productive and valuable meeting:

Twitter user kettenaito had several points in response to our prompt. Click the image to read on Twitter.

Twitter user Mateus Feira had several points in response to our prompt. Click the image to read on Twitter.

Effective collaboration improves code quality

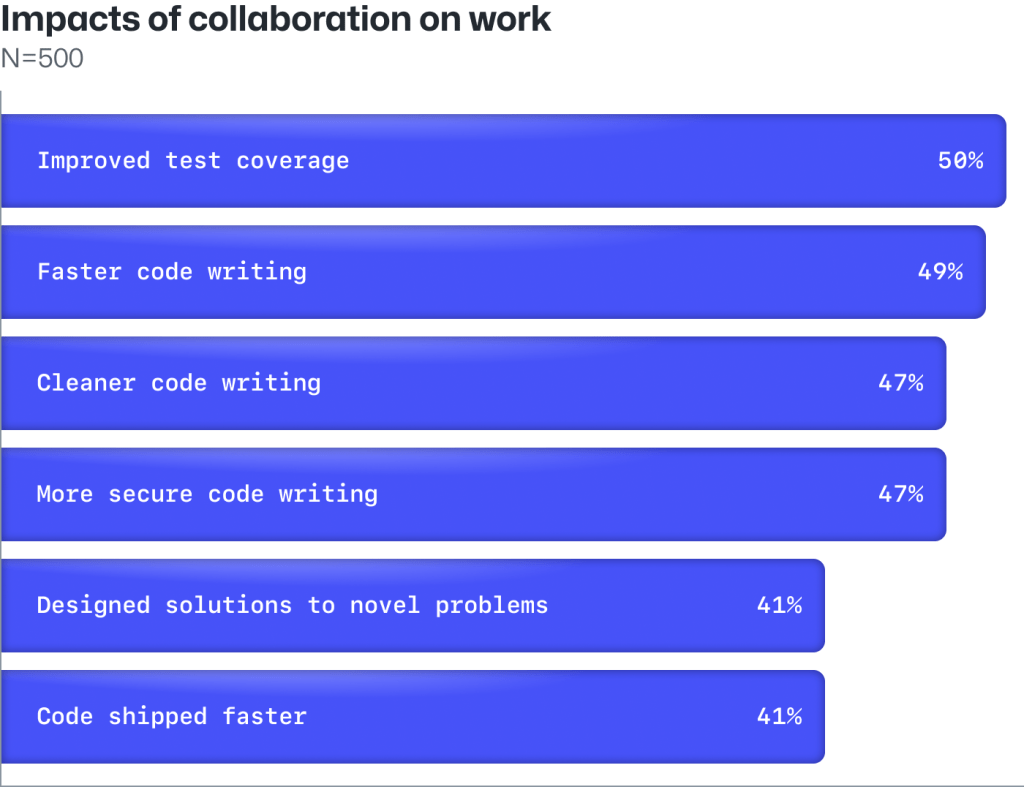
As developer experience continues to be defined, so, too, will successful developer collaboration. Too many pings and messages can affect flow, but there’s still a need to stay in touch. In our survey, developers say effective collaboration results in improved test coverage and faster, cleaner, more secure code writing—which are best practices for any development team. This shows that when developers work effectively with others, they believe they build better and more secure software.

Developers in a survey report that collaboration positively impacts how they write code, how fast they can ship it, and more.
Developers widely view effective collaboration as helping to improve what they ship and how often they ship it.

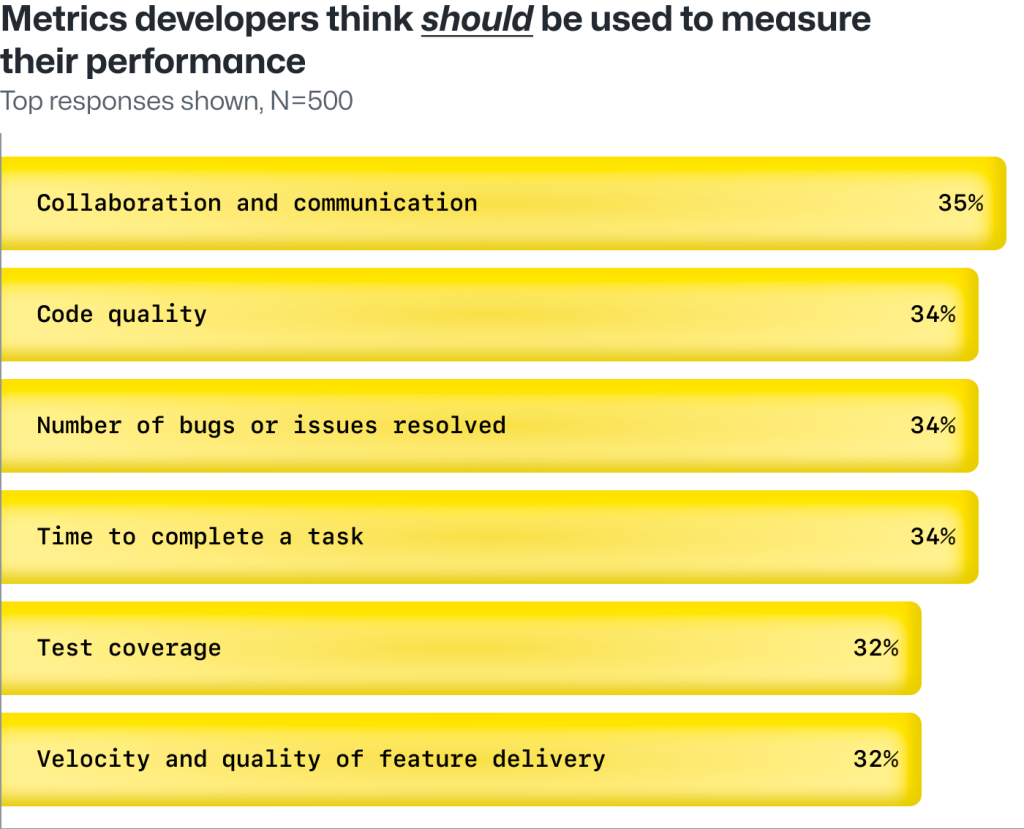
Developers we surveyed believe collaboration and communication—along with code quality—should be the top priority for evaluation.

  • From DevOps to agile methodologies, developers and the greater business world have been talking about the importance of collaboration for a long time.
  • But developers are still not being measured on it.
Developers in a survey respond to a question about what metrics they believe their companies should use to measure their performance and productivity.
The metrics that developers think their managers should use to evaluate their performance and productivity.

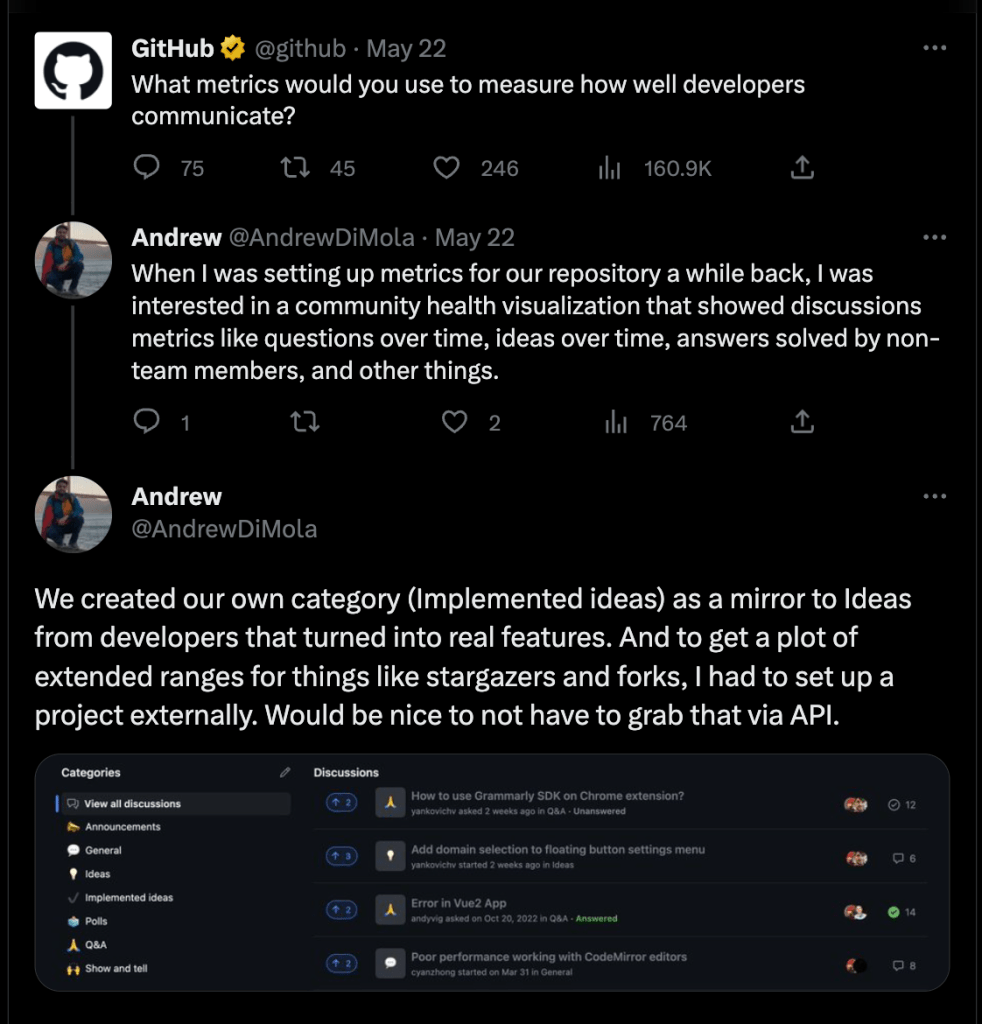
We asked developers to share their ideas for measuring how well they collaborate. Here’s what one developer had to say:

Twitter user Andrew DiMola had several points in response to our prompt. Click to read on Twitter.

  • The takeaway: Companies and engineering managers should encourage regular team communication, and set time to check in–especially in remote environments–but respect developers’ need to work and focus.
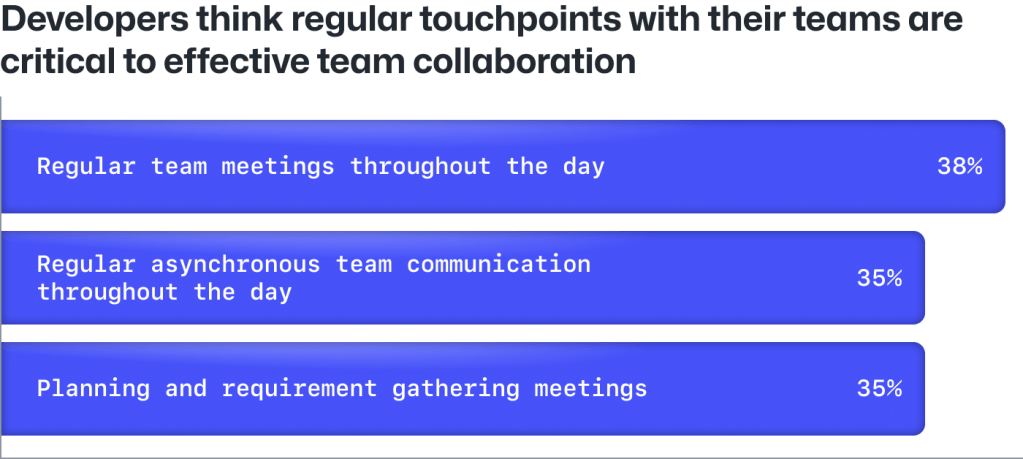
Developers think regular touchpoints with their teams including meetings, asynchronous communication, and innersource practices help organizations collaborate at scale.
Developers believe that effective and regular touchpoints with their colleagues are critical for effective team collaboration.

4 tips for engineering managers to improve collaboration

At GitHub, our researchers, developers, product teams, and analysts are dedicated to studying and improving developer productivity and satisfaction. Here are their tips for engineering leaders who want to improve collaboration among developers:

  1. Make collaboration a goal in performance objectives. This builds the space and expectation that people will collaborate. This could be in the form of lunch and learns, joint projects, etc.
  2. Define and scope what collaboration looks like in your organization. Let people know when they’re being informed about something vs. being consulted about something. A matrix outlining roles and responsibilities helps define each person’s role and is something GitHub teams have implemented.
  3. Give developers time to converse and get to know one another. In particular, remote or hybrid organizations need to dedicate a portion of a developer’s time and virtual space to building relationships. Check out the GitHub guides to remote work.
  4. Identify principal and distinguished engineers. Academic research supports the positive impact of change agents in organizations—and how they should be the people who are exceptionally great at collaboration. It’s a matter of identifying your distinguished engineers and elevating them to a place where they can model desired behaviors.

The bottom line
Effective developer collaboration improves code quality and should be a performance measure. Regular touchpoints, heads-down time, access to fully configured dev environments, and formal mentor-mentee relationships result in improved test coverage and faster, cleaner, more secure code writing.

AI improves individual performance and team collaboration

Developers are already using AI coding tools at work

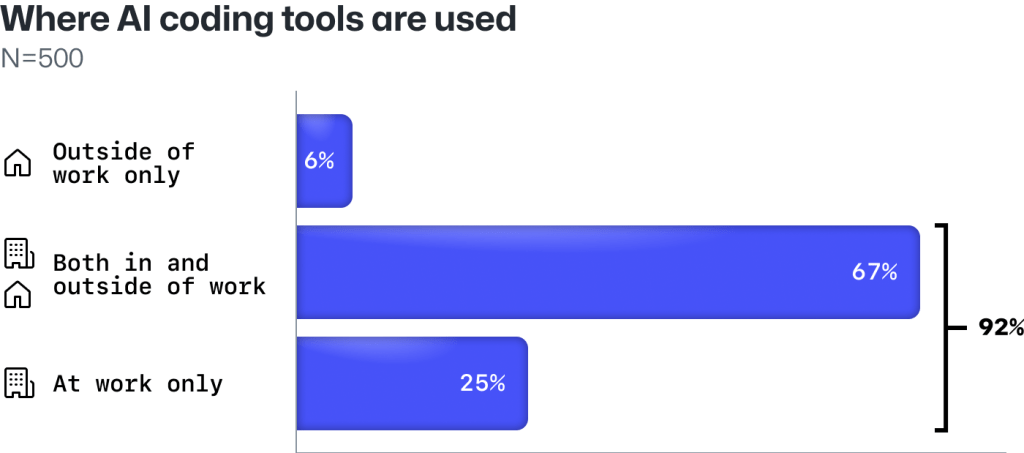
A staggering 92% of U.S.-based developers working in large companies report using an AI coding tool either at work or in their personal time—and 70% say they see significant benefits to using these tools.

  • AI is here to stay—and it’s already transforming how developers approach their day-to-day work. That makes it critical for businesses and engineering leaders to adopt enterprise-grade AI tools to avoid their developers using non-approved applications. Companies should also establish governance standards for using AI tools to ensure that they are used ethically and effectively.
92% of developers in a survey say they're already using AI coding tools at work.
Almost all developers are already using AI coding tools at and outside of work.

70% of developers see a benefit to using AI coding tools at work.

Almost all (92%) developers use AI coding tools at work—and a majority (67%) have used these tools in both a work setting and during their personal time. Curiously, only 6% of developers in our survey say they solely use these tools outside of work.
Twitter logo LinkedIn logo

Developers believe AI coding tools will enhance their performance

With most developers experimenting with AI tools in the workplace, our survey results suggest it’s not just idle interest leading developers to use AI. Rather, it’s a recognition that AI coding tools will help them meet performance standards.

  • In our survey, developers say AI coding tools can help them meet existing performance standards with improved code quality, faster outputs, and fewer production-level incidents. They also believe that these metrics should be used to measure their performance beyond code quantity.
The metrics developers say their managers use to measure their productivity vs. the metrics developers think their managers should use to measure their productivity if they use AI coding tools.
Developers widely think that AI coding tools will layer into their existing workflows and bring greater efficiencies—but they do not think AI will change how software is made.

Around one-third of developers report that their managers currently assess their performance based on the volume of code they produce—and an equal number anticipate that this will persist when they start using AI-based coding tools.

  • Notably, the quantity of code a developer produces may not necessarily correspond to its business value.
  • Stay smart. With the increase of AI tooling being used in software development—which often contributes to code volume—engineering leaders will need to ask whether measuring code volume is still the best way to measure productivity and output.

Developers think AI coding tools will lead to greater team collaboration

Beyond improving individual performance, more than 4 in 5 developers surveyed (81%) say AI coding tools will help increase collaboration within their teams and organizations.

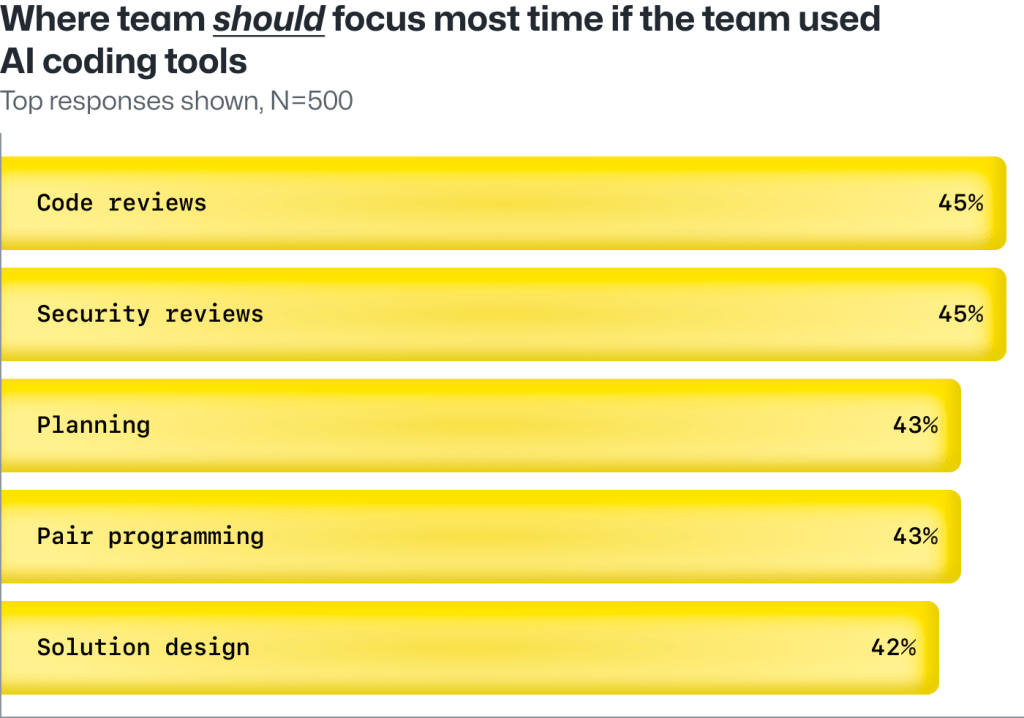
  • In fact, security reviews, planning, and pair programming are the most significant points of collaboration and the tasks that development teams are expected to, and should, work on with the help of AI coding tools. This also indicates that code and security reviews will remain important as developers increase their use of AI coding tools in the workplace.
Developers believe that AI coding tools will make engineering teams more collaborative as the quality of code produced becomes ever more important.
Developers think their teams will need to become more collaborative as they start using AI coding tools.
Sometimes, developers can do the same thing with one line or multiple lines of code. Even still, one-third of developers in our survey say their managers measure their performance based on how much code they produce.
Twitter logo LinkedIn logo

Notably, developers believe AI coding tools will give them more time to focus on solution design. This has direct organizational benefits and means developers believe they’ll spend more time designing new features and products with AI instead of writing boilerplate code.

  • Developers are already using generative AI coding tools to automate parts of their workflow, which frees up time for more collaborative projects like security reviews, planning, and pair programming.
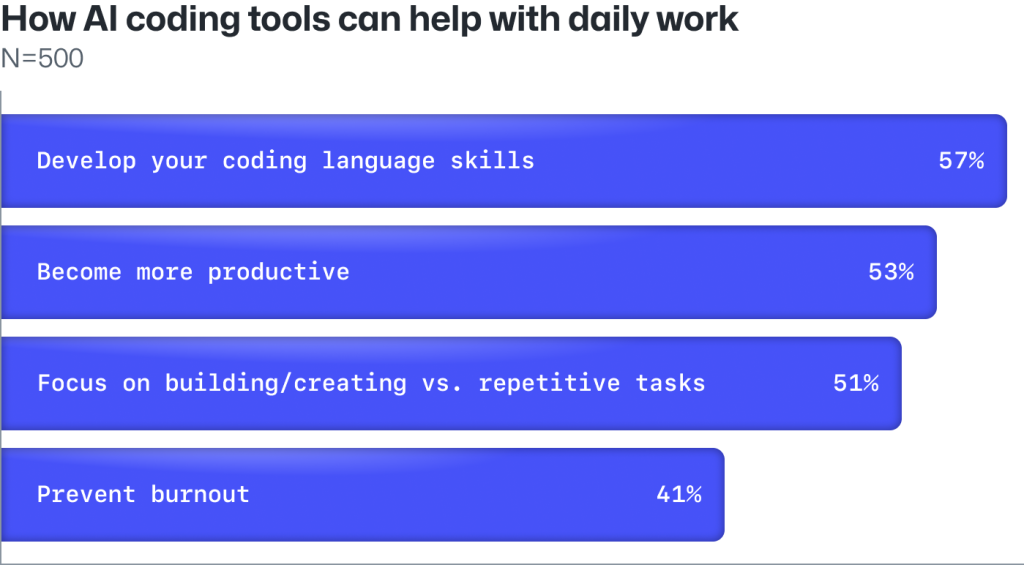
Developers think AI coding tools will help them upskill, become more productive, and focus on higher-value problem solving.
Developers believe that AI coding tools will help them focus on higher-value problem solving.

Developers think AI increases productivity and prevents burnout

Not only can AI coding tools help improve overall productivity, but they can also provide upskilling opportunities to help create a smarter workforce according to the developers we surveyed.

  • 57% of developers believe AI coding tools help them improve their coding language skills—which is the top benefit they see. Beyond the prospect of acting as an upskilling aid, developers also say AI coding tools can also help with reducing cognitive effort, and since mental capacity and time are both finite resources, 41% of developers believe that AI coding tools can help with preventing burnout.
  • In previous research we conducted, 87% of developers reported that the AI coding tool GitHub Copilot helped them preserve mental effort while completing more repetitive tasks. This shows that AI coding tools allow developers to preserve cognitive effort and focus on more challenging and innovative aspects of software development or research and development.
  • AI coding tools help developers upskill while they work. Across our survey, developers consistently rank learning new skills as the number one contributor to a positive workday. But 30% also say learning and development can have a negative impact on their overall workday, which suggests some developers view learning and development as adding more work to their workdays. Notably, developers say the top benefit of AI coding tools is learning new skills—and these tools can help developers learn while they work, instead of making learning and development an additional task.
Developers are already using generative AI coding tools to automate parts of their workflow, which frees up time for more collaborative projects like security reviews, planning, and pair programming.
Twitter logo LinkedIn logo

AI is improving the developer experience across the board

Developers in our survey suggest they can better meet standards around code quality, completion time, and the number of incidents when using AI coding tools—all of which are measures developers believe are key areas for evaluating their performance.

AI coding tools can also help reduce the likelihood of coding errors and improve the accuracy of code—which ultimately leads to more reliable software, increased application performance, and better performance numbers for developers. As AI technology continues to advance, it is likely that these coding tools will have an even greater impact on developer performance and upskilling.

AI coding tools are layering into existing developer workflows and creating greater efficiencies

Developers believe that AI coding tools will increase their productivity—but our survey suggests that developers don’t think these tools are fundamentally altering the software development lifecycle. Instead, developers suggest they’re bringing greater efficiencies to it.

  • The use of automation and AI has been a part of the developer workflow for a considerable amount of time, with developers already utilizing a range of automated and AI-powered tools, such as machine learning-based security checks and CI/CD pipelines.
  • Rather than completely overhauling operations, these tools create greater efficiencies within existing workflows, and that frees up more time for developers to concentrate on developing solutions.

The bottom line
Almost all developers (92%) are using AI coding at work—and they say these tools not only improve day-to-day tasks but enable upskilling opportunities, too. Developers see material benefits to using AI tools including improved performance and coding skills, as well as increased team collaboration.

The path forward

Developer satisfaction, productivity, and organizational impact are all positioned to get a boost from AI coding tools—and that will have a material impact on the overall developer experience.

92% of developers already saying they use AI coding tools at work and in their personal time, which makes it clear AI is here to stay. 70% of the developers we surveyed say they already see significant benefits when using AI coding tools, and 81% of the developers we surveyed expect AI coding tools to make their teams more collaborative—which is a net benefit for companies looking to improve both developer velocity and the developer experience.

Notably, 57% of developers believe that AI could help them upskill—and hold the potential to build learning and development into their daily workflow. With all of this in mind, technical leaders should start exploring AI as a solution to improve satisfaction, productivity, and the overall developer experience.

In addition to exploring AI tools, here are three takeaways engineering and business leaders should consider to improve the developer experience:

  1. Help your developers enter a flow state with tools, processes, and practices that help them be productive, drive impact, and do creative and meaningful work.
  2. Empower collaboration by breaking down organizational silos and providing developers with the opportunity to communicate efficiently.
  3. Make room for upskilling within developer workflows through key investments in AI to help your organization experiment and innovate for the future.

Methodology

This report draws on a survey conducted online by Wakefield Research on behalf of GitHub from March 14, 2023 through March 29, 2023 among 500 non-student, U.S.-based developers who are not managers and work at companies with 1,000-plus employees. For a complete survey methodology, please contact [email protected].

GitHub celebrates developers with disabilities on Global Accessibility Awareness Day

Post Syndicated from Ed Summers original https://github.blog/2023-05-18-github-celebrates-developers-with-disabilities-on-global-accessibility-awareness-day/

At GitHub, our favorite people are developers. We love to make them happy and productive, and today, on Global Accessibility Awareness Day, we want to celebrate their achievements by sharing some great stories about a few developers with disabilities alongside news of recent accessibility improvements at GitHub that help them do the best work of their lives.

Amplifying the voices of disabled developers

People with disabilities frequently encounter biases that prevent their full and equal participation in all areas of life, including education and employment. That’s why GitHub and The ReadME Project are thrilled to provide a platform for disabled developers to showcase their contributions and counteract bias.

Paul Chiou, a developer who’s paralyzed from the neck down, is breaking new ground in the field of accessibility automation, while pursuing his Ph.D. Paul uses a computer with custom hardware and software he designed and built, and this lived experience gives him a unique insight into the needs of other people with disabilities. The barriers he encounters push him to innovate, both in his daily life and in his academic endeavors. Learn more about Paul and his creative solutions in this featured article and video profile.

Becky Tyler found her way to coding via gaming, but she games completely with her eyes, just like everything else she does on a computer, from painting to livestreaming to writing code. Her desire to play Minecraft led her down the path of open source software and collaboration, and now she’s studying computer science at the University of Dundee. Learn more about Becky in this featured article and video profile.

Dr. Annalu Waller leads the Augmentative and Alternative Communication Research Group at the University of Dundee. She’s also Becky’s professor. Becky calls her a “taskmaster,” but the profile of Annalu’s life shows how her lived experience informed her high expectations for her students—especially those with disabilities—and gave her a unique ability to absorb innovations and use them to benefit people with disabilities.

Anton Mirhorodchenko has difficulty speaking and typing with his hands, and speaks English as a second language. Anton has explored ways to use ChatGPT and GitHub Copilot to not only help him communicate and express his ideas, but also develop software from initial architecture all the way to code creation. Through creative collaboration with his AI teammates, Anton has become a force to be reckoned with, and he recently shared his insights in this guide on how to harness the power of generative AI for software development.

Removing barriers that block disabled developers

Success requires skills. That’s why equal access to education is a fundamental human right. The GitHub Global Campus team agrees. They are working to systematically find and remove barriers that might block future developers with disabilities.

npm is the default package manager for JavaScript and the largest software registry in the world. To empower every developer to contribute to and benefit from this amazing resource, the npm team recently completed an accessibility bug bash and removed hundreds of potential barriers. Way to go, npm team!

The GitHub.com team has also been hard at work on accessibility and they recently shipped several improvements:

Great accessibility starts with design, requiring an in-depth understanding of the needs of users with disabilities and their assistive technologies. The GitHub Design organization has been leaning into accessibility for years, and this blog post explores how it has built a culture of accessibility and shifted accessibility left in the GitHub development process.

When I think about the future of technology, I think about GitHub Copilot—an AI pair programmer that boosts developers’ productivity and breaks down barriers to software development. The GitHub Copilot team recently shipped accessibility improvements for keyboard-only and screen reader users.

GitHub Next, the team behind GitHub Copilot, also recently introduced GitHub Copilot Voice, an experiment currently in technical preview. GitHub Copilot Voice empowers developers to code completely hands-free using only their voice. That’s a huge win for developers who have difficulty typing with their hands. Sign up for the technical preview if you can benefit from this innovation.

Giving back to our community

As we work to empower all developers to build on GitHub, we regularly contribute back to the broader accessibility community that has been so generous to us. For example, all accessibility improvements in Primer are available for direct use by the community.

Our accessibility team includes multiple Hubbers with disabilities—including myself. GitHub continually improves the accessibility and inclusivity of the processes we use to communicate and collaborate. One recent example is the process we use for retrospectives. At the end of our most recent retrospective, I observed that, as a person with blindness, it was the most accessible and inclusive retrospective I have ever attended. That observation prompted the team to share the process we use for inclusive retrospectives so other teams can benefit from our learnings.

More broadly, Hubbers regularly give back to the causes we care about. During a recent social giving event, I invited Hubbers to support the Seeing Eye because that organization has made such a profound impact in my life as a person with blindness. Our goal was to raise $5,000 so we could name and support a Seeing Eye puppy that will eventually provide independence and self-confidence to a person with blindness. I was overwhelmed by the generosity of my coworkers when they donated more than $15,000! So, we now get to name three puppies and I’m delighted to introduce you to the first one. Meet Octo!

A German Shepard named Octo sits in green grass wearing a green scarf that says “The Seeing Eye Puppy Raising Program.” She is sitting tall in a backyard with a black fence and a red shed behind her.
Photo courtesy of The Seeing Eye

Looking ahead

GitHub CEO, Thomas Dohmke, frequently says, “GitHub thrives on developer happiness.” I would add that the GitHub accessibility program thrives on the happiness of developers with disabilities. Our success is measured by their contributions. Our job is to remove barriers from their path and celebrate their accomplishments. We’re delighted with our progress thus far, but we are just getting warmed up. Stay tuned for more great things to come! In the meantime, learn more about the GitHub accessibility program at accessibility.github.com.

Addressing GitHub’s recent availability issues

Post Syndicated from Mike Hanley original https://github.blog/2023-05-16-addressing-githubs-recent-availability-issues/

Last week, GitHub experienced several availability incidents, both long running and shorter duration. We have since mitigated these incidents and all systems are now operating normally. The root causes for these incidents were unrelated but in aggregate, they negatively impacted the services that organizations and developers trust GitHub to deliver. This is not acceptable nor the standard we hold ourselves to. We took immediate and direct action to remedy the situation, and we want to be very transparent about what caused these incidents and what we’re doing to mitigate in the future. Read on for more details.

May 9 Git database incident

Date: May 9, 2023
Incident: Git Databases degraded due to configuration change
Impact: 8 of 10 main services degraded

Details:

On May 9, we had an incident that caused 8 of the 10 services on the status portal to be impacted by a major (status red) outage. The majority of downtime lasted just over an hour. During that hour-long period, many services could not read newly-written Git data, causing widespread failures. Following this outage, there was an extended timeline for post-incident recovery of some pull request and push data.

This incident was triggered by a configuration change to the internal service serving Git data. The change was intended to prevent connection saturation, and had been previously introduced successfully elsewhere in the Git backend.

Shortly after the rollout began, the cluster experienced a failover. We reverted the config change and attempted a rollback within a few minutes, but the rollback failed due to an internal infrastructure error.

Once we completed a gradual failover, write operations were restored to the database and broad impact ended. Additional time was needed to get Git data, website-visible contents, and pull requests consistent for pushes received during the outage to achieve a full resolution.

Plot of error rates over time: At around 11:30, rates rise from zero to about 30,000. The rate continues to fluctuate between 25,000 and 35,000 until around 12:30, at which point it falls back to zero.
Git Push Error Rate

May 10 GitHub App auth token incident

Date: May 10, 2023
Incident: GitHub App authentication token issuance degradation due to load
Impact: 6 of 10 main services degraded

Details:

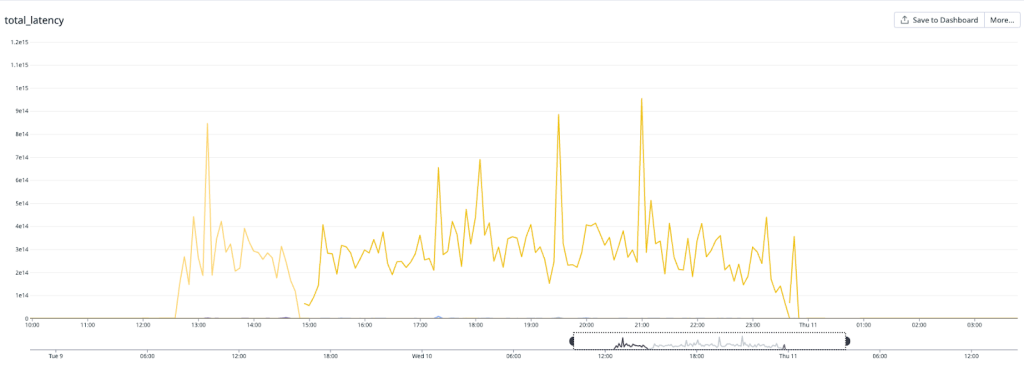
On May 10, the database cluster serving GitHub App auth tokens saw a 7x increase in write latency for GitHub App permissions (status yellow). The failure rate of these auth token requests was 8-15% for the majority of this incident, but did peak at 76% percent for a short time.

Line plot of latency over time, showing a jump from zero to fluctuate around '3e14' from 12:30 on Wednesday, May 10 until midnight on Thursday, May 11. Peak latency spiked close to '1e15' 5 times in that period.
Total Latency
Line plot of latency over time, showing a jump from zero to '25T' at 12:00 on Wednesday, May 10, followed by a another jump further up to '60T' at 17:00, then a drop back down to zero at midnight on Thursday, May 11. The line shows a peak latency of 75T at 21:00 on May 10.
Fetch Latency

We determined that an API for managing GitHub App permissions had an inefficient implementation. When invoked under specific circumstances, it results in very large writes and a timeout failure. This API was invoked by a new caller that retried on timeouts, triggering the incident. While working to identify root cause, improve the data access pattern, and address the source of the new call pattern, we also took steps to reduce load from both internal and external paths, reducing impact to critical paths like GitHub Actions workflows. After recovery, we re-enabled all suspended sources before statusing green.

While we update the backing data model to avoid this pattern entirely, we are updating the API to check for the shift in installation state and will fail the request if it would trigger these large writes as a temporary measure.

Beyond the problem with the query performance, much of our observability is optimized for identifying high-volume patterns, not low-volume high-cost ones, which made it difficult to identify the specific circumstances that were causing degraded cluster health. Moving forward, we are prioritizing work to apply the experiences of our investigations during this incident to ensure we have quick and clear answers for similar cases in the future.

May 11 git database incident

Date: May 11, 2023
Incident: Git database degraded due to loss of read replicas
Impact: 8 of 10 main services degraded

Details:

On May 11, a database cluster serving git data crashed, triggering an automated failover. The failover of the primary was successful, but in this instance read replicas were not attached. The primary cannot handle full read/write load, so an average of 15% of requests for Git data were failed or slow, with peak impact of 26% at the start of the incident. We mitigated this by reattaching the read replicas and the core scenarios recovered. Similar to the May 9 incident, additional work was required to recover pull request push updates, but we were eventually able to achieve full resolution.

Beyond the immediate mitigation work, the top workstreams underway are focused on determining and resolving what caused the cluster to crash and why the failure didn’t leave the cluster in a good state. We want to clarify that the team was already working to understand and address a previous cluster crash as part of a repair item from a different recent incident. This failover replica failure is new.

Line plot of successful operations over time, showing a typical value around 2.5 million. The plot displays a drop to around 1.5 million operations at 13:30, followed by a steady increase back to 2.5 million, normalizing at 14:00.
Git Operation success rate
Line plot of error rate over time, showing a roughly inverted trend to the success rate plot. The error rate spiked from zero to 200,000 at 13:30, then continued to rise past 400,000 until around 13:40 at which point it began to steadily decrease back down to zero, normalizing at 13:50.
Git Operation error rate

Why did these incidents impact other GitHub services?

We expect our services to be as resilient as possible to failure. Failure in a distributed system is inevitable, but it shouldn’t result in significant outages across multiple services. We saw widespread degradation in all three of these incidents. In the Git database incidents, Git reads and writes are at the core of many GitHub scenarios, so increased latency and failures resulted in GitHub Actions workflows unable to pull data or pull requests not updating.

In the GitHub Apps incident, the impact on the token issuance also impacted GitHub features that rely on tokens for operation. This is the source of each GITHUB_TOKEN in GitHub Actions, as well as the tokens used to give GitHub Codespaces access to your repositories. They’re also how access to private GitHub Pages are secured. When token issuance fails, GitHub Actions and GitHub Codespaces are unable to access the data they need to run, and fail to launch as a result.

What actions are we taking?

  1. We are carefully reviewing our internal processes and making adjustments to ensure changes are always deployed safely moving forward. Not all of these incidents were caused by production changes, but we recognize this as an area of improvement.
  2. In addition to the standard post-incident analysis and review, we are analyzing the breadth of impact these incidents had across services to identify where we can reduce the impact of future similar failures.
  3. We are working to improve observability of high-cost, low-volume query patterns and general ability to diagnose and mitigate this class of issue quickly.
  4. We are addressing the Git database crash that has caused more than one incident at this point. This work was already in progress and we will continue to prioritize it.
  5. We are addressing the database failover issues to ensure that failovers always recover fully without intervention.

As part of our commitment to transparency, we publish summaries of all incidents that result in degraded performance of GitHub services in our monthly availability report. Given the scope and duration of these recent incidents we felt it was important to address them with the community now. The May report will include these incidents and any further detail we have on them, along with a general update on progress towards increasing the availability of GitHub. We are deeply committed to improving site reliability moving forward and will continue to hold ourselves accountable for delivering on that commitment.

What’s with all the ducks?

Post Syndicated from Michelle Mannering original https://github.blog/2022-12-23-whats-with-all-the-ducks/

Black eyes.
Orange beak.
Large yellow body.
Rubbery texture…
…often seen floating in baths.

What are we talking about? Rubber ducks, of course. Now the question you might be asking, “Why is everyone obsessed with rubber ducks?” You may have seen our new “What is GitHub?” video making its way around the internet. Outside of the famous comedian, whom you may recognize, you saw a new character floating around (literally). And if you were at GitHub Universe this year or tuned into the livestream, you probably saw lots of physical rubber ducks dispersed throughout.

So, what in the world do rubber ducks have to do with programming? And why were they everywhere? A lot of you asked, so I’m here to help explain.

Rubber ducks + programming 🦆

Our story starts back in 1999, when a book was released, The Pragmatic Programmer by Andrew Hunt. The story describes a computer programmer who sat a rubber duck down one fine day, and explained his code to the duck—line by line!

The process of speaking the code out loud helped the developer understand the code and gain greater insight into his work. After all, rubber ducks don’t talk back!

The technique stuck. It’s now called rubber duck debugging or rubberducking. Of course, it doesn’t need to be only rubber ducks, but the term stuck and is part of developer lingo. So, in our effort to explain all the things GitHub can do for developers and businesses, we used this same technique, with our own special rubber duck. Our duck takes a journey through all the elements of GitHub that make it the most complete developer platform to build, scale, and deliver secure software.

Your turn 🔮

If rubber duck debugging is new to you, try it out! It doesn’t just work with code, either. If you’re ever stuck, try talking through your problem or challenge out loud, whether it’s to that plant on your desk, a roommate, your family, or even your dog. In the meantime, your code on GitHub is waiting to be explained to your new yellow friend.

Accelerating GitHub theme creation with color tooling

Post Syndicated from Cole Bemis original https://github.blog/2022-06-14-accelerating-github-theme-creation-with-color-tooling/

Dark mode is no longer a nice-to-have feature. It’s an expectation. Yet, for many teams, implementing dark mode is still a daunting task.

Creating a palette for dark interfaces is not as simple as inverting colors and complexity increases if your team is planning multiple themes. Many people find themselves using a combination of disjointed color tools, which can be a painful experience.

GitHub dark mode (unveiled at GitHub Universe in December 2020) was the result of trial and error, copy and paste, as well as back and forth in a Figma file (with more than 370,000 layers!).

A screenshot of the Figma file we made while designing GitHub dark mode

A few months after shipping dark mode, we began working on a dark high contrast theme to provide an option that maximizes legibility. While we were designing this new theme, we set out to improve our workflow by building an experimental tool to solve some of the challenges we encountered while designing the original dark color palette.

We’re calling our experimental color tool Primer Prism.

A sneak peek of Primer Prism

Part of GitHub’s Primer ecosystem, Primer Prism is a tool for creating and maintaining cohesive, consistent, and accessible color palettes. It allows us to:

  • Create or import color scales.
  • Adjust colors in a perceptually uniform color space (HSLuv).
  • Check contrast of color pairs.
  • Edit lightness curves across multiple color scales at once.
  • Export color palettes to production-ready code (JSON).

Our workflow

Our improved workflow for creating color palettes with Primer Prism is an iterative cycle comprised of three steps:

  1.  Defining tones
  2. Choosing colors
  3. Testing colors

Defining tones

We start by defining the color palette’s tonal character and contrast needs:

  • How light or dark should the background be?
  • What should the contrast ratio between the foreground and background be?

Although each palette will have a unique tonal character, we are mindful that all palettes meet contrast accessibility guidelines.

In Primer Prism, we start a new color palette by creating a new color scale and adjusting the lightness curve. In this phase, we’re only concerned with lightness and contrast. We’ll revisit hue and saturation later.

As we change the lightness of each color, Primer Prism checks the contrast of potential color pairings in the scale using the WCAG 2 standard.

Dragging lightness sliders up and down to adjust the lightness curve of a scale

Primer Prism also allows us to share curves across multiple color scales. So, when we have more scales, we can quickly change the tonal character of the entire color palette by adjusting a single lightness curve.

Adjusting the lightness curve of all color scales at once

Primer Prism uses the HSLuv color space to ensure that the lightness values are perceptually uniform across the entire palette. In the HSLuv color space, two colors with the same lightness value will look equally bright.

Choosing colors

Next, we define the overall color character of our palette:

  • What hues do we need (for example: red, blue, green, etc.)?
  • How vibrant do we want the colors to be?

We create a color scale for every hue using the same lightness curve we made earlier. Then, we compare and adjust the base color (the fifth step in the scale) across all the color scales until the palette feels cohesive and consistent.

A side-by-side comparison of every color scale

After deciding on the base color for each scale, we fine-tune the tints (lighter colors) and shades (darker colors). Blue, for example, shifts towards green hues in the tints and purple hues in the shades.

The hue, saturation, and lightness curves of the blue color scale

Fine-tuning color scales is more of an art than a science and often requires many micro-adjustments before the colors “feel right.” Check out Color in UI Design: A (Practical) Framework by Eric D. Kennedy to learn more about the fundamentals of designing color scales.

Testing colors

To test our colors in real-world scenarios, we export the palette from Primer Prism as a JSON object and add it to Primer Primitives, our repository of design tokens. We use pre-releases of the Primer Primitives package to test new color palettes on GitHub.com.

The dark color palette applied to GitHub.com

What’s next

We used Primer Prism to design several new color palettes, accelerating the creation of dark high contrast, light high contrast, and colorblind themes for GitHub. Next, we plan to improve our tooling to support the following key workflows.

Visual testing workflow

We plan to integrate visual testing directly into Primer Prism. Currently, visual testing of color palettes happens outside of Primer Prism, typically in Figma or production applications. However, we want a more convenient way to visualize how the colors will look when mapped to functional variables and used in actual user interfaces.

GitHub workflow

We plan to integrate GitHub into Primer Prism. Right now, it’s a hassle to edit existing color palettes because Primer Prism is not connected to the GitHub repository where we store color variables (Primer Primitives). A GitHub integration will allow us to directly pull from and push to the Primer Primitives repository.

Figma workflow

Our designers use Figma to explore and test new design ideas. We plan to create a Figma plugin to seamlessly integrate Primer Prism into their workflow.

Try it out

Primer Prism is open source and available for anyone to use at primer.style/prism.

We’d love to hear what you think. If you have feedback, please create an issue or start a discussion in the GitHub repository.

Warning: Primer Prism is experimental. Expect bugs and breaking changes as we continue to iterate.

Thanks

Huge shout-out to @Juliusschaeper, @auareyou, @edokoa, and @broccolini for their incredible work on the GitHub dark mode color palette.

Primer Prism was inspired by many existing color tools:
ColorBox by Lyft
Components AI
Huetone by Alexey Ardov
Leonardo by Adobe
Palettte by Gabriel Adorf
Palx by Brent Jackson
Scale by Hayk An

Further reading

Sunsetting Atom

Post Syndicated from GitHub Staff original https://github.blog/2022-06-08-sunsetting-atom/

When we formally introduced Atom in 2014, we set out to give developers a text editor that was deeply customizable but also easy to use—one that made it possible for more people to build software. While that goal of growing the software creator community remains, we’ve decided to retire Atom in order to further our commitment to bringing fast and reliable software development to the cloud via Microsoft Visual Studio Code and GitHub Codespaces.

Today, we’re announcing that we are sunsetting Atom and will archive all projects under the organization on December 15, 2022.

Why are we doing this now?

Atom has not had significant feature development for the past several years, though we’ve conducted maintenance and security updates during this period to ensure we’re being good stewards of the project and product. As new cloud-based tools have emerged and evolved over the years, Atom community involvement has declined significantly. As a result, we’ve decided to sunset Atom so we can focus on enhancing the developer experience in the cloud with GitHub Codespaces.

This is a tough goodbye. It’s worth reflecting that Atom has served as the foundation for the Electron framework, which paved the way for the creation of thousands of apps, including Microsoft Visual Studio Code, Slack, and our very own GitHub Desktop. However, reliability, security, and performance are core to GitHub, and in order to best serve the developer community, we are archiving Atom to prioritize technologies that enable the future of software development.

What happens next?

We recognize that Atom is still used by the community and want to acknowledge that migrating to an alternative solution takes time and energy. We are committed to helping users and contributors plan for their migration.

  • Today, we’re announcing the sunset date six months out.
  • Over the next six months, we’ll continue to inform Atom users of the sunset in the product and on atom.io.
  • On December 15, 2022, we will archive the atom/atom repository and all other repositories remaining in the Atom organization.

Thank you

GitHub and our community have benefited tremendously from those who have filed issues, created extensions, fixed bugs, and built new features on Atom. Atom played an integral part in many developers’ journeys, and we look forward to building and shaping the next chapter of software development together.

Git security vulnerability announced

Post Syndicated from Taylor Blau original https://github.blog/2022-04-12-git-security-vulnerability-announced/

Today, the Git project released new versions which address a pair of security vulnerabilities.

GitHub is unaffected by these vulnerabilities1. However, you should be aware of them and upgrade your local installation of Git, especially if you are using Git for Windows, or you use Git on a multi-user machine.

CVE-2022-24765

This vulnerability affects users working on multi-user machines where a malicious actor could create a .git directory in a shared location above a victim’s current working directory. On Windows, for example, an attacker could create C:\.git\config, which would cause all git invocations that occur outside of a repository to read its configured values.

Since some configuration variables (such as core.fsmonitor) cause Git to execute arbitrary commands, this can lead to arbitrary command
execution when working on a shared machine.

The most effective way to protect against this vulnerability is to upgrade to Git v2.35.2. This version changes Git’s behavior when looking for a top-level .git directory to stop when its directory traversal changes ownership from the current user. (If you wish to make an exception to this behavior, you can use the new multi-valued safe.directory configuration).

If you can’t upgrade immediately, the most effective ways to reduce your risk are the following:

  • Define the GIT_CEILING_DIRECTORIES environment variable to contain the parent directory of your user profile (i.e., /Users on macOS,
    /home on Linux, and C:\Users on Windows).
  • Avoid running Git on multi-user machines when your current working directory is not within a trusted repository.

Note that many tools (such as the Git for Windows installation of Git Bash, posh-git, and Visual Studio) run Git commands under the hood. If you are on a multi-user machine, avoid using these tools until you have upgraded to the latest release.

Credit for finding this vulnerability goes to 俞晨东.

[source]

CVE-2022-24767

This vulnerability affects the Git for Windows uninstaller, which runs in the user’s temporary directory. Because the SYSTEM user account inherits the
default permissions of C:\Windows\Temp (which is world-writable), any authenticated user can place malicious .dll files which are loaded when
running the Git for Windows uninstaller when run via the SYSTEM account.

The most effective way to protect against this vulnerability is to upgrade to Git for Windows v2.35.2. If you can’t upgrade
immediately, reduce your risk with the following:

  • Avoid running the uninstaller until after upgrading
  • Override the SYSTEM user’s TMP environment variable to a directory which can only be written to by the SYSTEM user
  • Remove unknown .dll files from C:\Windows\Temp before running the
    uninstaller
  • Run the uninstaller under an administrator account rather than as the
    SYSTEM user

Credit for finding this vulnerability goes to the Lockheed Martin Red Team.

[source]

Download Git 2.35.2


  1. GitHub does not run git outside of known repositories, so is not susceptible to the attack described by CVE-2022-24765. Likewise, GitHub does not use Git for Windows, and so is unaffected by CVE-2022-24767 entirely. 

4 ways we use GitHub Actions to build GitHub

Post Syndicated from Brian Douglas original https://github.blog/2022-04-05-4-ways-we-use-github-actions-to-build-github/

From planning and tracking our work on GitHub Issues to using GitHub Discussions to gather your feedback and running our developer environments in Codespaces, we pride ourselves on using GitHub to build GitHub, and we love sharing how we use our own products in the hopes it’ll inspire new ways for you and your teams to use them.

Even before we officially released GitHub Actions in 2018, we were already using it to automate all kinds of things behind the scenes at GitHub. If you don’t already know, GitHub Actions brings platform-native automation and CI/CD that responds to any webhook event on GitHub (you can learn more in this article). We’ve seen some incredible GitHub Actions from open source communities and enterprise companies alike with more than 12,000 community-built actions in the GitHub Marketplace.

Now, we want to share a few ways we use GitHub Actions to build GitHub. Let’s dive in.


1. Tracking security reports and vulnerabilities

In 2019, we announced the creation of the GitHub Security Lab as a way to bring security researchers, open source maintainers, and companies together to secure open source software. Since then, we’ve been busy doing everything from giving advice on how to write secure code, to explaining vulnerabilities in important open source projects, to keeping our GitHub Advisory Database up-to-date.

In short, it’s fair to say our Security Lab team is busy. And it shouldn’t surprise you to know that they’re using GitHub Actions to automate their workflows, tests, and project management processes.

One particularly interesting way our Security Lab team uses GitHub Actions is to automate a number of processes related to reporting vulnerabilities to open source projects. They also use actions to automate processes related to the CodeQL bug bounty program, but I’ll focus on the vulnerability reporting here.

Any GitHub employee who discovers a vulnerability in an open source project can report it via the Security Lab. We help them to create a vulnerability report, take care of reporting it to the project maintainer, and track the fix and the disclosure.

To start this process, we created an issue form template that GitHub employees can use to report a vulnerability:
A screenshot of an Issue template GitHub employees use to report vulnerabilities

A screenshot of an Issue template GitHub employees use to report vulnerabilities.

The issue form triggers an action that automatically generates a report template (with details such as the reporter’s name that is filled out automatically). We ask the vulnerability reporter to enter the URL of a private repository, which is where the report template will be created (as an issue), so that the details of the vulnerability can be discussed confidentially.

Every vulnerability report is assigned a unique ID, such as GHSL-2021-1001. The action generates these unique IDs automatically and adds them to the report template. We generate the unique IDs by creating empty issues in a special-purpose repository and use the issue numbers as the IDs. This is a great improvement over our previous system, which involved using a shared spreadsheet to generate GHSL IDs and introduced a lot more potential for error due to having to manually fill out the template.

For most people, reporting a vulnerability is not something that they do every day. The issue form and automatically-generated report template help to guide the reporter, so that they give the Security Lab all the information they need when they report the issue to the maintainer.

2. Automating large-scale regression testing of CodeQL implementation changes

CodeQL plays a big part in keeping the software ecosystem secure—both as a tool we use internally to bolster our own platform security and as a freely available tool for open source communities, companies, and developers to use.

If you’re not familiar, CodeQL is a semantic code analysis engine that enables developers to query code as if it were data. This makes it easier to find vulnerabilities across a codebase and create reusable queries (or leverage queries that others have developed).

The CodeQL Team at GitHub leverages a lot of automation in their day-to-day workflows. Yet one of the most interesting applications they use GitHub Actions for is large-scale regression testing of CodeQL implementation changes. In addition to recurring nightly experiments, most CodeQL pull requests also use custom experiments for investigating the CodeQL performance and output changes a merge would result in.

The typical experiment runs the standard github/codeql-action queries on a curated set of open source projects, recording performance and output metrics to perform comparisons that answers questions such as “how much faster does my optimization make the queries?” and “does my query improvement produce new security alerts?”

Let me repeat that for emphasis: They’ve built an entire regression testing system on GitHub Actions. To do this, they use two kinds of GitHub Actions workflows:

  • One-off, dynamically-generated workflows that run the github/codeql-action on individual open source projects. These workflows are similar to what codeql-action users would write manually, but also contain additional code that collects data for the experiments.
  • Periodically run workflows that generate and trigger the above workflows for any ongoing experiments and later compose the resulting data into digestible reports.

The elasticity of GitHub Actions is crucial for making the entire system work, both in terms of compute and storage. Experiments on hundreds of projects trivially parallelize to hundreds of on-demand action runners, causing even large experiments to finish quickly, while the storage of large experiment outputs is handled transparently through workflow artifacts.

Several other GitHub features are used to make the experiments accessible to the engineers through a single platform with the two most visible being:

  • Issues: The status of every experiment is tracked through an ordinary GitHub issue that is updated automatically by a workflow. Upon completion of the experiment, the relevant engineers are notified. This enables easy discussions of experiment outcomes, and also enables cross-referencing experiments and any associated pull requests.
  • Rich content: Detailed reports for the changes observed in an experiment are presented as ordinary markdown files in a GitHub repository that can easily be viewed through a browser.

And while this isn’t exactly a typical use case for GitHub Actions, it illustrates how flexible it is—and how much you can do with it. After all, most organizations have dedicated infrastructure to perform regression testing at the scale we do. At GitHub, we’re able to use our own products to solve the problem in a non-standard way.

3. Bringing CI/CD to the GitHub Mobile Team

Every week, the GitHub Mobile Team updates our mobile app with new features, bug fixes, and improvements. Additionally, GitHub Actions plays an integral role in their release process, helping to deliver release candidates to our more than 8,000 beta testers.

Our Mobile team is comparatively small compared to other teams at GitHub, so automating any number of processes is incredibly impactful. It lets them focus more on building code and new features, and removes repetitive tasks that otherwise would take hours to manually process each week.

That means they’ve thought a good deal about how to best leverage GitHub Actions to save the most amount of time possible when building and releasing GitHub Mobile updates.

This chart below shows all the steps included in building and delivering a mobile app update. The gray steps are automated, while the blue steps are manually orchestrated. The automated steps include running a shell command, creating a branch, opening a pull request, creating an issue and GitHub release, and assigning a developer.

A workflow diagram of GitHub’s release process with automated steps represented in gray and manual steps represented in green

A workflow diagram of GitHub’s release process with automated steps represented in gray and manual steps represented in green.

Another thing our team focused on was to make it possible for anyone to be a release captain. By making a computer do things that a human might have to learn or be trained on, makes it easier for any of our engineers to know what to do to get a new version of GitHub Mobile out to users.

This is a great example of CI/CD in action at GitHub. It also shows firsthand what GitHub Actions does best: automating workflows to let developers focus more on coding and less on repetitive tasks.

You can learn more about how the GitHub Mobile team uses GitHub Actions here >

4. Handling the day-to-day tasks

Of course, we also use GitHub Actions to automate a bunch of non-technical tasks, like spinning up status updates and sending automated notifications on chat applications.

After talking with some of our internal teams, I wanted to showcase some of my favorite internal examples I’ve seen of Hubbers using GitHub Actions to streamline their workflows (and have a bit of fun, too).

📰 Share company updates to GitHub’s intranet

Our Intranet team uses GitHub Actions to add updates to our intranet whenever changes are made to a specified directory. In practice, this means that anyone at GitHub with the right permissions can share messages with the company by adding a file to a repository. This then triggers a GitHub Actions workflow that turns that file into a public-facing message that’s shared to our intranet and automatically to a Slack channel.

📊 Create weekly reports on program status updates

At GitHub, we have technical program management teams that are responsible for making sure the trains arrive on time and things get built and shipped. Part of their job includes building out weekly status reports for visibility into development projects, including progress, anticipated timelines, and potential blockers. To speed up this process, our technical program teams use GitHub Actions to automate the compilation of all of their individual reports into an all-up program status dashboard.

📸 Turn weekly team photos into GIFs and upload to README

Here’s a fun one for you: Our Ecosystem Applications team built a custom GitHub Actions workflow that combines team photos they take at their weekly meetings and turns it into a GIF. And if that wasn’t enough, that same workflow also automatically uploads that GIF to their team README. In the words of our Senior Engineer, Jake Wilkins, “I’m not sure when or why we started taking team photos, but when we got access to GitHub Actions it was an obvious thing to do.”

Start automating your workflows with GitHub Actions

Whether you need to build a CI/CD pipeline or want to step up your Twitter game, GitHub Actions offers powerful automation across GitHub (and outside of it, too). With more than 12,000 pre-built community actions in the GitHub Marketplace, it’s easy to start bringing simple and complex automations to your workflows so you can focus on what matters most: building great code.

Additional resources