Solving and staying ahead of problems when scaling up a system of GitHub’s size is a delicate process. The stack is complex, and even small changes can have a big ripple effect. Here’s a look at some of the tools in GitHub’s toolbox, and how we’ve used them to solve problems. We’ll also share some of our wins and lessons we learned along the way.
Methods and tools
There are several tools that we use to keep pace with our growing system. While we can’t list them all, here are some that have been instrumental for our growth.
As we serve requests, there is a constant stream of related numbers that we care about. For example, we might want to know how often events are happening or how traffic levels compare to expected use. We can record metrics for each event in Datadog to see patterns over time and break them down across different dimensions, identifying areas that need focus.
Events also contain context that can help identify details for issues we’re troubleshooting. We send all this context to Splunk for further analysis.
Much of our application data is stored in MySQL, and query performance can degrade over time due to factors like database size and query frequency. We have written custom monitors that detect and report slow and timed-out queries for further investigation and remediation.
When we introduce changes, we often need to know how those changes affect performance. We use Scientist to test proposed changes. With this tool, we measure and report results before making the changes permanent.
When we’re ready to release a change, we roll it out incrementally to ensure it works as expected for all use cases. We also need to be able to roll back in the event of unexpected behavior. We use Flipper to limit the rollout to early access users, then to an increasing percentage of users as we build the confidence.
Achieving faster database queries
We recently observed a SQL query causing a high number of timeouts. Our investigation in Splunk tracked it down to GitHub’s Command Palette feature, which was loading a list of repositories. The code to generate that list looked something like this:
If an org has many active repositories, the second line could generate a SQL query with a large IN (...) clause with an increased risk of timing out. While we’d seen this type of problem before, there was something unique about this particular use case. We might be able to improve performance by querying the user first since a given user contributes to a relatively small number of repositories.
We created a Scientist experiment with a new candidate code block to evaluate performance. The Datadog dashboard for the experiment confirmed two things: the candidate code block returned the same results and improved performance by 80-90%.
We also did a deeper dive into the queries this feature was generating and found a couple of possible additional improvements.
The first involved eliminating a SQL query and sorting results in the application rather than asking the SQL server to sort. We followed the same process with a new experiment and found that the candidate code block performed 40-80% worse than the control. We removed the candidate code block and ended the experiment.
The second was a query filtering results based on the viewer’s level of access and did so by iterating through the list of results. The access check we needed can be batched. So, we started another experiment to do the filtering with a single batched query and confirmed that the candidate code block improved performance by another 20-80%.
While we were wrapping up these experiments, we checked for similar patterns in related code and found a similar filter we could batch. We confirmed a 30-40% performance improvement with a final experiment, and left the feature in a better place that made our developers, database administrators, and users happier.
Removing unused code
While our tooling does surface problem areas to focus on, it’s preferable to get ahead of performance issues and fix problematic areas before they cause a degraded experience. We recently analyzed the busiest request endpoints for one of our teams and found room to improve one of them before it escalated to an urgent problem.
Data for each request to the GitHub Rails application is logged in Splunk and tagged with the associated controller and action. We started by querying Splunk for the top 10 controller/action pairs in the endpoints owned by the team. We used that list to create a Datadog dashboard with a set of graphs for each controller/action that showed the total request volume, average and P99 request latency, and max request latency. We found that the busiest endpoint on the dashboard was an action responsible for a simple redirect, and that performance regularly degraded to the timeout threshold.
We needed to know what was slowing these requests down, so we dug into Datadog’s APM feature to show requests for the problematic controller/endpoint. We sorted those requests by elapsed request time to see the slowest requests first. We identified a pattern where slow requests spent a long time performing an access check that wasn’t required to send the redirect response.
Most requests to the GitHub Rails application generate HTML responses where we need to be careful to ensure that all data in the response is accessible to the viewer. We’re able to simplify the code involved by using shared Rails controller filters to verify that the viewer is allowed to see the resources they’re requesting that run before the server renders a response. These checks aren’t required for the redirect, so we wanted to confirm we could serve those requests using a different set of filters and that this approach would improve performance.
Since Rails controller filters are configured when the application boots rather than when each request is processed, we weren’t able to use a Scientist experiment to test a candidate code block. However, filters can be configured to run conditionally, which enabled us to use a Flipper feature flag to change behavior. We identified the set of filters that weren’t required for the redirect, and configured the controller to skip those filters when the feature flag was enabled. The feature flag controls let us ramp up this behavior while monitoring both performance and request status via Datadog and keeping watch for unexpected problems via Splunk.
After confirming that performance improved for P75/P99 request latency—and more importantly, reduced max latency to be more consistent and much less likely to time out—we graduated the feature and generalized the behavior so other similar controllers can use it.
What did we learn?
There are several lessons we learned throughout this process. Here are some of the main points we keep in mind.
The investment in observability is totally worth it! We identified and solved problems quickly because of the metric and log information we track.
Even when you’re troubleshooting a problem that’s been traditionally difficult to solve, the use case may be subtly different in a way that presents a new solution.
When you’re working on a fix, look around at adjacent code. There may be related issues you can tackle while you’re there.
Performance problems are a moving target. Keeping an eye open for the next one helps you fix it when it’s gotten slow rather than when it starts causing timeouts and breaking things.
Make small changes in ways that you can control with a gradual rollout and measure results.
How do we ensure over 100 million users across the world have uninterrupted access to GitHub’s products and services on a platform that is always available, secure, and accessible? From our beginnings as a platform for open source to now also supporting 90% of the Fortune 100, that is the ongoing challenge we face and hold ourselves accountable for delivering across our engineering organization.
Establishing engineering governance
To meet the needs of our increased number of enterprise customers and our continuing innovation across the GitHub platform, we needed to address tech debt, improve reliability, and enhance observability of our engineering systems. This led to the birth of GitHub’s engineering governance program called the Fundamentals program. Our goal was to work cross-functionally to define, measure, and sustain engineering excellence with a vision to ensure our products and services are built right for all users.
What is the Fundamentals program?
In order for such a large-scale program to be successful, we needed to tackle not only the processes but also influence GitHub’s engineering culture. The Fundamentals program helps the company continue to build trust and lead the industry in engineering excellence, by ensuring that there is clear prioritization of the work needed in order for us to guarantee the success of our platform and the products that you love.
We do this via the lens of three program pillars, which help our organization understand the focus areas that we emphasize today:
Accessibility (A11Y): Truly be the home for all developers
Security: Serve as the most trustworthy platform for developers
Availability: Always be available and on for developers
In order for this to be successful, we’ve relied on both grass-roots support from individual teams and strong and consistent sponsorship from our engineering leadership. In addition, it requires meaningful investment in the tools and processes to make it easy for engineers to measure progress against their goals. No one in this industry loves manual processes and here at GitHub we understand anything that is done more than once must be automated to the best of our ability.
How do we measure progress?
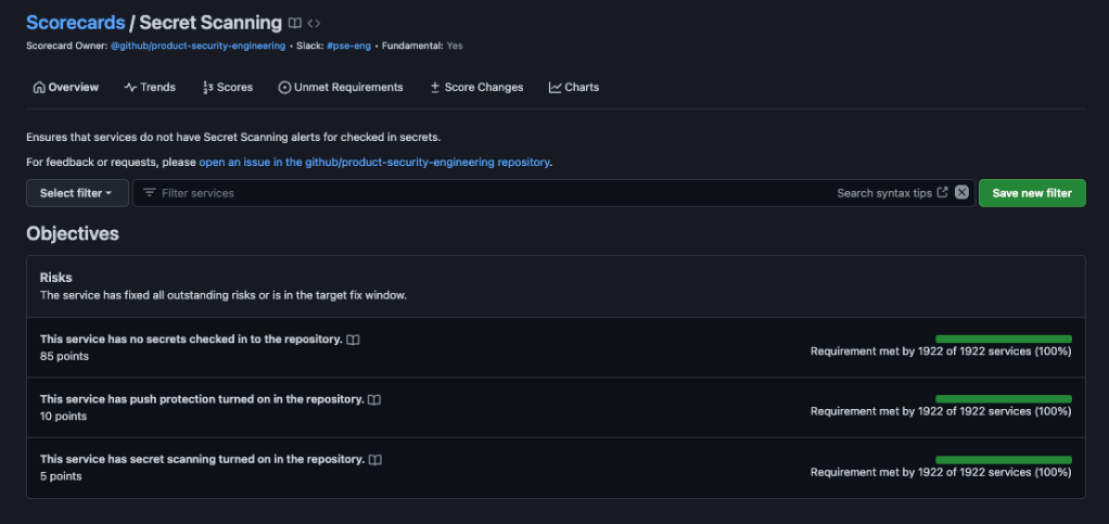
We use Fundamental Scorecards to measure progress against our Availability, Security, and Accessibility goals across the engineering organization. The scorecards are designed to let us know that a particular service or feature in GitHub has reached some expected level of performance against our standards. Scorecards align to the fundamentals pillars. For example, the secret scanning scorecard aligns to the Security pillar, Durable Ownership aligns to Availability, etc. These are iteratively evolved by enhancing or adding requirements to ensure our services are meeting our customer’s changing needs. We expect that some scorecards will eventually become concrete technical controls such that any deviation is treated as an incident and other automated safety and security measures may be taken, such as freezing deployments for a particular service until the issue is resolved.
Each service has a set of attributes that are captured and strictly maintained in a YAML file, such as a service tier (tier 0 to 3 based on criticality to business), quality of service (QoS values include critical, best effort, maintenance and so on based on the service tier), and service type that lives right in the service’s repo. In addition, this file also has the ownership information of the service, such as the sponsor, team name, and contact information. The Fundamental scorecards read the service’s YAML file and start monitoring the applicable services based on their attributes. If the service does not meet the requirements of the applicable Fundamental scorecard, an action item is generated with an SLA for effective resolution. A corresponding issue is automatically generated in the service’s repository to seamlessly tie into the developer’s workflow and meet them where they are to make it easy to find and resolve the unmet fundamental action items.
Through the successful implementation of the Fundamentals program, we have effectively managed several scorecards that align with our Availability, Security, and Accessibility goals, including:
Durable ownership: maintains ownership of software assets and ensures communication channels are defined. Adherence to this fundamental supports GitHub’s Availability and Security.
Code scanning: tracks security vulnerabilities in GitHub software and uses CodeQL to detect vulnerabilities during development. Adherence to this fundamental supports GitHub’s Security.
Secret scanning: tracks secrets in GitHub’s repositories to mitigate risks. Adherence to this fundamental supports GitHub’s Security.
Incident readiness: ensures services are configured to alert owners, determine incident cause, and guide on-call engineers. Adherence to this fundamental supports GitHub’s Availability.
Accessibility: ensures products and services follow our accessibility standards. Adherence to this fundamental enables developers with disabilities to build on GitHub.
Example secret scanning scorecard
A culture of accountability
As much emphasis as we put on Fundamentals, it’s not the only thing we do: we ship products, too!
We call it the Fundamentals program because we also make sure that:
We include Fundamentals in our strategic plans. This means our organization prioritizes this work and allocates resources to accomplish the fundamental goals we each quarter. We track the goals on a weekly basis and address the roadblocks.
We surface and manage risks across all services to the leaders so they can actively address them before they materialize into actual problems.
We provide support to teams as they work to mitigate fundamental action items.
It’s clearly understood that all services, regardless of team, have a consistent set of requirements from Fundamentals.
Planning, managing, and executing fundamentals is a team affair, with a program management umbrella.
Designated Fundamentals champions and delegates help maintain scorecard compliance, and our regular check-ins with engineering leaders help us identify high-risk services and commit to actions that will bring them back into compliance. This includes:
Executive sponsor. The executive sponsor is a senior leader who supports the program by providing resources, guidance, and strategic direction.
Pillar sponsor. The pillar sponsor is an engineering leader who oversees the overarching focus of a given pillar across the organization as in Availability, Security, and Accessibility.
Directly responsible individual (DRI). The DRI is an individual responsible for driving the program by collaborating across the organization to make the right decisions, determine the focus, and set the tempo of the program.
Scorecard champion. The scorecard champion is an individual responsible for the maintenance of the scorecard. They add, update, and deprecate the scorecard requirements to keep the scorecard relevant.
Service sponsors. The sponsor oversees the teams that maintain services and is accountable for the health of the service(s).
Fundamentals delegate. The delegate is responsible for coordinating Fundamentals work with the service owners within their org, supporting the Sponsor to ensure the work is prioritized, and resources committed so that it gets completed.
Results-driven execution
Making the data readily available is a critical part of the puzzle. We created a Fundamentals dashboard that shows all the services with unmet scorecards sorted by service tier and type and filtered by service owners and teams. This makes it easier for our engineering leaders and delegates to monitor and take action towards Fundamental scorecards’ adherence within their orgs.
As a result:
Our services comply with durable ownership requirements. For example, the service must have an executive sponsor, a team, and a communication channel on Slack as part of the requirements.
We resolved active secret scanning alerts in repositories affiliated with the services in the GitHub organization. Some of the repositories were 15 years old and as a part of this effort we ensured that these repos are durably owned.
Business critical services are held to greater incident readiness standards that are constantly evolving to support our customers.
Service tiers are audited and accurately updated so that critical services are held to the highest standards.
Example layout and contents of Fundamentals dashboard
Tier 1 Services Out of Compliance [Count: 2]
Service Name
Service Tier
Unmet Scorecard
Exec Sponsor
Team
service_a
1
incident-readiness
john_doe
github/team_a
service_x
1
code-scanning
jane_doe
github/team_x
Continuous monitoring and iterative enhancement for long-term success
By setting standards for engineering excellence and providing pathways to meet through standards through culture and process, GitHub’s Fundamentals program has delivered business critical improvements within the engineering organization and, as a by-product, to the GitHub platform. This success was possible by setting the right organizational priorities and committing to them. We keep all levels of the organization engaged and involved. Most importantly, we celebrate the wins publicly, however small they may seem. Building the culture of collaboration, support, and true partnership has been key to sustaining the ongoing momentum of an organization-wide engineering governance program, and the scorecards that monitor the availability, security, and accessibility of our platform so you can consistently rely on us to achieve your goals.
Over 15 years ago, GitHub started as a Ruby on Rails application with a single MySQL database. Since then, GitHub has evolved its MySQL architecture to meet the scaling and resiliency needs of the platform—including building for high availability, implementing testing automation, and partitioning the data. Today, MySQL remains a core part of GitHub’s infrastructure and our relational database of choice.
This is the story of how we upgraded our fleet of 1200+ MySQL hosts to 8.0. Upgrading the fleet with no impact to our Service Level Objectives (SLO) was no small feat–planning, testing and the upgrade itself took over a year and collaboration across multiple teams within GitHub.
Motivation for upgrading
Why upgrade to MySQL 8.0? With MySQL 5.7 nearing end of life, we upgraded our fleet to the next major version, MySQL 8.0. We also wanted to be on a version of MySQL that gets the latest security patches, bug fixes, and performance enhancements. There are also new features in 8.0 that we want to test and benefit from, including Instant DDLs, invisible indexes, and compressed bin logs, among others.
GitHub’s MySQL infrastructure
Before we dive into how we did the upgrade, let’s take a 10,000-foot view of our MySQL infrastructure:
Our fleet consists of 1200+ hosts. It’s a combination of Azure Virtual Machines and bare metal hosts in our data center.
We store 300+ TB of data and serve 5.5 million queries per second across 50+ database clusters.
Our data is partitioned. We leverage both horizontal and vertical sharding to scale our MySQL clusters. We have MySQL clusters that store data for specific product-domain areas. We also have horizontally sharded Vitess clusters for large-domain areas that outgrew the single-primary MySQL cluster.
We have a large ecosystem of tools consisting of Percona Toolkit, gh-ost, orchestrator, freno, and in-house automation used to operate the fleet.
All this sums up to a diverse and complex deployment that needs to be upgraded while maintaining our SLOs.
Preparing the journey
As the primary data store for GitHub, we hold ourselves to a high standard for availability. Due to the size of our fleet and the criticality of MySQL infrastructure, we had a few requirements for the upgrade process:
We must be able to upgrade each MySQL database while adhering to our Service Level Objectives (SLOs) and Service Level Agreements (SLAs).
We are unable to account for all failure modes in our testing and validation stages. So, in order to remain within SLO, we needed to be able to roll back to the prior version of MySQL 5.7 without a disruption of service.
We have a very diverse workload across our MySQL fleet. To reduce risk, we needed to upgrade each database cluster atomically and schedule around other major changes. This meant the upgrade process would be a long one. Therefore, we knew from the start we needed to be able to sustain operating a mixed-version environment.
Preparation for the upgrade started in July 2022 and we had several milestones to reach even before upgrading a single production database.
Prepare infrastructure for upgrade
We needed to determine appropriate default values for MySQL 8.0 and perform some baseline performance benchmarking. Since we needed to operate two versions of MySQL, our tooling and automation needed to be able to handle mixed versions and be aware of new, different, or deprecated syntax between 5.7 and 8.0.
Ensure application compatibility
We added MySQL 8.0 to Continuous Integration (CI) for all applications using MySQL. We ran MySQL 5.7 and 8.0 side-by-side in CI to ensure that there wouldn’t be regressions during the prolonged upgrade process. We detected a variety of bugs and incompatibilities in CI, helping us remove any unsupported configurations or features and escape any new reserved keywords.
To help application developers transition towards MySQL 8.0, we also enabled an option to select a MySQL 8.0 prebuilt container in GitHub Codespaces for debugging and provided MySQL 8.0 development clusters for additional pre-prod testing.
Communication and transparency
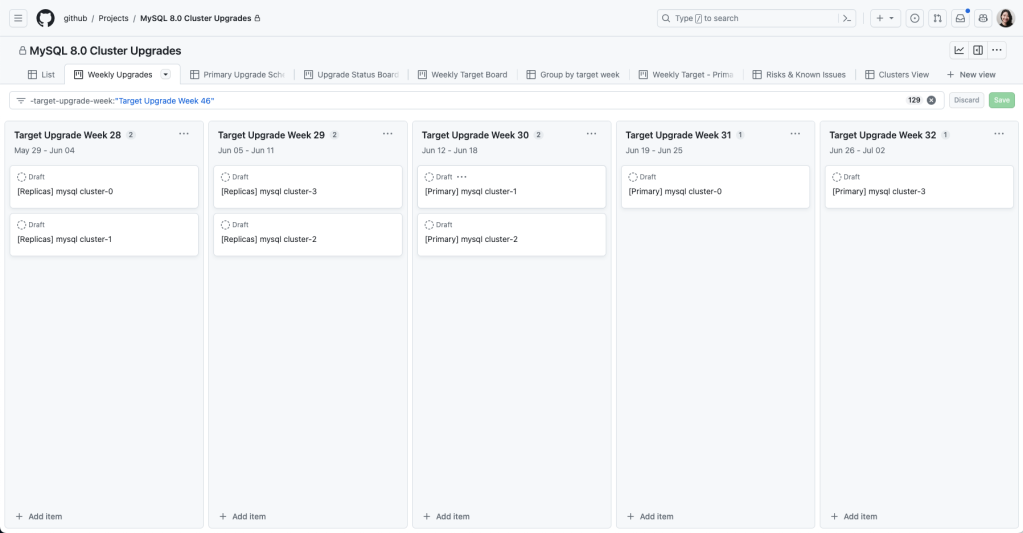
We used GitHub Projects to create a rolling calendar to communicate and track our upgrade schedule internally. We created issue templates that tracked the checklist for both application teams and the database team to coordinate an upgrade.
Project Board for tracking the MySQL 8.0 upgrade schedule
Upgrade plan
To meet our availability standards, we had a gradual upgrade strategy that allowed for checkpoints and rollbacks throughout the process.
Step 1: Rolling replica upgrades
We started with upgrading a single replica and monitoring while it was still offline to ensure basic functionality was stable. Then, we enabled production traffic and continued to monitor for query latency, system metrics, and application metrics. We gradually brought 8.0 replicas online until we upgraded an entire data center and then iterated through other data centers. We left enough 5.7 replicas online in order to rollback, but we disabled production traffic to start serving all read traffic through 8.0 servers.
The replica upgrade strategy involved gradual rollouts in each data center (DC).
Step 2: Update replication topology
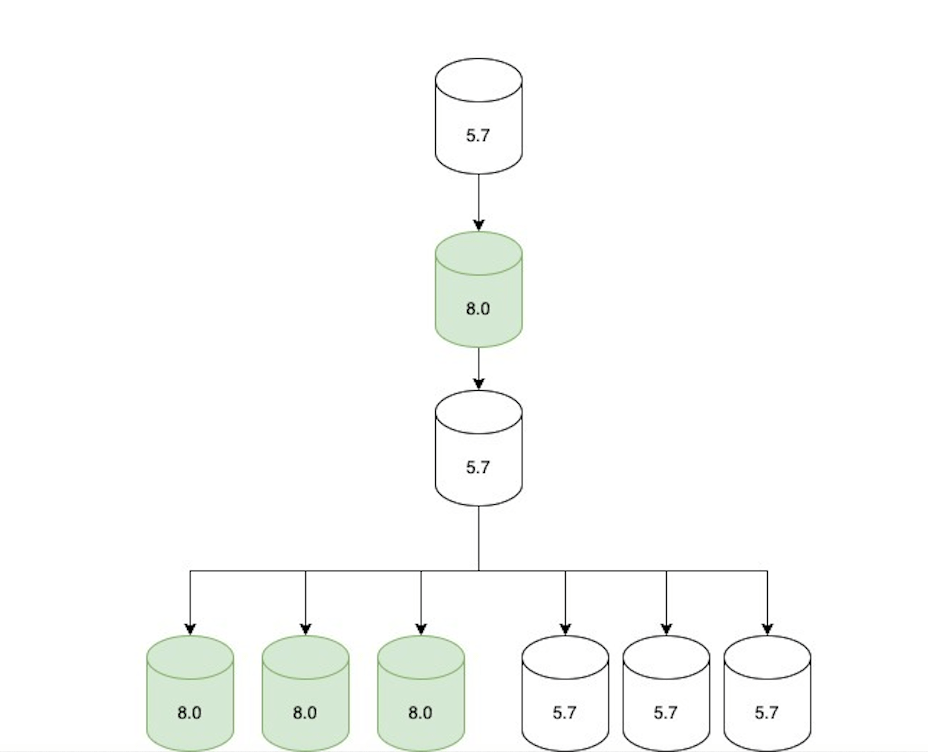
Once all the read-only traffic was being served via 8.0 replicas, we adjusted the replication topology as follows:
An 8.0 primary candidate was configured to replicate directly under the current 5.7 primary.
Two replication chains were created downstream of that 8.0 replica:
A set of only 5.7 replicas (not serving traffic, but ready in case of rollback).
A set of only 8.0 replicas (serving traffic).
The topology was only in this state for a short period of time (hours at most) until we moved to the next step.
To facilitate the upgrade, the topology was updated to have two replication chains.
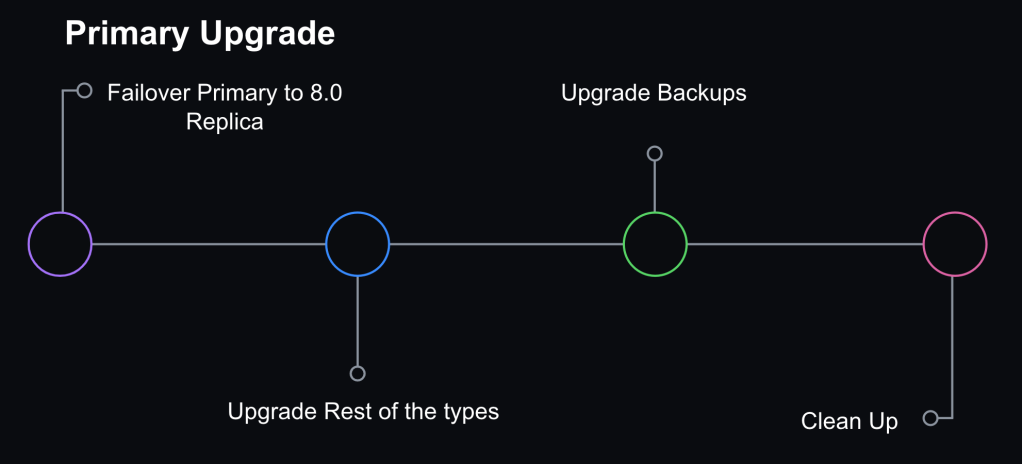
Step 3: Promote MySQL 8.0 host to primary
We opted not to do direct upgrades on the primary database host. Instead, we would promote a MySQL 8.0 replica to primary through a graceful failover performed with Orchestrator. At that point, the replication topology consisted of an 8.0 primary with two replication chains attached to it: an offline set of 5.7 replicas in case of rollback and a serving set of 8.0 replicas.
Orchestrator was also configured to blacklist 5.7 hosts as potential failover candidates to prevent an accidental rollback in case of an unplanned failover.
Primary failover and additional steps to finalize MySQL 8.0 upgrade for a database
Step 4: Internal facing instance types upgraded
We also have ancillary servers for backups or non-production workloads. Those were subsequently upgraded for consistency.
Step 5: Cleanup
Once we confirmed that the cluster didn’t need to rollback and was successfully upgraded to 8.0, we removed the 5.7 servers. Validation consisted of at least one complete 24 hour traffic cycle to ensure there were no issues during peak traffic.
Ability to Rollback
A core part of keeping our upgrade strategy safe was maintaining the ability to rollback to the prior version of MySQL 5.7. For read-replicas, we ensured enough 5.7 replicas remained online to serve production traffic load, and rollback was initiated by disabling the 8.0 replicas if they weren’t performing well. For the primary, in order to roll back without data loss or service disruption, we needed to be able to maintain backwards data replication between 8.0 and 5.7.
MySQL supports replication from one release to the next higher release but does not explicitly support the reverse (MySQL Replication compatibility). When we tested promoting an 8.0 host to primary on our staging cluster, we saw replication break on all 5.7 replicas. There were a couple of problems we needed to overcome:
In MySQL 8.0, utf8mb4 is the default character set and uses a more modern utf8mb4_0900_ai_ci collation as the default. The prior version of MySQL 5.7 supported the utf8mb4_unicode_520_ci collation but not the latest version of Unicode utf8mb4_0900_ai_ci.
MySQL 8.0 introduces roles for managing privileges but this feature did not exist in MySQL 5.7. When an 8.0 instance was promoted to be a primary in a cluster, we encountered problems. Our configuration management was expanding certain permission sets to include role statements and executing them, which broke downstream replication in 5.7 replicas. We solved this problem by temporarily adjusting defined permissions for affected users during the upgrade window.
To address the character collation incompatibility, we had to set the default character encoding to utf8 and collation to utf8_unicode_ci.
For the GitHub.com monolith, our Rails configuration ensured that character collation was consistent and made it easier to standardize client configurations to the database. As a result, we had high confidence that we could maintain backward replication for our most critical applications.
Challenges
Throughout our testing, preparation and upgrades, we encountered some technical challenges.
What about Vitess?
We use Vitess for horizontally sharding relational data. For the most part, upgrading our Vitess clusters was not too different from upgrading the MySQL clusters. We were already running Vitess in CI, so we were able to validate query compatibility. In our upgrade strategy for sharded clusters, we upgraded one shard at a time. VTgate, the Vitess proxy layer, advertises the version of MySQL and some client behavior depends on this version information. For example, one application used a Java client that disabled the query cache for 5.7 servers—since the query cache was removed in 8.0, it generated blocking errors for them. So, once a single MySQL host was upgraded for a given keyspace, we had to make sure we also updated the VTgate setting to advertise 8.0.
Replication delay
We use read-replicas to scale our read availability. GitHub.com requires low replication delay in order to serve up-to-date data.
Earlier on in our testing, we encountered a replication bug in MySQL that was patched on 8.0.28:
Replication: If a replica server with the system variable replica_preserve_commit_order = 1 set was used under intensive load for a long period, the instance could run out of commit order sequence tickets. Incorrect behavior after the maximum value was exceeded caused the applier to hang and the applier worker threads to wait indefinitely on the commit order queue. The commit order sequence ticket generator now wraps around correctly. Thanks to Zhai Weixiang for the contribution. (Bug #32891221, Bug #103636)
We happen to meet all the criteria for hitting this bug.
We use replica_preserve_commit_order because we use GTID based replication.
We have intensive load for long periods of time on many of our clusters and certainly for all of our most critical ones. Most of our clusters are very write-heavy.
Since this bug was already patched upstream, we just needed to ensure we are deploying a version of MySQL higher than 8.0.28.
We also observed that the heavy writes that drove replication delay were exacerbated in MySQL 8.0. This made it even more important that we avoid heavy bursts in writes. At GitHub, we use freno to throttle write workloads based on replication lag.
Queries would pass CI but fail on production
We knew we would inevitably see problems for the first time in production environments—hence our gradual rollout strategy with upgrading replicas. We encountered queries that passed CI but would fail on production when encountering real-world workloads. Most notably, we encountered a problem where queries with large WHERE IN clauses would crash MySQL. We had large WHERE IN queries containing over tens of thousands of values. In those cases, we needed to rewrite the queries prior to continuing the upgrade process. Query sampling helped to track and detect these problems. At GitHub, we use Solarwinds DPM (VividCortex), a SaaS database performance monitor, for query observability.
Learnings and takeaways
Between testing, performance tuning, and resolving identified issues, the overall upgrade process took over a year and involved engineers from multiple teams at GitHub. We upgraded our entire fleet to MySQL 8.0 – including staging clusters, production clusters in support of GitHub.com, and instances in support of internal tools. This upgrade highlighted the importance of our observability platform, testing plan, and rollback capabilities. The testing and gradual rollout strategy allowed us to identify problems early and reduce the likelihood for encountering new failure modes for the primary upgrade.
While there was a gradual rollout strategy, we still needed the ability to rollback at every step and we needed the observability to identify signals to indicate when a rollback was needed. The most challenging aspect of enabling rollbacks was holding onto the backward replication from the new 8.0 primary to 5.7 replicas. We learned that consistency in the Trilogy client library gave us more predictability in connection behavior and allowed us to have confidence that connections from the main Rails monolith would not break backward replication.
However, for some of our MySQL clusters with connections from multiple different clients in different frameworks/languages, we saw backwards replication break in a matter of hours which shortened the window of opportunity for rollback. Luckily, those cases were few and we didn’t have an instance where the replication broke before we needed to rollback. But for us this was a lesson that there are benefits to having known and well-understood client-side connection configurations. It emphasized the value of developing guidelines and frameworks to ensure consistency in such configurations.
Prior efforts to partition our data paid off—it allowed us to have more targeted upgrades for the different data domains. This was important as one failing query would block the upgrade for an entire cluster and having different workloads partitioned allowed us to upgrade piecemeal and reduce the blast radius of unknown risks encountered during the process. The tradeoff here is that this also means that our MySQL fleet has grown.
The last time GitHub upgraded MySQL versions, we had five database clusters and now we have 50+ clusters. In order to successfully upgrade, we had to invest in observability, tooling, and processes for managing the fleet.
Conclusion
A MySQL upgrade is just one type of routine maintenance that we have to perform – it’s critical for us to have an upgrade path for any software we run on our fleet. As part of the upgrade project, we developed new processes and operational capabilities to successfully complete the MySQL version upgrade. Yet, we still had too many steps in the upgrade process that required manual intervention and we want to reduce the effort and time it takes to complete future MySQL upgrades.
We anticipate that our fleet will continue to grow as GitHub.com grows and we have goals to partition our data further which will increase our number of MySQL clusters over time. Building in automation for operational tasks and self-healing capabilities can help us scale MySQL operations in the future. We believe that investing in reliable fleet management and automation will allow us to scale github and keep up with required maintenance, providing a more predictable and resilient system.
The lessons from this project provided the foundations for our MySQL automation and will pave the way for future upgrades to be done more efficiently, but still with the same level of care and safety.
Last week, GitHub experienced several availability incidents, both long running and shorter duration. We have since mitigated these incidents and all systems are now operating normally. The root causes for these incidents were unrelated but in aggregate, they negatively impacted the services that organizations and developers trust GitHub to deliver. This is not acceptable nor the standard we hold ourselves to. We took immediate and direct action to remedy the situation, and we want to be very transparent about what caused these incidents and what we’re doing to mitigate in the future. Read on for more details.
Date: May 9, 2023 Incident: Git Databases degraded due to configuration change Impact: 8 of 10 main services degraded
Details:
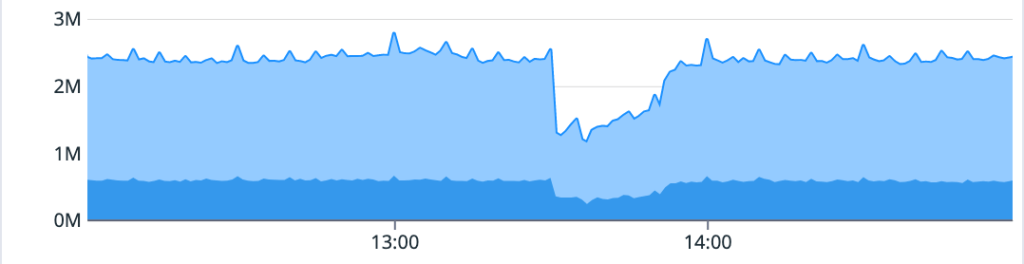
On May 9, we had an incident that caused 8 of the 10 services on the status portal to be impacted by a major (status red) outage. The majority of downtime lasted just over an hour. During that hour-long period, many services could not read newly-written Git data, causing widespread failures. Following this outage, there was an extended timeline for post-incident recovery of some pull request and push data.
This incident was triggered by a configuration change to the internal service serving Git data. The change was intended to prevent connection saturation, and had been previously introduced successfully elsewhere in the Git backend.
Shortly after the rollout began, the cluster experienced a failover. We reverted the config change and attempted a rollback within a few minutes, but the rollback failed due to an internal infrastructure error.
Once we completed a gradual failover, write operations were restored to the database and broad impact ended. Additional time was needed to get Git data, website-visible contents, and pull requests consistent for pushes received during the outage to achieve a full resolution.
Date: May 10, 2023 Incident: GitHub App authentication token issuance degradation due to load Impact: 6 of 10 main services degraded
Details:
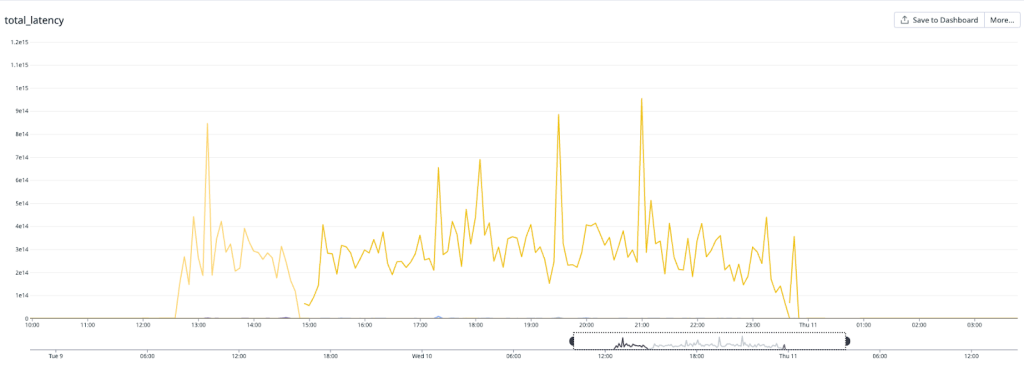
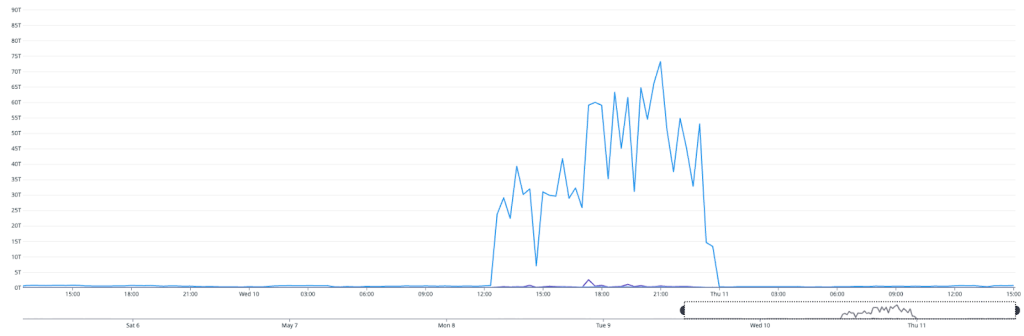
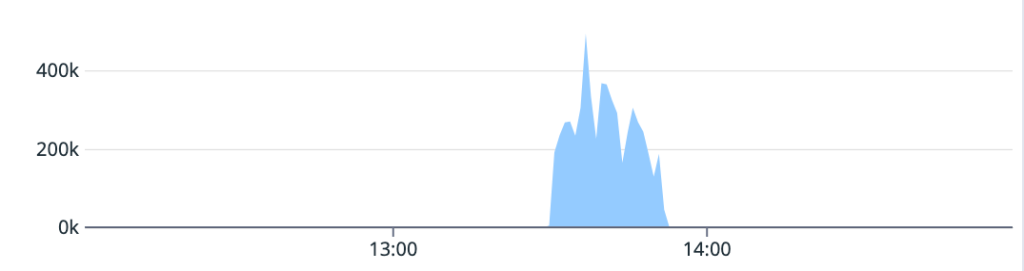
On May 10, the database cluster serving GitHub App auth tokens saw a 7x increase in write latency for GitHub App permissions (status yellow). The failure rate of these auth token requests was 8-15% for the majority of this incident, but did peak at 76% percent for a short time.
Total LatencyFetch Latency
We determined that an API for managing GitHub App permissions had an inefficient implementation. When invoked under specific circumstances, it results in very large writes and a timeout failure. This API was invoked by a new caller that retried on timeouts, triggering the incident. While working to identify root cause, improve the data access pattern, and address the source of the new call pattern, we also took steps to reduce load from both internal and external paths, reducing impact to critical paths like GitHub Actions workflows. After recovery, we re-enabled all suspended sources before statusing green.
While we update the backing data model to avoid this pattern entirely, we are updating the API to check for the shift in installation state and will fail the request if it would trigger these large writes as a temporary measure.
Beyond the problem with the query performance, much of our observability is optimized for identifying high-volume patterns, not low-volume high-cost ones, which made it difficult to identify the specific circumstances that were causing degraded cluster health. Moving forward, we are prioritizing work to apply the experiences of our investigations during this incident to ensure we have quick and clear answers for similar cases in the future.
Date: May 11, 2023 Incident: Git database degraded due to loss of read replicas Impact: 8 of 10 main services degraded
Details:
On May 11, a database cluster serving git data crashed, triggering an automated failover. The failover of the primary was successful, but in this instance read replicas were not attached. The primary cannot handle full read/write load, so an average of 15% of requests for Git data were failed or slow, with peak impact of 26% at the start of the incident. We mitigated this by reattaching the read replicas and the core scenarios recovered. Similar to the May 9 incident, additional work was required to recover pull request push updates, but we were eventually able to achieve full resolution.
Beyond the immediate mitigation work, the top workstreams underway are focused on determining and resolving what caused the cluster to crash and why the failure didn’t leave the cluster in a good state. We want to clarify that the team was already working to understand and address a previous cluster crash as part of a repair item from a different recent incident. This failover replica failure is new.
Why did these incidents impact other GitHub services?
We expect our services to be as resilient as possible to failure. Failure in a distributed system is inevitable, but it shouldn’t result in significant outages across multiple services. We saw widespread degradation in all three of these incidents. In the Git database incidents, Git reads and writes are at the core of many GitHub scenarios, so increased latency and failures resulted in GitHub Actions workflows unable to pull data or pull requests not updating.
In the GitHub Apps incident, the impact on the token issuance also impacted GitHub features that rely on tokens for operation. This is the source of each GITHUB_TOKEN in GitHub Actions, as well as the tokens used to give GitHub Codespaces access to your repositories. They’re also how access to private GitHub Pages are secured. When token issuance fails, GitHub Actions and GitHub Codespaces are unable to access the data they need to run, and fail to launch as a result.
What actions are we taking?
We are carefully reviewing our internal processes and making adjustments to ensure changes are always deployed safely moving forward. Not all of these incidents were caused by production changes, but we recognize this as an area of improvement.
In addition to the standard post-incident analysis and review, we are analyzing the breadth of impact these incidents had across services to identify where we can reduce the impact of future similar failures.
We are working to improve observability of high-cost, low-volume query patterns and general ability to diagnose and mitigate this class of issue quickly.
We are addressing the Git database crash that has caused more than one incident at this point. This work was already in progress and we will continue to prioritize it.
We are addressing the database failover issues to ensure that failovers always recover fully without intervention.
As part of our commitment to transparency, we publish summaries of all incidents that result in degraded performance of GitHub services in our monthly availability report. Given the scope and duration of these recent incidents we felt it was important to address them with the community now. The May report will include these incidents and any further detail we have on them, along with a general update on progress towards increasing the availability of GitHub. We are deeply committed to improving site reliability moving forward and will continue to hold ourselves accountable for delivering on that commitment.
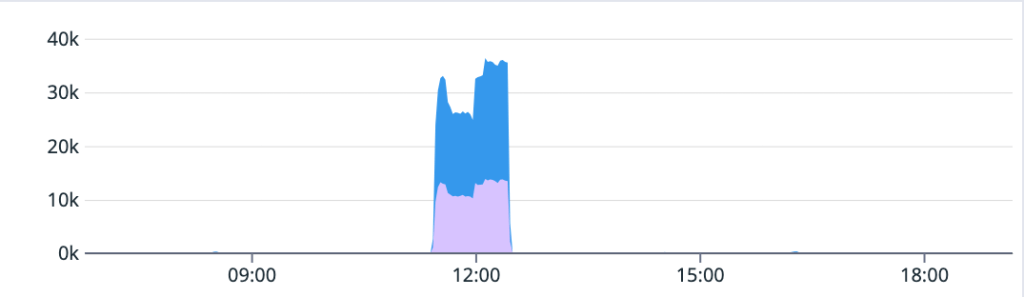
In February 2021, Cloudflare launched Project Fair Shot — a program that gave our Waiting Room product free of charge to any government, municipality, private/public business, or anyone responsible for the scheduling and/or dissemination of the COVID-19 vaccine.
By having our Waiting Room technology in front of the vaccine scheduling application, it ensured that:
Applications would remain available, reliable, and resilient against massive spikes of traffic for users attempting to get their vaccine appointment scheduled.
Visitors could wait for their long-awaited vaccine with confidence, arriving at a branded queuing page that provided accurate, estimated wait times.
Vaccines would get distributed equitably, and not just to folks with faster reflexes or Internet connections.
Since February, we’ve seen a good number of participants in Project Fair Shot. To date, we have helped more than 100 customers across more than 10 countries to schedule approximately 100 million vaccinations. Even better, these vaccinations went smoothly, with customers like the County of San Luis Obispo regularly dealing with more than 20,000 appointments in a day. “The bottom line is Cloudflare saved lives today. Our County will forever be grateful for your participation in getting the vaccine to those that need it most in an elegant, efficient and ethical manner” — Web Services Administrator for the County of San Luis Obispo.
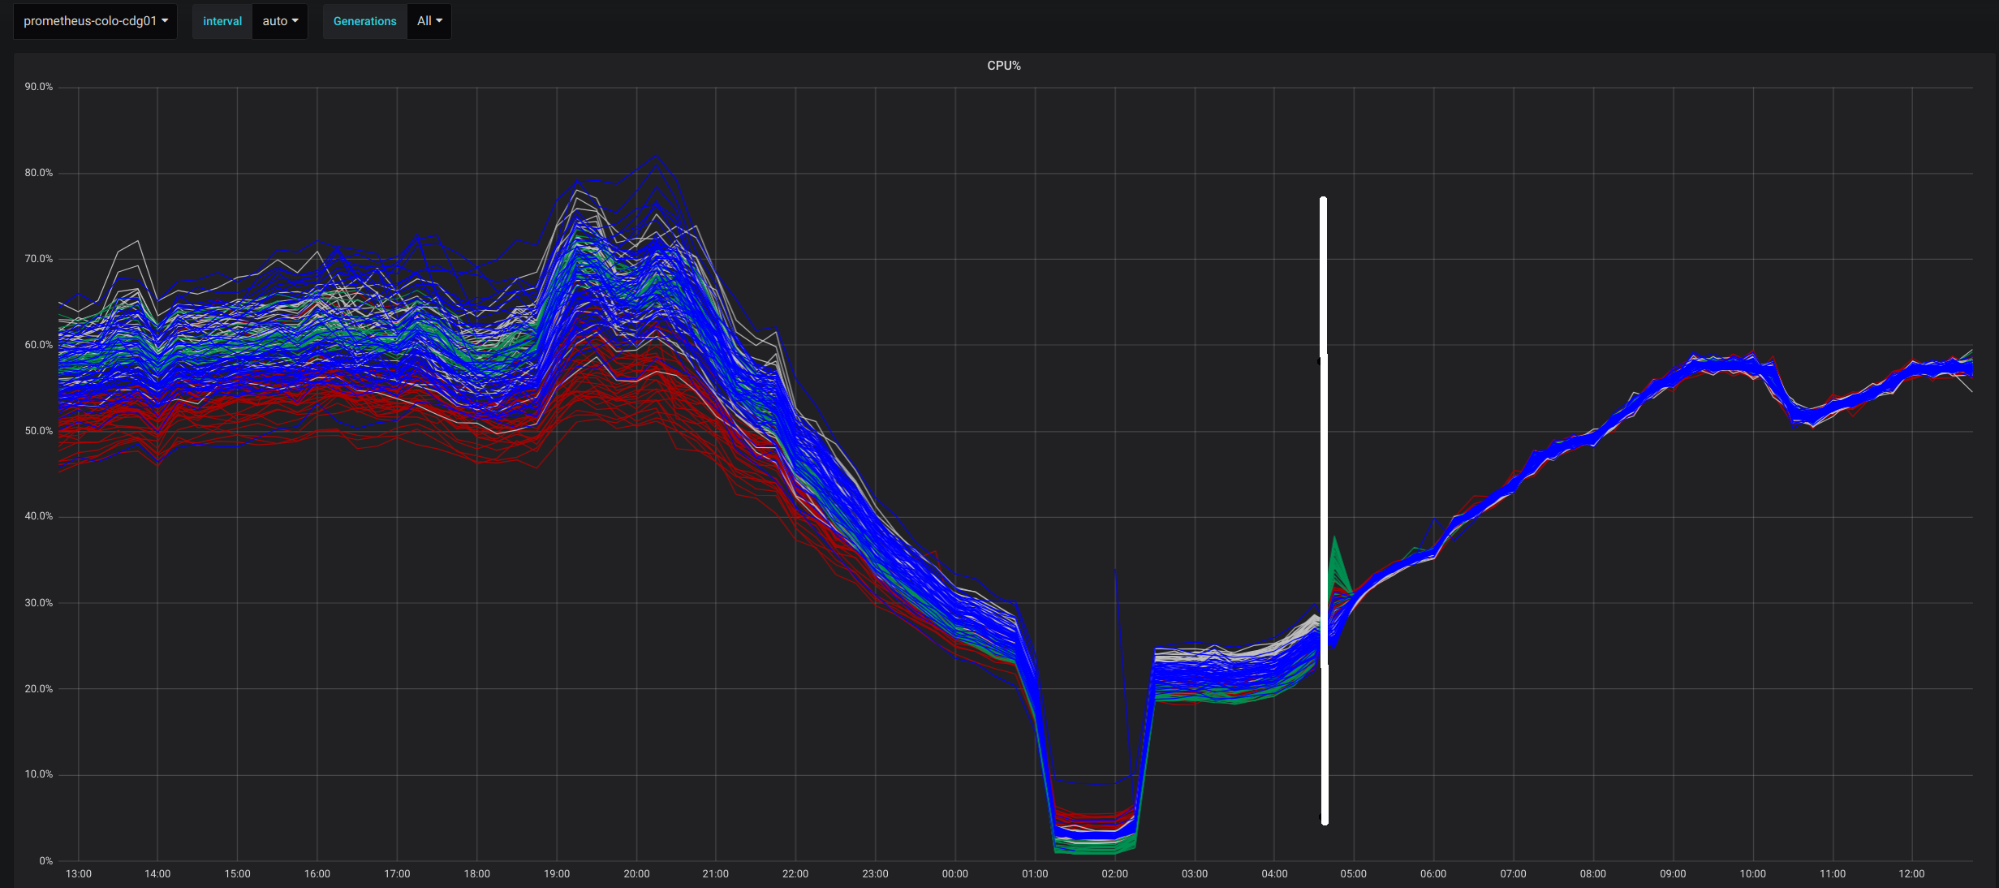
We are happy to have helped not just in the US, but worldwide as well. In Canada, we partnered with a number of organizations and the Canadian government to increase access to the vaccine. One partner stated: “Our relationship with Cloudflare went from ‘Let’s try Waiting Room’ to ‘Unless you have this, we’re not going live with that public-facing site.’” — CEO of Verto Health. In another country in Europe, we saw over three million people go through the Waiting Room in less than 24 hours, leading to a significantly smoother and less stressful experience. Cities in Japan, — working closely with our partner, Classmethod — have been able to vaccinate over 40 million people and are on track to complete their vaccination process across 317 cities. If you want more stories from Project Fair Shot, check out our case studies.
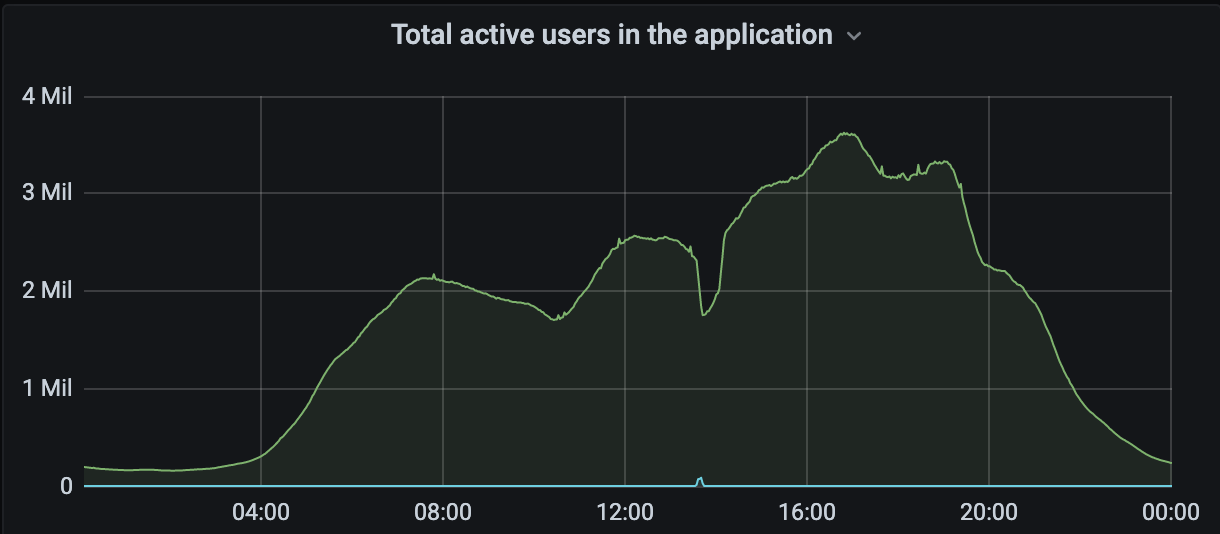
A European customer seeing very high amounts of traffic during a vaccination event
We are continuing to add more customers to Project Fair Shot every day to ensure we are doing all that we can to help distribute more vaccines. With the emergence of the Delta variant and others, vaccine distribution (and soon, booster shots) is still very much a real problem to keep everyone healthy and resilient. Because of these new developments, Cloudflare will be extending Project Fair Shot until at least July 1, 2022. Though we are not excited to see the pandemic continue, we are humbled to be able to provide our services and be a critical part in helping us collectively move towards a better tomorrow.
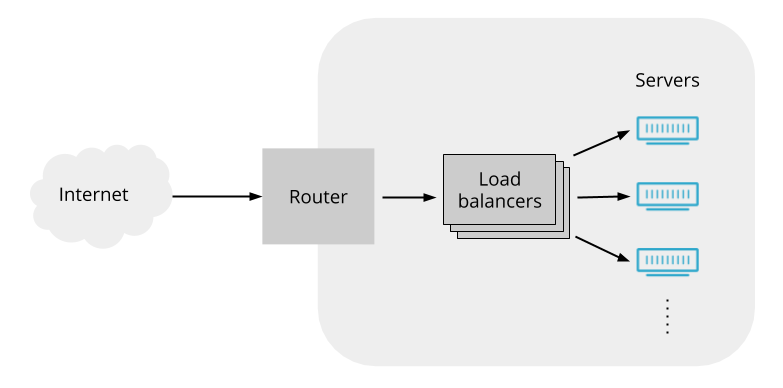
Load Balancing — functionality that’s been around for the last 30 years to help businesses leverage their existing infrastructure resources. Load balancing works by proactively steering traffic away from unhealthy origin servers and — for more advanced solutions — intelligently distributing traffic load based on different steering algorithms. This process ensures that errors aren’t served to end users and empowers businesses to tightly couple overall business objectives to their traffic behavior.
What’s important for load balancing today?
We are no longer in the age where setting up a fixed amount of servers in a data center is enough to meet the massive growth of users browsing the Internet. This means that we are well past the time when there is a one size fits all solution to suffice the needs of different businesses. Today, customers look for load balancers that are easy to use, propagate changes quickly, and — especially now — provide the most feature flexibility. Feature flexibility has become so important because different businesses have different paths to success and, consequently, different challenges! Let’s go through a few common use cases:
You might have an application split into microservices, where specific origins support segments of your application. You need to route your traffic based on specific paths to ensure no single origin can be overwhelmed and users get sent to the correct server to answer the originating request.
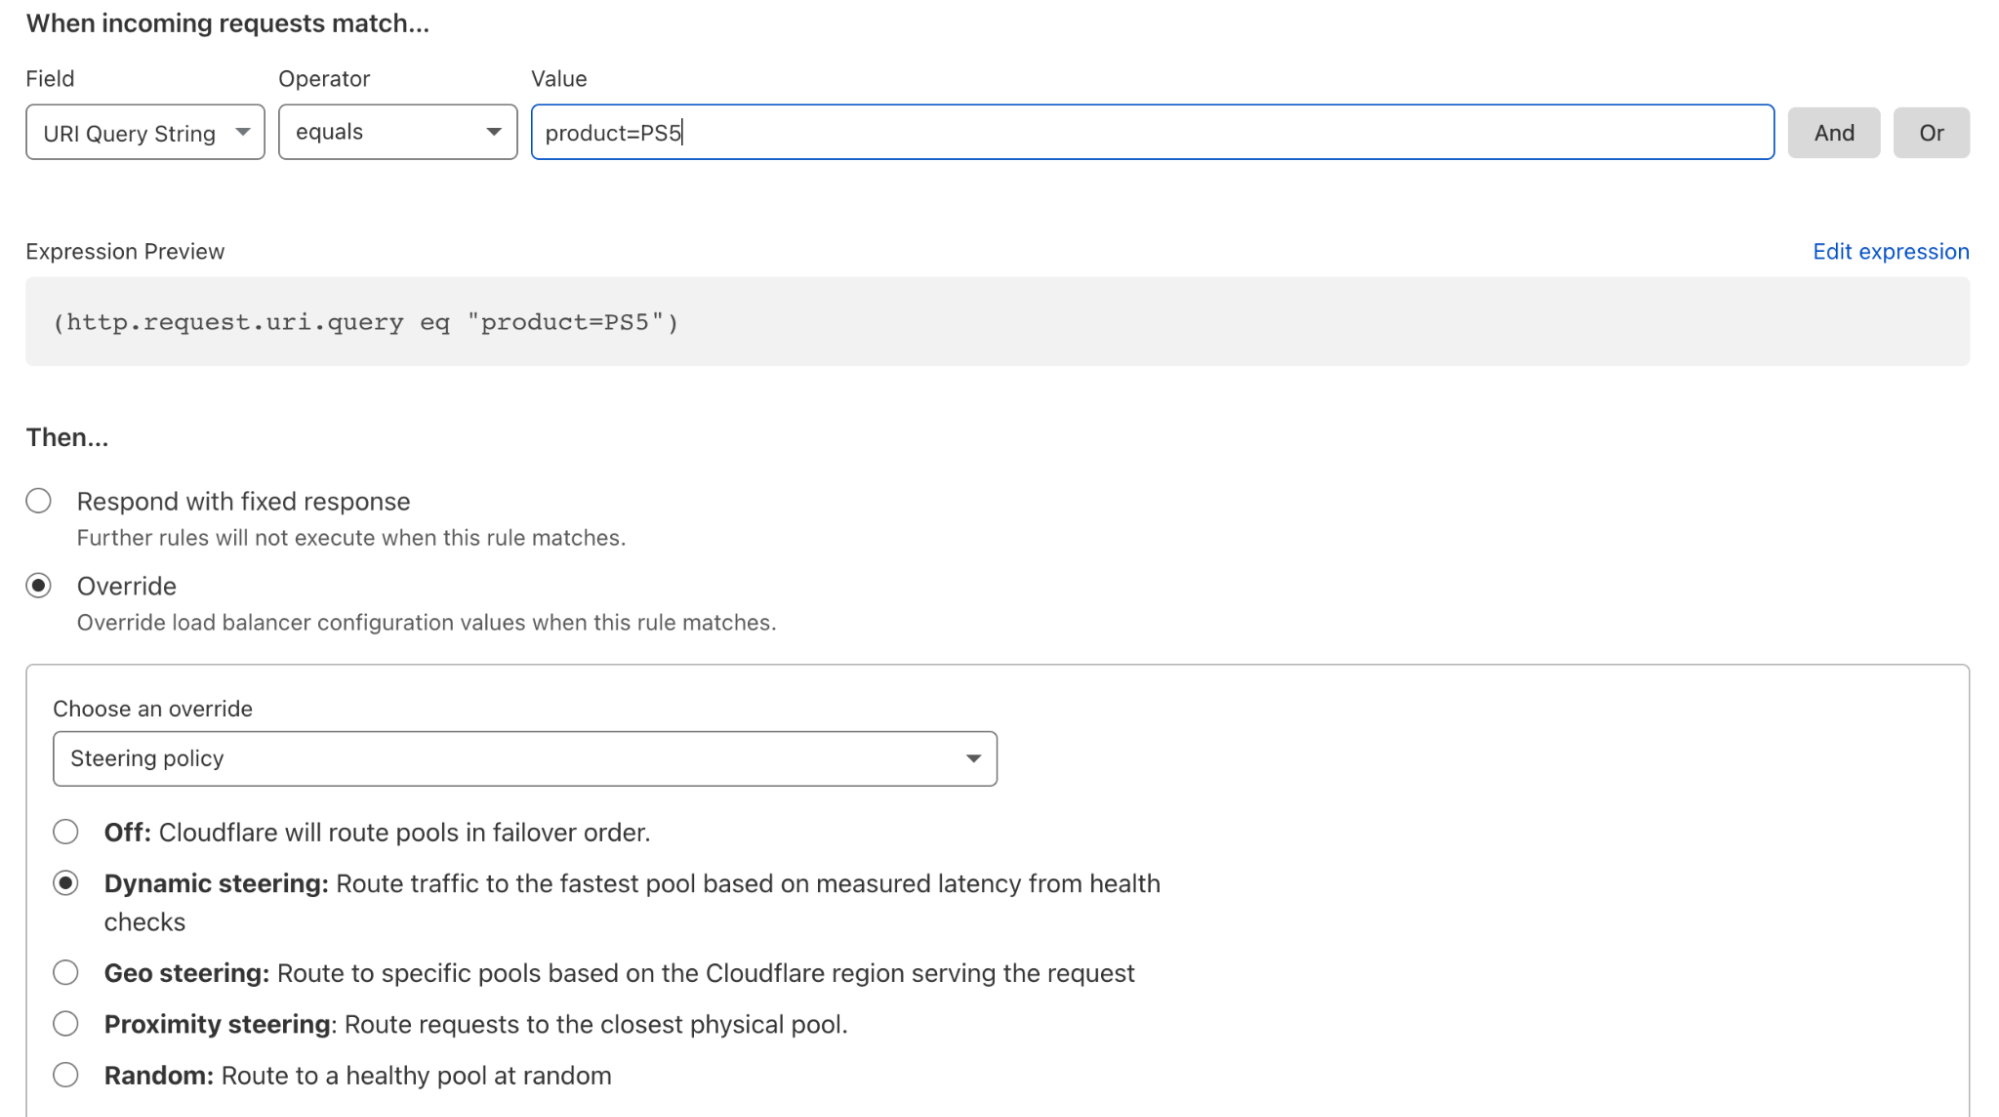
You may want to route traffic based on a specific value within a header request such as “PS5” and send requests to the data center with the matching header.
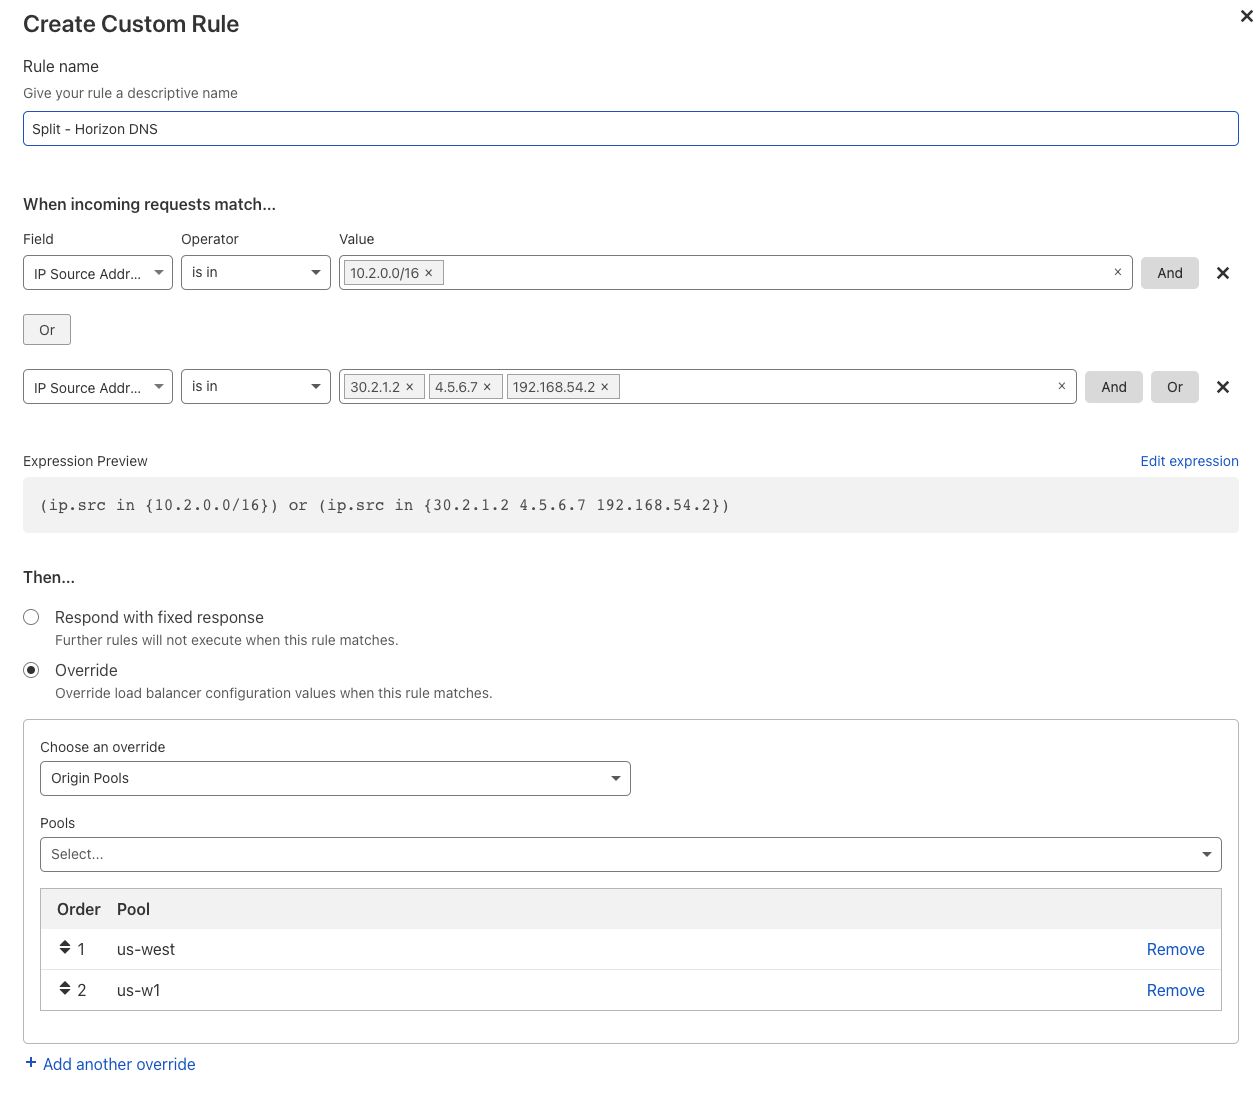
If you heavily prioritize security and privacy, you may adopt a split-horizon DNS setup within your network architecture. You might choose this architecture to separate internal network requests from public requests from the rest of the public Internet. Then, you could route each type of request to pools specifically suited to handle the amount and type of traffic.
As we continue to build new features and products, we also wanted to build a framework that would allow us to increase our velocity to add new items to our Load Balancing solution while we also take the time to create first class features as well. The result was the creation of our custom rule builder!
Now you can build complex, custom rules to direct traffic using Cloudflare Load Balancing, empowering customers to create their own custom logic around their traffic steering and origin selection decisions. As we mentioned, there is no one size fits all solution in today’s world. We provide the tools to easily and quickly create rules that meet the exact requirements needed for any customer’s unique situation and architecture. On top of that, we also support ‘and’ and ‘or’ statements within a rule, allowing very powerful and complex rules to be created for any situation!
Load Balancing by path becomes easy, requiring just a few minutes to enter the paths and some boolean statements to create complex rules. Steer by a specific header, query string, or cookie. It’s no longer a pain point. Leverage a split horizon DNS design by creating a rule looking at the IP source address and then routing to the appropriate pool based on the value. This is just a small subset of the very robust capabilities that load balancing custom rules makes available to our users and this is just the start! Not only do we have a large amount of functionality right out of the box, but we’re also providing a consistent, intuitive experience by building on our Firewall Rules Engine.
Let’s go through some use cases to explore how custom rules can open new possibilities by giving you more granular control of your traffic.
High-volume transactions for ecommerce
For any high-volume transaction business such as an ecommerce or retail store, ensuring the transactions go through as fast and reliably as possible is a table stakes requirement. As transaction volume increases, no single origin can handle the incoming traffic, and it doesn’t always make sense for it to do so. Why have a transaction request travel around the world to a specifically nominated origin for payment processing? This setup would only add latency, leading to degraded performance, increased errors, and a poor customer experience. But what if you could create custom logic to segment transactions to different origin servers based on a specific value in a query string, such as a PS5 (associated with Sony’s popular PlayStation 5)? What if you could then couple that value with dynamic latency steering to ensure your load balancer always chooses the most performant path to the origin? This would be game changing to not only ensure that table-stakes transactions are reliable and fast but also drastically improve the customer experience. You could do this in minutes with load balancing custom rules:
For any requests where the query string shows ‘PS5’, then route based on which pool is the most performant.
Load balance across multiple DNS vendors to support privacy and security
Some customers may want to use multiple DNS providers to bolster their resiliency along with their security and privacy for the different types of traffic going through their network. By utilizing two DNS providers, customers can not only be sure that they remain highly available in times of outages, but also direct different types of traffic, whether that be internal network traffic across offices or unknown traffic from the public Internet.
Without flexibility, however, it can be difficult to easily and intelligently route traffic to the proper data centers to maintain that security and privacy posture. Not anymore! With load balancing custom rules, supporting a split horizon DNS architecture takes as little as five minutes to set up a rule based on the IP source condition and then overwriting which pools or data centers that traffic should route to.
This can also be extremely helpful if your data centers are spread across multiple areas of the globe that don’t align with the 13 current regions within Cloudflare. By segmenting where traffic goes based on the IP source address, you can create a type of geo-steering setup that is also finely tuned to the requirements of the business!
How did we build it?
We built Load Balancing rules on top of our open-source wirefilter execution engine. People familiar with Firewall Rules and other products will notice similar syntax since both products are built on top of this execution engine.
By reusing the same underlying engine, we can take advantage of a battle-tested production library used by other products that have the performance and stability requirements of their own. For those experienced with our rule-based products, you can reuse your knowledge due to the shared syntax to define conditionals statements. For new users, the Wireshark-like syntax is often familiar and relatively simple.
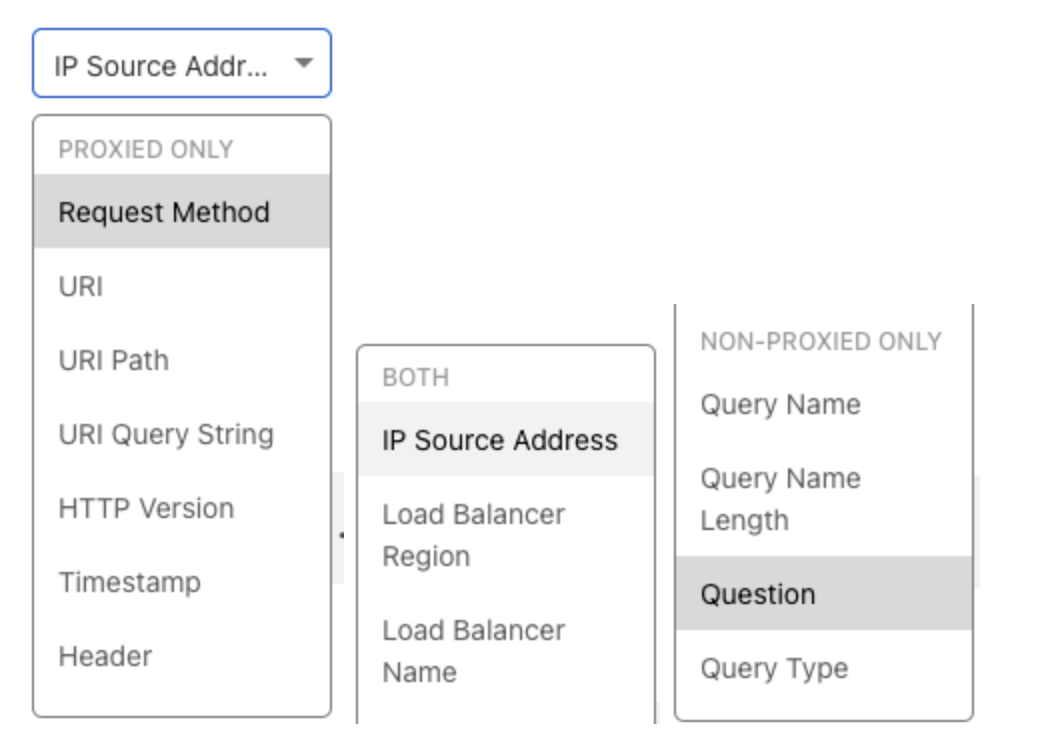
DNS vs Proxied?
Our Load Balancer supports both DNS and Proxied load balancing. These two protocols operate very differently and as such are handled differently.
For DNS-based load balancing, our load balancer responses to DNS queries sent from recursive resolvers. These resolvers are normally not the end user directly requesting the traffic nor is there a 1-to-1 ratio between DNS query and end-user requests. The DNS makes extensive use of caching at all levels so the result of each query could potentially be used by thousands of users. Combined, this greatly limits the possible feature set for DNS. Since you don’t see the end user directly nor know if your response is going to be used by one or more users, all responses can only be customized to a limited degree.
Our Proxied load balancing, on the other hand, processes rules logic for every request going through the system. Since we act as a proxy for all these requests, we can invoke this logic for all requests and access user-specific data.
These different modes mean the fields available to each end up being quite different. The DNS load balancer gets access to DNS-specific fields such as “dns.qry.name” (the query name) while our Proxied load balancer has access to “http.request.method” (the HTTP method used to access the proxied resource). Some more general fields — like the name of the load balancer being used — are available in both modes.
How does it work under the hood?
When a load balancer rule is configured, that API call will validate that the conditions and actions of the rules are valid. It makes sure the condition only references known fields, isn’t excessively long, and is syntactically valid. The overrides are processed and applied to the load balancers configuration to make sure they won’t cause an invalid configuration. After validation, the new rule is saved to our database.
With the new rule saved, we take the load balancer’s data and all rules used by it and package that data together into one configuration to be shipped out to our edge. This process happens very quickly, so any changes are visible to you in just a few seconds.
While DNS and proxied load balancers have access to different fields and the protocols themselves are quite different, the two code paths overlap quite a bit. When either request type makes it to our load balancer, we first load up the load balancer specific configuration data from our edge datastore. This object contains all the “static” data for a load balancer, such as rules, origins, pools, steering policy, and so forth. We load dynamic data such as origin health and RTT data when evaluating each pool.
At the start of the load balancer processing, we run our rules. This ends up looking very much like a loop where we check each condition and — if the condition is true — we apply the effects specified by the rules. After each condition is processed and the effects are applied we then run our normal load balancing logic as if you have configured the load balancer with the overridden settings. This style of applying each override in turn allows more than one rule to change a given setting multiple times during execution. This lets users avoid extremely long and specific conditionals and instead use shorter conditionals and rule ordering to override specific settings creating a more modular ruleset.
What’s coming next?
For you, the next steps are simple. Start building custom load balancing rules! For more guidance, check out our developer documentation.
For us, we’re looking to expand this functionality. As this new feature develops, we are going to be identifying new fields for conditionals and new options for overrides to allow more specific behavior. As an example, we’ve been looking into exposing a means to creating more time-based conditionals, so users can create rules that only apply during certain times of the day or month. Stay tuned to the blog for more!
Today, AWS Key Management Service (AWS KMS) is introducing multi-Region keys, a new capability that lets you replicate keys from one Amazon Web Services (AWS) Region into another. Multi-Region keys are designed to simplify management of client-side encryption when your encrypted data has to be copied into other Regions for disaster recovery or is replicated in Amazon DynamoDB global tables.
In this blog post, we give an overview of how we got here and how to get started using multi-Region keys. We include a code example for multi-Region encryption of data in DynamoDB global tables.
How we got here
From its inception, AWS KMS has been strictly isolated to a single AWS Region for each implementation, with no sharing of keys, policies, or audit information across Regions. Region isolation can help you comply with security standards and data residency requirements. However, not sharing keys across Regions creates challenges when you need to move data that depends on those keys across Regions. AWS services that use your KMS keys for server-side encryption address this challenge by transparently re-encrypting data on your behalf using the KMS keys you designate in the destination Region. If you use client-side encryption, this work adds extra complexity and latency of re-encrypting between regionally isolated KMS keys.
Multi-Region keys are a new feature from AWS KMS for client-side applications that makes KMS-encrypted ciphertext portable across Regions. Multi-Region keys are a set of interoperable KMS keys that have the same key ID and key material, and that you can replicate to different Regions within the same partition. With symmetric multi-Region keys, you can encrypt data in one Region and decrypt it in a different Region. With asymmetric multi-Region keys, you encrypt, decrypt, sign, and verify messages in multiple Regions.
To use multi-Region keys, you create a primary multi-Region key with a new key ID and key material. Then, you use the primary key to create a related multi-Region replica key in a different Region of the same AWS partition. Replica keys are KMS keys that can be used independently; they aren’t a pointer to the primary key. The primary and replica keys share only certain properties, including their key ID, key rotation, and key origin. In all other aspects, every multi-Region key, whether primary or replica, is a fully functional, independent KMS key resource with its own key policy, aliases, grants, key description, lifecycle, and other attributes. The key Amazon Resource Names (ARN) of related multi-Region keys differ only in the Region portion, as shown in the following figure (Figure 1).
Figure 1: Multi-Region keys have unique ARNs but identical key IDs
You cannot convert an existing single-Region key to a multi-Region key. This design ensures that all data protected with existing single-Region keys maintain the same data residency and data sovereignty properties.
When to use multi-Region keys
You can use multi-Region keys in any client-side application. Since multi-Region keys avoid cross-Region calls, they’re especially useful for scenarios where you don’t want to depend on another Region or incur the latency of a cross-Region call. For example, disaster recovery, global data management, distributed signing applications, and active-active applications that span multiple Regions can all benefit from using multi-Region keys. You can also create and use multi-Region keys in a single Region and choose to replicate those keys at some later date when you need to move protected data to additional Regions.
Note: If your application will run in only one Region, you should continue to use single-Region keys to benefit from their data isolation properties.
One significant benefit of multi-Region keys is using them with DynamoDB global tables. Let’s explore that interaction in detail.
Using multi-Region keys with DynamoDB global tables
AWS KMS multi-Region keys (MRKs) can be used with the DynamoDB Encryption Client to protect data in DynamoDB global tables. You can configure the DynamoDB Encryption Client to call AWS KMS for decryption in a different Region than the one in which the data was encrypted, as shown in the following figure (Figure 2). This is useful for disaster recovery, or simply to improve performance when using DynamoDB in a globally distributed application.
Figure 2: Using multi-Region keys with DynamoDB global tables
Configure the DynamoDB Encryption Client to encrypt records
To use AWS KMS multi-Region keys, you need to configure the DynamoDB Encryption Client with the Region you want to call, which is typically the Region where the application is running. Then, you need to configure the ARN of the KMS key you want to use in that Region.
This example encrypts records in us-east-1 (US East (N. Virginia)) and decrypts records in us-west-2 (US West (Oregon)). If you use the following example configuration code, be sure to replace the example key ARNs with valid key ARNs for your multi-Region keys.
// Specify the multi-Region key in the us-east-1 Region
String encryptRegion = "us-east-1";
String cmkArnEncrypt = "arn:aws:kms:us-east-1:<111122223333>:key/<mrk-1234abcd12ab34cd56ef12345678990ab>";

// Set up SDK clients for KMS and DDB in us-east-1
AWSKMS kmsEncrypt = AWSKMSClientBuilder.standard().withRegion(encryptRegion).build();
AmazonDynamoDB ddbEncrypt = AmazonDynamoDBClientBuilder.standard().withRegion(encryptRegion).build();

// Configure the example global table
String tableName = "global-table-example";
String employeeIdAttribute = "employeeId";
String nameAttribute = "name";

// Configure attribute actions for the Dynamo DB Encryption Client
//   Sign the employee ID field
//   Encrypt and sign the name field
Map<String, Set<EncryptionFlags>> actions = new HashMap<>();
actions.put(employeeIdAttribute, EnumSet.of(EncryptionFlags.SIGN));
actions.put(nameAttribute, EnumSet.of(EncryptionFlags.ENCRYPT, EncryptionFlags.SIGN));

// Set an encryption context. This is an optional best practice.
final EncryptionContext encryptionContext = new EncryptionContext.Builder()
        .withTableName(tableName)
        .withHashKeyName(employeeIdAttribute)
        .build();

// Use the Direct KMS materials provider and the DynamoDB encryptor
// Specify the key ARN of the multi-Region key in us-east-1
DirectKmsMaterialProvider cmpEncrypt = new DirectKmsMaterialProvider(kmsEncrypt, cmkArnEncrypt);
DynamoDBEncryptor encryptor = DynamoDBEncryptor.getInstance(cmpEncrypt);

// Create a record, encrypt it,
// and put it in the DynamoDB global table
Map<String, AttributeValue> rec = new HashMap<>();
rec.put(nameAttribute, new AttributeValue().withS("Andy"));
rec.put(employeeIdAttribute, new AttributeValue().withS("1234"));

final Map<String, AttributeValue> encryptedRecord = encryptor.encryptRecord(rec, actions, encryptionContext);
ddbEncrypt.putItem(tableName, encryptedRecord);
When you save the newly encrypted record, DynamoDB global tables automatically replicates this encrypted record to the replica tables in the us-west-2 Region.
Configure the DynamoDB Encryption Client to decrypt data
Now you’re ready to configure a DynamoDB client to decrypt the record in us-west-2 where both the replica table and the replica multi-Region key exist.
// Specify the Region and key ARN to use when decrypting
String decryptRegion = "us-west-2";
String cmkArnDecrypt = "arn:aws:kms:us-west-2:<111122223333>:key/<mrk-1234abcd12ab34cd56ef12345678990ab>";

// Set up SDK clients for KMS and DDB in us-west-2
AWSKMS kmsDecrypt = AWSKMSClientBuilder.standard()
    .withRegion(decryptRegion)
    .build();

AmazonDynamoDB ddbDecrypt = AmazonDynamoDBClientBuilder.standard()
    .withRegion(decryptRegion)
    .build();

// Configure the DynamoDB Encryption Client
// Use the Direct KMS materials provider and the DynamoDB encryptor
// Specify the key ARN of the multi-Region key in us-west-2
final DirectKmsMaterialProvider cmpDecrypt = new DirectKmsMaterialProvider(kmsDecrypt, cmkArnDecrypt);
final DynamoDBEncryptor decryptor = DynamoDBEncryptor.getInstance(cmpDecrypt);

// Set up your query
Map<String, AttributeValue> query = new HashMap<>();
query.put(employeeIdAttribute, new AttributeValue().withS("1234"));

// Get a record from DDB and decrypt it
final Map<String, AttributeValue> retrievedRecord = ddbDecrypt.getItem(tableName, query).getItem();
final Map<String, AttributeValue> decryptedRecord = decryptor.decryptRecord(retrievedRecord, actions, encryptionContext);
Note: This example encrypts with the primary multi-Region key and then decrypts with a replica multi-Region key. The process could also be reversed—every multi-Region key can be used in the encryption or decryption of data.
Summary
In this blog post, we showed you how to use AWS KMS multi-Region keys with client-side encryption to help secure data in global applications without sacrificing high availability or low latency. We also showed you how you can start working with a global application with a brief example of using multi-Region keys with the DynamoDB Encryption Client and DynamoDB global tables.
This blog post is a brief introduction to the ways you can use multi-Region keys. We encourage you to read through the Using multi-Region keys topic to learn more about their functionality and design. You’ll learn about:
If you have feedback about this post, submit comments in the Comments section below. If you have questions about this post, start a new thread on the AWS KMS forum.
Want more AWS Security how-to content, news, and feature announcements? Follow us on Twitter.
In this blog post we will discuss how we made our infrastructure DNS zone more reliable by using multiple primary nameservers to leverage our own DNS product running on our edge as well as a third-party DNS provider.
Authoritative Nameservers
You can think of an authoritative nameserver as the source of truth for the records of a given DNS zone. When a recursive resolver wants to look up a record, it will eventually need to talk to the authoritative nameserver(s) for the zone in question. If you’d like to read more on the topic, our learning center provides some additional information.
Here’s an example of our authoritative nameservers (replacing our actual domain with example.com):
As you can see, there are three nameservers listed. You’ll notice that the nameservers happen to reside in the same zone, but they don’t have to. Those three nameservers point to six anycasted IP addresses (3 x IPv4, 3 x IPv6) announced from our edge, comprising data centers from 200+ cities around the world.
The Problem
We store the hostnames for all of our machines, both the ones at the edge and the ones at core data centers, in a DNS zone we refer to as our infrastructure zone. By using our own DNS product to run our infrastructure zone, we get the reliability and performance of our Global Anycast Network. However, what would happen if those nameservers became unavailable due to an issue on our edge? Eventually DNS lookups would fail, as resolvers would not be able to connect to the only authoritative nameservers configured on the zone: the ones hosted on our edge. This is the main problem we set out to solve.
When an incident occurs, our engineering teams are busy investigating, debugging, and fixing the issue at hand. If they cannot resolve the hostnames of the infrastructure they need to use, it will lead to confusion and delays in resolving the incident.
Imagine you are part of a team tackling an incident. As you quickly begin to investigate, you try to connect to a specific machine to gather some debugging information, but you get a DNS resolution error. What now? You know you are using the right hostname. Is this a result of the incident at hand, some side effect, or is this completely unrelated? You need to keep investigating, so you try another way. Maybe you have memorized the IP address of the machine and you can connect. More likely, you ask another resolver which still has the answer in its cache and resolve the IP that way. One thing is certain, the extra “mini-debug” step costs you precious time and detracts from debugging the real root cause.
Unavailable nameservers and the problems they cause are not unique to Cloudflare, and are not specific to our use case. Even if we hosted our authoritative nameservers with a single external provider, they could also experience their own issues causing the nameservers to fail.
Within the DNS community it is always understood that the more diversity, the better. Some common methods include diversifying network/routing configurations and software choices between a standard primary/secondary setup. However, no matter how resilient the network or software stack is, a single authority is still responsible for the zone. Luckily, there are ways to solve this problem!
Our Solution: Multiple Primary Nameservers
Our solution was to set up our infrastructure zone with multiple primary nameservers. This type of setup is referred to as split authority, multi-primary, or primary/primary. This way, instead of using just one provider for our authoritative nameservers, we use two.
We added three nameservers from our additional provider to our zone at our registrar. Using multiple primaries allows changes to our zone at each provider, to be controlled separately and completely by us. Instead of using zone transfers to keep our zone in sync, we use OctoDNS to independently and simultaneously manage the zone at both providers. We’ll talk more about our use of OctoDNS in a bit.
This setup is similar to using a primary and secondary server. The main difference is that the nameservers operate independently from one another, and do not use the usual DNS AXFR/IXFR method to keep the zone up to date. If you’d like to learn more about this type of solution, here is a great blog post by Dina Kozlov, our Product Manager for DNS, about Secondary DNS.
The nameservers in our zone after adding an additional provider would look something like:
Currently, we cannot coordinate which provider should be used when querying a record within the zone. Recursive resolvers have different methods of choosing which nameserver should be used when presented with multiple NS records. A popular choice is to use the server with the lowest RTT (round trip time). A great blog post from APNIC on recursive resolver authoritative nameserver selection can be consulted for a detailed explanation.
We needed to enforce specific routing decisions between the two authorities. Our requirement was for a weighted routing policy preferring Cloudflare based on availability checks for requests originating from our infrastructure servers. This reduces RTT, since the queries originate from the same servers hosting our nameservers in the same data center, and do not need to travel further to the external provider when all is well.
Our edge infrastructure servers are configured to use DNSDist as their primary system resolver. DNSDist load balances queries using multiple upstream recursive DNS servers (Unbound) in each data center to provide DNS resolution. This setup is used for internal DNS resolution only, and as such, it is independent from our authoritative DNS and public resolver 1.1.1.1 service.
Additionally, we modified our DNSDist configuration by adding two server pools for our infrastructure zone authoritative servers, and set up active checks with weighted routes to always use the Cloudflare pool when available. With the active checking and weighted routing in place, our queries are always routed internally when available. In the event of a Cloudflare authoritative DNS failure, DNSDist will route all requests for the zone to our external provider.
Maintaining Our Infrastructure DNS Zone
In addition to a more reliable infrastructure zone, we also wanted to further automate the provisioning of DNS records. We had been relying on an older manual tool that became quite slow handling our growing number of DNS records. In a nutshell, this tool queried our provisioning database to gather all of the machine names, and then created, deleted, or updated the required DNS records using the Cloudflare API. We had to run this tool whenever we provisioned or decommissioned machines that serve our customers’ requests.
Part of the procedure for running this tool was to first run it in dry-run mode, and then paste the results for review in our team chat room. This review step ensured the changes the tool found were expected and safe to run, and it is something we want to keep as part of our plan to automate the process.
Here’s what the old tool looked like:
$ cf-provision update-example -l ${USER}@cloudflare.com -u
Running update-example.sh -t /var/tmp/cf-provision -l [email protected] -u
* Loading up possible records …

deleting: {"name":"node44.example.com","ttl":300, "type":"A","content":"192.0.2.2","proxied":false}
 rec_id:abcdefg
updating: { "name":"build-ts.example.com", "ttl":120, "type":"TXT", "content":"1596722274"} rec_id:123456 previous content: 1596712896

Result    : SUCCESS
Task      : BUILD
Dest dir  :
Started   : Thu, 06 Aug 2020 13:57:40 +0000
Finished  : Thu, 06 Aug 2020 13:58:16 +0000
Elapsed   : 36 secs
Records Changed In API  : 1 record(s) changed
Records Deleted In API  : 1 record(s) deleted
Zone Management with OctoDNS
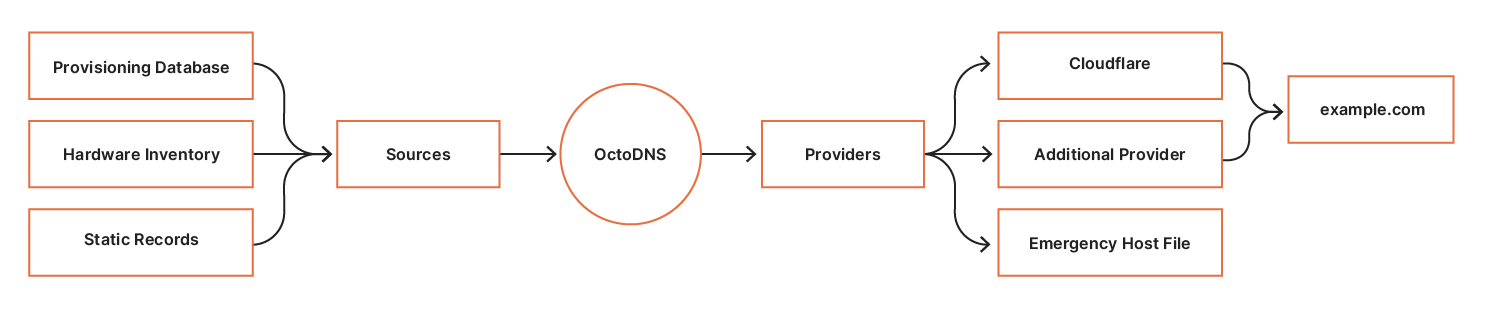
As we mentioned earlier, when using a multi-primary setup for our infrastructure zone, we are required to maintain the zone data outside of traditional DNS replication. Before rolling out our own solution we wanted to see what was out there, and we stumbled upon OctoDNS, a project from GitHub. OctoDNS provides a set of tools that make it easy to manage your DNS records across multiple providers.
OctoDNS uses a pluggable architecture. This means we can rewrite our old script as a plugin (which is called a ‘source’), and use other existing provider plugins (called ‘providers’) to interact with both the Cloudflare and our other provider’s APIs. Should we decide to sync to more external DNS providers in the future, we would just need to add them to our OctoDNS configuration. This allows our records to stay up to date, and, as an added benefit, records OctoDNS doesn’t know about will be removed during operation (for example, changes made outside of OctoDNS). This ensures that manual changes do not diverge from what is present in the provisioning database.
Our goal was to keep the zone management workflow as simple as possible. At Cloudflare, we use TeamCity for CI/CD, and we realized that it could not only facilitate code builds of our OctoDNS implementation, but it could also be used to deploy the zone.
There are a number of benefits to using our existing TeamCity infrastructure.
Our DevTools team can reliably manage it as a service
It has granular permissions, which allow us to control who can deploy the changes
It provides storage of the logs for auditing
It allows easy rollback of zone revisions
It integrates easily with our chat ops workflow via Google Chat webhooks
Below is a high-level overview of how we manage our zone through OctoDNS.
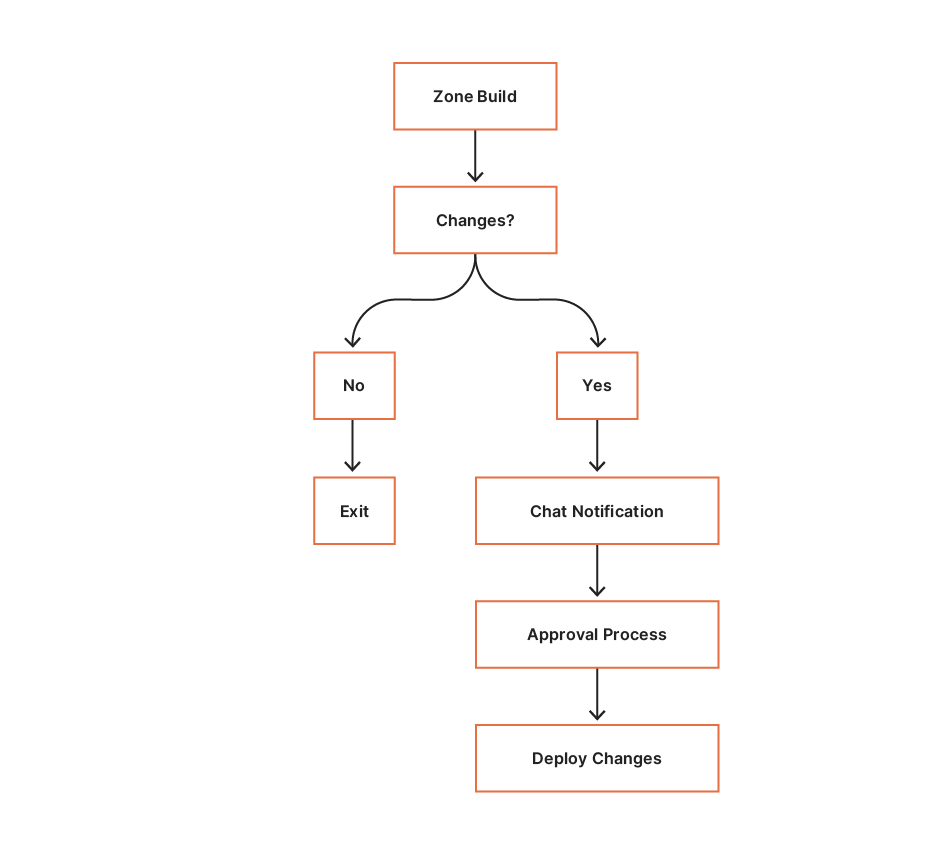
There are three steps in the workflow:
Build – evaluate the sources and build the complete zone.
Compare – parse the built zone and compare to the records on the providers. Changes found are sent to SRE for evaluation.
Deploy – deploy the changes to the providers.
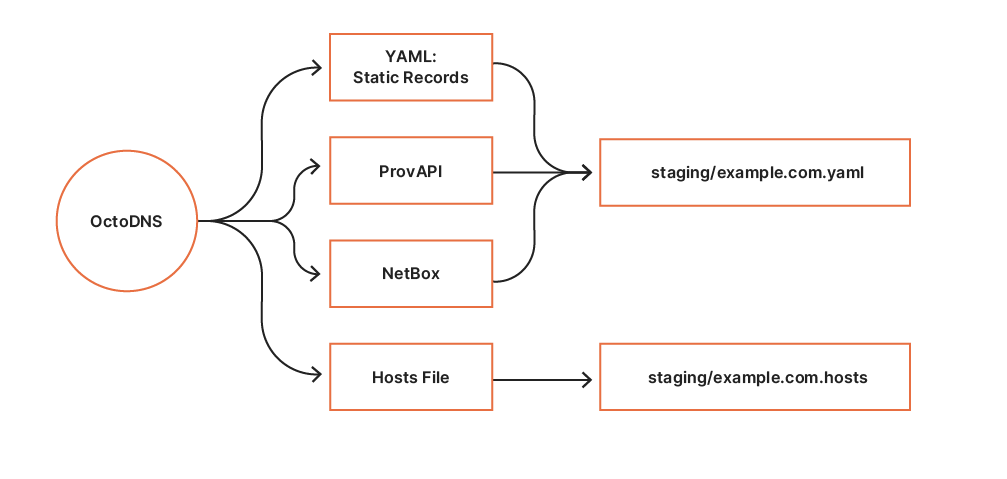
Step 1: Build
Sources OctoDNS consumes data from our internal systems via custom source modules. So far, we have built two source modules for querying data:
ProvAPI queries our internal provisioning API providing data center and node configuration.
Additionally, static records are defined in a YAML file. These sources form the infrastructure zone source of truth.
Providers The build process establishes a staging area per execution. The YAML provider builds a static YAML file containing the complete zone. The hosts file provider is used to generate an emergency hosts file for the zone. Contents from the staging area are revision controlled in CI, which allows us to easily deploy previous versions if required.
Step 2: Compare
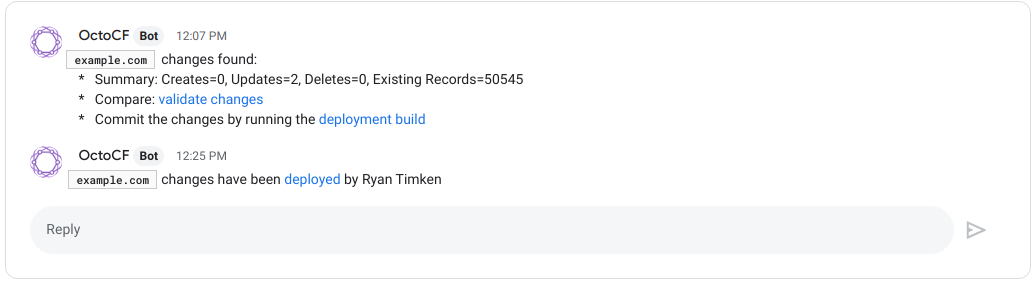
Following a successful zone build CI executes the compare build. During this phase, OctoDNS performs an octodns-sync in dry-run mode. The compare build consumes the staging YAML zone configuration, and compares the records against the records on our authoritative providers via their respective APIs. Any identified zone changes are parsed, and a summary line is generated and sent to the SRE Chat room for approval. SRE are automatically linked to the changes and associated CI build for deployment.
Step 3: Deploy
The deployment CI build is access-controlled and scoped to the SRE group using our single sign-on provider. Following successful approval and peer review, an SRE can deploy the changes by executing the deploy build.
The deployment process is simple; consume the YAML zone data from our staging area and deploy the changes to the zone’s authoritative providers via ‘octodns-sync –doit’. The hosts file generated for the zone is packaged and deployed, to be used in the event of complete DNS failure.
Here’s an example of how the message looks. When the deploy is finished, the thread is updated to indicate which user initiated it.
Future Improvements
In the future, we would like to automate the process further by reducing the need for approvals. There is usually no harm in adding new records, and it is done very often during the provisioning of new machines. Removing the need to approve those records would take out another step in the provisioning process, which is something we are always looking to optimize.
Introducing OctoDNS and an additional provider allowed us to make our infrastructure DNS zone more reliable and easier to manage. We can now easily include new sources of record data, with OctoDNS allowing us to focus more on new and exciting projects and less on managing DNS records.
As the scale of Cloudflare’s edge network has grown, we sometimes reach the limits of parts of our architecture. About two years ago we realized that our existing solution for spreading load within our data centers could no longer meet our needs. We embarked on a project to deploy a Layer 4 Load Balancer, internally called Unimog, to improve the reliability and operational efficiency of our edge network. Unimog has now been deployed in production for over a year.
This post explains the problems Unimog solves and how it works. Unimog builds on techniques used in other Layer 4 Load Balancers, but there are many details of its implementation that are tailored to the needs of our edge network.
The role of Unimog in our edge network
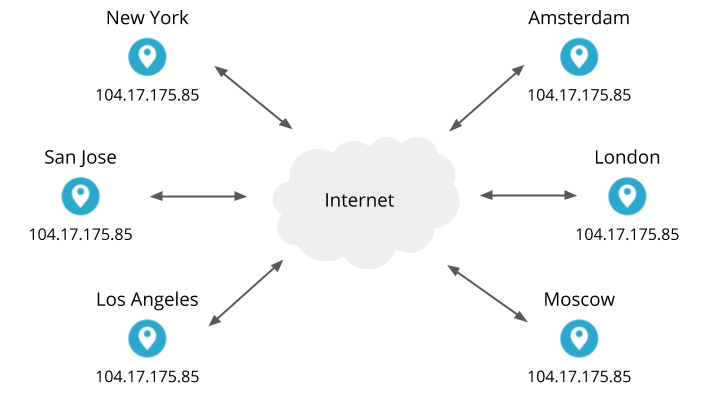
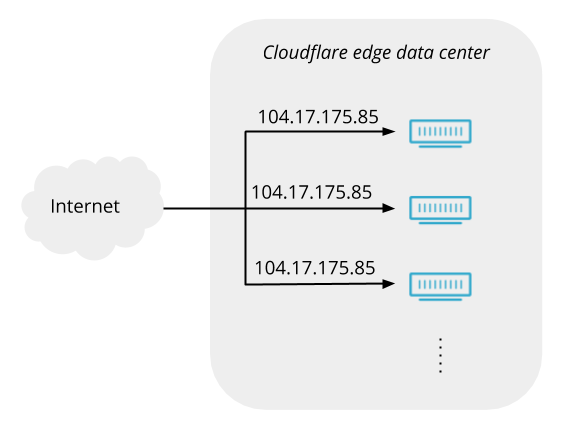
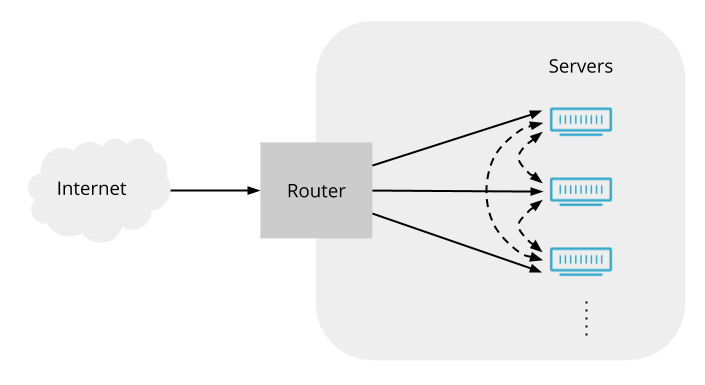
Cloudflare operates an anycast network, meaning that our data centers in 200+ cities around the world serve the same IP addresses. For example, our own cloudflare.com website uses Cloudflare services, and one of its IP addresses is 104.17.175.85. All of our data centers will accept connections to that address and respond to HTTP requests. By the magic of Internet routing, when you visit cloudflare.com and your browser connects to 104.17.175.85, your connection will usually go to the closest (and therefore fastest) data center.
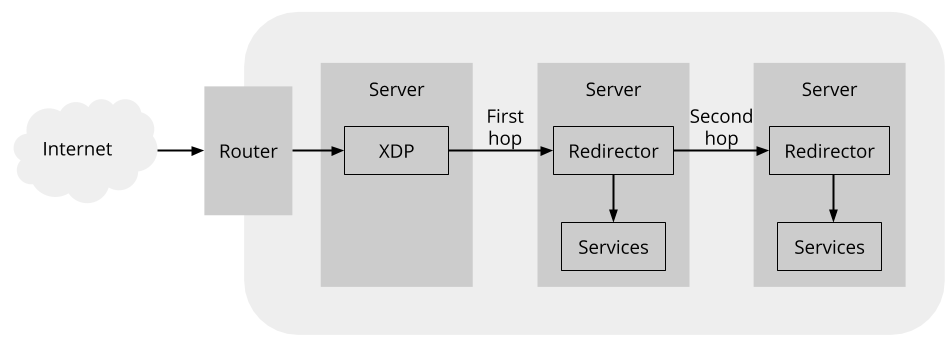
Inside those data centers are many servers. The number of servers in each varies greatly (the biggest data centers have a hundred times more servers than the smallest ones). The servers run the application services that implement our products (our caching, DNS, WAF, DDoS mitigation, Spectrum, WARP, etc). Within a single data center, any of the servers can handle a connection for any of our services on any of our anycast IP addresses. This uniformity keeps things simple and avoids bottlenecks.
But if any server within a data center can handle any connection, when a connection arrives from a browser or some other client, what controls which server it goes to? That’s the job of Unimog.
There are two main reasons why we need this control. The first is that we regularly move servers in and out of operation, and servers should only receive connections when they are in operation. For example, we sometimes remove a server from operation in order to perform maintenance on it. And sometimes servers are automatically removed from operation because health checks indicate that they are not functioning correctly.
The second reason concerns the management of the load on the servers (by load we mean the amount of computing work each one needs to do). If the load on a server exceeds the capacity of its hardware resources, then the quality of service to users will suffer. The performance experienced by users degrades as a server approaches saturation, and if a server becomes sufficiently overloaded, users may see errors. We also want to prevent servers being underloaded, which would reduce the value we get from our investment in hardware. So Unimog ensures that the load is spread across the servers in a data center. This general idea is called load balancing (balancing because the work has to be done somewhere, and so for the load on one server to go down, the load on some other server must go up).
Note that in this post, we’ll discuss how Cloudflare balances the load on its own servers in edge data centers. But load balancing is a requirement that occurs in many places in distributed computing systems. Cloudflare also has a Layer 7 Load Balancing product to allow our customers to balance load across their servers. And Cloudflare uses load balancing in other places internally.
Deploying Unimog led to a big improvement in our ability to balance the load on our servers in our edge data centers. Here’s a chart for one data center, showing the difference due to Unimog. Each line shows the processor utilization of an individual server (the colour of the lines indicates server model). The load on the servers varies during the day with the activity of users close to this data center.The white line marks the point when we enabled Unimog. You can see that after that point, the load on the servers became much more uniform. We saw similar results when we deployed Unimog to our other data centers.
How Unimog compares to other load balancers
There are a variety of techniques for load balancing. Unimog belongs to a category called Layer 4 Load Balancers (L4LBs). L4LBs direct packets on the network by inspecting information up to layer 4 of the OSI network model, which distinguishes them from the more common Layer 7 Load Balancers.
The advantage of L4LBs is their efficiency. They direct packets without processing the payload of those packets, so they avoid the overheads associated with higher level protocols. For any load balancer, it’s important that the resources consumed by the load balancer are low compared to the resources devoted to useful work. At Cloudflare, we already pay close attention to the efficient implementation of our services, and that sets a high bar for the load balancer that we put in front of those services.
The downside of L4LBs is that they can only control which connections go to which servers. They cannot modify the data going over the connection, which prevents them from participating in higher-level protocols like TLS, HTTP, etc. (in contrast, Layer 7 Load Balancers act as proxies, so they can modify data on the connection and participate in those higher-level protocols).
L4LBs are not new. They are mostly used at companies which have scaling needs that would be hard to meet with L7LBs alone. Google has published about Maglev, Facebook open-sourced Katran, and Github has open-sourced their GLB.
Unimog is the L4LB that Cloudflare has built to meet the needs of our edge network. It shares features with other L4LBs, and it is particularly strongly influenced by GLB. But there are some requirements that were not well-served by existing L4LBs, leading us to build our own:
Unimog is designed to run on the same general-purpose servers that provide application services, rather than requiring a separate tier of servers dedicated to load balancing.
It performs dynamic load balancing: measurements of server load are used to adjust the number of connections going to each server, in order to accurately balance load.
It supports long-lived connections that remain established for days.
Virtual IP addresses are managed as ranges (Cloudflare serves hundreds of thousands of IPv4 addresses on behalf of our customers, so it is impractical to configure these individually).
Unimog is tightly integrated with our existing DDoS mitigation system, and the implementation relies on the same XDP technology in the Linux kernel.
The rest of this post describes these features and the design and implementation choices that follow from them in more detail.
For Unimog to balance load, it’s not enough to send the same (or approximately the same) number of connections to each server, because the performance of our servers varies. We regularly update our server hardware, and we’re now on our 10th generation. Once we deploy a server, we keep it in service for as long as it is cost effective, and the lifetime of a server can be several years. It’s not unusual for a single data center to contain a mix of server models, due to expansion and upgrades over time. Processor performance has increased significantly across our server generations. So within a single data center, we need to send different numbers of connections to different servers to utilize the same percentage of their capacity.
It’s also not enough to give each server a fixed share of connections based on static estimates of their capacity. Not all connections consume the same amount of CPU. And there are other activities running on our servers and consuming CPU that are not directly driven by connections from clients. So in order to accurately balance load across servers, Unimog does dynamic load balancing: it takes regular measurements of the load on each of our servers, and uses a control loop that increases or decreases the number of connections going to each server so that their loads converge to an appropriate value.
Refresher: TCP connections
The relationship between TCP packets and connections is central to the operation of Unimog, so we’ll briefly describe that relationship.
(Unimog supports UDP as well as TCP, but for clarity most of this post will focus on the TCP support. We explain how UDP support differs towards the end.)
Here is the outline of a TCP packet:
The TCP connection that this packet belongs to is identified by the four labelled header fields, which span the IPv4/IPv6 (i.e. layer 3) and TCP (i.e. layer 4) headers: the source and destination addresses, and the source and destination ports. Collectively, these four fields are known as the 4-tuple. When we say the Unimog sends a connection to a server, we mean that all the packets with the 4-tuple identifying that connection are sent to that server.
A TCP connection is established via a three-way handshake between the client and the server handling that connection. Once a connection has been established, it is crucial that all the incoming packets for that connection go to that same server. If a TCP packet belonging to the connection is sent to a different server, it will signal the fact that it doesn’t know about the connection to the client with a TCP RST (reset) packet. Upon receiving this notification, the client terminates the connection, probably resulting in the user seeing an error. So a misdirected packet is much worse than a dropped packet. As usual, we consider the network to be unreliable, and it’s fine for occasional packets to be dropped. But even a single misdirected packet can lead to a broken connection.
Cloudflare handles a wide variety of connections on behalf of our customers. Many of these connections carry HTTP, and are typically short lived. But some HTTP connections are used for websockets, and can remain established for hours or days. Our Spectrum product supports arbitrary TCP connections. TCP connections can be terminated or stall for many reasons, and ideally all applications that use long-lived connections would be able to reconnect transparently, and applications would be designed to support such reconnections. But not all applications and protocols meet this ideal, so we strive to maintain long-lived connections. Unimog can maintain connections that last for many days.
Forwarding packets
The previous section described that the function of Unimog is to steer connections to servers. We’ll now explain how this is implemented.
To start with, let’s consider how one of our data centers might look without Unimog or any other load balancer. Here’s a conceptual view:
Packets arrive from the Internet, and pass through the router, which forwards them on to servers (in reality there is usually additional network infrastructure between the router and the servers, but it doesn’t play a significant role here so we’ll ignore it).
But is such a simple arrangement possible? Can the router spread traffic over servers without some kind of load balancer in between? Routers have a feature called ECMP (equal cost multipath) routing. Its original purpose is to allow traffic to be spread across multiple paths between two locations, but it is commonly repurposed to spread traffic across multiple servers within a data center. In fact, Cloudflare relied on ECMP alone to spread load across servers before we deployed Unimog. ECMP uses a hashing scheme to ensure that packets on a given connection use the same path (Unimog also employs a hashing scheme, so we’ll discuss how this can work in further detail below) . But ECMP is vulnerable to changes in the set of active servers, such as when servers go in and out of service. These changes cause rehashing events, which break connections to all the servers in an ECMP group. Also, routers impose limits on the sizes of ECMP groups, which means that a single ECMP group cannot cover all the servers in our larger edge data centers. Finally, ECMP does not allow us to do dynamic load balancing by adjusting the share of connections going to each server. These drawbacks mean that ECMP alone is not an effective approach.
Ideally, to overcome the drawbacks of ECMP, we could program the router with the appropriate logic to direct connections to servers in the way we want. But although programmable network data planes have been a hot research topic in recent years, commodity routers are still essentially fixed-function devices.
We can work around the limitations of routers by having the router send the packets to some load balancing servers, and then programming those load balancers to forward packets as we want. If the load balancers all act on packets in a consistent way, then it doesn’t matter which load balancer gets which packets from the router (so we can use ECMP to spread packets across the load balancers). That suggests an arrangement like this:
And indeed L4LBs are often deployed like this.
Instead, Unimog makes every server into a load balancer. The router can send any packet to any server, and that initial server will forward the packet to the right server for that connection:
We have two reasons to favour this arrangement:
First, in our edge network, we avoid specialised roles for servers. We run the same software stack on the servers in our edge network, providing all of our product features, whether DDoS attack prevention, website performance features, Cloudflare Workers, WARP, etc. This uniformity is key to the efficient operation of our edge network: we don’t have to manage how many load balancers we have within each of our data centers, because all of our servers act as load balancers.
The second reason relates to stopping attacks. Cloudflare’s edge network is the target of incessant attacks. Some of these attacks are volumetric – large packet floods which attempt to overwhelm the ability of our data centers to process network traffic from the Internet, and so impact our ability to service legitimate traffic. To successfully mitigate such attacks, it’s important to filter out attack packets as early as possible, minimising the resources they consume. This means that our attack mitigation system needs to occur before the forwarding done by Unimog. That mitigation system is called l4drop, and we’ve written about it before. l4drop and Unimog are closely integrated. Because l4drop runs on all of our servers, and because l4drop comes before Unimog, it’s natural for Unimog to run on all of our servers too.
XDP and xdpd
Unimog implements packet forwarding using a Linux kernel facility called XDP. XDP allows a program to be attached to a network interface, and the program gets run for every packet that arrives, before it is processed by the kernel’s main network stack. The XDP program returns an action code to tell the kernel what to do with the packet:
PASS: Pass the packet on to the kernel’s network stack for normal processing.
DROP: Drop the packet. This is the basis for l4drop.
TX: Transmit the packet back out of the network interface. The XDP program can modify the packet data before transmission. This action is the basis for Unimog forwarding.
XDP programs run within the kernel, making this an efficient approach even at high packet rates. XDP programs are expressed as eBPF bytecode, and run within an in-kernel virtual machine. Upon loading an XDP program, the kernel compiles its eBPF code into machine code. The kernel also verifies the program to check that it does not compromise security or stability. eBPF is not only used in the context of XDP: many recent Linux kernel innovations employ eBPF, as it provides a convenient and efficient way to extend the behaviour of the kernel.
XDP is much more convenient than alternative approaches to packet-level processing, particularly in our context where the servers involved also have many other tasks. We have continued to enhance Unimog since its initial deployment. Our deployment model for new versions of our Unimog XDP code is essentially the same as for userspace services, and we are able to deploy new versions on a weekly basis if needed. Also, established techniques for optimizing the performance of the Linux network stack provide good performance for XDP.
There are two main alternatives for efficient packet-level processing:
Kernel-bypass networking (such as DPDK), where a program in userspace manages a network interface (or some part of one) directly without the involvement of the kernel. This approach works best when servers can be dedicated to a network function (due to the need to dedicate processor or network interface hardware resources, and awkward integration with the normal kernel network stack; see our old post about this). But we avoid putting servers in specialised roles. (Github’s open-source GLB uses DPDK, and this is one of the main factors that made GLB unsuitable for us.)
Kernel modules, where code is added to the kernel to perform the necessary network functions. The Linux IPVS (IP Virtual Server) subsystem falls into this category. But developing, testing, and deploying kernel modules is cumbersome compared to XDP.
The following diagram shows an overview of our use of XDP. Both l4drop and Unimog are implemented by an XDP program. l4drop matches attack packets, and uses the DROP action to discard them. Unimog forwards packets, using the TX action to resend them. Packets that are not dropped or forwarded pass through to the normal Linux network stack. To support our elaborate use of XPD, we have developed the xdpd daemon which performs the necessary supervisory and support functions for our XDP programs.
Rather than a single XDP program, we have a chain of XDP programs that must be run for each packet (l4drop, Unimog, and others we have not covered here). One of the responsibilities of xdpd is to prepare these programs, and to make the appropriate system calls to load them and assemble the full chain.
Our XDP programs come from two sources. Some are developed in a conventional way: engineers write C code, our build system compiles it (with clang) to eBPF ELF files, and our release system deploys those files to our servers. Our Unimog XDP code works like this. In contrast, the l4drop XDP code is dynamically generated by xdpd based on information it receives from attack detection systems.
xdpd has many other duties to support our use of XDP:
XDP programs can be supplied with data using data structures called maps. xdpd populates the maps needed by our programs, based on information received from control planes.
Programs (for instance, our Unimog XDP program) may depend upon configuration values which are fixed while the program runs, but do not have universal values known at the time their C code was compiled. It would be possible to supply these values to the program via maps, but that would be inefficient (retrieving a value from a map requires a call to a helper function). So instead, xdpd will fix up the eBPF program to insert these constants before it is loaded.
Cloudflare carefully monitors the behaviour of all our software systems, and this includes our XDP programs: They emit metrics (via another use of maps), which xdpd exposes to our metrics and alerting system (prometheus).
When we deploy a new version of xdpd, it gracefully upgrades in such a way that there is no interruption to the operation of Unimog or l4drop.
Although the XDP programs are written in C, xdpd itself is written in Go. Much of its code is specific to Cloudflare. But in the course of developing xdpd, we have collaborated with Cilium to develop https://github.com/cilium/ebpf, an open source Go library that provides the operations needed by xdpd for manipulating and loading eBPF programs and related objects. We’re also collaborating with the Linux eBPF community to share our experience, and extend the core eBPF technology in ways that make features of xdpd obsolete.
In evaluating the performance of Unimog, our main concern is efficiency: that is, the resources consumed for load balancing relative to the resources used for customer-visible services. Our measurements show that Unimog costs less than 1% of the processor utilization, compared to a scenario where no load balancing is in use. Other L4LBs, intended to be used with servers dedicated to load balancing, may place more emphasis on maximum throughput of packets. Nonetheless, our experience with Unimog and XDP in general indicates that the throughput is more than adequate for our needs, even during large volumetric attacks.
Unimog is not the first L4LB to use XDP. In 2018, Facebook open sourced Katran, their XDP-based L4LB data plane. We considered the possibility of reusing code from Katran. But it would not have been worthwhile: the core C code needed to implement an XDP-based L4LB is relatively modest (about 1000 lines of C, both for Unimog and Katran). Furthermore, we had requirements that were not met by Katran, and we also needed to integrate with existing components and systems at Cloudflare (particularly l4drop). So very little of the code could have been reused as-is.
Encapsulation
As discussed as the start of this post, clients make connections to one of our edge data centers with a destination IP address that can be served by any one of our servers. These addresses that do not correspond to a specific server are known as virtual IPs (VIPs). When our Unimog XDP program forwards a packet destined to a VIP, it must replace that VIP address with the direct IP (DIP) of the appropriate server for the connection, so that when the packet is retransmitted it will reach that server. But it is not sufficient to overwrite the VIP in the packet headers with the DIP, as that would hide the original destination address from the server handling the connection (the original destination address is often needed to correctly handle the connection).
Instead, the packet must be encapsulated: Another set of packet headers is prepended to the packet, so that the original packet becomes the payload in this new packet. The DIP is then used as the destination address in the outer headers, but the addressing information in the headers of the original packet is preserved. The encapsulated packet is then retransmitted. Once it reaches the target server, it must be decapsulated: the outer headers are stripped off to yield the original packet as if it had arrived directly.
Encapsulation is a general concept in computer networking, and is used in a variety of contexts. The headers to be added to the packet by encapsulation are defined by an encapsulation format. Many different encapsulation formats have been defined within the industry, tailored to the requirements in specific contexts. Unimog uses a format called GUE (Generic UDP Encapsulation), in order to allow us to re-use the glb-redirect component from github’s GLB (glb-redirect is discussed below).
GUE is a relatively simple encapsulation format. It encapsulates within a UDP packet, placing a GUE-specific header between the outer IP/UDP headers and the payload packet to allow extension data to be carried (and we’ll see how Unimog takes advantage of this):
When an encapsulated packet arrives at a server, the encapsulation process must be reversed. This step is called decapsulation. The headers that were added during the encapsulation process are removed, leaving the original packet to be processed by the network stack as if it had arrived directly from the client.
An issue that can arise with encapsulation is hitting limits on the maximum packet size, because the encapsulation process makes packets larger. The de-facto maximum packet size on the Internet is 1500 bytes, and not coincidentally this is also the maximum packet size on ethernet networks. For Unimog, encapsulating a 1500-byte packet results in a 1536-byte packet. To allow for these enlarged encapsulated packets, we have enabled jumbo frames on the networks inside our data centers, so that the 1500-byte limit only applies to packets headed out to the Internet.
Forwarding logic
So far, we have described the technology used to implement the Unimog load balancer, but not how our Unimog XDP program selects the DIP address when forwarding a packet. This section describes the basic scheme. But as we’ll see, there is a problem, so then we’ll describe how this scheme is elaborated to solve that problem.
In outline, our Unimog XDP program processes each packet in the following way:
Determine whether the packet is destined for a VIP address. Not all of the packets arriving at a server are for VIP addresses. Other packets are passed through for normal handling by the kernel’s network stack. (xdpd obtains the VIP address ranges from the Unimog control plane.)
Determine the DIP for the server handling the packet’s connection.
Encapsulate the packet, and retransmit it to the DIP.
In step 2, note that all the load balancers must act consistently – when forwarding packets, they must all agree about which connections go to which servers. The rate of new connections arriving at a data center is large, so it’s not practical for load balancers to agree by communicating information about connections amongst themselves. Instead L4LBs adopt designs which allow the load balancers to reach consistent forwarding decisions independently. To do this, they rely on hashing schemes: Take the 4-tuple identifying the packet’s connection, put it through a hash function to obtain a key (the hash function ensures that these key values are uniformly distributed), then perform some kind of lookup into a data structure to turn the key into the DIP for the target server.
Unimog uses such a scheme, with a data structure that is simple compared to some other L4LBs. We call this data structure the forwarding table, and it consists of an array where each entry contains a DIP specifying the server target server for the relevant packets (we call these entries buckets). The forwarding table is generated by the Unimog control plane and broadcast to the load balancers (more on this below), so that it has the same contents on all load balancers.
To look up a packet’s key in the forwarding table, the low N bits from the key are used as the index for a bucket (the forwarding table is always a power-of-2 in size):
Note that this approach does not provide per-connection control – each bucket typically applies to many connections. All load balancers in a data center use the same forwarding table, so they all forward packets in a consistent manner. This means it doesn’t matter which packets are sent by the router to which servers, and so ECMP re-hashes are a non-issue. And because the forwarding table is immutable and simple in structure, lookups are fast.
Although the above description only discusses a single forwarding table, Unimog supports multiple forwarding tables, each one associated with a trafficset – the traffic destined for a particular service. Ranges of VIP addresses are associated with a trafficset. Each trafficset has its own configuration settings and forwarding tables. This gives us the flexibility to differentiate how Unimog behaves for different services.
Precise load balancing requires the ability to make fine adjustments to the number of connections arriving at each server. So we make the number of buckets in the forwarding table more than 100 times the number of servers. Our data centers can contain hundreds of servers, and so it is normal for a Unimog forwarding table to have tens of thousands of buckets. The DIP for a given server is repeated across many buckets in the forwarding table, and by increasing or decreasing the number of buckets that refer to a server, we can control the share of connections going to that server. Not all buckets will correspond to exactly the same number of connections at a given point in time (the properties of the hash function make this a statistical matter). But experience with Unimog has demonstrated that the relationship between the number of buckets and resulting server load is sufficiently strong to allow for good load balancing.
But as mentioned, there is a problem with this scheme as presented so far. Updating a forwarding table, and changing the DIPs in some buckets, would break connections that hash to those buckets (because packets on those connections would get forwarded to a different server after the update). But one of the requirements for Unimog is to allow us to change which servers get new connections without impacting the existing connections. For example, sometimes we want to drain the connections to a server, maintaining the existing connections to that server but not forwarding new connections to it, in the expectation that many of the existing connections will terminate of their own accord. The next section explains how we fix this scheme to allow such changes.
Maintaining established connections
To make changes to the forwarding table without breaking established connections, Unimog adopts the “daisy chaining” technique described in the paper Stateless Datacenter Load-balancing with Beamer.
To understand how the Beamer technique works, let’s look at what can go wrong when a forwarding table changes: imagine the forwarding table is updated so that a bucket which contained the DIP of server A now refers to server B. A packet that would formerly have been sent to A by the load balancers is now sent to B. If that packet initiates a new connection (it’s a TCP SYN packet), there’s no problem – server B will continue the three-way handshake to complete the new connection. On the other hand, if the packet belongs to a connection established before the change, then the TCP implementation of server B has no matching TCP socket, and so sends a RST back to the client, breaking the connection.
This explanation hints at a solution: the problem occurs when server B receives a forwarded packet that does not match a TCP socket. If we could change its behaviour in this case to forward the packet a second time to the DIP of server A, that would allow the connection to server A to be preserved. For this to work, server B needs to know the DIP for the bucket before the change.
To accomplish this, we extend the forwarding table so that each bucket has two slots, each containing the DIP for a server. The first slot contains the current DIP, which is used by the load balancer to forward packets as discussed (and here we refer to this forwarding as the first hop). The second slot preserves the previous DIP (if any), in order to allow the packet to be forwarded again on a second hop when necessary.
For example, imagine we have a forwarding table that refers to servers A, B, and C, and then it is updated to stop new connections going to server A, but maintaining established connections to server A. This is achieved by replacing server A’s DIP in the first slot of any buckets where it appears, but preserving it in the second slot:
In addition to extending the forwarding table, this approach requires a component on each server to forward packets on the second hop when necessary. This diagram shows where this redirector fits into the path a packet can take:
The redirector follows some simple logic to decide whether to process a packet locally on the first-hop server or to forward it on the second-hop server:
If the packet is a SYN packet, initiating a new connection, then it is always processed by the first-hop server. This ensures that new connections go to the first-hop server.
For other packets, the redirector checks whether the packet belongs to a connection with a corresponding TCP socket on the first-hop server. If so, it is processed by that server.
Otherwise, the packet has no corresponding TCP socket on the first-hop server. So it is forwarded on to the second-hop server to be processed there (in the expectation that it belongs to some connection established on the second-hop server that we wish to maintain).
In that last step, the redirector needs to know the DIP for the second hop. To avoid the need for the redirector to do forwarding table lookups, the second-hop DIP is placed into the encapsulated packet by the Unimog XDP program (which already does a forwarding table lookup, so it has easy access to this value). This second-hop DIP is carried in a GUE extension header, so that it is readily available to the redirector if it needs to forward the packet again.
This second hop, when necessary, does have a cost. But in our data centers, the fraction of forwarded packets that take the second hop is usually less than 1% (despite the significance of long-lived connections in our context). The result is that the practical overhead of the second hops is modest.
When we initially deployed Unimog, we adopted the glb-redirect iptables module from github’s GLB to serve as the redirector component. In fact, some implementation choices in Unimog, such as the use of GUE, were made in order to facilitate this re-use. glb-redirect worked well for us initially, but subsequently we wanted to enhance the redirector logic. glb-redirect is a custom Linux kernel module, and developing and deploying changes to kernel modules is more difficult for us than for eBPF-based components such as our XDP programs. This is not merely due to Cloudflare having invested more engineering effort in software infrastructure for eBPF; it also results from the more explicit boundary between the kernel and eBPF programs (for example, we are able to run the same eBPF programs on a range of kernel versions without recompilation). We wanted to achieve the same ease of development for the redirector as for our XDP programs.
To that end, we decided to write an eBPF replacement for glb-redirect. While the redirector could be implemented within XDP, like our load balancer, practical concerns led us to implement it as a TC classifier program instead (TC is the traffic control subsystem within the Linux network stack). A downside to XDP is that the packet contents prior to processing by the XDP program are not visible using conventional tools such as tcpdump, complicating debugging. TC classifiers do not have this downside, and in the context of the redirector, which passes most packets through, the performance advantages of XDP would not be significant.
The result is cls-redirect, a redirector implemented as a TC classifier program. We have contributed our cls-redirect code as part of the Linux kernel test suite. In addition to implementing the redirector logic, cls-redirect also implements decapsulation, removing the need to separately configure GUE tunnel endpoints for this purpose.
There are some features suggested in the Beamer paper that Unimog does not implement:
Beamer embeds generation numbers in the encapsulated packets to address a potential corner case where a ECMP rehash event occurs at the same time as a forwarding table update is propagating from the control plane to the load balancers. Given the combination of circumstances required for a connection to be impacted by this issue, we believe that in our context the number of affected connections is negligible, and so the added complexity of the generation numbers is not worthwhile.
In the Beamer paper, the concept of daisy-chaining encompasses third hops etc. to preserve connections across a series of changes to a bucket. Unimog only uses two hops (the first and second hops above), so in general it can only preserve connections across a single update to a bucket. But our experience is that even with only two hops, a careful strategy for updating the forwarding tables permits connection lifetimes of days.
To elaborate on this second point: when the control plane is updating the forwarding table, it often has some choice in which buckets to change, depending on the event that led to the update. For example, if a server is being brought into service, then some buckets must be assigned to it (by placing the DIP for the new server in the first slot of the bucket). But there is a choice about which buckets. A strategy of choosing the least-recently modified buckets will tend to minimise the impact to connections.
Furthermore, when updating the forwarding table to adjust the balance of load between servers, Unimog often uses a novel trick: due to the redirector logic, exchanging the first-hop and second-hop DIPs for a bucket only affects which server receives new connections for that bucket, and never impacts any established connections. Unimog is able to achieve load balancing in our edge data centers largely through forwarding table changes of this type.
Control plane
So far, we have discussed the Unimog data plane – the part that processes network packets. But much of the development effort on Unimog has been devoted to the control plane – the part that generates the forwarding tables used by the data plane. In order to correctly maintain the forwarding tables, the control plane consumes information from multiple sources:
Server information: Unimog needs to know the set of servers present in a data center, some key information about each one (such as their DIP addresses), and their operational status. It also needs signals about transitional states, such as when a server is being withdrawn from service, in order to gracefully drain connections (preventing the server from receiving new connections, while maintaining its established connections).
Health: Unimog should only send connections to servers that are able to correctly handle those connections, otherwise those servers should be removed from the forwarding tables. To ensure this, it needs health information at the node level (indicating that a server is available) and at the service level (indicating that a service is functioning normally on a server).
Load: in order to balance load, Unimog needs information about the resource utilization on each server.
IP address information: Cloudflare serves hundreds of thousands of IPv4 addresses, and these are something that we have to treat as a dynamic resource rather than something statically configured.
The control plane is implemented by a process called the conductor. In each of our edge data centers, there is one active conductor, but there are also standby instances that will take over if the active instance goes away.
We use Hashicorp’s Consul in a number of ways in the Unimog control plane (we have an independent Consul server cluster in each data center):
Consul provides a key-value store, with support for blocking queries so that changes to values can be received promptly. We use this to propagate the forwarding tables and VIP address information from the conductor to xdpd on the servers.
Consul provides server- and service-level health checks. We use this as the source of health information for Unimog.
The conductor stores its state in the Consul KV store, and uses Consul’s distributed locks to ensure that only one conductor instance is active.
The conductor obtains server load information from Prometheus, which we already use for metrics throughout our systems. It balances the load across the servers using a control loop, periodically adjusting the forwarding tables to send more connections to underloaded servers and less connections to overloaded servers. The load for a server is defined by a Prometheus metric expression which measures processor utilization (with some intricacies to better handle characteristics of our workloads). The determination of whether a server is underloaded or overloaded is based on comparison with the average value of the load metric, and the adjustments made to the forwarding table are proportional to the deviation from the average. So the result of the feedback loop is that the load metric for all servers converges on the average.
Finally, the conductor queries internal Cloudflare APIs to obtain the necessary information on servers and addresses.
Unimog is a critical system: incorrect, poorly adjusted or stale forwarding tables could cause incoming network traffic to a data center to be dropped, or servers to be overloaded, to the point that a data center would have to be removed from service. To maintain a high quality of service and minimise the overhead of managing our many edge data centers, we have to be able to upgrade all components. So to the greatest extent possible, all components are able to tolerate brief absences of the other components without any impact to service. In some cases this is possible through careful design. In other cases, it requires explicit handling. For example, we have found that Consul can temporarily report inaccurate health information for a server and its services when the Consul agent on that server is restarted (for example, in order to upgrade Consul). So we implemented the necessary logic in the conductor to detect and disregard these transient health changes.
Unimog also forms a complex system with feedback loops: The conductor reacts to its observations of behaviour of the servers, and the servers react to the control information they receive from the conductor. This can lead to behaviours of the overall system that are hard to anticipate or test for. For instance, not long after we deployed Unimog we encountered surprising behaviour when data centers became overloaded. This is of course a scenario that we strive to avoid, and we have automated systems to remove traffic from overloaded data centers if it does. But if a data center became sufficiently overloaded, then health information from its servers would indicate that many servers were degraded to the point that Unimog would stop sending new connections to those servers. Under normal circumstances, this is the correct reaction to a degraded server. But if enough servers become degraded, diverting new connections to other servers would mean those servers became degraded, while the original servers were able to recover. So it was possible for a data center that became temporarily overloaded to get stuck in a state where servers oscillated between healthy and degraded, even after the level of demand on the data center had returned to normal. To correct this issue, the conductor now has logic to distinguish between isolated degraded servers and such data center-wide problems. We have continued to improve Unimog in response to operational experience, ensuring that it behaves in a predictable manner over a wide range of conditions.
UDP Support
So far, we have described Unimog’s support for directing TCP connections. But Unimog also supports UDP traffic. UDP does not have explicit connections between clients and servers, so how it works depends upon how the UDP application exchanges packets between the client and server. There are a few cases of interest:
Request-response UDP applications
Some applications, such as DNS, use a simple request-response pattern: the client sends a request packet to the server, and expects a response packet in return. Here, there is nothing corresponding to a connection (the client only sends a single packet, so there is no requirement to make sure that multiple packets arrive at the same server). But Unimog can still provide value by spreading the requests across our servers.
To cater to this case, Unimog operates as described in previous sections, hashing the 4-tuple from the packet headers (the source and destination IP addresses and ports). But the Beamer daisy-chaining technique that allows connections to be maintained does not apply here, and so the buckets in the forwarding table only have a single slot.
UDP applications with flows
Some UDP applications have long-lived flows of packets between the client and server. Like TCP connections, these flows are identified by the 4-tuple. It is necessary that such flows go to the same server (even when Cloudflare is just passing a flow through to the origin server, it is convenient for detecting and mitigating certain kinds of attack to have that flow pass through a single server within one of Cloudflare’s data centers).
It’s possible to treat these flows by hashing the 4-tuple, skipping the Beamer daisy-chaining technique as for request-response applications. But then adding servers will cause some flows to change servers (this would effectively be a form of consistent hashing). For UDP applications, we can’t say in general what impact this has, as we can for TCP connections. But it’s possible that it causes some disruption, so it would be nice to avoid this.
So Unimog adapts the daisy-chaining technique to apply it to UDP flows. The outline remains similar to that for TCP: the same redirector component on each server decides whether to send a packet on a second hop. But UDP does not have anything corresponding to TCP’s SYN packet that indicates a new connection. So for UDP, the part that depends on SYNs is removed, and the logic applied for each packet becomes:
The redirector checks whether the packet belongs to a connection with a corresponding UDP socket on the first-hop server. If so, it is processed by that server.
Otherwise, the packet has no corresponding TCP socket on the first-hop server. So it is forwarded on to the second-hop server to be processed there (in the expectation that it belongs to some flow established on the second-hop server that we wish to maintain).
Although the change compared to the TCP logic is not large, it has the effect of switching the roles of the first- and second-hop servers: For UDP, new flows go to the second-hop server. The Unimog control plane has to take account of this when it updates a forwarding table. When it introduces a server into a bucket, that server should receive new connections or flows. For a TCP trafficset, this means it becomes the first-hop server. For UDP trafficset, it must become the second-hop server.
This difference between handling of TCP and UDP also leads to higher overheads for UDP. In the case of TCP, as new connections are formed and old connections terminate over time, fewer packets will require the second hop, and so the overhead tends to diminish. But with UDP, new connections always involve the second hop. This is why we differentiate the two cases, taking advantage of SYN packets in the TCP case.
The UDP logic also places a requirement on services. The redirector must be able to match packets to the corresponding sockets on a server according to their 4-tuple. This is not a problem in the TCP case, because all TCP connections are represented by connected sockets in the BSD sockets API (these sockets are obtained from an accept system call, so that they have a local address and a peer address, determining the 4-tuple). But for UDP, unconnected sockets (lacking a declared peer address) can be used to send and receive packets. So some UDP services only use unconnected sockets. For the redirector logic above to work, services must create connected UDP sockets in order to expose their flows to the redirector.
UDP applications with sessions
Some UDP-based protocols have explicit sessions, with a session identifier in each packet. Session identifiers allow sessions to persist even if the 4-tuple changes. This happens in mobility scenarios – for example, if a mobile device passes from a WiFi to a cellular network, causing its IP address to change. An example of a UDP-based protocol with session identifiers is QUIC (which calls them connection IDs).
Our Unimog XDP program allows a flow dissector to be configured for different trafficsets. The flow dissector is the part of the code that is responsible for taking a packet and extracting the value that identifies the flow or connection (this value is then hashed and used for the lookup into the forwarding table). For TCP and UDP, there are default flow dissectors that extract the 4-tuple. But specialised flow dissectors can be added to handle UDP-based protocols.
We have used this functionality in our WARP product. We extended the Wireguard protocol used by WARP in a backwards-compatible way to include a session identifier, and added a flow dissector to Unimog to exploit it. There are more details in our post on the technical challenges of WARP.
Conclusion
Unimog has been deployed to all of Cloudflare’s edge data centers for over a year, and it has become essential to our operations. Throughout that time, we have continued to enhance Unimog (many of the features described here were not present when it was first deployed). So the ease of developing and deploying changes, due to XDP and xdpd, has been a significant benefit. Today we continue to extend it, to support more services, and to help us manage our traffic and the load on our servers in more contexts.
The collective thoughts of the interwebz
Manage Consent
To provide the best experiences, we use technologies like cookies to store and/or access device information. Consenting to these technologies will allow us to process data such as browsing behavior or unique IDs on this site. Not consenting or withdrawing consent, may adversely affect certain features and functions.
Functional
Always active
The technical storage or access is strictly necessary for the legitimate purpose of enabling the use of a specific service explicitly requested by the subscriber or user, or for the sole purpose of carrying out the transmission of a communication over an electronic communications network.
Preferences
The technical storage or access is necessary for the legitimate purpose of storing preferences that are not requested by the subscriber or user.
Statistics
The technical storage or access that is used exclusively for statistical purposes.The technical storage or access that is used exclusively for anonymous statistical purposes. Without a subpoena, voluntary compliance on the part of your Internet Service Provider, or additional records from a third party, information stored or retrieved for this purpose alone cannot usually be used to identify you.
Marketing
The technical storage or access is required to create user profiles to send advertising, or to track the user on a website or across several websites for similar marketing purposes.