When cable cuts occur, whether submarine or terrestrial, they often result in observable disruptions to Internet connectivity, knocking a network, city, or country offline. This is especially true when there is insufficient resilience or alternative paths — that is, when a cable is effectively a single point of failure. Associated observations of traffic loss resulting from these disruptions are frequently covered by Cloudflare Radar in social media and blog posts. However, two recent cable cuts that occurred in the Baltic Sea resulted in little-to-no observable impact to the affected countries, as we discuss below, in large part because of the significant redundancy and resilience of Internet infrastructure in Europe.
BCS East-West Interlink
Traffic volume indicators
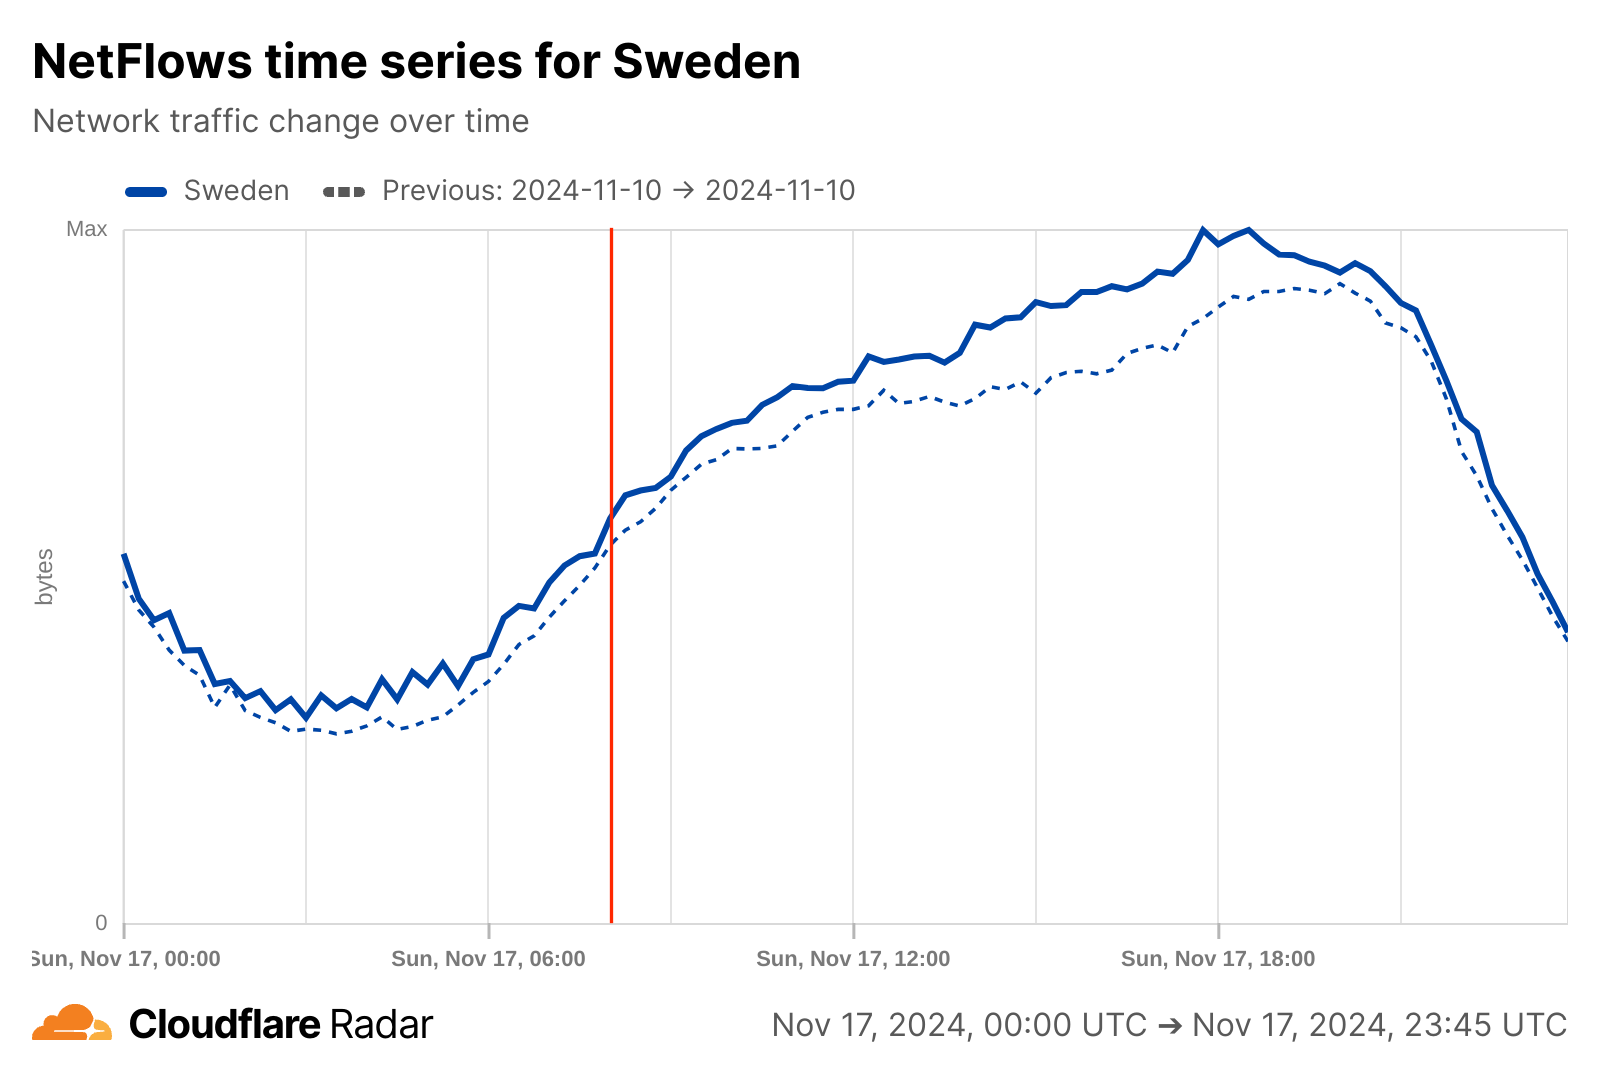
On Sunday, November 17 2024, the BCS East-West Interlink submarine cable connecting Sventoji, Lithuania and Katthammarsvik, Sweden was reportedly damaged around 10:00 local (Lithuania) time (08:00 UTC). A Data Center Dynamics article about the cable cut quotes the CTO of Telia Lietuva, the telecommunications provider that operates the cable, and notes “The Lithuanian cable carried about a third of the nation’s Internet capacity, but capacity was carried via other routes.”
As the Cloudflare Radar graphs below show, there was no apparent impact to traffic volumes in either country at the time that the cables were damaged. The NetFlows graphs represent the number of bytes that Cloudflare sends to users and clients in response to their requests.
Internet quality
Internet quality metrics for both countries show changes in measured bandwidth and latency throughout the day on Sunday, but with no sudden anomalous shifts visible around the time of the cable cut. (The loss of connectivity associated with a cable cut potentially manifests itself as an increase in latency and concurrent decrease in bandwidth due to loss of capacity.) The latency graph for Sweden does show an increase in latency, but it began before the cable cut occurred, is similar to a pattern visible several hours earlier, and is matched by an increase in measured bandwidth, so it is unlikely to be related to the cable cut event.
Visibility in BGP events, announced IP address space unaffected
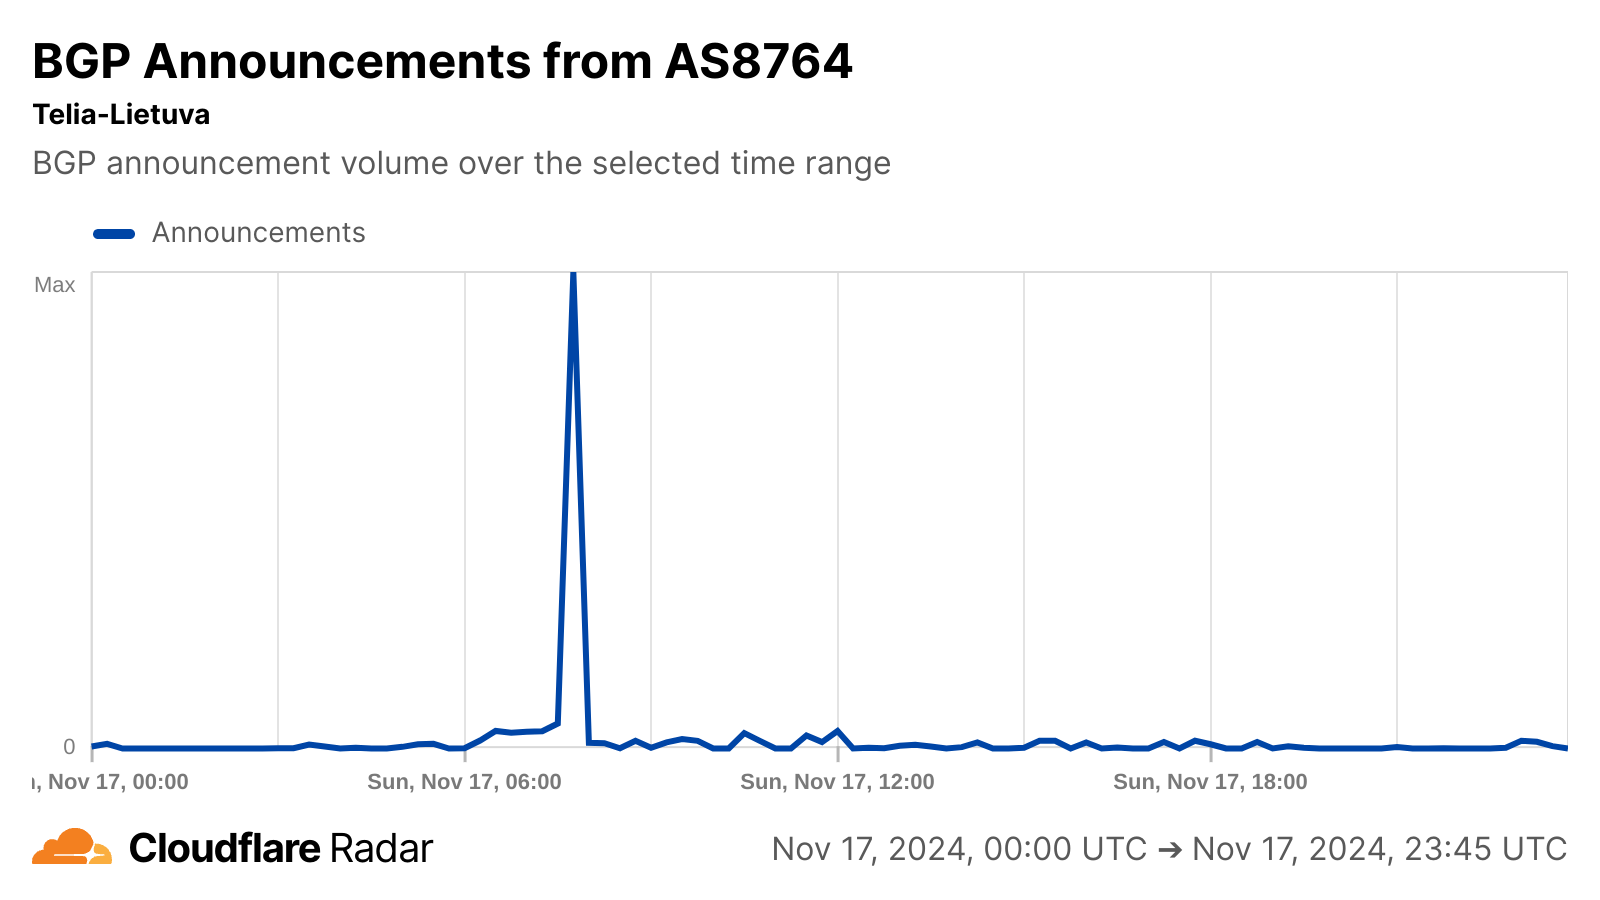
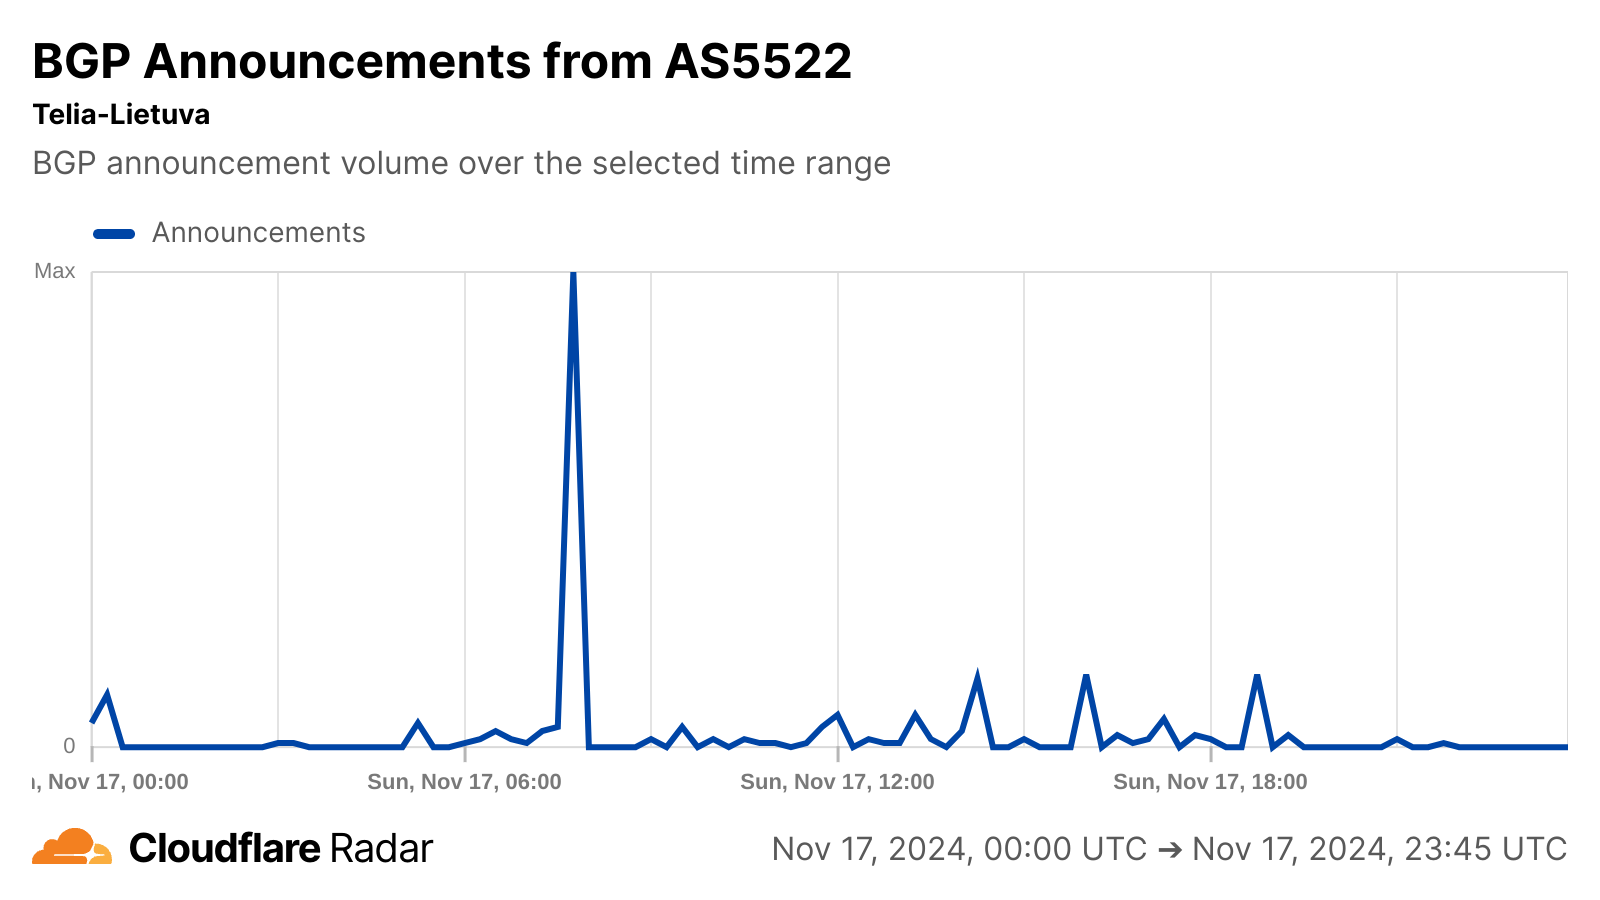
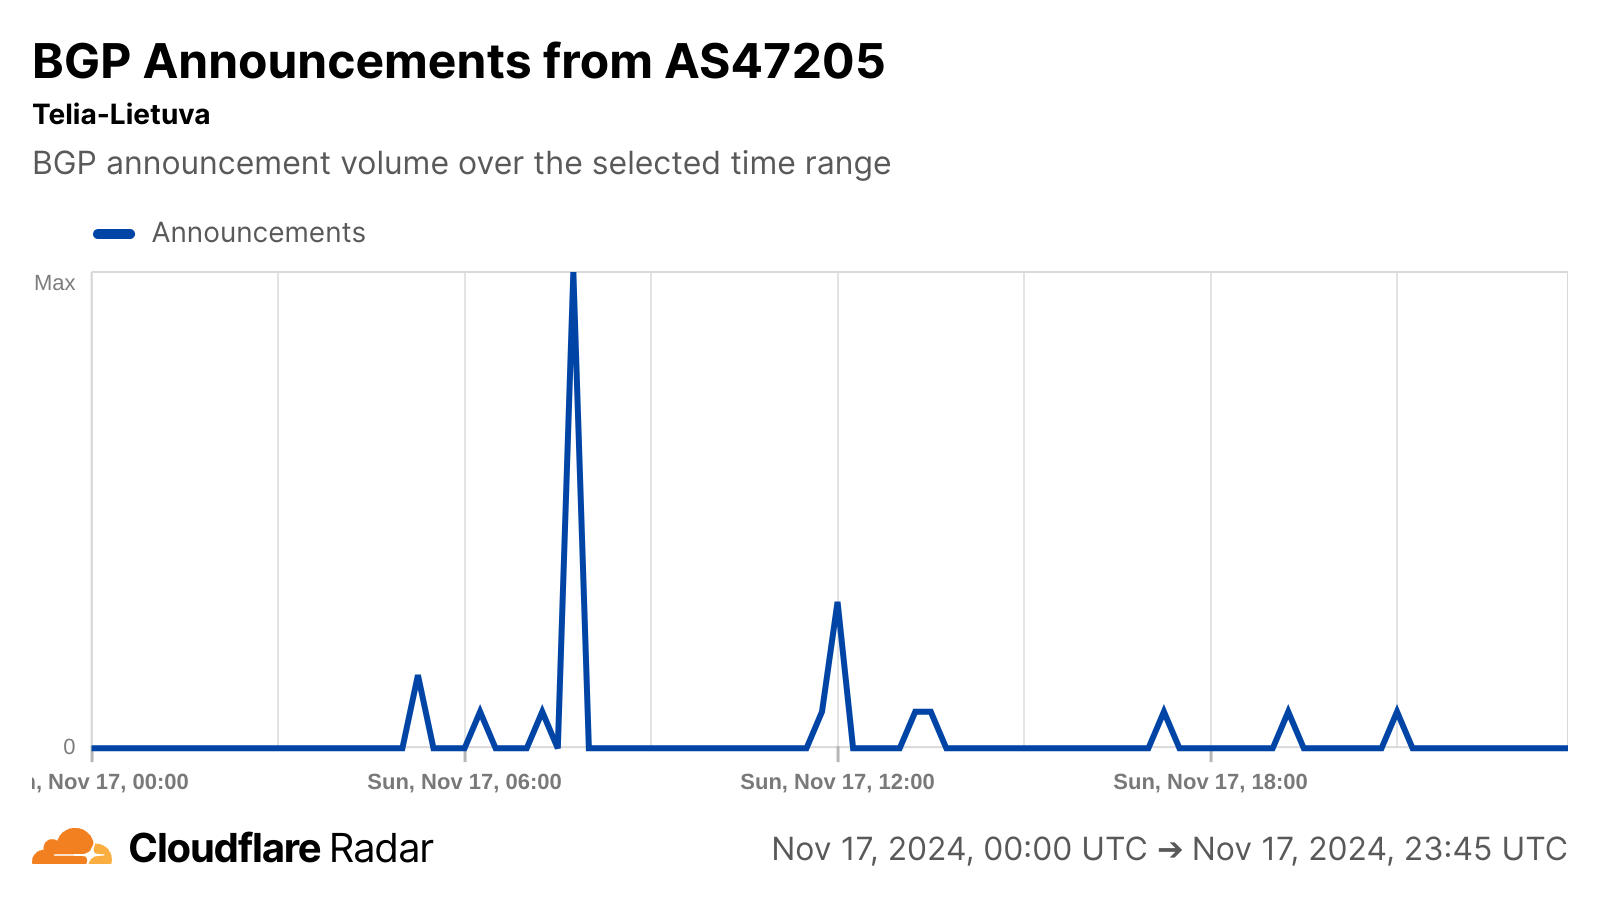
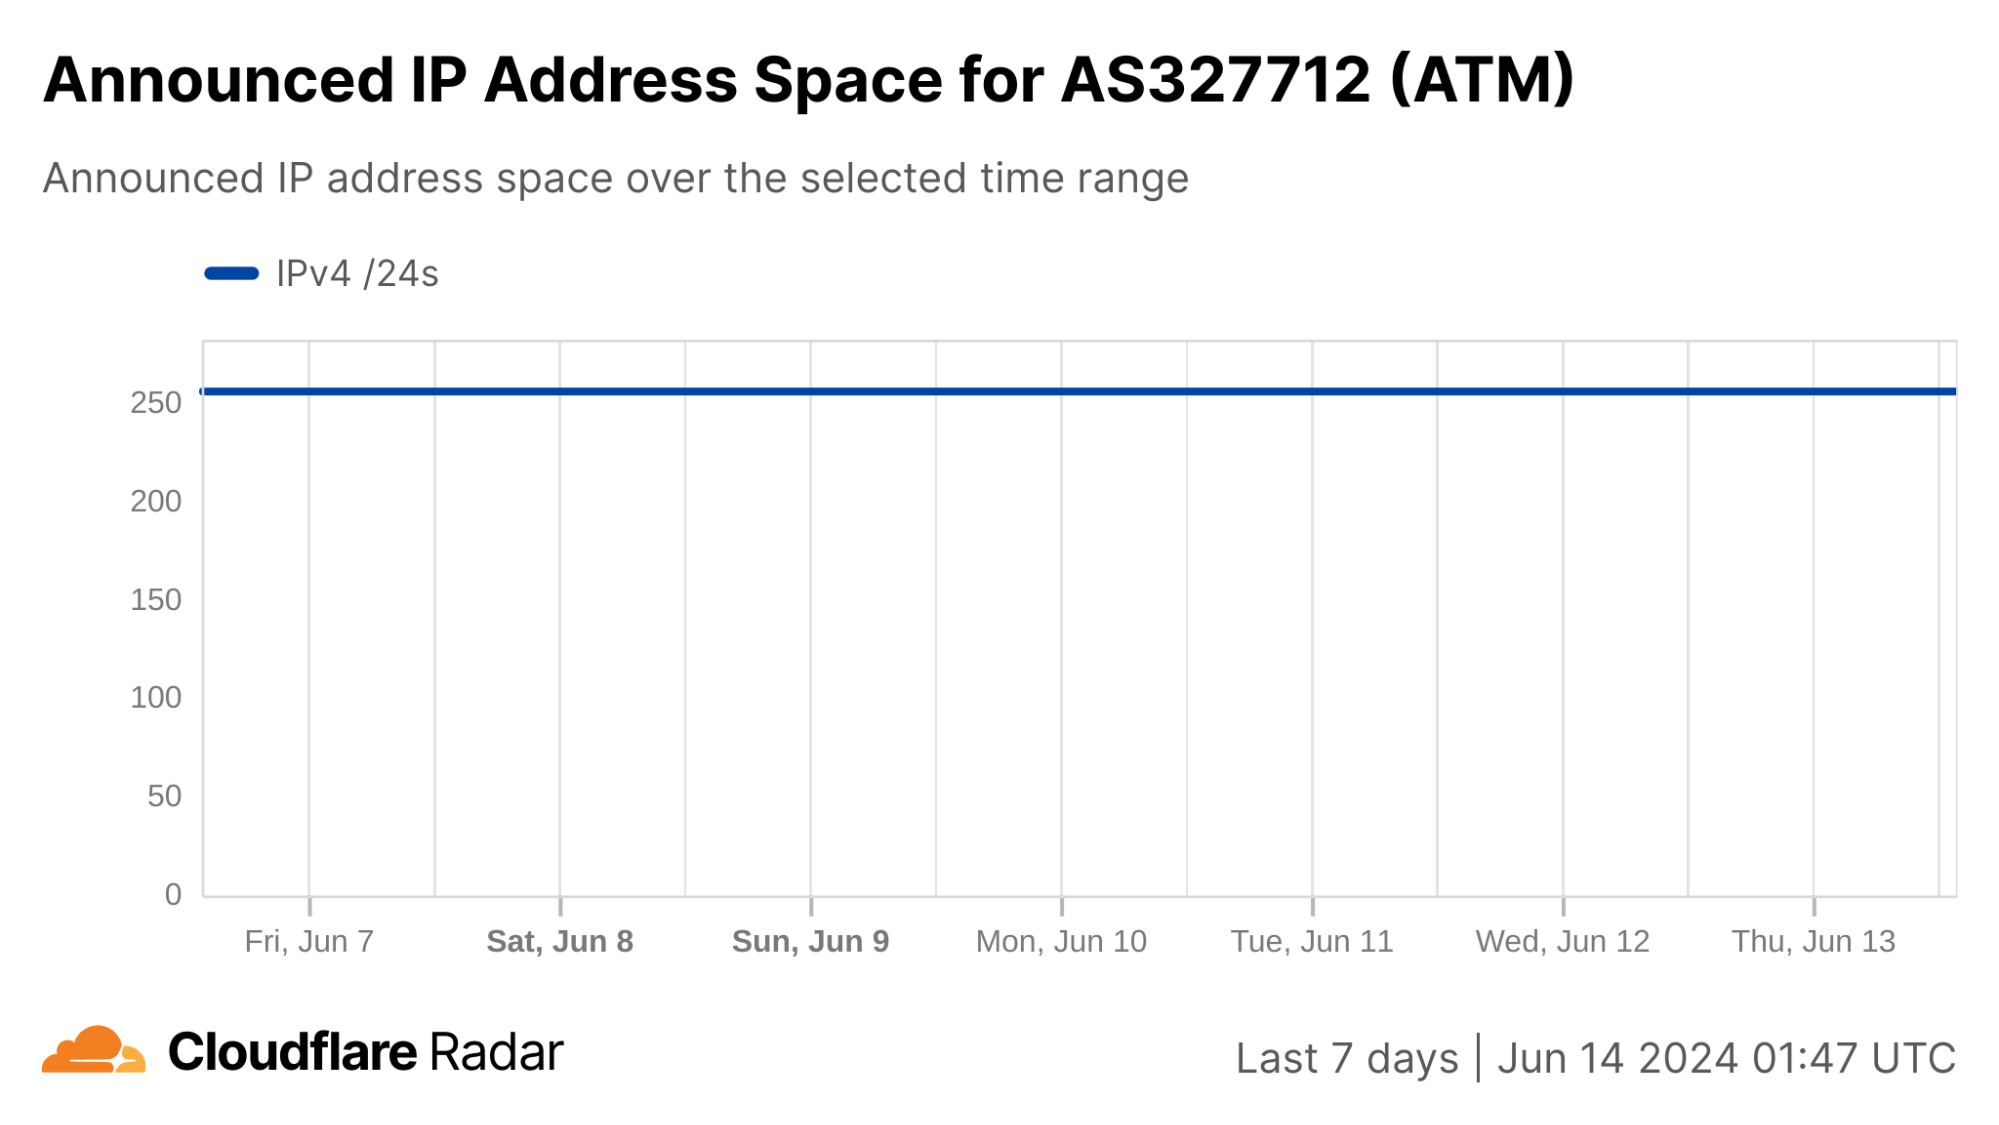
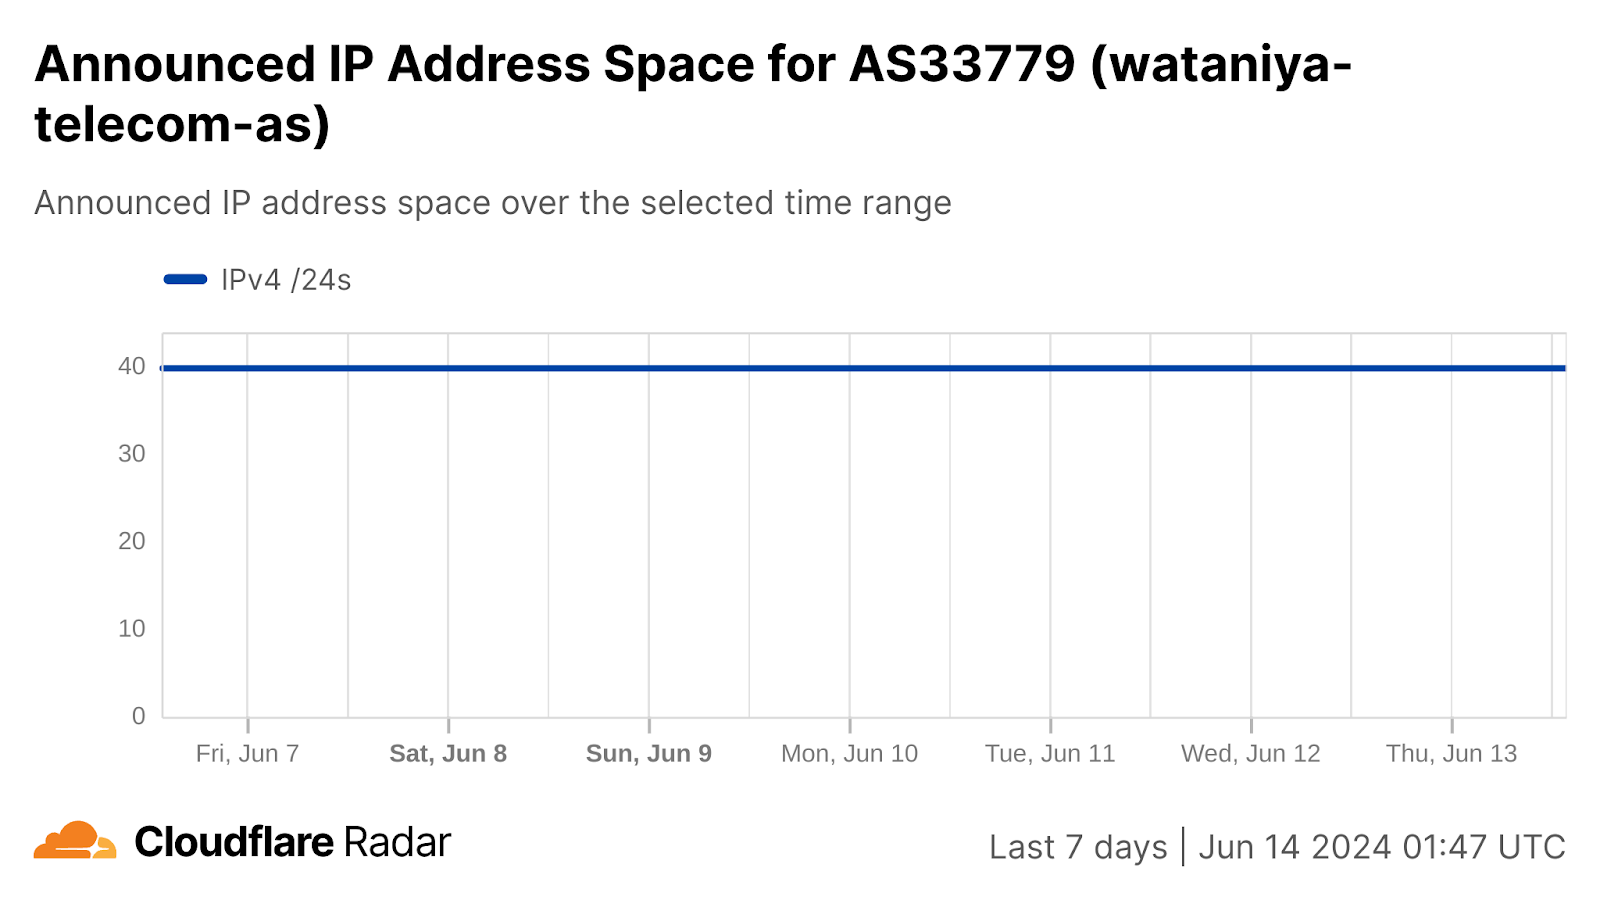
BGP announcements are a way for network providers to communicate routing information to other networks, and announcement activity observed on Telia Lietuva’s autonomous systems around the time of the cable cut may be related to the re-routing referenced in the article. No change in announced IP address space was visible for any of these autonomous systems, suggesting no loss of connectivity as the capacity was re-routed.
Telegeography’s submarinecablemap.com illustrates, at least in part, the resilience in connectivity enjoyed by these two countries. In addition to the damaged cable, it shows that Lithuania is connected to neighboring Latvia as well as to the Swedish mainland. Over 20 submarine cables land in Sweden, connecting it to multiple countries across Europe. In addition to the submarine resilience, network providers in both countries can take advantage of terrestrial fiber connections to neighboring countries, such as those illustrated in a European network map from Arelion (formerly Telia), which is only one of the large European backbone providers.
C-Lion1
Traffic volume indicators
Less than a day later, the C-Lion1 submarine cable, which connects Helsinki, Finland and Rostock Germany was reportedly damaged during the early morning hours of Monday, November 18. Cinia, the telecommunications company that owns the cable, said that the cable stopped working at about 02:00 UTC.
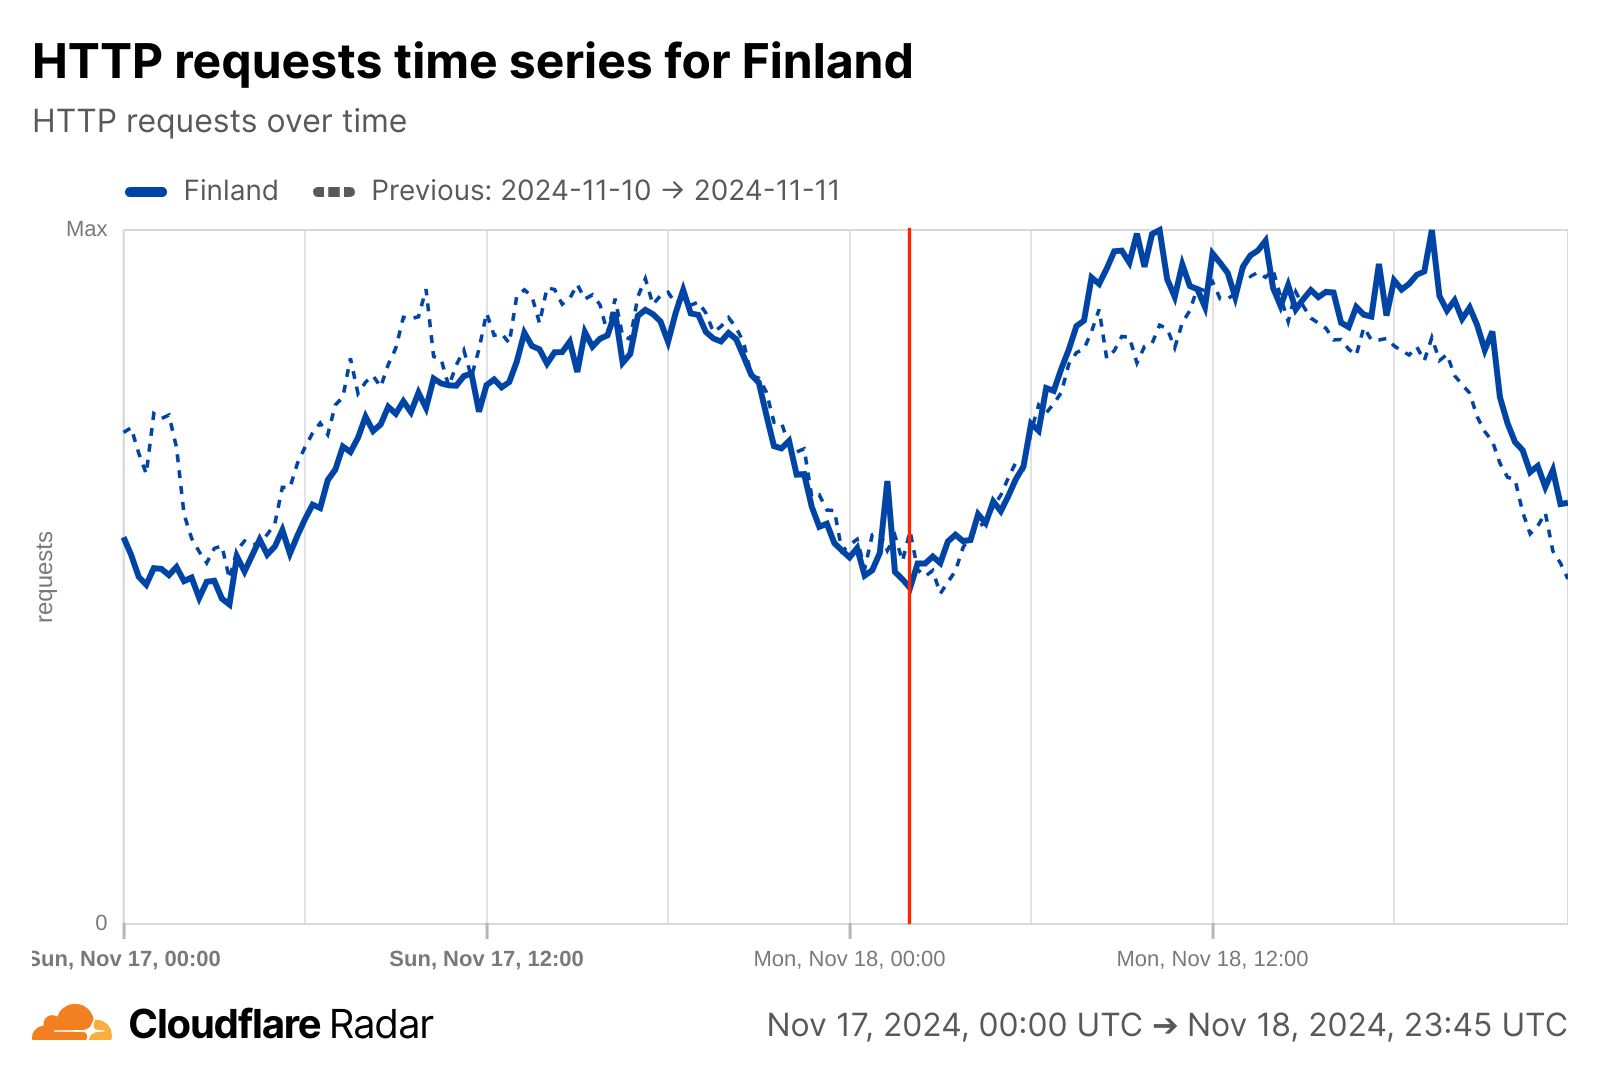
In this situation as well, as the Cloudflare Radar graphs below show, there was no apparent impact to traffic volumes in either country at the time that the cables were damaged. The Finland graphs, week-on-week, show fewer bytes transferred and fewer HTTP requests, but that difference is present before the cable cut at 02:00 UTC. However, the trend of the current line does not change after the cable cut, so the two events would appear unrelated.
Internet quality
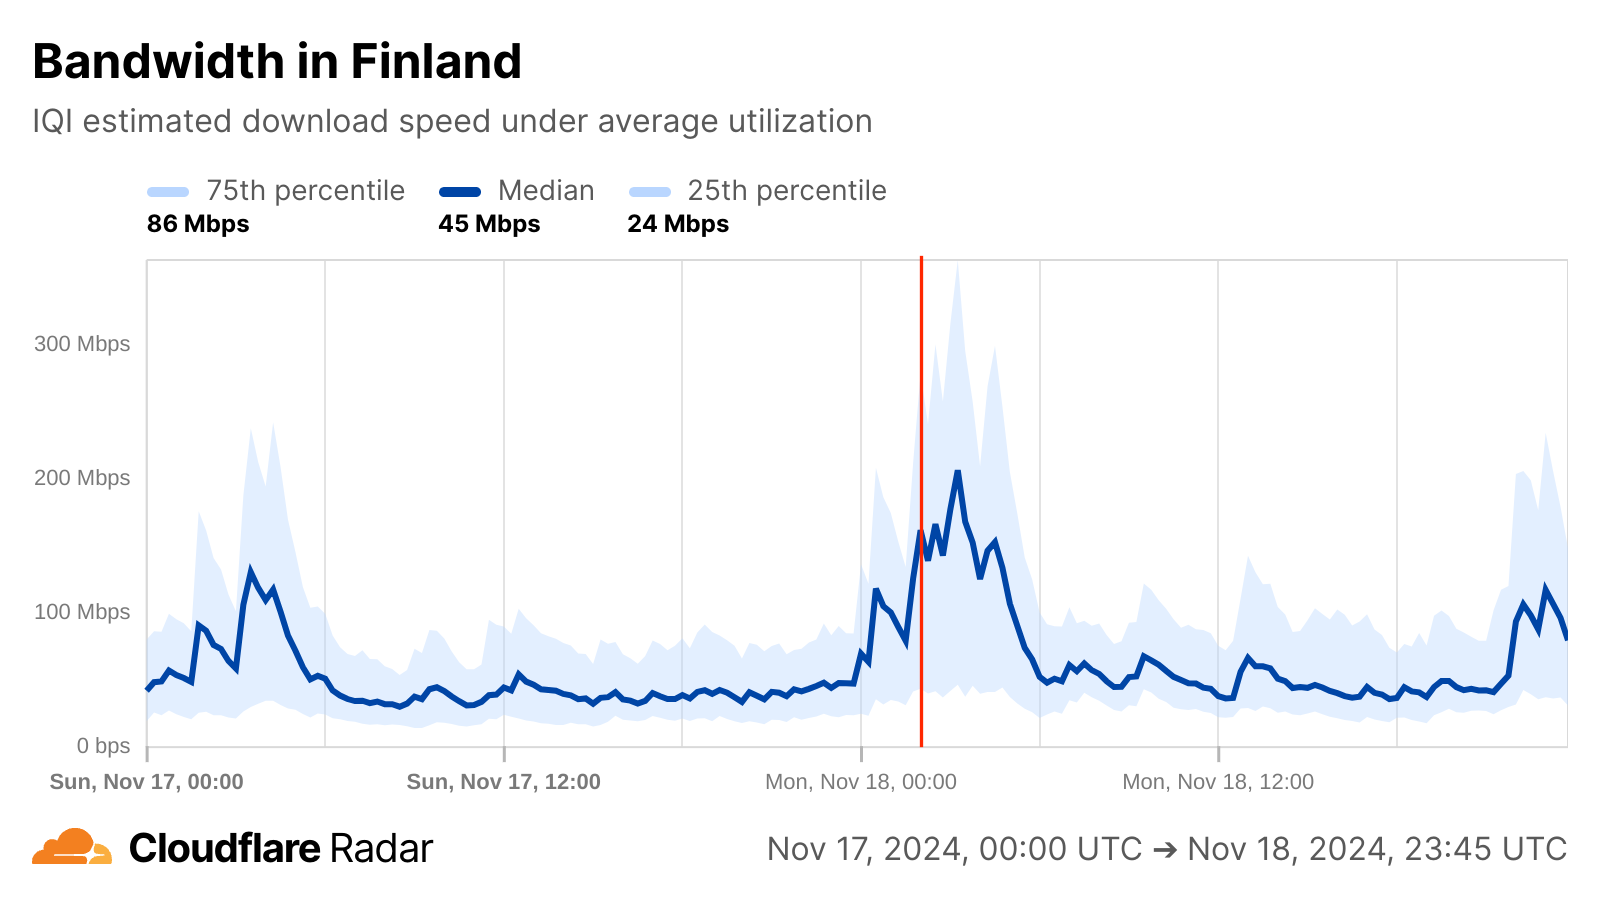
By looking at volume-related metrics, alone, Internet connectivity would appear to be unaffected by the cable cut.
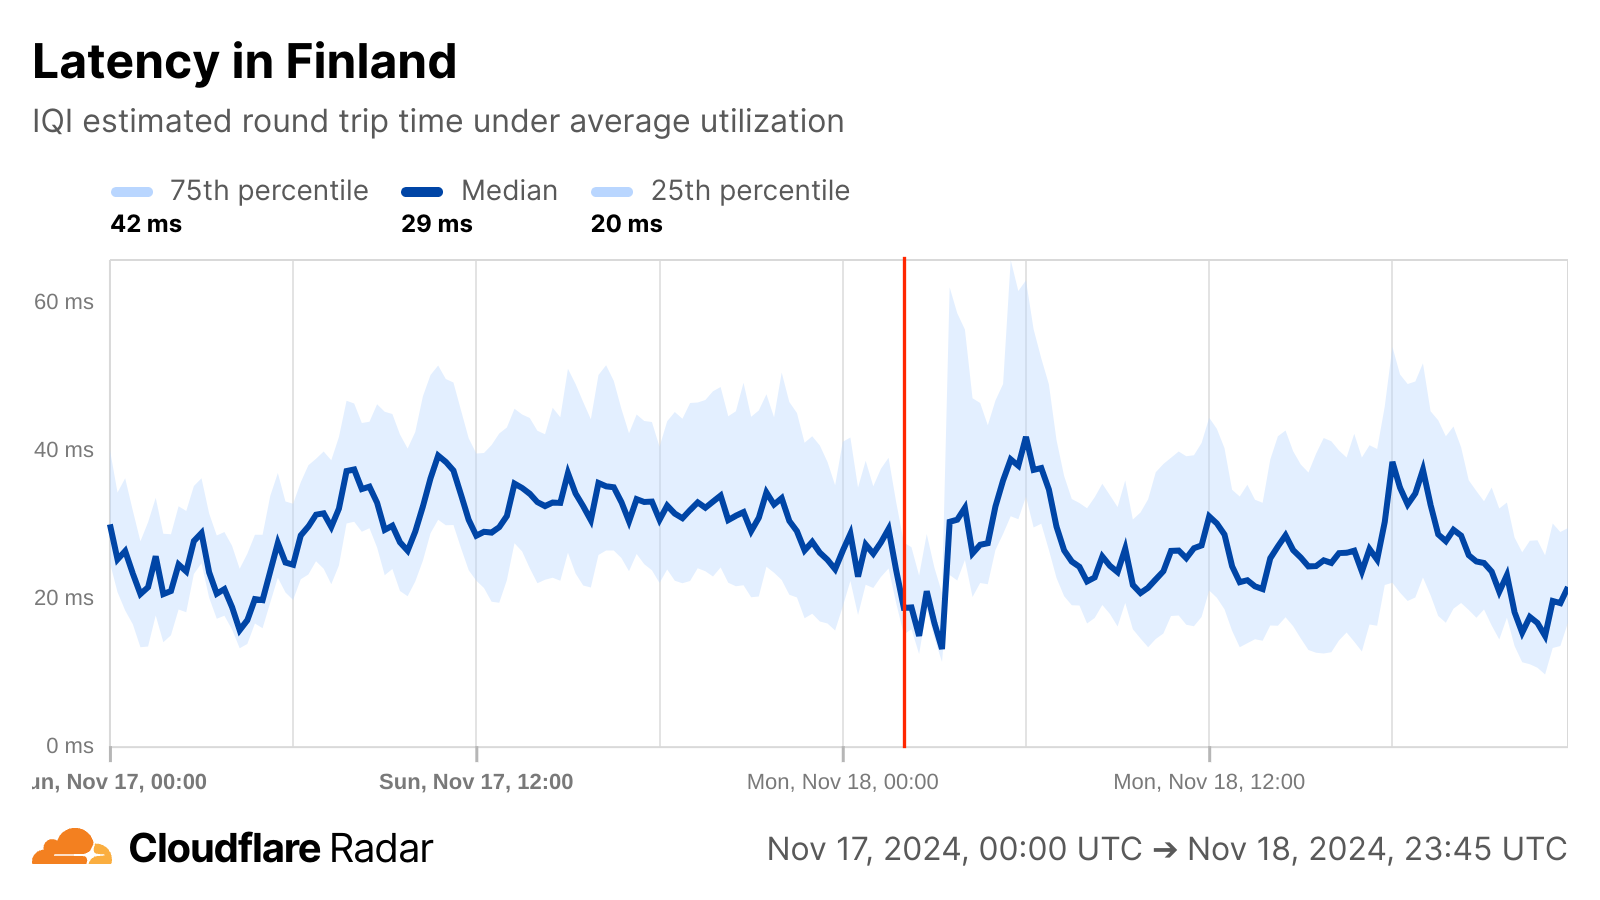
If, however, we change perspective and look at Internet quality, a brief yet interesting change is visible for Finland around the reported time of the cable damage, though it isn’t clear whether it is related in any way. Just after midnight, median measured bandwidth, previously consistent around 50 Mbps begins to grow, peaking just over 200 Mbps around 03:00 UTC. Around that same time, measured median latency also begins to drop, falling from around 30 ms to a low of 13 ms, also around 03:00 UTC. Median bandwidth returned to normal levels around 06:00 UTC, while latency took about two hours longer to return to normal levels. These observed improvements in bandwidth and latency could have been due to traffic being re-routed to along paths with better connectivity to measurement endpoints, but because the shifts began before the cable damage occurred, and recovered shortly thereafter, that is unlikely to be the root cause.
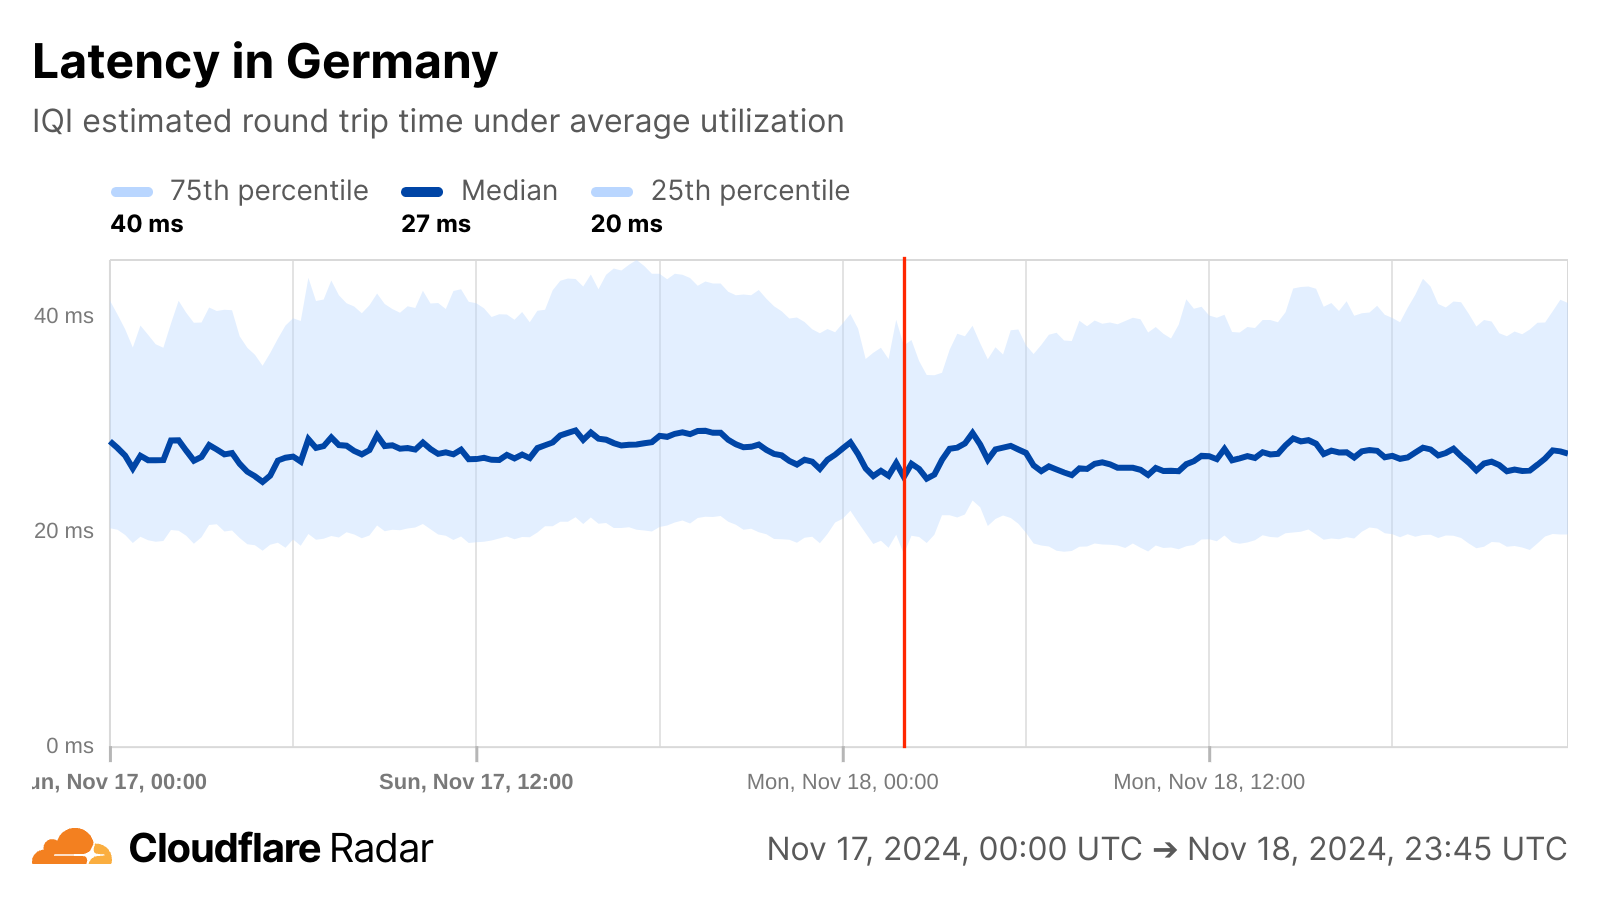
In Germany, a brief minor increase in median bandwidth peaked around 02:45 UTC, while no notable changes were observed in latency.
BGP business as usual
From a routing perspective, there was no notable BGP announcement activity observed for top autonomous systems in either Finland or Germany around 02:00 on November 18, and total announced IP address space aggregated at a country level also demonstrated no change.
Telegeography’s submarinecablemap.com shows that both Finland and Germany also have significant redundancy and resilience from a submarine cable perspective, with over 10 cables landing in Finland, and nearly 10 landing in Germany, including Atlantic Crossing-1 (AC-1), which connects to the United States over two distinct paths. Terrestrial fiber maps from Arelion and eunetworks (as just two examples) show multiple redundant fiber routes within both countries, as well as cross-border routes to other neighboring countries, enabling more resilient Internet connectivity.
Conclusion
As we have discussed in multiple prior blog posts (Jersey, 2016; AAE-1/SMW5, 2022; WACS/MainOne/SAT3/ACE, 2024; EASSy/Seacom, 2024), cable cuts often cause significant disruptions to Internet connectivity, in many cases because they represent a concentrated point of vulnerability, whether for an individual network provider, city/state, or country. These disruptions are often quite lengthy as well, due to the time needed to marshal repair resources, identify the location of the damage, etc. Although it is not always feasible due to financial or geographic constraints, building redundant and resilient network architecture, at multiple levels, is a best practice. This includes the sending traffic over multiple physical cables (both submarine and terrestrial), connecting to multiple peer and upstream network providers, and even avoiding single points of failure in core Internet resources like DNS servers.
On October 30, 2024, cloud hosting provider OVHcloud (AS16276) suffered a brief but significant outage. According to their incident report, the problem started at 13:23 UTC, and was described simply as “An incident is in progress on our backbone infrastructure.” OVHcloud noted that the incident ended 17 minutes later, at 13:40 UTC. As a major global cloud hosting provider, some customers use OVHcloud as an origin for sites delivered by Cloudflare — if a given content asset is not in our cache for a customer’s site, we retrieve the asset from OVHcloud.
We observed traffic starting to drop at 13:21 UTC, just ahead of the reported start time. By 13:28 UTC, it was approximately 95% lower than pre-incident levels. Recovery appeared to start at 13:31 UTC, and by 13:40 UTC, the reported end time of the incident, it had reached approximately 50% of pre-incident levels.
Traffic from OVHcloud (AS16276) to Cloudflare
Cloudflare generally exchanges most of our traffic with OVHcloud over peering links. However, as shown below, peered traffic volume during the incident fell significantly. It appears that some small amount of traffic briefly began to flow over transit links from Cloudflare to OVHcloud due to sudden changes in which Cloudflare data centers we were receiving OVHcloud requests. (Peering is a direct connection between two network providers for the purpose of exchanging traffic. Transit is when one network pays an intermediary network to carry traffic to the destination network.)
Because we peer directly, we exchange most traffic over our private peering sessions with OVHcloud. Instead, we found OVHcloud routing to Cloudflare dropped entirely for a few minutes, then switched to just a single Internet Exchange port in Amsterdam, and finally normalized globally minutes later.
As the graphs below illustrate, we normally see the largest amount of traffic from OVHcloud in our Frankfurt and Paris data centers, as OVHcloud has large data center presences in these regions. However, in that shift to transit, and the shift to an Amsterdam Internet Exchange peering point, we saw a spike in traffic routed to our Amsterdam data center. We suspect the routing shifts are the earliest signs of either internal BGP reconvergence, or general network recovery within AS12676, starting with their presence nearest our Amsterdam peering point.
The postmortem published by OVHcloud noted that the incident was caused by “an issue in a network configuration mistakenly pushed by one of our peering partner[s]” and that “We immediately reconfigured our network routes to restore traffic.” One possible explanation for the backbone incident may be a BGP route leak by the mentioned peering partner, where OVHcloud could have accepted a full Internet table from the peer and therefore overwhelmed their network or the peering partner’s network with traffic, or caused unexpected internal BGP route updates within AS12676.
Upon investigating what route leak may have caused this incident impacting OVHcloud, we found evidence of a maximum prefix-limit threshold being breached on our peering with Worldstream (AS49981) in Amsterdam.
Oct 30 13:16:53 edge02.ams01 rpd[9669]: RPD_BGP_NEIGHBOR_STATE_CHANGED: BGP peer 141.101.65.53 (External AS 49981) changed state from Established to Idle (event PrefixLimitExceeded) (instance master)
As the number of received prefixes exceeded the limits configured for our peering session with Worldstream, the BGP session automatically entered an idle state. This prevented the route leak from impacting Cloudflare’s network. In analyzing BGP Monitoring Protocol (BMP) data from AS49981 prior to the automatic session shutdown, we were able to confirm Worldstream was sending advertisements with AS paths that contained their upstream Tier 1 transit provider.
During this time, we also detected over 500,000 BGP announcements from AS49981, as Worldstream was announcing routes to many of their peers, visible on Cloudflare Radar.
Worldsteam later posted a notice on their status page, indicating that their network experienced a route leak, causing routes to be unintentionally advertised to all peers:
“Due to a configuration error on one of the core routers, all routes were briefly announced to all our peers. As a result, we pulled in more traffic than expected, leading to congestion on some paths. To address this, we temporarily shut down these BGP sessions to locate the issue and stabilize the network. We are sorry for the inconvenience.”
We believe Worldstream also leaked routes on an OVHcloud peering session in Amsterdam, which caused today’s impact.
Conclusion
Cloudflare has written aboutimpactful route leaks before, and there are multiple methods available to prevent BGP route leaks from impacting your network. One is setting max prefix-limits for a peer, so the BGP session is automatically torn down when a peer sends more prefixes than they are expected to. Other forward-looking measures areAutonomous System Provider Authorization (ASPA) for BGP, where Resource Public Key Infrastructure (RPKI) helps protect a network from accepting BGP routes with an invalid AS path, orRFC9234, which prevents leaks by tying strict customer and provider relationships to BGP updates. For improved Internet resilience, we recommend that network operators follow recommendations defined withinMANRS for Network Operators.
Cloudflare’s network spans more than 330 cities in over 120 countries, where we interconnect with over 13,000 network providers in order to provide a broad range of services to millions of customers. The breadth of both our network and our customer base provides us with a unique perspective on Internet resilience, enabling us to observe the impact of Internet disruptions. Thanks to Cloudflare Radar functionality released earlier this year, we can explore the impact from a routing perspective, as well as a traffic perspective, at both a network and location level.
As we have noted in the past, this post is intended as a summary overview of observed and confirmed disruptions, and is not an exhaustive or complete list of issues that have occurred during the quarter.
Over the past several years, we have seen multiple governments around the world implement Internet shutdowns in response to protests within their countries. Some shutdowns are more targeted, affecting only (a subset of) mobile Internet providers, while others are more aggressive, effectively cutting off Internet connectivity at a national level. In addition, we all too frequently see governments implement nationwide multi-hour Internet shutdowns in an effort to prevent students from cheating on national exams. Unfortunately, governments were active in both respects during the third quarter, as we observed multiple government directed Internet shutdowns. Several were covered in our August 1 blog post, A recent spate of Internet disruptions.
Bangladesh
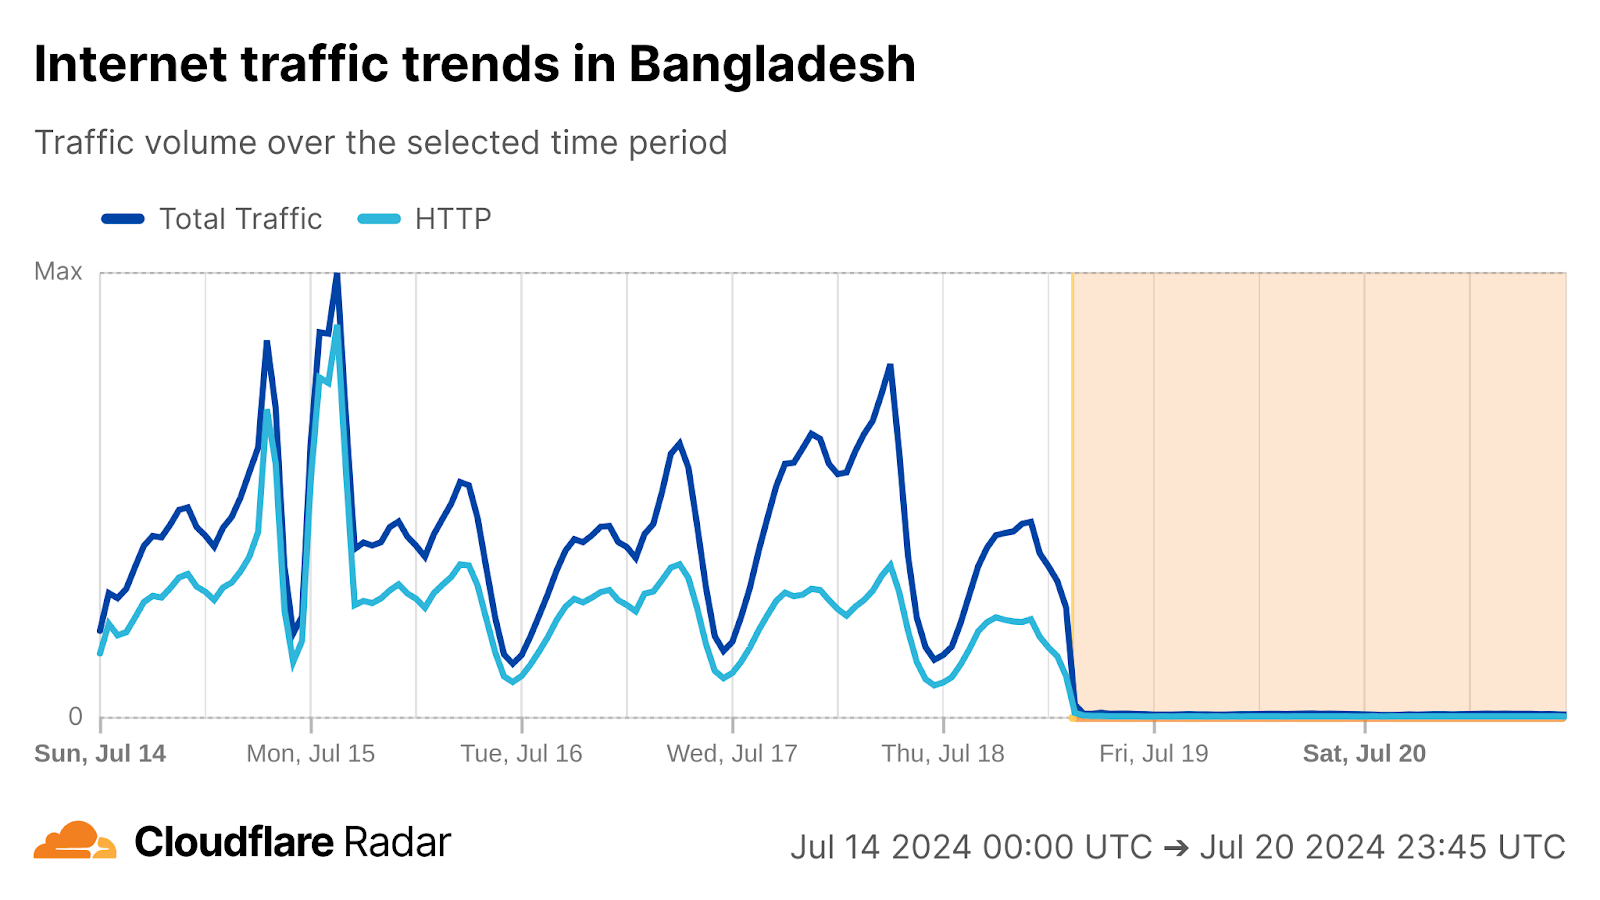
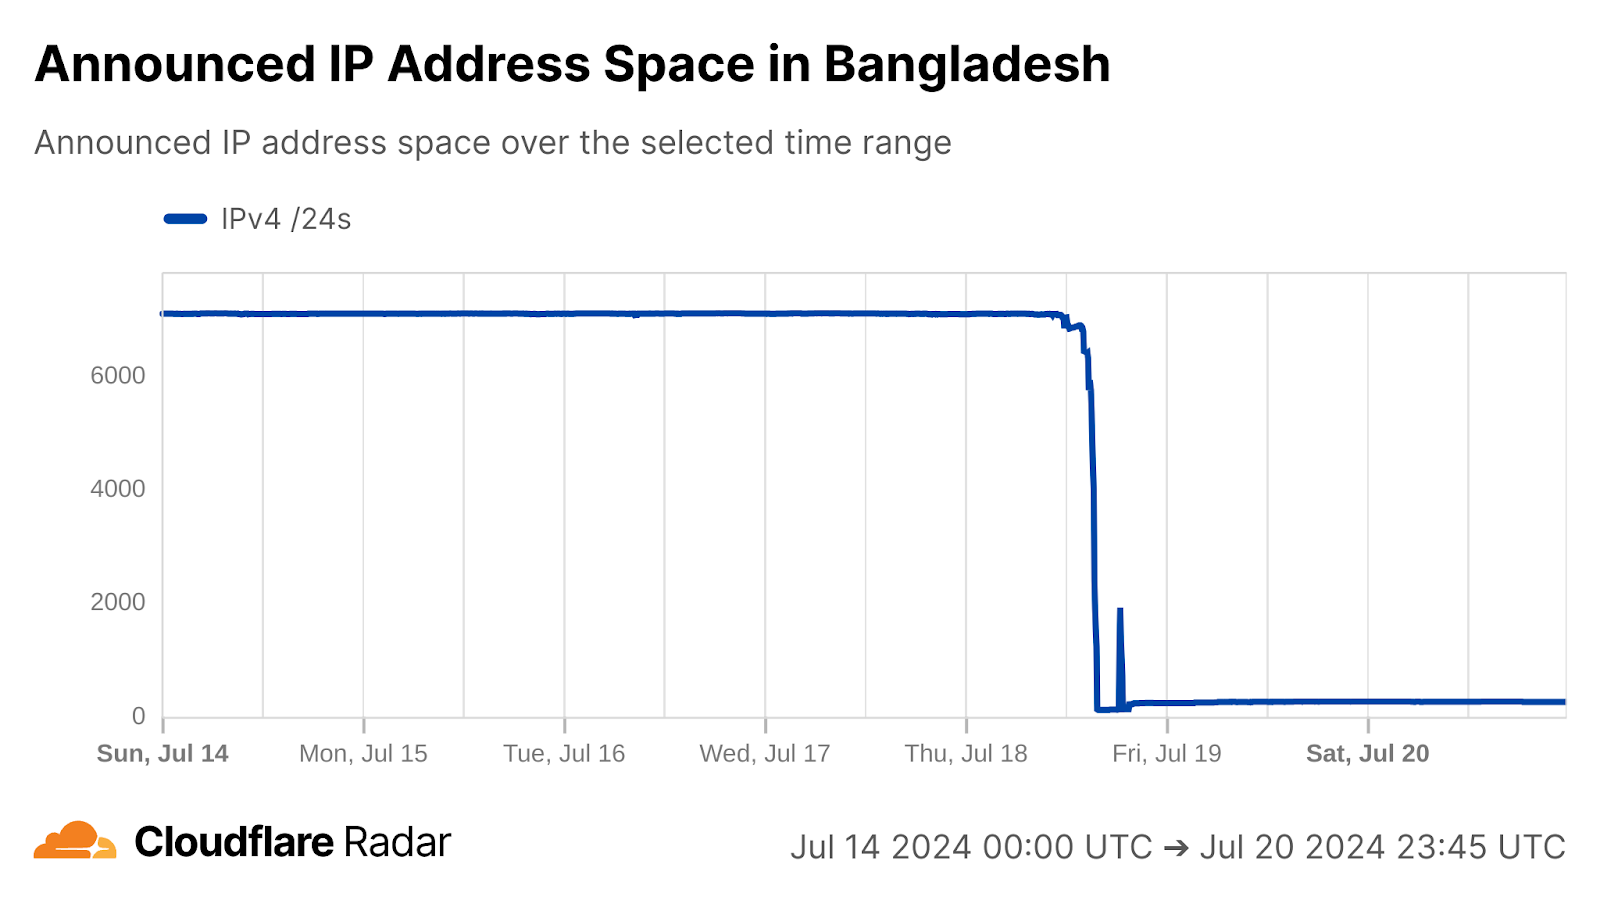
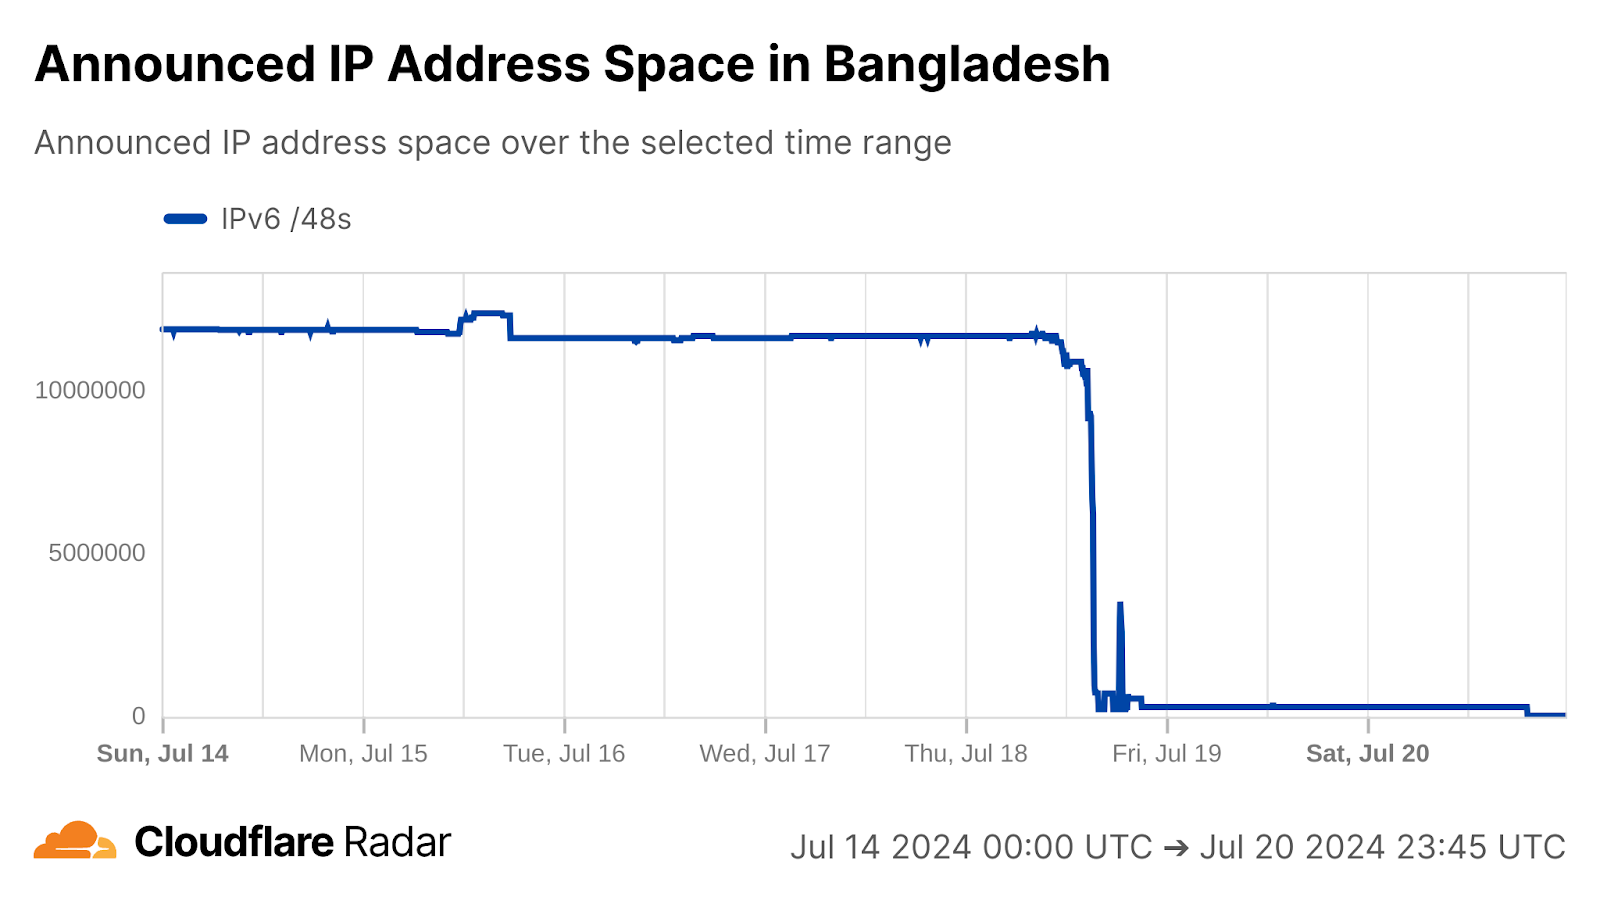
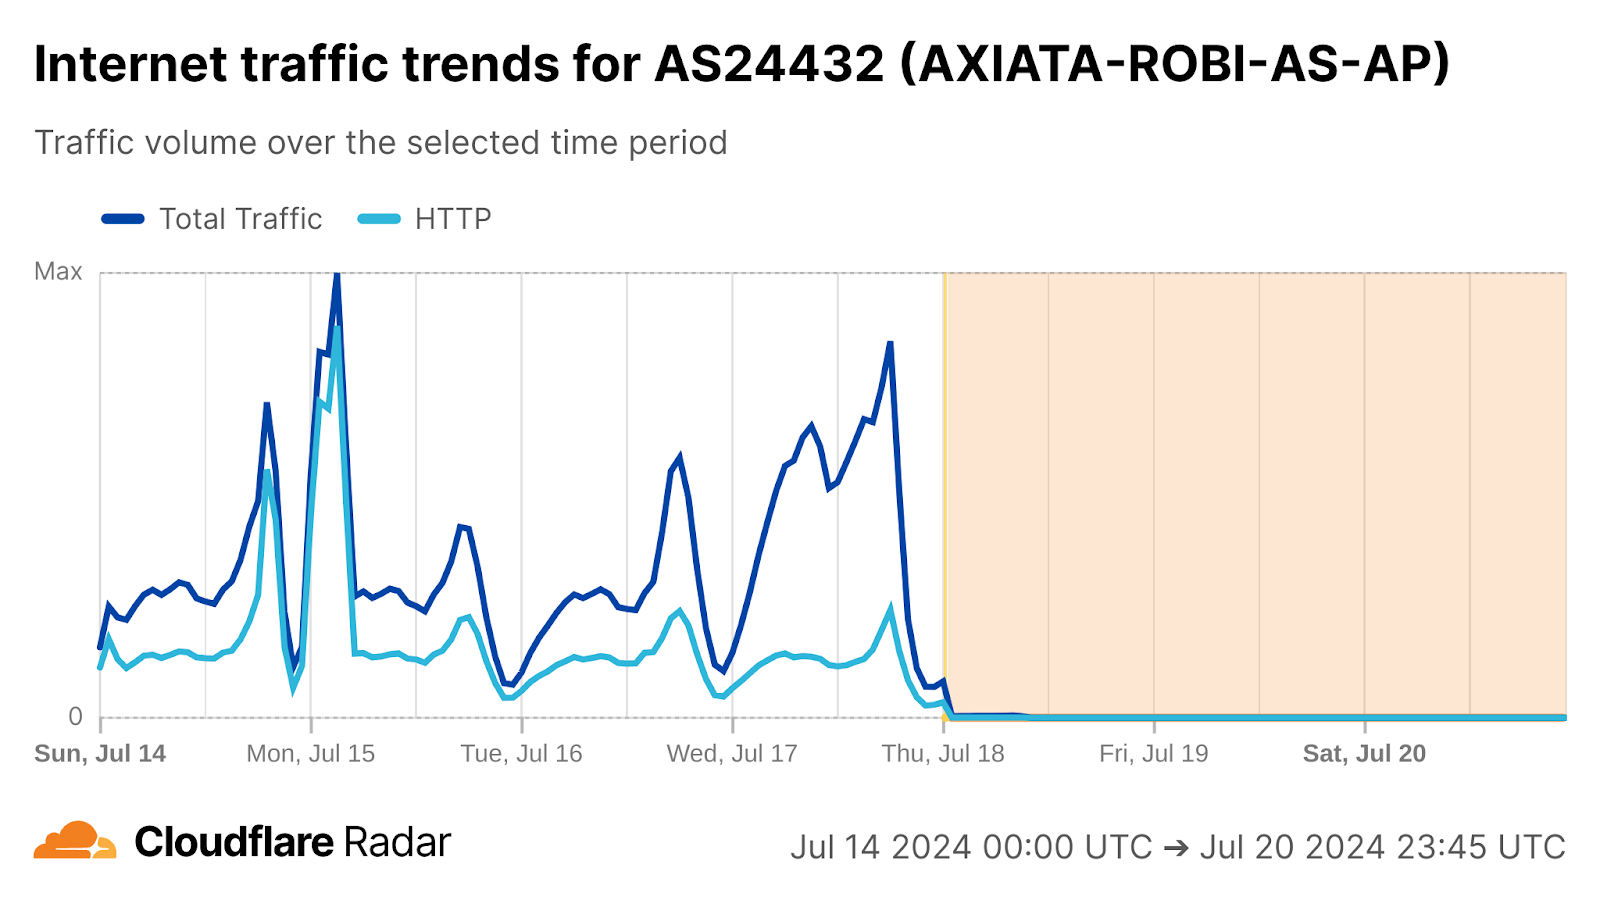
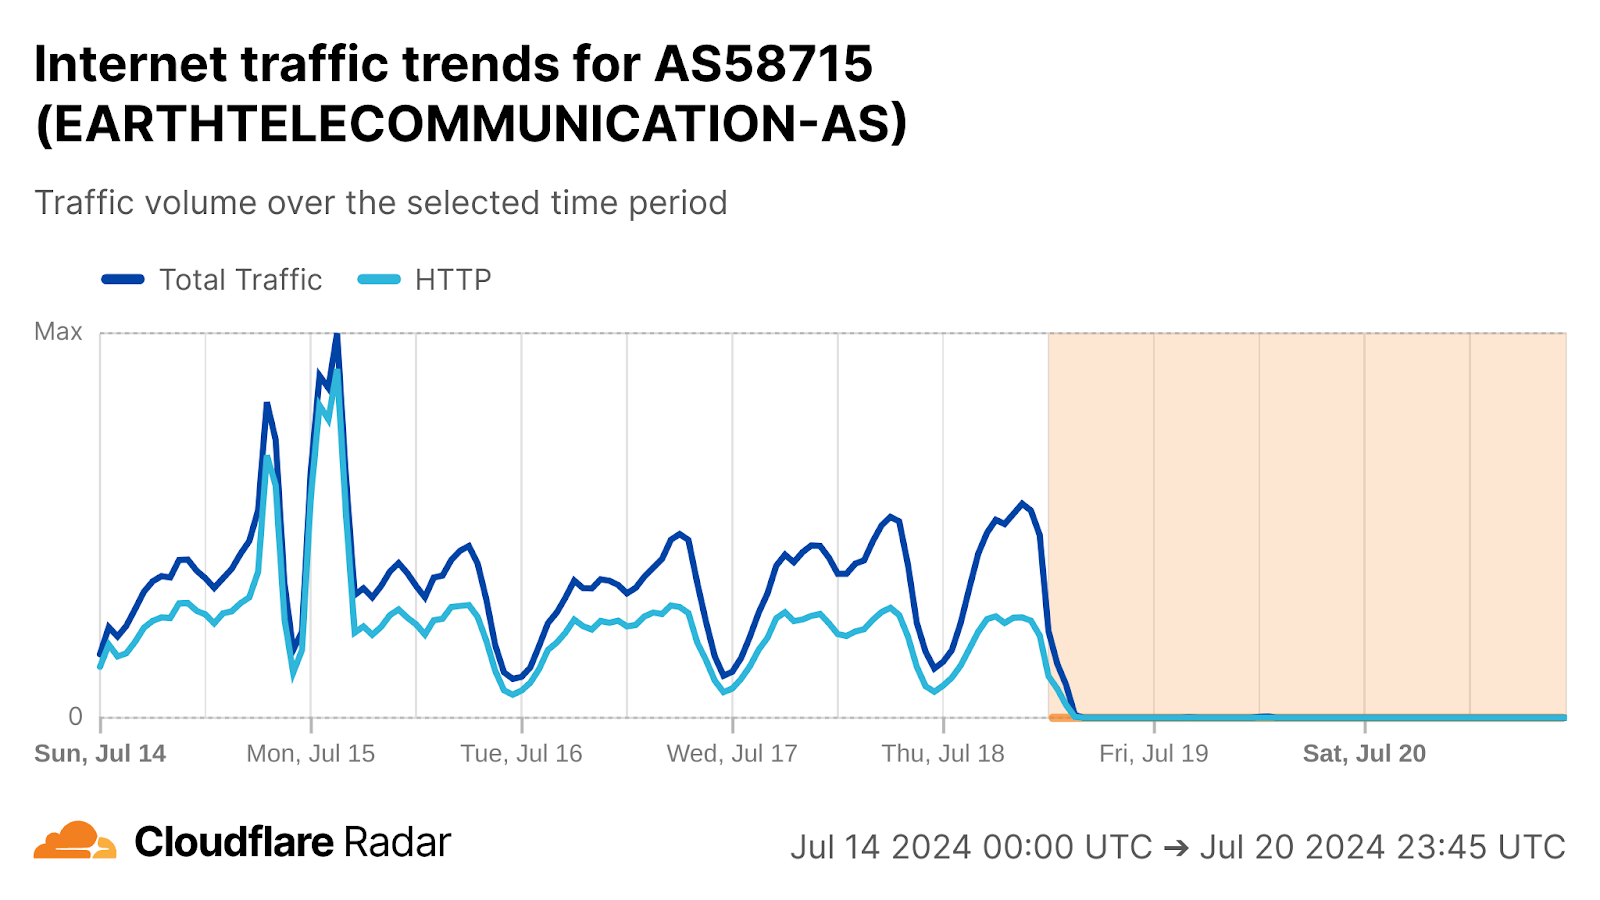
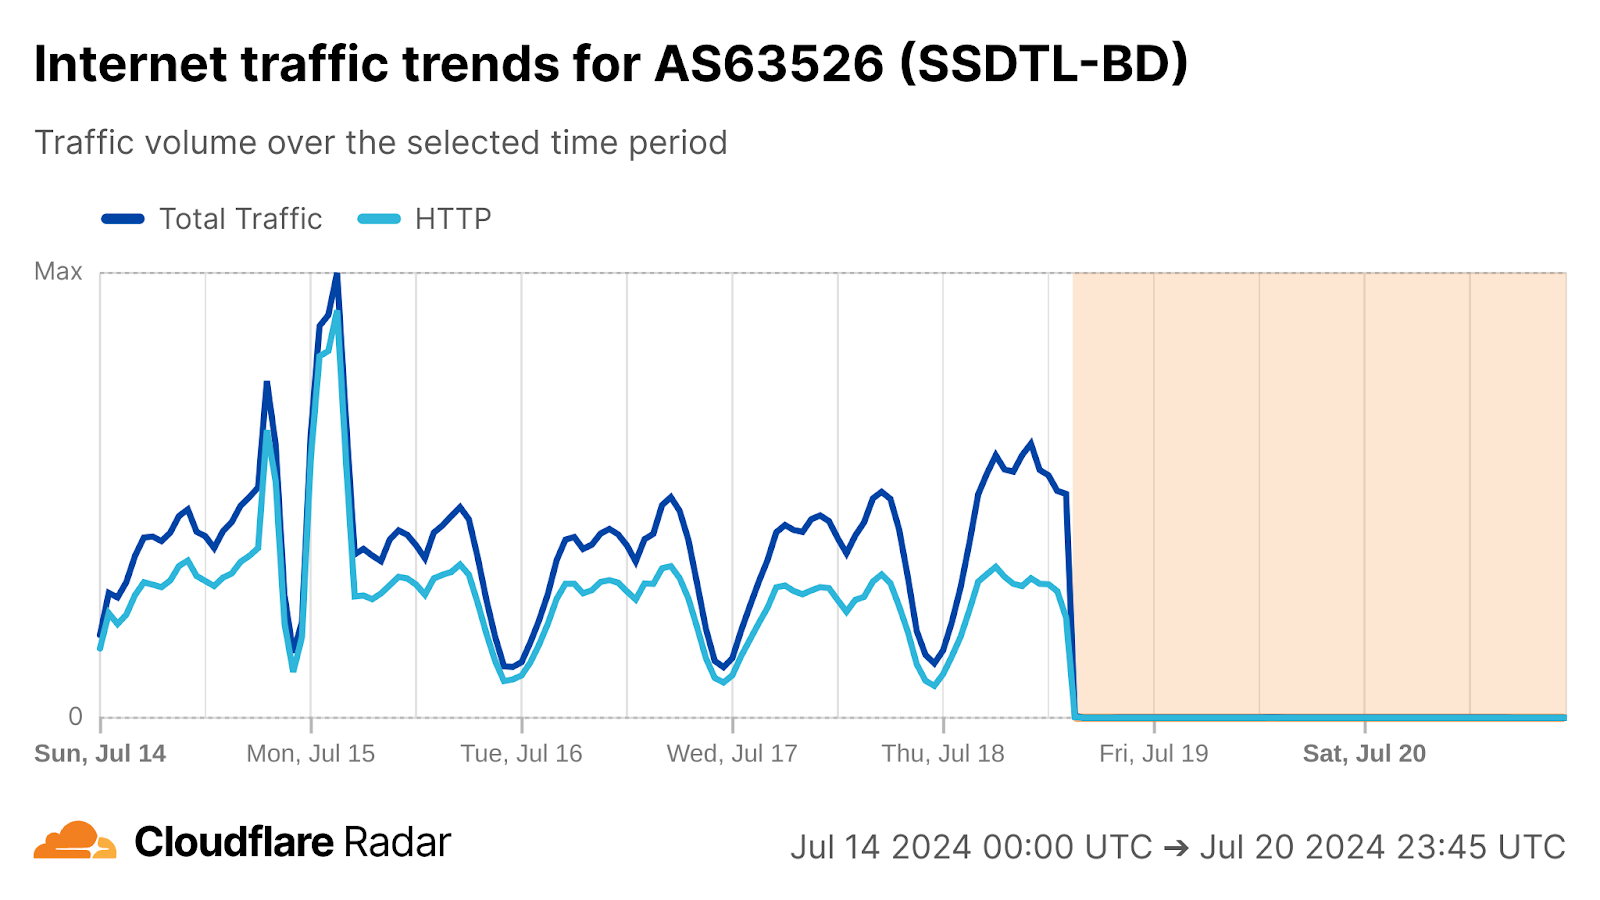
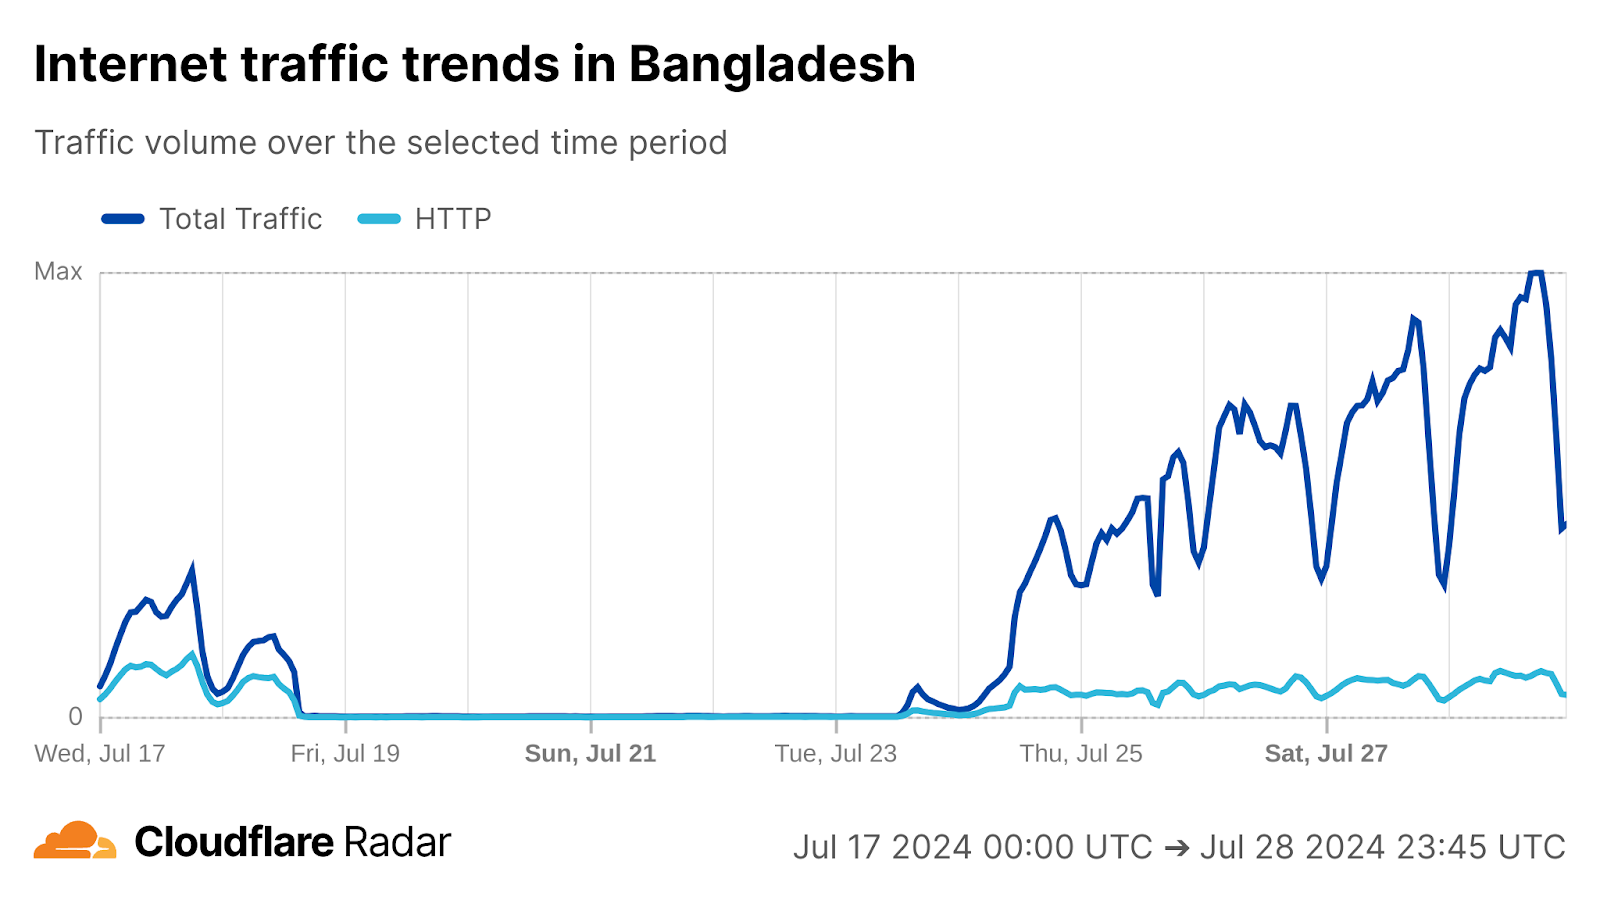
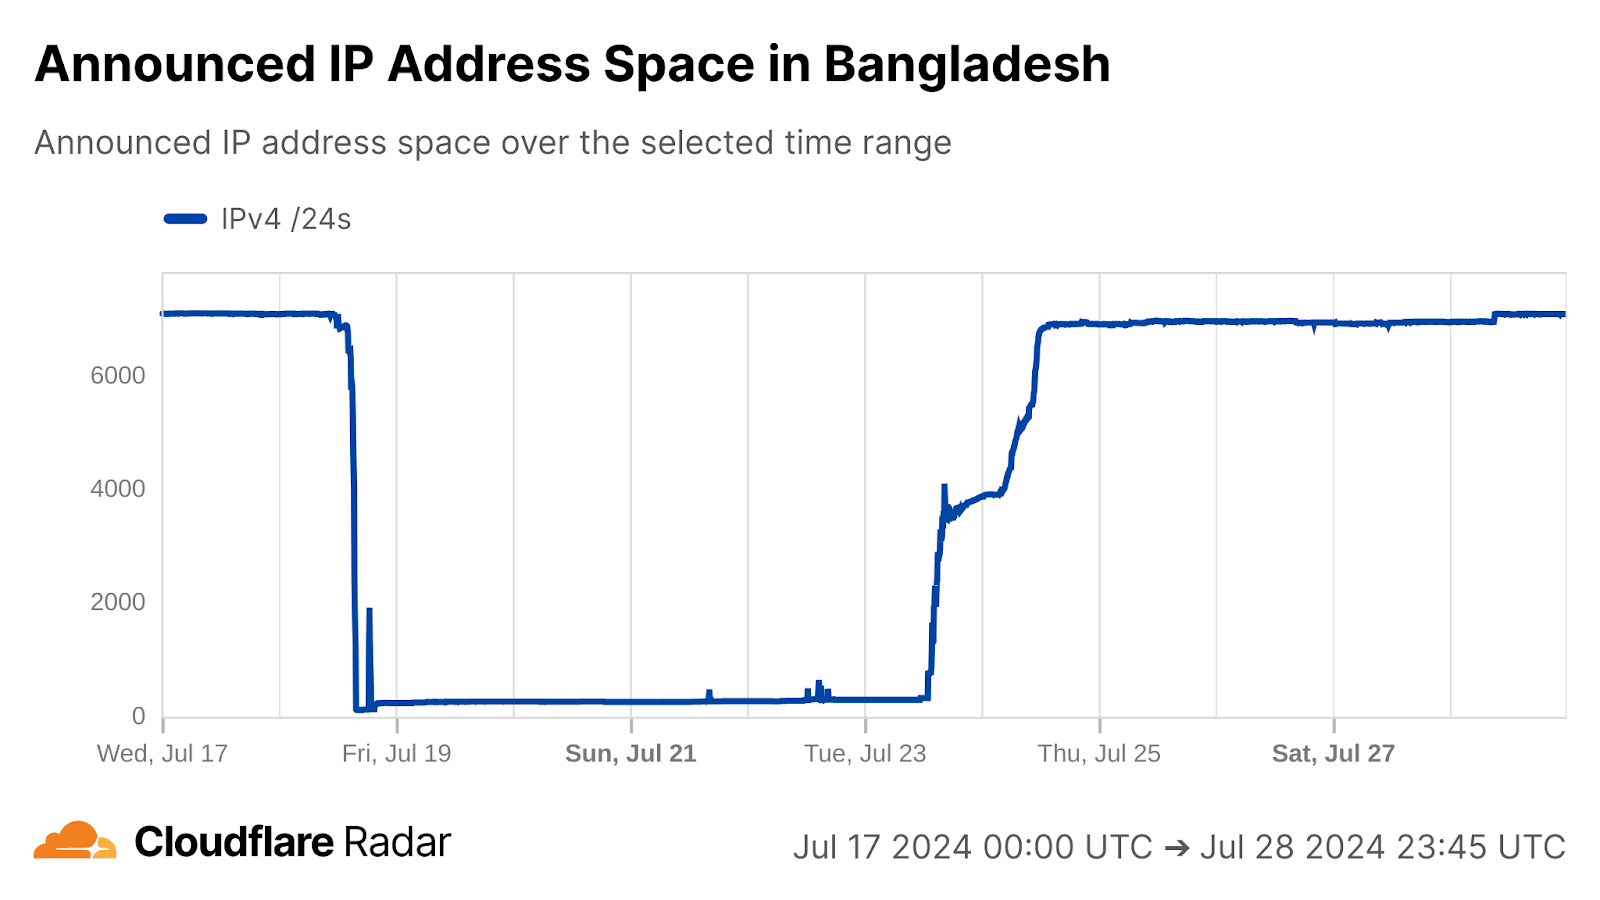
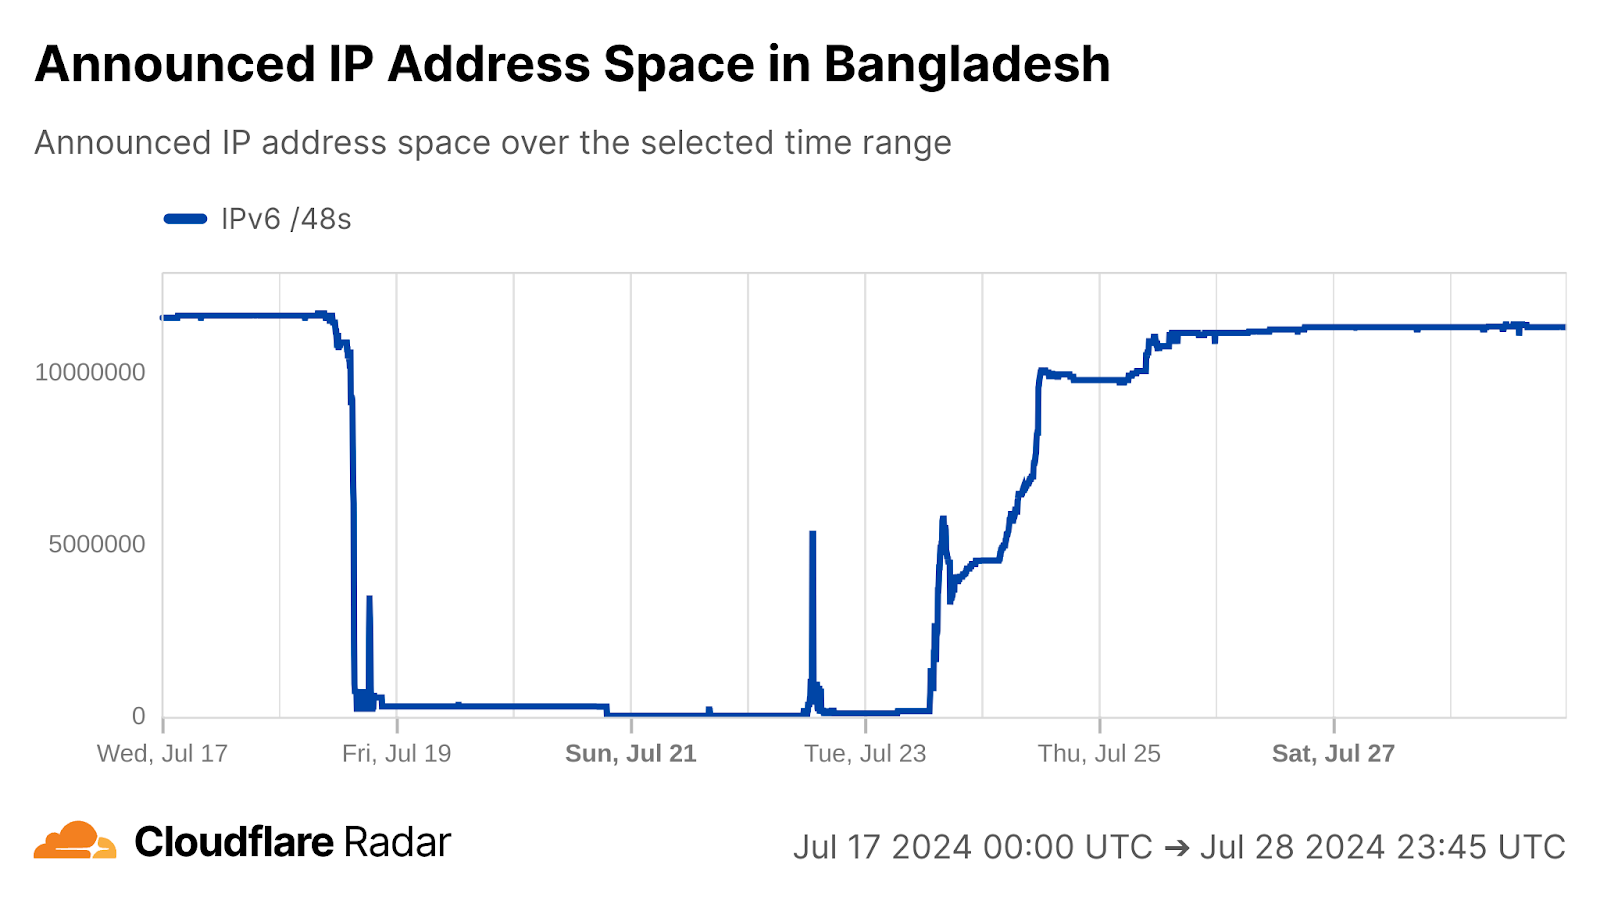
Violent student protests in Bangladesh against quotas in government jobs and rising unemployment rates led the government to order the nationwide shutdown of mobile Internet connectivity on July 18, reportedly to “ensure the security of citizens.” This government-directed shutdown ultimately became a near-complete Internet outage for the country, as broadband networks were taken offline as well. At a country level, Internet traffic in Bangladesh dropped to near zero just before 21:00 local time (15:00 UTC). Announced IP address space from the country dropped to near zero at that time as well, meaning that nearly every network in the country was disconnected from the Internet.
Traffic and announced IP address space at a national level began to recover around 18:00 local time (12:00 UTC) on July 23, and continued over the next several days, as fixed broadband connectivity was restored, with mobile connectivity returning on July 28. The initial restoration was characterized as a “trial run”, prioritizing banking, commercial sectors, technology firms, exporters, outsourcing providers and media outlets, according to the state minister for post, telecommunication and information technology.
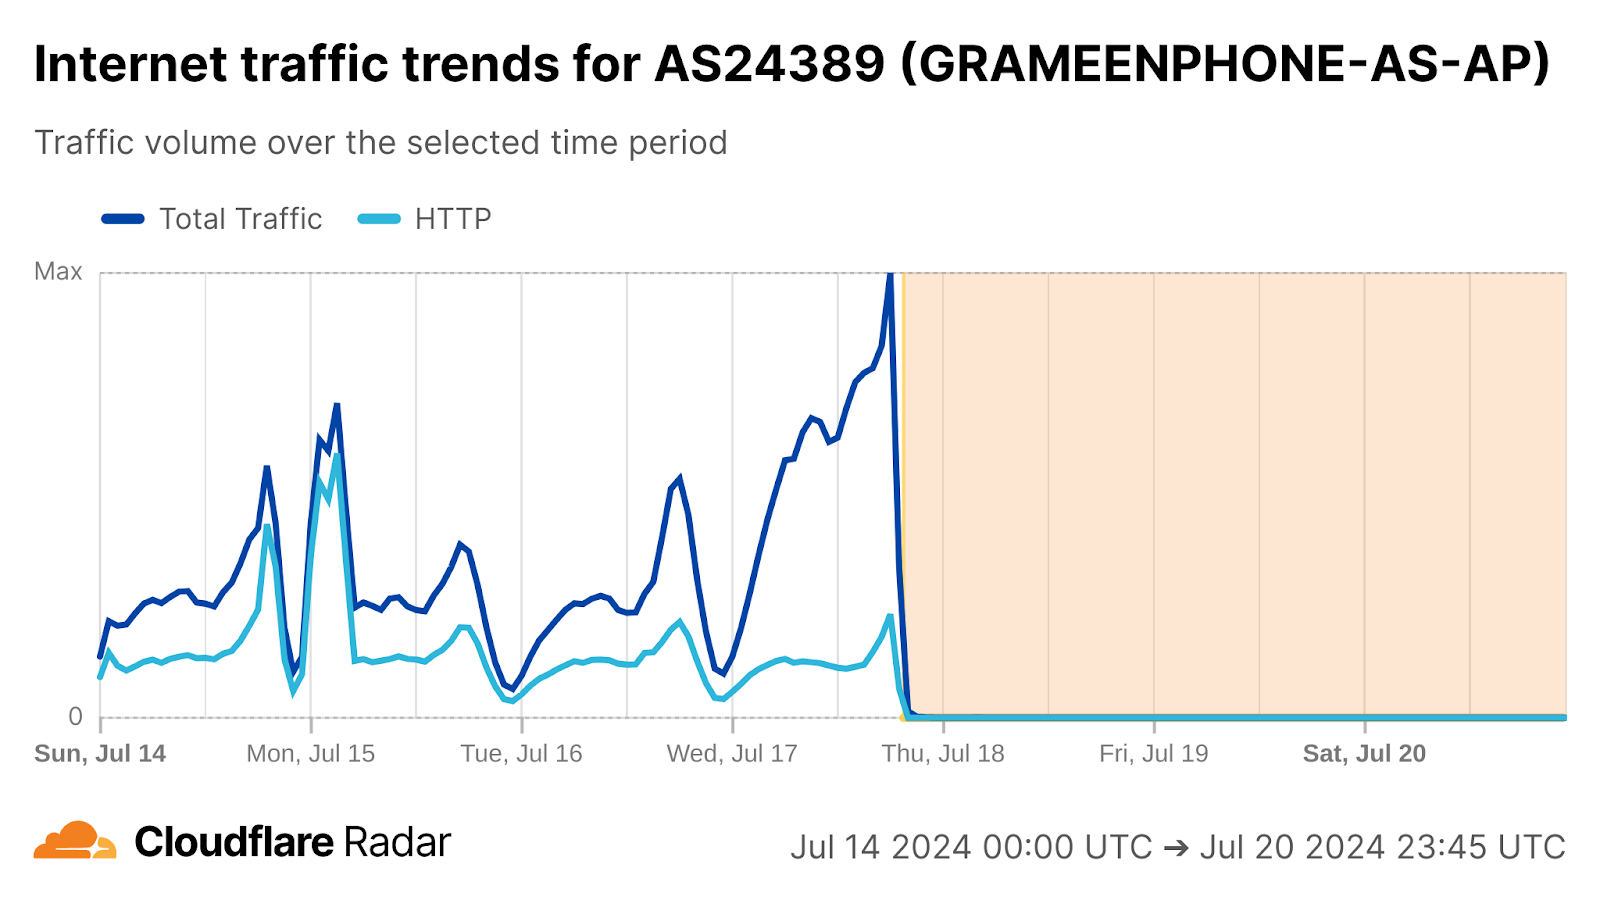
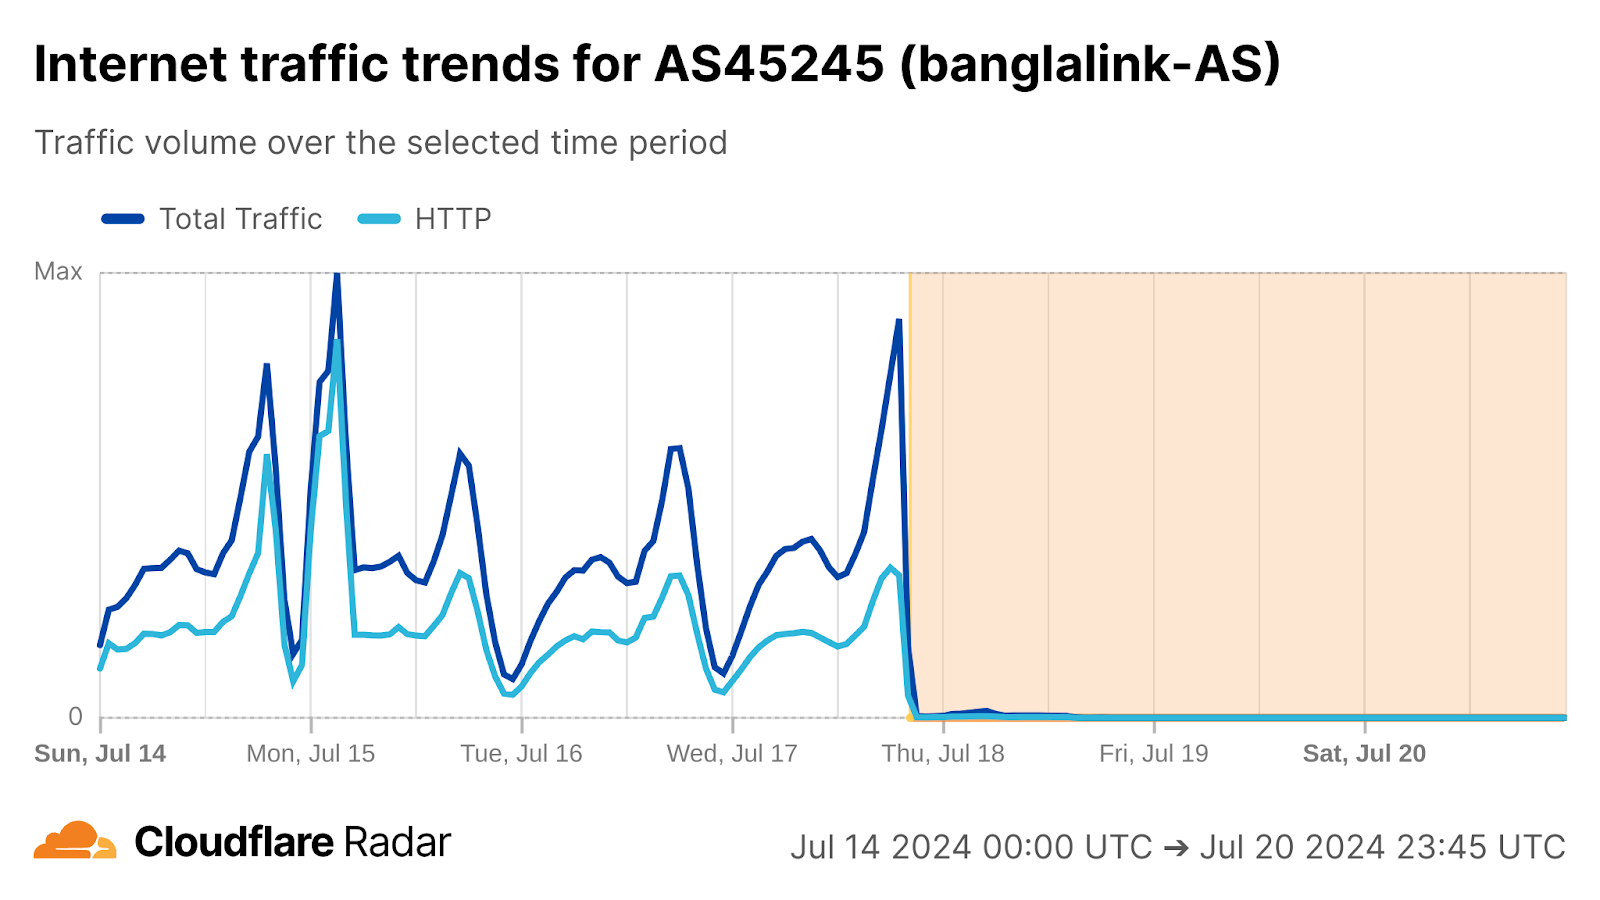
Ahead of this nationwide shutdown, we observed outages across several Bangladeshi network providers, perhaps foreshadowing what was to come. At AS24389 (Grameenphone), a complete Internet outage started at 01:30 local time on July 18 (19:30 UTC on July 17), with a total loss of both Internet traffic and announced IP address space.
These mobile connectivity outages lasted from July 18 through July 28. Just a few days after connectivity was restored, additional clashes between police and protestors drove the government to order mobile Internet connectivity to be shut down again. As shown in the graphs below, traffic on these mobile network providers dropped between 13:30 and 14:15 local time (07:30 to 08:15 UTC) on Sunday, August 4.
These protests ultimately led the government to order a full Internet shutdown in the country, with both traffic and announced IP address space dropping precipitously around 10:30 local time (04:30 UTC) on Monday, August 5. However, the shutdown appeared to be short-lived, as broadband connectivity began to recover around 13:20 local time (07:20 UTC), with mobile connectivity being restored around 14:00 local time (08:00 UTC).
Iraqi Kurdistan
Both Iraq and Iraqi Kurdistan (the autonomous Kurdistan region in the northern part of the country) regularly implement government directed Internet shutdowns to prevent cheating on secondary and baccalaureate exams. Within Iraqi Kurdistan, we observed two sets of exam-related Internet shutdowns during the third quarter. The impacts of the shutdowns are visible on traffic from networks that operate within the region, as well as on the country-level graphs for Iraq.
The first round of shutdowns occurred in July, impacting AS59625 (KorekTel), AS21277 (Newroz Telecom), AS48492 (IQ Online), and AS206206 (KNET) between 06:00 – 08:00 local time (03:00 – 05:00 UTC) on July 3, 7, 10, and 14. This is consistent with shutdowns observed in the second quarter, as well as in June 2023. None of the impacted networks experienced a drop in announced IP address space during these shutdowns.
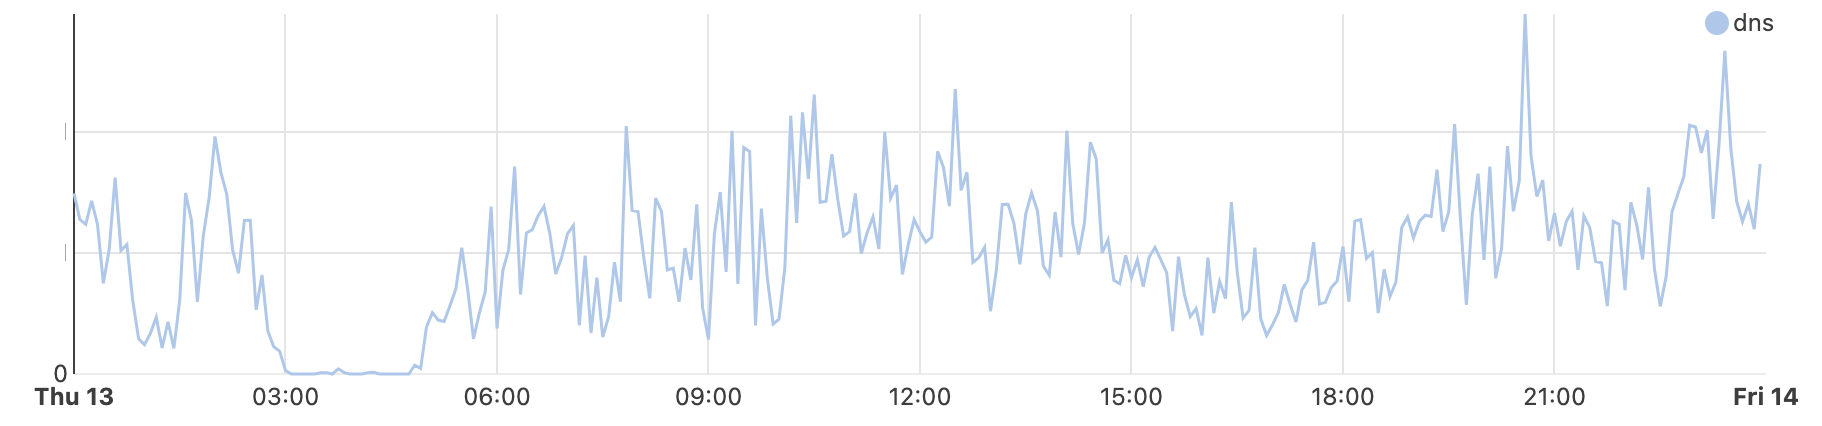
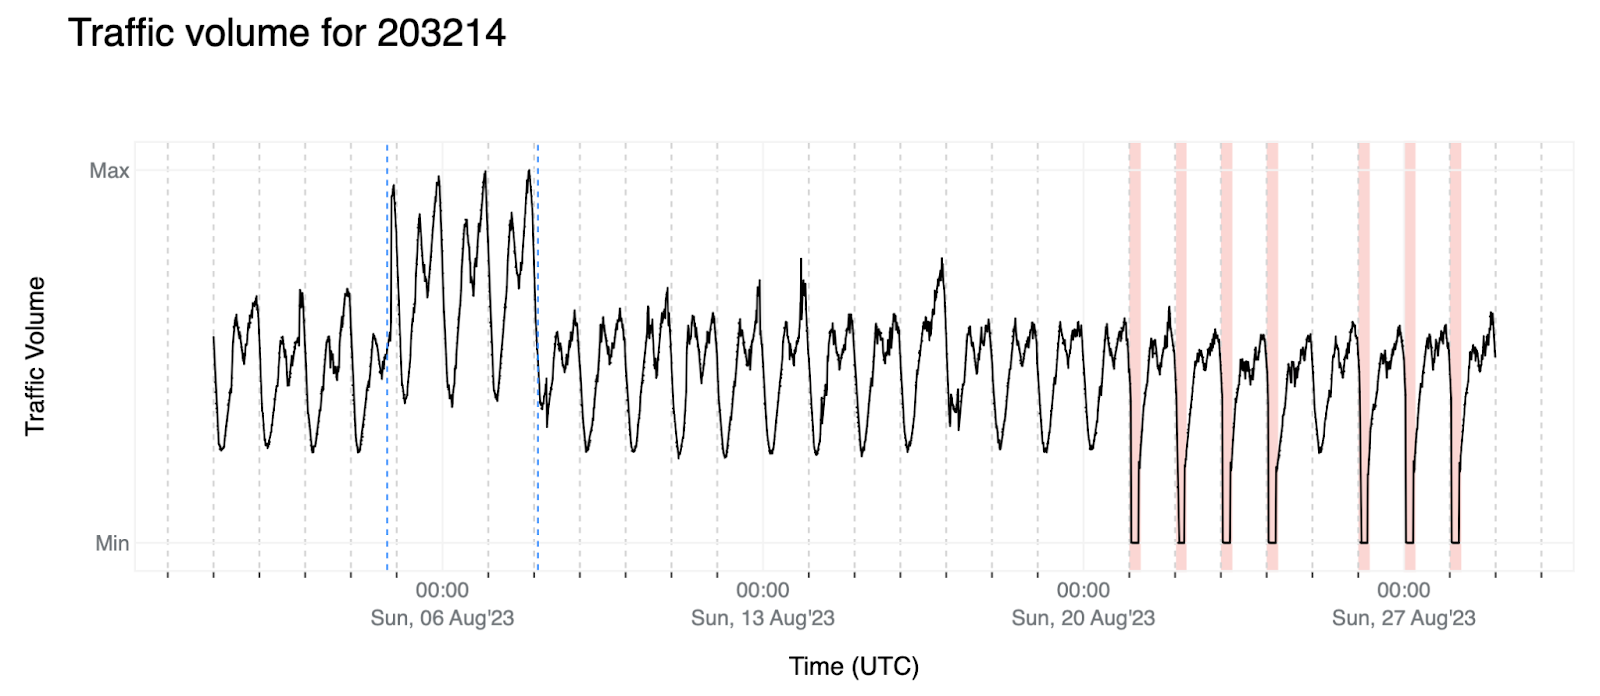
The second set of shutdowns in Iraqi Kurdistan took place across multiple days during the back half of August. On August 17, 19, 21, 24, 26, 28, and 31, all four network providers were again impacted, as seen in the graphs below, with traffic dropping between 06:00 – 08:00 local time (03:00 – 05:00 UTC).
Iraq
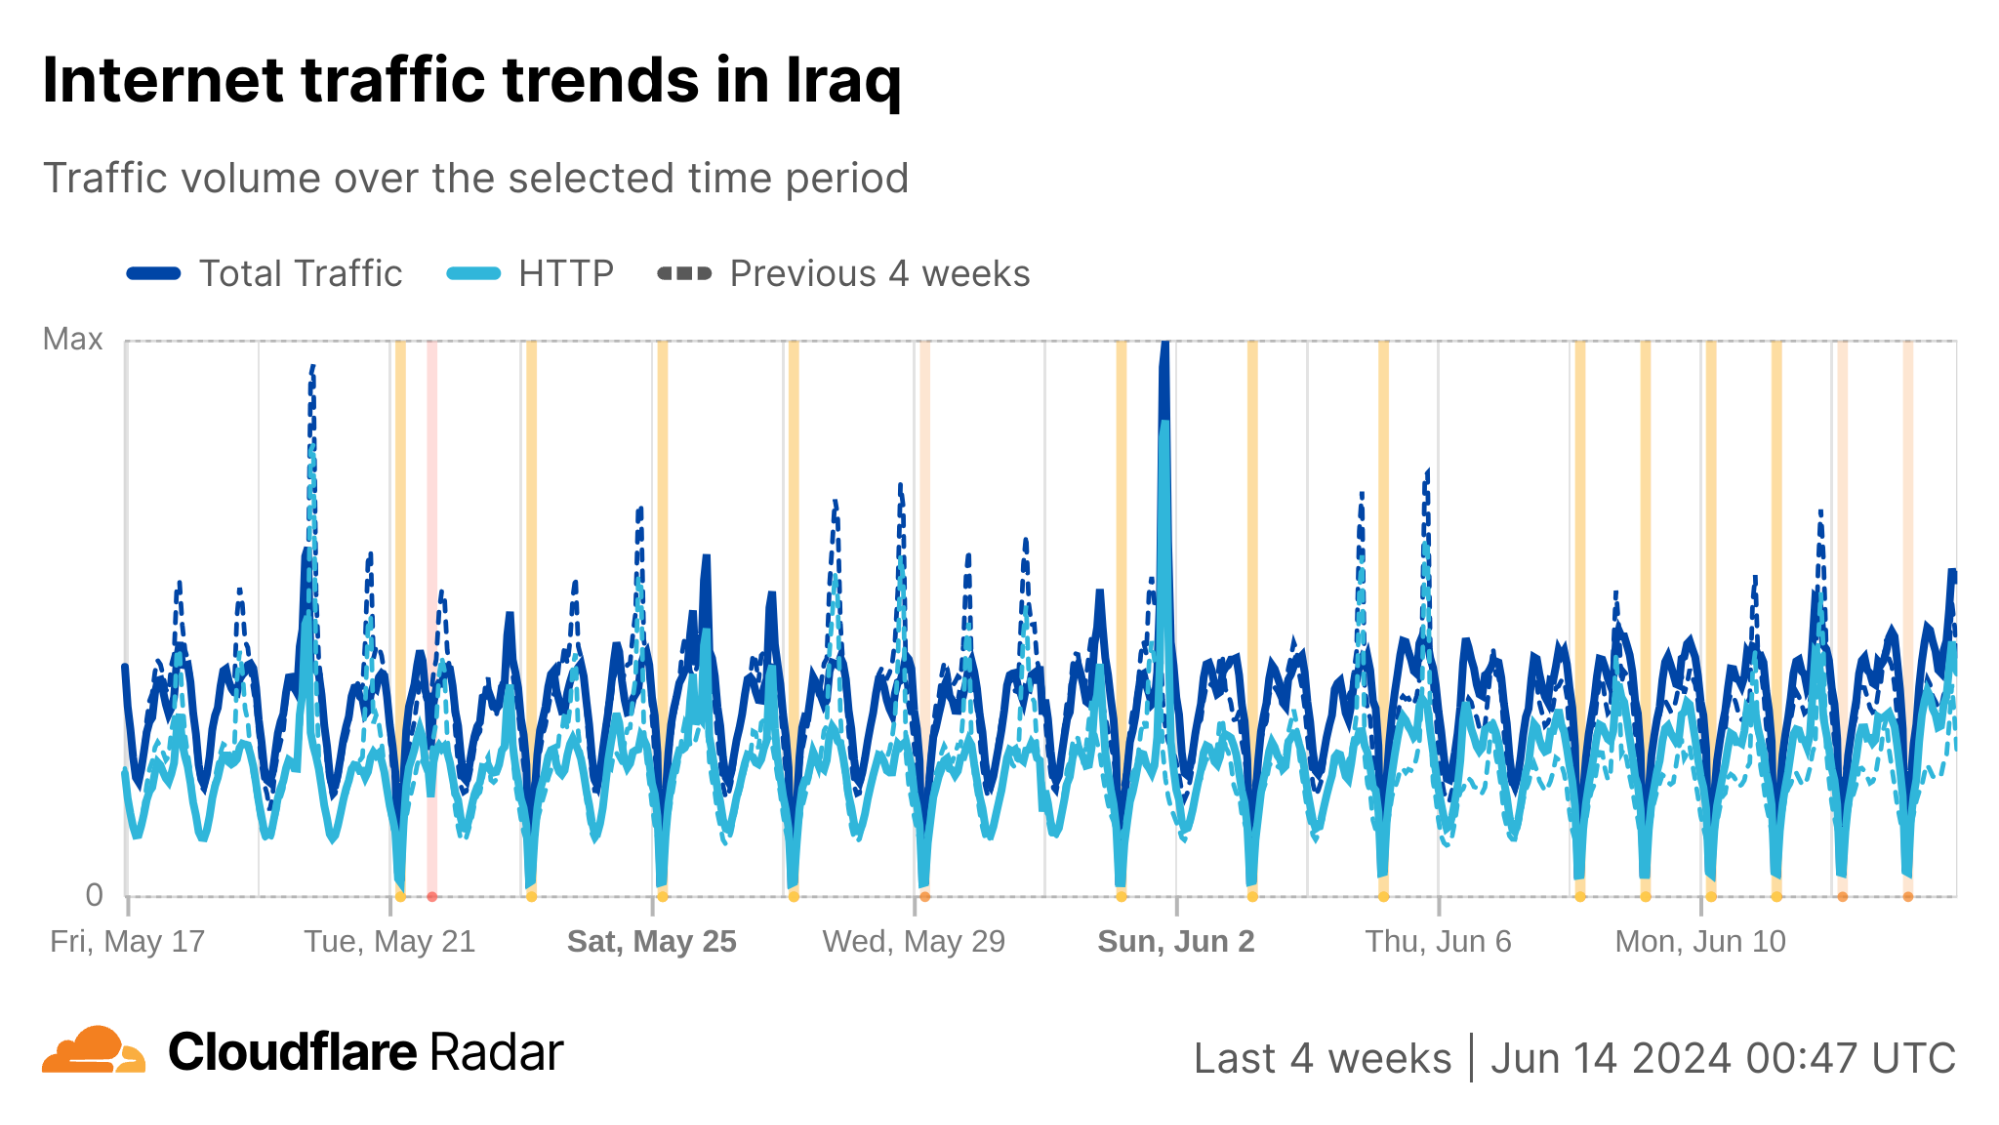
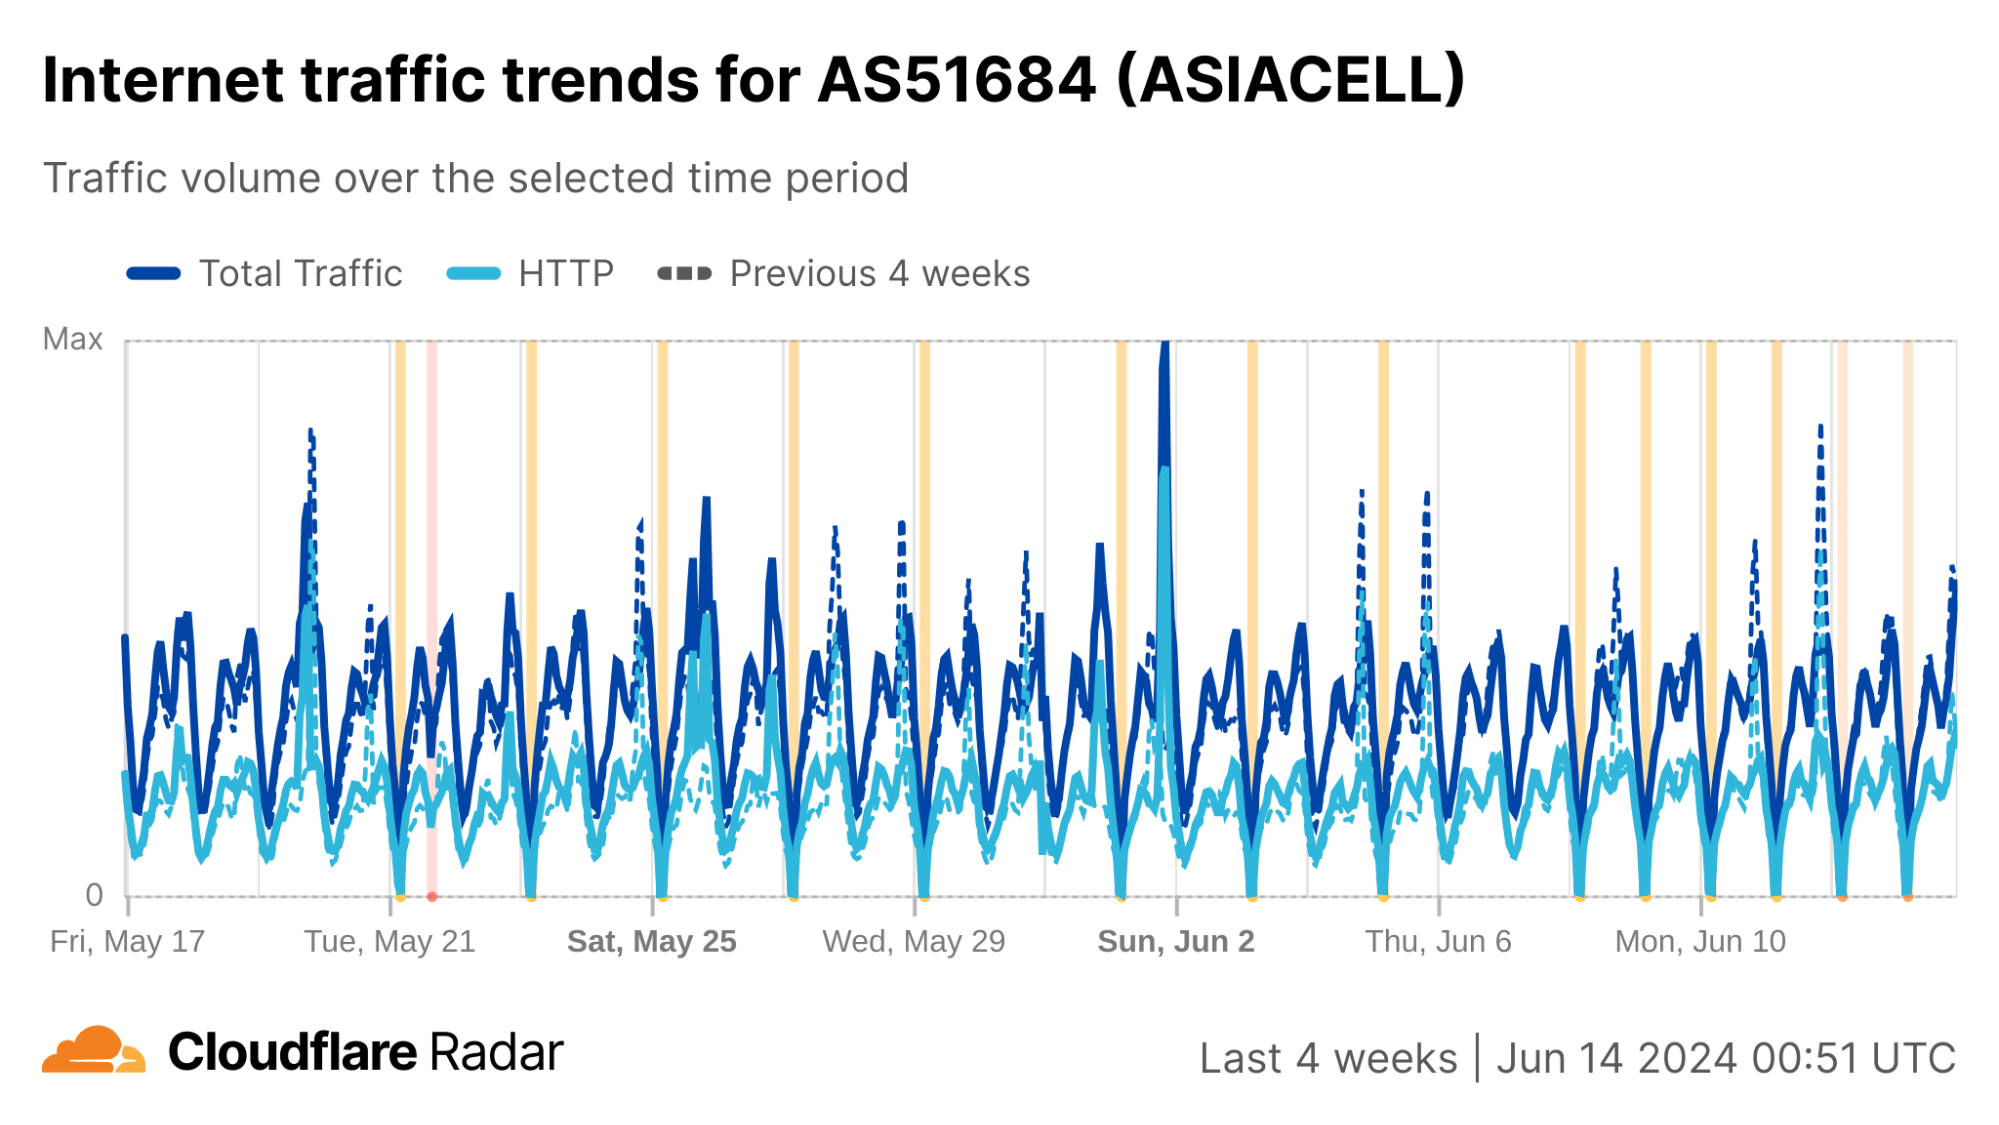
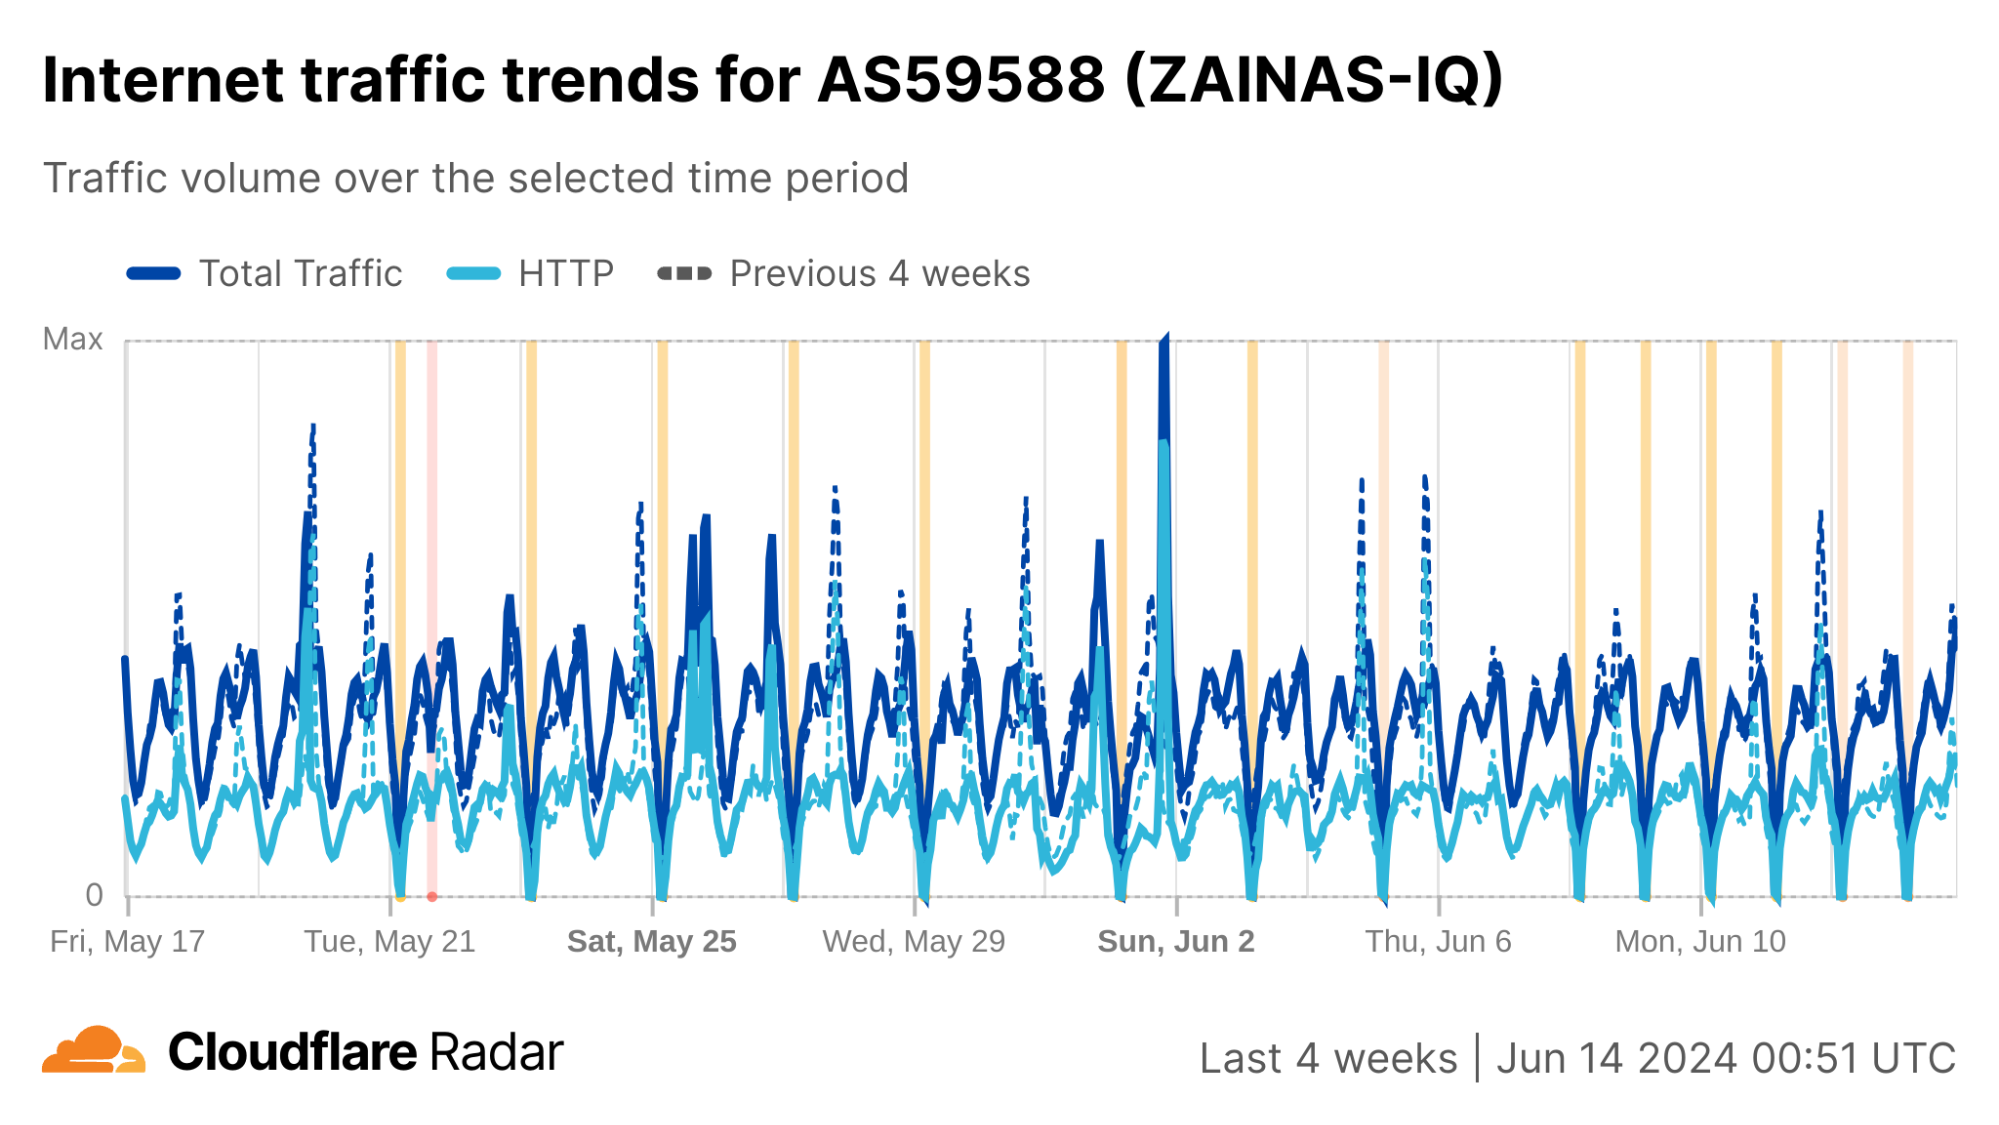
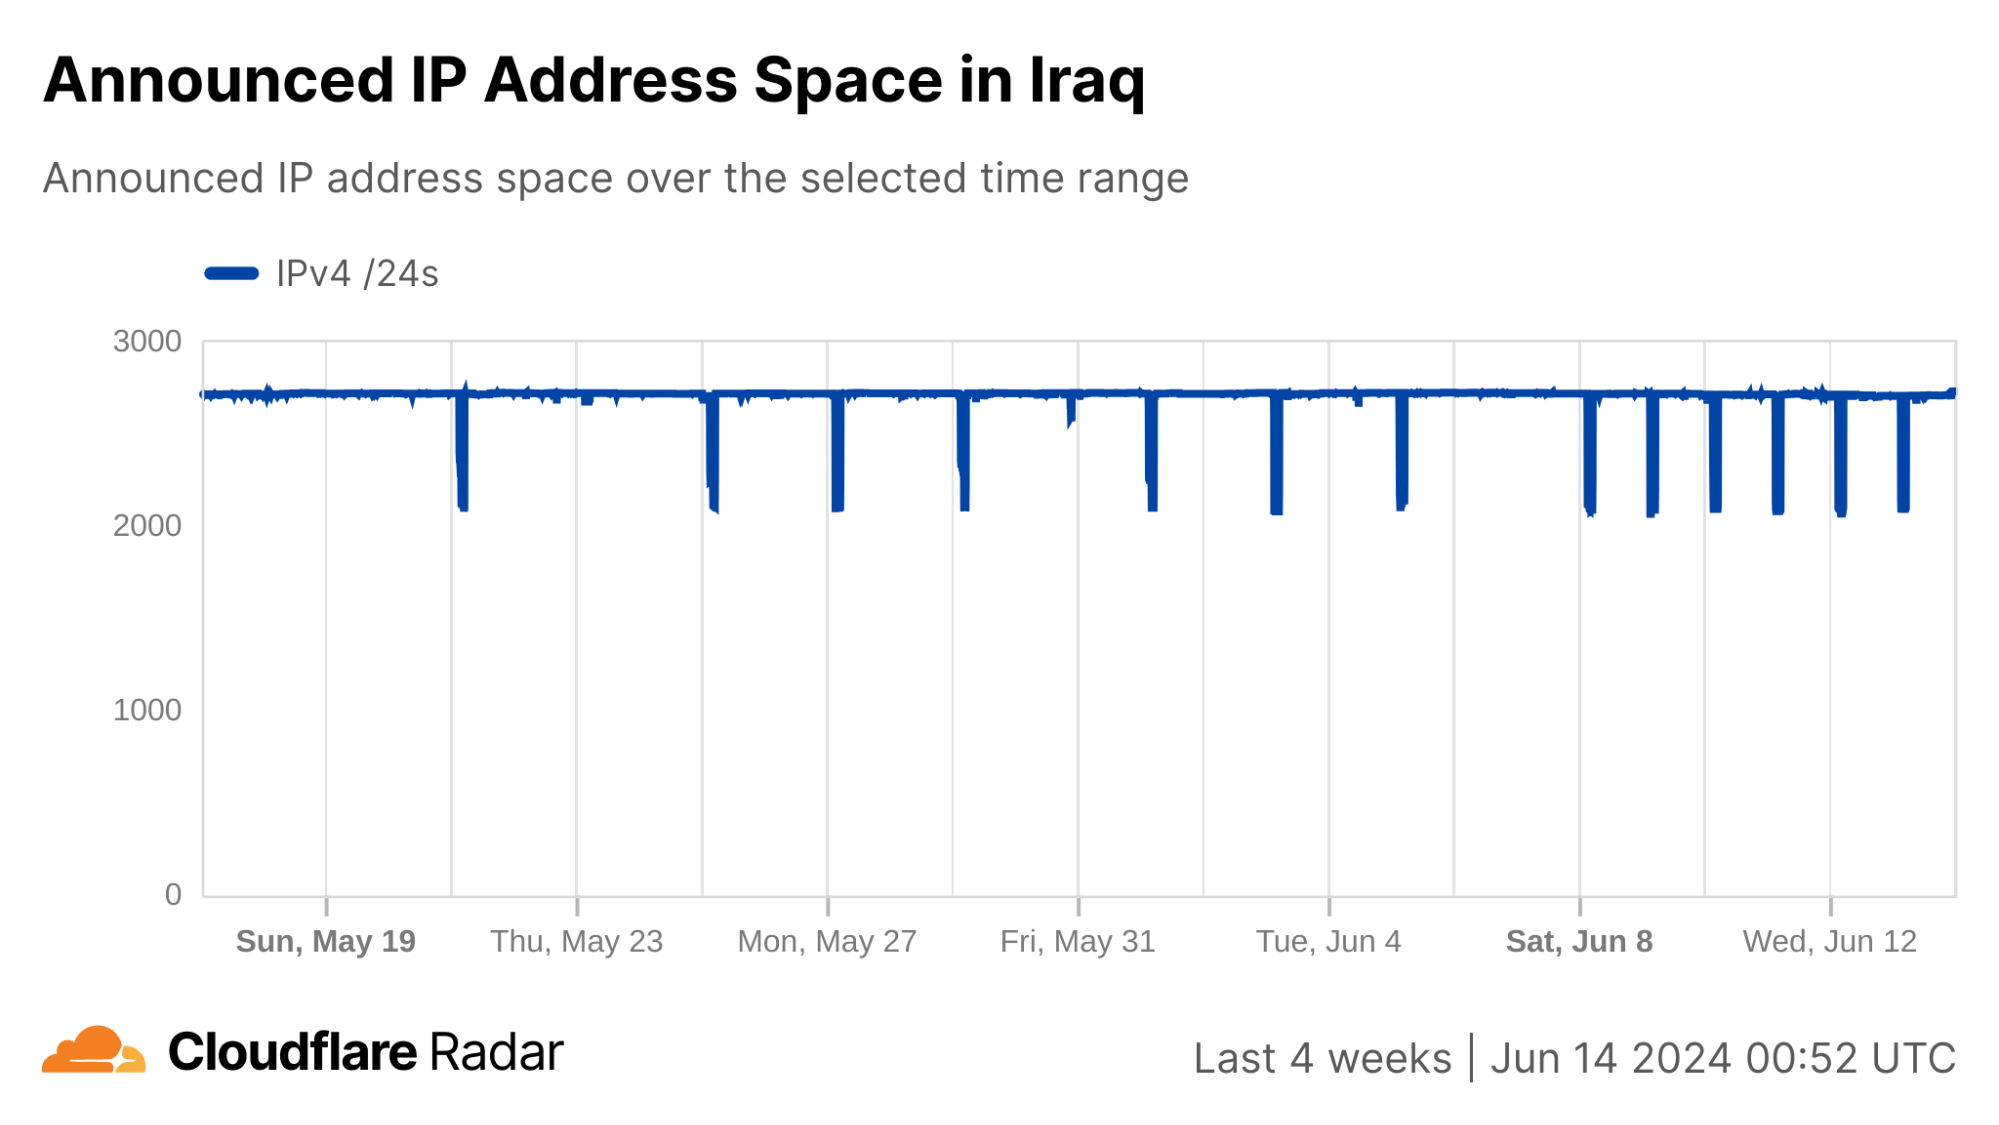
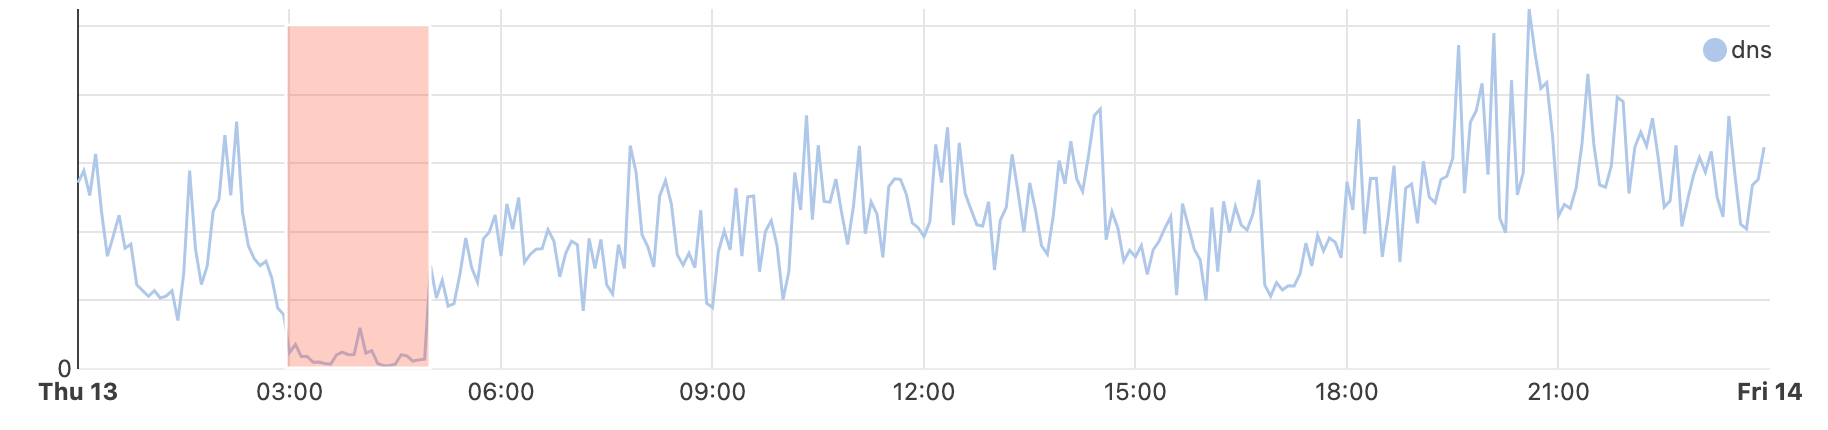
In Iraq, a second round of exams for 12th graders resulted in over two weeks of regular Internet shutdowns across the country occurring between 06:00 – 08:00 local time (03:00 – 05:00 UTC) on multiple days between August 29 and September 16, intended to prevent cheating on second ministerial exams for secondary education. Both HTTP traffic and announced IP address space from Iraq dropped during these shutdowns, as seen in the graphs below.
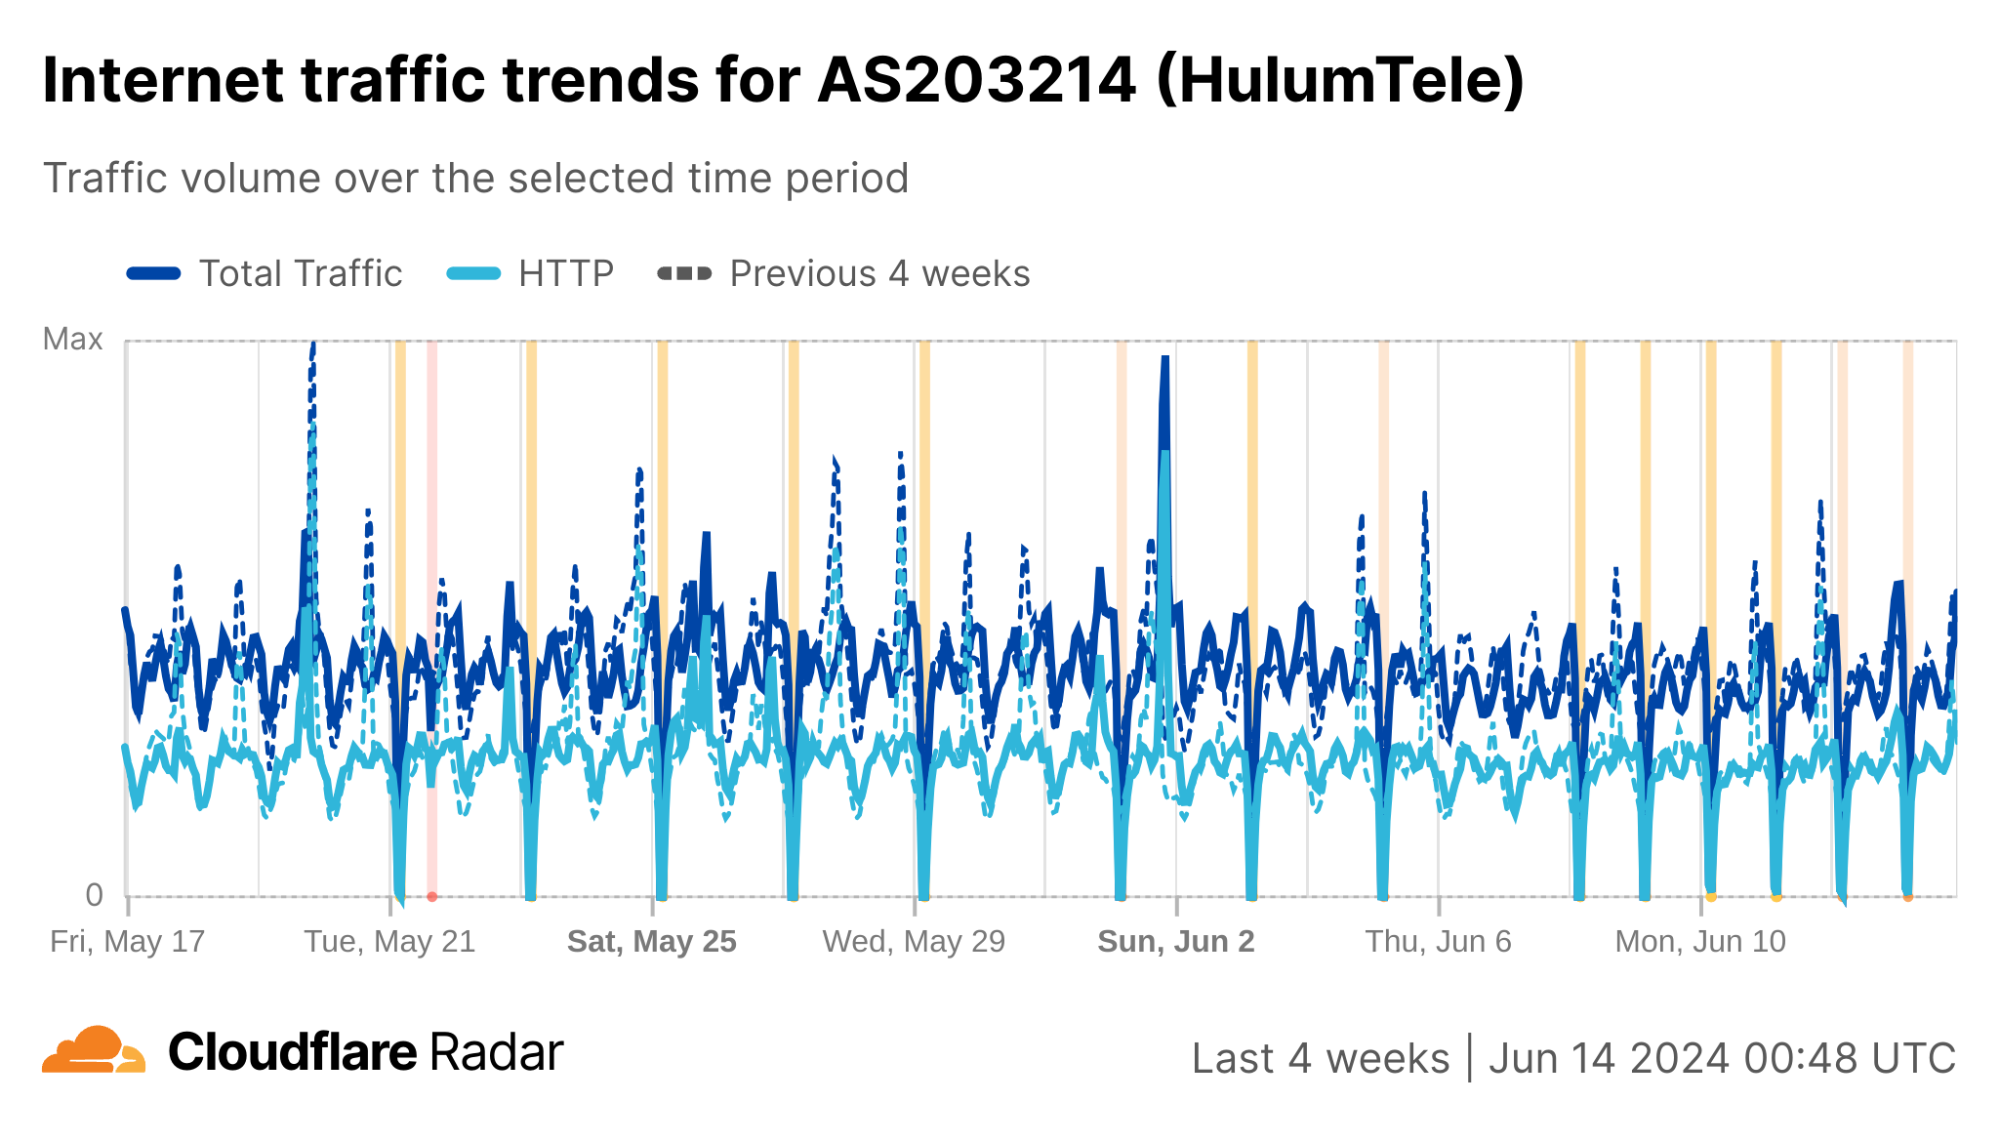
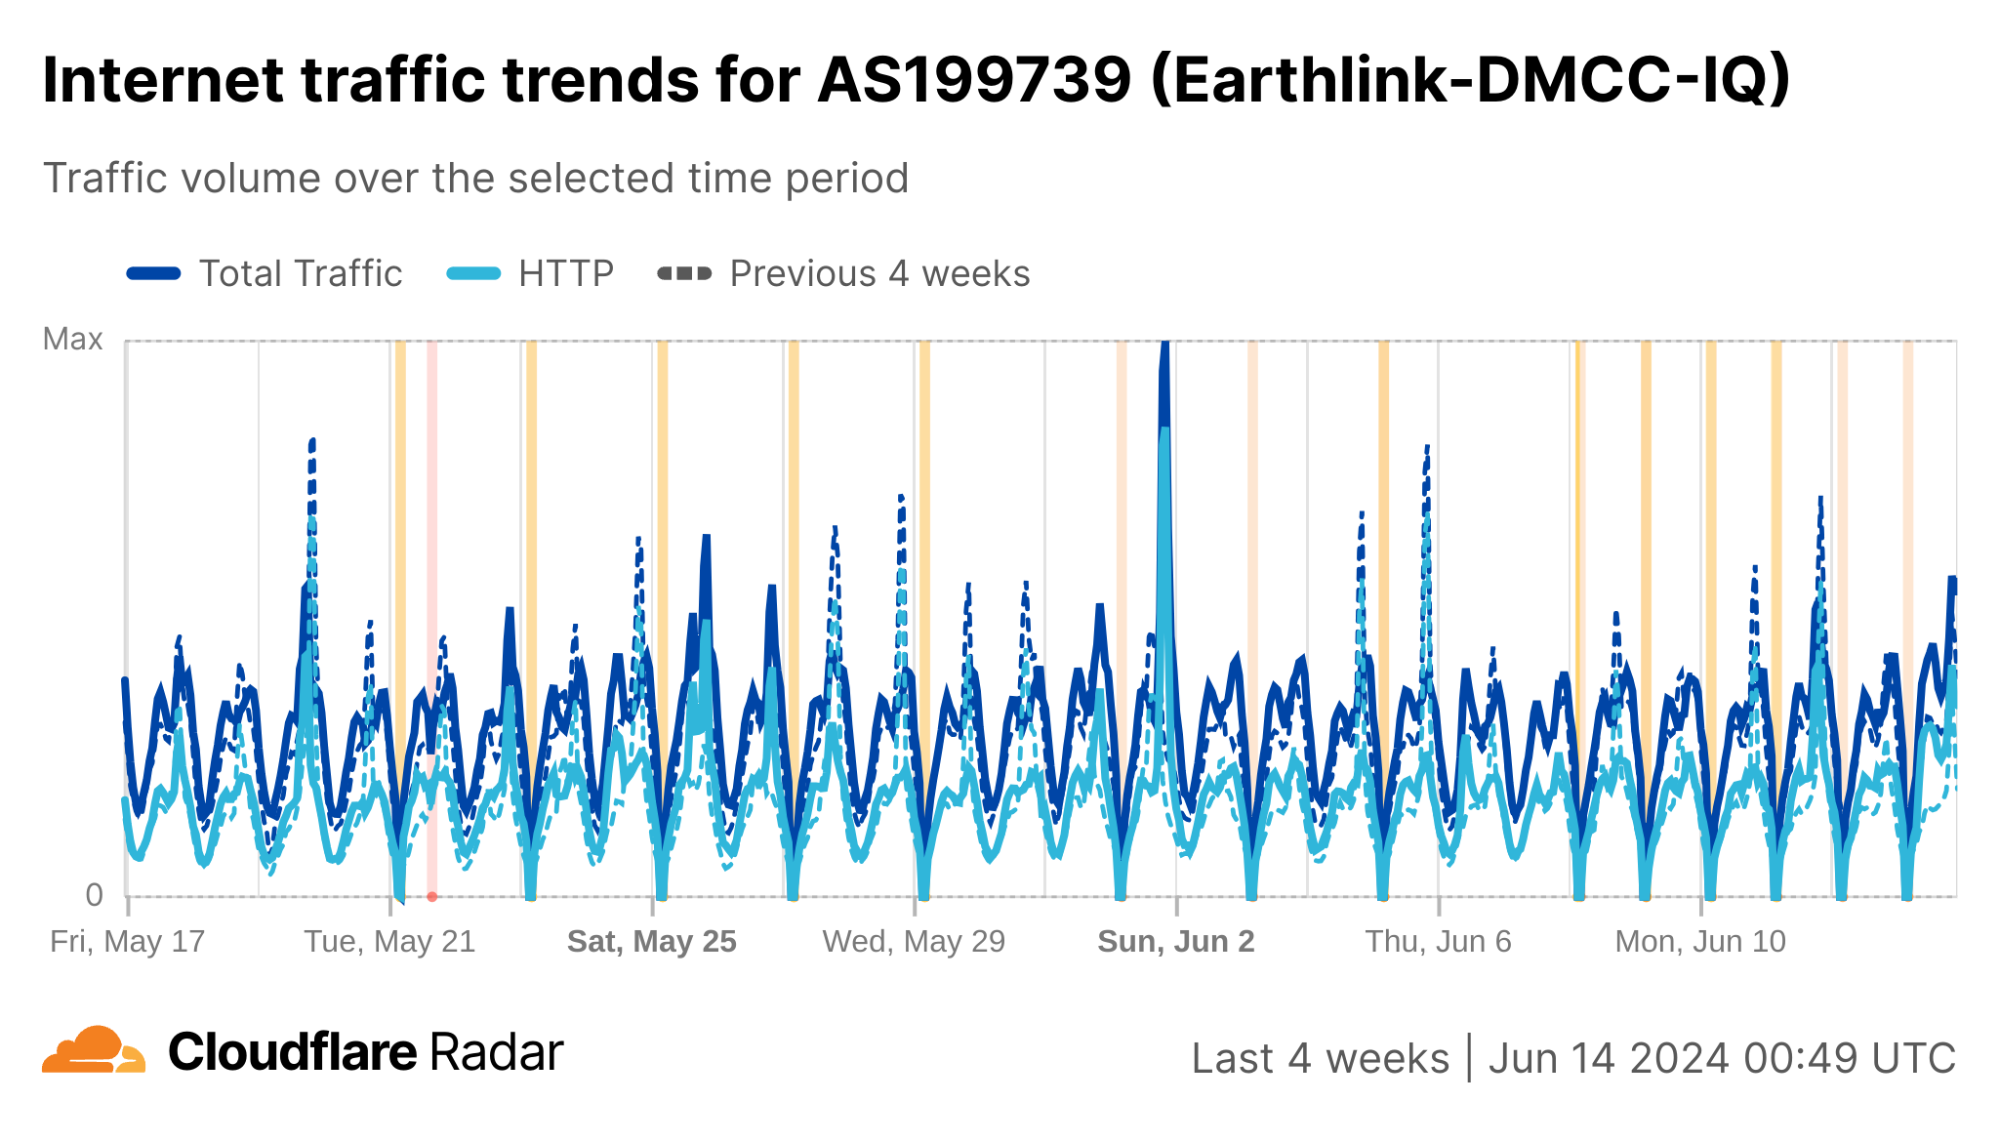
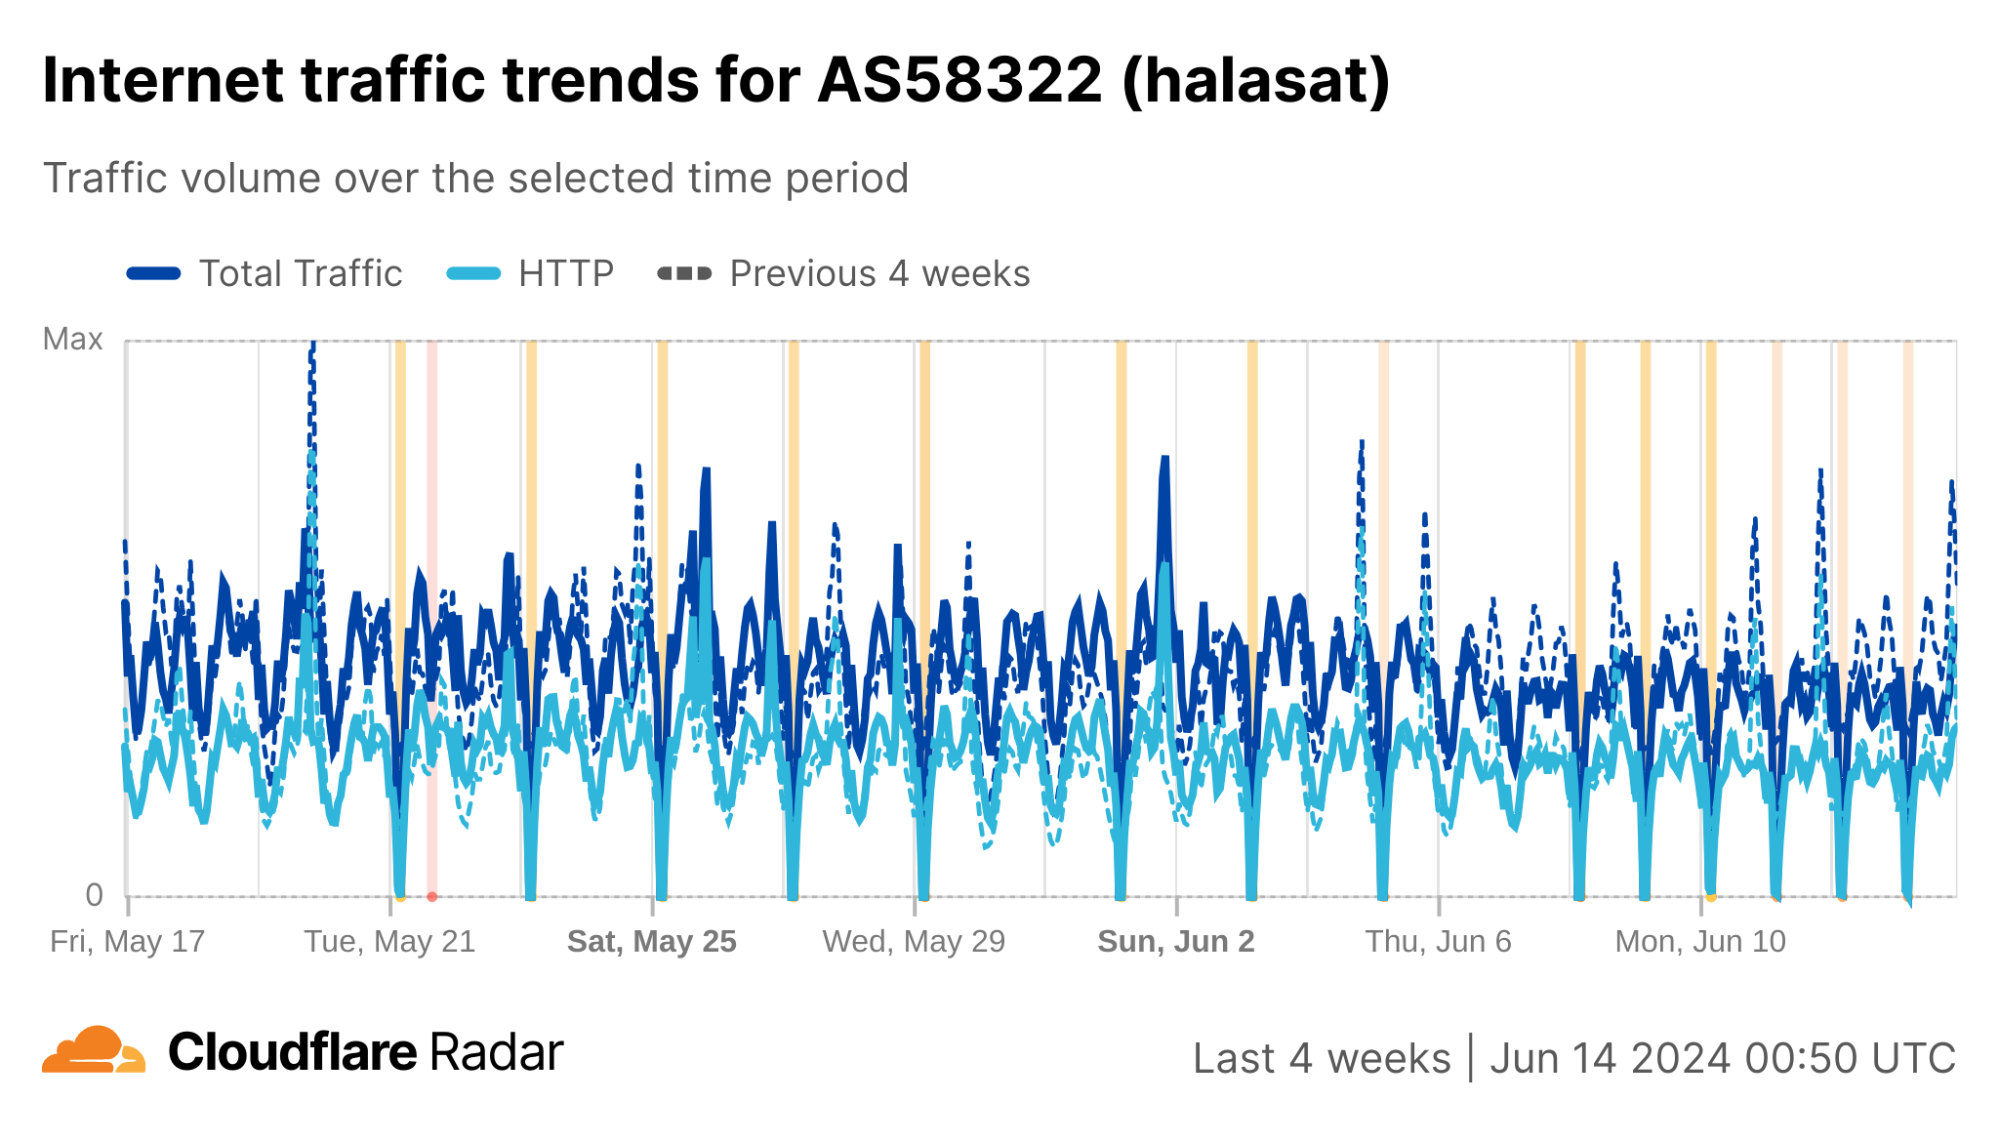
(Note that the red annotation bar visible on September 11 & 12 on both the country and network-level graphs below highlights an internal data pipeline issue, and is not associated with an Internet shutdown in Iraq.)
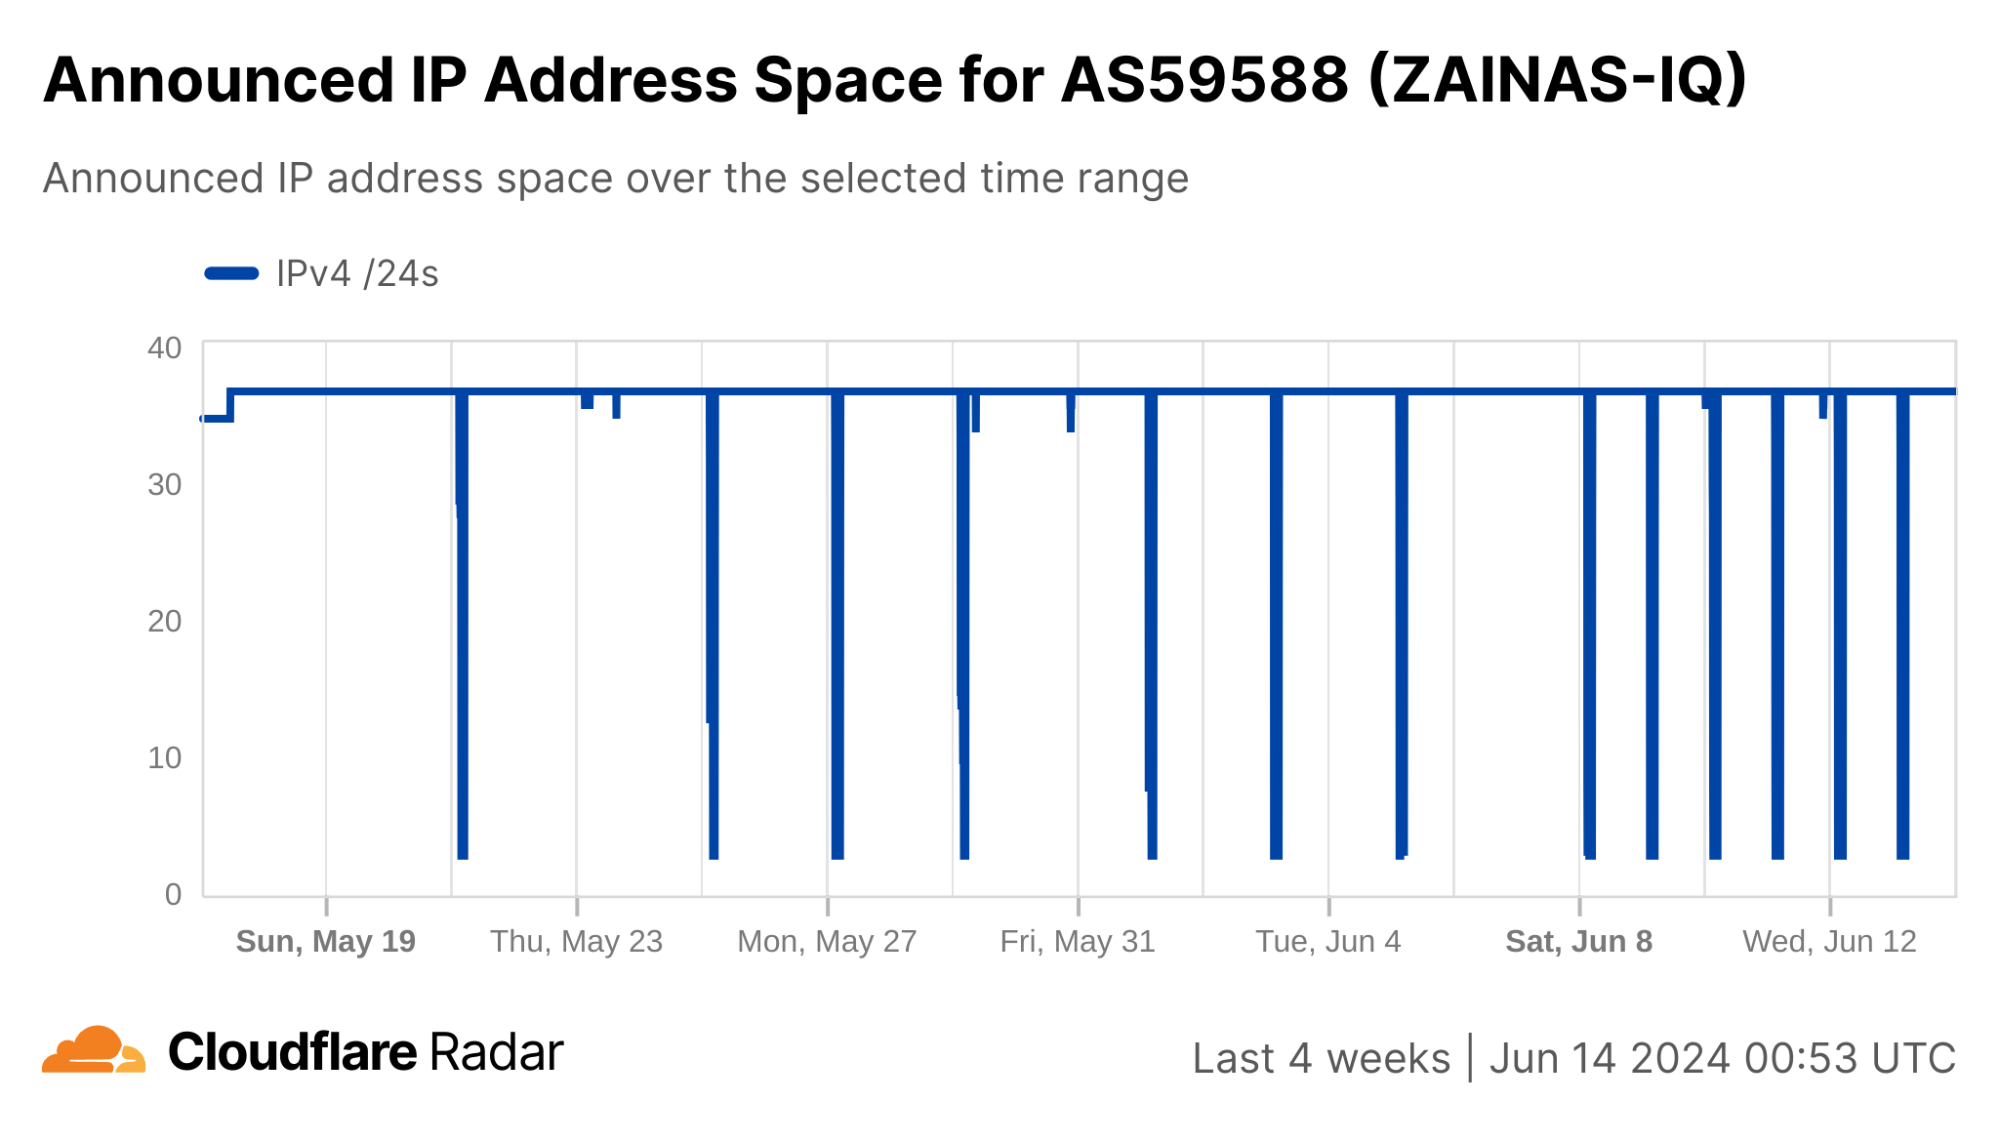
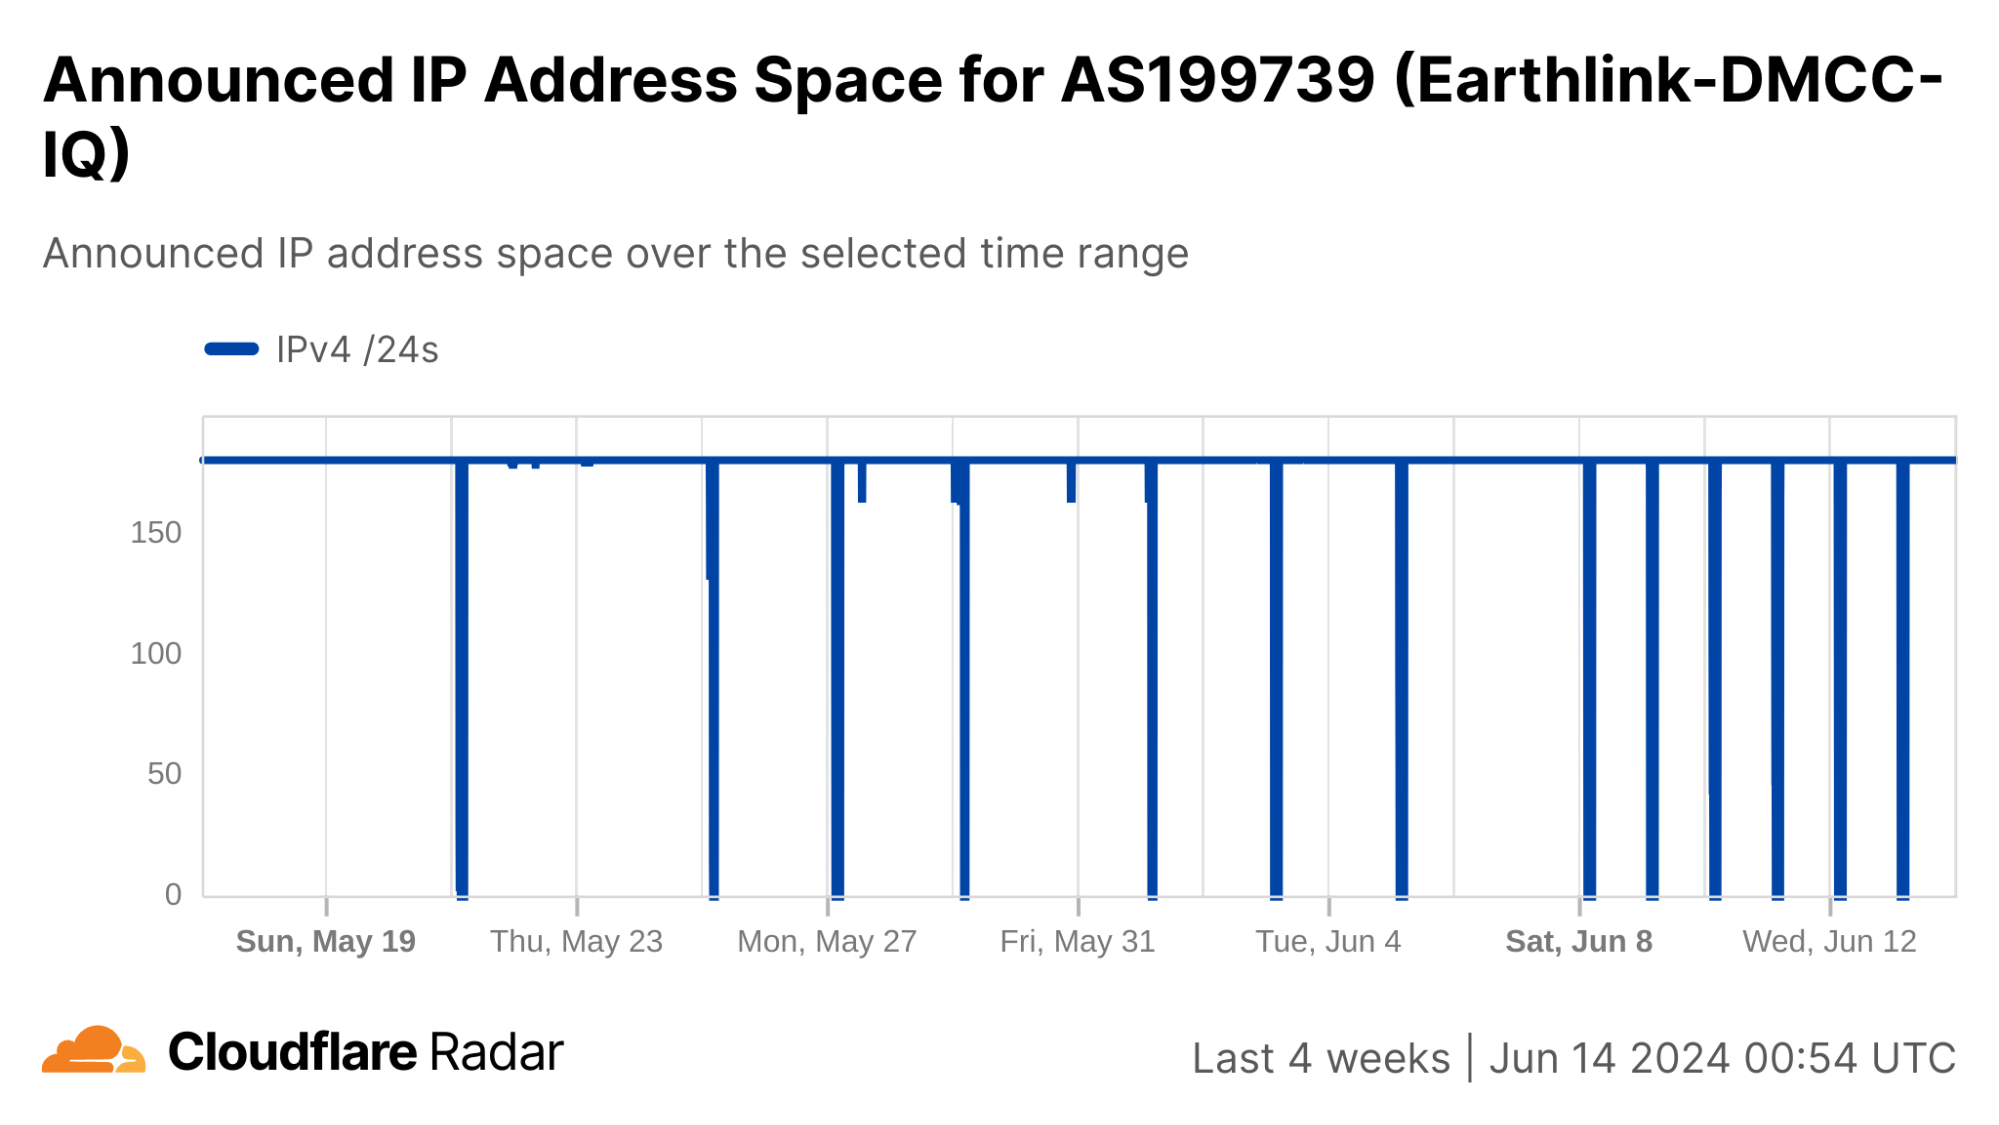
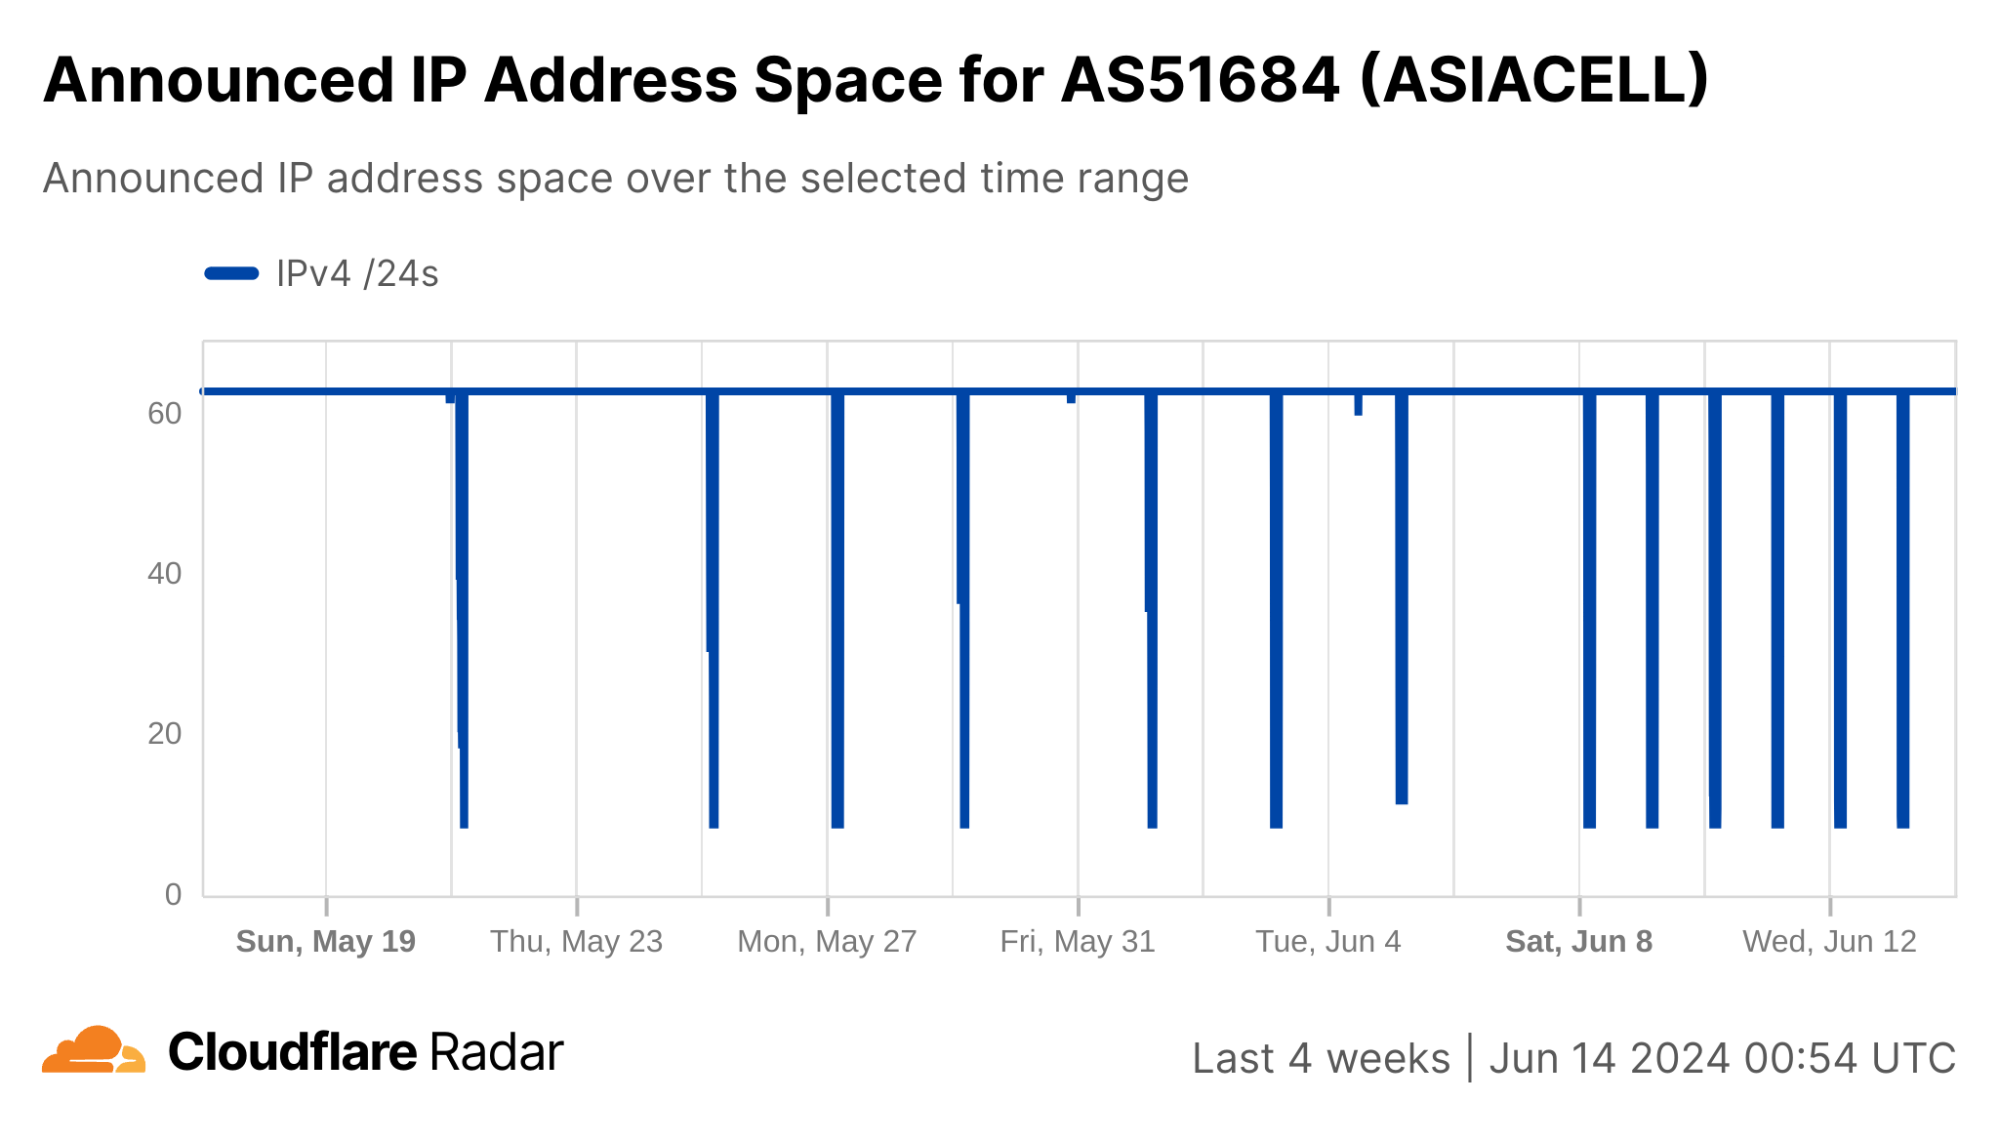
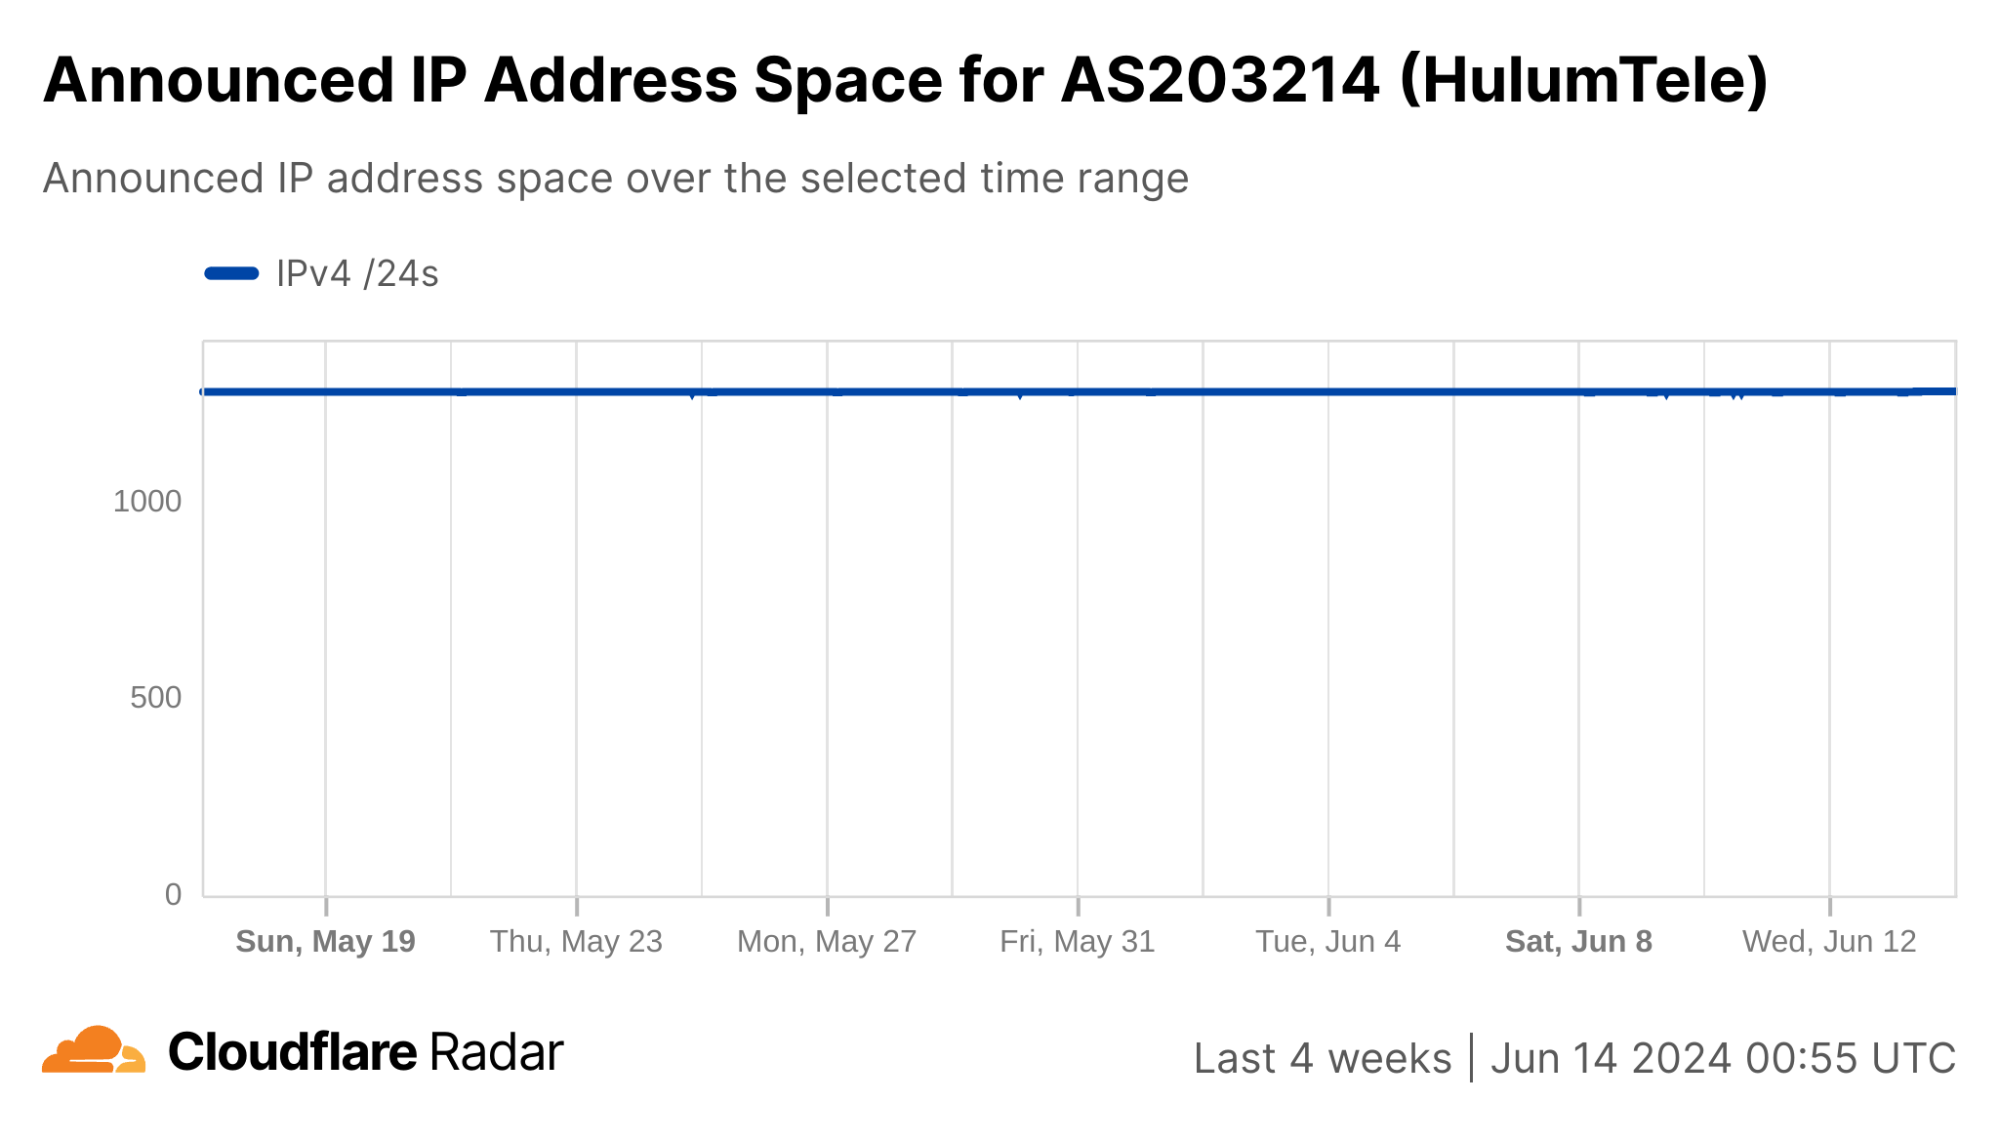
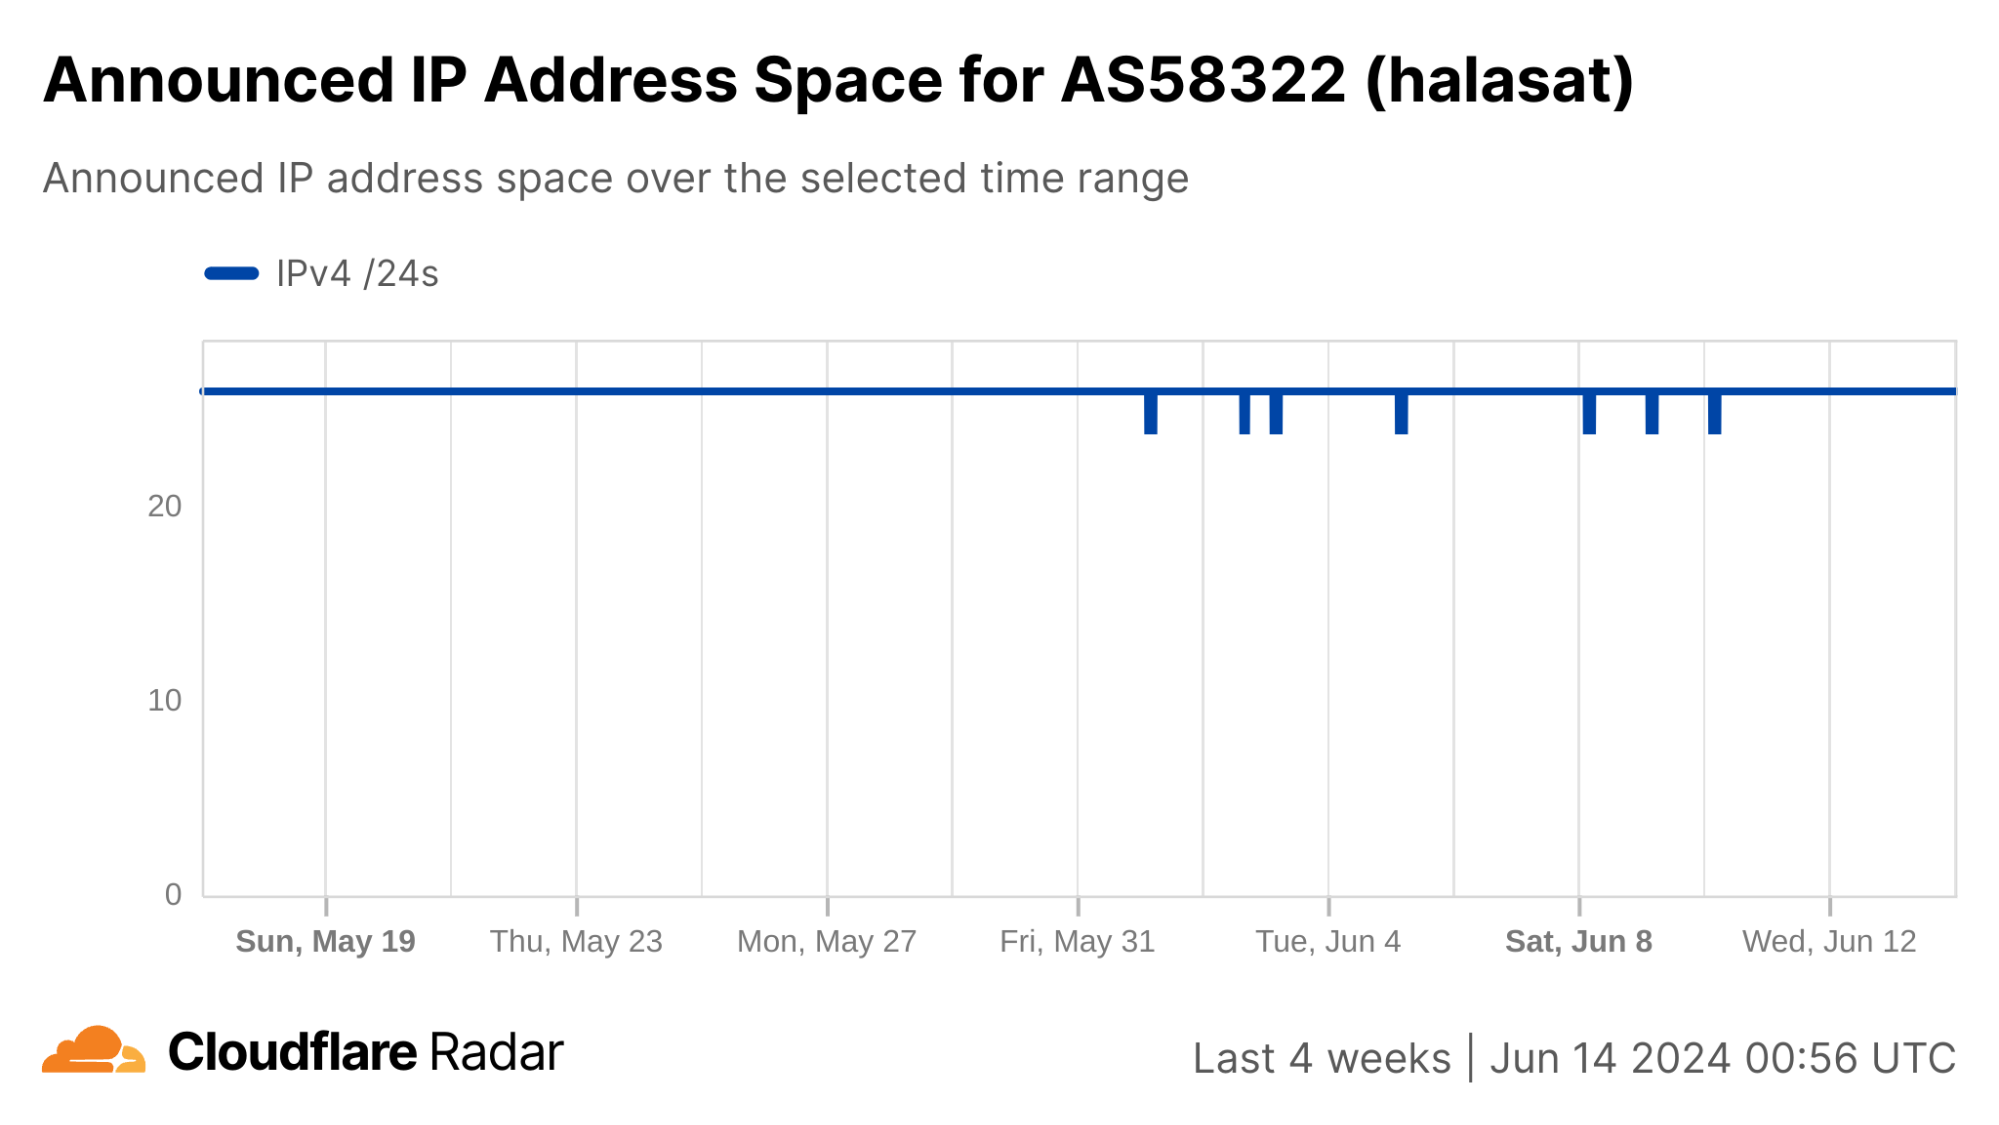
This round of government-directed shutdowns impacted multiple local network providers, including AS58322 (Halasat), AS51684 (AsiaCell), AS203214 (HulumTele), AS199739 (Earthlink), and AS59588 (ZAINAS). In reviewing the distribution of mobile device and desktop traffic at a network level, gaps were observed during the shutdowns on AS58322 and AS199739, and to a lesser extent, AS203214, suggesting that these networks were completely offline, while AS56184 and AS59588 remained at least partially online. (This is also corroborated by complete or partial loss of announced IP address space across these networks during the shutdowns.)
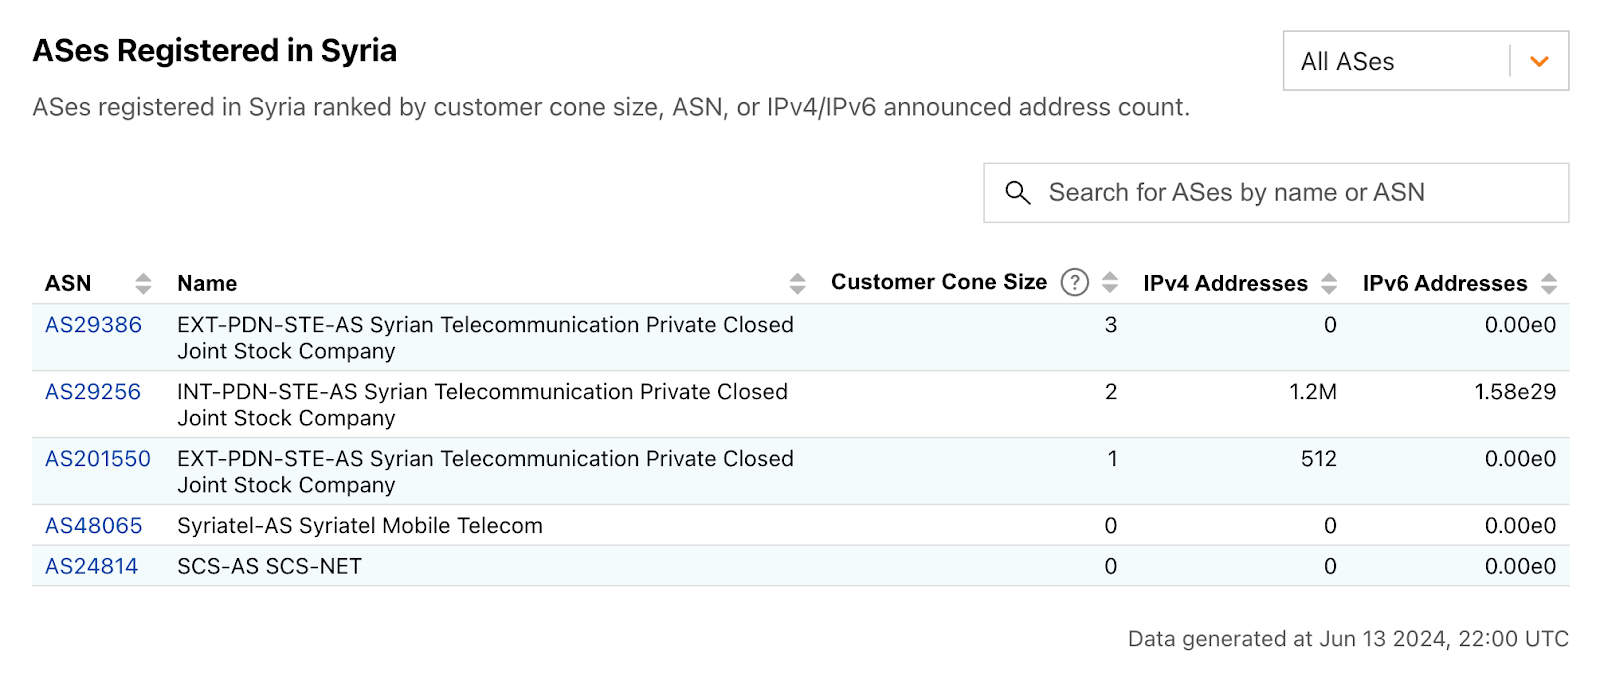
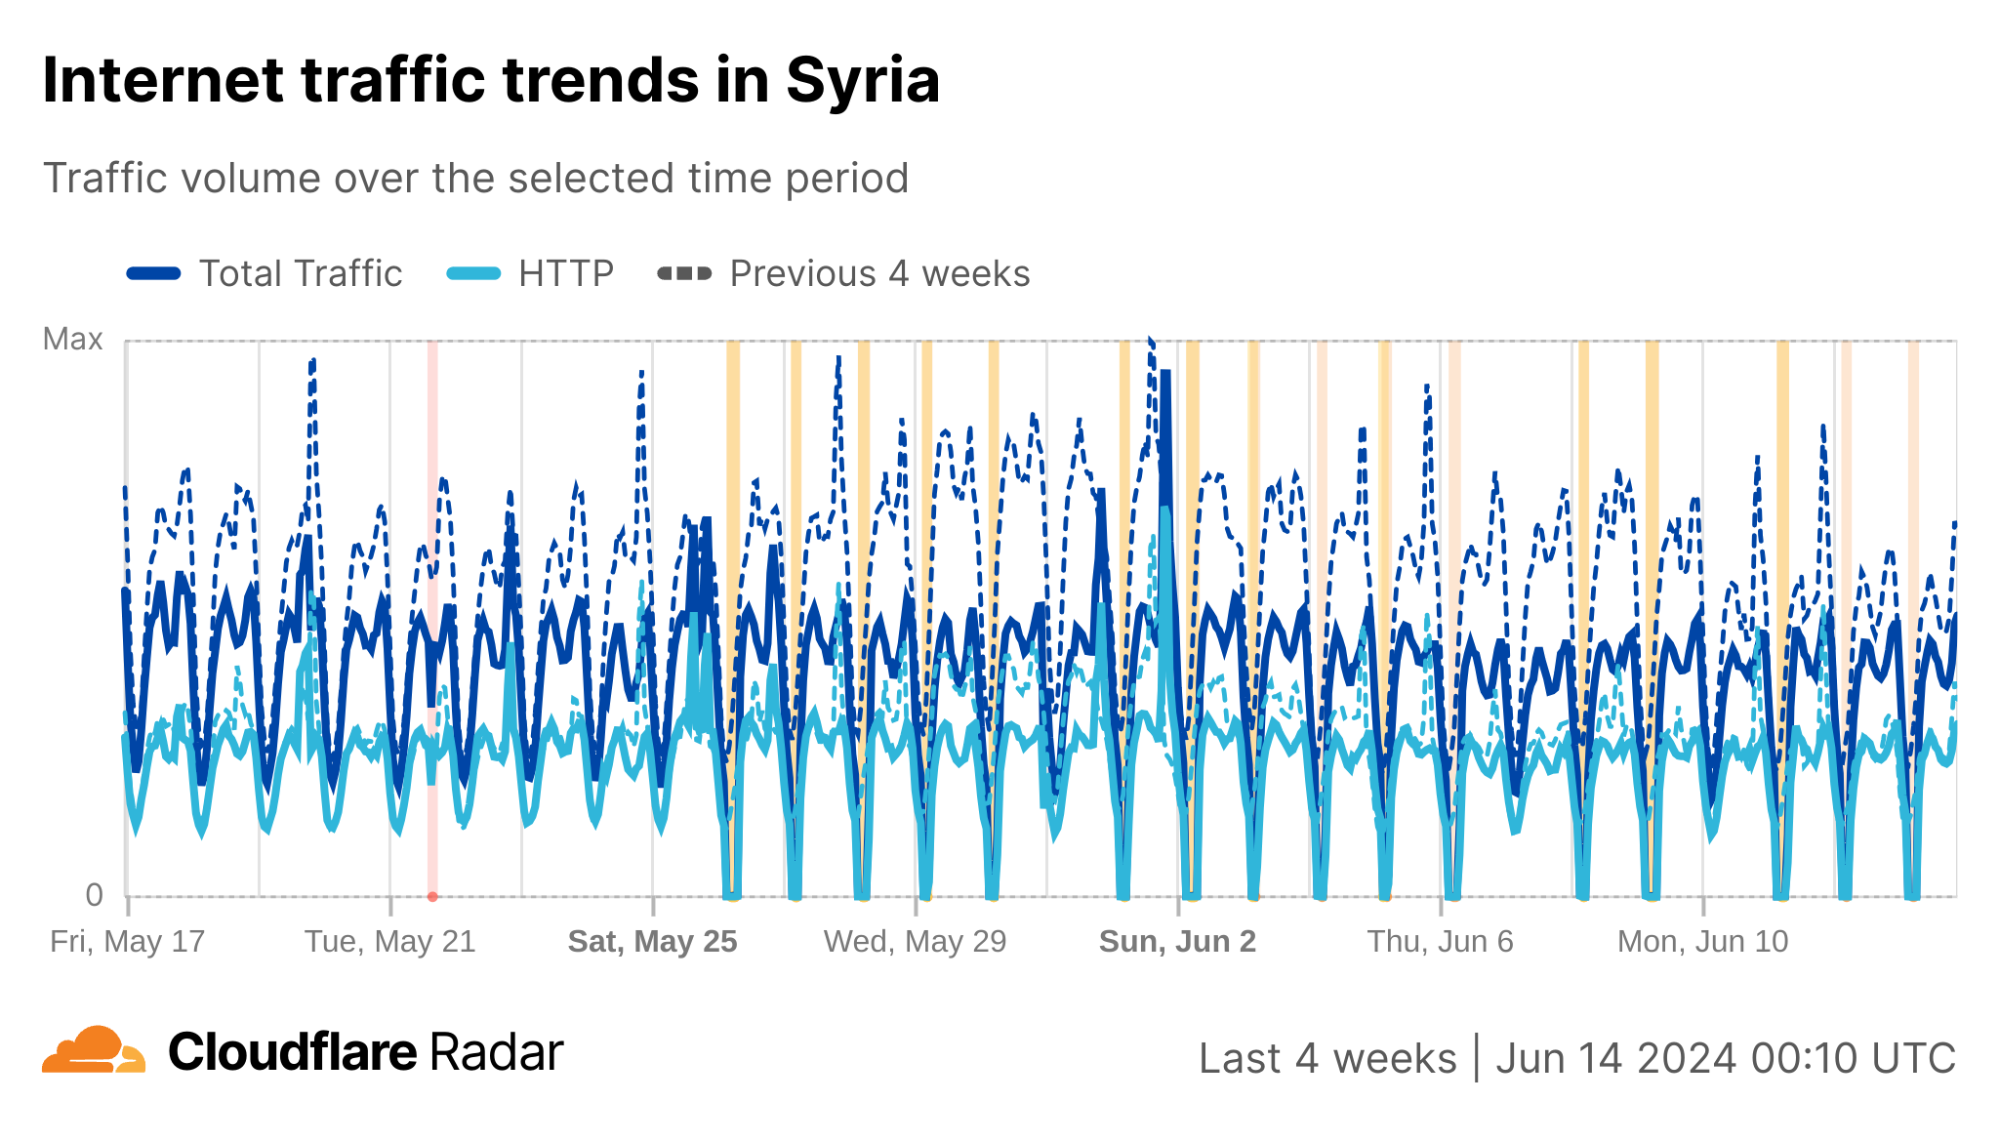
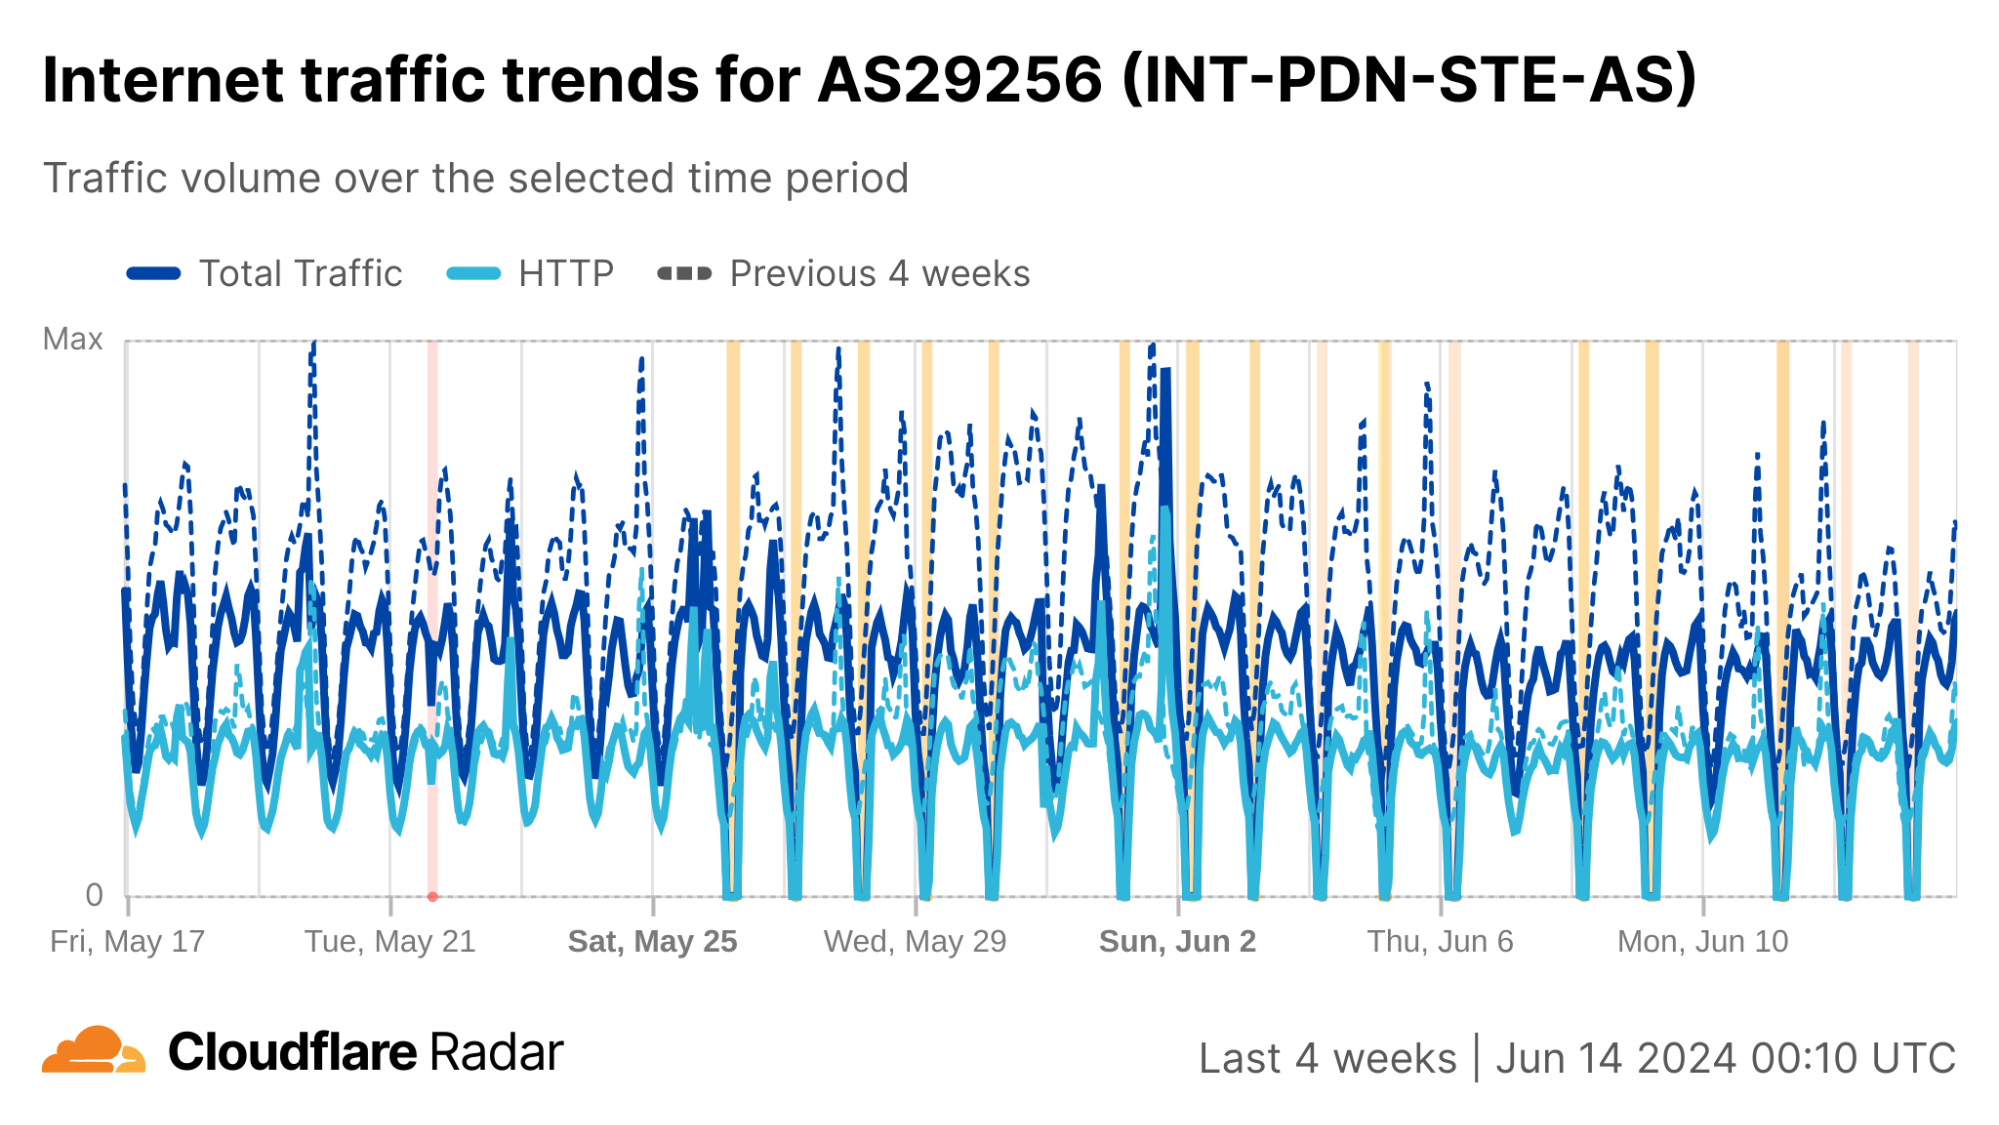
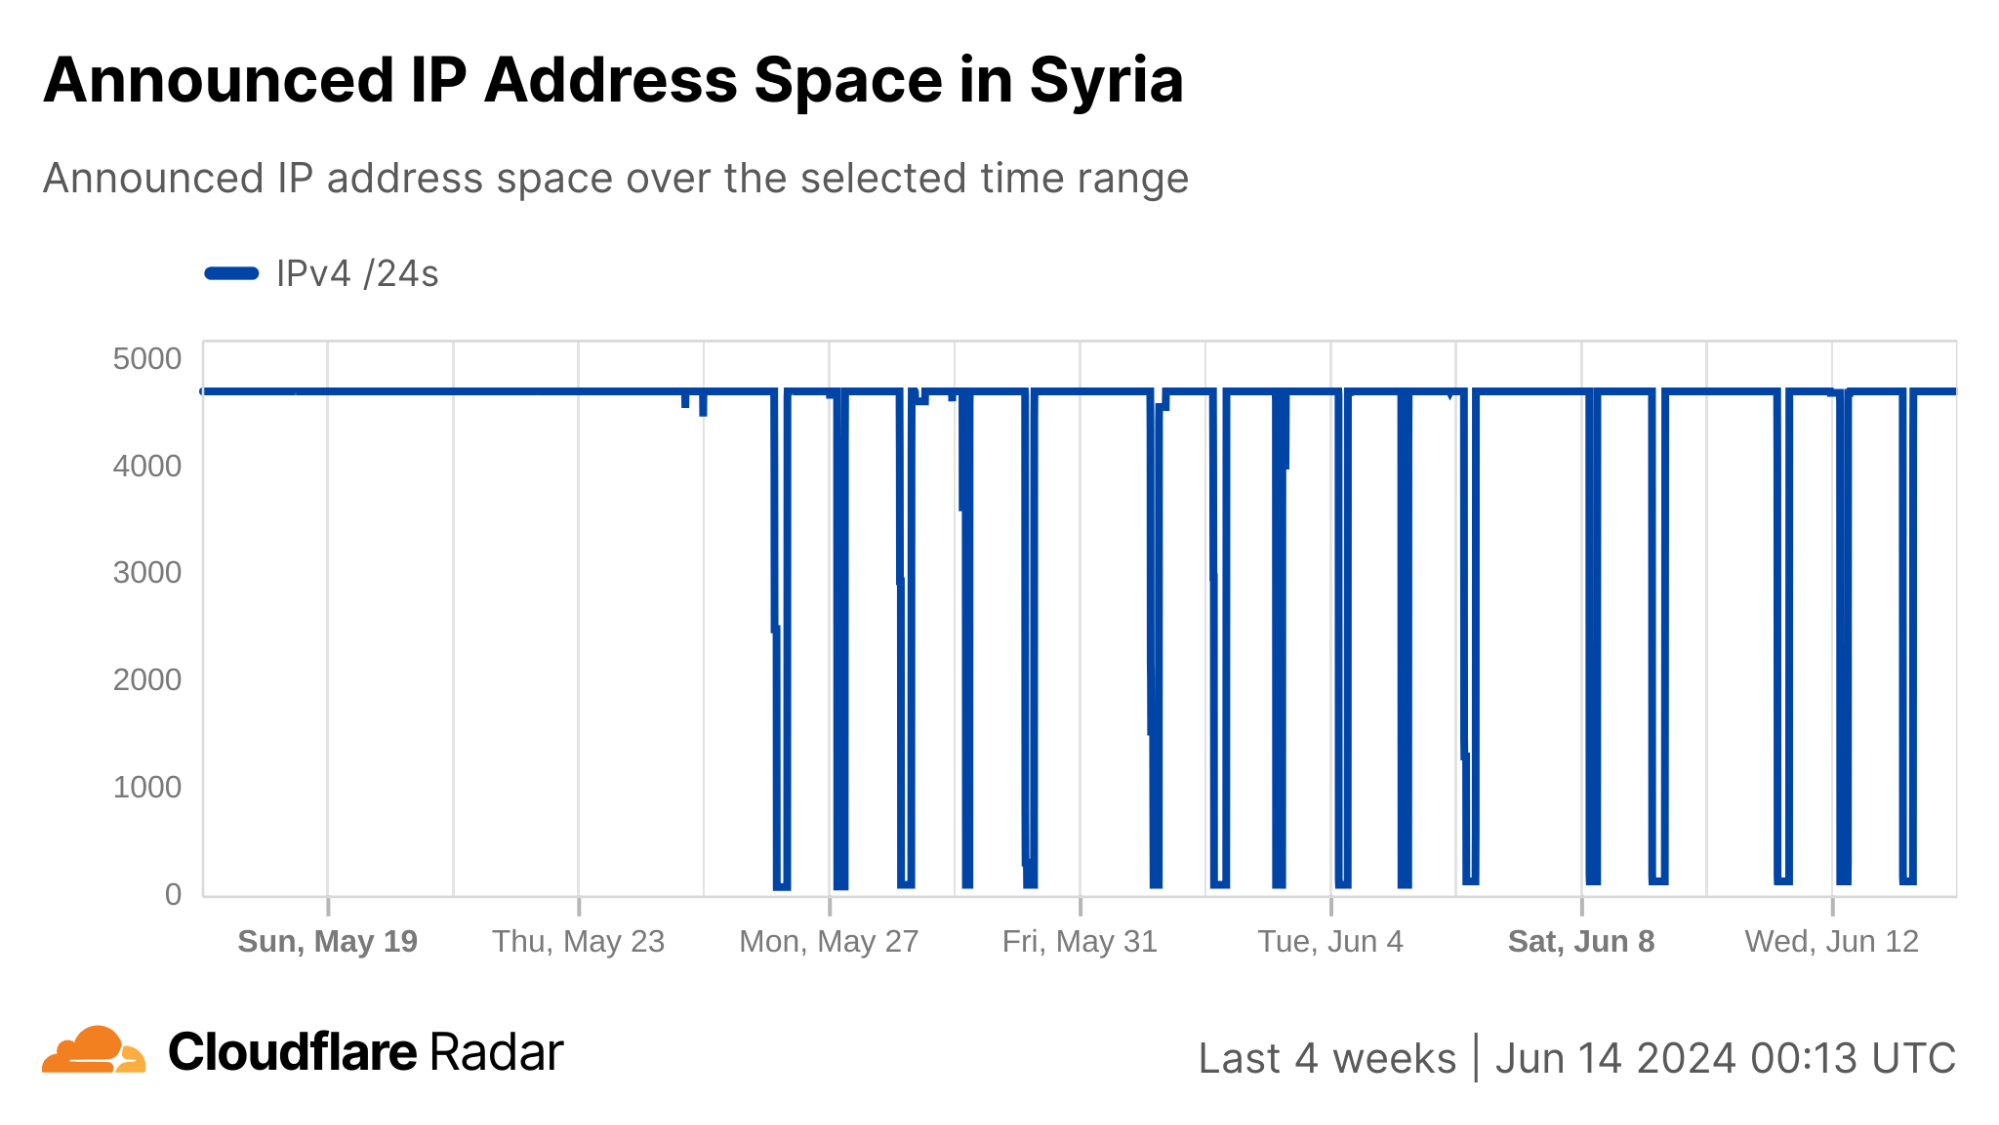
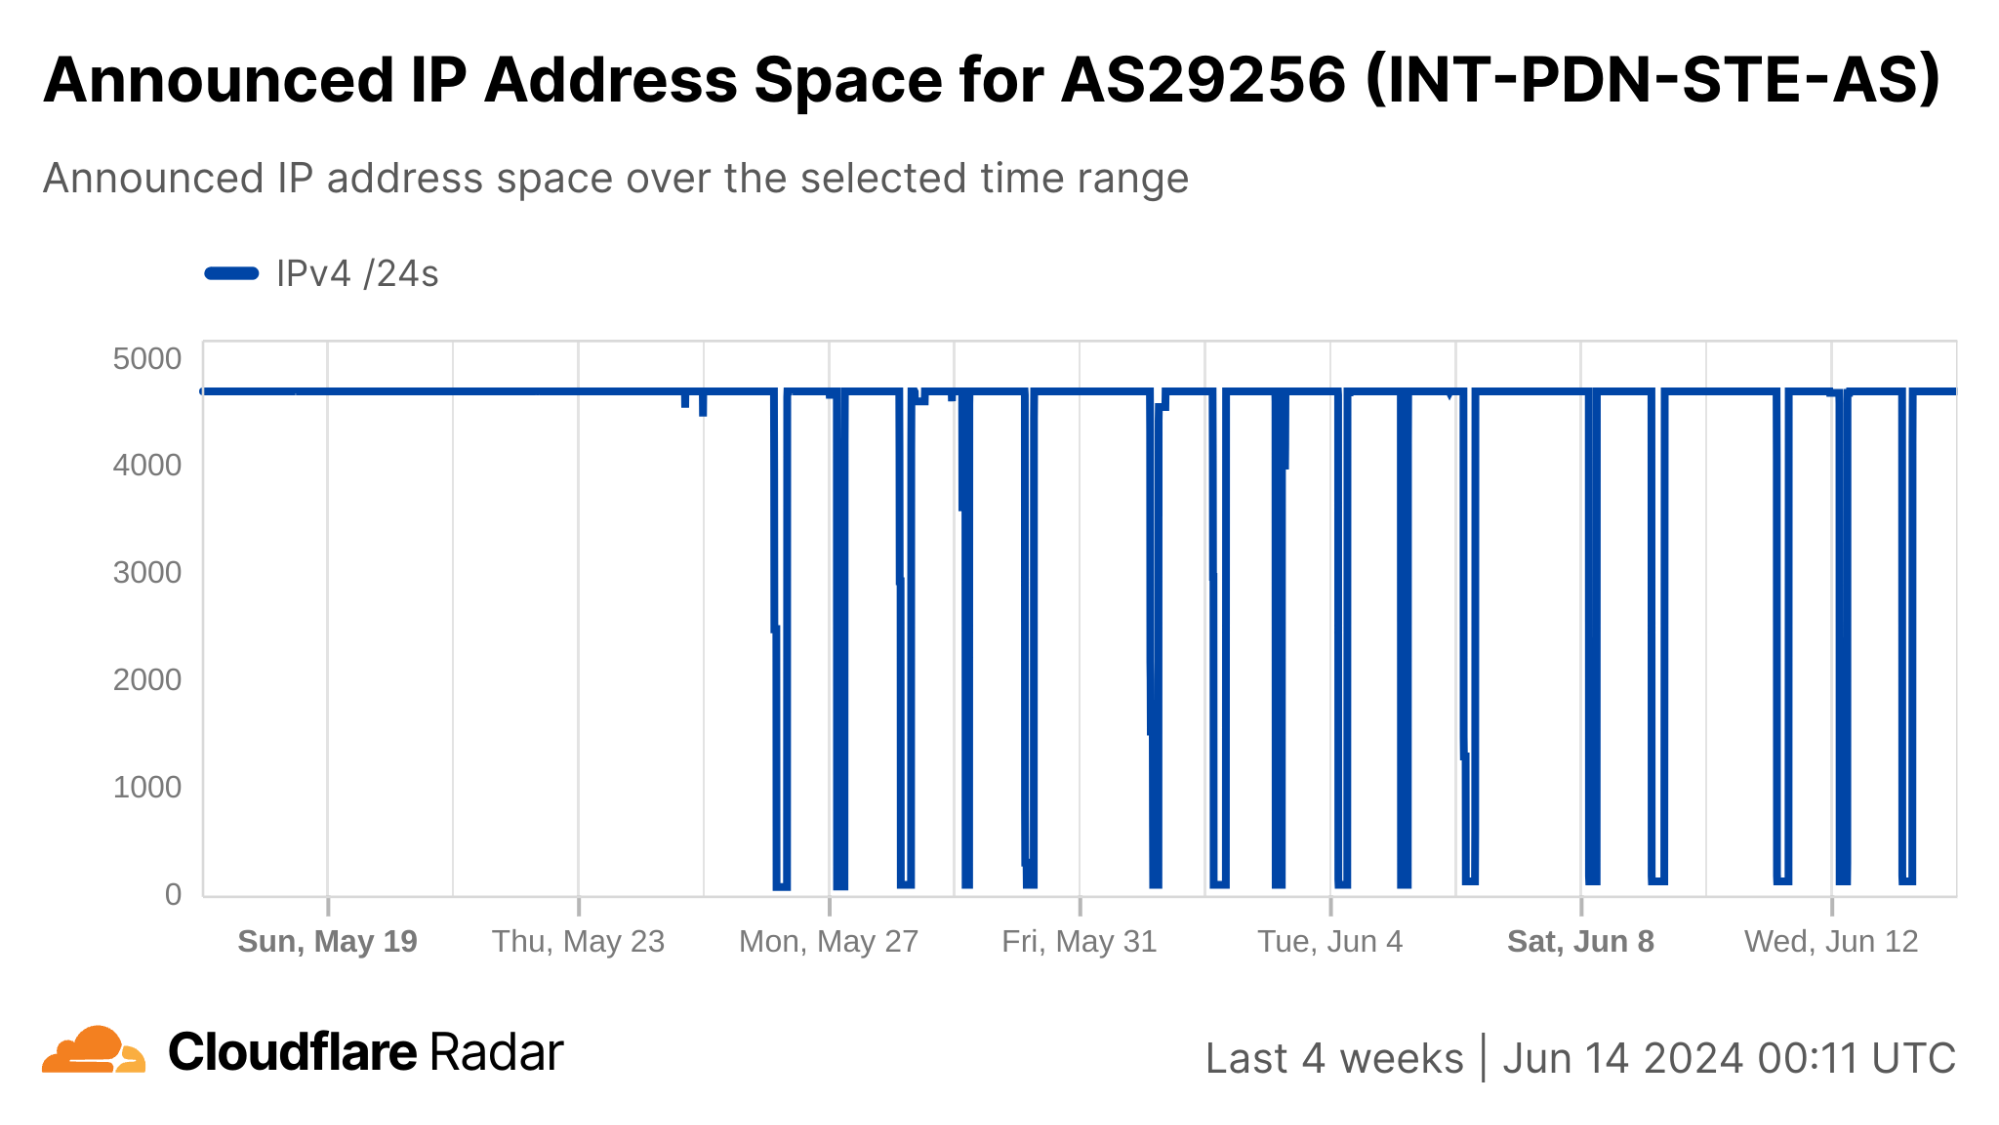
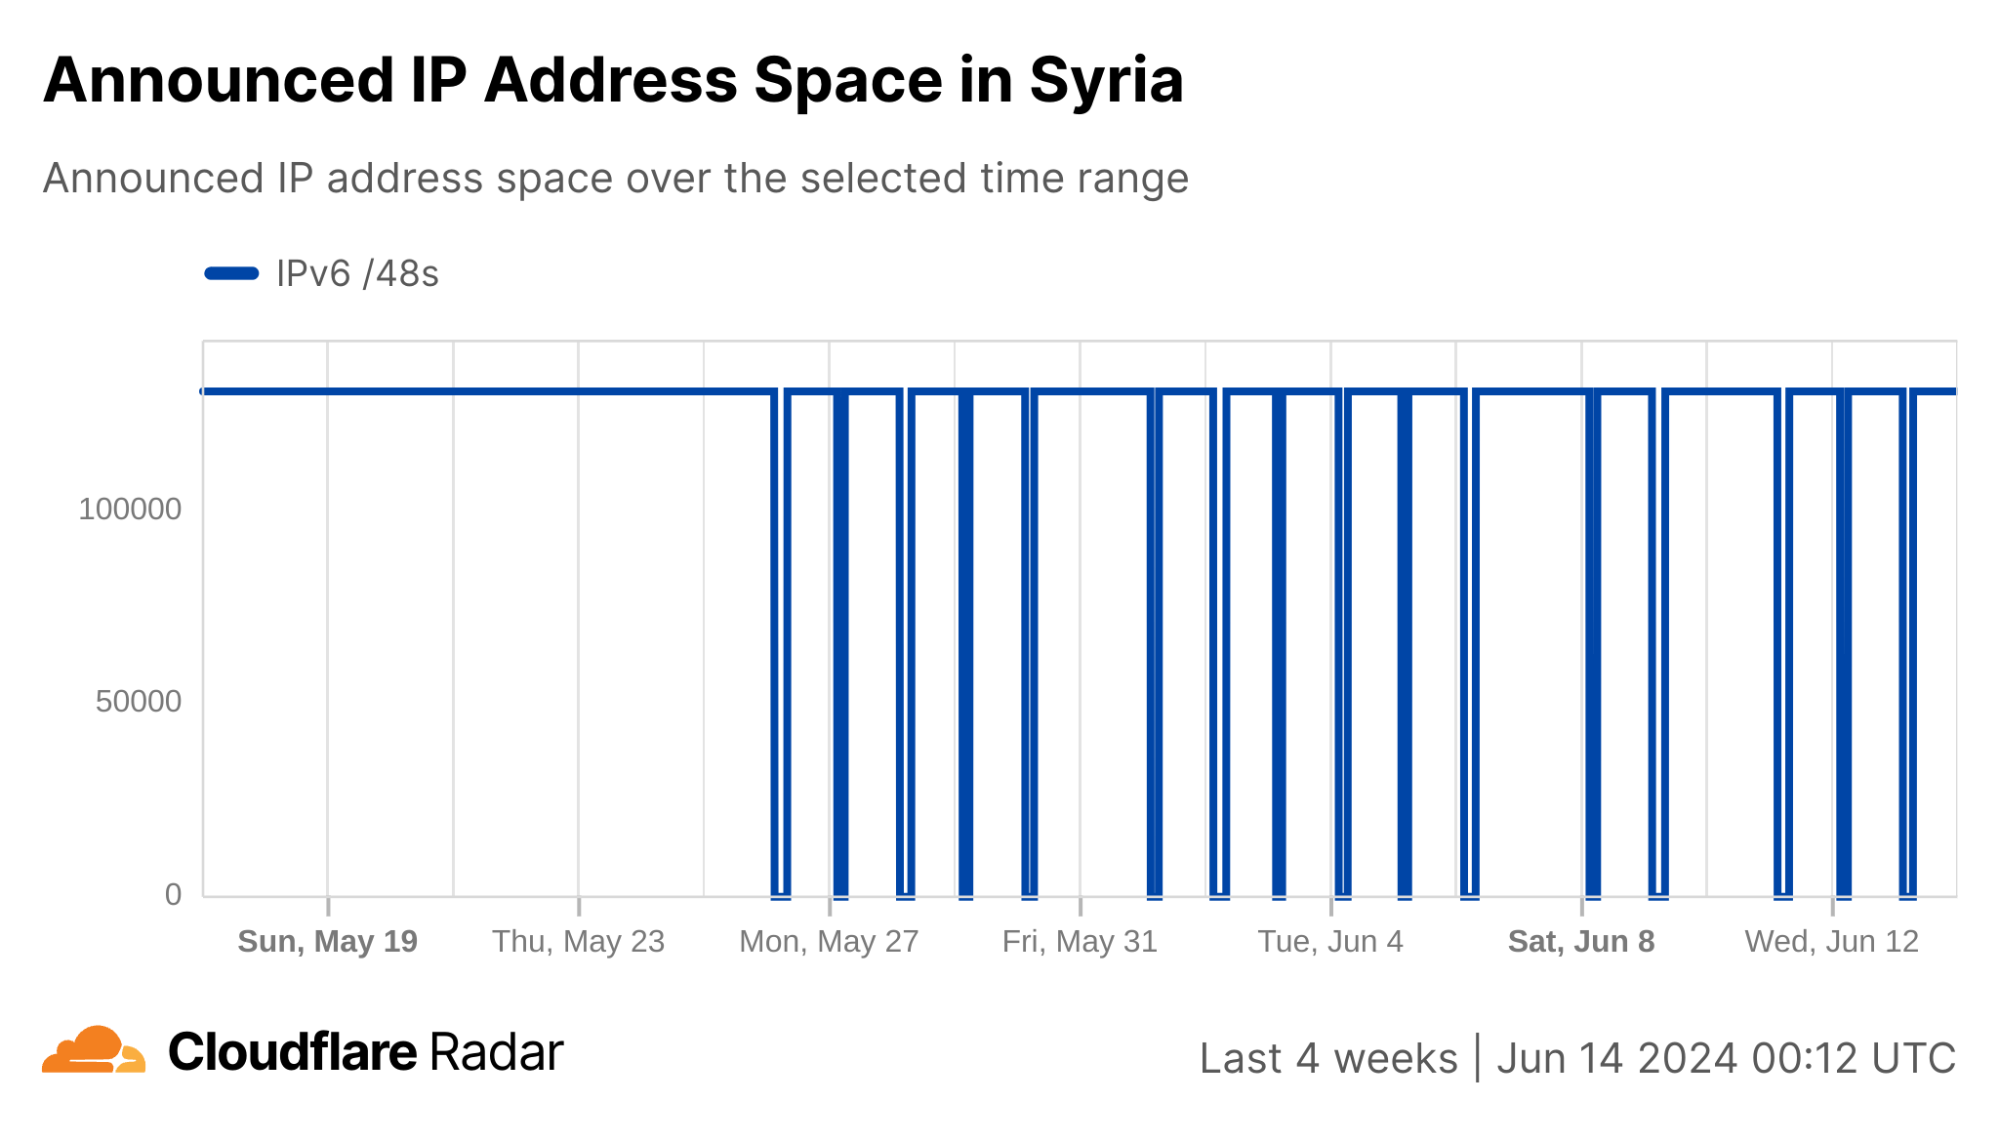
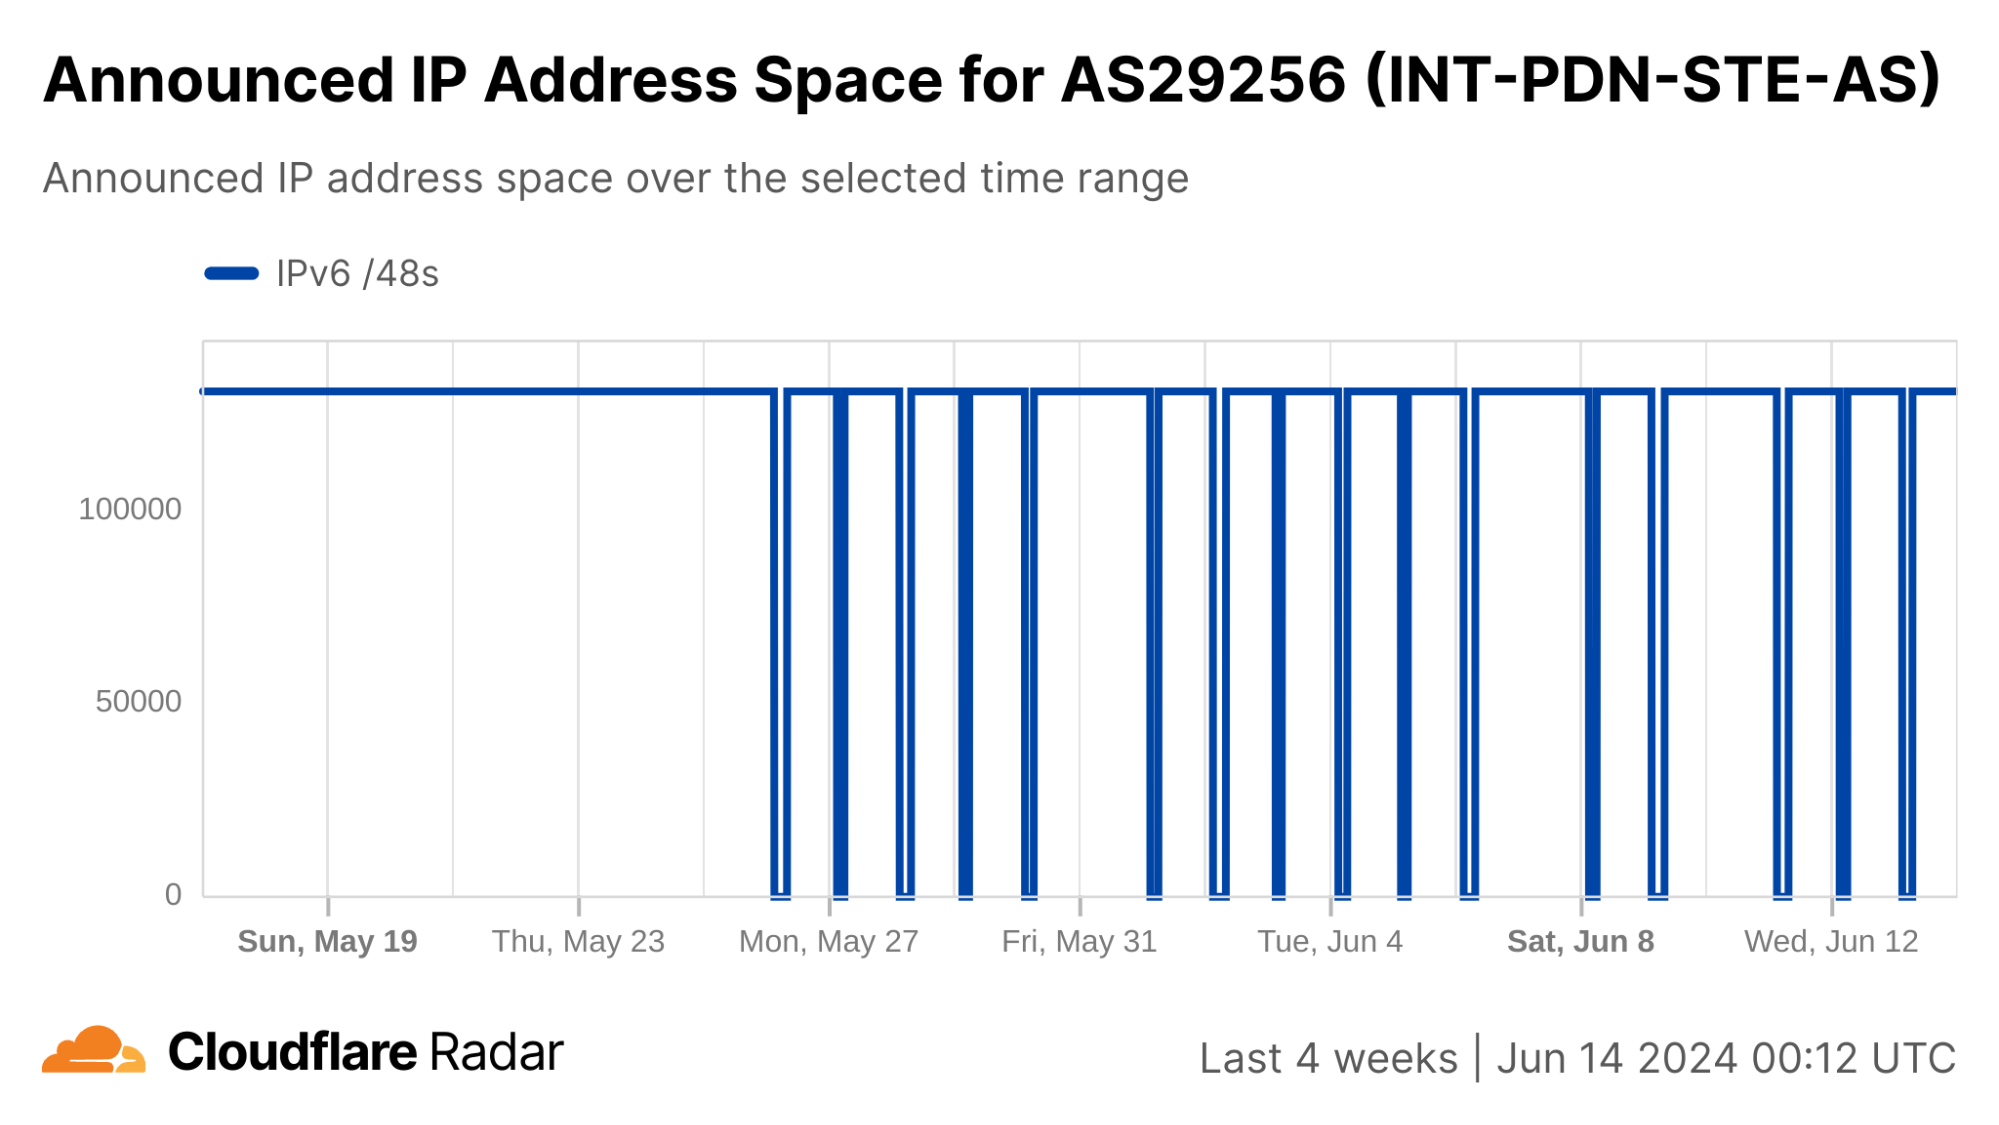
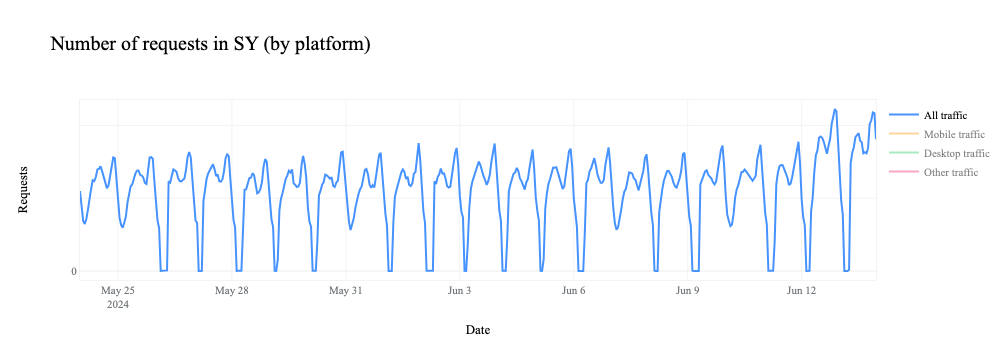
The length of the shutdowns varied by day — they all began at 07:00 local time (04:00 UTC), but the end times ranged between 09:45 -10:30 local time (06:45 – 07:30 UTC). The graphs below show the impact at a country level, as well as to AS29256 (Syrian Telecom), the primary telecommunications provider within the country.
On August 12, a round of baccalaureate exams began in Mauritania, and in an effort to prevent student cheating on the exams, the government instituted multiple Internet shutdowns that impacted several major mobile providers. Two shutdowns were observed on August 12, between 08:00 – 12:00 local time (08:00 – 12:00 UTC) and between 15:00 – 19:00 local time (15:00 – 19:00 UTC), and an additional one was observed on August 13, between 08:00 – 12:30 local time (08:00 – 12:30 UTC). Impacted network providers included AS37508 (Mattel), AS37541 (Chinguitel), and AS29544 (Mauritel). Announced IP address space for these networks remained unchanged during the shutdown periods, suggesting that that mobile subscriber connectivity was disabled, as opposed to the networks effectively being disconnected from the Internet, as we have seen in other countries.
Exam-related Internet shutdowns are, unfortunately, not new to Mauritania, as authorities in the country also implemented them between 2017 and 2020.
Cable cuts
Eswatini (Swaziland)
On July 14, MTN Eswatini (AS327765) informed customers via a post on X that “connection to the internet and data services is currently intermittent, because of fiber cable breaks resulting from wildfires.” This apparent connection disruption was visible in Cloudflare Radar between 19:30 and 20:15 local time (17:30 and 18:15 UTC).
Cameroon
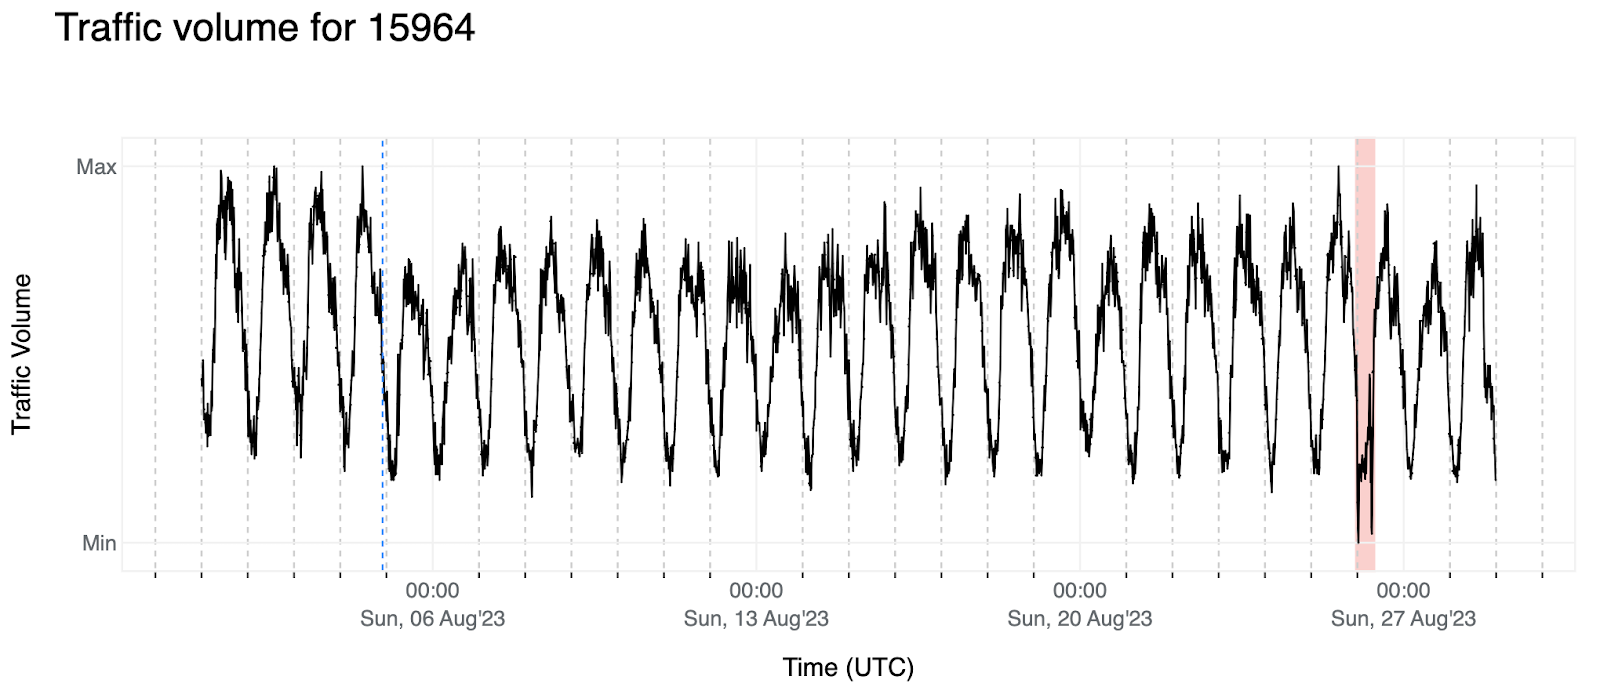
In Cameroon, a fiber cut that occurred on August 4 during sanitation work disrupted mobile connectivity for Cameroon Telecommunications (AS15964 (Camtel)) customers for over half a day. According to a (translated) post on X from Camtel, “We inform you that due to the sanitation work carried out in the city of Yaoundé, at the place called Cradat, our Voice and Data services have been temporarily interrupted on the entire mobile network.” The observed disruption occurred between 03:00 – 16:30 local time (02:00 – 15:30 UTC). Although it initially started during a time when traffic was lower overnight anyway, both request and bytes traffic remained lower than the same time a week prior during the duration of the disruption.
Liberia
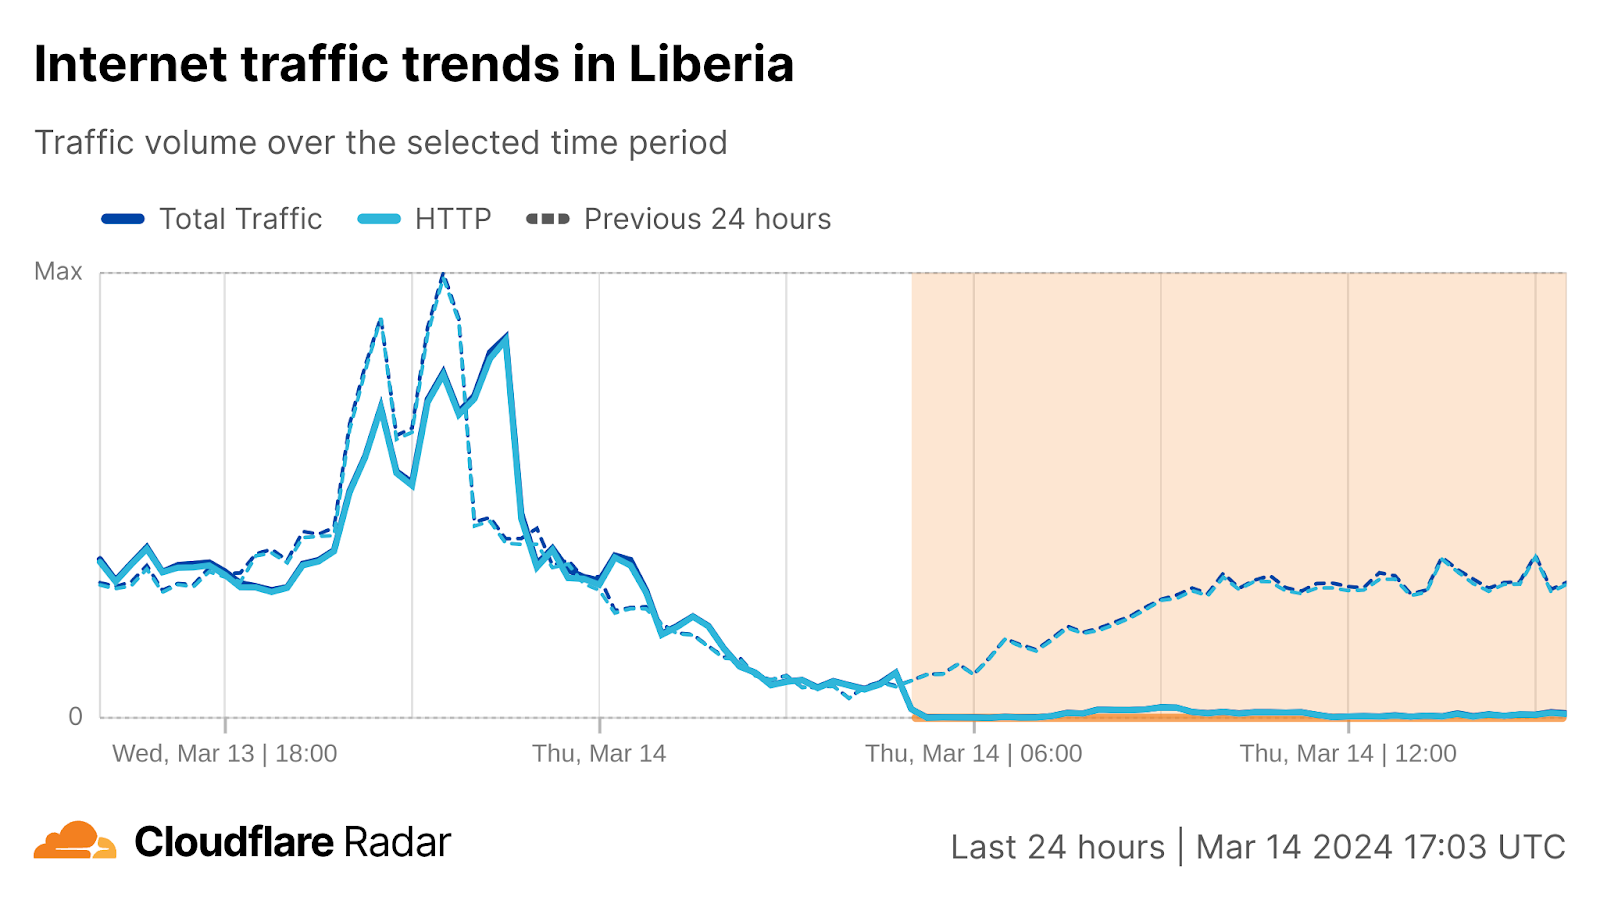
The Liberia Telecommunications Authority posted an announcement to their Facebook page on August 21 noting that “We have been informed by the CCL that the ACE Cable is experiencing interruptions.” (The Africa Coast to Europe (ACE) submarine cable connects multiple countries along the West Coast of Africa to Portugal and Europe.) The announcement further noted that the first signs of interruption occurred at 01:00 local time (and UTC), and that Lonestar Cell MTN (AS37410) was among the providers that had been “gravely affected” by the cut.
We observed traffic on Lonestar Cell MTN dropping just after 01:00, in line with the announcement. The network experienced a complete outage lasting over a day and a half, before traffic started to recover at 14:00 local time (and UTC) on August 22. In a Facebook post on August 22, Lonestar Cell MTN confirmed that Internet service had been restored, and that customer accounts would be credited with 500 MB of data for free.
Niger
A September 7 post on X from Airtel Niger alerted customers to Internet service disruptions caused by cuts on international fiber optic cables. As a land-locked country, Niger is dependent on terrestrial connections to networks in neighboring countries, but it isn’t clear which connection or country Airtel Niger’s post was referencing.
Two significant Internet disruptions were observed around the time of Airtel Niger’s post that we believe are related to the referenced fiber cuts. The first occurred between 18:00 – 21:00 local time (17:00 – 20:00 UTC) on September 6, visible at a country level and at a network level as well on AS37531 (Airtel Niger) and AS37233 (Orange Niger / Zamani Telecom). The second disruption occurred between 10:45 – 12:00 local time (09:45 – 11:00 UTC) on September 7, visible at a country level as well as on those two networks.
Haiti
Internet disruptions related to submarine cable failures often take a significant amount of time to resolve because of the challenges repair crews face in getting to, and accessing, the damaged portion of the cable, as it is frequently located deep underwater in the middle of an ocean. A September 14 submarine cable failure that impacted Digicel Haiti (AS27653) lasted for over a week for a similar, but slightly different, reason.
A significant loss of traffic on Digicel Haiti was first observed at 08:00 local time (12:00 UTC) on September 14. On September 16, Digicel Haiti posted a press release confirming that since September 14, a failure had been detected on an international submarine cable belonging to Cable and Wireless, and that the cable damage occurred at Kaliko Beach Club (the property is reportedly used as a cable entry point). Digicel noted that their technicians went to the scene of the damage immediately, but were denied access, apparently because of a business dispute dating back to 2021. The release also explained that technical teams had taken temporary steps to ensure the continuity of essential services, which prevented the incident from resulting in a complete loss of connectivity. On September 22, a subsequent press release posted by Digicel Haiti announced the restoration of Internet services as of 02:00 local time (06:00 UTC), and referenced vandalism as the cause of the cable damage.
The outage lasted for only an hour, between 15:45 and 16:45 local time (09:45 – 10:45 UTC), dropping both traffic and announced IP address space to zero. At a country level, traffic dropped as much as 72% as compared to the previous week. Given the complete loss of both traffic and IP address space, the damage likely occurred on the connection between Megacom and Rostelecom.
Severe weather
An active hurricane season during July, August, and September resulted in infrastructure damage caused by multiple hurricanes disrupting Internet connectivity in multiple places across the Caribbean and Southeastern United States.
Grenada & Saint Vincent and the Grenadines
At the start of the third quarter, Grenada and Saint Vincent and the Grenadines both suffered significant damage from Hurricane Beryl, reportedly causing destruction of infrastructure, buildings, agriculture, and the natural environment.
On July 1, traffic from Grenada dropped significantly at 10:00 local time (14:00 UTC), just ahead of landfall on Grenada’s Carriacou Island. The most significant impacts to traffic were seen for approximately the first 24 hours, though traffic did not return to expected pre-storm levels until around 10:00 local time (14:00 UTC) on July 5.
Internet traffic in Saint Vincent and the Grenadines was also disrupted by Hurricane Beryl, also falling at 10:00 local time (14:00 UTC). Similar to Grenada, the most significant impact was seen in the first 24 hours, with consistent gradual recovery seen after that time. However, traffic did not return to expected pre-storm levels until July 11.
Jamaica
As Hurricane Beryl continued across the Caribbean, it passed Jamaica on July 3. The associated damage that it caused impacted Internet connectivity on the island, with traffic dropping significantly around 14:00 local time (19:00 UTC). As the graph below shows, the disruption was preceded by higher than normal traffic volumes, presumably due to residents looking for information about Beryl. The disruption lasted nearly a week, with traffic returning to expected levels on July 10.
U.S. Virgin Islands
The following month, damage from Tropical Storm Ernesto caused power outages across the U.S. Virgin Islands, resulting in disruptions to Internet connectivity. Traffic from the islands dropped precipitously at 22:00 local time on August 13 (02:00 UTC on August 14) and remained lower for over two days, before returning to expected pre-storm levels around 11:00 local time (15:00 UTC) on August 16.
Bermuda
Over the course of the following few days, Ernesto strengthened from a tropical storm into a hurricane, but had weakened by the time it hit Bermuda on August 16/17. In this case, damage was reportedly limited to power outages, downed trees, and flooding, but even this limited damage disrupted Internet connectivity on the island. As the storm made landfall on the island, traffic levels dropped over 80% at 22:00 local time on August 16 (01:00 UTC on August 17). Traffic levels remained depressed for about two and a half days, recovering to expected levels around 09:00 local time (12:00 UTC) on August 19.
Nepal
Heavy rains in Nepal at the end of September resulted in flooding and landslides across much of the country, which in turn resulted in power outages and Internet disruptions. One such disruption believed to be associated with the impacts of the storm was observed on September 28, when AS23752 (Nepal Telecom), AS45650 (Vianet), AS139922 (Dishhome), and AS17501 (Worldlink) all saw traffic drop 50 – 70% between 14:15 – 16:00 local time (08:30 – 10:15 UTC).
United States
A disruption to traffic from AS11427 (Charter Communications/Spectrum) in Texas that occurred between 12:30 and 19:30 local time on July 9 (17:30 – 00:30 UTC) was caused by “a third-party infrastructure issue caused by the impact of Hurricane Beryl”, according to a July 9 post on X from the provider. Spectrum acknowledged the issue shortly after it began, and followed up again after service had been restored.
Hurricane Helene made landfall in northern Florida as a Category 4 storm late in the evening (local time) on September 26, and over the following hours and days, continued north through Georgia, South Carolina, and North Carolina, and into Tennessee. Even as it weakened, it caused historic flooding and damage to roads, homes, power lines, and telecommunications infrastructure. Below, we review the traffic impacts observed at a state level in three of the most impacted states, as well as exploring the impact at a network level for selected providers. (Doug Madory at Kentik published an excellent blog post exploring the impact of Helene from the perspective of their data, and the networks referenced below were informed by that post.)
Georgia
Helene entered Georgia early morning on Friday, September 27, and by midday (local time), peak traffic was approximately 20% lower than peak levels seen in the days ahead of the storm. (The lower peaks on September 28 & 29 are likely due to it being a weekend.) At a state level, peak traffic remained lower over the following week, with more recovery seen heading into the week of October 6.
One of the most significantly impacted network providers in Georgia was AS11240 (ATC Broadband), which saw traffic start to drop around 22:00 local time on September 26 (02:00 UTC on September 27). Subscribers and customers experienced a near complete outage until around 08:00 local time on September 30 (12:00 UTC), when traffic volumes slowly started to recover. The normal diurnal traffic pattern became more clear in the following days, with peak traffic levels continuing to increase over the next week as well.
The midday traffic peak on September 27 in South Carolina was just 65% of the preceding days, with the peaks remaining lower over the following two weekend days. Traffic remained somewhat lower during the week following Helene, with peak increases becoming more evident the week of October 6.
At AS19212 (Piedmont Rural Telephone) in South Carolina, traffic began to fall rapidly around midnight local time on September 27 (04:00 UTC), reaching a state of near complete outage over the next eight hours. A gradual recovery is visible over the following several days, with a more regular pattern becoming evident on October 1, with rapid growth over the following week, accelerating towards the end of the week.
Although a drop in traffic is visible in the graph for North Carolina on September 27, it occurs after a midday peak in line with previous days, and the magnitude is not as significant as that seen in South Carolina and Georgia. Traffic peaks over the following week are in line with the week preceding Helene’s arrival, with higher peaks seen the week of October 6.
North Carolina providers AS53488 (Morris Broadband) and AS53274 (Skyrunner) both experienced multi-day disruptions, likely related to damage from Helene. However, these disruptions took Morris Broadband completely offline several times over the course of a week — the announced IP address space graph below shows three distinct drops to zero, aligning with outages visible in the traffic graph, when the network was effectively disconnected from the Internet. A similar but less severe pattern was seen at Skyrunner, which lost 75-80% of announced IP address space for a two-day period covering September 27-29, aligning with an outage visible in the associated traffic graph.
A nationwide power outage in Venezuela on August 30 was, according to President Nicolás Maduro, the result of an attack on the Guri Reservoir, Venezuela’s largest hydroelectric project. A published report indicated that all 24 of the country’s states reported a total or partial loss of electricity supply. The loss of power unsurprisingly caused an Internet disruption, with country-level traffic dropping 82%, starting around 04:45 local time (08:45 UTC). Traffic began to increase as electricity returned to various parts of the country throughout the day, and returned to expected levels just after midnight local time on August 31 (04:00 UTC).
Kenya
On August 30, Kenya Power Care posted a Customer Alert on its Facebook page, issued at 21:57 local time (18:57 UTC), stating that “We have lost power supply to various parts of the country except North Rift region and sections of Western region.” Approximately a half hour before that alert, Kenya’s Internet traffic began to drop, falling as much as 61%. Just two hours later, Kenya Power Care posted a follow up, stating “Following the partial outage affecting several parts of the country this evening, we are pleased to report that power supply has now been restored to the entire Western region, as well as parts of Central Rift, South Nyanza, and Nairobi regions.” However, traffic did not return to expected levels for several more hours, taking until 06:00 local time (03:00 UTC).
A week later, on September 6, Kenya Power Care posted another similar Customer Alert, noting that “We are experiencing a power outage affecting several parts of the country, except sections of North Rift and Western regions.” This alert was issued at 09:20 local time (06:20 UTC), and follows a drop in Internet traffic that started around 09:00 local time (06:00 UTC). Traffic dropped approximately 45% during this power outage, and returned to expected levels around 16:00 local time (13:00 UTC). Traffic recovery aligns with a subsequent Customer Alert posted on Facebook, where Kenya Power Care stated “We are glad to report that normal electricity supply was restored across the country as at 3:49pm”.
A statement from Energy and Petroleum Cabinet Secretary Opiyo Wandayi, shared on Facebook by Kenya Power Care, explained the cause of the power outage: “Today, Friday 6th September 2024 at 8.56 am, the 220kV High Voltage Loiyangalani transmission line tripped at Suswa substation while evacuating 288MW from Lake Turkana Wind Power (LTWP) plant. This was followed by a trip on the Ethiopia – Kenya 500kV DC interconnector that was then carrying 200MW, resulting to a total loss of 488MW…”
Ecuador
According to a (translated) September 7 post on X from CENACE, the national electricity operator in Ecuador, “We inform the public that due to a fault in the Molino substation bar, which is connected to the Paute generation, there has been a power outage in some provinces of the country. Cenace’s technical team, in coordination with the distribution companies, is working to gradually restore electrical service. It is estimated that it will take 3 to 4 hours maximum for the supply to return to normal.” The post was published at 09:53 local time (14:53 UTC), approximately an hour after Internet traffic from the country began to drop. Traffic returned to expected levels just under four hours later, at around 12:30 local time (17:30 UTC), in line with CENACE’s predicted time for power to be fully restored.
On September 18/19, the first of several planned nightly power outages to enable needed grid maintenance in Ecuador disrupted Internet connectivity. Traffic dropped by over 60% as compared to the same time the prior week starting around 21:30 local (02:30 UTC), with the power outages reportedly scheduled for 22:00 – 06:00 local time. Internet traffic recovered to expected levels around 06:00 local time (11:00 UTC) as power was restored. Similar power cuts were reportedly planned from September 23 to September 27, but these power outages did not appear to impact traffic levels in Ecuador as compared to the previous week.
Senegal
Senegal’s power company, Senelec, posted a communiqué on X on September 12 that stated (translated) “Senelec informs its valued customers that an incident that occurred this morning at the Hann substation resulted in the loss of the OMVS interconnected network and disruptions to electricity distribution.” This disruption to electricity distribution also resulted in a disruption to Internet traffic, which dropped sharply at 13:00 local time (13:00 UTC), falling as much as 80%. Traffic recovered to expected levels by 20:00 local time (20:00 UTC) around the same time that Senelec posted a followup about the incident that stated (translated) “Effective restoration of electricity supply in all localities.”
Maintenance
Syria
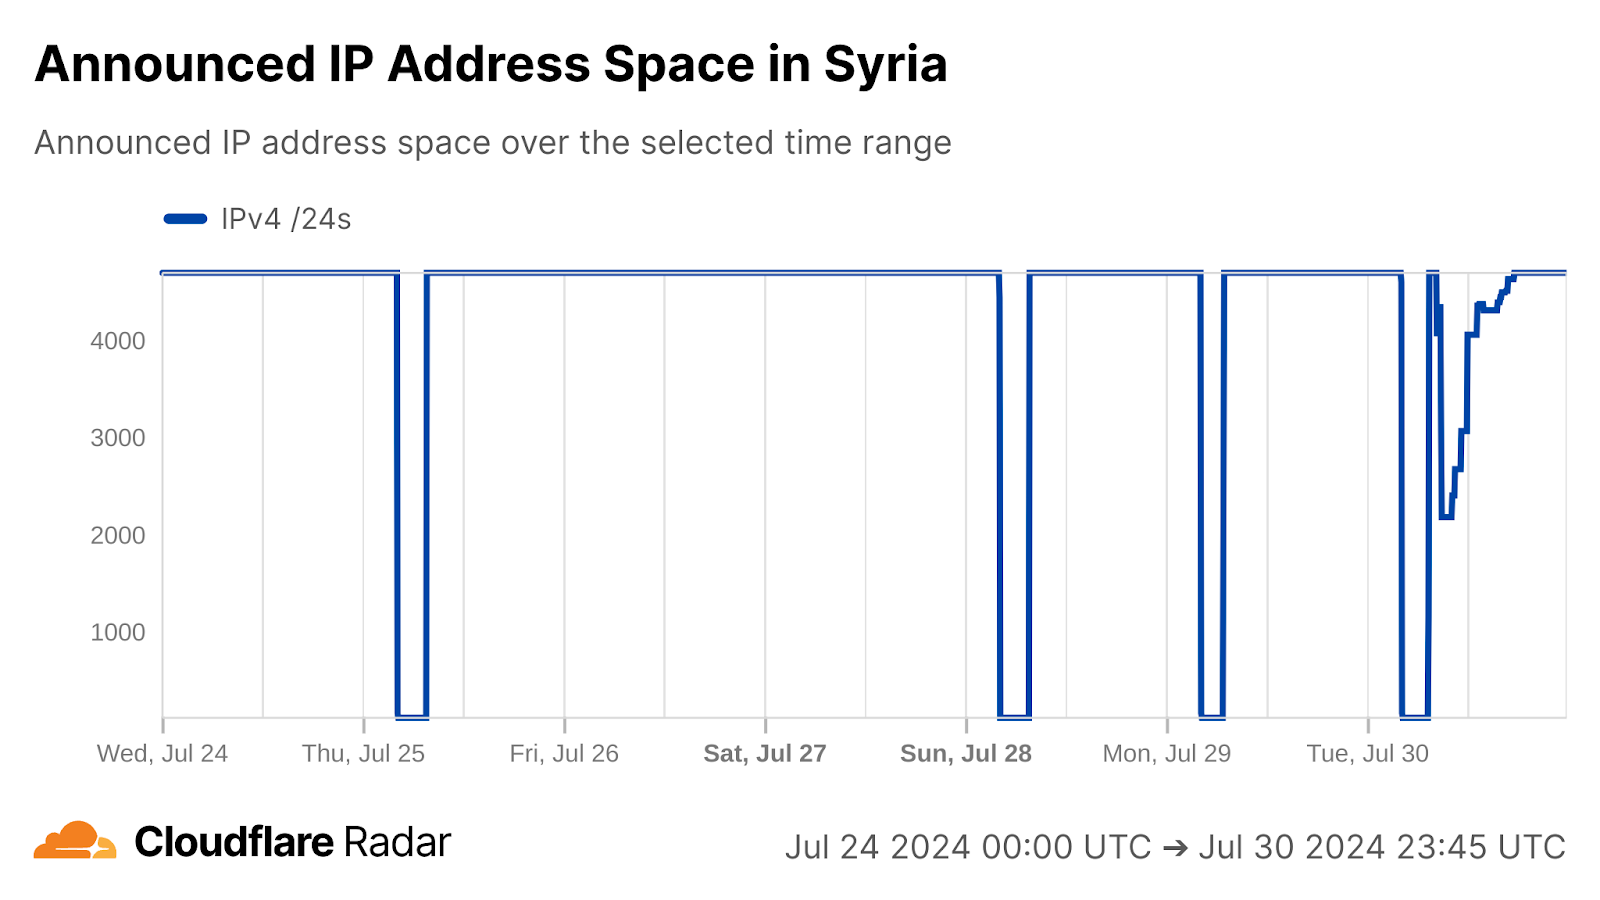
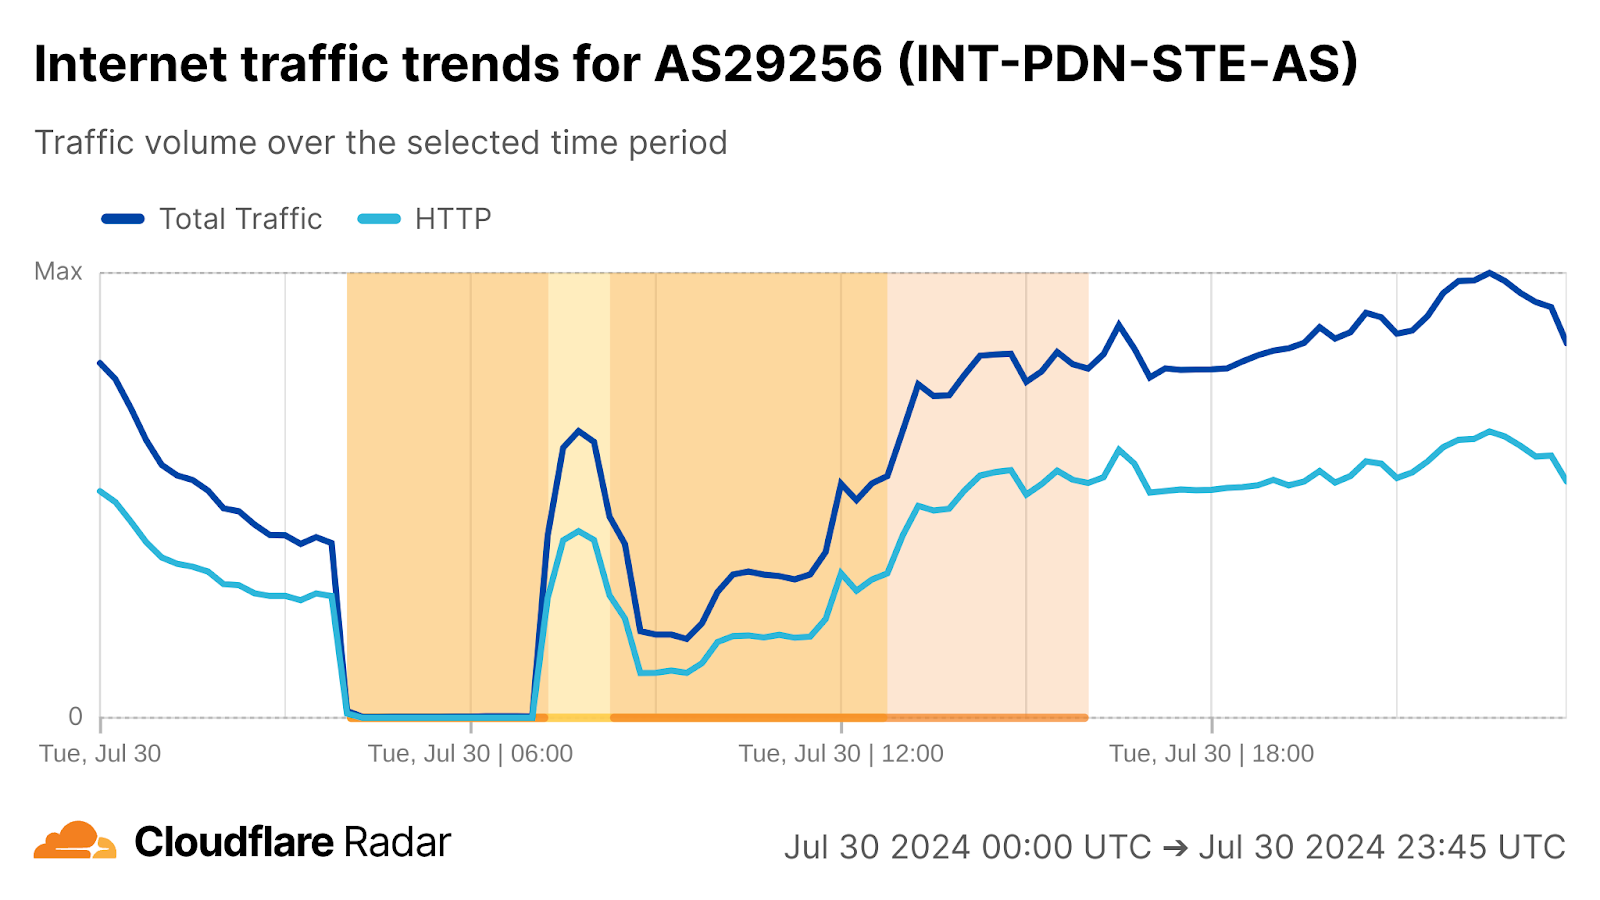
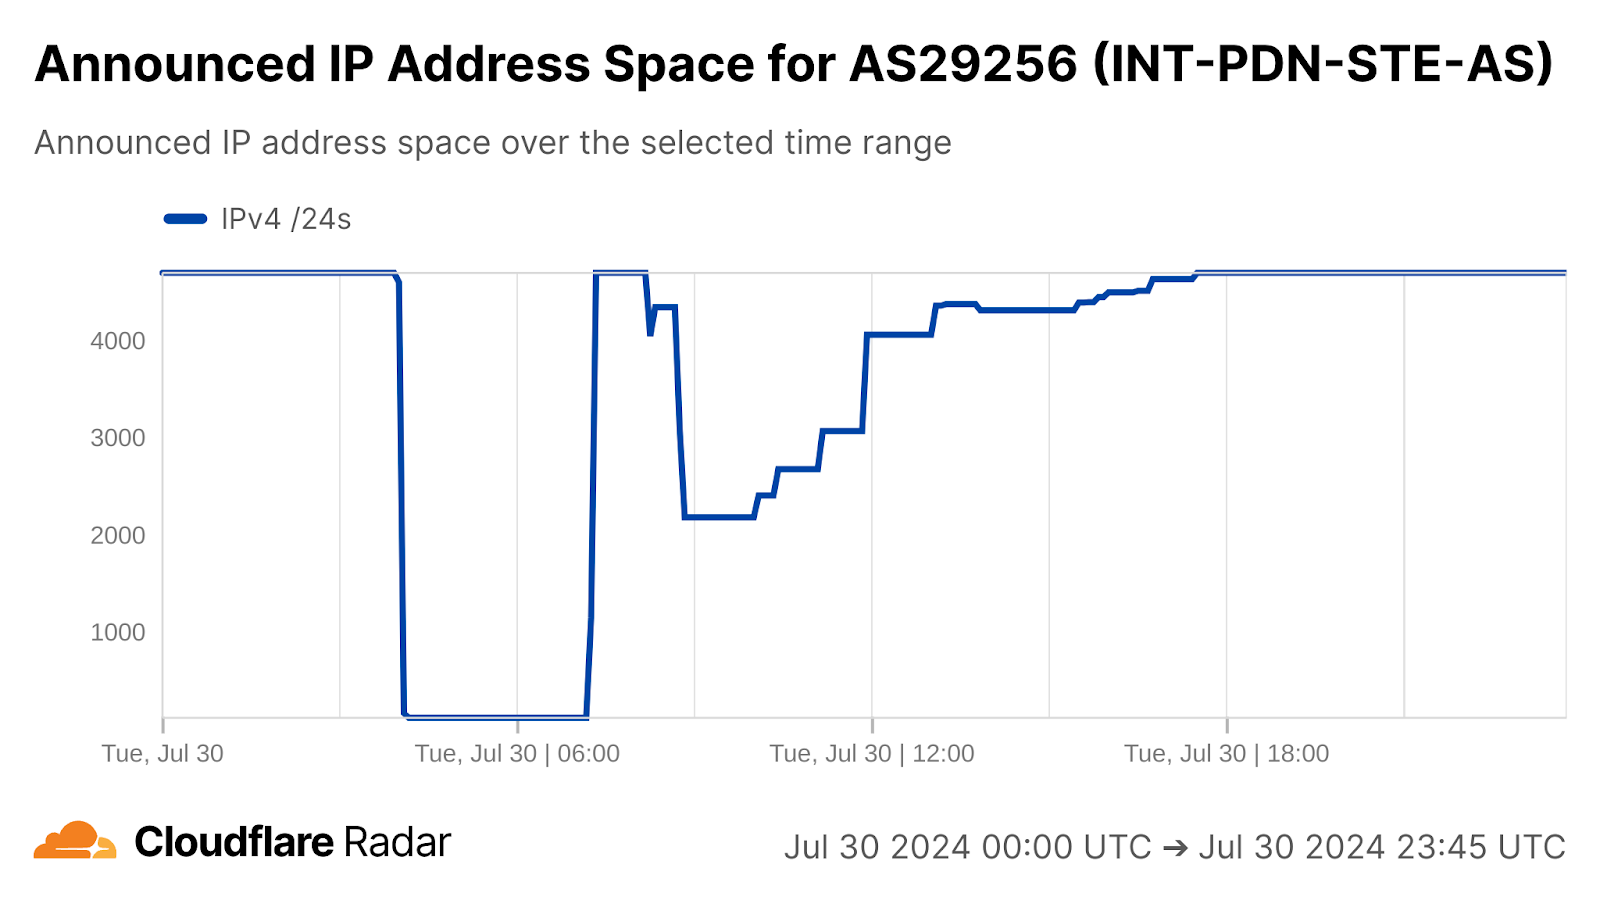
As we discussed above, Internet users in Syria were impacted by an exam-related Internet shutdown from 07:00 – 10:15 local time (04:00 – 07:15 UTC) on July 30. However, just an hour after connectivity was restored, another disruption occurred, as seen in both the traffic and announced IP address space graphs below. According to a (translated) Facebook post from Syrian Telecom, “…during the periodic maintenance of one of the air conditioners in one of the technical halls, an explosion occurred, which caused the internet circuits to be temporarily out of service.” Traffic remained depressed for approximately eight hours, recovering to expected levels around 19:00 local time (16:00 UTC).
Cyberattack
Russia
Roskomnadzor, Russia’s Internet regulate, blamed a brief disruption in traffic observed in Russia and on AS12389 (Rostelecom) on August 21 on a distributed denial-of-service (DDoS) attack that targeted Russian telecommunications operators. The disruption was brief, lasting from around 13:45 until 14:30 Moscow time (10:45 – 11:30 UTC). Roskomnadzor subsequently stated “As of 3 PM Moscow time, the attack has been repelled, and services are operating normally.” The disruption reportedly impacted messaging services Telegram and WhatsApp, as well as Wikipedia, Yandex, VKontakte, telecom support services, and mobile banking apps. Some experts questioned the official explanation, suggesting instead that the disruption was due to centralized interference from Roskomnadzor.
Military action
Palestine
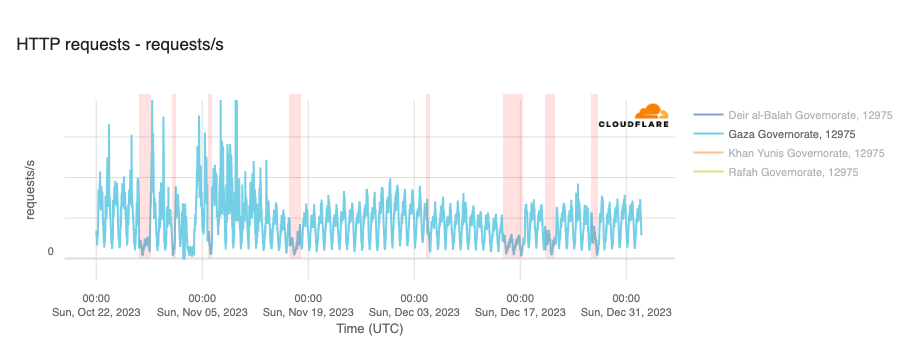
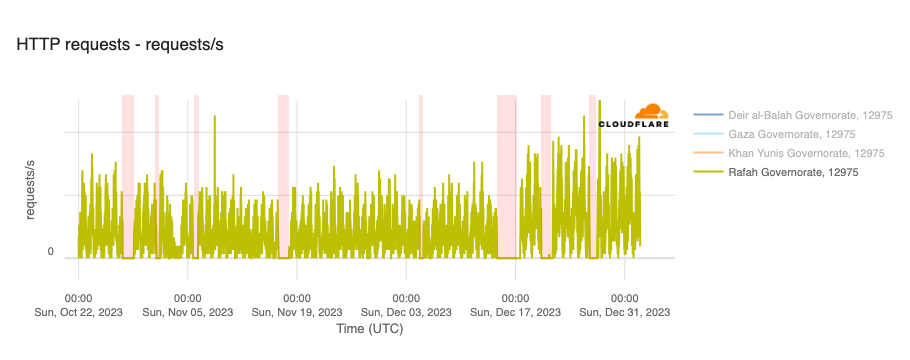
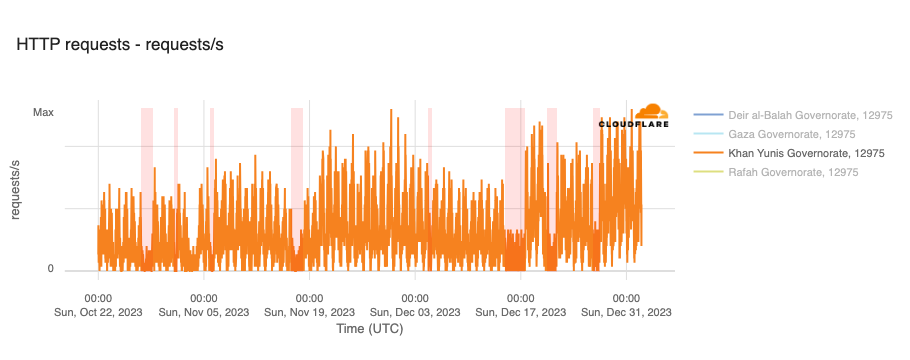
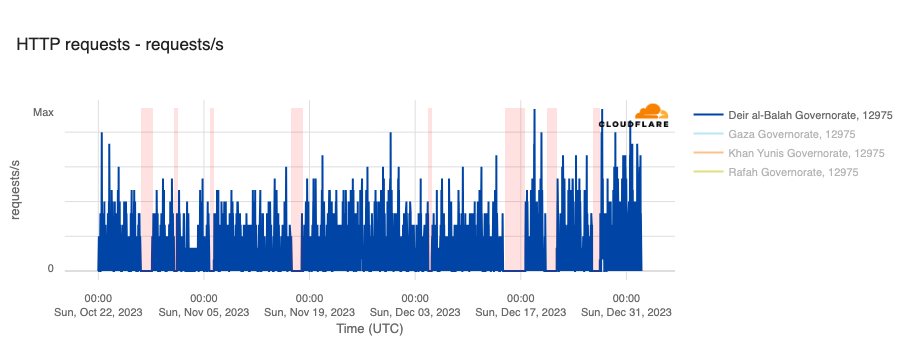
We have covered Internet disruptions related to the ongoing conflict in Gaza multiple times since October 2023, both on Cloudflare Radar’s presence on X, and on the Cloudflare blog (1, 2, 3). In many of these cases, Paltel (AS12975) has posted notices on social media regarding service disruptions and outages. On September 8, Paltel posted a message on its Facebook page, stating (translated) “We regret to announce the suspension of home internet services in the central and southern areas of the Gaza Strip, due to the ongoing aggression.”
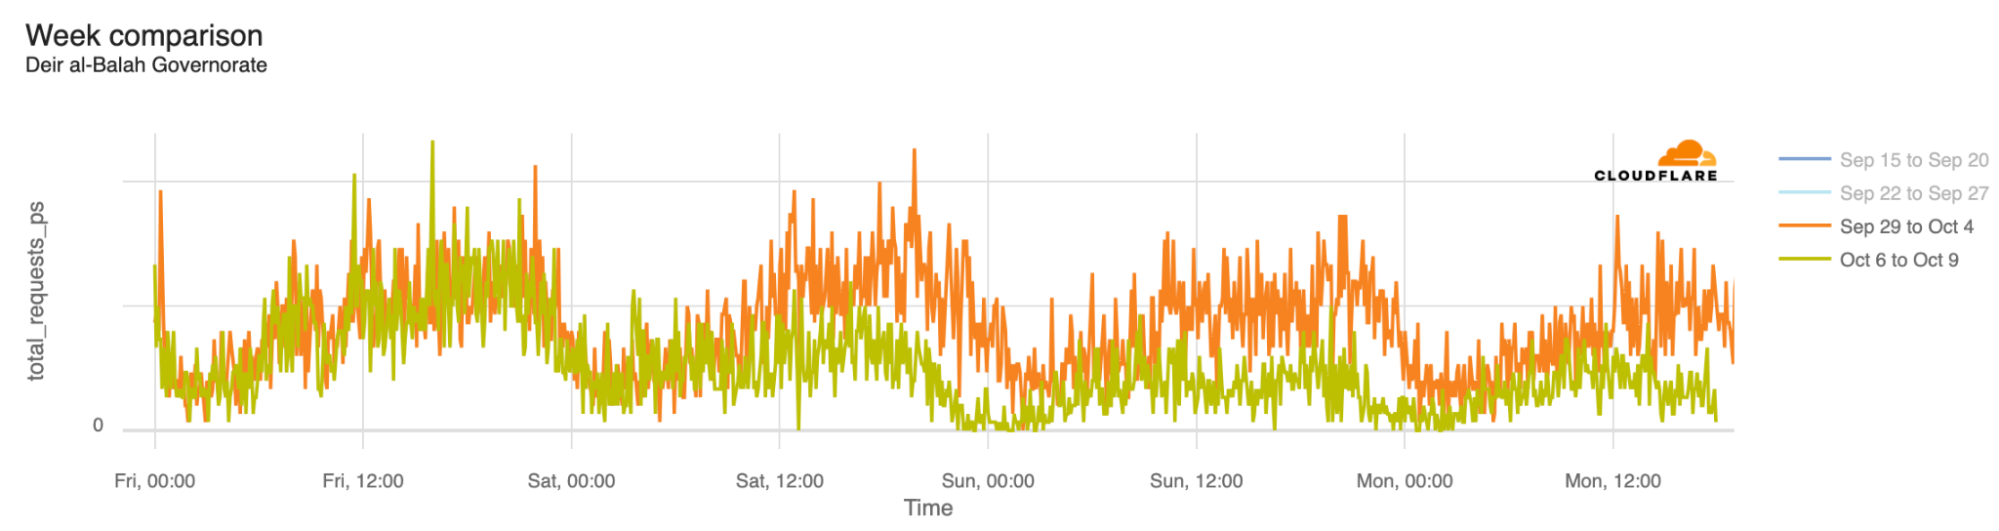
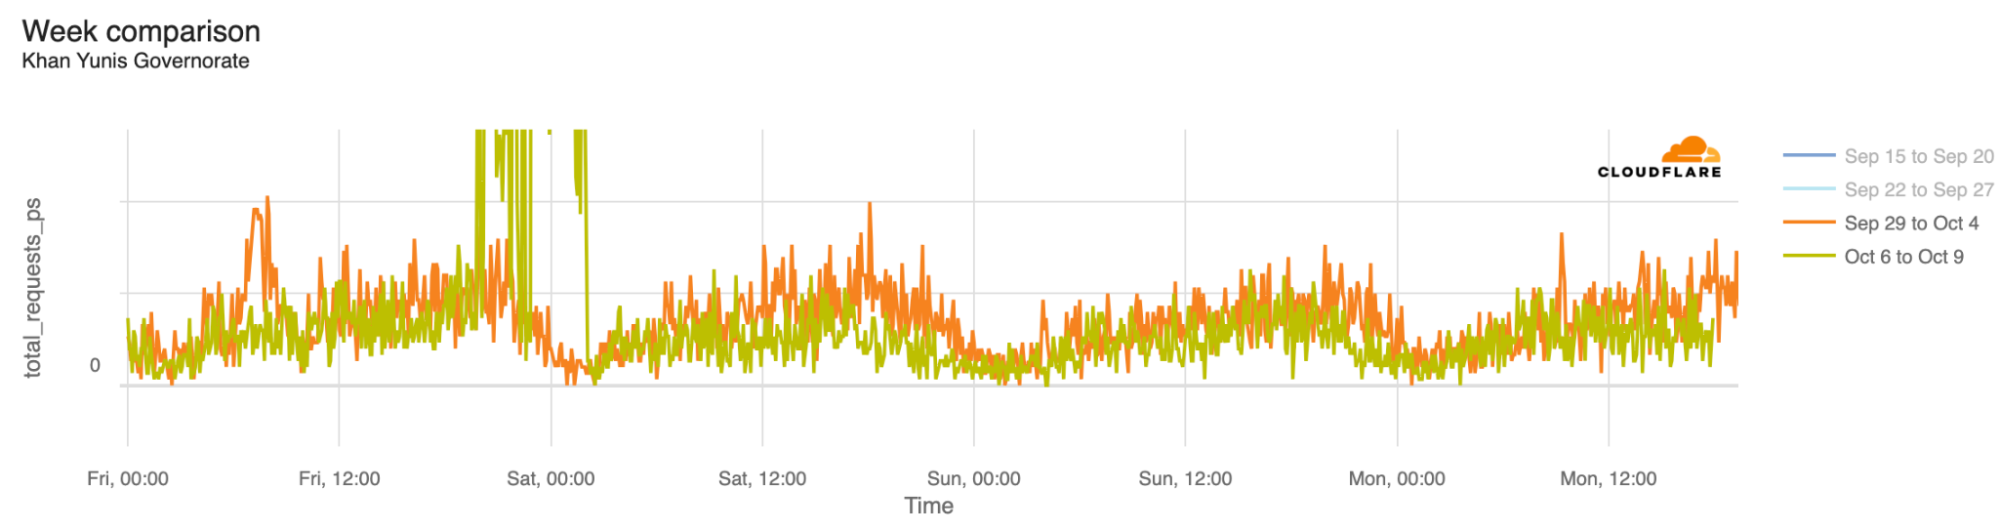
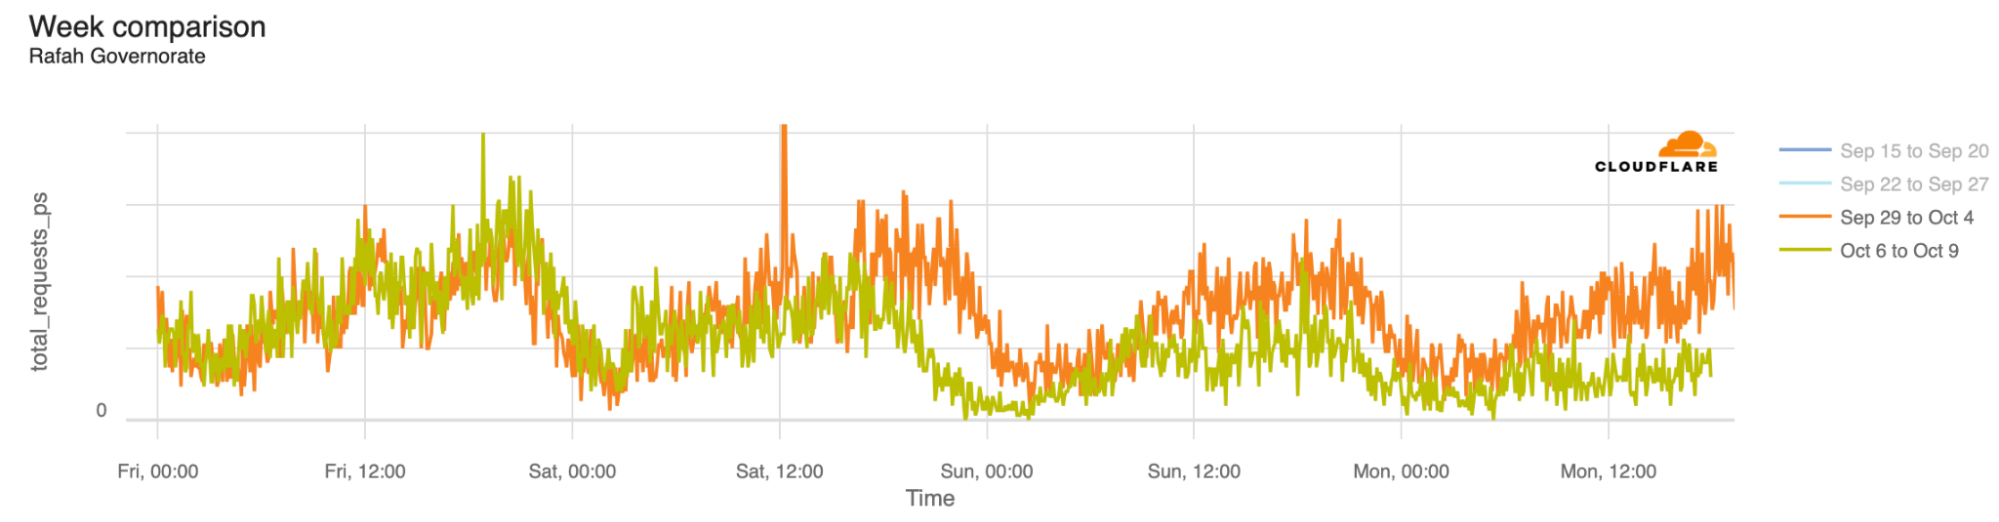
Within the Gaza, Rafah, Deir al-Balah Governorates, we observed a sharp drop in traffic at 18:00 local time (16:00 UTC). The impact appeared to be most significant in Rafah and Deir al-Balah. Traffic returned to expected levels around 23:00 local time (21:00 UTC), and Paltel confirmed the service restoration in a subsequent Facebook post, stating (translated) “We would like to announce the return of home Internet services in central and southern Gaza Strip to the way it was before it was interrupted hours ago.”
Lebanon
Israeli airstrikes targeting the Lebanese capital of Beirut on September 28 likely knocked local network provider Solidere (AS42852) offline for several hours. The graph below shows a loss of traffic starting around 12:15 local time (10:15 UTC), at the same time a complete loss of announced IP address space occurred. Most of Solidere’s IP address space started to get announced again at 14:45 local time (12:45 UTC), and a slight increase in traffic was seen at that time as well. Traffic levels fully recovered just after 18:00 local time (16:00 UTC), and announced IP address space had stabilized by that time as well.
Fire
Algeria
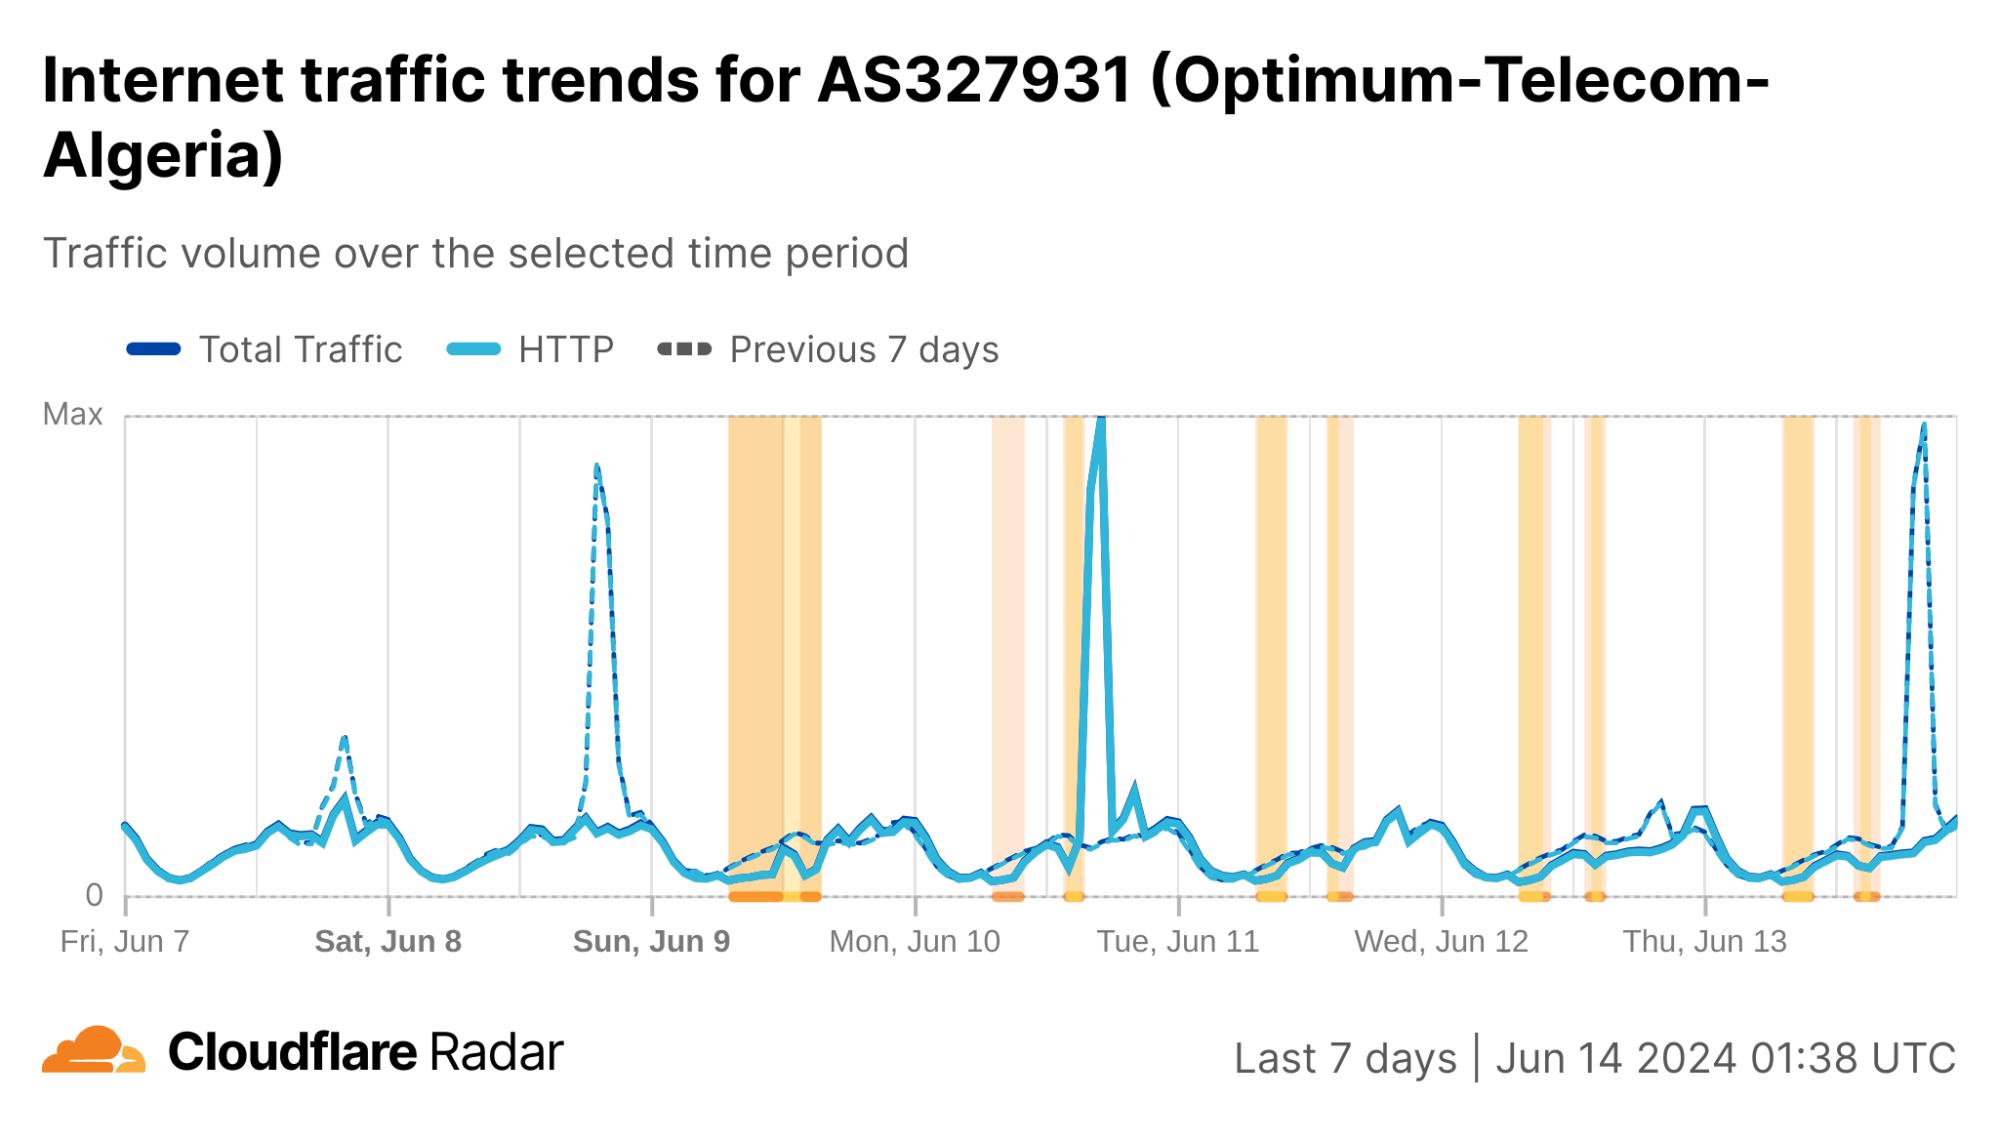
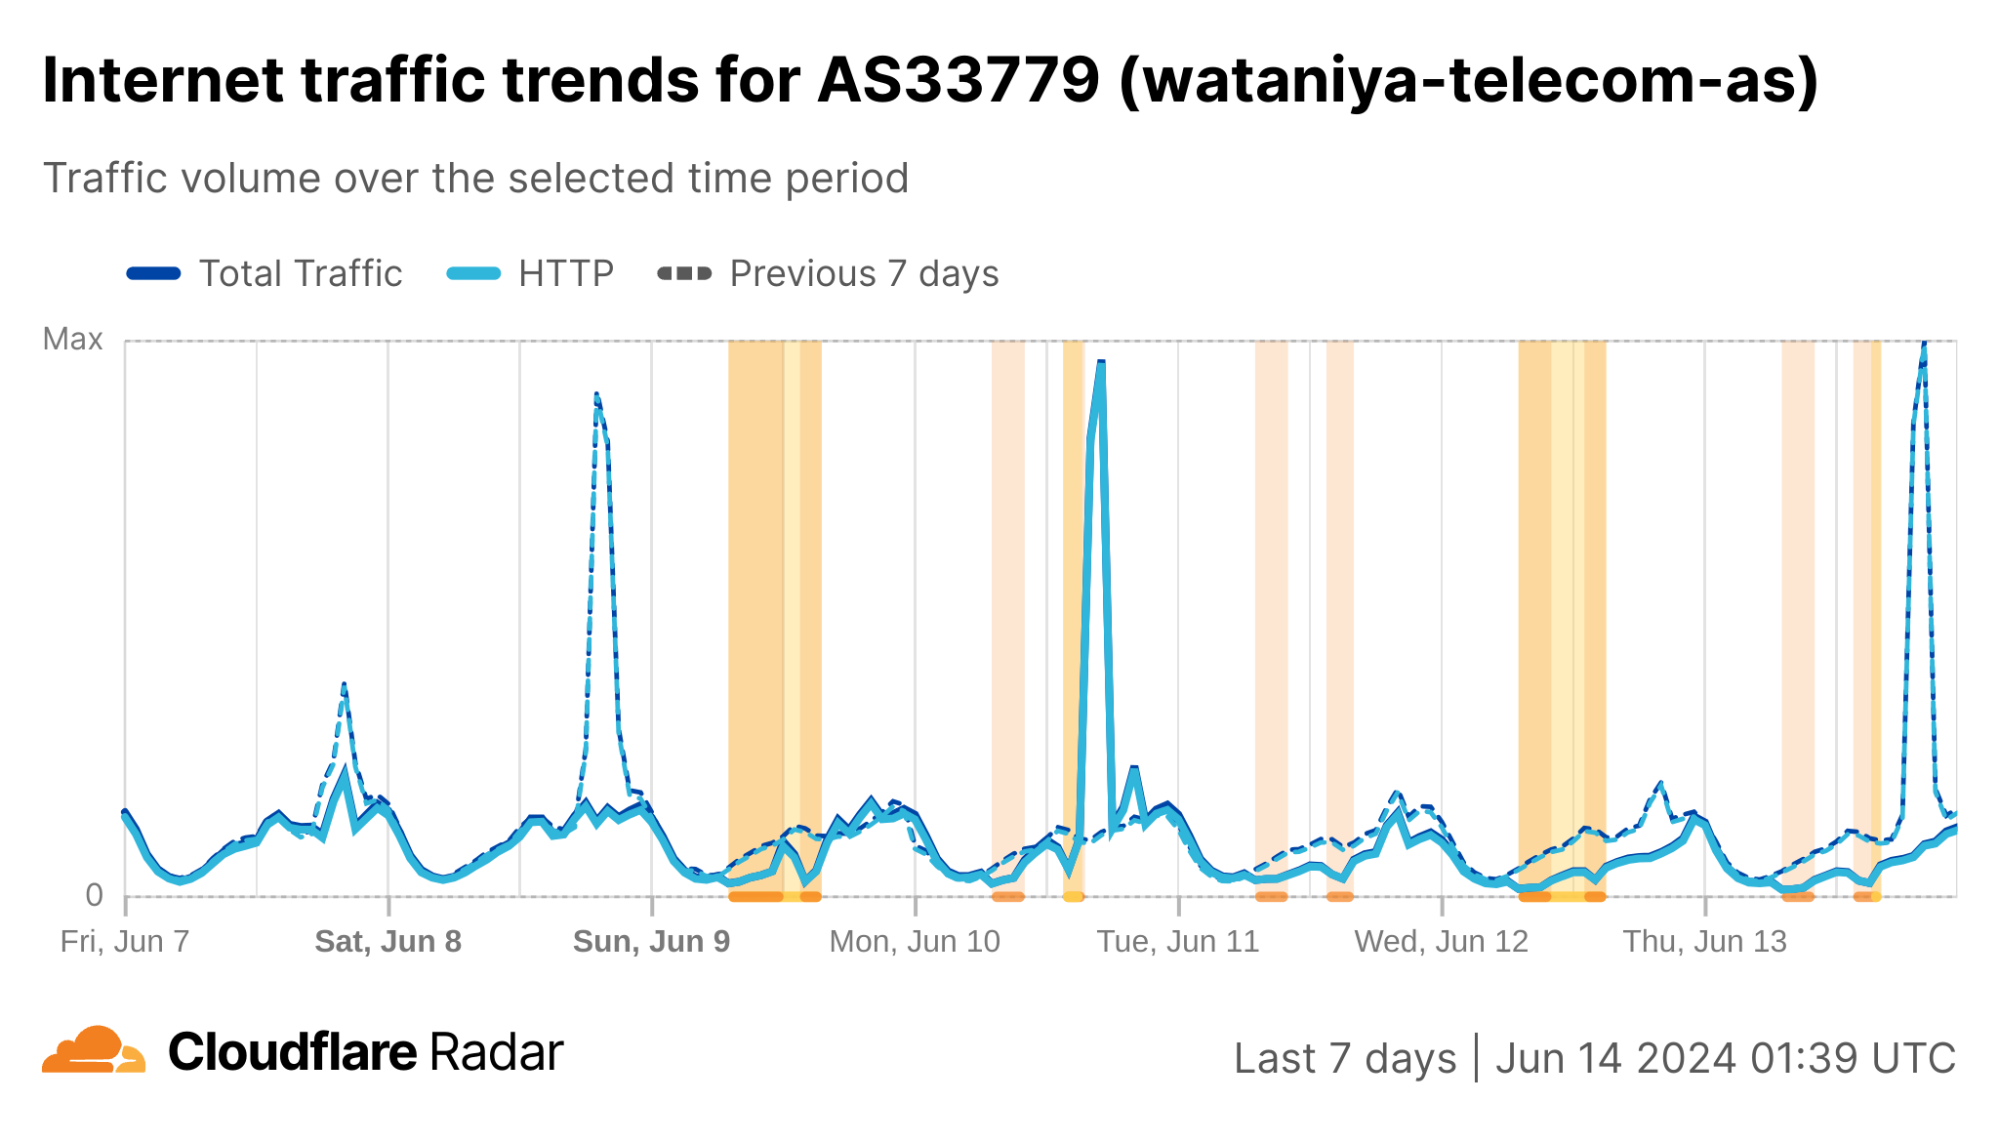
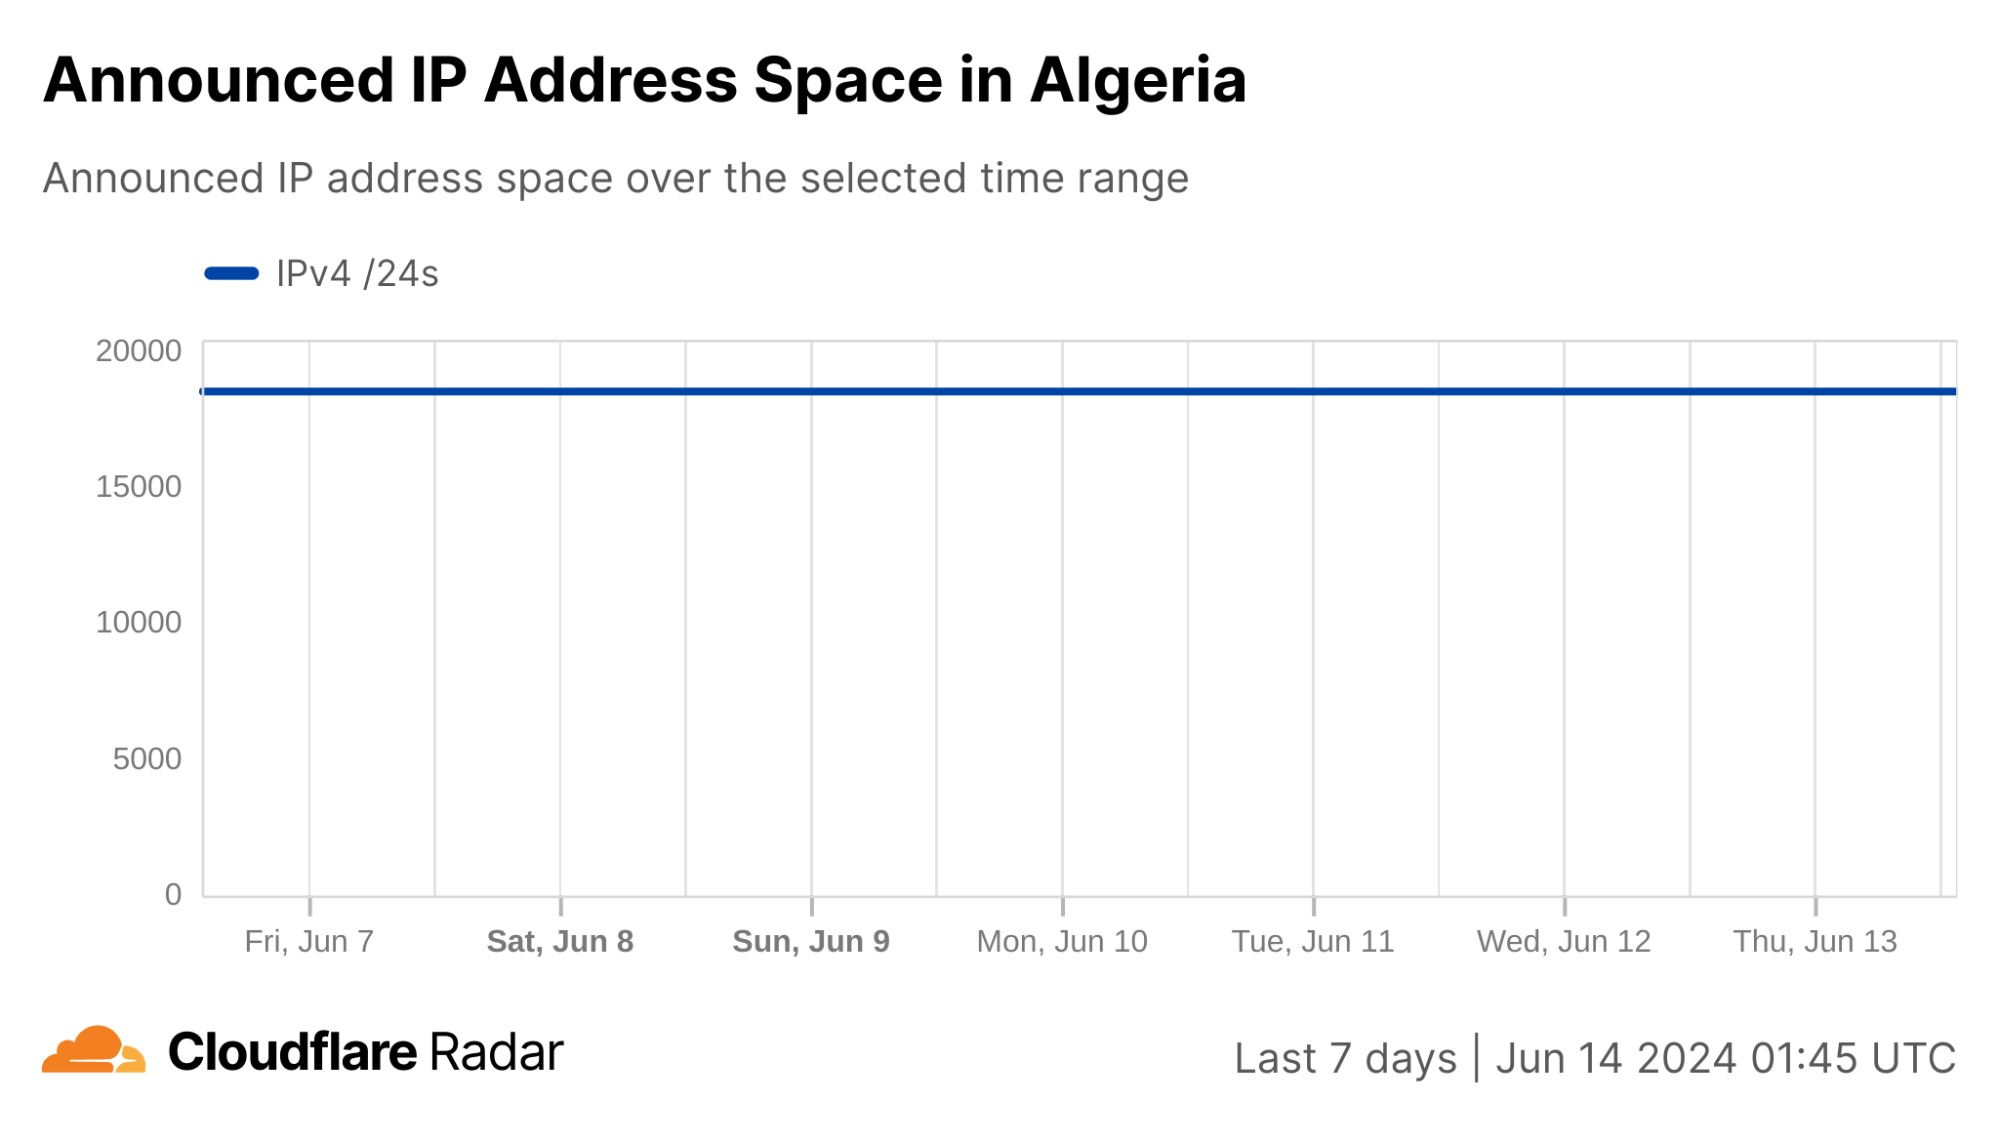
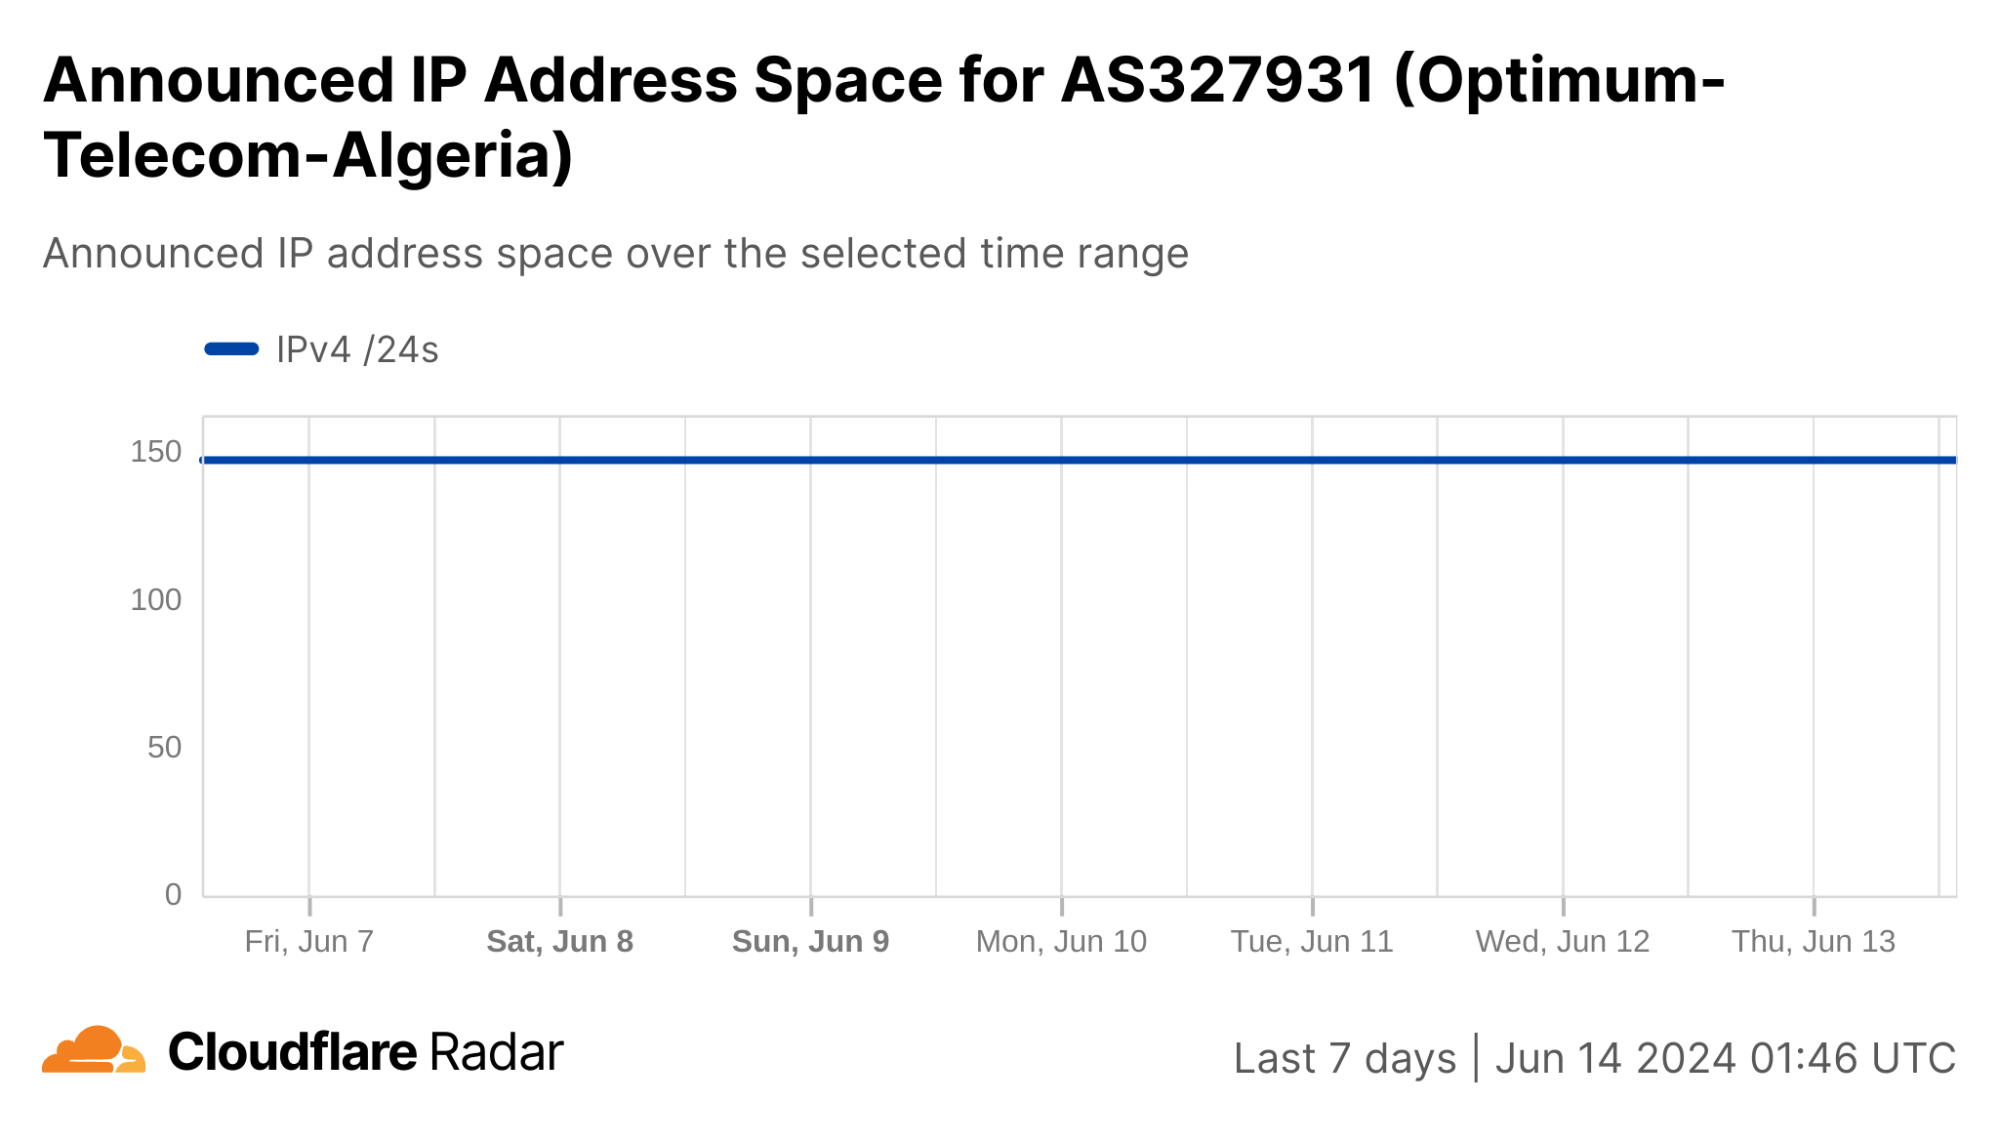
A fire near a data center in Blida Province, Algeria disrupted connectivity on AS327931 (Djezzy) at 13:00 and local time (12:00 UTC) on July 24. According to a (translated) X post from Djezzy, “Djezzy announced fluctuations in its services in some areas of the country, as it was a victim of a fire that broke out on Wednesday, July 24, 2024, in a warehouse of one of the companies located near its technical center in the state of Blida.” The post from Djezzy predicted that “97% of the sites will be restored by around 3 am [July 25]”, but traffic did not return to expected levels until the end of the day on July 25.
Unknown
United States
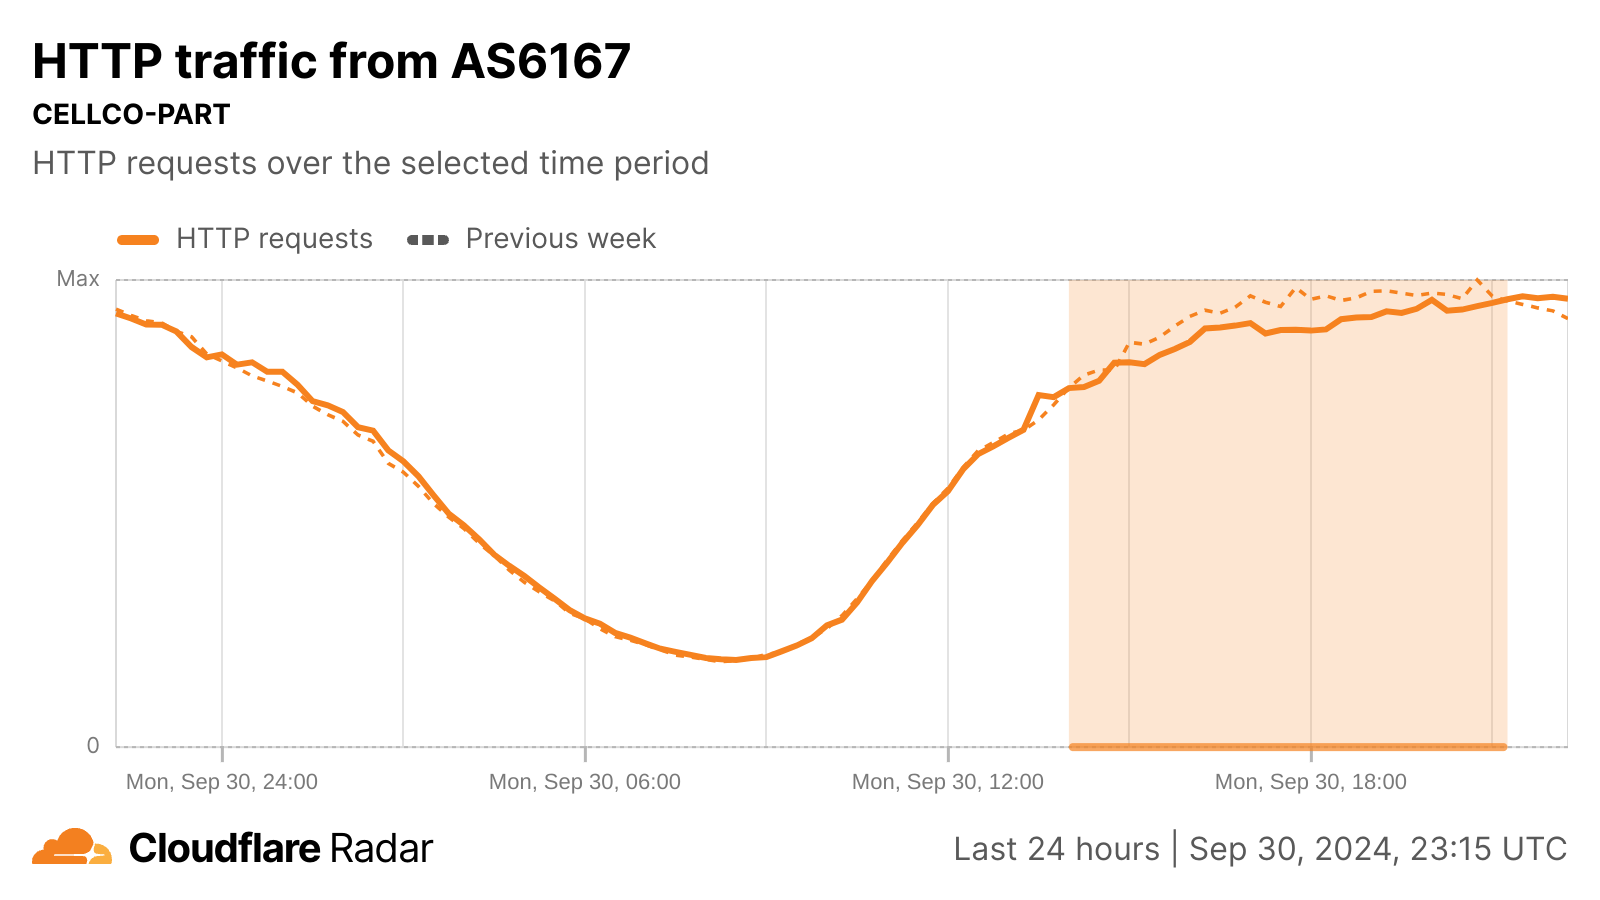
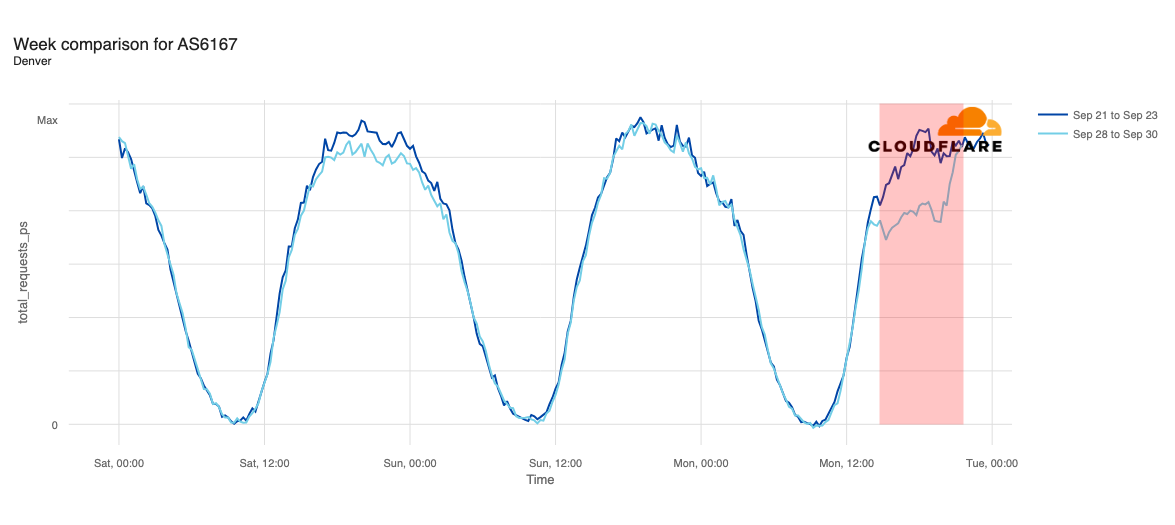
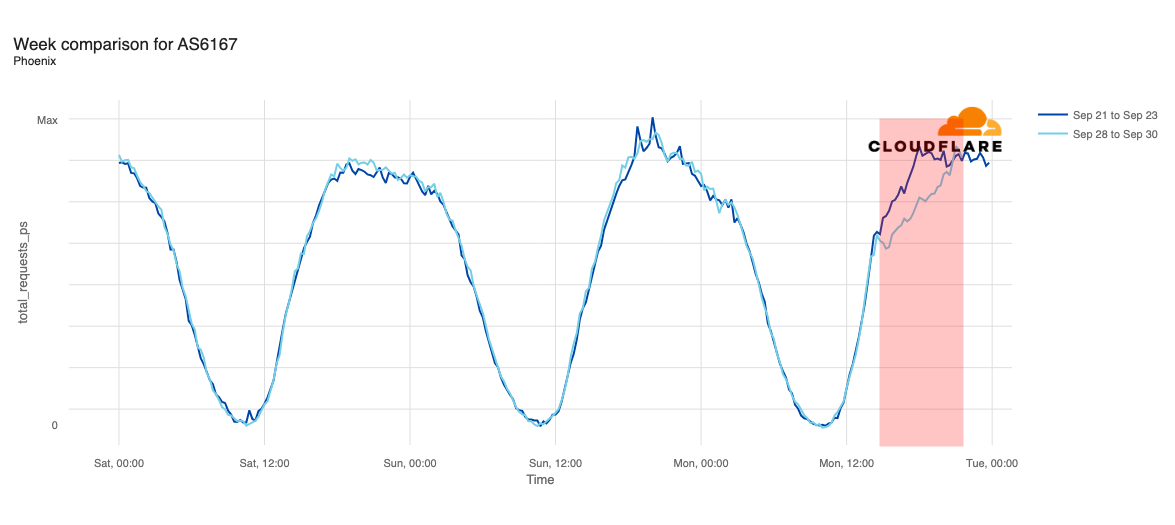
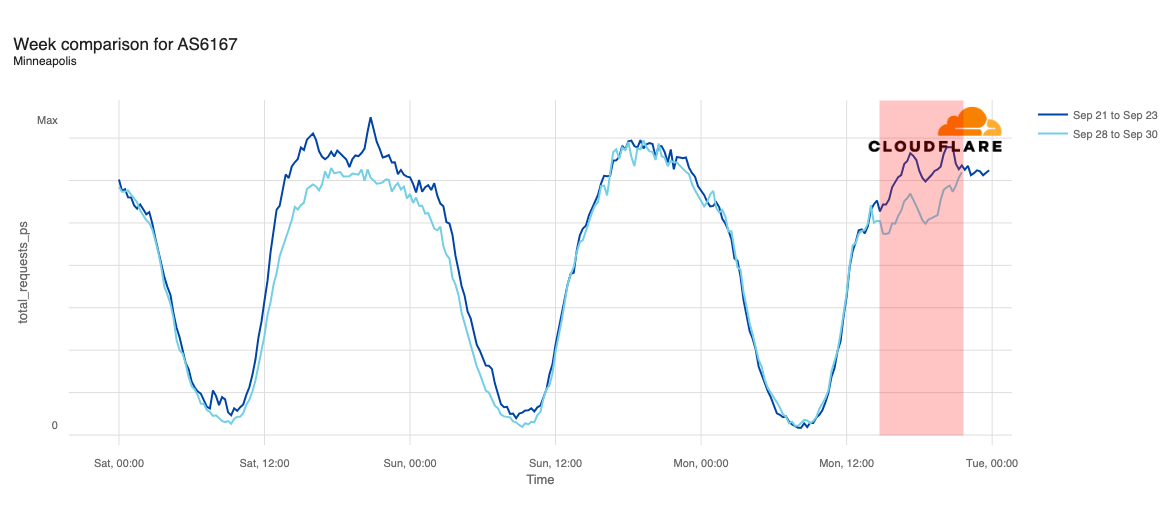
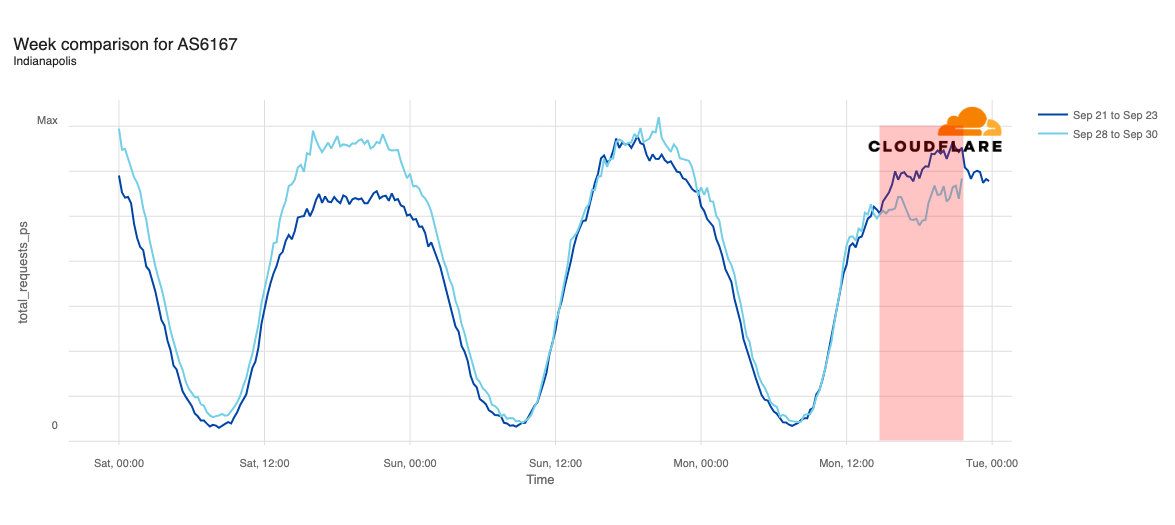
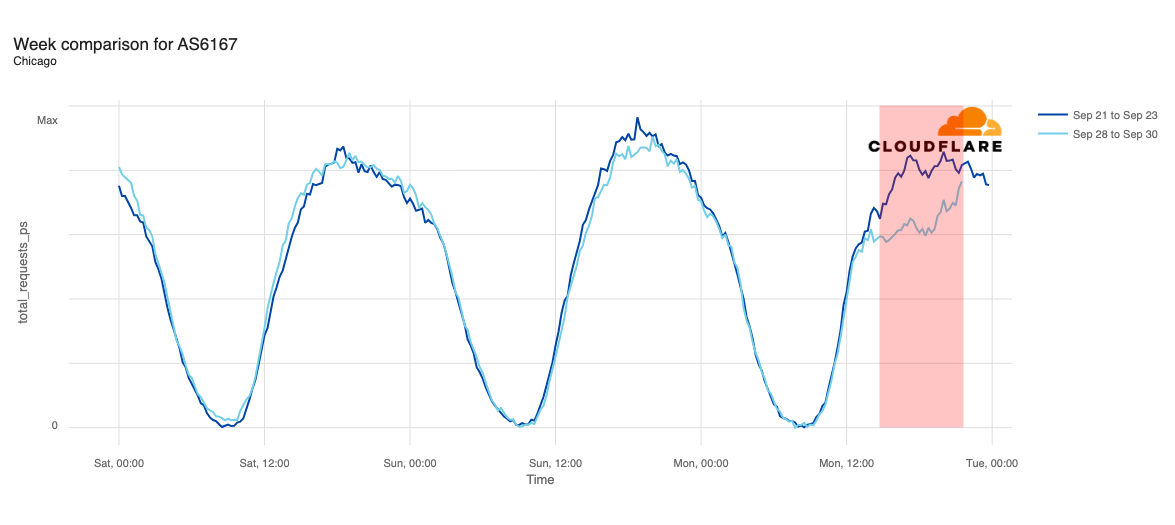
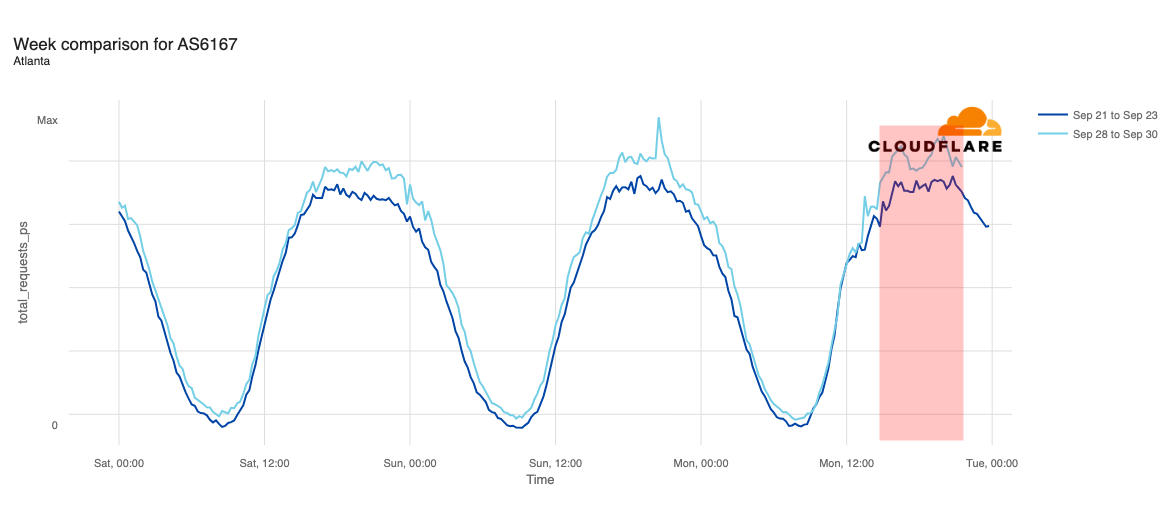
On Monday, September 30, customers on Verizon’s mobile network in multiple cities across the United States reported experiencing a loss of connectivity. Impacted phones showed “SOS” instead of the usual bar-based signal strength indicator, and customers complained of an inability to make or receive calls on their mobile devices. Although initial reports of connectivity problems started around 09:00 ET (13:00 UTC), we didn’t see a noticeable change in request volume at an ASN level until about two hours later. AS6167 (CELLCO) is the autonomous system used by Verizon for its mobile network.
Just before 12:00 ET (16:00 UTC), Verizon published a social media post acknowledging the problem, stating “We are aware of an issue impacting service for some customers. Our engineers are engaged, and we are working quickly to identify and solve the issue.” As the graph below shows, a slight decline (-5%) in HTTP traffic as compared to traffic at the same time a week prior is first visible around 11:00 ET (15:00 UTC), and request volume fell as much as 9% below expected levels at 13:45 ET (17:45 UTC).
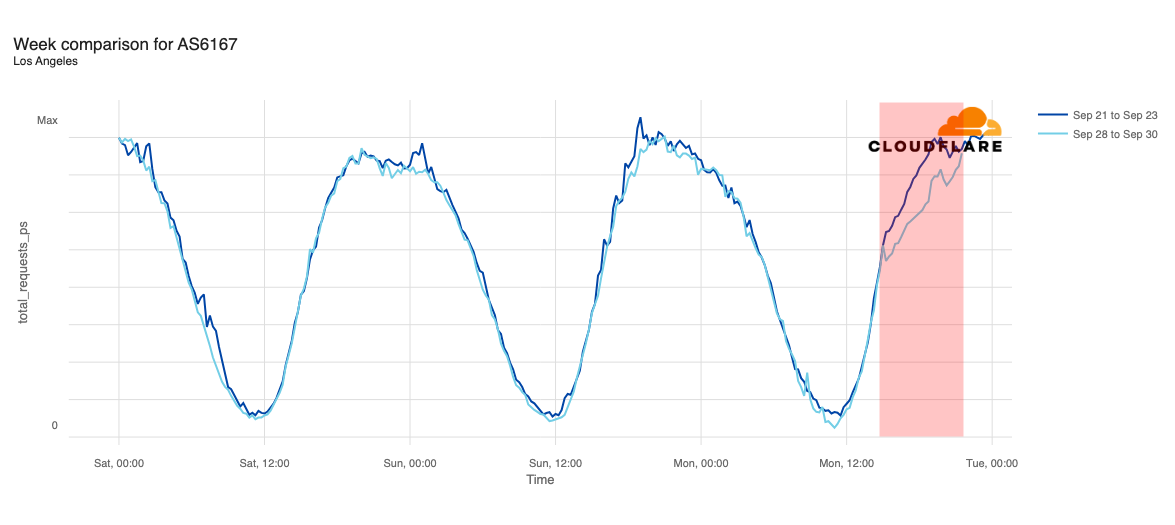
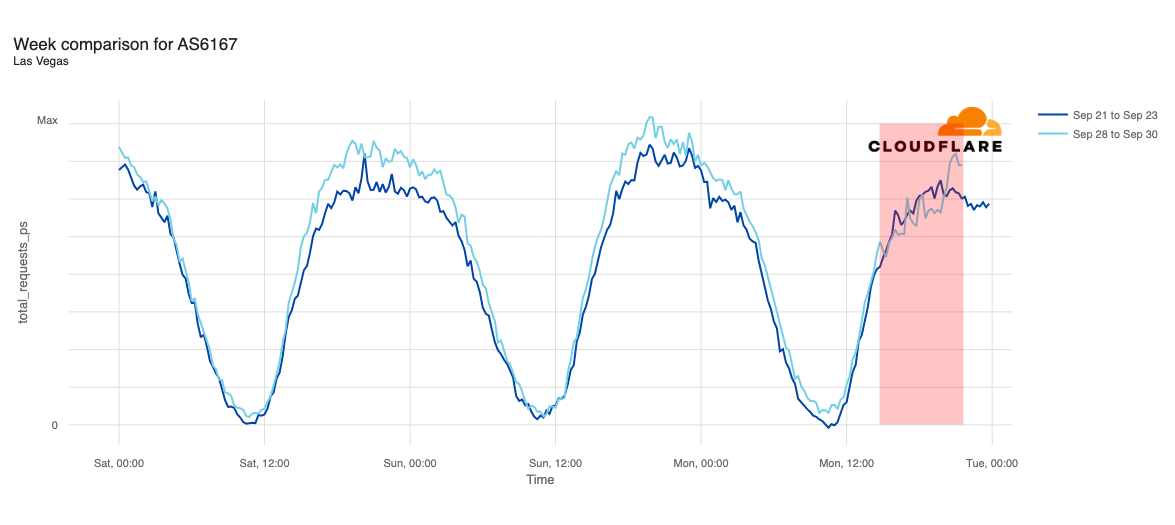
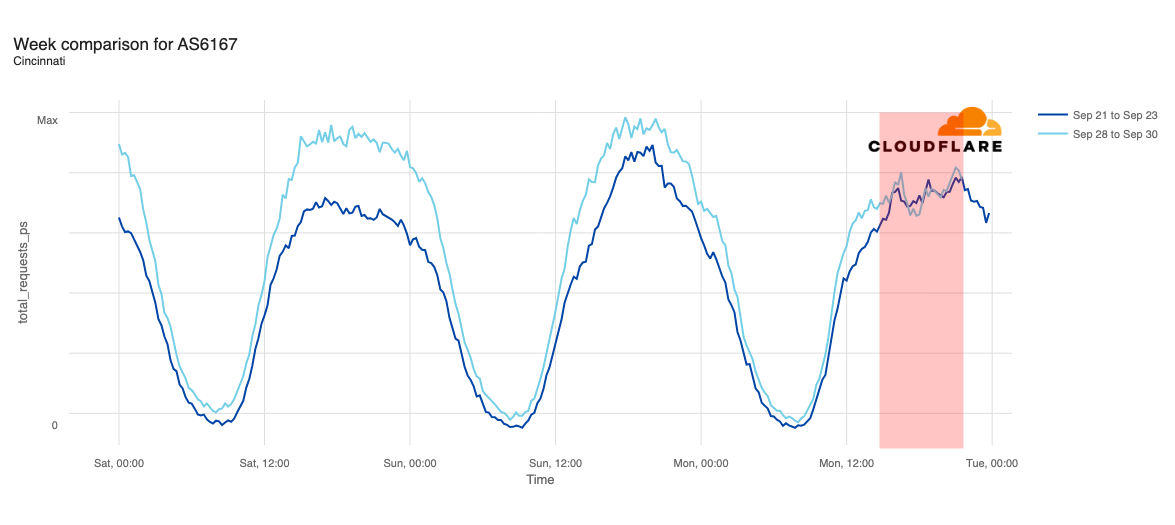
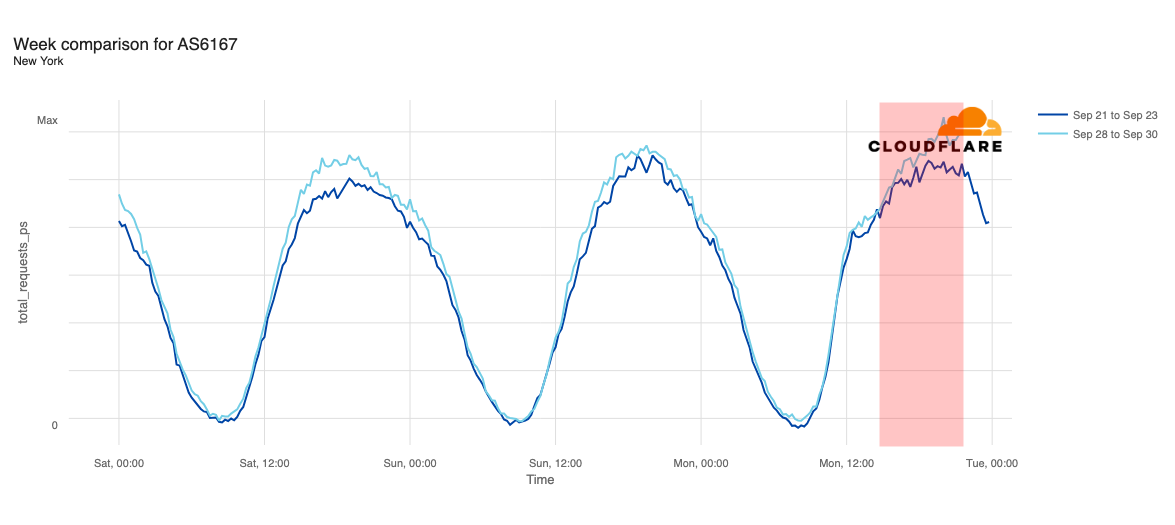
Media reports listed cities including Chicago, Indianapolis, New York City, Atlanta, Cincinnati, Omaha, Phoenix, Denver, Minneapolis, Seattle, Los Angeles, and Las Vegas as being most impacted. Traffic graphs illustrating the impacts seen in these cities can be found in our Impact of Verizon’s September 30 outage on Internet traffic blog post.
Traffic appeared to return to expected levels around 17:15 ET (21:15 UTC). At 19:18 ET (23:18 UTC), a social media post from Verizon noted “Verizon engineers have fully restored today’s network disruption that impacted some customers. Service has returned to normal levels.”
Pakistan
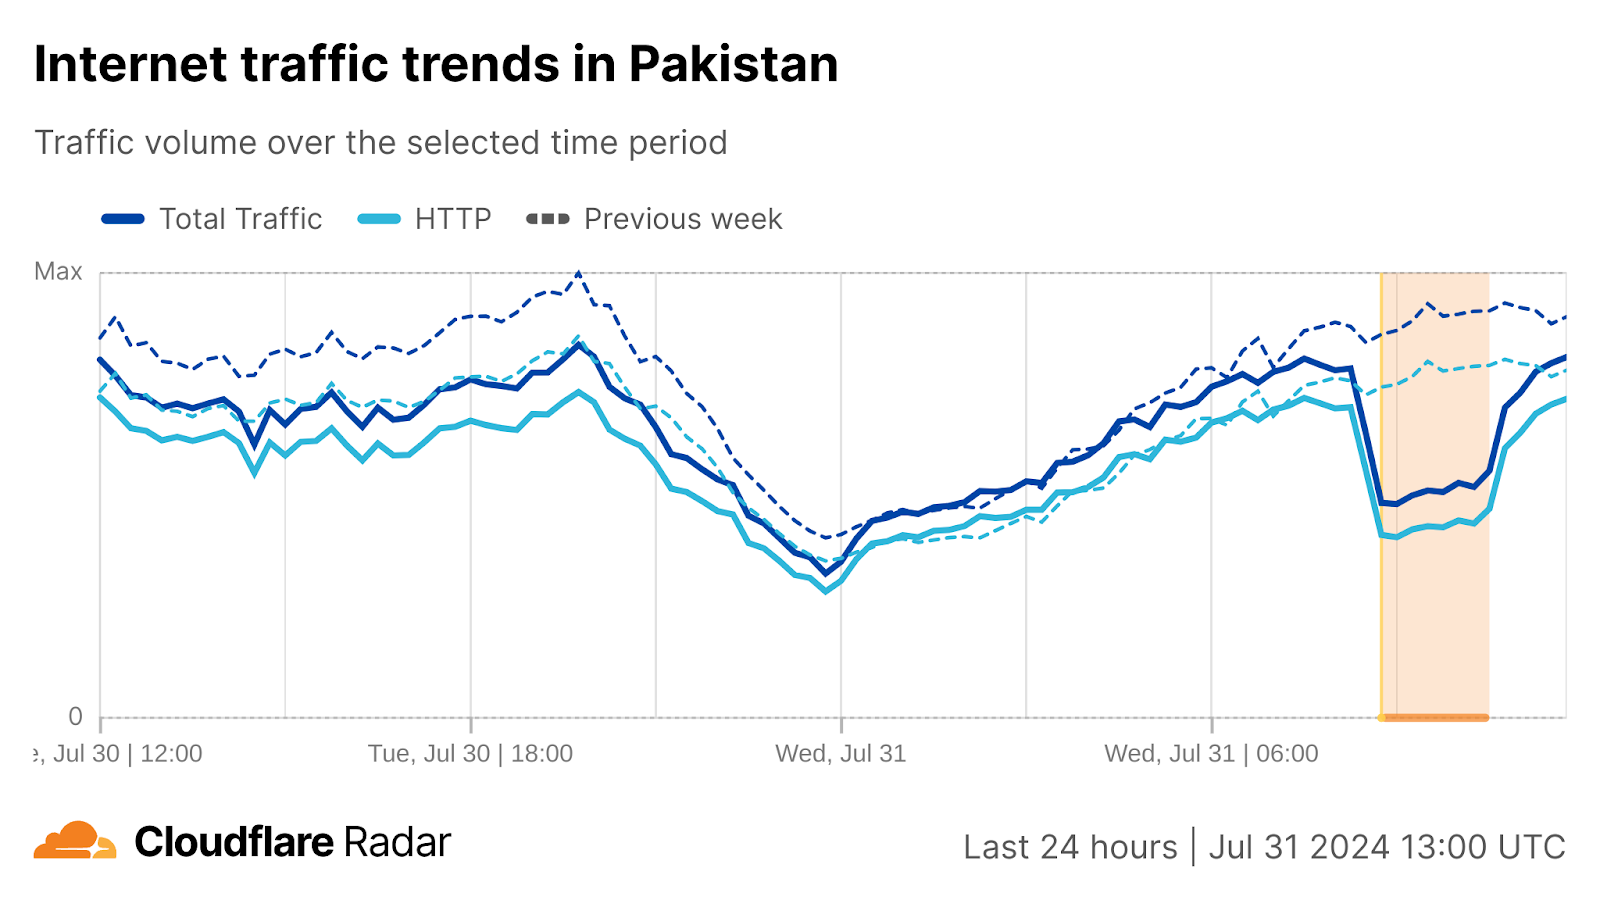
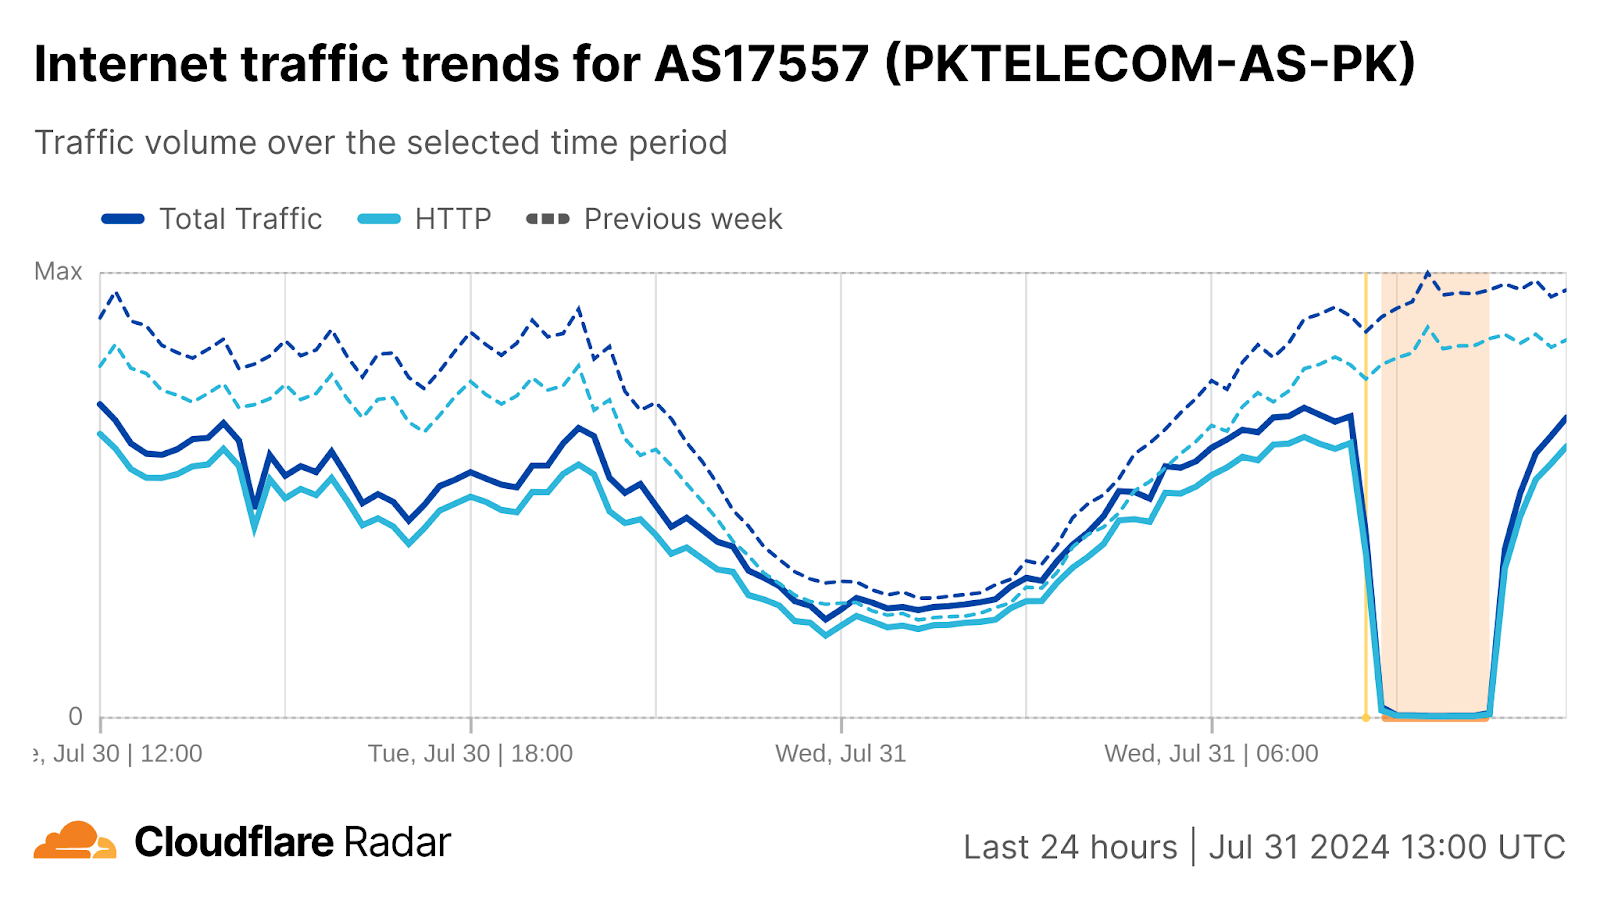
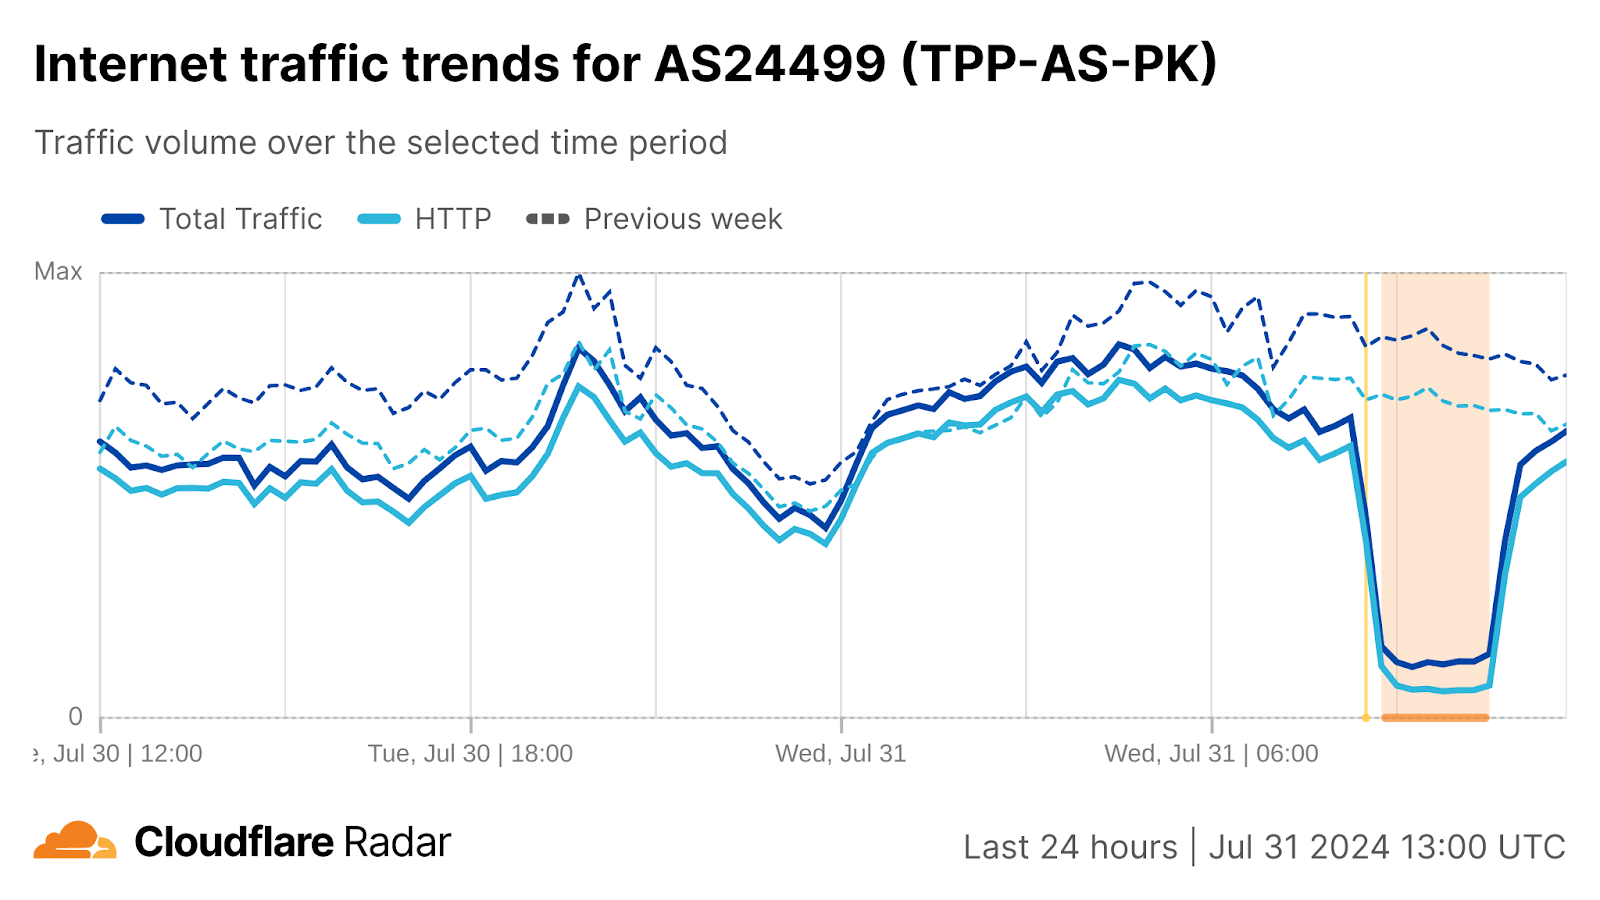
On July 31, Pakistan experienced a wide-scale Internet disruption that lasted approximately two hours, between 13:30 – 15:30 local time (08:30 – 10:30 UTC). Traffic only dropped ~45% at a country level, but AS17557 (PTCL) experienced a near complete loss of traffic, while traffic at AS24499 (Telenor Pakistan) dropped nearly 90%. Together, the two network providers serve an estimated nine million users, and are among the top five Internet service providers in the country.
The actual cause of the disruption is disputed. It was reported that the Pakistan Telecommunication Authority (PTA) attributed the disruptions to a technical glitch in the international submarine cable affecting the Pakistan Telecommunication Company Limited (PTCL) network. However, another published report noted “According to our sources, the government’s latest firewall edition to block the content was misconfigured, resulting in Internet connectivity disruption.” Additional details can be found in our August 1 blog post, A recent spate of Internet disruptions.
United Kingdom
On August 14, subscribers of UK service provider Vodafone (AS25135)reported problems accessing both mobile and landline Internet connections. Starting around 11:00 local time (10:00 UTC), we observed traffic starting to drop, ultimately falling 43% below the same time the prior week. The disruption was fairly short-lived, as traffic returned to expected levels by 13:30 local time (12:30 UTC). Vodafone did not acknowledge the issue on social media, nor did it provide a public explanation for what caused the disruption.
Conclusion
Although Internet disruptions observed during the third quarter had a variety of underlying causes, those caused by power outages due to aging or insufficiently maintained electrical infrastructure are worth highlighting. Of course, widespread power outages always create a massive inconvenience for impacted populations, but over the last several years, as communication, entertainment, commerce, and more have become increasingly reliant on the Internet, the impact of these outages has become even more significant, because losing electrical power largely means losing Internet connectivity. Although mobile connectivity may still be available in some cases, it is decidedly not a complete replacement, not to mention that mobile devices will eventually need to be recharged. While addressing the underlying infrastructure issues require non-trivial amounts of time, resources, and money, governments appear to be taking steps towards doing so.
On Monday, September 30, customers on Verizon’s mobile network in multiple cities across the United States reported experiencing a loss of connectivity. Impacted phones showed “SOS” instead of the usual bar-based signal strength indicator, and customers complained of an inability to make or receive calls on their mobile devices.
AS6167 (CELLCO) is the autonomous system used by Verizon for its mobile network. To better understand how the outage impacted Internet traffic on Verizon’s network, we took a look at HTTP request volume from AS6167 independent of geography, as well as traffic from AS6167 in various cities that were reported to be the most significantly impacted.
Although initial reports of connectivity problems started around 09:00 ET (13:00 UTC), we didn’t see a noticeable change in request volume at an ASN level until about two hours later. Just before 12:00 ET (16:00 UTC), Verizon published a social media post acknowledging the problem, stating “We are aware of an issue impacting service for some customers. Our engineers are engaged and we are working quickly to identify and solve the issue.”
As the Cloudflare Radar graph below shows, a slight decline (-5%) in HTTP traffic as compared to traffic at the same time a week prior is first visible around 11:00 ET (15:00 UTC). Request volume fell as much as 9% below expected levels at 13:45 ET (17:45 UTC).
Just after 17:00 ET (21:00 UTC), Verizon published a second social media post noting, in part, “Verizon engineers are making progress on our network issue and service has started to be restored.” Request volumes returned to expected levels around the same time, surpassing the previous week’s levels at 17:15 ET (21:15 UTC). At 19:18 ET (23:18 UTC), a social media post from Verizon noted “Verizon engineers have fully restored today’s network disruption that impacted some customers. Service has returned to normal levels.”
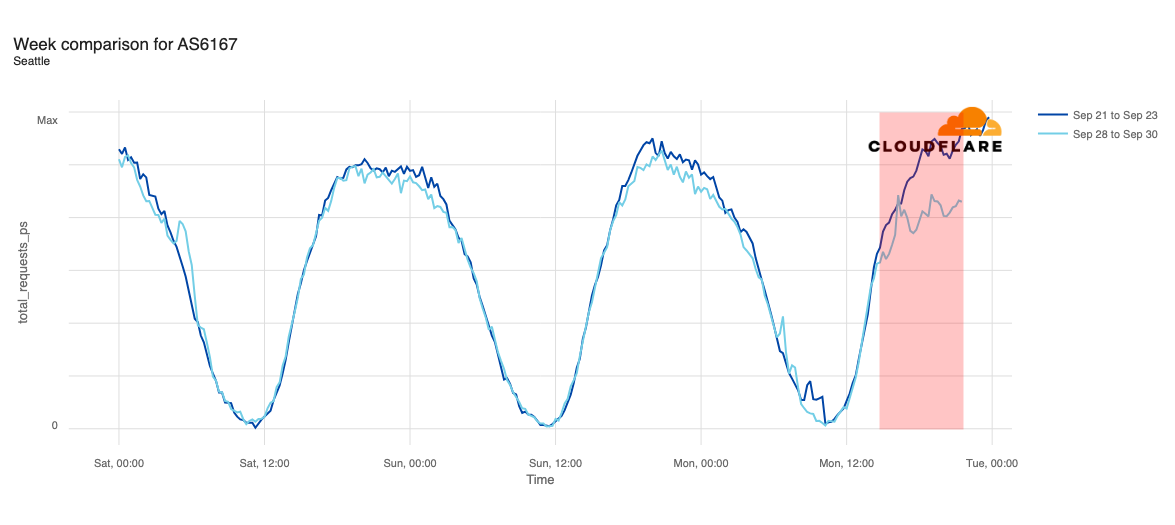
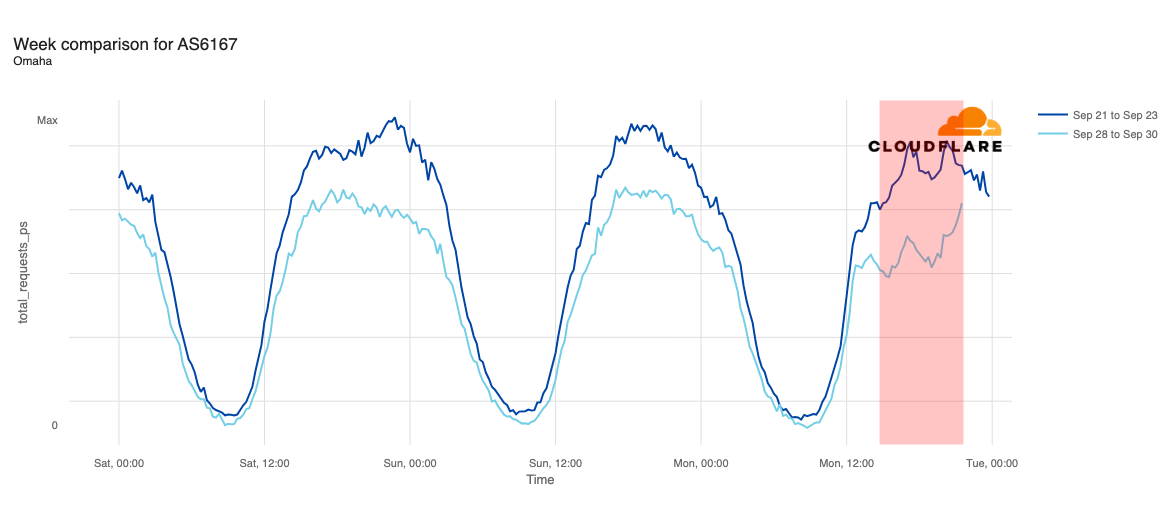
Media reports listed cities including Chicago, Indianapolis, New York City, Atlanta, Cincinnati, Omaha, Phoenix, Denver, Minneapolis, Seattle, Los Angeles, and Las Vegas as being most impacted. In addition to looking at comparative traffic trends across the whole Verizon Wireless network, we also compared request volumes in the listed cities to the same time a week prior (September 23).
Declines in request traffic starting around 11:00 ET (15:00 UTC) are clearly visible in cities including Los Angeles, Seattle, Omaha, Denver, Phoenix, Minneapolis, Indianapolis, and Chicago. In contrast to other cities, Omaha’s request volume was already trending lower than last week heading into today’s outage, but its graph clearly shows the impact of today’s disruption as well. Omaha’s difference in traffic was the most significant, down approximately 30%, while other cities saw declines in the 10-20% range.
Request traffic from Las Vegas initially appeared to exhibit a bit of volatility around 11:00 ET (15:00 UTC), but continues to track fairly closely to last week’s levels before exceeding them starting at 16:00 ET (20:00 UTC). Cincinnati was tracking slightly above last week’s request volume before the outage began, and tracked closely to the prior week during the outage period.
We observed week-over-week traffic increases during the outage period in New York and Atlanta. However, in both cities, traffic was already slightly above last week’s levels, and that trend continued throughout the day.
Based on our observations, it appears that voice services on Verizon’s network may have been more significantly impacted than data services, as we saw some declines in request traffic across impacted cities, but none experienced full outages.
As of this writing (19:15 ET, 23:15 UTC), no specific information has been made available by Verizon regarding the root cause of the network problems.
On September 17, 2024, during routine maintenance, Cloudflare inadvertently stopped announcing fifteen IPv4 prefixes, affecting some Business plan websites for approximately one hour. During this time, IPv4 traffic for these customers would not have reached Cloudflare, and users attempting to connect to websites assigned addresses within those prefixes would have received errors.
We’re very sorry for this outage.
This outage was the result of an internal software error and not the result of an attack. In this blog post, we’re going to talk about what the failure was, why it occurred, and what we’re doing to make sure this doesn’t happen again.
Background
Cloudflare assembled a dedicated Addressing team in 2019 to simplify the ways that IP addresses are used across Cloudflare products and services. The team builds and maintains systems that help Cloudflare conserve and manage its own network resources. The Addressing team also manages periodic changes to the assignment of IP addresses across infrastructure and services at Cloudflare. In this case, our goal was to reduce the number of IPv4 addresses used for customer websites, allowing us to free up addresses for other purposes, like deploying infrastructure in new locations. Since IPv4 addresses are a finite resource and are becoming more scarce over time, we carry out these kinds of “renumbering” exercises quite regularly.
Renumbering in Cloudflare is carried out using internal processes that move websites between sets of IP addresses. A set of IP addresses that no longer has websites associated with it is no longer needed, and can be retired. Once that has happened, the associated addresses are free to be used elsewhere.
Back in July 2024, a batch of Business plan websites were moved from their original set of IPv4 addresses to a new, smaller set, appropriate to the forecast requirements of that particular plan. On September 17, after confirming that all of the websites using those addresses had been successfully renumbered, the next step was to be carried out: detach the IPv4 prefixes associated with those addresses from Cloudflare’s network and to withdraw them from service. That last part was to be achieved by removing those IPv4 prefixes from the Internet’s global routing table using the Border Gateway Protocol (BGP), so that traffic to those addresses is no longer routed towards Cloudflare. The prefixes concerned would then be ready to be deployed for other purposes.
What was released and how did it break?
When we migrated customer websites out of their existing assigned address space in July, we used a one time migration template that cycles through all the websites associated with the old IP addresses and moves them to new ones. This calls a function that updates the IP assignment mechanism to synchronize the IP address-to-website mapping.
A couple of months prior to the July migration, the relevant function code was updated as part of a separate project related to legacy SSL configurations. That update contained a fix that replaced legacy code to synchronize two address pools with a call to an existing synchronization function. The update was reviewed, approved, merged, and released.
Unfortunately, the fix had consequences for the subsequent renumbering work. Upon closer inspection (we’ve done some very close post-incident inspection), a side effect of the change was to suppress updates in cases where there was no linked reference to a legacy SSL certificate. Since not all websites use legacy certificates, the effect was that not all websites were renumbered — 1,661 customer websites remained linked to old addresses in the address pools that were intended to be withdrawn. This was not noticed during the renumbering work in July, which had concluded with the assumption that every website linked to the old addresses had been renumbered, and that assumption was not checked.
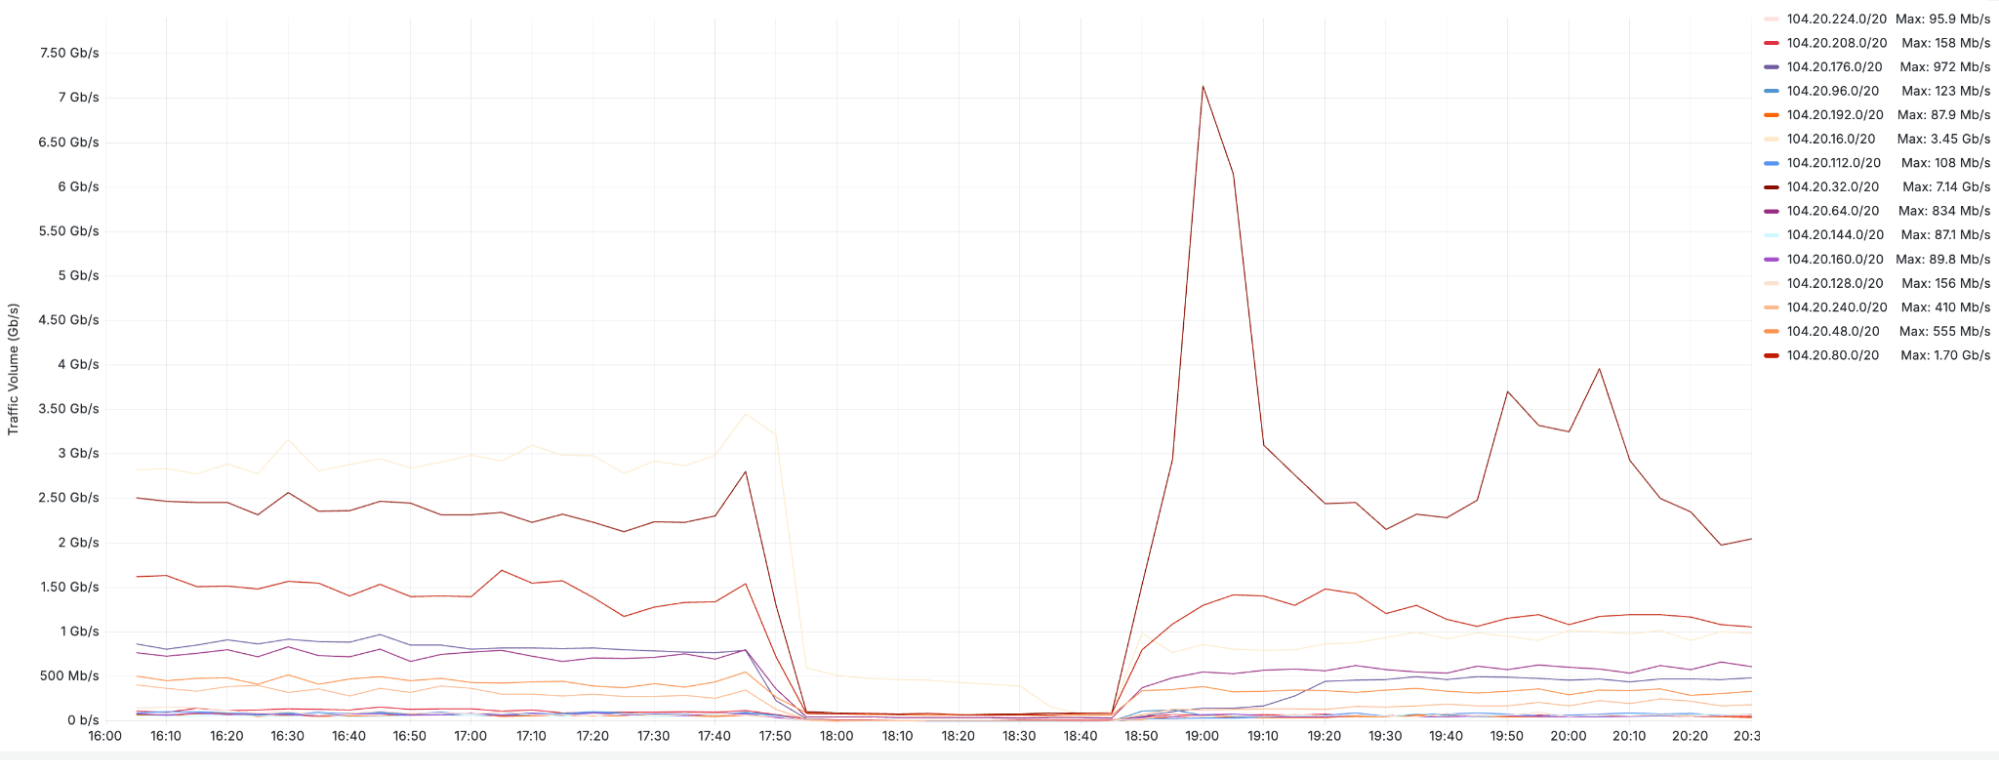
At 2024-09-17 17:51 UTC, fifteen IPv4 prefixes corresponding to the addresses that were thought to be safely unused were withdrawn using BGP. Cloudflare operates a global network with hundreds of data centers, and there was some variation in the precise time when the prefixes were withdrawn from particular parts of the world. In the following ten minutes, we observed an aggregate 10 Gbps drop in traffic to the 1,661 affected websites network-wide.
The graph above shows traffic volume (in bits per second) for each individual prefix that was affected by the incident.
Incident timeline and impact
All timestamps are UTC on 2024-09-17.
At 17:41, the Addressing engineering team initiated the release that disabled prefixes in production.
At 17:51, BGP announcements began to be withdrawn and traffic to Cloudflare on the impacted prefixes started to drop.
At 17:57, the SRE team noticed alerts triggered by an increase in unreachable IP address space and began investigating. The investigation ended shortly afterwards, since it is generally expected that IP addresses will become unreachable when they are being removed from service, and consequently the alerts did not seem to indicate an abnormal situation.
At 18:36, Cloudflare received escalations from two customers, and an incident was declared. A limited deployment window was quickly implemented once the severity of the incident was assessed.
At 18:46, Addressing team engineers confirmed that the change introduced in the renumbering release triggered the incident and began preparing the rollback procedure to revert changes.
At 18:50, the release was rolled back, prefixes were re-announced in BGP to the Internet, and traffic began flowing back through Cloudflare.
At 18:50:27, the affected routes were restored and prefixes began receiving traffic again.
There was no impact to IPv6 traffic. 1,661 customer websites that were associated with addresses in the withdrawn IPv4 prefixes were affected. There was no impact to other customers or services.
How did we fix it?
The immediate fix to the problem was to roll back the release that was determined to be the proximal cause. Since all approved changes have tested roll back procedures, this is often a pragmatic first step to fix whatever has just been found to be broken. In this case, as in many, it was an effective way to resolve the immediate impact and return things to normal.
Identifying the root cause took more effort. The code mentioned above that had been modified earlier this year is quite old, and part of a legacy system that the Addressing team has been working on moving away from since the team’s inception. Much of the engineering effort during that time has been on building the modern replacement, rather than line-level dives into the legacy code.
We have since fixed the specific bug that triggered this incident. However, to address the more general problem of relying on old code that is not as well understood as the code in modern systems, we will do more. Sometimes software has bugs, and sometimes software is old, and these are not useful excuses; they are just the way things are. It’s our job to maintain the agility and confidence in our release processes while living in this reality, maintaining the level of safety and stability that our customers and their customers rely on.
What are we doing to prevent this from happening again?
We take incidents like this seriously, and we recognise the impact that this incident had. Though this specific bug has been resolved, we have identified several steps we can take to mitigate the risk of a similar problem occurring in the future. We are implementing the following plan as a result of this incident:
Test: The Addressing Team is adding tests that check for the existence of outstanding assignments of websites to IP addresses as part of future renumbering exercises. These tests will verify that there are no remaining websites that inadvertently depend on the old addresses being in service. The changes that prompted this incident made incorrect assumptions that all websites had been renumbered. In the future, we will avoid making assumptions like those, and instead do explicit checks to make sure.
Process: The Addressing team is improving the processes associated with the withdrawal of Cloudflare-owned prefixes, regardless of whether the withdrawal is associated with a renumbering event, to include automated and manual verification of traffic levels associated with the addresses that are intended to be withdrawn. Where traffic is attached to a service that provides more detailed logging, service-specific request logs will be checked for signs that the addresses thought to be unused are not associated with active traffic.
Implementation: The Addressing Team is reviewing every use of stored procedures and functions associated with legacy systems. Where there is doubt, functionality will be re-implemented with present-day standards of documentation and test coverage.
We are sorry for the disruption this incident caused for our customers. We are actively making these improvements to ensure improved stability moving forward and to prevent this problem from happening again.
Cloudflare Radar is constantly monitoring the Internet for widespread disruptions. In mid-July, we published our Q2 2024 Internet Disruption Summary, and here we examine recent several noteworthy disruptions detected in the first month of Q3, including traffic anomalies observed in Bangladesh, Syria, Pakistan, and Venezuela.
Bangladesh
Violent student protests in Bangladesh against quotas in government jobs and rising unemployment rates led the government to order the nationwide shutdown of mobile Internet connectivity on July 18, reportedly to “ensure the security of citizens.” This government-directed shutdown ultimately became a near-complete Internet outage for the country, as broadband networks were taken offline as well. At a country level, Internet traffic in Bangladesh dropped to near zero just before 21:00 local time (15:00 UTC). Announced IP address space from the country dropped to near zero at that time as well, meaning that nearly every network in the country was disconnected from the Internet.
However, ahead of this nationwide shutdown, we observed outages across several Bangladeshi network providers, perhaps foreshadowing what was to come. At AS24389 (Grameenphone), a complete Internet outage started at 01:30 local time on July 18 (19:30 UTC on July 17), with a total loss of both Internet traffic and announced IP address space.
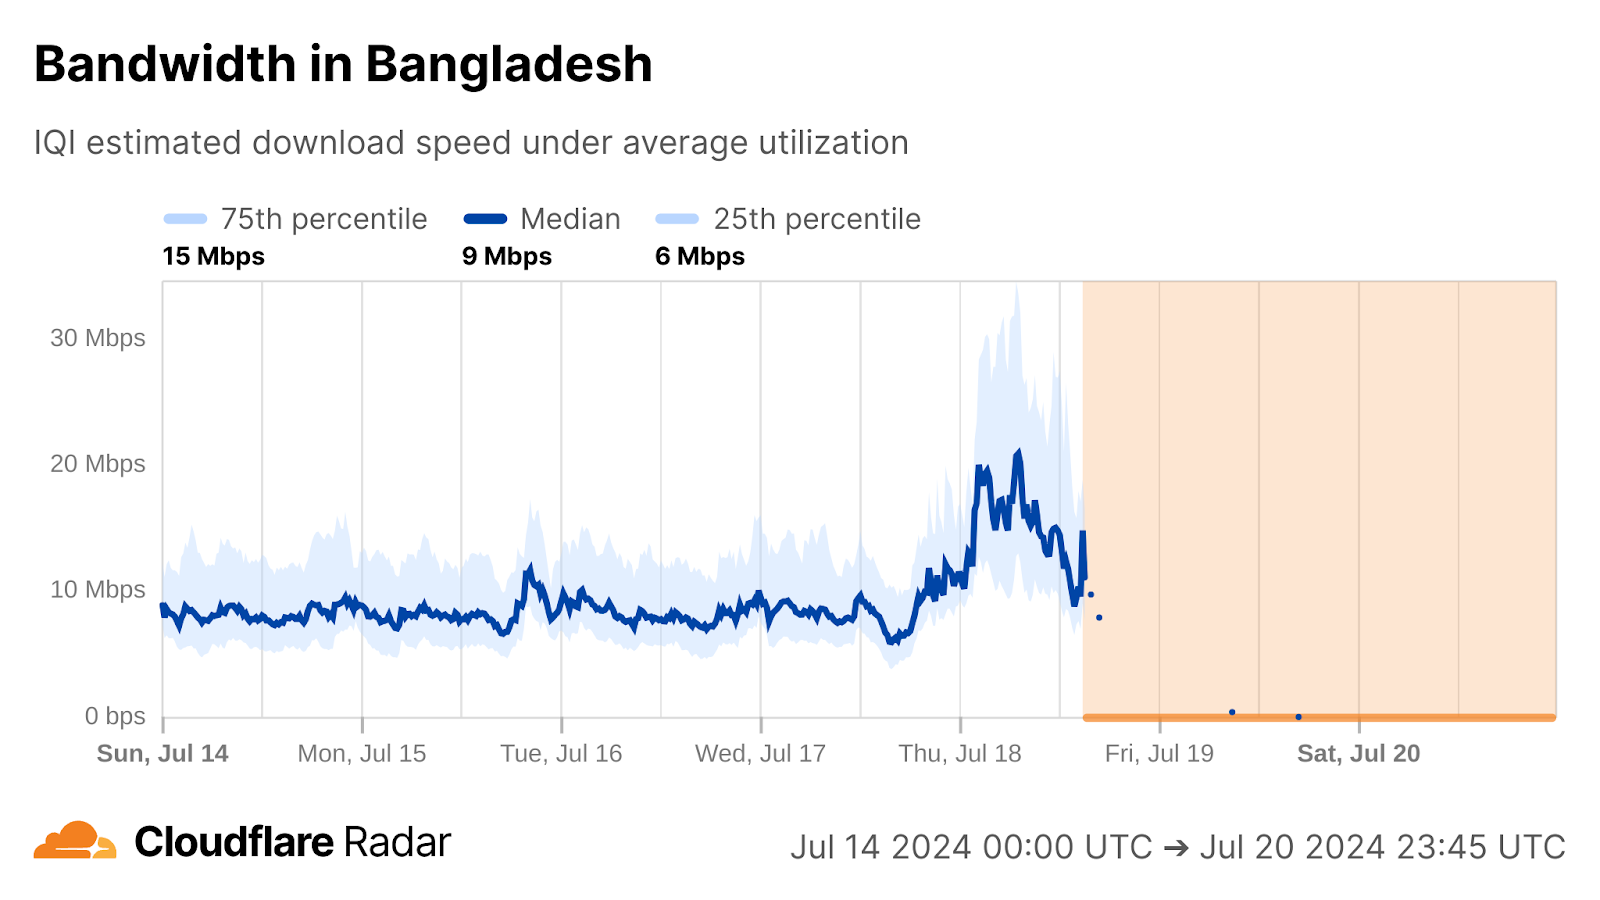
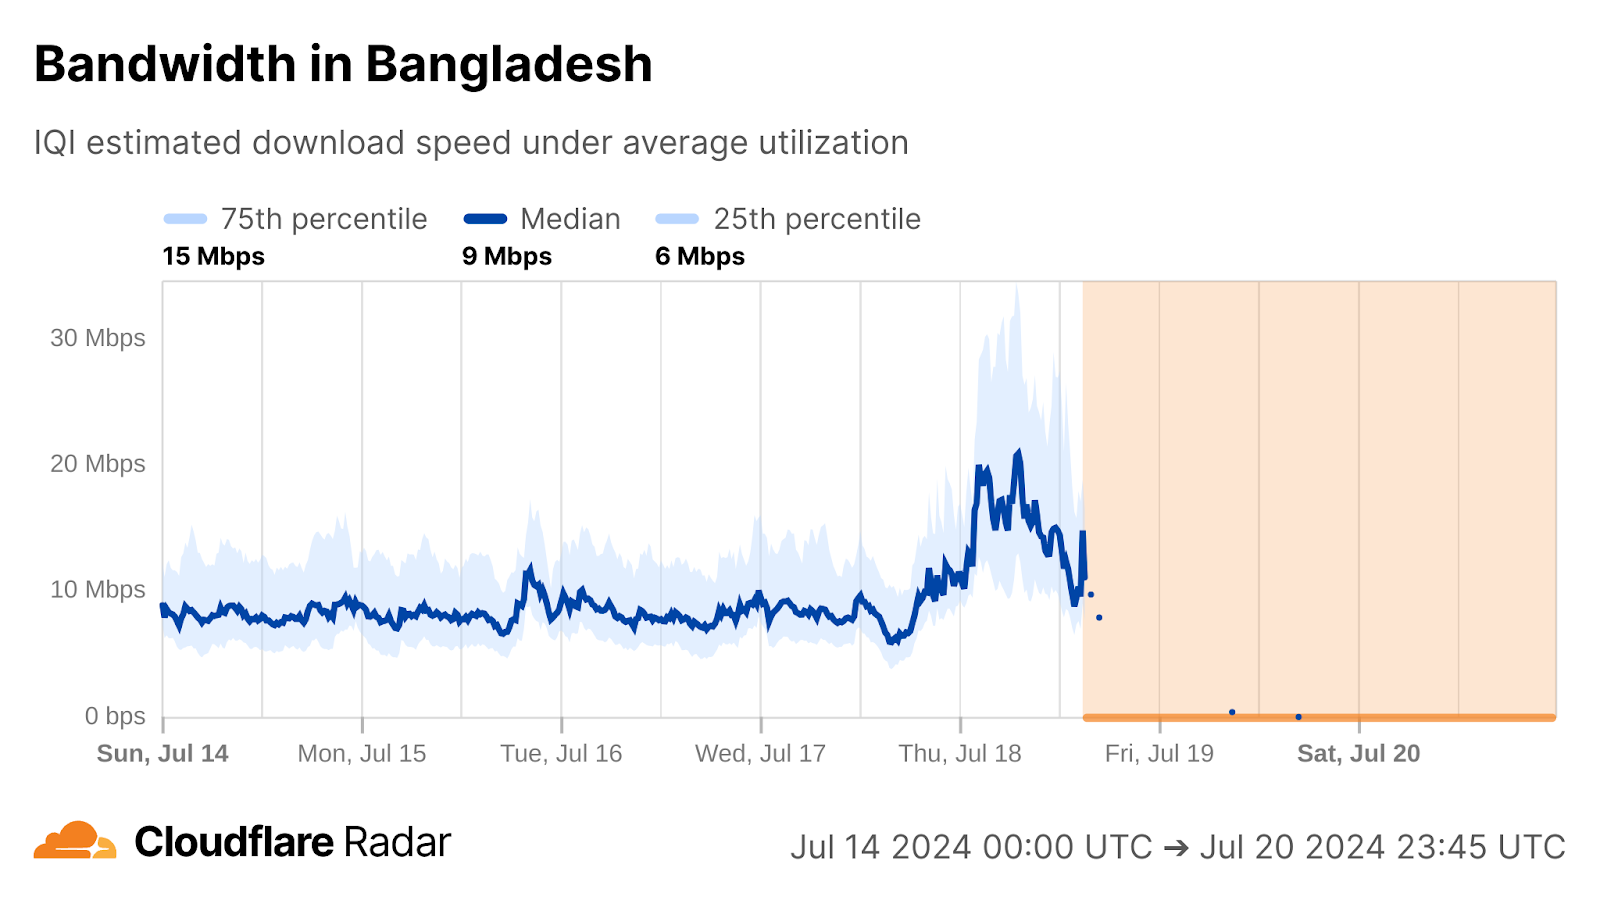
In the days before the shutdown, both median bandwidth and latency at a country level for Bangladesh were fairly stable. However, Cloudflare Radar’s Internet Quality measurements at a country level show a clear increase in median bandwidth and a concurrent drop in median latency, both likely due to the loss of measurements from mobile network providers as they disconnected from the Internet.
Five days after the full Internet shutdown started, broadband Internet services providers in Bangladesh began to restore connectivity on July 23. The initial restoration was characterized as a “trial run”, prioritizing banking, commercial sectors, technology firms, exporters, outsourcing providers and media outlets, according to the state minister for post, telecommunication and information technology. Announced IP address space began to increase around 19:00 local time (13:00 UTC), with traffic volumes beginning to trend upwards at that same time, as selected networks reconnected to the Internet.
Unfortunately, Syria is no stranger to Internet shutdowns, as they occur yearly during nationwide exams, implemented with the intent of preventing cheating on those exams. Our recent blog post titled Exam-ining recent Internet shutdowns in Syria, Iraq, and Algeria examined the first round of 2024 exams, which took place between May 26 and June 13.
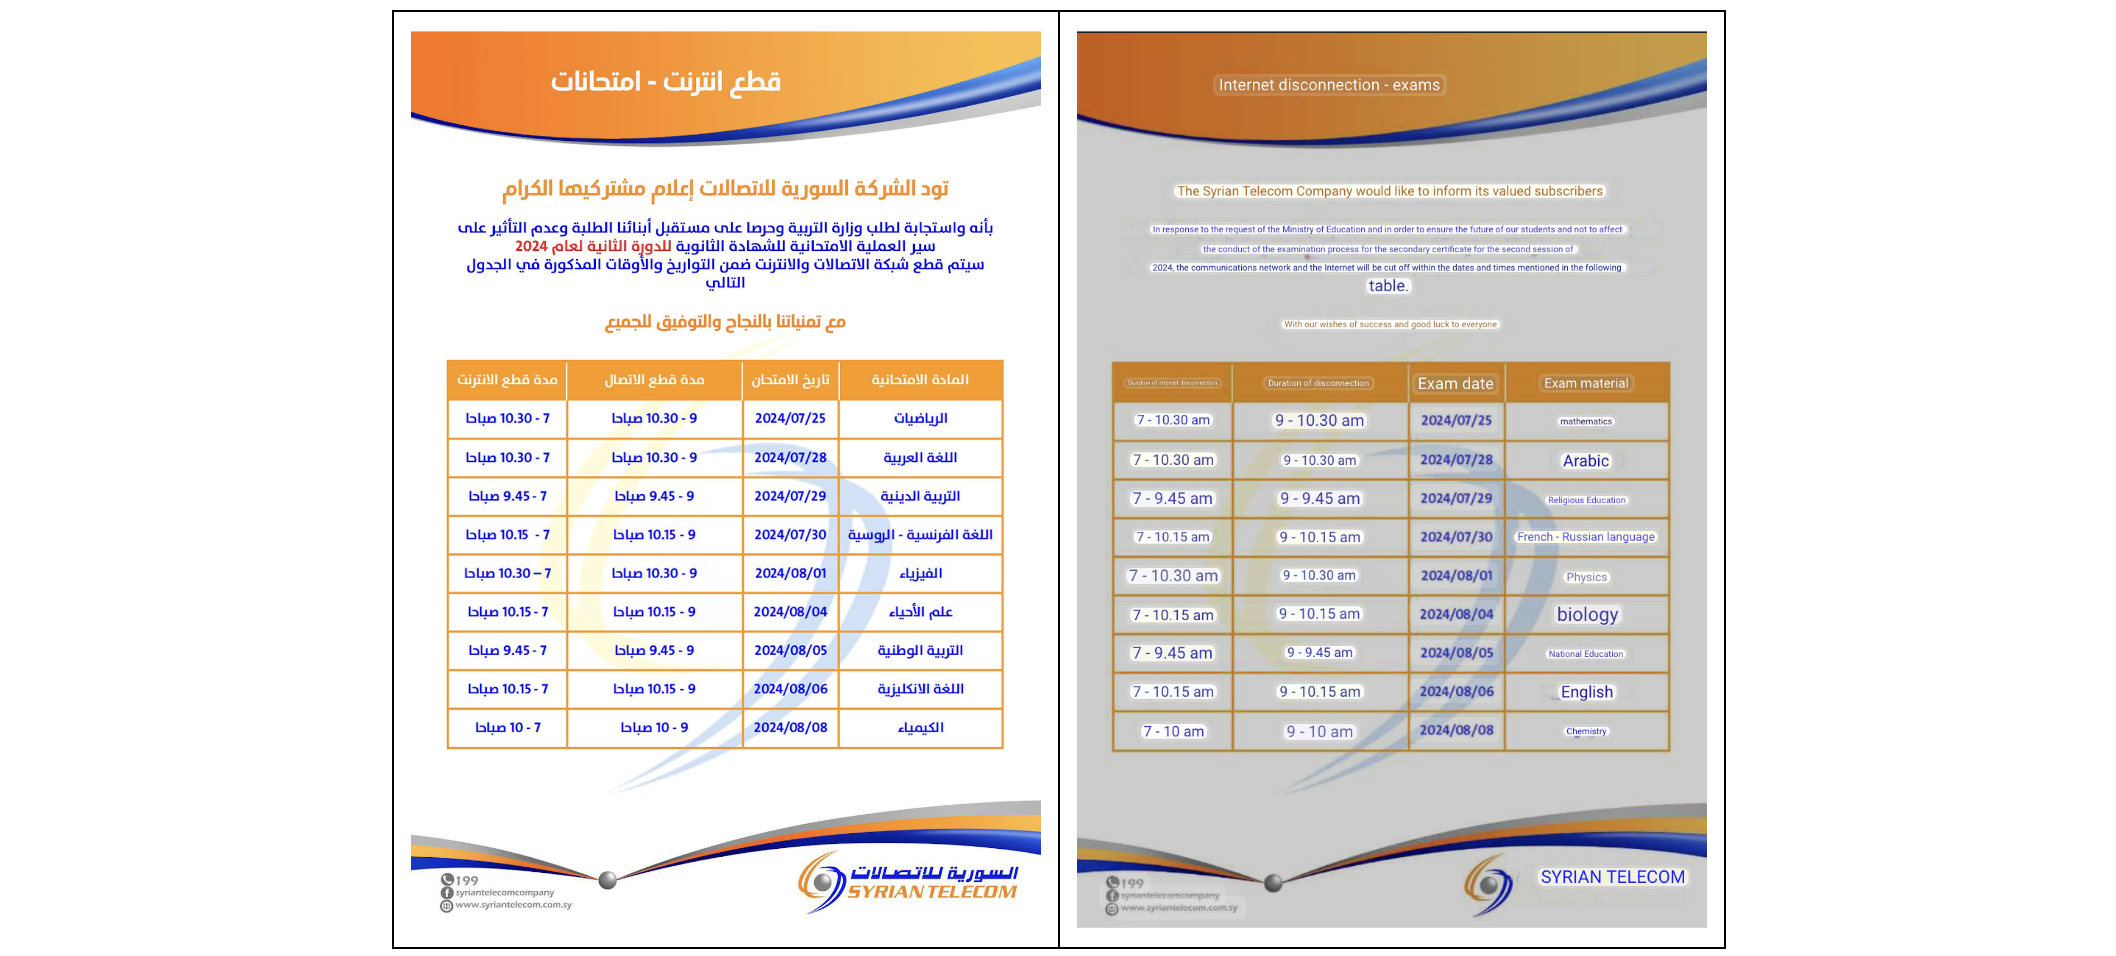
A second round of exams, and with them, multi-hour Internet shutdowns, began on July 25, and seen in the schedules below, published by Syrian Telecom on its Facebook page (English translation via Google Lens).
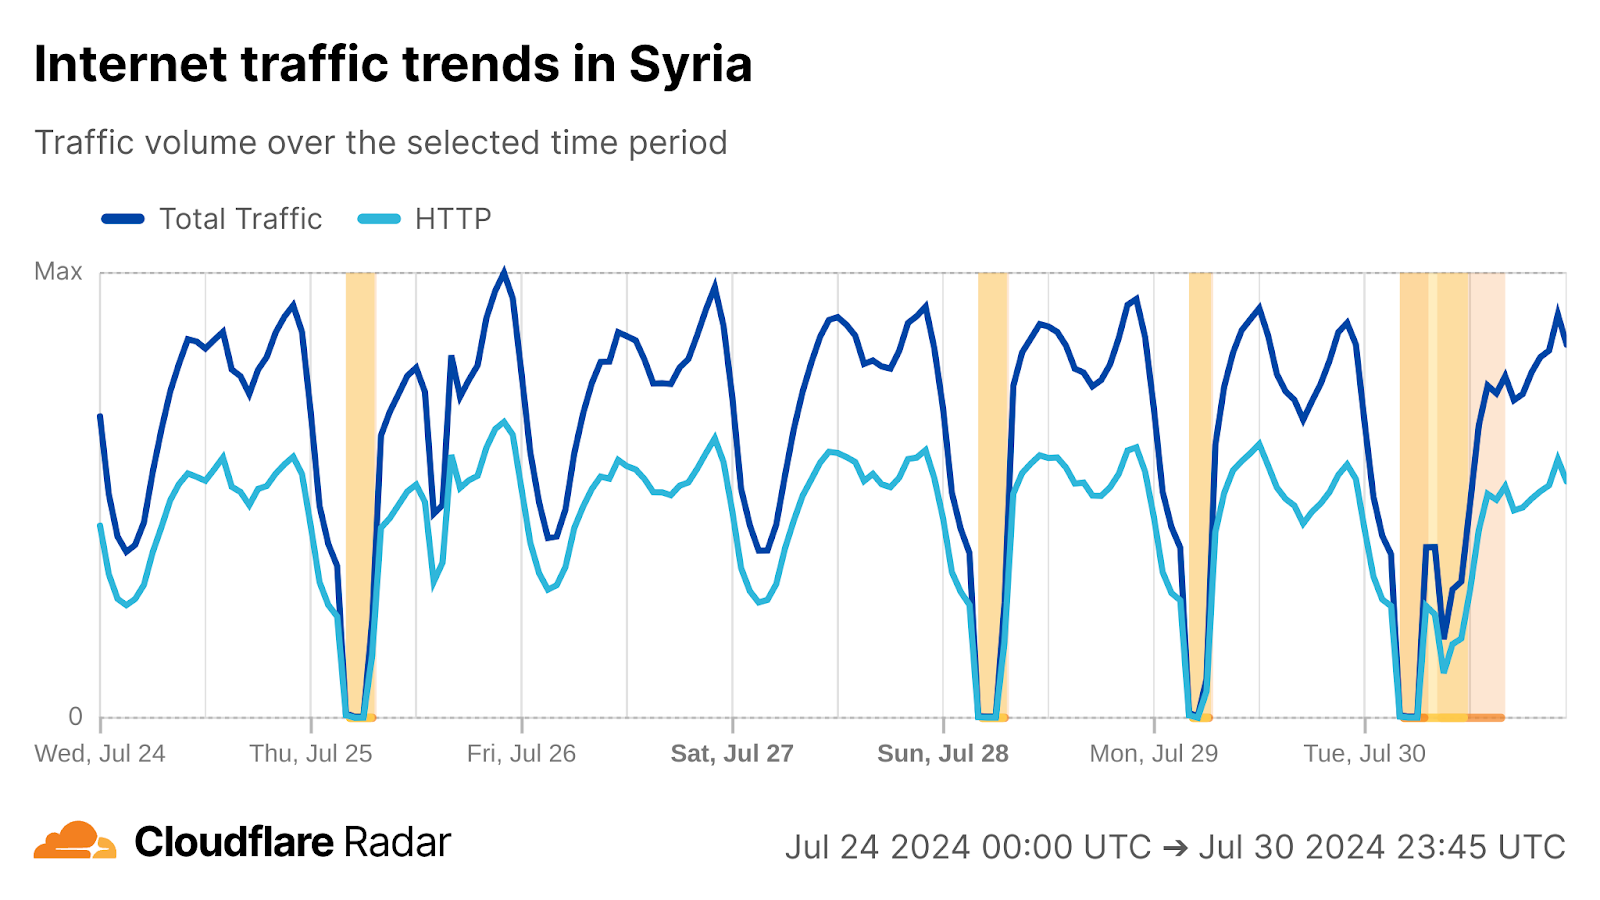
The Internet shutdowns implemented for the first four days of tests are clearly visible in the graph below, occurring on July 25, 28, 29, and 30.
However, you will also note another disruption is visible in both Syria’s Internet traffic and announced IP address space shortly after the planned shutdown on July 30. According to a (translated) Facebook post from Syrian Telecom, “while performing regular maintenance on one of the air conditioners located in one of the technical halls [data centers], an explosion occurred, causing the Internet circuits to temporarily go out of service.” This issue resulted in a disruption lasting approximately eight hours, between 11:00 – 19:00 local time (08:00 – 16:00 UTC) seen in both traffic and announced IP address space graphs for AS29256 (Syrian Telecom).
Pakistan
Closing out the month, on July 31, Pakistan experienced a wide-scale Internet disruption that lasted approximately two hours, between 13:30 – 15:30 local time (08:30 – 10:30 UTC). Traffic only dropped ~45% at a country level, but AS17557 (PTCL) experienced a near complete loss of traffic, while traffic at AS24499 (Telenor Pakistan) dropped nearly 90%. Together, the two network providers serve an estimated nine million users, and are among the top five Internet service providers in the country.
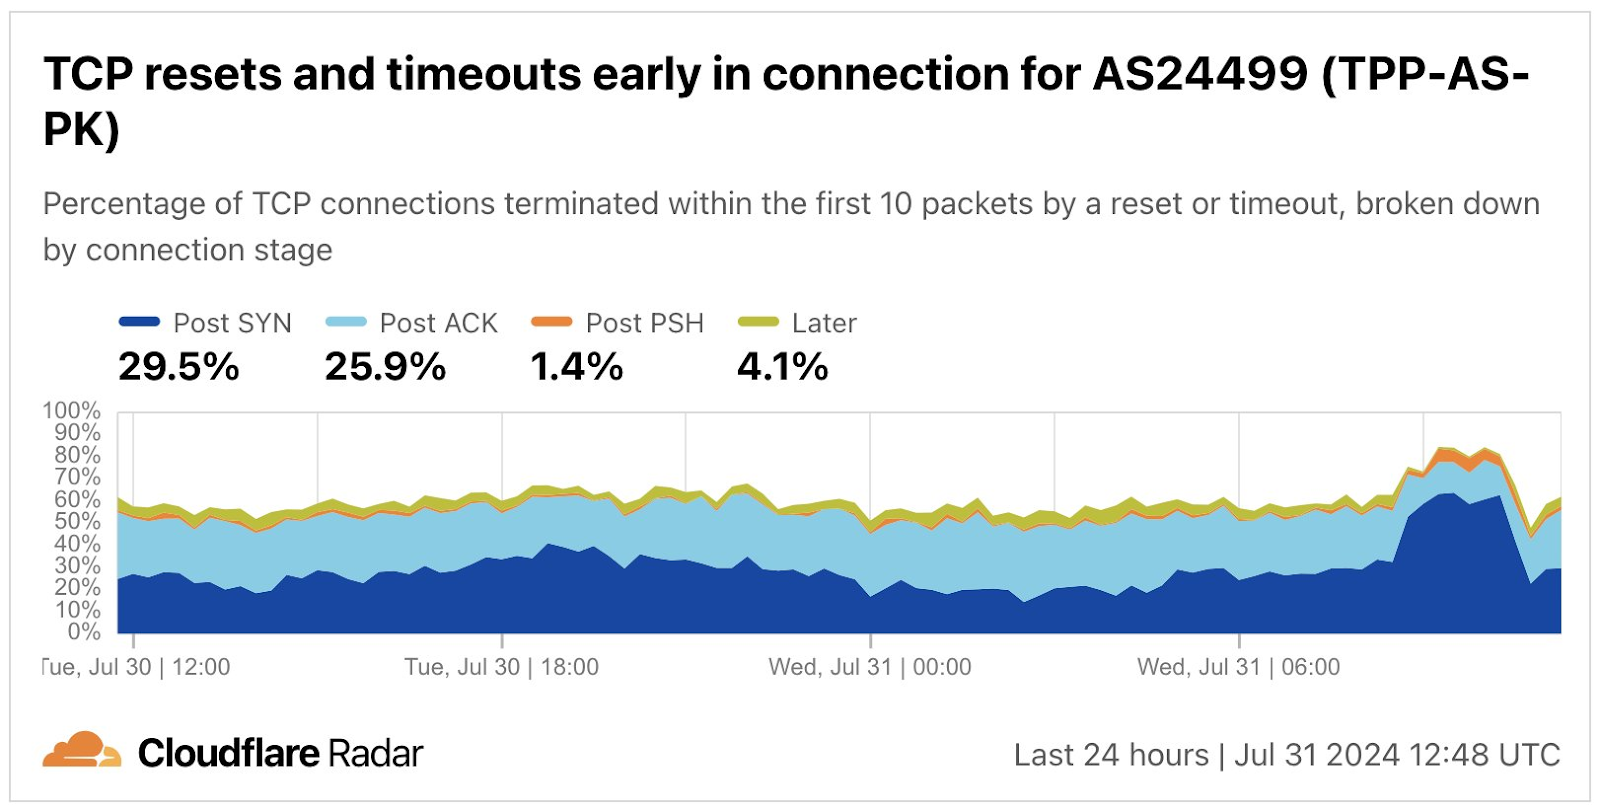
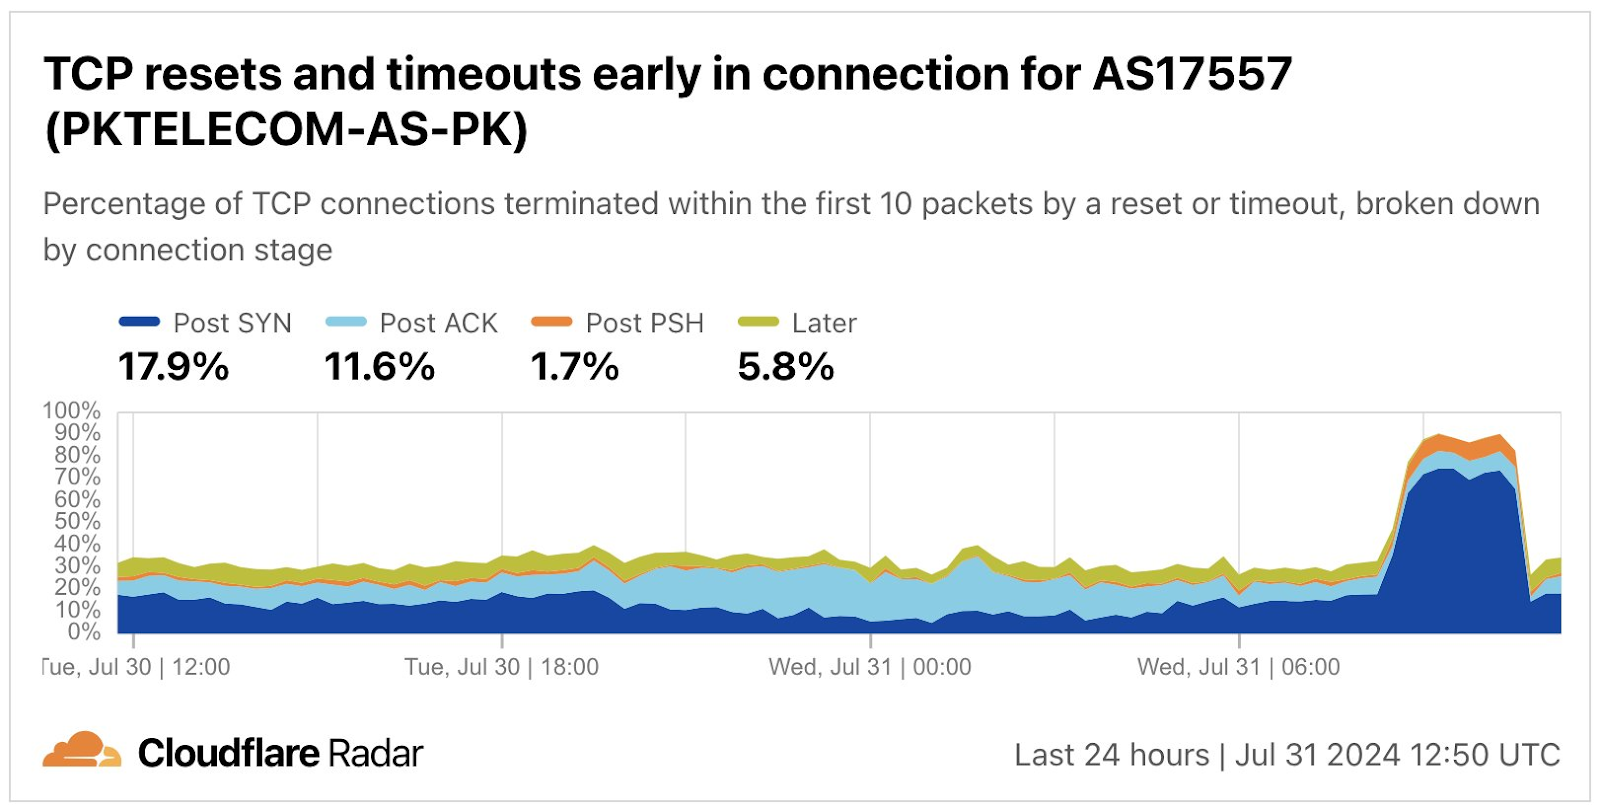
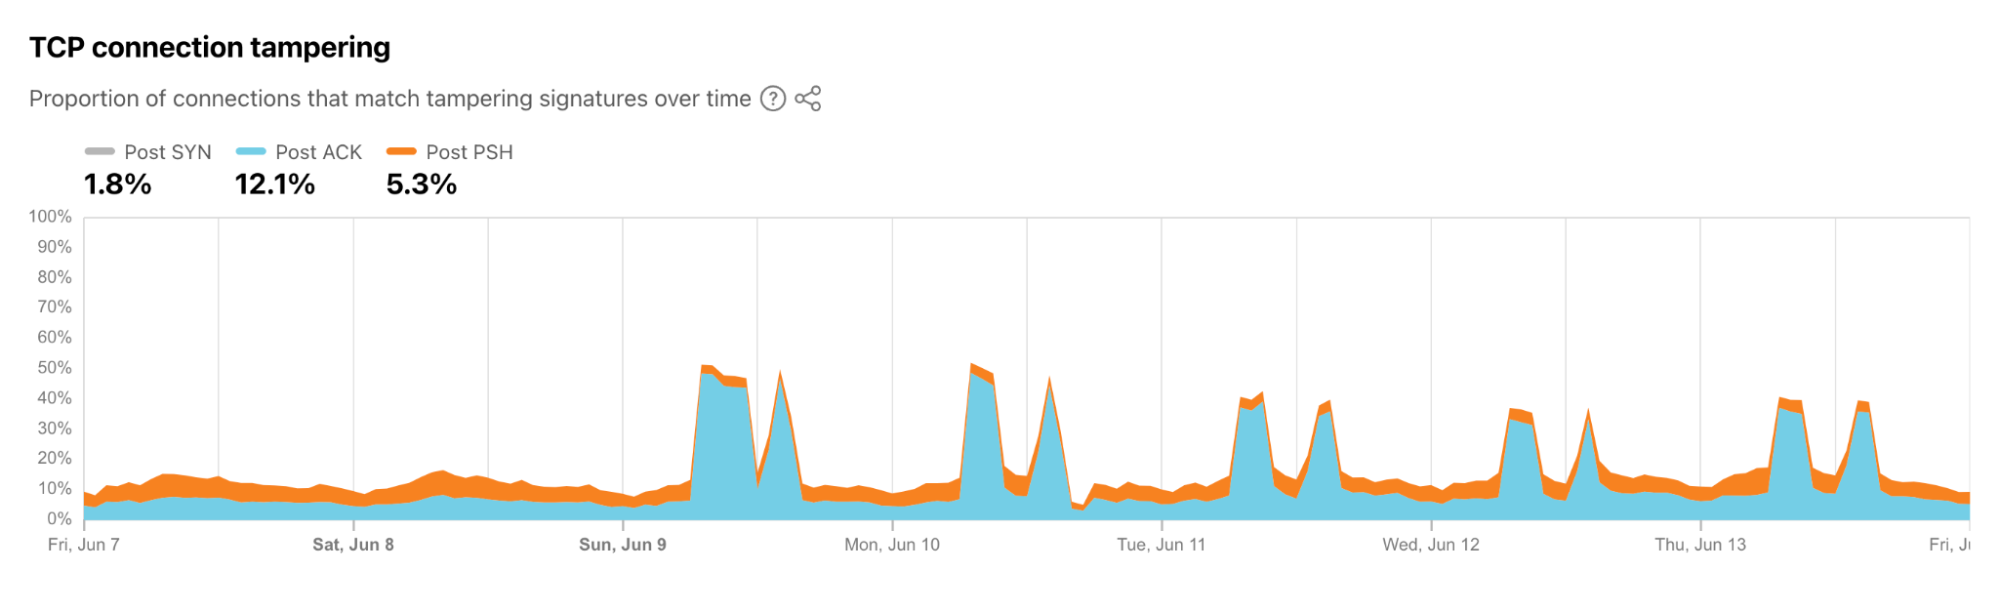
It was reported that the Pakistan Telecommunication Authority (PTA) attributed the disruptions to a technical glitch in the international submarine cable affecting the Pakistan Telecommunication Company Limited (PTCL) network. However, another published report noted “According to our sources, the government’s latest firewall edition to block the content was misconfigured, resulting in Internet connectivity disruption.” (Some additional information about the firewall can be found in this article.) The graphs below are from forthcoming TCP reset/timeout data on Cloudflare Radar, and show increased numbers of connections terminating immediately after the initial synchronization (SYN) packet used to establish new TCP connections (“Post SYN”) between 13:30 – 15:30 local time (08:30 – 10:30 UTC) on PTCL and Telenor Pakistan, coincident with the observed disruption. In other words, the rate of SYN packets arriving at Cloudflare was mostly consistent during the disruption, but there was a drop in other TCP packets, suggesting that the firewall explanation may be plausible.
A Facebook post from the Pakistan Telecommunication Authority (PTA) simply highlighted that the issue had been resolved, and that “The exact issue is being investigated by PTA to avoid such instances in future.”
Regardless of the actual cause, the disruption had a clear impact on the country’s financial markets, with a published report stating “The KSE-100 index suffered a sharp decline on Wednesday, plummeting over 740 points in the final hour of trading amid a nationwide internet outage. Analysts attributed the sudden drop to panic selling as investors struggled with limited market data.”
Venezuela
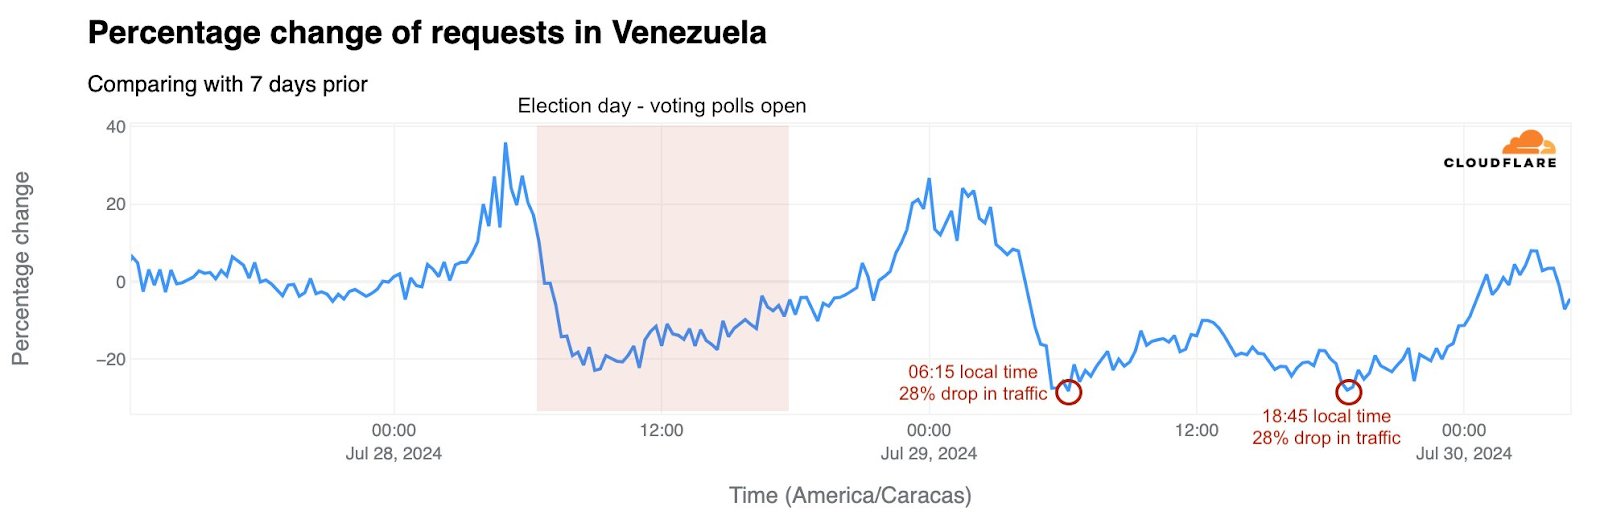
In the past, some countries have implemented government-directed Internet shutdowns as a means of limiting communication about or organizing of protests and demonstrations associated with contested elections. Although such protests and demonstrations sprang up in the wake of a contested presidential election in Venezuela that took place on July 28, Internet shutdowns did not follow. However, in monitoring Internet traffic in Venezuela during the days around the election, the Cloudflare Radar team did observe several notable drops in traffic, as compared to the same times the week prior.
After surging 35% at 05:00 local time (09:00 UTC) on Sunday, July 28 (election day), traffic dropped after the polls opened, down by as much as 23% at 09:00 local time (13:00 UTC). On July 29, the day following the election, traffic was as much as 28% lower than the same time the previous week at 06:15 local time (10:15 UTC) and 18:45 local time (22:45 UTC).
And while the observed drops in traffic appeared to be organic, and not caused by an Internet shutdown, it is worth noting that multiple websites are being blocked in Venezuela. An Internet Society Pulse blog post, published two days ahead of the election, reports that “Around 60 websites are currently blocked in Venezuela, including eight media sites and three that fact-check news and misinformation.”, citing data from the Open Observatory of Network Interference (OONI).
Cloudflare’s network spans more than 320 cities in over 120 countries, where we interconnect with over 13,000 network providers in order to provide a broad range of services to millions of customers. The breadth of both our network and our customer base provides us with a unique perspective on Internet resilience, enabling us to observe the impact of Internet disruptions. Thanks to Cloudflare Radar functionality released earlier this year, we can explore the impact from a routing perspective, as well as a traffic perspective, at both a network and location level.
As we have seen in previous years, nationwide exams take place across several MENA countries in the second quarter, and with them come government directed Internet shutdowns. Cable cuts, both terrestrial and submarine, caused Internet outages across a number of countries, with the ACE submarine cable being a particular source of problems. Maintenance, power outages, and technical problems also disrupted Internet connectivity, as did unknown issues. And as we have frequently seen in the two-plus years since the conflict began, Internet connectivity in Ukraine suffers as a result of Russian attacks.
As we have noted in the past, this post is intended as a summary overview of observed disruptions, and is not an exhaustive or complete list of issues that have occurred during the quarter.
Government directed
Syria, Algeria, Iraq
Each spring, governments in several countries in the Middle East and North Africa (MENA) region order local telecommunications providers to shut down or disrupt Internet connectivity across the country in an effort to prevent students from cheating on national secondary and high school exams. These shutdowns/disruptions generally occur for several hours per day over a multi-week period. We covered such events in 2023, 2022, and 2021, as they occurred in locations including Syria, Sudan, Algeria, and Iraq.
In June, we published Exam-ining recent Internet shutdowns in Syria, Iraq, and Algeria, which examined the daily Internet shutdowns that took place in Iraq and Syria, as well as the two multi-hour daily disruptions in Algeria, which appeared to be pursuing a content blocking strategy, rather than a full nationwide shutdown. The post examined the impact that these shutdowns have on Internet traffic, and also analyzed routing information and traffic from other Cloudflare services in an effort to better understand how these shutdowns are being implemented.
In addition to the shutdowns covered in the previously referenced blog post, Iraq implemented a second round of shutdowns that started on June 23, and ran through at least July 14. Some of these shutdowns impacted the same set of networks seen in the first round, and some impacted networks in the autonomous Kurdistan region in the north.
Both sets of shutdowns reviewed above appeared to have followed the same approach as the first round covered in the earlier blog post.
Kenya, Burundi, Uganda, Rwanda, Tanzania
Concerns over a potential Internet shutdown during planned protests against tax increases proposed in “Finance Bill 2024” by the Kenyan government led to the publication of a joint statement signed by multiple organizations. The statement strongly urged the Kenyan government to refrain from enforcing any
Internet shutdowns or information controls, and highlighted the “disastrous economic effects” such a move could have. In response, the Communications Authority of Kenya issued a press release stating that “For the avoidance of doubt, the Authority has no intention whatsoever to shut down Internet traffic or interfere with the quality of connectivity. Such actions would be a betrayal of the Constitution as a whole, the freedom of expression in particular and our own ethos.”
As protests escalated on June 25, Internet traffic in Kenya dropped at 16:30 local time (13:30 UTC). Initially, this outage was thought to be due to issues with one or more undersea cables that provide international connectivity to the country, with the potential cause supported by social media posts from Safaricom and Airtel.
Similar concurrent drops in Internet traffic were observed in Burundi, Uganda, Rwanda, and Tanzania, as shown below. Issues with submarine cables connected to one country can impact Internet connectivity in other countries if there is a dependency on that country/cable for upstream Internet connectivity. As such, the observed disruptions in those four countries were not that unusual. To that end, a (subsequently deleted) post on X from MTN Uganda noted: “Our esteemed customers, We are experiencing a degraded service on all our internet services due to an outage caused by our connectivity supply through Kenya. Our technical teams and partners are working jointly to resolve the issue in the shortest time possible. In the interim, we kindly advise our customers to use *165# to access Mobile Money and other app based services. Thank you.“
However, other participants in the Internet infrastructure community in Africa called the undersea cable outage explanation into question. Kyle Spencer, Executive Director of the Uganda Internet eXchange Point, posted on X that “I am told the Kenyan government ordered sea cable landing stations to disconnect circuits.” Ben Roberts, Group CTIO at Liquid Intelligent Technologies (a pan-African network infrastructure provider), posted “No cables are damaged this week.” In addition, outages on undersea cables are rarely, if ever, resolved in a matter of hours, as this disruption was – they frequently last for days or weeks.
On June 26, Safaricom’s CEO claimed “This outage was occasioned by reduced bandwidth on some cables that carry Internet traffic”, contradicting the company’s original claim. No additional information was forthcoming from Airtel or the Communications Authority of Kenya, but as noted above, some within the industry believe that the disruption that impacted connectivity in Kenya, Burundi, Uganda, Rwanda, and Tanzania was directed by the government of Kenya, and was not caused by submarine cable outages.
Cable cuts
Haiti
At 17:36 local time (21:36 UTC) on April 28, Digicel Haiti posted an “important note” on X that stated in part (translated) “On April 27, 2024, the company suffered several attacks on its international optical infrastructure in the Drouya area on National Road #1. The optical fiber was damaged by the impact of cartridges after the armed clashes in the area for a few days. It affected several services such as internet (data), SMS, MonCash and international calling. For now, we are happy to inform the population that all services are restored to 100%.” The graph below shows the impact of the fiber damage, with AS27653 (Digicel Haiti) suffering an Internet outage lasting nearly 24 hours, from around 17:30 local time (21:30 UTC) on April 27 through approximately 16:00 local time (20:00 UTC) on April 28, after which traffic quickly recovered.
Then on May 3, The Director General of Digicel Haiti posted on X that (translated) “Digicel is informing the general public that it suffered two more damages to its international fiber infrastructure at 2am this morning. We have restored Moncash services, SMS, and Fiber Optic connections. Our crews are already on their way to address the apparent landslide in the Canaan area.” The disruption caused by this fiber damage lasted for approximately eight hours, between 02:15 – 10:30 local time (06:15 – 14:30 UTC), and as seen in the graph below, appeared to have a nominal impact on traffic.
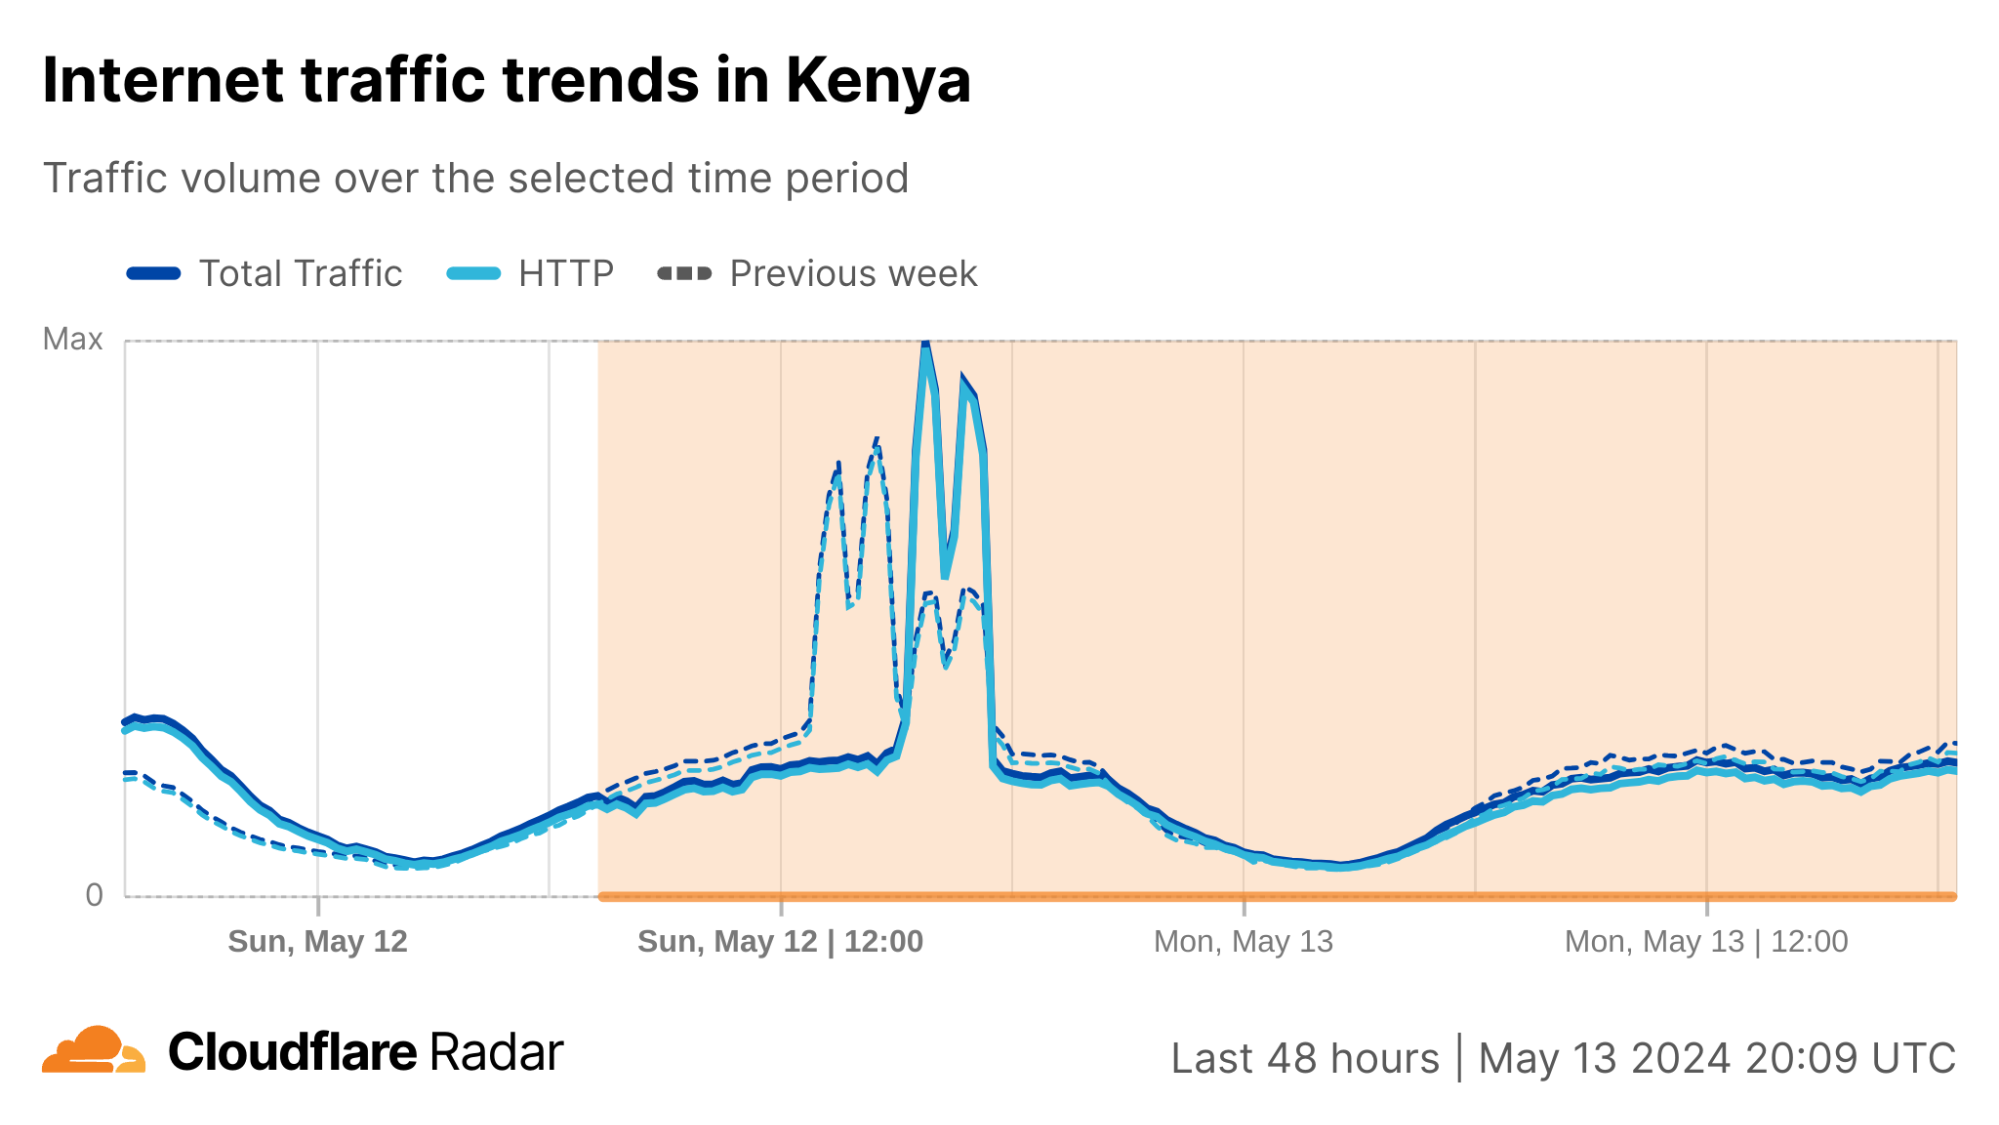
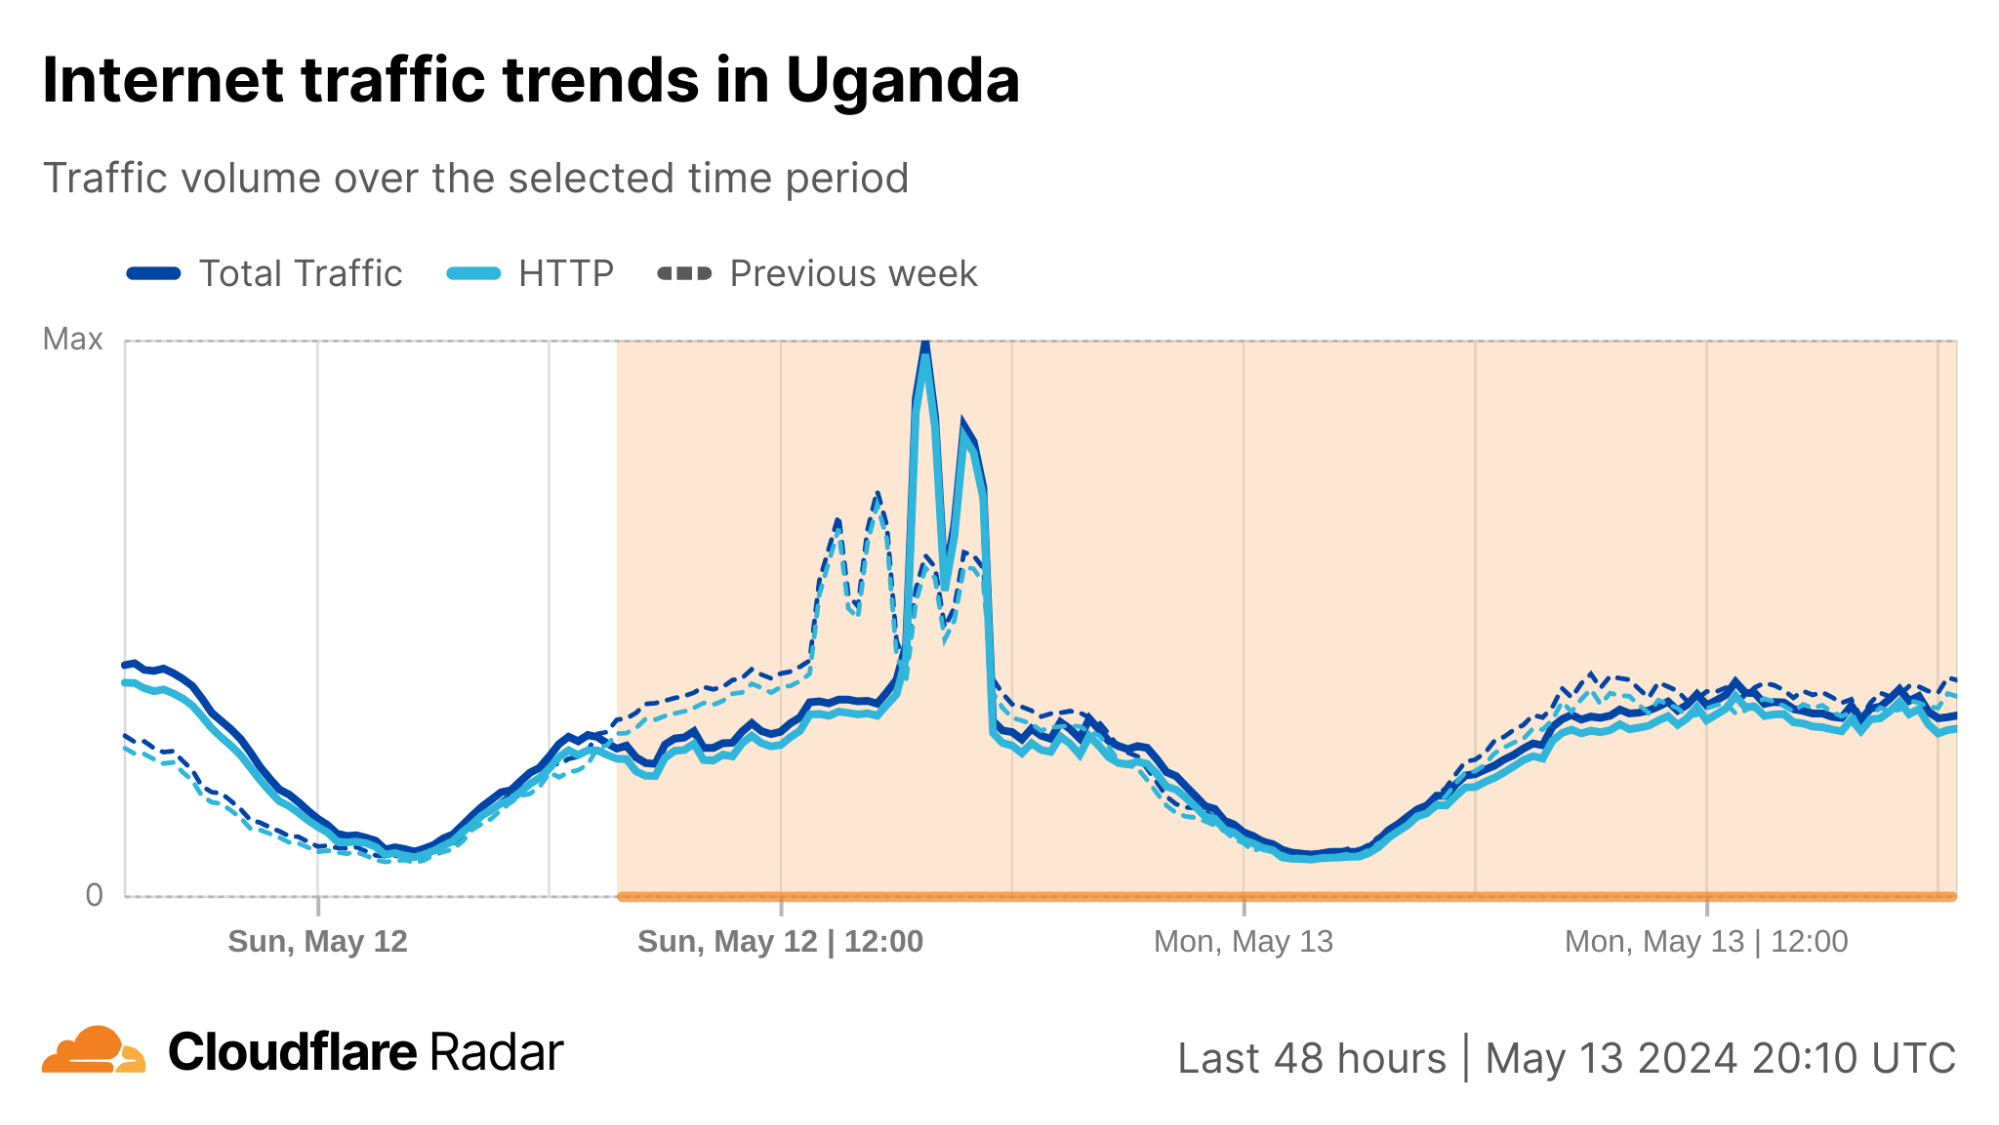
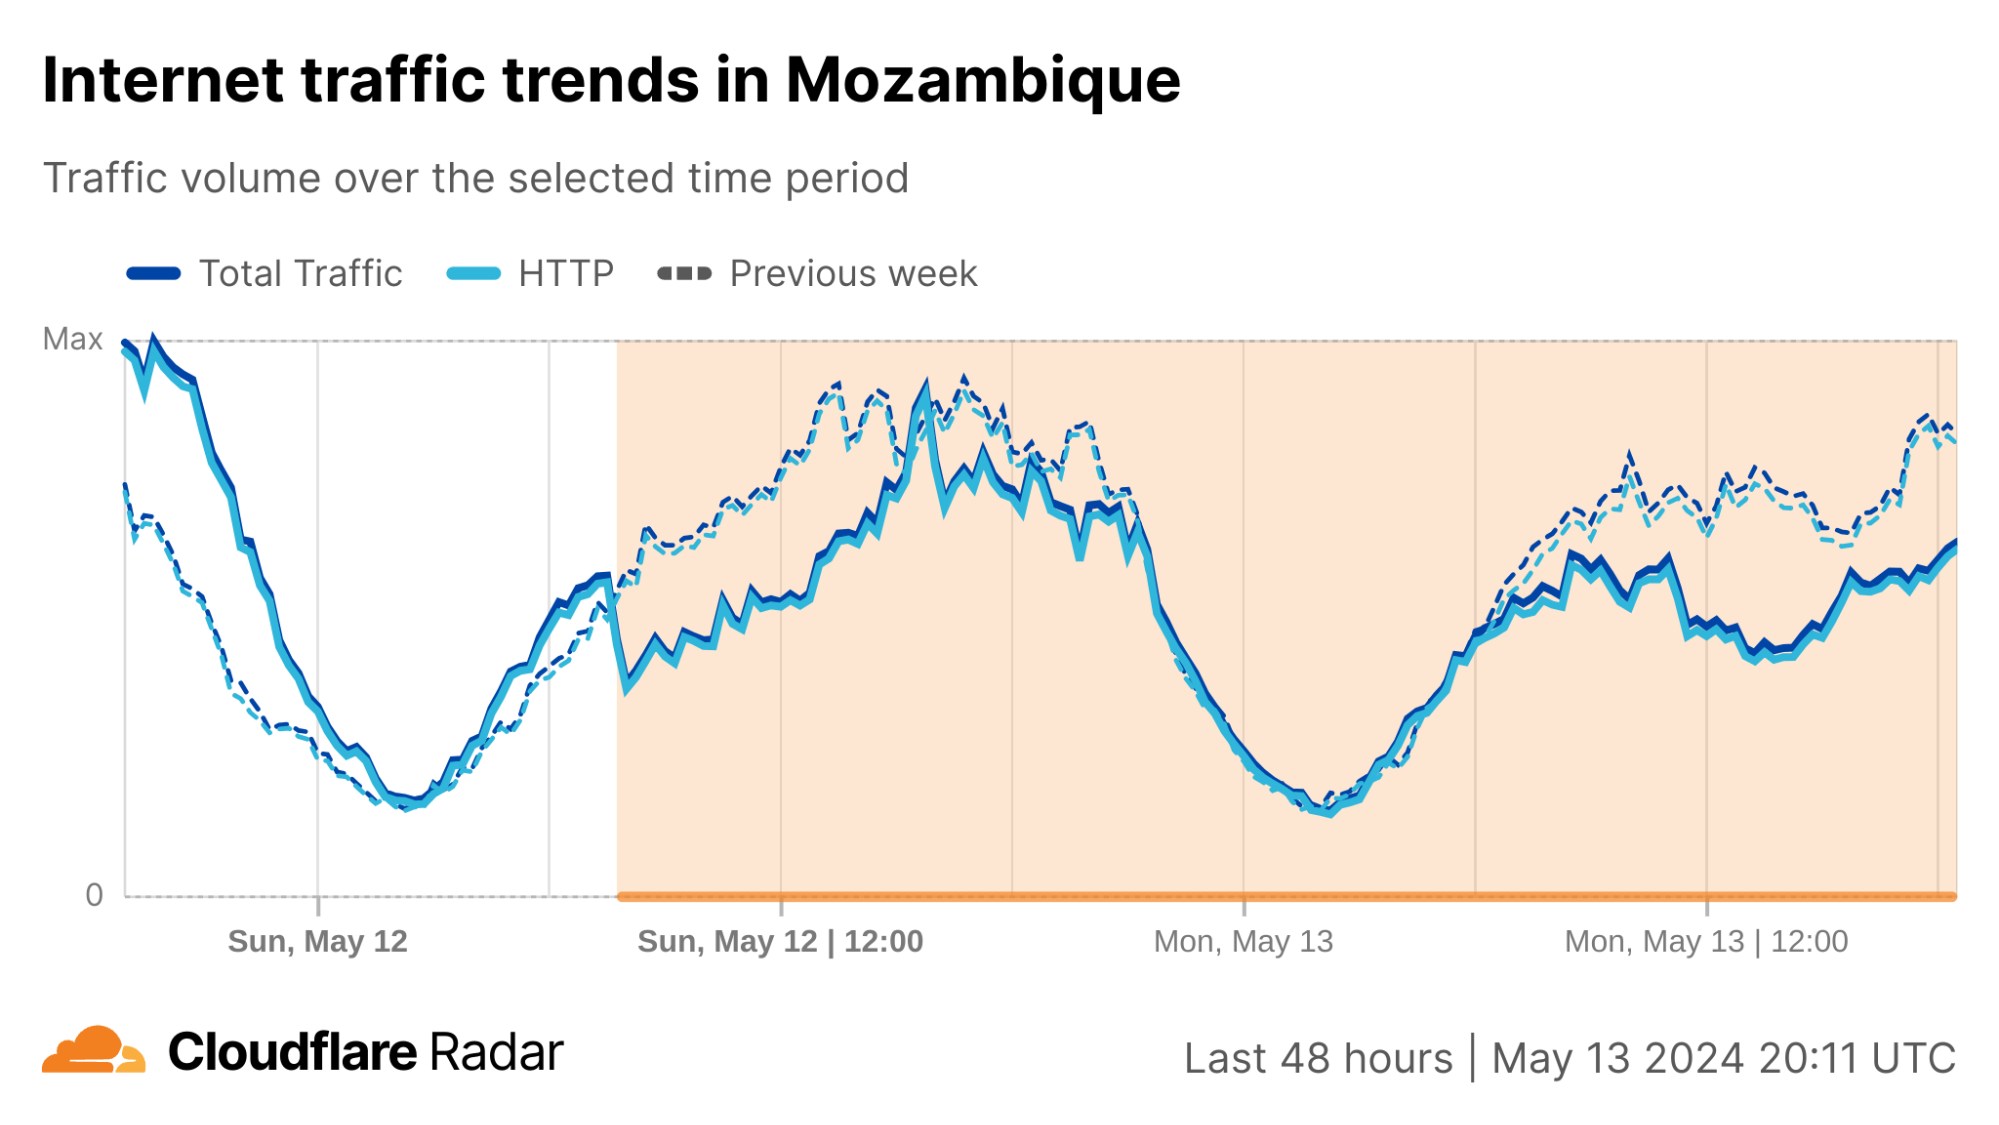
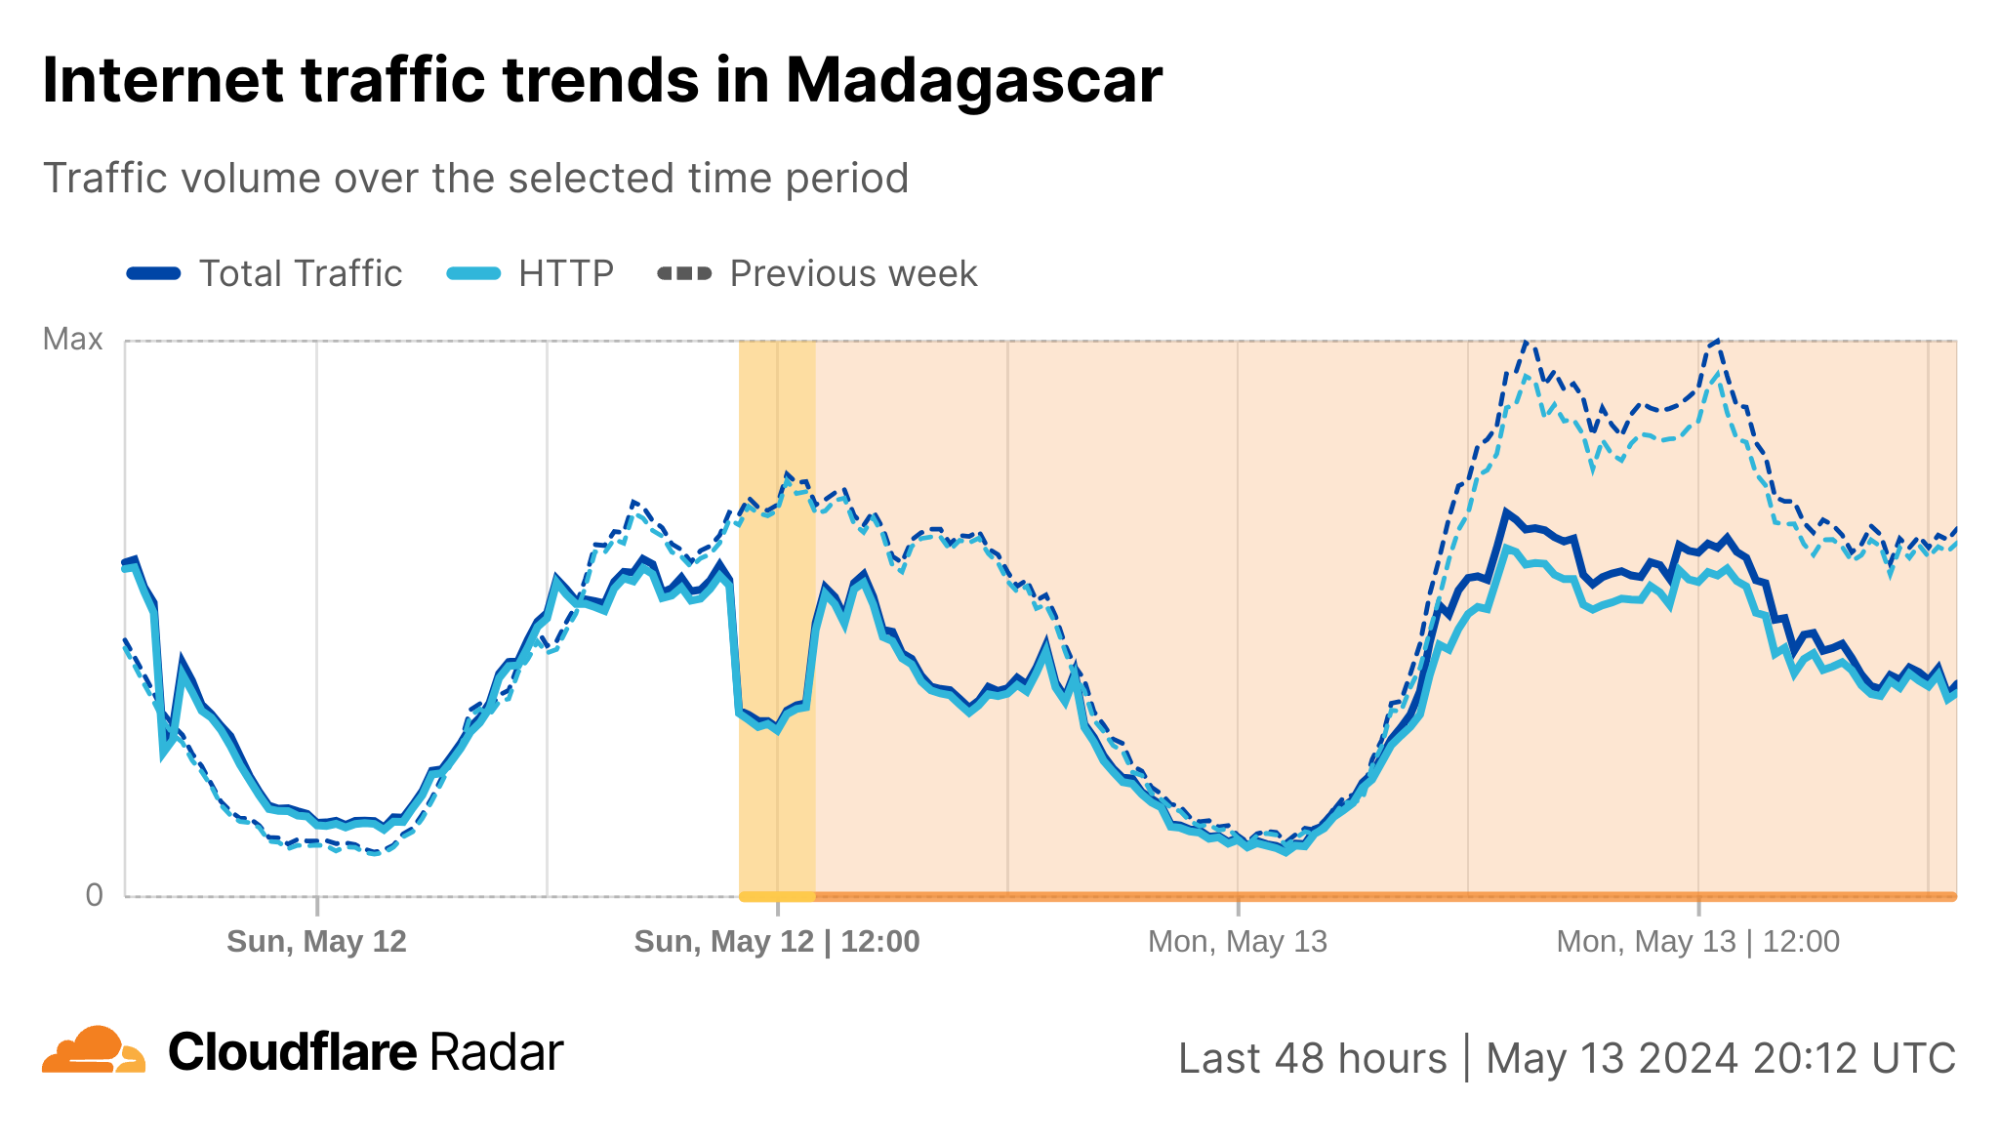
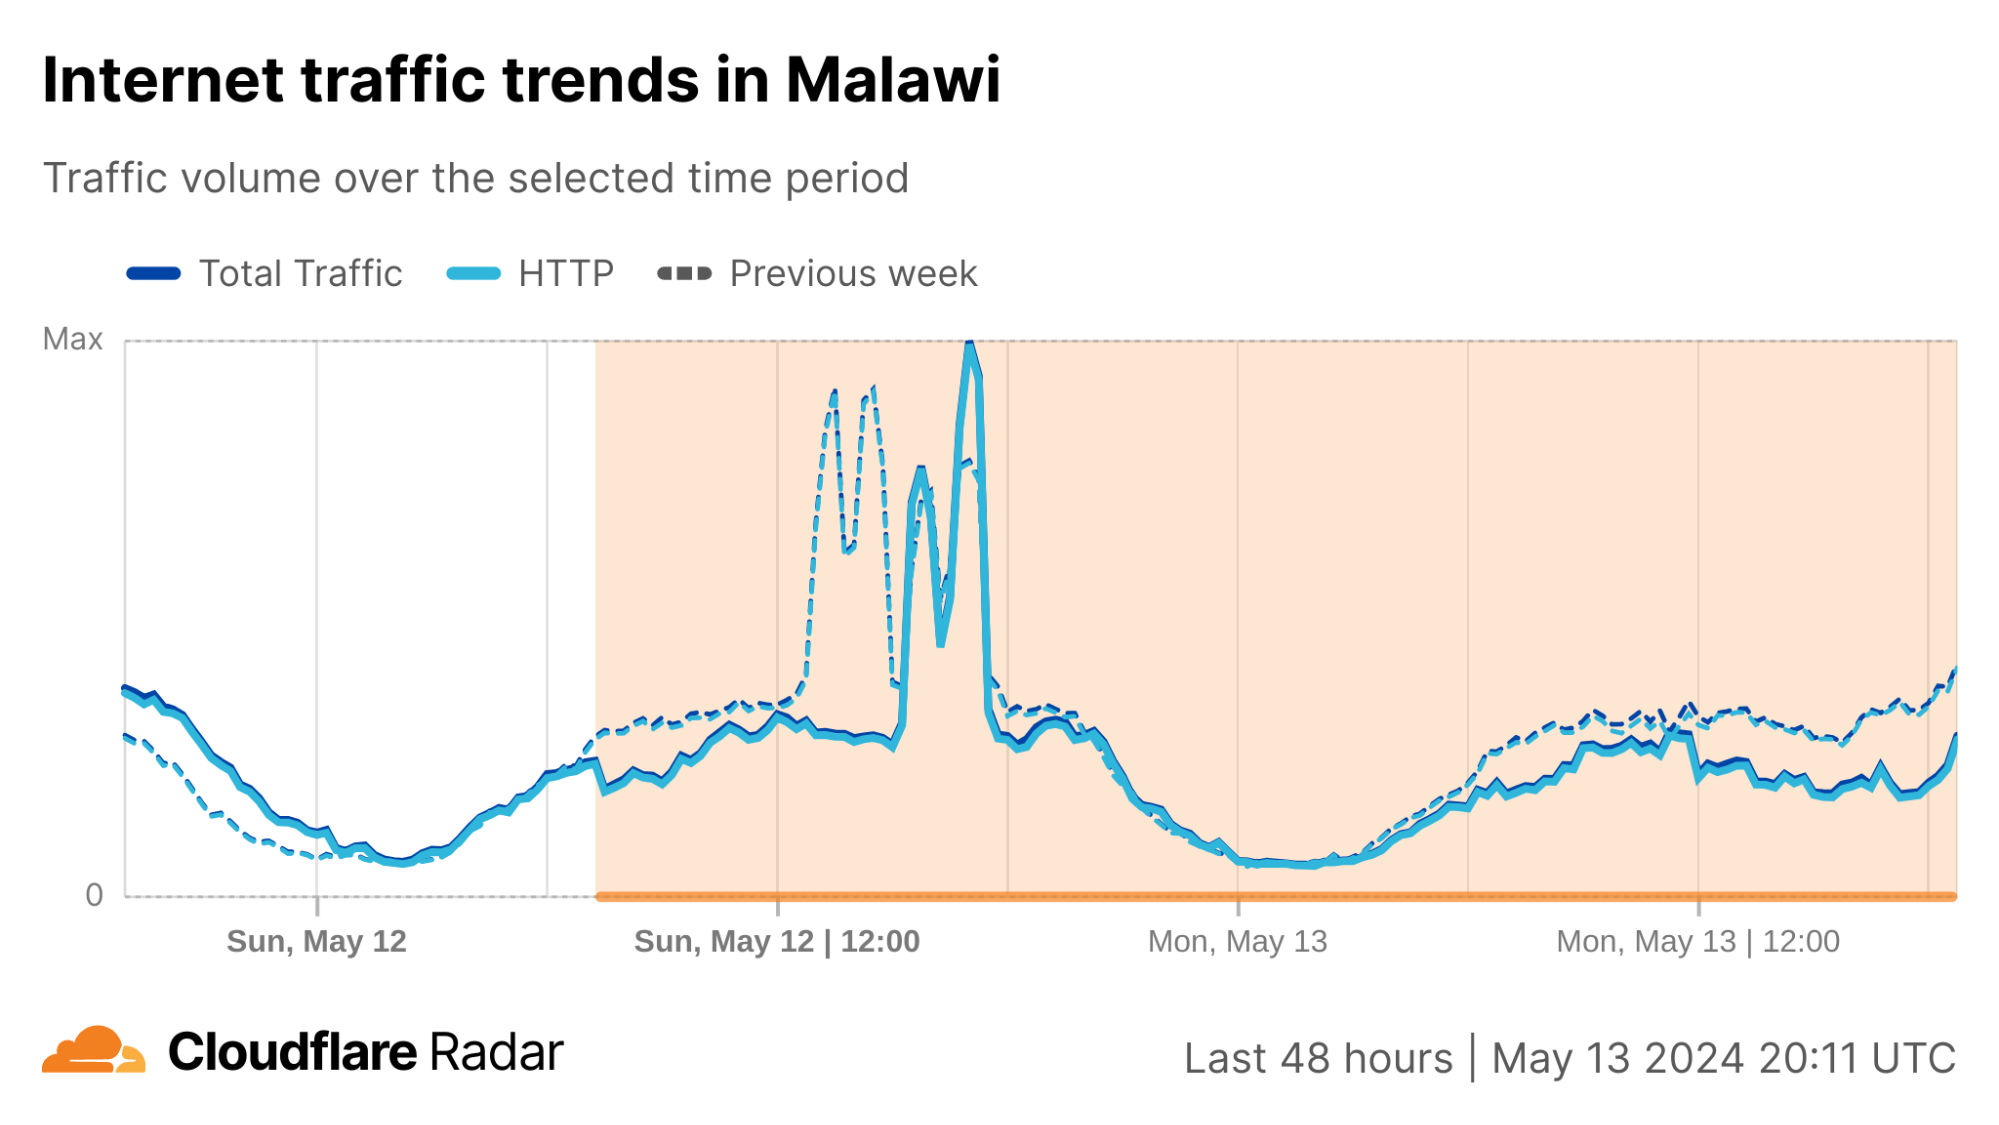
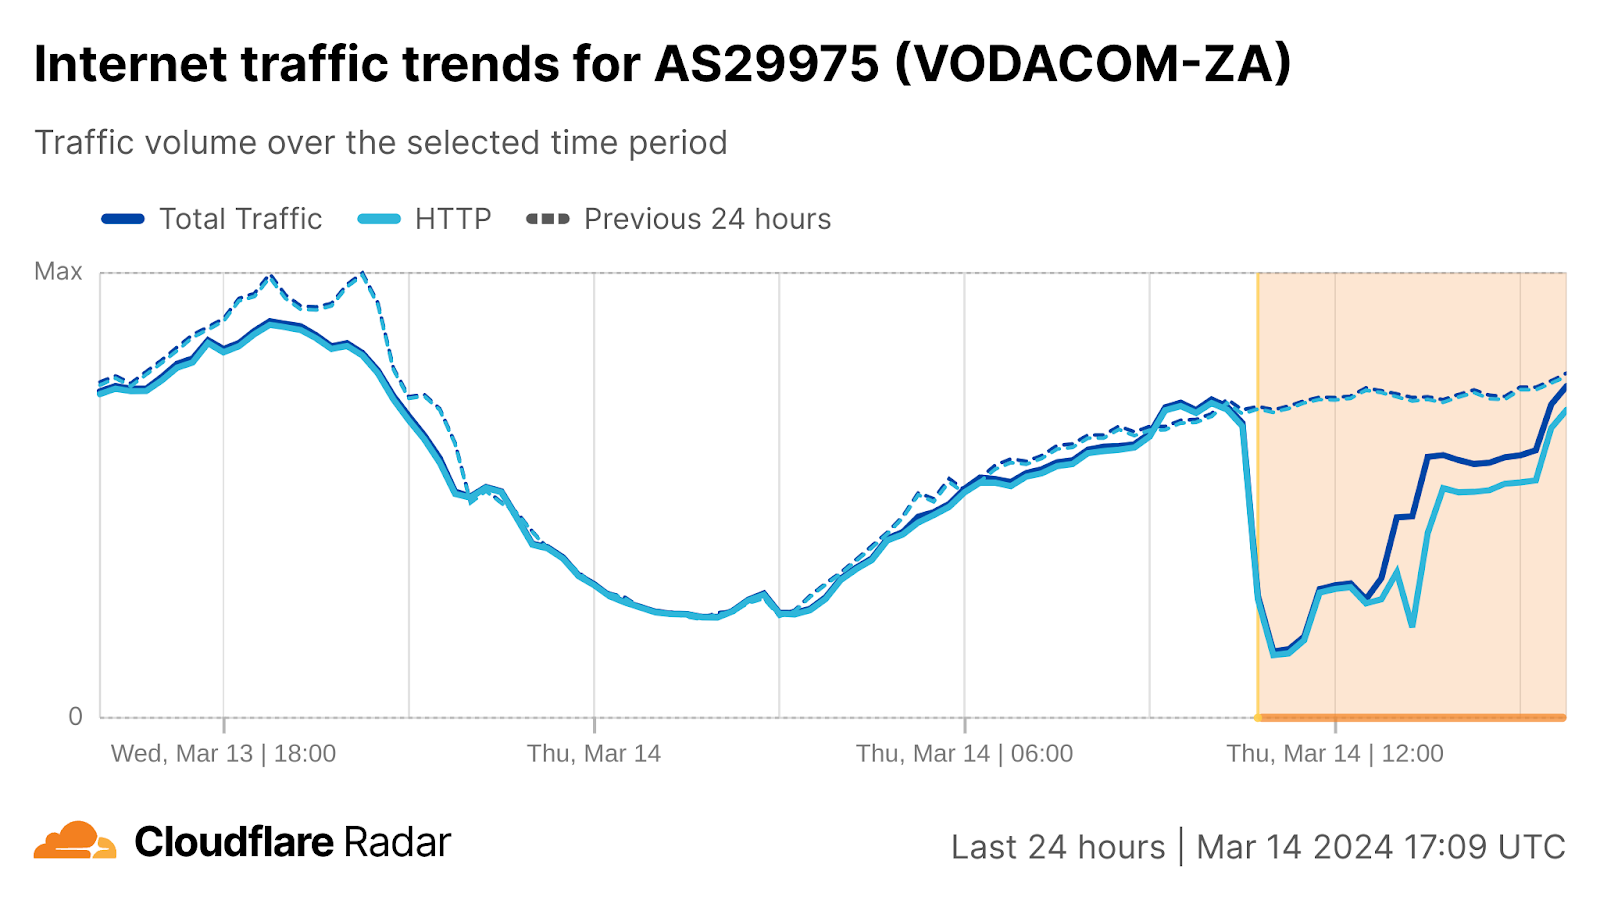
On Sunday, May 12, issues with the EASSy and Seacom submarine cables again disrupted connectivity to East Africa, impacting a number of countries previously affected by a set of cable cuts that occurred nearly three months earlier. Insight into these earlier cable cuts and the initial impact of May’s cable damage was covered in our East African Internet connectivity again impacted by submarine cable cuts blog post.
Traffic levels across a number of the impacted countries dropped just before 11:00 local time (08:00 UTC). The magnitude of the initial impact varied by country, with traffic initially dropping by 10-25% in Kenya, Uganda, Madagascar, and Mozambique, while traffic in Rwanda, Malawi, and Tanzania dropped by one-third or more than compared to the previous week. The overall impact was most significant in Tanzania, Madagascar, and Rwanda, as seen in the graphs below. Traffic returned to expected levels at various times over the following week, ranging from a day and a half later (May 13) in Kenya to a week later (May 19) in Rwanda.
Repairs to the EASSy and Seacom cables were completed on May 31. Repairs to the cables damaged in February were ongoing as of July 9, as their location in a war zone complicates repair efforts.
Chad
A reported fiber optic cable cut in Cameroon disrupted Internet connectivity for customers of Moov Africa TChad on May 25. The outage lasted three hours, between 15:15 -18:15 local time (14:15 – 17:15 UTC), with the impact visible at a country level as well. Routing was disrupted too, as the number of IPv4 /24 prefixes (256 IPv4 addresses) announced by Moov Africa Tchad fell from eight to three during the disruption.
The event was similar to one that occurred on January 10, when Moov Africa Tchad and country-level traffic was disrupted for over 12 hours “due to a cut in the optical fiber coming from Cameroon through which Chad has access to the Internet”. During that event, significant volatility was also observed from a routing perspective, as the volume of announced IPv4 address space shifted frequently at a network and country level during the disruption. As we noted last quarter, as a landlocked country, Chad is dependent on terrestrial Internet connections to/through neighboring countries, and the AfTerFibre cable map illustrates Chad’s reliance on limited cable paths through Cameroon and Sudan.
Gambia, Mauritania, Senegal
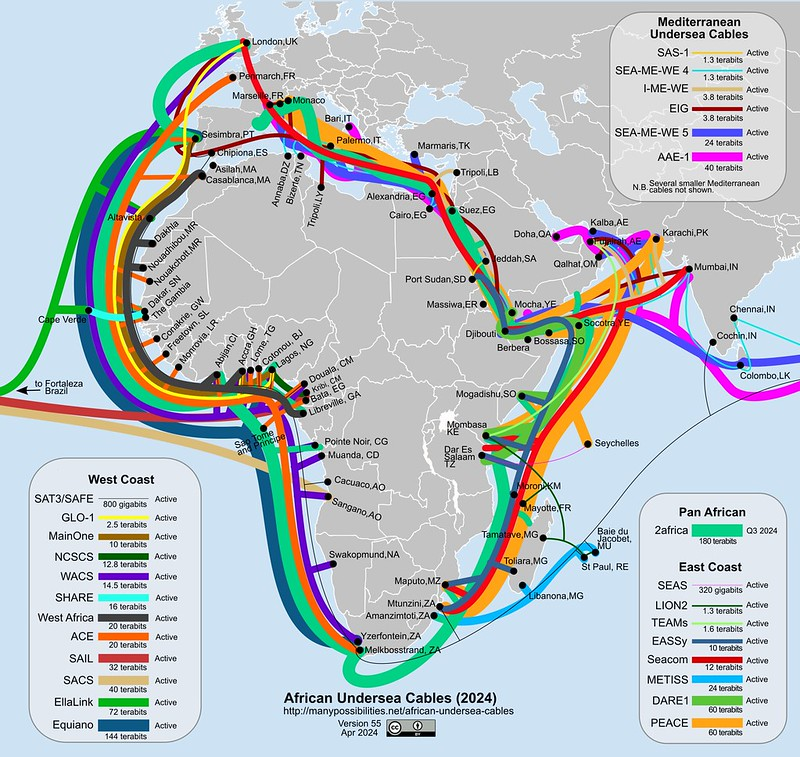
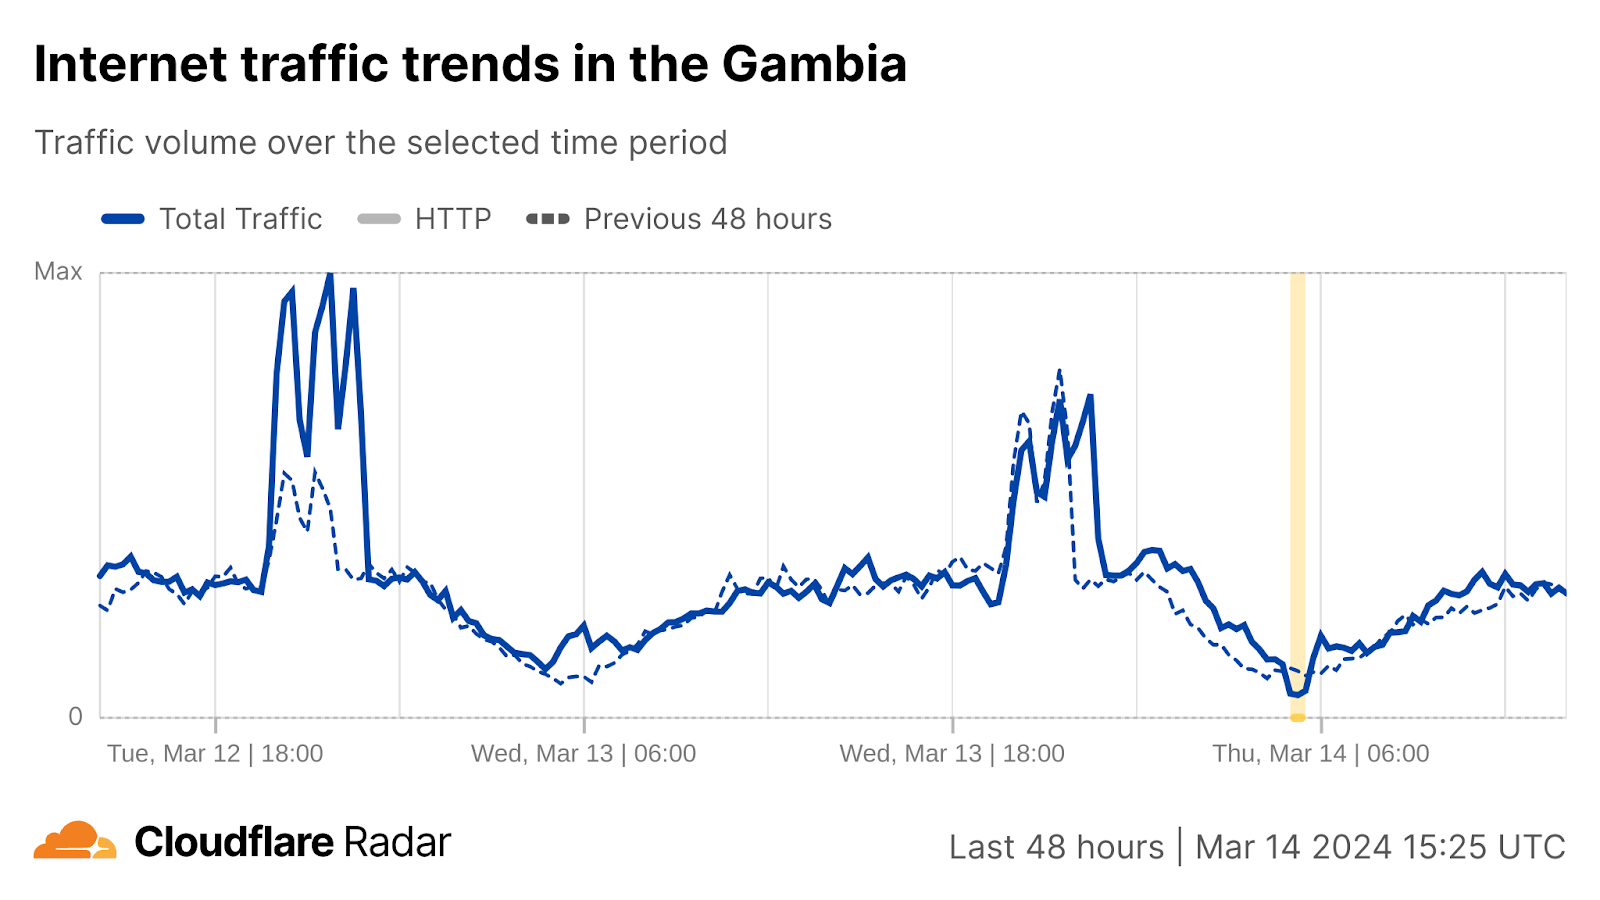
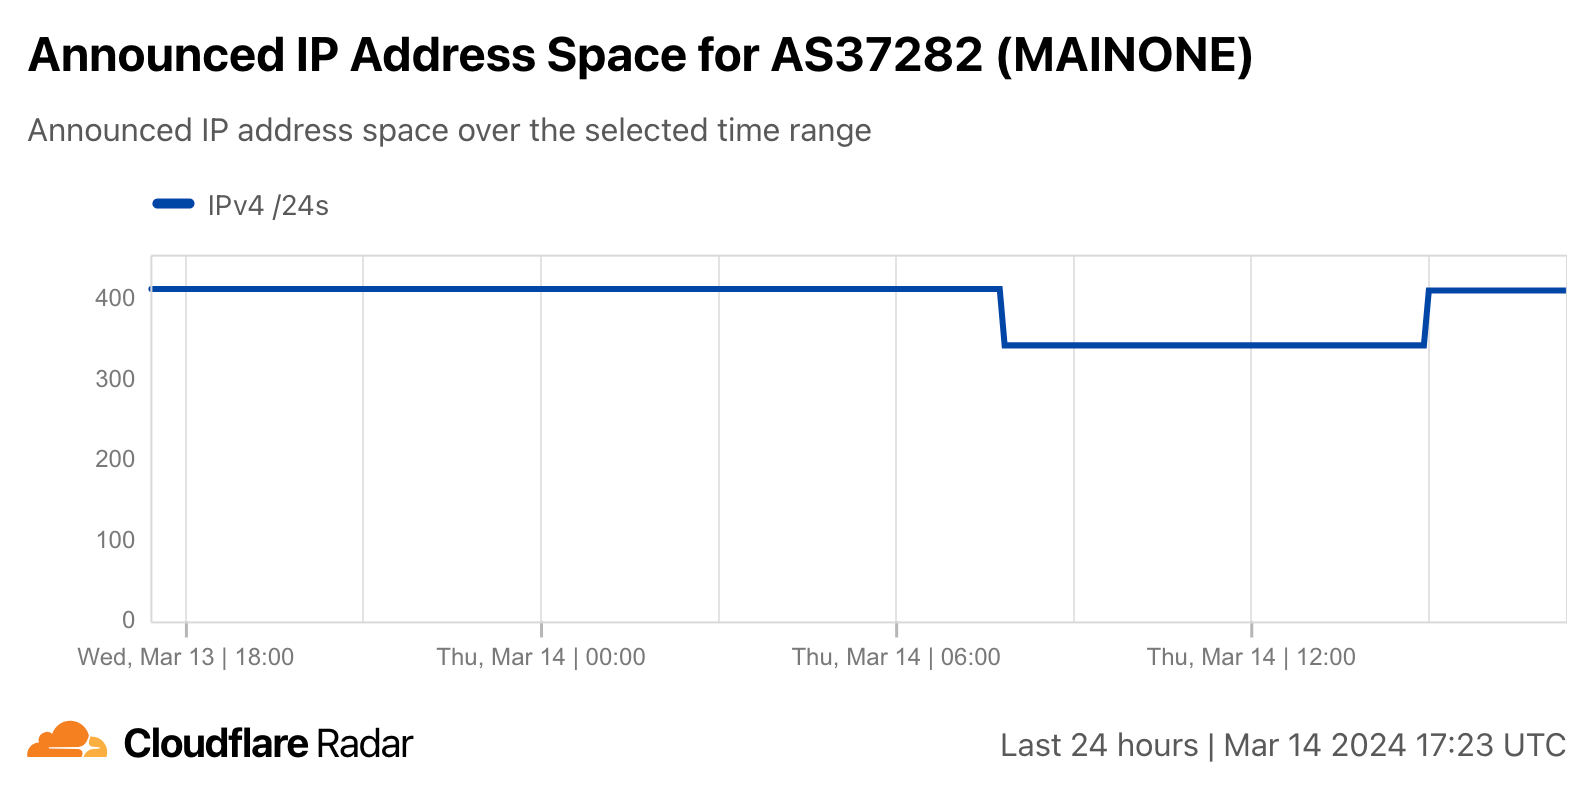
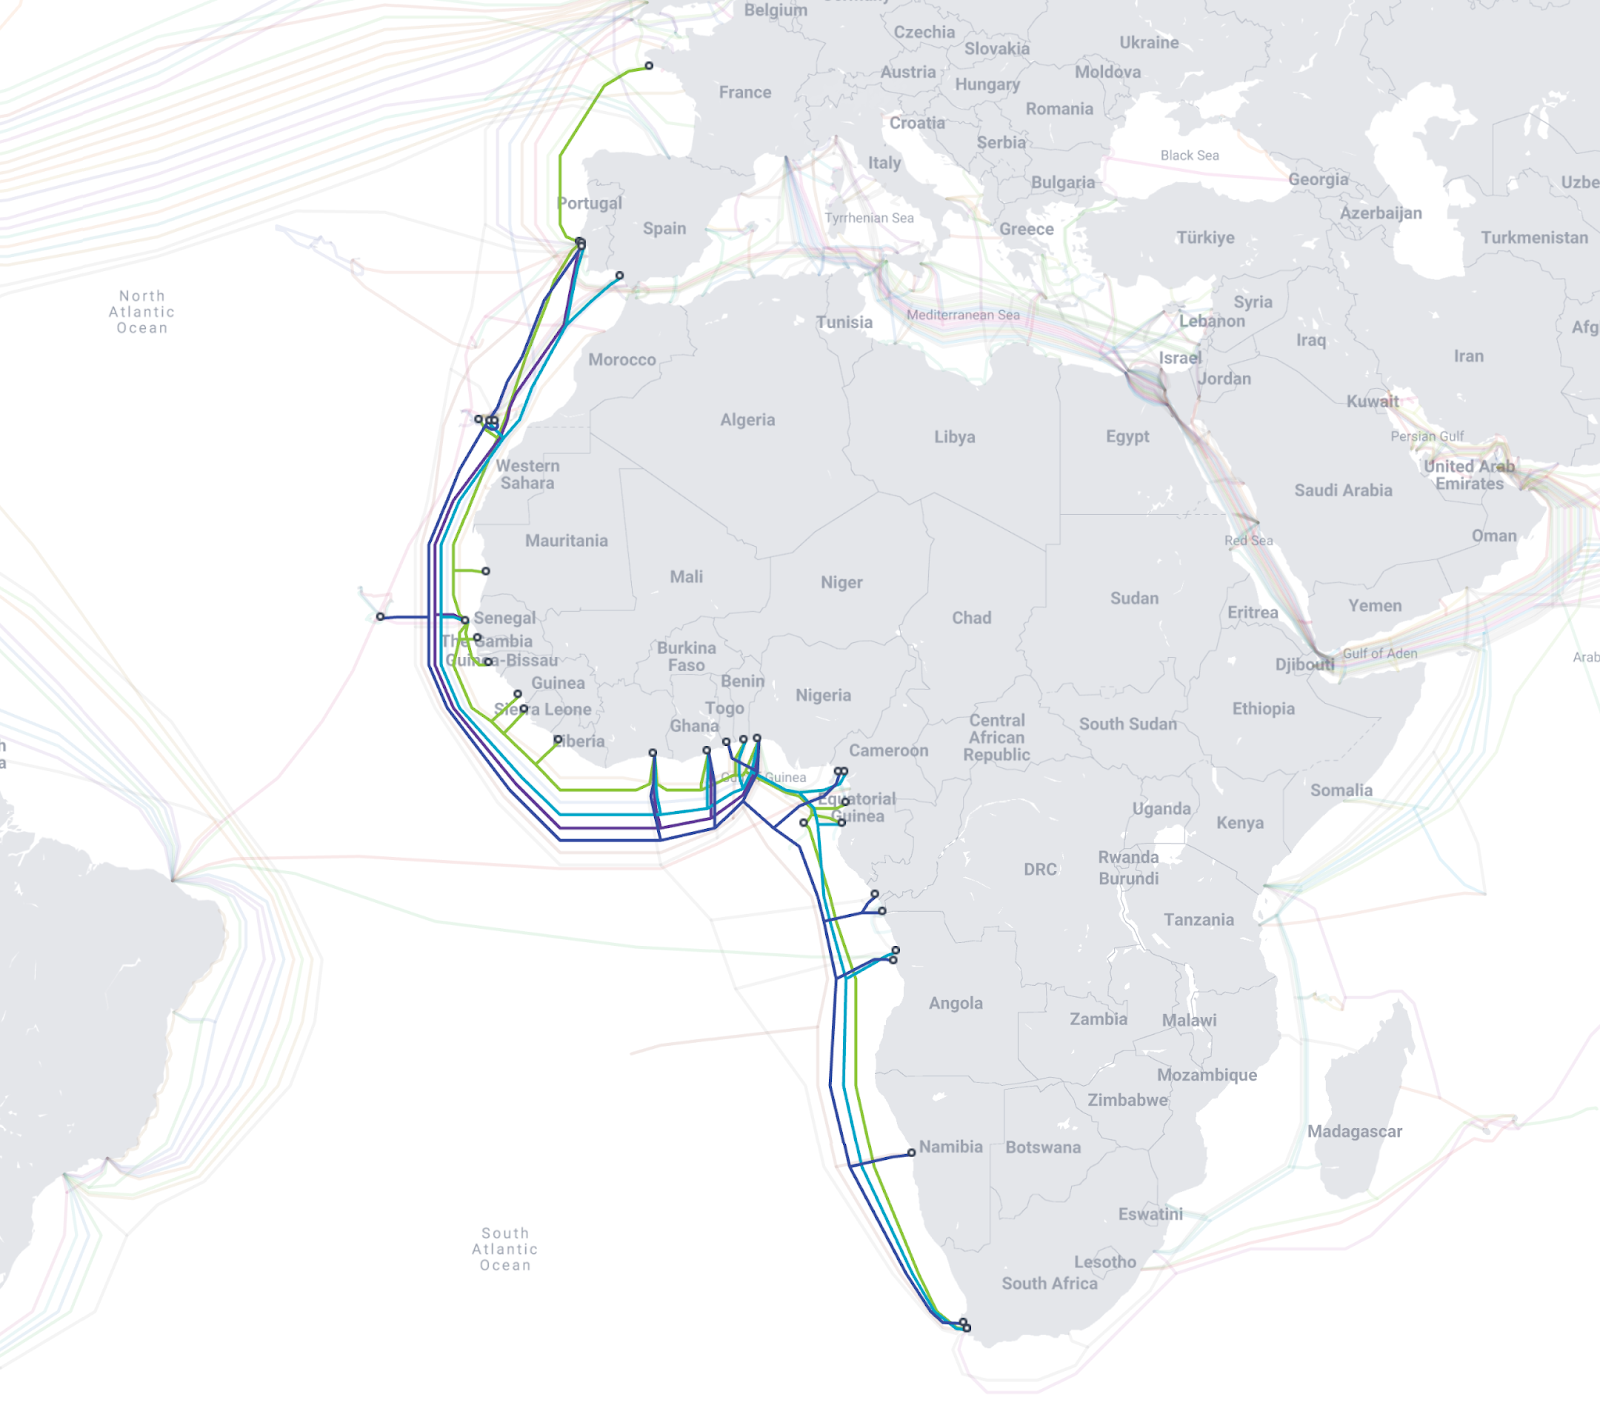
A reported “network interruption” on the Africa Coast to Europe (ACE) submarine cable disrupted traffic across networks in the Gambia, Mauritania, and Senegal on June 5. AS25250 (Gamtel), AS29544 (Mauritel), and AS37649 (Free/Tigo) all saw traffic drop around 23:00 local time (23:00 UTC). As seen in the graphs below, the outage lasted for nearly 11 hours, with traffic recovering just 10:00 local time on June 6 (10:00 UTC). Mauritel saw a near complete outage, while Gamtel and Free/Tigo saw less severe impacts, possibly because they were able to shift traffic to back up links.
Maintenance
Guinea, Gambia, Sierra Leone, Liberia
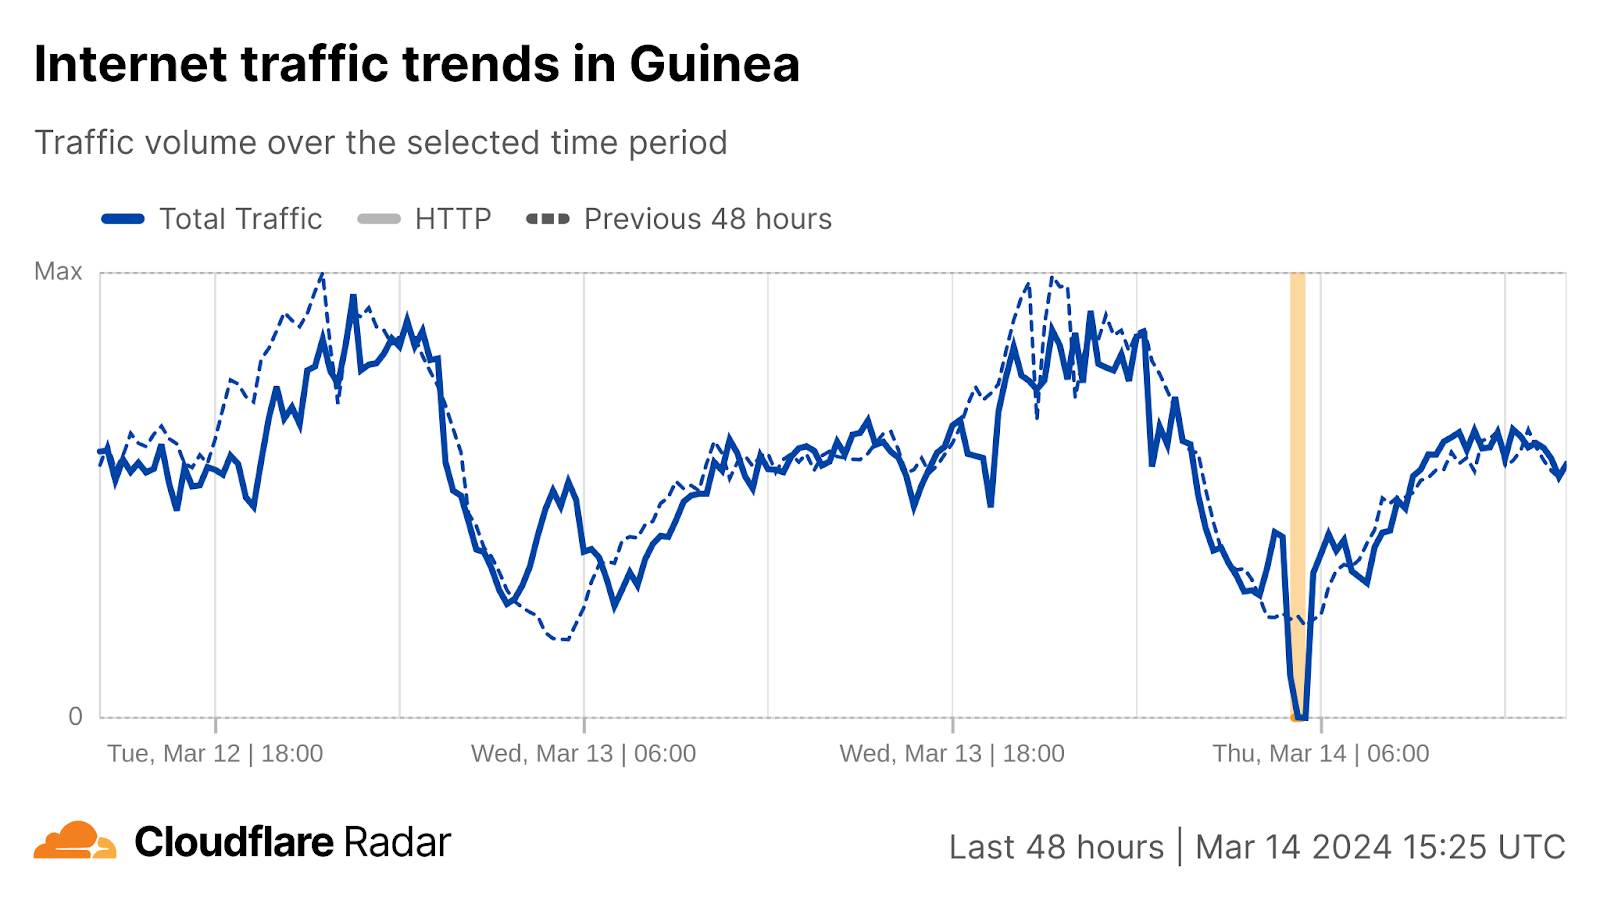
Above, we discussed an unexpected network interruption on the ACE submarine cable that caused outages across multiple countries on June 5. However, two months earlier, a planned outage for repair work on the cable also disrupted connectivity across multiple African countries. A communiqúe issued by the Ministry of Posts, Telecommunications and the Digital Economy in Guinea noted in part (translated) “…the ACE (Africa Coast to Europe) network will undergo a planned outage on April 8, 2024, between midnight and 2:00 a.m. morning in the following countries: Guinea, Senegal, Gambia, Sierra Leone and Liberia. This total outage of approximately 2 hours will affect Internet traffic and international calls.”
The graphs below show the impact to traffic in the listed countries for the planned two-hour repair window, though it appears that traffic did not return fully to expected levels after the repair window concluded – it is unclear why it remained slightly depressed. In addition, despite being listed as one of the impacted countries, no impact to traffic was observed in Senegal.
Guinea
Rounding out a trifecta of entries about the ACE submarine cable, planned maintenance work on the cable by GUILAB reportedly caused a multi-hour outage at AS37461 (Orange Guinea) and at a country level as well, lasting from 12:15 – 15:45 local time (12:15 – 15:45 UTC). (GUILAB is the company in charge of managing the capacity allocated to Guinea on the ACE submarine cable.) The maintenance work was reported by Orange Guinea in two X posts (1, 2), although these posts were subsequently deleted.
Power outage
Kenya
At 18:30 local time (15:30 UTC) on May 2, Kenya Power posted a “Power Outage Alert” on X that stated “At 5:40 PM (EAT) today, Thursday, 2nd May 2024, we experienced a system disturbance on the grid, resulting in power supply disruption in most parts of the country.” The graph below shows the resultant impact on Internet connectivity in the country, with traffic dropping sharply between 17:30 – 17:45 local time (14:30 – 14:45 UTC). The drop in traffic lasted until approximately 21:30 local time (18:30 UTC), the same time that Kenya Power posted a “Power Supply Restoration” notice on X, highlighting the restoration of power to parts of the country. Although the post-outage spike seen in the graph would suggest pent-up demand for online content, a longer-term view of Kenya’s Internet traffic shows traffic peaks at the same time (22:00 local time, 19:00 UTC) during the preceding two days as well.
Ecuador
A nationwide power outage in Ecuador on June 19 impacted hospitals, homes, and the subway, in addition to causing a major disruption to Internet connectivity. The graph below shows Ecuador’s Internet traffic dropping sharply just after 15:00 local time (20:00 UTC). A post on X from Public Works Minister Roberto Luque explained (translated) “The immediate report that we received from CENACE is that there is a failure in the transmission line that caused a cascade disconnection, so there is no energy service on a national scale.” A subsequent post pointed at a lack of investment in the underlying systems, and noted that as of 18:41 pm local time (23:41 UTC), “95% of the energy has already been restored”. After the initial sharp drop, traffic began to recover fairly quickly, and was effectively back to expected levels by the stated time.
Albania, Bosnia, Montenegro
A sudden increase in power consumption related to increased usage due to high temperatures, as well electrical systems being impacted by the heat, caused a widespread power outage across Montenegro, Bosnia, and Montenegro on June 21. The outage reportedly originated in Montenegro after a 400-kilowatt transmission line exploded. While power outages are generally more localized to a single country, or region within a country, power distribution systems are linked across Balkan countries as part of the Trans-Balkan Electricity Corridor.
Published reports (MSN, Reuters) noted that electrical networks went down 12:00 – 13:00 local time (10:00 – 11:00 UTC), and that electricity suppliers in the impacted countries started restoring power by mid-afternoon, and had it largely restored by the evening. The graphs below show traffic from Albania, Bosnia, and Montenegro starting to drop around 12:00 local time (10:00 UTC), reaching its nadir in Albania and Bosnia at 12:30 local time (10:30 UTC) and at 13:00 local time (11:00 UTC) in Montenegro. Traffic recovered gradually over the next several hours as power was restored, returning to expected levels by 15:30 local time (13:30 UTC).
Croatia was reportedly impacted by the power outage as well, but no adverse impact to traffic at a country level is visible during the timeframe that connectivity in the other countries was disrupted.
Military action
Ukraine
During the two-plus years of the Russia-Ukraine conflict, Ukraine’s power grid has been a frequent target for Russian air attacks. When damage to Ukraine’s electrical power infrastructure occurs as a result of these attacks, Internet connectivity is also disrupted. Attacks on May 21 caused power outages across a number of areas in Ukraine. The most significant impact was in Sumy, where traffic dropped as low as 82% below the previous week at 00:00 on May 22 local time (21:00 UTC). As the graphs below illustrate, traffic was also lower than the previous week for several hours in Kyiv, Kharkiv, and Vinnytsia, with traffic returning to expected levels by around 08:00 local time (05:00 UTC) on May 22.
\
Technical problems
Malaysia
As we’ve covered in previous quarterly posts, Internet outages and disruptions aren’t always due to significant wide-scale events like severe weather, power outages, or cable cuts. Sometimes more mundane technical issues can cause problems when users try to access the Internet. One example of this occurred on April 15 in Malaysia, when customers of Time Internet experienced a network outage for nearly two hours. The company explained the reason for the outage in a contrite post on their Facebook page, stating in part “This Internet service outage was by far the worst in our history – affecting approximately 40% of our customers. … At 5.38pm today, both our primary and secondary Secure DNS servers became unreachable. This means that any browser or service requiring a DNS address resolution was not able to reach its intended site.” Because subscribers could not reach Time Internet’s DNS resolvers, they were unable to resolve hostnames for Internet services, sites, and applications, including those delivered by Cloudflare. This resulted in the drop in traffic seen in the graph below, which started just after 17:00 local time (05:00 UTC), and began to recover approximately an hour later. The company did not provide any additional information on what caused the DNS servers to fail.
Nepal
In Nepal, a number of local Internet service providers including AS45650 (Vianet) and AS139922 (Dishhome) rely on Indian provider Bharti Airtel for upstream connectivity, enabling them to reach the rest of the Internet. A published report underscores the reliance, noting “Nepali ISPs buy 70 percent of their internet from Airtel.”
On April 25, these ISPs warned that their services could be interrupted because the Nepali government had not provided them with foreign exchange services that would enable them to pay bandwidth vendors such as Airtel, whom they reportedly owed USD $30 million to. On May 1, Airtel informed the delinquent Nepali providers that Internet services may be interrupted at any time due to the overdue payment, and on May 2, Airtel took that step. The graphs below show Vianet’s traffic dropping to near zero at 16:15 local time (10:30 UTC), recovering to expected levels six hours later. An hour later, at 17:15 local time (11:30 UTC), Dishhome’s traffic dropped significantly, though not as severely as Vianet’s. Dishhome’s traffic also recovered approximately six hours later.
A month later, on June 3, AS45650 (Vianet) and AS17501 (Worldlink) in Nepal experienced Internet disruptions that were reportedly caused by routing issues on Bharti Airtel’s network. On Worldlink, a drop in traffic occurred between 12:15 – 14:00 local time (06:30 – 08:15 UTC), while on Vianet, the loss of traffic took place between 12:15 – 13:15 local time (06:30 – 07:30 local time).
Unknown
Most of the Internet disruptions covered in this blog post series have a known root cause, whether admitted/stated by the impacted provider(s) or closely associated with a real world event (severe weather, power outage, etc.) However, other disruptions are observed and even publicized by the impacted provider, but no underlying reason for the outage is ever made public.
Malaysia
On May 21, CelcomDigi (AS10030)posted on X that it was experiencing an outage on its network, and that it was working to resolve the issue as soon as possible. However. just 12 minutes later, it published a second post stating that it had fully restored Celcom Internet service. These posts were made at 21:35 and 21:47 local time (13:35 and 13:47) respectively. However, as the graph below shows, traffic volumes had returned to expected levels over an hour earlier, as the observed Internet disruption on Celcom’s network lasted between 18:00 – 20:15 local time (10:00 – 12:15 UTC). (Note that the second disruption shown in the graph below was due to an internal Cloudflare data pipeline issue, and not any sort of problem with Celcom’s network.)
Starlink
SpaceX Starlink’s satellite Internet service is unique in that it has an international subscriber base, so outages on its network have a more wide-reaching impact than issues with an ISP that covers a single country. At 01:59 UTC on May 29, Starlinkshared on X that it was currently experiencing a network outage, and that it was actively implementing a solution. Twenty-eight minutes later, it posted “The network issue has been fully resolved.” This brief outage is visible in the graph below as a slight dip in traffic. However, what is particularly interesting is the spike in traffic to Cloudflare from Starlink’s network following the resolution of the outage. The sharp increase and rapid decline of the traffic curve after service was restored suggests that it may be related to an automated connectivity check of some kind, rather than pent-up user demand for content.
Chad
A near-complete Internet outage was observed in Chad on June 5 between 08:15 – 12:00 local time (07:15 – 11:00 UTC), as seen in the graph below. Routing was also impacted, as the number of IPv4 /24 address blocks (256 IPv4 addresses) announced by network providers in the country dropped by as much as 75% during the outage.
A news item covering the outage noted that only Starlink subscribers retained Internet access during the outage. It also noted that Chad has faced recurring Internet disruptions since 2016, either because of problems with fiber-optic cables, or due to government directed shutdowns in the name of national security. It is unclear what ultimately caused this particular outage.
India
With an estimated subscriber base in excess of over 460 million, any Internet disruption affecting Reliance Jio’s network (AS55836) is going to have a widespread impact across India. On June 18, Reliance Jio experienced two disruptions that occurred between 13:15 – 17:15 local time (07:45 – 11:45 UTC). Each disruption lasted less than an hour, and dropped traffic levels to approximately half of those seen at the same time a week prior. Both mobile and fiber connectivity was affected, and no additional information has been provided by Reliance Jio regarding the root cause of the connectivity issues.
Conclusion
As we become increasingly dependent on reliable Internet connectivity, we must recognize that that connectivity is itself reliant on a complex and interconnected foundation of physical, technical, and political factors. A failure in any one of these foundational components, whether due to a cable cut, power outage, misconfiguration, or government action, can have a significant impact, disrupting Internet connectivity for millions of users, potentially across multiple countries. While the resilience and reliability of the physical and technical components can be improved through redundancy and best practices, political factors have arguably proven to be the hardest to address. However, organizations like AccessNow, through their #KeepItOn campaign, mobilize people, communities, and civil society actors globally to fight against government-directed Internet shutdowns, which can have significant financial consequences.
On Thursday, June 20, 2024, two independent events caused an increase in latency and error rates for Internet properties and Cloudflare services that lasted 114 minutes. During the 30-minute peak of the impact, we saw that 1.4 – 2.1% of HTTP requests to our CDN received a generic error page, and observed a 3x increase for the 99th percentile Time To First Byte (TTFB) latency.
A new Distributed Denial-of-Service (DDoS) mitigation mechanism deployed between 14:14 and 17:06 UTC triggered a latent bug in our rate limiting system that allowed a specific form of HTTP request to cause a process handling it to enter an infinite loop between 17:47 and 19:27 UTC
Impact from these events were observed in many Cloudflare data centers around the world.
With respect to the backbone congestion event, we were already working on expanding backbone capacity in the affected data centers, and improving our network mitigations to use more information about the available capacity on alternative network paths when taking action. In the remainder of this blog post, we will go into more detail on the second and more impactful of these events.
As part of routine updates to our protection mechanisms, we created a new DDoS rule to prevent a specific type of abuse that we observed on our infrastructure. This DDoS rule worked as expected, however in a specific suspect traffic case it exposed a latent bug in our existing rate-limiting component. To be absolutely clear, we have no reason to believe this suspect traffic was intentionally exploiting this bug, and there is no evidence of a breach of any kind.
We are sorry for the impact and have already made changes to help prevent these problems from occurring again.
Background
Rate-limiting suspicious traffic
Depending on the profile of an HTTP request and the configuration of the requested Internet property, Cloudflare may protect our network and our customer’s origins by applying a limit to the number of requests a visitor can make within a certain time window. These rate limits can activate through customer configuration or in response to DDoS rules detecting suspicious activity.
Usually, these rate limits will be applied based on the IP address of the visitor. As many institutions and Internet Service Providers (ISPs) can have many devices and individual users behind a single IP address, rate limiting based on the IP address is a broad brush that can unintentionally block legitimate traffic.
Balancing traffic across our network
Cloudflare has several systems that together provide continuous real-time capacity monitoring and rebalancing to ensure we serve as much traffic as we can as quickly and efficiently as we can.
The first of these is Unimog, Cloudflare’s edge load balancer. Every packet that reaches our anycast network passes through Unimog, which delivers it to an appropriate server to process that packet. That server may be in a different location from where the packet originally arrived into our network, depending on the availability of compute capacity. Within each data center, Unimog aims to keep the CPU load uniform across all active servers.
For a global view of our network, we rely on Traffic Manager. Across all of our data center locations, it takes in a variety of signals, such as overall CPU utilization, HTTP request latency, and bandwidth utilization to instruct rebalancing decisions. It has built-in safety limits to prevent causing outsized traffic shifts, and also considers the expected resulting load in destination locations when making any decisions.
Incident timeline and impact
All timestamps are UTC on 2024-06-20.
14:14 DDoS rule gradual deployment starts
17:06 DDoS rule deployed globally
17:47 First HTTP request handling processe is poisoned
18:04 Incident declared automatically based on detected high CPU load
18:34 Service restart shown to recover on a server, full restart tested in one data center
18:44 CPU load normalized in data center after service restart
18:51 Continual global reloads of all servers with many stuck processes begin
19:05 Global eyeball HTTP error rate peaks at 2.1% service unavailable / 3.45% total
19:05 First Traffic Manager actions recovering service
19:11 Global eyeball HTTP error rate halved to 1% service unavailable / 1.96% total
19:27 Global eyeball HTTP error rate reduced to baseline levels
19:29 DDoS rule deployment identified as likely cause of process poisoning
19:34 DDoS rule is fully disabled
19:43 Engineers stop routine restarts of services on servers with many stuck processes
20:16 Incident response stood down
Below, we provide a view of the impact from some of Cloudflare’s internal metrics. The first graph illustrates the percentage of all eyeball (inbound from external devices) HTTP requests that were served an error response because the service suffering poisoning could not be reached. We saw an initial increase to 0.5% of requests, and then later a larger one reaching as much as 2.1% before recovery started due to our service reloads.
For a broader view of errors, we can see all 5xx responses our network returned to eyeballs during the same window, including those from origin servers. These peaked at 3.45%, and you can more clearly see the gradual recovery between 19:25 and 20:00 UTC as Traffic Manager finished its re-routing activities. The dip at 19:25 UTC aligns with the last large reload, with the error increase afterwards primarily consisting of upstream DNS timeouts and connection limits which are consistent with high and unbalanced load.
And here’s what our TTFB measurements looked like at the 50th, 90th and 99th percentiles, showing an almost 3x increase in latency at p99:
Technical description of the error and how it happened
Global percentage of HTTP Request handling processes that were using excessive CPU during the event
Earlier on June 20, between 14:14 – 17:06 UTC, we gradually activated a new DDoS rule on our network. Cloudflare has recently been building a new way of mitigating HTTP DDoS attacks. This method is using a combination of rate-limits and cookies in order to allow legitimate clients that were falsely identified as being part of an attack to proceed anyway.
With this new method, an HTTP request that is considered suspicious runs through these key steps:
Check for the presence of a valid cookie, otherwise block the request
If a valid cookie is found, add a rate-limit rule based on the cookie value to be evaluated at a later point
Once all the currently applied DDoS mitigation are run, apply rate-limit rules
We use this “asynchronous” workflow because it is more efficient to block a request without a rate-limit rule, so it gives a chance for other rule types to be applied.
So overall, the flow can be summarized with this pseudocode:
for (rule in active_mitigations) {
   // ... (ignore other rule types)
   if (rule.match_current_request()) {
       if (!has_valid_cookie()) {
           // no cookie: serve error page
           return serve_error_page();
       } else {
           // add a rate-limit rule to be evaluated later
           add_rate_limit_rule(rule);
       }
   }
}


evaluate_rate_limit_rules();
When evaluating rate-limit rules, we need to make a key for each client that is used to look up the correct counter and compare it with the target rate. Typically, this key is the client IP address, but other options are available, such as the value of a cookie as used here. We actually reused an existing portion of the rate-limit logic to achieve this. In pseudocode, it looks like:
function get_cookie_key() {
   // Validate that the cookie is valid before taking its value.
   // Here the cookie has been checked before already, but this code is
   // also used for "standalone" rate-limit rules.
   if (!has_valid_cookie_broken()) { // more on the "broken" part later
       return cookie_value;
   } else {
       return parent_key_generator();
   }
}
This simple key generation function had two issues that, combined with a specific form of client request, caused an infinite loop in the process handling the HTTP request:
The rate-limit rules generated by the DDoS logic are using internal APIs in ways that haven’t been anticipated. This caused the parent_key_generator in the pseudocode above to point to the get_cookie_key function itself, meaning that if that code path was taken, the function would call itself indefinitely
As these rate-limit rules are added only after validating the cookie, validating it a second time should give the same result. The problem is that the has_valid_cookie_broken function used here is actually different and both can disagree if the client sends multiple cookies where some are valid but not others
So, combining these two issues: the broken validation function tells get_cookie_key that the cookie is invalid, causing the else branch to be taken and calling the same function over and over.
A protection many programming languages have in place to help prevent loops like this is a run-time protection limit on how deep the stack of function calls can get. An attempt to call a function once already at this limit will result in a runtime error. When reading the logic above, an initial analysis might suggest we were reaching the limit in this case, and so requests eventually resulted in an error, with a stack containing those same function calls over and over.
However, this isn’t the case here. Some languages, including Lua, in which this logic is written, also implement an optimization called proper tail calls. A tail call is when the final action a function takes is to execute another function. Instead of adding that function as another layer in the stack, as we know for sure that we will not be returning execution context to the parent function afterwards, nor using any of its local variables, we can replace the top frame in the stack with this function call instead.
The end result is a loop in the request processing logic which never increases the size of the stack. Instead, it simply consumes 100% of available CPU resources, and never terminates. Once a process handling HTTP requests receives a single request on which the action should be applied and has a mixture of valid and invalid cookies, that process is poisoned and is never able to process any further requests.
Every Cloudflare server has dozens of such processes, so a single poisoned process does not have much of an impact. However, then some other things start happening:
The increase in CPU utilization for the server causes Unimog to lower the amount of new traffic that server receives, moving traffic to other servers, so at a certain point, more new connections are directed away from servers with a subset of their processes poisoned to those with fewer or no poisoned processes, and therefore lower CPU utilization.
The gradual increase in CPU utilization in the data center starts to cause Traffic Manager to redirect traffic to other data centers. As this movement does not fix the poisoned processes, CPU utilization remains high, and so Traffic Manager continues to redirect more and more traffic away.
The redirected traffic in both cases includes the requests that are poisoning processes, causing the servers and data centers to which this redirected traffic was sent to start failing in the same way.
Within a few minutes, multiple data centers had many poisoned processes, and Traffic Manager had redirected as much traffic away from them as possible, but was restricted from doing more. This was partly due to its built-in automation safety limits, but also because it was becoming more difficult to find a data center with sufficient available capacity to use as a target.
The first case of a poisoned process was at 17:47 UTC, and by 18:09 UTC – five minutes after the incident was declared – Traffic Manager was re-routing a lot of traffic out of Europe:
A summary map of Traffic Manager capacity actions as of 18:09 UTC. Each circle represents a data center that traffic is being re-routed towards or away from. The color of the circle indicates the CPU load of that data center. The orange ribbons between them show how much traffic is re-routed, and where from/to.
It’s obvious to see why, if we look at the percentage of the HTTP request service’s processes that were saturating their CPUs. 10% of our capacity in Western Europe was already gone, and 4% in Eastern Europe, during peak traffic time for those timezones:
Percentage of all the HTTP request handling processes saturating their CPU, by geographic region
Partially poisoned servers in many locations struggled with the request load, and the remaining processes could not keep up, resulting in Cloudflare returning minimal HTTP error responses.
Cloudflare engineers were automatically notified at 18:04 UTC, once our global CPU utilization reached a certain sustained level, and started to investigate. Many of our on-duty incident responders were already working on the open incident caused by backbone network congestion, and in the early minutes we looked into likely correlation with the network congestion events. It took some time for us to realize that locations where the CPU was highest is where traffic was the lowest, drawing the investigation away from a network event being the trigger. At this point, the focus moved to two main streams:
Evaluating if restarting poisoned processes allowed them to recover, and if so, instigating mass-restarts of the service on affected servers
Identifying the trigger of processes entering this CPU saturation state
It was 25 minutes after the initial incident was declared when we validated that restarts helped on one sample server. Five minutes after this, we started executing wider restarts – initially to entire data centers at once, and then as the identification method was refined, on servers with a large number of poisoned processes. Some engineers continued regular routine restarts of the affected service on impacted servers, whilst others moved to join the ongoing parallel effort to identify the trigger. At 19:36 UTC, the new DDoS rule was disabled globally, and the incident was declared resolved after executing one more round of mass restarts and monitoring.
At the same time, conditions presented by the incident triggered a latent bug in Traffic Manager. When triggered, the system would attempt to recover from the exception by initiating a graceful restart, halting its activity. The bug was first triggered at 18:17 UTC, then numerous times between 18:35 and 18:57 UTC. During two periods in this window (18:35-18:52 UTC and 18:56-19:05 UTC) the system did not issue any new traffic routing actions. This meant whilst we had recovered service in the most affected data centers, almost all traffic was still being re-routed away from them. Alerting notified on-call engineers of the issue at 18:34 UTC. By 19:05 UTC the Traffic team had written, tested, and deployed a fix. The first actions following restoration showed a positive impact on restoring service.
Remediation and follow-up steps
To resolve the immediate impact to our network from the request poisoning, Cloudflare instigated mass rolling restarts of the affected service until the change that triggered the condition was identified and rolled back. The change, which was the activation of a new type of DDoS rule, remains fully rolled back, and the rule will not be reactivated until we have fixed the broken cookie validation check and are fully confident this situation cannot recur.
We take these incidents very seriously, and recognize the magnitude of impact they had. We have identified several steps we can take to address these specific situations, and the risk of these sorts of problems from recurring in the future.
Design: The rate limiting implementation in use for our DDoS module is a legacy component, and rate limiting rules customers configure for their Internet properties use a newer engine with more modern technologies and protections.
Design: We are exploring options within and around the service which experienced process poisoning to limit the ability to loop forever through tail calls. Longer term, Cloudflare is entering the early implementation stages of replacing this service entirely. The design of this replacement service will allow us to apply limits on the non-interrupted and total execution time of a single request.
Process: The activation of the new rule for the first time was staged in a handful of production data centers for validation, and then to all data centers a few hours later. We will continue to enhance our staging and rollout procedures to minimize the potential change-related blast radius.
Conclusion
Cloudflare experienced two back-to-back incidents that affected a significant set of customers using our CDN and network services. The first was network backbone congestion that our systems automatically remediated. We mitigated the second by regularly restarting the faulty service whilst we identified and deactivated the DDoS rule that was triggering the fault. We are sorry for any disruption this caused our customers and to end users trying to access services.
The conditions necessary to activate the latent bug in the faulty service are no longer possible in our production environment, and we are putting further fixes and detections in place as soon as possible.
The practice of cheating on exams (or at least attempting to) is presumably as old as the concept of exams itself, especially when the results of the exam can have significant consequences for one’s academic future or career. As access to the Internet became more ubiquitous with the growth of mobile connectivity, and communication easier with an assortment of social media and messaging apps, a new avenue for cheating on exams emerged, potentially facilitating the sharing of test materials or answers. Over the last decade, some governments have reacted to this perceived risk by taking aggressive action to prevent cheating, ranging from targeted DNS-based blocking/filtering to multi-hour nationwide shutdowns across multi-week exam periods.
Syria and Iraq are well-known practitioners of the latter approach, and we have covered past exam-related Internet shutdowns in Syria (2021, 2022, 2023) and Iraq (2022, 2023) here on the Cloudflare blog. It is now mid-June 2024, and exams in both countries took place over the last several weeks, and with those exams, regular nationwide Internet shutdowns. In addition, Baccalaureate exams also took place in Algeria, and we have written about related Internet disruptions there in the past (2022, 2023). However, in contrast to the single daily shutdowns in Syria and Iraq, the Algerian government opted instead for two multi-hour disruptions each day – one in the morning, one in the afternoon – and appears to be pursuing a content blocking strategy, rather than a full nationwide shutdown.
As we have done in past year’s posts, we will examine the impact that these shutdowns have on Internet traffic, but also analyze routing information and traffic from other Cloudflare services in an effort to better understand how these shutdowns are being implemented.
Syria
The Syrian Telecom Company, to their credit, publishes an exam schedule on social media, with the image below published to their Facebook page. The English version was created by applying Google Translate to the image. The schedule shows the date & time of each Internet shutdown (“disconnection”), in addition to the subject(s) of that day’s exam(s). In 2024, exams started on May 26, and went through June 13.
In Syria, AS29256 (Syrian Telecom) is effectively the Internet, as shown in the table below. While there are a few other autonomous systems (ASNs/ASes) registered in Syria, there are only two that currently announce IP address space to the public Internet. As such, the trends seen at a country level for Syria reflect those seen for AS29256, and this is clearly evident in the traffic graphs below.
Nationwide Internet shutdowns in Syria began on May 26, taking place for varying multi-hour periods from Sunday to Thursday for three consecutive weeks. The graphs below show Internet traffic from the country, as well as AS29256, dropping to zero during the scheduled shutdowns.
In addition, graphs from the Cloudflare Radar Routing pages for Syria and AS29256 show the number of IPv4 and IPv6 prefixes being announced country-wide and by AS29256 dropping to at or near zero during each shutdown. This ultimately means that there is no Internet path back to systems (IP addresses) connected to Syrian Telecom. Below, we explore why this is important and problematic.
As has been observed in the past, the shutdowns in Syria are asymmetrical. That is, traffic can exit the country (via AS29256), but there are no paths for responses to return. The impact of this approach is clearly evident in traffic to Cloudflare’s 1.1.1.1 DNS Resolver. We continue to see traffic to the resolver when the shutdowns take place, and in fact, we see the traffic spike during the shutdowns, as the graph below shows.
If we dig into traffic to 1.1.1.1 by protocol, we can see that it is driven by requests over UDP port 53, the standard port used for DNS requests over UDP and TCP. (Given the request pattern, that also appears to be the primary way that we see traffic to the resolver from Syria.)
If we remove the UDP line from the graph, we see that request volume for DNS over TCP port 53, as well as DNS over HTTPS (DoH) and DNS over TLS (DoT), all drops to zero during the shutdowns.
Similarly, we can clearly see the shutdowns in HTTP(S) request-based traffic graphs as well, since HTTP(S) is also a TCP-based protocol.
Why do we see this impact? With DNS over UDP, the client simply makes a request to the resolver – no multi-step handshake is involved, as with TCP. So in this case, 1.1.1.1 is receiving these requests, but as shown above, there’s no path for the response to reach the client. Because it hasn’t received a response, the client retries the request, and this flood of retries is manifested as the spike seen in the graphs above.
However, as we see above, request volume for DNS over TCP, as well as DoH, DoT, and HTTP(S) (which all use TCP), falls to zero during the shutdowns. The lack of a path back to the client means that the TCP 3-way handshake can’t complete, and thus we don’t see DNS requests over these protocols.
In looking at 1.1.1.1 Resolver request volume from Syria for popular social media and messaging applications, we can see traffic for facebook.com most closely matches the spikes shown above. Removing facebook.com from the graph, we can also see similar, though more limited, increases for domains used by popular messaging applications WhatsApp, Signal, and Telegram. Facebook and WhatsApp are reportedly the most popular social media and messaging applications in Syria.
Although we have focused on the analysis of traffic to Cloudflare’s DNS resolver, and the patterns seen within that traffic, it is also worth highlighting an interesting pattern observed in traffic to Cloudflare’s Authoritative DNS platform. (DNS resolvers act as a middleman between clients, such as a laptop or phone, and an authoritative DNS server. Authoritative DNS servers contain information specific to the domain names they serve, including IP addresses and other types of records.)
The graph below shows bits/second traffic from Syria for Cloudflare’s authoritative DNS service on June 13. (Similar patterns were observed during the other days when shutdowns occurred, but data volume limits the ability to create a graph showing an extended period of time.) In this graph, we can see that at the start of the shutdown (03:00 UTC), traffic rises sharply, effectively plateaus for the duration of the shutdown, and then returns to normal levels. We believe that the traffic pattern illustrated here could be the result of some local resolvers in Syria having the IP addresses for our authoritative DNS servers cached, and are making requests to them. The increased traffic level could be because they are retrying their queries after not receiving responses, but in a less aggressive fashion than the client applications driving the resolver traffic spikes shown above.
In summary, Syria appears to be implementing their Internet shutdowns not through filtering, but rather by simply not announcing their IP address space for the duration of the shutdown, thereby preventing any responses from returning to the originating requestor, whether client application, web browser, or local DNS resolver.
Iraq
On May 19, the Iraqi Ministry of Communication posted an update that stated (translated) “The Ministry of Communications would like to note that the Internet service will be cut off for two hours during the general exams for intermediate studies, from six in the morning until eight in the morning, based on higher directives and at the request of the Ministry of Education.” The post came nearly a year after the Iraqi Ministry of Communication refused a request from the Ministry of Education to shut down the Internet during the baccalaureate exams as part of efforts to prevent cheating. On May 20, the Iraqi Ministry of Education posted the schedule for the upcoming set of exams to its Facebook page.
Iraq has a much richer network service provider environment than Syria does, with over 150autonomous systems (ASNs) registered in the country and announcing IP address space, compared to just two ASNs (both Syrian Telecom) in Syria announcing IP address space. Although traffic in Iraq is generally concentrated among the larger providers, shutdowns are rarely “complete” at a country level because not every autonomous system (network provider) in the country implements a shutdown. (This is due in part to the autonomous Kurdistan region in the north, which often implements similar shutdowns on their own schedule. Network providers in this region are included in Iraq’s country-level graphs.)
We can see this in a Cloudflare Radar traffic graph that shows the shutdowns at a country level, where traffic is dropping by around 87% during each multi-hour shutdown. In addition to the five networks also shown here (AS203214 (HulumTele), AS199739 (Earthlink), AS58322 (Halasat), AS51684 (Asiacell), and AS59588 (Zainas)), further analysis finds more than 30 where we observed a complete loss of traffic during the shutdowns, with a number of them downstream of these providers.
In contrast to Syria, the changes to announced IP address space during the shutdowns are much less severe in Iraq. Several of the shutdowns are correlated with a drop of ~20-25% in announced IPv4 address space, while a few others saw a drop closer to just 2%.
Similar to Syria, we can also look at 1.1.1.1 resolver traffic data to better understand how the shutdowns are being implemented. The country-level graphs below suggest that UDP traffic patterns are not visibly changing, suggesting that responses from the resolver are, in fact, getting back to the clients. However, this likely isn’t the case, and such a conclusion is at least in part an artifact of the graph’s time frame and hourly granularity, as well as the inclusion of resolver traffic from Kurdish network providers (ASNs). The shutdowns are more clearly evident in the DNS-over-TCP and DNS-over-HTTPS graphs below, as well as in the graph for HTTP(S) request traffic (both mobile & desktop), which is also TCP-based. In these graphs, the troughs on days that shutdowns occurred generally dip lower than those on the days that the Internet remained available.
In looking at authoritative DNS traffic from Iraq during a shutdown (for June 13 as an example day, as above), we see evidence of a decline in traffic during the time the shutdown occurs.
The decline in authoritative DNS traffic is more evident at an ASN level, such as in the graph below for AS203214 (Hulum), effectively confirming that UDP traffic is not getting through here either.
Considering the traffic, 1.1.1.1 Resolver, and authoritative DNS observations reviewed here, it suggests that the Internet shutdowns taking place in Iraq are more complex than Syria’s, as it appears that both UDP and TCP traffic are unable to egress from impacted network providers. As not all impacted network providers are showing a complete loss of announced IP address space during the shutdowns, Iraq is taking a different approach to disrupting Internet connectivity. Although analysis of our data doesn’t provide a definitive conclusion, there are several likely options, and network providers in the country may be combining several. These options revolve around:
IP: Block packets from reaching IP addresses. This may be done by withdrawing prefix announcements from the routing table (a brute force approach) or by blocking access to specific IP addresses, such as those associated with a specific application or service (a more surgical approach).
Connection: Block connections based on SNI/HTTP headers, or other application data. If a network or on-path device is able to observe the server name (or other relevant headers/data), then the connection can be terminated.
DNS: Operators of private or ‘internal’ DNS resolvers, offered by ISPs and enterprise environments for use by their own users, can apply content restrictions, blocking the resolution of hostnames associated with websites and other applications.
The consequences of these options are covered in more detail in a blog post. In addition, applying them at common network chokepoints, such as AS212330 (IRAQIXP) or AS208293 (AlSalam State Company, associated with the Iraqi Ministry of Communications), can disrupt connectivity at multiple downstream ISPs, without those providers necessarily having to take action themselves.
Algeria
As we noted in blog posts in 2022 and 2023, Algeria has a history of disrupting Internet connectivity during Baccalaureate exams. This has been taking place since 2018, following widespread cheating in 2016 that saw questions leaked online both before and during tests. On March 13, the Algerian Ministry of Education announced that the Baccalaureate exams would be held June 9-13. As expected, Internet disruptions were observed both country-wide and at a network level. Similar to previous years, two disruptions were observed each day. The first one began at 08:00 local time (07:00 UTC), and except for June 9, lasted three hours, ending at 11:00 local time (10:00 UTC). (On June 9, it lasted until 13:00 local time (12:00 UTC).) The second one began between 14:00-14:30 local time (13:00-13:30 UTC), and lasted until 16:00-17:00 local time (15:00-16:00 UTC) – the end time varied by day.
As seen in the graphs below, the impact to traffic was fairly nominal, suggesting that wide scale Internet shutdowns similar to those seen in Syria were not being implemented. While this is in line with 2023’s pronouncement by the Minister of Education that there would be no Internet shutdown on exam days, a number of posts on X complained of broader cuts to Internet connectivity.
Similar to the analysis above of the shutdowns in Syria and Iraq, we can also review changes to announced IP address space to better understand how connectivity was being disrupted. In this case, as the graphs below show, no meaningful changes to announced IPv4 address space were observed during the days the Baccalaureate exams were given. As such, the observed drops in traffic were not caused by routing changes.
In the HTTP(S) request traffic graph below, the twice-daily disruptions are highlighted, with the morning one appearing as a nominal drop in traffic, and the afternoon one causing a more severe decline. (The graph shows request traffic aggregated at a country level, but the graphs for the ASNs listed above also show similar patterns.)
In addition, similar patterns are observed in 1.1.1.1 resolver traffic at a country and ASN level, but only for DNS over TCP, DNS over TLS, and DNS over HTTPS, all of which leverage TCP. In the graph below showing only resolver traffic over UDP, there’s no clear evidence of disruptions. However, in the graph that shows resolver traffic over HTTPS, TCP, and TLS, a slight perturbation is visible in the morning, as traffic begins to rise for the day, and a sharper decrease is visible in the afternoon, with both disruptions aligning with the twice daily drops in traffic discussed above.
These observations support the conjecture that the Algerian government is likely taking a more nuanced approach to restricting access to content, interfering in some fashion with TCP-based traffic. The conjecture is also supported by an internal tool that helps to understand connection tampering that is based on research co-designed and developed by members of the Cloudflare Research team. We will be launching insights into TCP connection tampering on Cloudflare Radar later in 2024 and, in the meantime, technical details can be found in the peer-reviewed paper titled Global, Passive Detection of Connection Tampering.
The graph below, taken from the internal tool, highlights observed TCP connection tampering in connections from Algeria during the week that the Baccalaureate exams took place. While some baseline level of post-ACK and post-PSH tampering is consistently visible, we see significant increases in post-ACK twice a day during the exam period, at the times that align with the shifts in traffic discussed above. Technical descriptions of post-ACK and post-PSH tampering can be found in the Cloudflare Radar glossary, but in short, tampering post-ACK means an established TCP connection to Cloudflare’s server has been abruptly ended by one or more RST packets before the server sees data packets. Although clients do use RSTs, clients are more likely to close connections with a FIN (as specified by the RFC). The RST method can also be used by middleboxes that (i) sees the data packet, then (ii) drops the data packet, then (iii) sends an RST to the server to force the server to close the connection (and very likely another RST to the client too for the same reason). Tampering post-PSH means that something on the path, like a middlebox, (i) saw something it didn’t like on an established connection, then (ii) permitted the data to pass but then, (iii) it sends the RST to force endpoints to close the connection.
Looking beyond Cloudflare-sourced data, aggregated test results from the Open Observatory of Network Interference (OONI) also show evidence of anomalous behavior. Using OONI Probe, a mobile and desktop app, can probe for potential blocking of websites, instant messaging apps, and censorship circumvention tools. Examining test results from users in Algeria for popular messaging platforms WhatsApp, Telegram, Signal, and Facebook Messenger for the first two weeks of June, we clearly see the appearance of test results marked as “Anomaly” starting on June 9. (OONI defines “Anomaly” results as “Measurements that provided signs of potential blocking”.) OONI Tor testresults also show a similar “Anomaly” pattern. Anomalous traffic patterns are also visible for Google Web Search, YouTube, and GMail.
Although the analysis of these observations and data sets doesn’t provide us with specific details around exactly how the observed Internet disruptions are being implemented, it strongly supports the supposition that network providers in Algeria are, in some fashion, interfering with TCP connections, but not blocking them outright nor shutting down their networks completely. Given that popular messaging platforms, Google properties, Cloudflare’s 1.1.1.1 DNS resolver, and some number of Cloudflare customer sites all appear to be impacted, it suggests that a list of hostnames are being targeted for disruption/interference, either by the SNI or the destination IP address.
Conclusion
Perhaps recognizing the broad negative impact that brute-force nationwide Internet shutdowns have as a response to cheating on exams, some governments appear to be turning to more nuanced techniques, such as content blocking or connection tampering. However, because these are widely applied as well, they are arguably just as disruptive as a full nationwide Internet shutdown. The cause of full shutdowns, such as those seen in Syria, are arguably easier to diagnose than the disruptions to connectivity seen in Iraq and Algeria, which appear to use approaches that are hard to specifically identify from the outside.
On Sunday, May 12, issues with the ESSAy and Seacom submarine cables again disrupted connectivity to East Africa, impacting a number of countries previously affected by a set of cable cuts that occurred nearly three months earlier.
Already suffering from reduced capacity due to the February cable cuts, these countries were impacted by a second set of cable cuts that occurred on Sunday, May 12. According to a social media post from Ben Roberts, Group CTIO at Liquid Intelligent Technologies in Kenya, faults on the EASSy and Seacom cables again disrupted connectivity to East Africa, as he noted “All sub sea capacity between East Africa and South Africa is down.” A BBC article citing Roberts stated that the EASSy cable had been cut approximately 45km (28 miles) north of the South African port city of Durban. A subsequent press release issued by the Communications Authority of Kenya stated that the cut had occurred at the Mtunzini teleport station (in South Africa). As seen in the map below, both the EASSy and Seacom cables land in Mtunzini.
Map of African undersea cables, April 2024. Source: https://manypossibilities.net/african-undersea-cables/
Impacts to country-level Internet traffic
Cloudflare Radar saw traffic levels across a number of the impacted countries drop just before 11:00 local time (08:00 UTC). As seen in the graphs below, the magnitude of impact varied by country, with traffic initially dropping by 10-25% in Kenya, Uganda, Madagascar, and Mozambique, while traffic in Rwanda, Malawi, and Tanzania dropped by one-third or more as compared to the previous week.
In Kenya and Uganda, the overall impact appeared to be low, with traffic generally remaining just below expected levels in the day and a half following the cable faults. In the other countries, the overnight trough of the diurnal traffic patterns remained consistent with the previous week’s traffic levels, but otherwise traffic remains significantly lower than expected.
The importance of redundancy
In Kenya, the impact may have been nominal due to steps taken by providers like Safaricom and Airtel Kenya. In a May 12 social media post, Safaricom noted “…We have since activated redundancy measures to minimise service interruption and keep you connected as we await the full restoration of the cable.” In a subsequent social media post on May 13, Safaricom noted “Thanks to our redundancy plans and capacity investment across multiple undersea cables our services continue to be available, however some customers may experience slow connectivity and speeds.” Similarly, a social media post from Airtel Kenya noted “Following yesterday’s undersea fiber cut that has impacted internet connectivity, we would like to update you that we have taken measures to improve your browsing experience through additional capacity enhancement.”
Similarly, the previously referenced press release from the Communications Authority of Kenya talked about actions being taken, stating “Meanwhile, the Authority has directed service providers to take proactive steps to secure alternative routes for their traffic and is monitoring the situation closely to ensure that incoming and outbound internet connectivity is available. The East Africa Marine System (TEAMS) cable, which has not been affected by the cut, is currently being utilised for local traffic flow while redundancy on the South Africa route has been activated to minimize the impact.”
What’s next?
Once the necessary permits are secured and the cable faults are located, repairs can often be completed in several days. However, because cable repair ships are something of a scarce resource, there is often a delay to both engage a vessel and for it to travel to the area where the cable damage occurred, whether from its baseport or the location of a previous repair. However, in this case that delay may be comparatively short, as submarine cable industry observer @philBE2 predicts “Expecting the usual suspect, CS Leon Thevenin, now moored in Cape Town, to be swiftly mobilized for an expeditious repair mission…”
Cloudflare’s network spans more than 310 cities in over 120 countries, where we interconnect with over 13,000 network providers in order to provide a broad range of services to millions of customers. The breadth of both our network and our customer base provides us with a unique perspective on Internet resilience, enabling us to observe the impact of Internet disruptions. Thanks to recently released Cloudflare Radar functionality, this quarter we have started to explore the impact from a routing perspective, as well as a traffic perspective, at both a network and location level.
The first quarter of 2024 kicked off with quite a few Internet disruptions. Damage to both terrestrial and submarine cables caused problems in a number of locations, while military action related to ongoing geopolitical conflicts impacted connectivity in other areas. Governments in several African countries, as well as Pakistan, ordered Internet shutdowns, focusing heavily on mobile connectivity. Malicious actors known as Anonymous Sudan claimed responsibility for cyberattacks that disrupted Internet connectivity in Israel and Bahrain. Maintenance and power outages forced users offline, resulting in observed drops in traffic. And in a more unusual turn, RPKI, DNS, and DNSSEC issues were among the technical problems that disrupted connectivity for subscribers across multiple network providers.
As we have noted in the past, this post is intended as a summary overview of observed disruptions, and is not an exhaustive or complete list of issues that have occurred during the quarter.
Cable cuts
Moov Africa Tchad
Reported fiber optic cable damage that occurred in Cameroon on January 10 further disrupted connectivity for customers of AS327802 (Moov Africa Tchad / Millicom) a telecommunications provider in Chad. According to a (translated) Facebook post from Moov Africa Tchad, “On the afternoon of January 10, 2024, there was a breakdown of the internet due to a cut in the optical fiber coming from Cameroon through which Chad has access to the internet, the one coming from Sudan being unavailable for a while.” It is unclear whether the referenced cable cut occurred in Cameroon or Chad, and the mentioned Sudan cable issue may be the one covered in our Q4 2023 summary post. As a landlocked country, Chad is dependent on terrestrial Internet connections to/through neighboring countries, and the AfTerFibre cable map illustrates Chad’s reliance on limited cable paths through Cameroon and Sudan.
The graphs below show that Moov Africa Tchad traffic was disrupted for over 12 hours starting midday (UTC) on January 10, and the disruption was visible at a country level as well. The fiber cut also resulted in significant volatility from a routing perspective, as the volume of announced IPv4 address space shifted frequently at a network and country level during the disruption.
On February 15, a brief (~30 minute) but complete significant Internet disruption was observed at AS37577 (Orange Burkina Faso). According to the translation of a communiqué posted by the provider on social media, “The incident is due to a fiber cut, which causes a disruption of Internet services for certain customers.” Orange did not specify whether it was a more localized fiber cut, or damage to one of the terrestrial fibers that cross the country. The incident took the network completely offline, as the ASN’s amount of announced IPv4 address space dropped to zero for the duration.
MTN Nigeria
MTN Nigeria turned to social media on February 28 to let customers know that “You have been experiencing challenges connecting to the network due to a major service outage caused by multiple fibre cuts, affecting voice and data services.” A published report described the impact, noting “Millions of customers nationwide were impacted by the hours-long outage, especially in Lagos.” Connectivity was disrupted for approximately seven hours between 13:30 – 20:30 local time (12:30 – 19:30 UTC), and the provider posted a followup note just before midnight local time stating that service had been fully restored.
Digicel Haiti
A 16-hour Internet disruption on March 2/3 at AS27653 (Digicel Haiti) was due to a double fiber cut as a result of violence related to attempts to oust Prime Minister Ariel Henry. Starting around 22:00 local time on March 2 (03:00 on March 3), a complete outage was observed for approximately nine hours. Some recovery in traffic occurred for approximately two-and-a-half hours, followed by a three hour near-complete disruption. Digicel Haiti effectively disappeared from the Internet during the nine-hour outage, as no IPv4 or IPv6 address space was announced by the network during that time.
SKY (Philippines)
A brief traffic disruption observed on AS23944 (SKY) in the Philippines on March 18 was likely related to a fiber cut. In an advisory posted by SKY on social media, they stated that “SKY services in several areas in Marikina, Pasig and Quezon City are currently affected by a cut-fiber issue”, listing 45 affected areas. Traffic was most significantly impacted between 20:00 – 21:00 local time (12:00 – 13:00 UTC), although full recovery took several more hours. Only a minor impact to routing resulting from the fiber cut was observed.
Multiple African countries
On March 14, damage to multiple submarine cables off the west coast of Africa impacted Internet connectivity across multiple countries in West and Southern Africa. The damage was reportedly caused by underwater rock falls, and in addition to disrupting Internet connectivity, also caused availability issues for Microsoft Azure and Office 365 cloud services.
Comparatively brief disruptions were observed in Niger, Guinea, and Gambia, lasting from under an hour to approximately two hours.
However, the disruptions stretched out across multiple days in countries including Togo, Liberia, and Ghana, where it took several weeks for traffic to return to previously observed peak levels.
Operators in impacted countries attempted to maintain availability by shifting traffic to Google’s Equiano submarine cable, which reportedly experienced a 4x increase in traffic, and Morocco’sMaroc Telecom West Africa submarine cable. Service on the SAT-3 cable was fully restored as of April 6, with repairs on ACE completed on April 17, repairs to WACS and MainOne expected to be done by April 28.
On February 24, three submarine cables that run through the Red Sea were damaged: the Seacom/Tata cable, the Asia Africa Europe-1 (AAE-1), and the Europe India Gateway (EIG). It is believed that the cables were cut by the anchor of the Rubymar, a cargo ship that was damaged by a ballistic missile on February 18. At the time of the disruption, Seacom confirmed the damage to their cable, while the owners of the other two cables did not publish similar confirmations.
On February 2, Cloudflare observed a loss of traffic at AS15706 (Sudatel) and AS36972 (MTN Sudan), with a similar loss occurring on February 7 at AS36998 (Zain Sudan / SDN Mobitel). The disruption at MTN Sudan aligns with a social media post from the provider, in which they stated (translated) “We regret the interruption of all services due to circumstances beyond our control. While we apologize for the inconvenience caused by this interruption, we assure you of our endeavor to restore the service as soon as possible, and you will be notified of the return of the service.” On February 5, several days after their outage started, Zain Sudan published a social media post that stated (translated) “Zain Sudan has been constantly striving to maintain communication and Internet service to serve its valued subscribers, and we would like to point out that the current network outage is due to circumstances beyond its control, with our hopes that safety will prevail, and that service will be restored as soon as possible.” Sudatel did not share any information about the status of its network. On February 4, Digital Rights Lab – Sudan posted on social media that “Our sources confirmed that @RSFSudan forces tookover data centers of ISPs in Khartoum, #Sudan.” It is likely that the Internet outages observed across these providers are related to these takeovers, part of the military conflict that has been underway in the country since April 15, 2023.
The disruptions on these networks varied in length. At Sudatel, traffic started to return on February 11. At Zain Sudan, traffic began to return on March 3, corroborated by a social media post that stated (translated) “Zain network is gradually returning to work and allows its subscribers to communicate for free for a limited time. Zain promises to continue working to restore its network in the rest of the states.” Traffic had not yet returned on MTN Sudan by the end of the first quarter.
Ukraine
In February, the Ukraine/Russia war reached the two-year mark, and over that time, we have covered a number of Internet outages in Ukraine caused by conflict-related attacks. On February 22, Russian air strikes on critical infrastructure in Ukraine damaged energy facilities across the country, resulting in widespread power outages. These power outages caused Internet disruptions across multiple regions in Ukraine, including Kharkiv, Zaporizhzhia, Odessa, Dnipropetrovsk Oblast, and Khmelnytskyi Oblast. Traffic initially dropped around 05:00 local time (03:00 UTC), falling as much as 68% in Kharkiv. However, all regions saw lower traffic levels for several days as compared to the week before.
The associated outages during the quarter varied in length, from just a few hours to over a week. Each outage is shown in the graphs below, which show Paltel traffic within four Palestinian governorates in the Gaza Strip region. While it appears that the Gaza governorate suffered a disruption to traffic as connectivity remained available, complete outages occurred in the Khan Yunis, Rafah, and Deir al-Balah governorates.
January 12-19
January 22-24
March 5
Cyberattacks
In addition to the previously discussed cyberattack that impacted connectivity for AS327802 (Moov Africa Tchad / Millicom) on January 11, several other observed Internet disruptions were caused by cyberattacks in the first quarter.
Anonymous Sudan also reportedly targeted AS31452 (Zain Bahrain) with a cyber attack. This attack appeared to be less severe than the one that targeted HotNet in Israel, but it also lasted significantly longer, with traffic disrupted between 20:45 on March 3 and 18:15 on March 4 local time (17:45 on March 3 to 15:15 on March 4 UTC). No impact to announced IP address space was observed. Zain Bahrain acknowledged the connectivity disruption in a social media post on March 4, noting (translated) “We would like to inform you that some customers may encounter difficulties in using some of our services. Our technical team works to avoid these difficulties as quickly as possible.”
Multiple networks in Ukraine
On March 13, an attack targeted a number of Ukrainian telecommunications providers, including AS16066 (Triangulum), AS34359 (Link Telecom Ukraine), AS197522 (Kalush Information Network), AS52074 (Mandarun), and AS29013 (LinkKremen). Triangulum appeared to be the most significantly impacted, experiencing a near complete loss of traffic between March 13 and March 20, as seen below. Triangulum posted a notice on its website, noting in part “On March 13, 2024, a hacker attack was carried out on a number of Ukrainian providers. At 10:28 a.m. on March 13, 2024, a large-scale technical failure occurred on our Company’s network, as a result of which it became impossible to provide electronic communication services. The Company’s employees, together with employees of the Cyber Police and the National Cyber Security Coordination Center, are taking comprehensive measures around the clock aimed at restoring the entire range of services as soon as possible. Services are being restored gradually. Full recovery may take several days.”
Other affected providers experienced comparatively shorter connectivity disruptions. The near complete outage at Mandarun lasted approximately a day, while the others saw outages lasting around seven hours, starting around 11:30 local time (09:30 UTC) on March 13, with connectivity returning to typical levels around 08:00 local time (06:00 UTC) on March 14.
Government directed
Comoros
Following protests against the re-election of President Azali Assoumani, authorities in Comorosreportedly shut down Internet connectivity on January 17. While some disruption was visible to traffic at a country level between 12:00 local time on January 17 (09:00 UTC) and 17:30 local time on January 19 (14:30 UTC), it was significantly more noticeable in the traffic from AS36939 (Comores Telecom), which saw several periods of near-complete outage across the two-day span. Although Comores Telecom announces a limited amount of IPv4 address space, it saw significant volatility on January 17 & 18, dropping to zero several times.
Sudatel Senegal/Expresso Telecom and Tigo/Free (Senegal)
On February 4, the Minister of Communication, Telecommunications, and Digital Affairs in Senegalordered the suspension of mobile Internet connectivity starting at 22:00 local time (22:00 UTC). The suspension followed protests that erupted in the wake of the postponement of the presidential election. Traffic from AS37196 (Sudatel Senegal/Expresso Telecom) fell sharply at the time the suspension went into effect, recovering around 07:30 local time (07:30 UTC) on February 7. Traffic from AS37649 (Tigo/Free) fell at around 09:30 local time (09:30 UTC) on February 5, with the provider notifying subscribers of the suspension via social media. Traffic on Tigo/Free recovered around midnight local time (00:00 UTC) on February 7, and the provider again used social media to inform subscribers of service availability. No changes were observed to announced IP address space for either provider, indicating that the suspension of mobile Internet connectivity was not done at a routing level.
A little more than a week later, on February 13, the government in Senegal again ordered the suspension of mobile Internet connectivity in an effort to prevent “the spread of hateful and subversive messages online.” ahead of a march planned by activist groups which aimed to express dissent against the postponement of the presidential election. The mobile Internet shutdown was most visible on Tigo/Free, which saw a significant disruption between 10:15 and 19:45 local time (10:15 – 19:45 UTC).
Pakistan
According to a published report, The Pakistan Telecommunication Authority (PTA) said that Internet services would remain available as citizens went to the polls on February 8 to elect a new government. However, on that day, Pakistani authorities cut mobile Internet access across the country as the nation’s voters went to cast their ballots, with the authorities attributing the move “to maintain law and order” in the wake of the violence that occurred the previous day. The impact of the ordered shutdown was visible across multiple Internet providers in Pakistan, including AS59257 (Zong/CMPak), AS24499 (Telenor Pakistan), and AS45669 (Jazz/Mobilink), lasting from 07:00 until 20:00 (02:00 – 15:00 UTC), with traffic returning to expected levels approximately nine hours later. A post on the Internet Society’s Pulse blog estimated that the shutdown cost Pakistan nearly USD $18.5M in lost Gross Domestic Product.
Chad
Several Internet disruptions were observed in Chad between February 28 and March 7. The first one started at 10:45 local time on February 28 and lasted until 18:00 local time on March 1 (09:45 on February 28 – 17:00 on March 1). Shorter disruptions lasting just a few hours each were also observed on March 3, 4, and 7. The apparent shutdowns came in the wake of political violence in the country. Notable drops in announced IPv4 address space aggregated across networks in the country were observed coincident with the February 28, March 3, and March 4 shutdowns, although it isn’t clear why a similar drop did not occur on March 7.
Power outages
Tajikistan
According to a published report, a widespread multi-hour power outage occurred in Tajikistan on March 1, possibly related to increased electricity usage by electric heaters as temperatures across the country neared freezing. The outage began around 11:00 local time (06:00 UTC), and lasted for approximately three hours. The impact on Internet traffic from the country is visible in the graph below. Although power was restored around 14:00 local time (09:00 UTC), Internet traffic did not return to expected levels until around 05:00 local time the next day (midnight UTC on March 2).
Although power outages most often have the biggest impact on Internet traffic, as computers and home/office routers shut down, this outage also appeared to impact network infrastructure within the country, as the aggregate volume of announced IPv4 address space across the country dipped slightly when the power was out.
Tanzania
On March 4, the Tanzania Electricity Corporation (TANESCO)posted a notice on social media regarding an ongoing power outage. It stated (translated) “The Tanzania Electricity Corporation (TANESCO) has notified the public that there has been an error in the National Grid system, resulting in a lack of electricity service in some areas of the country including Zanzibar. Our experts are continuing their efforts to ensure that the electricity service returns to its normal state. The organization apologizes for any inconvenience caused.” The power outage disrupted Internet connectivity in Tanzania, causing an observed drop in traffic between 13:30 and 23:00 local time (10:30 – 20:00 UTC).
Technical problems
Orange España
Network routing is the process of selecting a path across one or more networks, and on the Internet, routing relies on the Border Gateway Protocol (BGP). Historically, the exchange of BGP routing information was based on trust between providers, but over time, security mechanisms such as Resource Public Key Infrastructure (RPKI) have been developed to prevent abuse of the system by bad actors. RPKI is a cryptographic method of signing records that associate a BGP route announcement with the correct originating AS number. ROA (Route Origin Authorization) records provide a means of verifying that an IP address block holder has authorized an AS (Autonomous System) to originate routes to that one or more prefixes within the address block. Cloudflare has published a number of blog posts over the years about the importance of, and our support for, RPKI. Properly implemented and configured, RPKI and ROAs help support routing security, effectively preventing behavior like BGP hijacking.
Because Cloudflare enforces RPKI validation, we also rejected the RPKI-invalid routes. We would have started trying to reach Orange España over our default route toward some of our transit providers, but because they also perform RPKI validation, traffic would have been dropped within those provider networks as well. Because of this, from Cloudflare’s perspective, this incident caused a drop in traffic from Orange España between 16:45 and 19:45 local time (14:45 – 17:45 UTC) as well as a notable drop in announced IPv4 address space from AS12479.
On January 11, subscribers of AS34700 (MaxNet) in Ukraine experienced a nine-hour Internet outage. Initial traffic loss occurred around 16:00 local time (14:00 UTC), and recovered around 01:00 local time on January 12 (23:00 UTC on January 11). An initial social media post from the provider explained the reason for the outage, noting (translated) “Dear subscribers! Due to the flooding of one of the hub sites due to a utility malfunction, some areas of the city may be without services, partially or completely. We are doing our best to restore services, but it takes time. Further information regarding the opening times will be published as soon as the emergency works have been completed.” A subsequent post informed subscribers that Internet connectivity had been restored. The flooding apparently impacted core routing infrastructure as well, as the volume of IPv4 address space announced by MaxNet also fell to zero between 16:00 and 22:00 local time (14:00 – 20:00 UTC).
Plusnet (United Kingdom)
A traffic disruption observed on AS6871 (Plusnet) in the United Kingdom on January 15 was initially characterized as a “mass outage” by the provider in replies to customer complaints on social media. However, the underlying cause of the disruption turned out to be significantly less sensational – it was apparently linked to problems with their DNS servers. Because subscribers were unable to successfully resolve hostnames using Plusnet’s default DNS resolvers, this ultimately manifested itself as a drop in traffic from the network for approximately two hours, between 16:00 and 18:00 local time (and UTC). Users that had configured their systems to use a third-party DNS resolver, such as Cloudflare’s 1.1.1.1 service, did not experience a service disruption.
Russia
DNS issues also impacted users in Russia during January, though in a different way than Plusnet subscribers in the UK experienced. A reportedDNSSEC failure on January 30 resulted in .ru domains becoming inaccessible for several hours. (DNSSEC creates a secure domain name system by adding cryptographic signatures to existing DNS records. By checking its associated signature, you can verify that a requested DNS record comes from its authoritative name server and wasn’t altered en-route, as opposed to a fake record injected in a man-in-the-middle attack.)
The DNSSEC validation failure resulted in SERVFAIL responses to DNS lookups against Cloudflare’s 1.1.1.1 resolver for hostnames in the .ru country code top level domain (ccTLD). At peak, 68.4% of requests received SERVFAIL responses. The Coordination Center for the .ru ccTLD confirmed that it was working on the “technical problem affecting the .ru zone associated with the global DNSSEC infrastructure” but didn’t provide any additional details around the root cause of the problem, such as a potential issue with a DNSSEC key rollover. The .ru ccTLD experienced a similar DNSSEC-related outage for several hours on August 16, 2019, as well.
AT&T (United States)
Starting just before 04:00 Eastern / 03:00 Central (09:00 UTC) on February 22, AT&T subscribers in several cities across the United States experienced mobile service interruptions. Impacted cities included Atlanta, Houston, and Chicago, with connectivity disrupted for approximately eight hours. Cloudflare data showed that as the problem began, AT&T (AS7018) traffic dropped as much as 45% in Chicago and 18% in Dallas, as compared with the previous week.
According to a “network update” published by AT&T, “Based on our initial review, we believe that today’s outage was caused by the application and execution of an incorrect process used as we were expanding our network, not a cyber attack.”
Just before noon local time (05:15 UTC) on March 12, a significant drop in traffic was observed on AS136442 (Ocean Wave), a consumer fiber and business Internet service provider in Myanmar. A (translated) social media post from the provider noted “Ocean Wave customers, please be informed that there will be no internet/ slow connection due to network maintenance.” The connectivity disruption lasted approximately seven hours, with traffic returning to typical levels just before 19:00 local time (12:15 UTC).
Conclusion
Two notable submarine cable damage events during the first quarter again highlighted the importance of protecting submarine cables, and the risks associated with them passing through/near geopolitically sensitive areas. Given the reliance on submarine cables for carrying Internet traffic, this will continue to be an issue for many years to come.
The Orange España incident also shed light on the importance of securing operationally important resources with multi-factor authentication, a topic that Cloudflare has written about in the past. Organizations like RIPE play a critically important behind-the-scenes role in functioning of the Internet, arguably obligating them to take all practical precautions when it comes to securing their systems in order to prevent malicious actors from taking actions that could broadly disrupt Internet connectivity.
Here’s a post we never thought we’d need to write: less than five months after one of our major data centers lost power, it happened again to the exact same data center. That sucks and, if you’re thinking “why do they keep using this facility??,” I don’t blame you. We’re thinking the same thing. But, here’s the thing, while a lot may not have changed at the data center, a lot changed over those five months at Cloudflare. So, while five months ago a major data center going offline was really painful, this time it was much less so.
This is a little bit about how a high availability data center lost power for the second time in five months. But, more so, it’s the story of how our team worked to ensure that even if one of our critical data centers lost power it wouldn’t impact our customers.
On November 2, 2023, one of our critical facilities in the Portland, Oregon region lost power for an extended period of time. It happened because of a cascading series of faults that appears to have been caused by maintenance by the electrical grid provider, climaxing with a ground fault at the facility, and was made worse by a series of unfortunate incidents that prevented the facility from getting back online in a timely fashion.
If you want to read all the gory details, they’re available here.
It’s painful whenever a data center has a complete loss of power, but it’s something that we were supposed to expect. Unfortunately, in spite of that expectation, we hadn’t enforced a number of requirements on our products that would ensure they continued running in spite of a major failure.
That was a mistake we were never going to allow to happen again.
Code Orange
The incident was painful enough that we declared what we called Code Orange. We borrowed the idea from Google which, when they have an existential threat to their business, reportedly declares a Code Yellow or Code Red. Our logo is orange, so we altered the formula a bit.
Our conception of Code Orange was that the person who led the incident, in this case our SVP of Technical Operations, Jeremy Hartman, would be empowered to charge any engineer on our team to work on what he deemed the highest priority project. (Unless we declared a Code Red, which we actually ended up doing due to a hacking incident, and which would then take even higher priority. If you’re interested, you can read more about that here.)
After getting through the immediate incident, Jeremy quickly triaged the most important work that needed to be done in order to ensure we’d be highly available even in the case of another catastrophic failure of a major data center facility. And the team got to work.
How’d we do?
We didn’t expect such an extensive real-world test so quickly, but the universe works in mysterious ways. On Tuesday, March 26, 2024, — just shy of five months after the initial incident — the same facility had another major power outage. Below, we’ll get into what caused the outage this time, but what is most important is that it provided a perfect test for the work our team had done under Code Orange. So, what were the results?
First, let’s revisit what functions the Portland data centers at Cloudflare provide. As described in the November 2, 2023, post, the control plane of Cloudflare primarily consists of the customer-facing interface for all of our services including our website and API. Additionally, the underlying services that provide the Analytics and Logging pipelines are primarily served from these facilities.
Just like in November 2023, we were alerted immediately that we had lost connectivity to our PDX01 data center. Unlike in November, we very quickly knew with certainty that we had once again lost all power, putting us in the exact same situation as five months prior. We also knew, based on a successful internal cut test in February, how our systems should react. We had spent months preparing, updating countless systems and activating huge amounts of network and server capacity, culminating with a test to prove the work was having the intended effect, which in this case was an automatic failover to the redundant facilities.
Our Control Plane consists of hundreds of internal services, and the expectation is that when we lose one of the three critical data centers in Portland, these services continue to operate normally in the remaining two facilities, and we continue to operate primarily in Portland. We have the capability to fail over to our European data centers in case our Portland centers are completely unavailable. However, that is a secondary option, and not something we pursue immediately.
On March 26, 2024, at 14:58 UTC, PDX01 lost power and our systems began to react. By 15:05 UTC, our APIs and Dashboards were operating normally, all without human intervention. Our primary focus over the past few months has been to make sure that our customers would still be able to configure and operate their Cloudflare services in case of a similar outage. There were a few specific services that required human intervention and therefore took a bit longer to recover, however the primary interface mechanism was operating as expected.
To put a finer point on this, during the November 2, 2023, incident the following services had at least six hours of control plane downtime, with several of them functionally degraded for days.
API and Dashboard Zero Trust Magic Transit SSL SSL for SaaS Workers KV Waiting Room Load Balancing Zero Trust Gateway Access Pages Stream Images
During the March 26, 2024, incident, all of these services were up and running within minutes of the power failure, and many of them did not experience any impact at all during the failover.
The data plane, which handles the traffic that Cloudflare customers pass through our 300+ data centers, was not impacted.
Our Analytics platform, which provides a view into customer traffic, was impacted and wasn’t fully restored until later that day. This was expected behavior as the Analytics platform is reliant on the PDX01 data center. Just like the Control Plane work, we began building new Analytics capacity immediately after the November 2, 2023, incident. However, the scale of the work requires that it will take a bit more time to complete. We have been working as fast as we can to remove this dependency, and we expect to complete this work in the near future.
Once we had validated the functionality of our Control Plane services, we were faced yet again with the cold start of a very large data center. This activity took roughly 72 hours in November 2023, but this time around we were able to complete this in roughly 10 hours. There is still work to be done to make that even faster in the future, and we will continue to refine our procedures in case we have a similar incident in the future.
How did we get here?
As mentioned above, the power outage event from last November led us to introduce Code Orange, a process where we shift most or all engineering resources to addressing the issue at hand when there’s a significant event or crisis. Over the past five months, we shifted all non-critical engineering functions to focusing on ensuring high reliability of our control plane.
Teams across our engineering departments rallied to ensure our systems would be more resilient in the face of a similar failure in the future. Though the March 26, 2024, incident was unexpected, it was something we’d been preparing for.
The most obvious difference is the speed at which the control plane and APIs regained service. Without human intervention, the ability to log in and make changes to Cloudflare configuration was possible seven minutes after PDX01 was lost. This is due to our efforts to move all of our configuration databases to a Highly Available (HA) topology, and pre-provision enough capacity that we could absorb the capacity loss. More than 100 databases across over 20 different database clusters simultaneously failed out of the affected facility and restored service automatically. This was actually the culmination of over a year’s worth of work, and we make sure we prove our ability to failover properly with weekly tests.
Another significant improvement is the updates to our Logpush infrastructure. In November 2023, the loss of the PDX01 datacenter meant that we were unable to push logs to our customers. During Code Orange, we invested in making the Logpush infrastructure HA in Portland, and additionally created an active failover option in Amsterdam. Logpush took advantage of our massively expanded Kubernetes cluster that spans all of our Portland facilities and provides a seamless way for service owners to deploy HA compliant services that have resiliency baked in. In fact, during our February chaos exercise, we found a flaw in our Portland HA deployment, but customers were not impacted because the Amsterdam Logpush infrastructure took over successfully. During this event, we saw that the fixes we’d made since then worked, and we were able to push logs from the Portland region.
A number of other improvements in our Stream and Zero Trust products resulted in little to no impact to their operation. Our Stream products, which use a lot of compute resources to transcode videos, were able to seamlessly hand off to our Amsterdam facility to continue operations. Teams were given specific availability targets for the services and were provided several options to achieve those targets. Stream is a good example of a service that chose a different resiliency architecture but was able to seamlessly deliver their service during this outage. Zero Trust, which was also impacted in November 2023, has since moved the vast majority of its functionally to our hundreds of data centers, which kept working seamlessly throughout this event. Ultimately this is the strategy we are pushing all Cloudflare products to adopt as our 300+ data centers provide the highest level of availability possible.
What happened to the power in the data center?
On March 26, 2024, at 14:58 UTC, PDX01 experienced a total loss of power to Cloudflare’s physical infrastructure following a reportedly simultaneous failure of four Flexential-owned and operated switchboards serving all of Cloudflare’s cages. This meant both primary and redundant power paths were deactivated across the entire environment. During the Flexential investigation, engineers focused on a set of equipment known as Circuit Switch Boards, or CSBs. CSBs are likened to an electrical panel board, consisting of a main input circuit breaker and series of smaller output breakers. Flexential engineers reported that infrastructure upstream of the CSBs (power feed, generator, UPS & PDU/transformer) was not impacted and continued to act normally. Similarly, infrastructure downstream from the CSBs such as Remote Power Panels and connected switchgear was not impacted – thus implying the outage was isolated to the CSBs themselves.
Initial assessment of the root cause of Flexential’s CSB failures points to incorrectly set breaker coordination settings within the four CSBs as one contributing factor. Trip settings which are too restrictive can result in overly sensitive overcurrent protection and the potential nuisance tripping of devices. In our case, Flexential’s breaker settings within the four CSBs were reportedly too low in relation to the downstream provisioned power capacities. When one or more of these breakers tripped, a cascading failure of the remaining active CSB boards resulted, thus causing a total loss of power serving Cloudflare’s cage and others on the shared infrastructure. During the triage of the incident, we were told that the Flexential facilities team noticed the incorrect trip settings, reset the CSBs and adjusted them to the expected values, enabling our team to power up our servers in a staged and controlled fashion. We do not know when these settings were established – typically, these would be set/adjusted as part of a data center commissioning process and/or breaker coordination study before customer critical loads are installed.
What’s next?
Our top priority is completing the resilience program for our Analytics platform. Analytics aren’t simply pretty charts in a dashboard. When you want to check the status of attacks, activities a firewall is blocking, or even the status of Cloudflare Tunnels – you need analytics. We have evidence that the resiliency pattern we are adopting works as expected, so this remains our primary focus, and we will progress as quickly as possible.
There were some services that still required manual intervention to properly recover, and we have collected data and action items for each of them to ensure that further manual action is not required. We will continue to use production cut tests to prove all of these changes and enhancements provide the resiliency that our customers expect.
We will continue to work with Flexential on follow-up activities to expand our understanding of their operational and review procedures to the greatest extent possible. While this incident was limited to a single facility, we will turn this exercise into a process that ensures we have a similar view into all of our critical data center facilities.
Once again, we are very sorry for the impact to our customers, particularly those that rely on the Analytics engine who were unable to access that product feature during the incident. Our work over the past four months has yielded the results that we expected, and we will stay absolutely focused on completing the remaining body of work.
Internet connectivity in several African countries was disrupted today, March 14, 2024. Beginning at approximately 05:00 UTC, west and central African countries were most impacted, as was South Africa. Based on published reports and social media posts from impacted network providers, the disruption is believed to be due to multiple undersea cable failures in the region. From The Gambia to Côte d’Ivoire, including a major network in South Africa (Vodacom), a total of 11 African countries were impacted, based on our observations.
Cloudflare Radar data shows a pattern of disruptions from the north to the south of West Africa over time. It began south of Senegal, with The Gambia, Guinea, and Liberia experiencing disruptions around 05:00 UTC.
In The Gambia and Guinea, the disruptions lasted about 30 minutes, while in Liberia, the disruption has lasted more than 12 hours.
Moving south, around 07:30 UTC, disruptions were observed in Côte d’Ivoire and Ghana.
Niger, a landlocked nation in Central Africa, experienced a disruption at 09:15, lasting just over two hours.
This was followed by disruptions starting around 10:30 UTC in Nigeria, Benin, Cameroon, and Togo. These disruptions were ongoing at the time of writing.
At approximately the same time, a significant disruption was observed on Vodacom’s South African network (AS29975). Traffic began to recover after 13:30 UTC, and appears to have reached close to normal levels by 16:00 UTC.
The importance of submarine cables
This series of disruptions serves as a reminder of how dependent the Internet is on submarine cables, which are estimated to carry over 90% of intercontinental data traffic. Only a small percentage of general use is done via satellite networks. There are 529 active submarine cables and 1,444 landings that are currently active or under construction, running to an estimated 1.3 million km around the globe.
Reports from several local networks, including South Africa’s Vodacom, MTN in Nigeria, and Celtiis in Bénin, reference multiple submarine cable failures. Microsoft was more detailed, stating on their Azure status page that “multiple fiber cables on the West Coast of Africa — WACS, MainOne, SAT3, ACE — have been impacted which reduced total capacity supporting our Regions in South Africa”. The company also explains that the recent cable cuts in the Red Sea in combination with today’s cable issues, “has impacted all Africa capacity”.
In addition to the impacts to the Microsoft Azure cloud platform, the website of MainOne, owners of the MainOne submarine cable, was offline for several hours. DNS for mainone.net is handled by name servers located in MainOne’s address space. It appears that a portion of the IPv4 address space for AS37282 (MAINONE) stopped being announced between 07:30 and 15:00 UTC, and once this address space was being routed again, both the nameservers and website became reachable.
This map from TeleGeography highlights the impacted submarine cables: WACS (West Africa Cable System), MainOne, SAT-3/WASC, and ACE.
The disruptions are now being reported by news media outlets, including in South Africa, where the emphasis is not only on the latest outage but also on the problem with the submarine cable operator Seacom. This operator experienced a service-impacting outage on its cable system in the Red Sea. On March 8, the company stated that it is waiting for permits to start repairing its broken submarine cable in the Red Sea.
Cloudflare’s network spans more than 310 cities in over 120 countries, where we interconnect with over 13,000 network providers in order to provide a broad range of services to millions of customers. The breadth of both our network and our customer base provides us with a unique perspective on Internet resilience, enabling us to observe the impact of Internet disruptions.
During previous quarters, we tracked a number of government directed Internet shutdowns in Iraq, intended to prevent cheating on academic exams. We expected to do so again during the fourth quarter, but there turned out to be no need to, as discussed below. While we didn’t see that set of expected shutdowns, we did observe a number of other Internet outages and disruptions due to a number of commonly seen causes, including fiber/cable issues, power outages, extreme weather, infrastructure maintenance, general technical problems, cyberattacks, and unfortunately, military action. As we have noted in the past, this post is intended as a summary overview of observed disruptions, and is not an exhaustive or complete list of issues that have occurred during the quarter.
Government directed
Iraq
In a slight departure from the usual subject of this blog post, this time we lead off with coverage of government directed Internet shutdowns that didn’t happen. Iraq has been a frequent subject of this series of posts, as they have historically implemented daily multi-hour Internet shutdowns during exam periods, intended to prevent cheating. Earlier this year, there was some hope that this practice might be ending, and in our Q2 2023 Internet disruption summary post, we noted “In the weeks prior to the start of this year’s shutdowns, it was reported that the Iraqi Ministry of Communications had announced it had refused a request from the Ministry of Education to impose an Internet shutdown during the exams as part of efforts to prevent cheating. Unfortunately, this refusal was short-lived, with shutdowns ultimately starting two weeks later.” In addition to these second quarter shutdowns, they also occurred during the third quarter across multiple weeks in July, August, and September.
During the fourth quarter, the third round of 12th grade high school final exams was scheduled to begin on November 13 and end on November 21, taking place at 13:00 local time, as shown in the schedule below, which was published on the Iraqi Ministry of Education’s Facebook page.
November 2023 exam schedule in Iraq
However, in looking at Internet traffic for Iraq during that period, it appears that the nationwide Internet shutdowns that would have normally taken place did not occur, as the graph shows a very consistent diurnal pattern with no evidence of disruptions to Internet connectivity like we have seen in the past. Additionally, other civil society groups, academic researchers, and Internet analysts that also monitor these shutdowns did not report seeing any related drops in traffic. It is unclear whether a request for shutdowns was submitted by the Ministry of Education and again refused by the Ministry of Communications, or if no request was ever submitted for this round of exams. Regardless, we hope that Iraq continues to keep the Internet connected during future rounds of exams.
Military action
Palestine
On Saturday, October 7, 2023, attacks from the Palestinian group Hamas launched from the Gaza Strip against the south of Israel started a new conflict in the region, with Israel officially declaring the next day that it was at war. This had an almost immediate impact on Internet traffic in both Israel and Palestine, with traffic in the former showing ~170% growth as compared to the prior week, and ~100% growth in the latter as compared to the previous week. These trends are discussed in our October 9 blog post, Internet traffic patterns in Israel and Palestine following the October 2023 attacks.
On November 13, Telecom Namibia (AS36996)reported that it was experiencing interruptions to its fixed voice and data services in several areas, resulting from cable theft. The impact of these interruptions is shown in the figure below, with Internet traffic disrupted between 13:45 local time (11:45 UTC) on November 13 and 08:30 local time (06:30 UTC) on November 14. The disruption to connectivity due to cable theft was not an isolated incident, as the provider posted several additional notices on its social media accounts in November and December about similar occurrences.
Cuba
A day later, on November 14, ETECSA (AS27725)posted a notice about a terrestrial fiber cut that disrupted Internet services. As the state-owned telecommunications provider in Cuba, the cut impacted Internet traffic nationwide, as well as at a network level, as seen in the graphs below. The disruption was relatively short-lived, occurring between 06:30 – 08:15 local time (11:30 – 13:15 UTC), with a follow-up post announcing the re-establishment of Internet service.
Chad
On December 7 & 8, a near-complete outage observed in Chad was reportedly due to fiber optic cable cuts in neighboring countries. A published article cited SudaChad as claiming that the outage seen in the graphs below was due to an issue with CAMTEL, a Cameroonian partner. It also cites Moov Africa’s (formerly known as Millicom Chad)apology to customers, which points at “the fiber-optic cut in Cameroon and Sudan” as the root cause. Since simultaneous cuts in fiber optic cables in Chad’s two neighboring countries would certainly be an unusual occurrence, it isn’t clear if such an event happened, though routing data for SudaChad shows that the network’s two upstream providers are AS15706 (Sudatel) in Sudan and AS15964 (CAMNET) in Cameroon. The three providers are also partners on the WE-AFRICA-NA terrestrial cable, which stretches from Port-Sudan on the Red Sea in Sudan to Kribi on the Atlantic Ocean in Cameroon via Chad, but it isn’t known whether that cable system was involved in this outage.
The disruption lasted approximately fourteen hours, from 20:00 local time on December 7 until 10:15 local time on December 8 (19:00 UTC on December 7 until 09:15 UTC on December 8), with the impact visible country-wide, as well as at SudaChad and several downstream network providers.
Cyberattacks
Ukraine
Ukrainian Internet provider Kyivstar announced on the morning of December 12 that they were the “target of a powerful hacker attack”. They noted that the attack caused a “technical failure” that resulted in mobile communication and Internet access becoming temporarily unavailable. Although Kyivstar has been targeted by around 500 cyberattacks since Russia launched its invasion of Ukraine in February 2022, this was reportedly the largest attack to date. A subsequent report referenced an interview with Illia Vitiuk, the head of the cybersecurity department at Ukraine’s security service (SBU), in which he claimed that “the hackers attempted to penetrate Kyivstar in March 2023 or earlier, managed to get into the system at least as early as May, and likely gained full access to the network in November.”
Recovery took several days, with Kyivstar posting on December 15 that “the Internet is everywhere” but warning that connection speeds might be slightly reduced. These posts align with the traffic disruption shown in the figure below, which lasted from 06:30 local time (04:30 UTC) on December 12 until 14:00 local time (12:00 UTC) on December 15.
Power outages
Brunei
A major power outage in Brunei on October 17 disrupted key services including mobile and fixed Internet connectivity. Starting around 11:30 local time (03:30 UTC), traffic was disrupted for approximately 13 hours, recovering to expected levels around just after midnight local time on October 18 (16:45 UTC). Two Unified National Networksautonomous systems (AS10094 and AS131467) saw lower traffic volumes during the power outage.
Kenya
A widespread power outage in Kenya on November 11 disrupted Internet connectivity across the county for approximately seven hours. An X post from Kenya Power at 20:30 local time (17:30 UTC) reported a partial power outage, stating “We have lost power supply to parts of the country. Our engineers are working to restore supply to the affected areas.” Kenya Power kept customers informed of progress, posting updates at 22:00, 23:57, and the morning of November 12, with the final update reporting “We have successfully restored normal power supply in all the areas that were affected by the partial outage.”
Curaçao
On November 14, a Facebook post from Aqualectra, the water and power company in Curaçao, stated in part, “Around 14:00 this afternoon, a blackout occurred. Preliminary investigation indicates that one of the main cables responsible for transporting electricity between the substations at Nijlweg and Weis experienced a short circuit. It is important to emphasize that this is not due to a lack of production capacity.” The power outage resulted in a near complete loss of traffic at Flow Curaçao (AS52233), with significant disruptions also visible at United Telecommunication Services (AS11081) and at a country level, as seen in the graphs below. The disruption lasted eight hours, from 14:00 until 22:00 local time (18:00 UTC on November 14 until 02:00 UTC on November 15).
Sri Lanka
After stabilizing its electrical infrastructure in the wake of 2022’s problems with its electrical power grid, the failure of a main transmission line caused an island-wide power outage in Sri Lanka on December 9, in turn disrupting Internet connectivity. Traffic from the island nation initially dropped by around 50% starting around 16:45 local time (11:15 UTC). Repairs took several hours, with the country’s Internet traffic returning to expected levels around 01:00 local time on December 10 (19:30 UTC).
Panama
On the morning of December 24, Panamanian electric distribution company ENSAinitially reported an event that affected electrical services to their customers. A subsequent report posted just 30 minutes later provided additional details, pointing to an incident in the “National Interconnected System” that affected the electrical supply in a number of areas, but within an hour, it had spread nationally. Although the initial regional power issues did not have a noticeable impact on Panama’s Internet traffic, the loss of traffic in the graph below aligns with the national growth of the power outage, occurring at 11:45 local time (16:45 UTC). Traffic returned to expected levels at around 15:00 local time (20:00 UTC), aligning with an X post from ENSA stating that “At 3:12pm the supply of electrical energy to all our clients has been normalized after an event at the Transmission level originating in the Panama 1 Substation of ETESA.”
Weather
Ukraine
Internet disruptions in Ukraine due to the conflict there have been covered in multiple quarterly Internet disruption summary blog posts over the last two years. However, in November, connectivity in multiple areas of the country was disrupted by power outages caused by a major winter storm. Snow and high winds knocked out power to hundreds of towns and villages, damaging electrical power infrastructure. The impact is visible in the graphs below as a drop in traffic occurring around 01:00 local time on November 27 (23:00 UTC on November 26), observed in regions including Donetsk, Kherson Oblast, and Luhansk. Traffic appeared to return to expected levels early in the morning local time on November 28.
Mexico
On October 25, Hurricane Otis made landfall near Acapulco, a popular tourist destination in Mexico. In addition to catastrophic structural damage, it was reported that “more than 10,000 utility poles were destroyed, knocking out power and internet/communications across the region, while numerous transmission lines, electrical substations, and a power plant were also heavily damaged.” This damage to electrical and communications infrastructure in the area resulted in significant disruption to Internet connectivity. As shown in the graph below, Internet traffic from Acapulco dropped by around 80% as Otis made landfall. Traffic started to show some growth in early November, but peak volumes remained relatively consistent, and well below pre-hurricane levels, through the end of the year. (Several large spikes are visible on December 26 & 30, but it isn’t clear what those are associated with.) Although Acapulco’s tourism industry experienced a notable recovery heading into the end of the year, it appears that infrastructure recovery has not been quite as swift.
Fire
Hawaii
Last quarter, we reported on the impact of wildfires that started on August 7 in Hawaii, including killing nearly 100 people, as well as destroying homes, businesses, and infrastructure, causing power outages and disrupting Internet connectivity. One of the most impacted areas was the town of Lahaina, where Internet connectivity remained sparse for weeks after the fires began. Repair and restoration efforts continued throughout the fourth quarter, with traffic clearly growing throughout October, with peak levels in November and December approaching pre-fire levels.
Maintenance
Yemen
Two maintenance-related Internet disruptions impacted Internet connectivity in Yemen in the fourth quarter. The first lasted over four hours during the morning of November 10, from 03:10 – 07:45 local time (00:10 – 04:45 UTC), and followed two other disruptions the prior day. The impact was visible at a country level, as well as at a network level on PTC-YemenNet (AS30873).
An Associated Press article noted that in a statement to the state news agency, Yemen’s Public Telecom Corp. (PTC-YemenNet) blamed the outage on maintenance, apparently of the FALCON submarine cable. The article also cited a statement from GCX, the operator of the FALCON cable, regarding scheduled maintenance to the cable system that had been in planning for the previous three months.
The second maintenance-related disruption occurred on December 15 just before 23:00 local time (20:00 UTC). An X post from Mosfer Alnomeir, the Minister of Telecommunication and Information Technology in Yemen, explained what happened: “We note that half an hour ago there was an interruption in the Internet service that lasted approximately 30 minutes. This is while engineers carry out emergency replacement and upgrade work on some service equipment. Service was restored immediately. On behalf of the team, I say thank you for your understanding.” Once again, the impact was visible at both a country and network level.
Technical problems
Australia
“Changes to routing information” after a “routine software upgrade” were reportedly responsible for a multi-hour Internet outage at Australian telecommunications provider Optus (AS4804) on November 8 local time. Connectivity began to drop just after 04:00 Sydney time, with the outage lasting from 04:30 – 10:00 Sydney time (17:30 – 23:00 UTC on November 7). Traffic didn’t fully recover to expected levels until around 23:00 Sydney time (12:00 UTC).
The network issue impacted more than 10 million customers, as well as hospitals and payment and transport systems, and drew comparisons to July 2023’s outage at Canadian provider Rogers Communications. Optus submitted a report to the Australian Senate Standing Committee on Environment and Communications that detailed the cause of the outage, noting “It is now understood that the outage occurred due to approximately 90 PE routers automatically self-isolating in order to protect themselves from an overload of IP routing information. … This unexpected overload of IP routing information occurred after a software upgrade at one of the Singtel internet exchanges (known as STiX) in North America, one of Optus’ international networks. During the upgrade, the Optus network received changes in routing information from an alternate Singtel peering router. These routing changes were propagated through multiple layers of our IP Core network. As a result, at around 4:05am (AEDT), the pre-set safety limits on a significant number of Optus network routers were exceeded.” The report also detailed the recovery efforts and timelines for consumer Internet, DNS, and mobile services.
Armenia
Failure of international links caused a brief Internet disruption at Telecom Armenia (AS12297) on November 11, similar to a disruption that occurred almost exactly a year earlier. As shown in the graph below, the disruption began just around 15:15 local time (11:15 UTC), with short periods where traffic dropped to zero. Traffic recovered to expected levels by 21:00 local time (17:00 UTC). As one of the largest telecommunications providers in the country, the service disruption was visible at a country level as well.
United Kingdom
A sizable drop in traffic was observed between 15:00 and 21:30 local time (15:00 – 21:30 UTC) on mobile and broadband Internet provider Three UK (AS206067) on December 1, as seen in the graph below. Although the provider acknowledged that customers were experiencing issues and provided several updates (1, 2, 3, 4) on service restoration over the next day, it never disclosed any additional information on the cause of the disruption. However, a published report stated that Three UK blamed technical issues at one of its data centers as the cause of the problem, which impacted more than 20,000 users.
Egypt
On December 5, Telecom Egypt (AS8452)posted on X that a technical malfunction affecting one of their main network devices was responsible for an Internet disruption that occurred on their network, which also impacted connectivity on several other network providers, including LINKdotNET (AS24863), Vodadfone Egypt (AS24835), and Etisalat (AS36992), as well as traffic at a national level, as seen in the graphs below. Although one news report claimed that the disruption, which occurred between 14:15 – 00:00 local time (12:15 – 22:00 UTC), was due to damage to the FLAG and SeaMeWe-4 submarine cables, a subsequent post from Telecom Egypt about service restoration dispelled that claim, noting “The company also confirms that there is no truth to what has been circulated on some social media sites about the presence of a break in one of the submarine cables.”
Tunisia
A reported DNS server outage (albeit unconfirmed) at Tunisian Internet provider Topnet (AS37705) caused a brief Internet disruption for the provider’s customers on December 17, also impacting traffic volumes at a national level. The incident lasted less than two hours, from 13:00 – 14:45 local time (12:00 – 13:45 UTC).
Guinea
An unspecified incident on the Orange Guinée (AS37461) network impacted Internet connectivity, as well as telephone calls and text messages during the morning of December 22. The graph below shows a near-complete outage on the network between 09:15 – 11:30 local time (09:15 – 11:30 UTC). The provider posted a subsequent update regarding the restoration of calls, text messages, and Internet connectivity.
Conclusion
Within the Cloudflare Radar 2023 Year in Review, we highlighted over 180 major Internet disruptions that were observed year-to-date through the end of November, though the actual number was likely closer to 200 by the end of the year. While that may seem like a lot, it is worth nothing that the actual number is even higher, as these posts are not exhaustive in their coverage of such events. For example, while we covered the Internet shutdown in Manipur, India that took place across multiple months in 2023, internetshutdowns.in shows that over 90 more smaller localized shutdowns were put into place across the country.
Beginning on Thursday, November 2, 2023 at 11:43 UTC Cloudflare’s control plane and analytics services experienced an outage. The control plane of Cloudflare consists primarily of the customer-facing interface for all of our services including our website and APIs. Our analytics services include logging and analytics reporting.
The incident lasted from November 2 at 11:44 UTC until November 4 at 04:25 UTC. We were able to restore most of our control plane at our disaster recovery facility as of November 2 at 17:57 UTC. Many customers would not have experienced issues with most of our products after the disaster recovery facility came online. However, other services took longer to restore and customers that used them may have seen issues until we fully resolved the incident. Our raw log services were unavailable for most customers for the duration of the incident.
Services have now been restored for all customers. Throughout the incident, Cloudflare’s network and security services continued to work as expected. While there were periods where customers were unable to make changes to those services, traffic through our network was not impacted.
This post outlines the events that caused this incident, the architecture we had in place to prevent issues like this, what failed, what worked and why, and the changes we’re making based on what we’ve learned over the last 36 hours.
To start, this never should have happened. We believed that we had high availability systems in place that should have stopped an outage like this, even when one of our core data center providers failed catastrophically. And, while many systems did remain online as designed, some critical systems had non-obvious dependencies that made them unavailable. I am sorry and embarrassed for this incident and the pain that it caused our customers and our team.
Intended Design
Cloudflare’s control plane and analytics systems run primarily on servers in three data centers around Hillsboro, Oregon. The three data centers are independent of one another, each have multiple utility power feeds, and each have multiple redundant and independent network connections.
The facilities were intentionally chosen to be at a distance apart that would minimize the chances that a natural disaster would cause all three to be impacted, while still close enough that they could all run active-active redundant data clusters. This means that they are continuously syncing data between the three facilities. By design, if any of the facilities goes offline then the remaining ones are able to continue to operate.
This is a system design that we began implementing four years ago. While most of our critical control plane systems had been migrated to the high availability cluster, some services, especially for some newer products, had not yet been added to the high availability cluster.
In addition, our logging systems were intentionally not part of the high availability cluster. The logic of that decision was that logging was already a distributed problem where logs were queued at the edge of our network and then sent back to the core in Oregon (or another regional facility for customers using regional services for logging). If our logging facility was offline then analytics logs would queue at the edge of our network until it came back online. We determined that analytics being delayed was acceptable.
Flexential Data Center Power Failure
The largest of the three facilities in Oregon is run by Flexential. We refer to this facility as “PDX-04.” Cloudflare leases space in PDX-04 where we house our largest analytics cluster as well as more than a third of the machines for our high availability cluster. It is also the default location for services that have not yet been onboarded onto our high availability cluster. We are a relatively large customer of the facility, consuming approximately 10 percent of its total capacity.
On November 2 at 08:50 UTC Portland General Electric (PGE), the utility company that services PDX-04, had an unplanned maintenance event affecting one of their independent power feeds into the building. That event shut down one feed into PDX-04. The data center has multiple feeds with some level of independence that can power the facility. However, Flexential powered up their generators to effectively supplement the feed that was down.
Counter to best practices, Flexential did not inform Cloudflare that they had failed over to generator power. None of our observability tools were able to detect that the source of power had changed. Had they informed us, we would have stood up a team to monitor the facility closely and move control plane services that were dependent on that facility out while it was degraded.
It is also unusual that Flexential ran both the one remaining utility feed and the generators at the same time. It is not unusual for utilities to ask data centers to drop off the grid when power demands are high and run exclusively on generators. Flexential operates 10 generators, inclusive of redundant units, capable of supporting the facility at full load. It would also have been possible for Flexential to run the facility only from the remaining utility feed. We haven’t gotten a clear answer why they ran utility power and generator power.
Informed Speculation On What Happened Next
From this decision onward, we don’t yet have clarity from Flexential on the root cause or some of the decisions they made or the events. We will update this post as we get more information from Flexential, as well as PGE, on what happened. Some of what follows is informed speculation based on the most likely series of events as well as what individual Flexential employees have shared with us unofficially.
One possible reason they may have left the utility line running is because Flexential was part of a program with PGE called DSG. DSG allows the local utility to run a data center’s generators to help supply additional power to the grid. In exchange, the power company helps maintain the generators and supplies fuel. We have been unable to locate any record of Flexential informing us about the DSG program. We’ve asked if DSG was active at the time and have not received an answer. We do not know if it contributed to the decisions that Flexential made, but it could explain why the utility line continued to remain online after the generators were started.
At approximately 11:40 UTC, there was a ground fault on a PGE transformer at PDX-04. We believe, but have not been able to get confirmation from Flexential or PGE, that this was the transformer that stepped down power from the grid for the second feed that was still running as it entered the data center. It seems likely, though we have not been able to confirm with Flexential or PGE, that the ground fault was caused by the unplanned maintenance PGE was performing that impacted the first feed. Or it was a very unlucky coincidence.
Ground faults with high voltage (12,470 volt) power lines are very bad. Electrical systems are designed to quickly shut down to prevent damage when one occurs. Unfortunately, in this case, the protective measure also shut down all of PDX-04’s generators. This meant that the two sources of power generation for the facility — both the redundant utility lines as well as the 10 generators — were offline.
Fortunately, in addition to the generators, PDX-04 also contains a bank of UPS batteries. These batteries are supposedly sufficient to power the facility for approximately 10 minutes. That time is meant to be enough to bridge the gap between the power going out and the generators automatically starting up. If Flexential could get the generators or a utility feed restored within 10 minutes then there would be no interruption. In reality, the batteries started to fail after only 4 minutes based on what we observed from our own equipment failing. And it took Flexential far longer than 10 minutes to get the generators restored.
Attempting to Restore Power
While we haven’t gotten official confirmation, we have been told by employees that three things hampered getting the generators back online. First, they needed to be physically accessed and manually restarted because of the way the ground fault had tripped circuits. Second, Flexential’s access control system was not powered by the battery backups so it was offline. And third, the overnight staffing at the site did not include an experienced operations or electrical expert — the overnight shift consisted of security and an unaccompanied technician who had only been on the job for a week.
Between 11:44 and 12:01 UTC, with the generators not fully restarted, the UPS batteries ran out of power and all customers of the data center lost power. Throughout this, Flexential never informed Cloudflare that there was any issue at the facility. We were first notified of issues in the data center when the two routers that connect the facility to the rest of the world went offline at 11:44 UTC. When we weren’t able to reach the routers directly or through out-of-band management, we attempted to contact Flexential and dispatched our local team to physically travel to the facility. The first message to us from Flexential that they were experiencing an issue was at 12:28 UTC.
We are currently experiencing an issue with power at our [PDX-04] that began at approximately 0500AM PT [12:00 UTC]. Engineers are actively working to resolve the issue and restore service. We will communicate progress every 30 minutes or as more information becomes available as to the estimated time to restore. Thank you for your patience and understanding.
Designing for Data Center Level Failure
While the PDX-04’s design was certified Tier III before construction and is expected to provide high availability SLAs, we planned for the possibility that it could go offline. Even well-run facilities can have bad days. And we planned for that. What we expected would happen in that case is that our analytics would be offline, logs would be queued at the edge and delayed, and certain lower priority services that were not integrated into our high availability cluster would go offline temporarily until they could be restored at another facility.
The other two data centers running in the area would take over responsibility for the high availability cluster and keep critical services online. Generally that worked as planned. Unfortunately, we discovered that a subset of services that were supposed to be on the high availability cluster had dependencies on services exclusively running in PDX-04.
In particular, two critical services that process logs and power our analytics — Kafka and ClickHouse — were only available in PDX-04 but had services that depended on them that were running in the high availability cluster. Those dependencies shouldn’t have been so tight, should have failed more gracefully, and we should have caught them.
We had performed testing of our high availability cluster by taking offline each (and both) of the other two data center facilities entirely offline. And we had also tested taking the high availability portion of PDX-04 offline. However, we had never tested fully taking the entire PDX-04 facility offline. As a result, we had missed the importance of some of these dependencies on our data plane.
We were also far too lax about requiring new products and their associated databases to integrate with the high availability cluster. Cloudflare allows multiple teams to innovate quickly. As such, products often take different paths toward their initial alpha. While, over time, our practice is to migrate the backend for these services to our best practices, we did not formally require that before products were declared generally available (GA). That was a mistake as it meant that the redundancy protections we had in place worked inconsistently depending on the product.
Moreover, far too many of our services depend on the availability of our core facilities. While this is the way a lot of software services are created, it does not play to Cloudflare’s strength. We are good at distributed systems. Throughout this incident, our global network continued to perform as expected. While some of our products and features are configurable and serviceable through the edge of our network without needing the core, far too many today fail if the core is unavailable. We need to use the distributed systems products that we make available to all our customers for all our services so they continue to function mostly as normal even if our core facilities are disrupted.
Disaster Recovery
At 12:48 UTC, Flexential was able to get the generators restarted. Power returned to portions of the facility. In order to not overwhelm the system, when power is restored to a data center it is typically done gradually by powering back on one circuit at a time. Like the circuit breakers in a residential home, each customer is serviced by redundant breakers. When Flexential attempted to power back up Cloudflare’s circuits, the circuit breakers were discovered to be faulty. We don’t know if the breakers failed due to the ground fault or some other surge as a result of the incident, or if they’d been bad before and it was only discovered after they had been powered off.
Flexential began the process of replacing the failed breakers. That required them to source new breakers because more were bad than they had on hand in the facility. Because more services were offline than we expected, and because Flexential could not give us a time for restoration of our services, we made the call at 13:40 UTC to fail over to Cloudflare’s disaster recovery sites located in Europe. Thankfully, we only needed to fail over a small percentage of Cloudflare’s overall control plane. Most of our services continued to run across our high availability systems across the two active core data centers.
We turned up the first services on the disaster recovery site at 13:43 UTC.Cloudflare’s disaster recovery sites provide critical control plane services in the event of a disaster. While the disaster recovery site does not support some of our log processing services, it is designed to support the other portions of our control plane.
When services were turned up there, we experienced a thundering herd problem where the API calls that had been failing overwhelmed our services. We implemented rate limits to get the request volume under control. During this period, customers of most products would have seen intermittent errors when making modifications through our dashboard or API. By 17:57 UTC, the services that had been successfully moved to the disaster recovery site were stable and most customers were no longer directly impacted. However, some systems still required manual configuration (e.g., Magic WAN) and some other services, largely related to log processing and some bespoke APIs, remained unavailable until we were able to restore PDX-04.
Some Products and Features Delayed Restart
A handful of products did not properly get stood up on our disaster recovery sites. These tended to be newer products where we had not fully implemented and tested a disaster recovery procedure. These included our Stream service for uploading new videos and some other services. Our team worked two simultaneous tracks to get these services restored: 1) reimplementing them on our disaster recovery sites; and 2) migrating them to our high-availability cluster.
Flexential replaced our failed circuit breakers, restored both utility feeds, and confirmed clean power at 22:48 UTC. Our team was all-hands-on-deck and had worked all day on the emergency, so I made the call that most of us should get some rest and start the move back to PDX-04 in the morning. That decision delayed our full recovery, but I believe made it less likely that we’d compound this situation with additional mistakes.
Beginning first thing on November 3, our team began restoring service in PDX-04. That began with physically booting our network gear then powering up thousands of servers and restoring their services. The state of our services in the data center was unknown as we believed multiple power cycles were likely to have occurred during the incident. Our only safe process to recover was to follow a complete bootstrap of the entire facility.
This involved a manual process of bringing our configuration management servers online to begin the restoration of the facility. Rebuilding these took 3 hours. From there, our team was able to bootstrap the rebuild of the rest of the servers that power our services. Each server took between 10 minutes and 2 hours to rebuild. While we were able to run this in parallel across multiple servers, there were inherent dependencies between services that required some to be brought back online in sequence.
Services are now fully restored as of November 4 at 04:25 UTC. For most customers, because of how we queue analytics at the edge, you should see no data loss in your analytics. Any gaps that appear as of now we expect will fill in as any lingering caches of analytics data is ingested. For customers that use our log push feature, your logs will not have been processed for the majority of the event, so anything you did not receive will not be recovered. However, the records in our analytics dashboard will still be accurate.
Lessons and Remediation
We have a number of questions that we need answered from Flexential. But we also must expect that entire data centers may fail. Google has a process where when there’s a significant event or crisis they can call a Code Yellow or Code Red. In these cases, most or all engineering resources are shifted to addressing the issue at hand.
We have not had such a process in the past, but it’s clear today we need to implement a version of it ourselves: Code Orange. We are shifting all non-critical engineering functions to focusing on ensuring high reliability of our control plane. As part of that, we expect the following changes:
Remove dependencies on our core data centers for control plane configuration of all services and move them wherever possible to be powered first by our distributed network
Ensure that the control plane running on the network continues to function even if all our core data centers are offline
Require that all products and features that are designated Generally Available must rely on the high availability cluster (if they rely on any of our core data centers), without having any software dependencies on specific facilities
Require all products and features that are designated Generally Available have a reliable disaster recovery plan that is tested
Test the blast radius of system failures and minimize the number of services that are impacted by a failure
Implement more rigorous chaos testing of all data center functions including the full removal of each of our core data center facilities
Thorough auditing of all core data centers and a plan to reaudit to ensure they comply with our standards
Logging and analytics disaster recovery plan that ensures no logs are dropped even in the case of a failure of all our core facilities
As I said earlier, I am sorry and embarrassed for this incident and the pain that it caused our customers and our team. We have the right systems and procedures in place to be able to withstand even the cascading string of failures we saw at our data center provider, but we need to be more rigorous about enforcing that they are followed and tested for unknown dependencies. This will have my full attention and the attention of a large portion of our team through the balance of the year. And the pain from the last couple days will make us better.
On Saturday, October 7, 2023, attacks from the Palestinian group Hamas launched from the Gaza Strip against the south of Israel started a new conflict in the region. Israel officially declared that it is at war the next day. Cloudflare's data shows that Internet traffic was impacted in different ways, both in Israel and Palestine, with two networks (autonomous systems) in the Gaza Strip going offline a few hours after the attacks. Subsequently, on October 9, two additional networks also experienced outages. We also saw an uptick in cyberattacks targeting Israel, including a 1.26 billion HTTP requests DDoS attack, and Palestine.
Starting with general Internet traffic trends, there was a clear increase in Internet traffic right after the attacks reportedly began (03:30 UTC, 06:30 local time). Traffic spiked at around 03:35 UTC (06:35 local time) in both Israel (~170% growth compared with the previous week) and Palestine (100% growth).
That growth is consistent with other situations, where we’ve seen surges in Internet traffic when countrywide events occur and people are going online to check for news, updates, and more information on what is happening, with social media and messaging also playing a role. However, in Palestine, that traffic growth was followed by a clear drop in traffic around 08:00 UTC (11:00 local time).
The Palestine uptick in traffic after the Hamas attacks started is more visible when only looking at HTTP requests. Requests in Palestine dropped on Saturday and Sunday, October 7 and 8, as much as 20% and 25%, respectively.
Palestine's outages and Internet impact
What drove the drop in Internet traffic in Palestine? Our data shows that two Gaza Strip related networks (autonomous systems or ASNs) were offline on that October 7 morning. Fusion (AS42314) was offline from 08:00 UTC, but saw some recovery after 17:00 UTC the next day; this only lasted for a few hours, given that it went back offline after 12:00 UTC this Monday, October 9.
It was the same scenario for DCC North (AS203905), but it went offline after 10:00 UTC and with no recovery of traffic observed as of Monday, October 9. These Internet disruptions may be related to power outages in the Gaza Strip.
During the day on October 7, other Palestinian networks saw less traffic than usual. JETNET (AS199046) had around half of the usual traffic after 08:00 UTC, similar to SpeedClick (AS57704), which had around 60% less traffic. After 14:15 on October 9, traffic to those networks dropped sharply (a 95% decrease compared with the previous week), showing only residual traffic.
When looking more closely at the Gaza Strip specifically, we can see that some districts or governorates had a drop in HTTP requests a few hours after the first Hamas attacks. The Gaza Governorate was impacted, with traffic dropping on October 7, 2023, after 09:15 UTC. On October 9, at 18:00 UTC, traffic was 46% lower than in the previous week. (Note: there were spikes in traffic during Friday, October 6, several hours before the attacks, but it is unclear what caused those spikes.)
The Deir al-Balah Governorate (on October 9, at 18:00 UTC, traffic was 46% lower than in the previous week) and the Khan Yunis Governorate (50% lower) also both experienced similar drops in traffic:
In the Rafah Governorate traffic dropped after 19:00 UTC on October 8 (and on October 9, at 18:00 UTC, traffic was 65% lower than in the previous week).
Other Palestinian governorates in the West Bank did not experience the same impact to Internet traffic.
Spikes in Internet traffic in Israel
In Israel, Internet traffic surged to ~170% as compared to the previous week right after the Hamas attacks on October 7 at around 03:35 UTC (06:35 local time), and again at around 16:00 UTC (19:00 local time), with ~80% growth compared to the previous week. In both cases, the increase was driven by mobile device traffic.
There was also increased traffic, as compared with usual levels, on Sunday, October 8, with notable spikes at around 06:00 (09:00 local time) and 12:00 UTC (15:00 local time), seen in the HTTP requests traffic graph below.
Mobile device traffic drove the Saturday, October 7 spikes in traffic, with the daily mobile device usage percentage reaching its highest in the past two months, reaching 56%.
Looking at specific Israel districts, traffic looks similar to the nationwide perspective.
Cyber attacks targeting Israel
Cyber attacks are frequent, recurrent, and are not necessarily dependent on actual wars on the ground, as our 2023 attacks landscape clearly showed. However, it is not unusual to see cyberattacks launched in tandem with ground assaults. We saw that in Ukraine, an uptick in cyber attacks started just before war began there on February 24, 2022, and were even more constant, and spread to other countries after that day.
In Israel, we saw a clear uptick in cyber attacks earlier this year, with another wave of notable attacks on October 7 and October 8, 2023, after the Hamas attacks. The largest ones were DDoS attacks targeting Israeli newspapers. One attack on October 8, reached 1.26 billion daily requests blocked by Cloudflare as DDoS attacks, and the other reached 346 million daily requests on October 7, and 332 million daily requests the following day.
Looking at these DDoS attacks in terms of requests per second, one of the impacted sites experienced a peak of 1.1 million requests per second on October 8 at 02:00 UTC, and the other Israeli newspaper saw a peak of 745k requests per second at around 06:00 the same day.
In Palestine, we also saw application layer DDoS attacks, but not as big. The main one in the past three months was on October 7, 2023, targeting a Palestine online newspaper, reaching 105 million daily requests.
Looking at these most notable DDoS attacks targeting Palestine in terms of requests per second (rps), the most impacted site (a Palestinian newspaper) experienced a peak of 214k requests per second at around 17:20 UTC on October 7.
Follow Cloudflare Radar for up to date information
On 4 October 2023, Cloudflare experienced DNS resolution problems starting at 07:00 UTC and ending at 11:00 UTC. Some users of 1.1.1.1 or products like WARP, Zero Trust, or third party DNS resolvers which use 1.1.1.1 may have received SERVFAIL DNS responses to valid queries. We’re very sorry for this outage. This outage was an internal software error and not the result of an attack. In this blog, we’re going to talk about what the failure was, why it occurred, and what we’re doing to make sure this doesn’t happen again.
Background
In the Domain Name System (DNS), every domain name exists within a DNS zone. The zone is a collection of domain names and host names that are controlled together. For example, Cloudflare is responsible for the domain name cloudflare.com, which we say is in the “cloudflare.com” zone. The .com top-level domain (TLD) is owned by a third party and is in the “com” zone. It gives directions on how to reach cloudflare.com. Above all of the TLDs is the root zone, which gives directions on how to reach TLDs. This means that the root zone is important in being able to resolve all other domain names. Like other important parts of the DNS, the root zone is signed with DNSSEC, which means the root zone itself contains cryptographic signatures.
The root zone is published on the root servers, but it is also common for DNS operators to retrieve and retain a copy of the root zone automatically so that in the event that the root servers cannot be reached, the information in the root zone is still available. Cloudflare’s recursive DNS infrastructure takes this approach as it also makes the resolution process faster. New versions of the root zone are normally published twice a day. 1.1.1.1 has a WebAssembly app called static_zone running on top of the main DNS logic that serves those new versions when they are available.
What happened
On 21 September, as part of a known and planned change in root zone management, a new resource record type was included in the root zones for the first time. The new resource record is named ZONEMD, and is in effect a checksum for the contents of the root zone.
The root zone is retrieved by software running in Cloudflare’s core network. It is subsequently redistributed to Cloudflare’s data centers around the world. After the change, the root zone containing the ZONEMD record continued to be retrieved and distributed as normal. However, the 1.1.1.1 resolver systems that make use of that data had problems parsing the ZONEMD record. Because zones must be loaded and served in their entirety, the system’s failure to parse ZONEMD meant the new versions of the root zone were not used in Cloudflare’s resolver systems. Some of the servers hosting Cloudflare's resolver infrastructure failed over to querying the DNS root servers directly on a request-by-request basis when they did not receive the new root zone. However, others continued to rely on the known working version of the root zone still available in their memory cache, which was the version pulled on 21 September before the change.
On 4 October 2023 at 07:00 UTC, the DNSSEC signatures in the version of the root zone from 21 September expired. Because there was no newer version that the Cloudflare resolver systems were able to use, some of Cloudflare’s resolver systems stopped being able to validate DNSSEC signatures and as a result started sending error responses (SERVFAIL). The rate at which Cloudflare resolvers generated SERVFAIL responses grew by 12%. The diagrams below illustrate the progression of the failure and how it became visible to users.
Incident timeline and impact
21 September 6:30 UTC: Last successful pull of the root zone 4 October 7:00 UTC: DNSSEC signatures in the root zone obtained on 21 September expired causing an increase in SERVFAIL responses to client queries. 7:57: First external reports of unexpected SERVFAILs started coming in. 8:03: Internal Cloudflare incident declared. 8:50: Initial attempt made at stopping 1.1.1.1 from serving responses using the stale root zone file with an override rule. 10:30: Stopped 1.1.1.1 from preloading the root zone file entirely. 10:32: Responses returned to normal. 11:02: Incident closed.
This below chart shows the timeline of impact along with the percentage of DNS queries that returned with a SERVFAIL error:
We expect a baseline volume of SERVFAIL errors for regular traffic during normal operation. Usually that percentage sits at around 3%. These SERVFAILs can be caused by legitimate issues in the DNSSEC chain, failures to connect to authoritative servers, authoritative servers taking too long to respond, and many others. During the incident the amount of SERVFAILs peaked at 15% of total queries, although the impact was not evenly distributed around the world and was mainly concentrated in our larger data centers like Ashburn, Virginia; Frankfurt, Germany; and Singapore.
Why this incident happened
Why parsing the ZONEMD record failed
DNS has a binary format for storing resource records. In this binary format the type of the resource record (TYPE) is stored as a 16-bit integer. The type of resource record determines how the resource data (RDATA) is parsed. When the record type is 1, this means it is an A record, and the RDATA can be parsed as an IPv4 address. Record type 28 is an AAAA record, whose RDATA can be parsed as an IPv6 address instead. When a parser runs into an unknown resource type it won’t know how to parse its RDATA, but fortunately it doesn’t have to: the RDLENGTH field indicates how long the RDATA field is, allowing the parser to treat it as an opaque data element.
The reason static_zone didn’t support the new ZONEMD record is because up until now we had chosen to distribute the root zone internally in its presentation format, rather than in the binary format. When looking at the text representation for a few resource records we can see there is a lot more variation in how different records are presented.
.			86400	IN	SOA	a.root-servers.net. nstld.verisign-grs.com. 2023100400 1800 900 604800 86400
.			86400	IN	RRSIG	SOA 8 0 86400 20231017050000 20231004040000 46780 . J5lVTygIkJHDBt6HHm1QLx7S0EItynbBijgNlcKs/W8FIkPBfCQmw5BsUTZAPVxKj7r2iNLRddwRcM/1sL49jV9Jtctn8OLLc9wtouBmg3LH94M0utW86dKSGEKtzGzWbi5hjVBlkroB8XVQxBphAUqGxNDxdE6AIAvh/eSSb3uSQrarxLnKWvHIHm5PORIOftkIRZ2kcA7Qtou9NqPCSE8fOM5EdXxussKChGthmN5AR5S2EruXIGGRd1vvEYBrRPv55BAWKKRERkaXhgAp7VikYzXesiRLdqVlTQd+fwy2tm/MTw+v3Un48wXPg1lRPlQXmQsuBwqg74Ts5r8w8w==
.			518400	IN	NS	a.root-servers.net.
.			86400	IN	ZONEMD	2023100400 1 241 E375B158DAEE6141E1F784FDB66620CC4412EDE47C8892B975C90C6A102E97443678CCA4115E27195B468E33ABD9F78C
When we run into an unknown resource record it’s not always easy to know how to handle it. Because of this, the library we use to parse the root zone at the edge does not make an attempt at doing so, and instead returns a parser error.
Why a stale version of the root zone was used
The static_zone app, tasked with loading and parsing the root zone for the purpose of serving the root zone locally (RFC 7706), stores the latest version in memory. When a new version is published it parses it and, when successfully done so, drops the old version. However, as parsing failed the static_zone app never switched to a newer version, and instead continued using the old version indefinitely. When the 1.1.1.1 service is first started the static_zone app does not have an existing version in memory. When it tries to parse the root zone it fails in doing so, but because it does not have an older version of the root zone to fall back on, it falls back on querying the root servers directly for incoming requests.
Why the initial attempt at disabling static_zone didn’t work
Initially we tried to disable the static_zone app through override rules, a mechanism that allows us to programmatically change some behavior of 1.1.1.1. The rule we deployed was:
phase = pre-cache set-tag rec_disable_static
For any incoming request this rule adds the tag rec_disable_static to the request. Inside the static_zone app we check for this tag and, if it’s set, we do not return a response from the cached, static root zone. However, to improve cache performance queries are sometimes forwarded to another node if the current node can’t find the response in its own cache. Unfortunately, the rec_disable_static tag is not included in the queries being forwarded to other nodes, which caused the static_zone app to continue replying with stale information until we eventually disabled the app entirely.
Why the impact was partial
Cloudflare regularly performs rolling reboots of the servers that host our services for tasks like kernel updates that can only take effect after a full system restart. At the time of this outage, resolver server instances that were restarted between the ZONEMD change and the DNSSEC invalidation did not contribute to impact. If they had restarted during this two-week period, they would have failed to load the root zone on startup and fallen back to resolving by sending DNS queries to root servers instead. In addition, the resolver uses a technique called serve stale (RFC 8767) with the purpose of being able to continue to serve popular records from a potentially stale cache to limit the impact. A record is considered to be stale once the TTL amount of seconds has passed since the record was retrieved from upstream. This prevented a total outage; impact was mainly felt in our largest data centers which had many servers that had not restarted the 1.1.1.1 service in that timeframe.
Remediation and follow-up steps
This incident had widespread impact, and we take the availability of our services very seriously. We have identified several areas of improvement and will continue to work on uncovering any other gaps that could cause a recurrence.
Here is what we are working on immediately:
Visibility: We’re adding alerts to notify when static_zone serves a stale root zone file. It should not have been the case that serving a stale root zone file went unnoticed for as long as it did. If we had been monitoring this better, with the caching that exists, there would have been no impact. It is our goal to protect our customers and their users from upstream changes.
Resilience: We will re-evaluate how we ingest and distribute the root zone internally. Our ingestion and distribution pipelines should handle new RRTYPEs seamlessly, and any brief interruption to the pipeline should be invisible to end users.
Testing: Despite having tests in place around this problem, including tests related to unreleased changes in parsing the new ZONEMD records, we did not adequately test what happens when the root zone fails to parse. We will improve our test coverage and the related processes.
Architecture: We should not use stale copies of the root zone past a certain point. While it’s certainly possible to continue to use stale root zone data for a limited amount of time, past a certain point there are unacceptable operational risks. We will take measures to ensure that the lifetime of cached root zone data is better managed as described in RFC 8806: Running a Root Server Local to a Resolver.
Conclusion
We are deeply sorry that this incident happened. There is one clear message from this incident: do not ever assume that something is not going to change! Many modern systems are built with a long chain of libraries that are pulled into the final executable, each one of those may have bugs or may not be updated early enough for programs to operate correctly when changes in input happen. We understand how important it is to have good testing in place that allows detection of regressions and systems and components that fail gracefully on changes to input. We understand that we need to always assume that “format” changes in the most critical systems of the internet (DNS and BGP) are going to have an impact.
We have a lot to follow up on internally and are working around the clock to make sure something like this does not happen again.
We launched the Cloudflare Radar Outage Center (CROC) during Birthday Week 2022 as a way of keeping the community up to date on Internet disruptions, including outages and shutdowns, visible in Cloudflare’s traffic data. While some of the entries have their genesis in information from social media posts made by local telecommunications providers or civil society organizations, others are based on an internal traffic anomaly detection and alerting tool. Today, we’re adding this alerting feed to Cloudflare Radar, showing country and network-level traffic anomalies on the CROC as they are detected, as well as making the feed available via API.
Building on this new functionality, as well as the route leaks and route hijacks insights that we recently launched on Cloudflare Radar, we are also launching new Radar notification functionality, enabling you to subscribe to notifications about traffic anomalies, confirmed Internet outages, route leaks, or route hijacks. Using the Cloudflare dashboard’s existing notification functionality, users can set up notifications for one or more countries or autonomous systems, and receive notifications when a relevant event occurs. Notifications may be sent via e-mail or webhooks — the available delivery methods vary according to plan level.
Traffic anomalies
Internet traffic generally follows a fairly regular pattern, with daily peaks and troughs at roughly the same volumes of traffic. However, while weekend traffic patterns may look similar to weekday ones, their traffic volumes are generally different. Similarly, holidays or national events can also cause traffic patterns and volumes to differ significantly from “normal”, as people shift their activities and spend more time offline, or as people turn to online sources for information about, or coverage of, the event. These traffic shifts can be newsworthy, and we have covered some of them in past Cloudflare blog posts (King Charles III coronation, Easter/Passover/Ramadan, Brazilian presidential elections).
However, as you also know from reading our blog posts and following Cloudflare Radar on social media, it is the more drastic drops in traffic that are a cause for concern. Some are the result of infrastructure damage from severe weather or a natural disaster like an earthquake and are effectively unavoidable, but getting timely insights into the impact of these events on Internet connectivity is valuable from a communications perspective. Other traffic drops have occurred when an authoritarian government orders mobile Internet connectivity to be shut down, or shuts down all Internet connectivity nationwide. Timely insights into these types of anomalous traffic drops are often critical from a human rights perspective, as Internet shutdowns are often used as a means of controlling communication with the outside world.
Over the last several months, the Cloudflare Radar team has been using an internal tool to identify traffic anomalies and post alerts for followup to a dedicated chat space. The companion blog post Gone Offline: Detecting Internet Outages goes into deeper technical detail about our traffic analysis and anomaly detection methodologies that power this internal tool.
Many of these internal traffic anomaly alerts ultimately result in Outage Center entries and Cloudflare Radar social media posts. Today, we’re extending the Cloudflare Radar Outage Center and publishing information about these anomalies as we identify them. As shown in the figure below, the new Traffic anomalies table includes the type of anomaly (location or ASN), the entity where the anomaly was detected (country/region name or autonomous system), the start time, duration, verification status, and an “Actions” link, where the user can view the anomaly on the relevant entity traffic page or subscribe to a notification. (If manual review of a detected anomaly finds that it is present in multiple Cloudflare traffic datasets and/or is visible in third-party datasets, such as Georgia Tech’s IODA platform, we will mark it as verified. Unverified anomalies may be false positives, or related to Netflows collection issues, though we endeavor to minimize both.)
In addition to this new table, we have updated the Cloudflare Radar Outage Center map to highlight where we have detected anomalies, as well as placing them into a broader temporal context in a new timeline immediately below the map. Anomalies are represented as orange circles on the map, and can be hidden with the toggle in the upper right corner. Double-bordered circles represent an aggregation across multiple countries, and zooming in to that area will ultimately show the number of anomalies associated with each country that was included in the aggregation. Hovering over a specific dot in the timeline displays information about the outage or anomaly with which it is associated.
Internet outage information has been available via the Radar API since we launched the Outage Center and API in September 2022, and traffic anomalies are now available through a Radar API endpoint as well. An example traffic anomaly API request and response are shown below.
Timely knowledge about Internet “events”, such as drops in traffic or routing issues, are potentially of interest to multiple audiences. Customer service or help desk agents can use the information to help diagnose customer/user complaints about application performance or availability. Similarly, network administrators can use the information to better understand the state of the Internet outside their network. And civil society organizations can use the information to inform action plans aimed at maintaining communications and protecting human rights in areas of conflict or instability. With the new notifications functionality also being launched today, you can subscribe to be notified about observed traffic anomalies, confirmed Internet outages, route leaks, or route hijacks, at a country or autonomous system level. In the following sections, we discuss how to subscribe to and configure notifications, as well as the information contained within the various types of notifications.
Subscribing to notifications
Note that you need to log in to the Cloudflare dashboard to subscribe to and configure notifications. No purchase of Cloudflare services is necessary — just a verified email address is required to set up an account. While we would have preferred to not require a login, it enables us to take advantage of Cloudflare’s existing notifications engine, allowing us to avoid having to dedicate time and resources to building a separate one just for Radar. If you don’t already have a Cloudflare account, visit https://dash.cloudflare.com/sign-up to create one. Enter your username and a unique strong password, click “Sign Up”, and follow the instructions in the verification email to activate your account. (Once you’ve activated your account, we also suggest activating two-factor authentication (2FA) as an additional security measure.)
Once you have set up and activated your account, you are ready to start creating and configuring notifications. The first step is to look for the Notifications (bullhorn) icon – the presence of this icon means that notifications are available for that metric — in the Traffic, Routing, and Outage Center sections on Cloudflare Radar. If you are on a country or ASN-scoped traffic or routing page, the notification subscription will be scoped to that entity.
Look for this icon in the Traffic, Routing, and Outage Center sections of Cloudflare Radar to start setting up notifications.In the Outage Center, click the icon in the “Actions” column of an Internet outages table entry to subscribe to notifications for the related location and/or ASN(s). Click the icon alongside the table description to subscribe to notifications for all confirmed Internet outages.In the Outage Center, click the icon in the “Actions” column of a Traffic anomalies table entry to subscribe to notifications for the related entity. Click the icon alongside the table description to subscribe to notifications for all traffic anomalies.On country or ASN traffic pages, click the icon alongside the description of the traffic trends graph to subscribe to notifications for traffic anomalies or Internet outages impacting the selected country or ASN.On country or ASN routing pages, click the icon alongside the description to subscribe to notifications for route leaks or origin hijacks related to the selected country or ASN.Within the Route Leaks or Origin Hijacks tables on the routing pages, click the icon in a table entry to subscribe to notifications for route leaks or origin hijacks for referenced countries and/or ASNs.
After clicking a notification icon, you’ll be taken to the Cloudflare login screen. Enter your username and password (and 2FA code if required), and once logged in, you’ll see the Add Notification page, pre-filled with the key information passed through from the referring page on Radar, including relevant locations and/or ASNs. (If you are already logged in to Cloudflare, then you’ll be taken directly to the Add Notification page after clicking a notification icon on Radar.) On this page, you can name the notification, add an optional description, and adjust the location and ASN filters as necessary. Enter an email address for notifications to be sent to, or select an established webhook destination (if you have webhooks enabled on your account).
Click “Save”, and the notification is added to the Notifications Overview page for the account.
You can also create and configure notifications directly within Cloudflare, without starting from a link on Radar a Radar page. To do so, log in to Cloudflare, and choose “Notifications” from the left side navigation bar. That will take you to the Notifications page shown below. Click the “Add” button to add a new notification.
On the next page, search for and select “Radar” from the list of Cloudflare products for which notifications are available.
On the subsequent “Add Notification” page, you can create and configure a notification from scratch. Event types can be selected in the “Notify me for:” field, and both locations and ASNs can be searched for and selected within the respective “Filtered by (optional)” fields. Note that if no filters are selected, then notifications will be sent for all events of the selected type(s). Add one or more emails to send notifications to, or select a webhook target if available, and click “Save” to add it to the list of notifications configured for your account.
It is worth mentioning that advanced users can also create and configure notifications through the Cloudflare API Notification policies endpoint, but we will not review that process within this blog post.
Notification messages
Example notification email messages are shown below for the various types of events. Each contains key information like the type of event, affected entities, and start time — additional relevant information is included depending on the event type. Each email includes both plaintext and HTML versions to accommodate multiple types of email clients. (Final production emails may vary slightly from those shown below.)
Internet outage notification emails include information about the affected entities, a description of the cause of the outage, start time, scope (if available), and the type of outage (Nationwide, Network, Regional, or Platform), as well as a link to view the outage in a Radar traffic graph.Traffic anomaly notification emails simply include information about the affected entity and a start time, as well as a link to view the anomaly in a Radar traffic graph.BGP hijack notification emails include information about the hijacking and victim ASNs, affected IP address prefixes, the number of BGP messages (announcements) containing leaked routes, the number of peers announcing the hijack, detection timing, a confidence level on the event being a true hijack, and relevant tags, as well as a link to view details of the hijack event on Radar.BGP route leak notification emails include information about the AS that the leaked routes were learned from, the AS that leaked the routes, the AS that received and propagated the leaked routes, the number of affected prefixes, the number of affected origin ASes, the number of BGP route collector peers that saw the route leak, and detection timing, as well as a link to view details of the route leak event on Radar.
If you are sending notifications to webhooks, you can integrate those notifications into tools like Slack. For example, by following the directions in Slack’s API documentation, creating a simple integration took just a few minutes and results in messages like the one shown below.
Conclusion
Cloudflare’s unique perspective on the Internet provides us with near-real-time insight into unexpected drops in traffic, as well as potentially problematic routing events. While we’ve been sharing these insights with you over the past year, you had to visit Cloudflare Radar to figure out if there were any new “events”. With the launch of notifications, we’ll now automatically send you information about the latest events that you are interested in.
We encourage you to visit Cloudflare Radar to familiarize yourself with the information we publish about traffic anomalies, confirmed Internet outages, BGP route leaks, and BGP origin hijacks. Look for the notification icon on the relevant graphs and tables on Radar, and go through the workflow to set up and subscribe to notifications. (And don’t forget to sign up for a Cloudflare account if you don’t have one already.) Please send us feedback about the notifications, as we are constantly working to improve them, and let us know how and where you’ve integrated Radar notifications into your own tools/workflows/organization.
Currently, Cloudflare Radar curates a list of observed Internet disruptions (which may include partial or complete outages) in the Outage Center. These disruptions are recorded whenever we have sufficient context to correlate with an observed drop in traffic, found by checking status updates and related communications from ISPs, or finding news reports related to cable cuts, government orders, power outages, or natural disasters.
However, we observe more disruptions than we currently report in the outage center because there are cases where we can’t find any source of information that provides a likely cause for what we are observing, although we are still able to validate with external data sources such as Georgia Tech’s IODA. This curation process involves manual work, and is supported by internal tooling that allows us to analyze traffic volumes and detect anomalies automatically, triggering the workflow to find an associated root cause. While the Cloudflare Radar Outage Center is a valuable resource, one of key shortcomings include that we are not reporting all disruptions, and that the current curation process is not as timely as we’d like, because we still need to find the context.
As we announced today in a related blog post, Cloudflare Radar will be publishing anomalous traffic events for countries and Autonomous Systems (ASes). These events are the same ones referenced above that have been triggering our internal workflow to validate and confirm disruptions. (Note that at this time “anomalous traffic events” are associated with drops in traffic, not unexpected traffic spikes.) In addition to adding traffic anomaly information to the Outage Center, we are also launching the ability for users to subscribe to notifications at a location (country) or network (autonomous system) level whenever a new anomaly event is detected, or a new entry is added to the outage table. Please refer to the related blog post for more details on how to subscribe.
The current status of each detected anomaly will be shown in the new “Traffic anomalies” table on the Outage Center page:
When the anomaly is automatically detected its status will initially be Unverified
After attempting to validate ‘Unverified’ entries:
We will change the status to ‘Verified’ if we can confirm that the anomaly appears across multiple internal data sources, and possibly external ones as well. If we find associated context for it, we will also create an outage entry.
We will change status to ‘False Positive’ if we cannot confirm it across multiple data sources. This will remove it from the “Traffic anomalies” table. (If a notification has been sent, but the anomaly isn’t shown in Radar anymore, it means we flagged it as ‘False Positive’.)
We might also manually add an entry with a “Verified” status. This might occur if we observe, and validate, a drop in traffic that is noticeable, but was not large enough for the algorithm to catch it.
A glimpse at what Internet traffic volume looks like
At Cloudflare, we have several internal data sources that can give us insights into what the traffic for a specific entity looks like. We identify the entity based on IP address geolocation in the case of locations, and IP address allocation in the case of ASes, and can analyze traffic from different sources, such as DNS, HTTP, NetFlows, and Network Error Logs (NEL). All the signals used in the figures below come from one of these data sources and in this blog post we will treat this as a univariate time-series problem — in the current algorithm, we use more than one signal just to add redundancy and identify anomalies with a higher level of confidence. In the discussion below, we intentionally select various examples to encompass a broad spectrum of potential Internet traffic volume scenarios.
1. Ideally, the signals would resemble the pattern depicted below for Australia (AU): a stable weekly pattern with a slightly positive trend meaning that the trend average is moving up over time (we see more traffic over time from users in Australia).
These statements can be clearly seen when we perform time-series decomposition which allows us to break down a time-series into its constituent parts to better understand and analyze its underlying patterns. Decomposing the traffic volume for Australia above assuming a weekly pattern with Seasonal-Trend decomposition using LOESS (STL) we get the following:
The weekly pattern we are referring to is represented by the seasonal part of the signal that is expected to be observed due to the fact that we are interested in eyeball / human internet traffic. As observed in the image above, the trend component is expected to move slowly when compared with the signal level and the residual part ideally would resemble white noise meaning that all existing patterns in the signal are represented by the seasonal and trend components.
2. Below we have the traffic volume for AS15964 (CAMNET-AS) that appears to have more of a daily pattern, as opposed to weekly.
We also observe that there’s a value offset of the signal right after the first four days (blue dashed-line) and the red background shows us an outage for which we didn’t find any reporting besides seeing it in our data and other Internet data providers — our intention here is to develop an algorithm that will trigger an event when it comes across this or similar patterns.
4. Another scenario is several scheduled outages for AS203214 (HulumTele), for which we also have context. These anomalies are the easiest to detect since the traffic goes to values that are unique to outages (cannot be mistaken as regular traffic), but it poses another challenge: if our plan was to just check the weekly patterns, since these government-directed outages happen with the same frequency, at some point the algorithm would see this as expected traffic.
5. This outage in Kenya could be seen as similar to the above: the traffic volume went down to unseen values although not as significantly. We also observe some upward spikes in the data that are not following any specific pattern — possibly outliers — that we should clean depending on the approach we use to model the time-series.
6. Lastly, here's the data that will be used throughout this post as an example of how we are approaching this problem. For Madagascar (MG), we observe a clear pattern with pronounced weekends (blue background). There’s also a holiday (Assumption of Mary), highlighted with a green background, and an outage, with a red background. In this example, weekends, holidays, and outages all seem to have roughly the same traffic volume. Fortunately, the outage gives itself away by showing that it intended to go up as in a normal working day, but then there was a sudden drop — we will see it more closely later in this post.
In summary, here we looked over six examples out of ~700 (the number of entities we are automatically detecting anomalies for currently) and we see a wide range of variability. This means that in order to effectively model the time-series we would have to run a lot of preprocessing steps before the modeling itself. These steps include removing outliers, detecting short and long-term data offsets and readjusting, and detecting changes in variance, mean, or magnitude. Time is also a factor in preprocessing, as we would also need to know in advance when to expect events / holidays that will push the traffic down, apply daylight saving time adjustments that will cause a time shift in the data, and be able to apply local time zones for each entity, including dealing with locations that have multiple time zones and AS traffic that is shared across different time zones.
To add to the challenge, some of these steps cannot even be performed in a close-to-real-time fashion (example: we can only say there’s a change in seasonality after some time of observing the new pattern). Considering the challenges mentioned earlier, we have chosen an algorithm that combines basic preprocessing and statistics. This approach aligns with our expectations for the data's characteristics, offers ease of interpretation, allows us to control the false positive rate, and ensures fast execution while reducing the need for many of the preprocessing steps discussed previously.
Above, we noted that we are detecting anomalies for around 700 entities (locations and autonomous systems) at launch. This obviously does not represent the entire universe of countries and networks, and for good reason. As we discuss in this post, we need to see enough traffic from a given entity (have a strong enough signal) to be able to build relevant models and subsequently detect anomalies. For some smaller or sparsely populated countries, the traffic signal simply isn’t strong enough, and for many autonomous systems, we see little-to-no traffic from them, again resulting in a signal too weak to be useful. We are initially focusing on locations where we have a sufficiently strong traffic signal and/or are likely to experience traffic anomalies, as well as major or notable autonomous systems — those that represent a meaningful percentage of a location’s population and/or those that are known to have been impacted by traffic anomalies in the past.
Detecting anomalies
The approach we took to solve this problem involves creating a forecast that is a set of data points that correspond to our expectation according to what we’ve seen in historical data. This will be explained in the section Creating a forecast. We take this forecast and compare it to what we are actually observing — if what we are observing is significantly different from what we expect, then we call it an anomaly. Here, since we are interested in traffic drops, an anomaly will always correspond to lower traffic than the forecast / expected traffic. This comparison is elaborated in the section Comparing forecast with actual traffic.
In order to compute the forecast we need to fulfill the following business requirements:
We are mainly interested in traffic related to human activity.
The more timely we detect the anomaly, the more useful it is. This needs to take into account constraints such as data ingestion and data processing times, but once the data is available, we should be able to use the latest data point and detect if it is an anomaly.
A low False Positive (FP) rate is more important than a high True Positive (TP) rate. As an internal tool, this is not necessarily true, but as a publicly visible notification service, we want to limit spurious entries at the cost of not reporting some anomalies.
Selecting which entities to observe
Aside from the examples given above, the quality of the data highly depends on the volume of the data, and this means that we have different levels of data quality depending on which entity (location / AS) we are considering. As an extreme example, we don’t have enough data from Antarctica to reliably detect outages. Follows the process we used to select which entities are eligible to be observed.
For ASes, since we are mainly interested in Internet traffic that represents human activity, we use the number of users estimation provided by APNIC. We then compute the total number of users per location by summing up the number of users of each AS in that location, and then we calculate what percentage of users an AS has for that location (this number is also provided by the APNIC table in column ‘% of country’). We filter out ASes that have less than 1% of the users in that location. Here’s what the list looks like for Portugal — AS15525 (MEO-EMPRESAS) is excluded because it has less than 1% of users of the total number of Internet users in Portugal (estimated).
At this point we have a subset of ASes and a set of locations (we don’t exclude any location a priori because we want to cover as much as possible) but we will have to narrow it down based on the quality of the data to be able to reliably detect anomalies automatically. After testing several metrics and visually analyzing the results, we came to the conclusion that the best predictor of a stable signal is related to the volume of data, so we removed the entities that don’t satisfy the criteria of a minimum number of unique IPs daily in a two weeks period — the threshold is based on visual inspection.
Creating a forecast
In order to detect the anomalies in a timely manner, we decided to go with traffic aggregated every fifteen minutes, and we are forecasting one hour of data (four data points / blocks of fifteen minutes) that are compared with the actual data.
After selecting the entities for which we will detect anomalies, the approach is quite simple:
1. We look at the last 24 hours immediately before the forecast window and use that interval as the reference. The assumption is that the last 24 hours will contain information about the shape of what follows. In the figure below, the last 24 hours (in blue) corresponds to data transitioning from Friday to Saturday. By using the Euclidean distance, we get the six most similar matches to that reference (orange) — four of those six matches correspond to other transitions from Friday to Saturday. It also captures the holiday on Monday (August 14, 2023) to Tuesday, and we also see a match that is the most dissimilar to the reference, a regular working day from Wednesday to Thursday. Capturing one that doesn't represent the reference properly should not be a problem because the forecast is the median of the most similar 24 hours to the reference, and thus the data of that day ends up being discarded.
There are two important parameters that we are using for this approach to work:
We take into consideration the last 28 days (plus the reference day equals 29). This way we ensure that the weekly seasonality can be seen at least 4 times, we control the risk associated with the trend changing over time, and we set an upper bound to the amount of data we need to process. Looking at the example above, the first day was one with the highest similarity to the reference because it corresponds to the transition from Friday to Saturday.
The other parameter is the number of most similar days. We are using six days as a result of empirical knowledge: given the weekly seasonality, when using six days, we expect at most to match four days for the same weekday and then two more that might be completely different. Since we use the median to create the forecast, the majority is still four and thus those extra days end up not being used as reference. Another scenario is in the case of holidays such as the example below:
A holiday in the middle of the week in this case looks like a transition from Friday to Saturday. Since we are using the last 28 days and the holiday starts on a Tuesday we only see three such transitions that are matching (orange) and then another three regular working days because that pattern is not found anywhere else in the time-series and those are the closest matches. This is why we use the lower quartile when computing the median for an even number of values (meaning we round the data down to the lower values) and use the result as the forecast. This also allows us to be more conservative and plays a role in the true positive/false positive tradeoff.
Lastly let's look at the outage example:
In this case, the matches are always connected to low traffic because the last 24h (reference) corresponds to a transition from Sunday to Monday and due to the low traffic the lowest Euclidean distance (most similar 24h) are either Saturdays (two times) or Sundays (four times). So the forecast is what we would expect to see on a regular Monday and that’s why the forecast (red) has an upward trend but since we had an outage, the actual volume of traffic (black) is considerably lower than the forecast.
This approach works for regular seasonal patterns, as would several other modeling approaches, and it has also been shown to work in case of holidays and other moving events (such as festivities that don’t happen at the same day every year) without having to actively add that information in. Nevertheless, there are still use cases where it will fail specifically when there’s an offset in the data. This is one of the reasons why we use multiple data sources to reduce the chances of the algorithm being affected by data artifacts.
Below we have an example of how the algorithm behaves over time.
Comparing forecast with actual traffic
Once we have the forecast and the actual traffic volume, we do the following steps.
We calculate relative change, which measures how much one value has changed relative to another. Since we are detecting anomalies based on traffic drops, the actual traffic will always be lower than the forecast.
After calculating this metric, we apply the following rules:
The difference between the actual and the forecast must be at least 10% of the magnitude of the signal. This magnitude is computed using the difference between 95th and 5th percentiles of the selected data. The idea is to avoid scenarios where the traffic is low, particularly during the off-peaks of the day and scenarios where small changes in actual traffic correspond to big changes in relative change because the forecast is also low. As an example:
a forecast of 100 Gbps compared with an actual value of 80 Gbps gives us a relative change of -0.20 (-20%).
a forecast of 20 Mbps compared with an actual value of 10 Mbps gives us a much smaller decrease in total volume than the previous example but a relative change of -0.50 (50%).
Then we have two rules for detecting considerably low traffic:
Sustained anomaly: The relative change is below a given threshold α throughout the forecast window (for all four data points). This allows us to detect weaker anomalies (with smaller relative changes) that are extended over time.
Point anomaly: The relative change of the last data point of the forecast window is below a given threshold β (where β < α — these thresholds are negative; as an example, β and α might be -0.6 and -0.4, respectively). In this case we need β < α to avoid triggering anomalies due to the stochastic nature of the data but still be able to detect sudden and short-lived traffic drops.
The values of α and β were chosen empirically to maximize detection rate, while keeping the false positive rate at an acceptable level.
Closing an anomaly event
Although the most important message that we want to convey is when an anomaly starts, it is also crucial to detect when the Internet traffic volume goes back to normal for two main reasons:
We need to have the notion of active anomaly, which means that we detected an anomaly and that same anomaly is still ongoing. This allows us to stop considering new data for the reference while the anomaly is still active. Considering that data would impact the reference and the selection of most similar sets of 24 hours.
Once the traffic goes back to normal, knowing the duration of the anomaly allows us to flag those data points as outliers and replace them, so we don’t end up using it as reference or as best matches to the reference. Although we are using the median to compute the forecast, and in most cases that would be enough to overcome the presence of anomalous data, there are scenarios such as the one for AS203214 (HulumTele), used as example four, where the outages are frequently occurring at the same time of the day that would make the anomalous data become the expectation after few days.
Whenever we detect an anomaly we keep the same reference until the data comes back to normal, otherwise our reference would start including anomalous data. To determine when the traffic is back to normal, we use lower thresholds than α and we give it a time period (currently four hours) where there should be no anomalies in order for it to close. This is to avoid situations where we observe drops in traffic that bounce back to normal and drop again. In such cases we want to detect a single anomaly and aggregate it to avoid sending multiple notifications, and in terms of semantics there’s a high chance that it’s related to the same anomaly.
Conclusion
Internet traffic data is generally predictable, which in theory would allow us to build a very straightforward anomaly detection algorithm to detect Internet disruptions. However, due to the heterogeneity of the time series depending on the entity we are observing (Location or AS) and the presence of artifacts in the data, it also needs a lot of context that poses some challenges if we want to track it in real-time. Here we’ve shown particular examples of what makes this problem challenging, and we have explained how we approached this problem in order to overcome most of the hurdles. This approach has been shown to be very effective at detecting traffic anomalies while keeping a low false positive rate, which is one of our priorities. Since it is a static threshold approach, one of the downsides is that we are not detecting anomalies that are not as steep as the ones we’ve shown.
We will keep working on adding more entities and refining the algorithm to be able to cover a broader range of anomalies.
Cloudflare operates in more than 300 cities in over 100 countries, where we interconnect with over 12,000 network providers in order to provide a broad range of services to millions of customers. The breadth of both our network and our customer base provides us with a unique perspective on Internet resilience, enabling us to observe the impact of Internet disruptions.
As we have noted in the past, this post is intended as a summary overview of observed disruptions, and is not an exhaustive or complete list of issues that have occurred during the quarter.
Government directed
Late spring often marks the start of a so-called “exam season” in several Middle Eastern and African countries, where students sit for a series of secondary school exams. In an attempt to prevent cheating on these exams, governments in the countries have taken to implementing wide-scale Internet shutdowns covering time periods just before and during the exams. We have covered these shutdowns in the past, including Sudan and Syria in 2021 and Syria, Sudan, and Algeria in 2022. This year, we saw governments in Iraq, Algeria, and Syria taking such actions.
Iraq
In the weeks prior to the start of this year’s shutdowns, it was reported that the Iraqi Ministry of Communications had announced it had refused a request from the Ministry of Education to impose an Internet shutdown during the exams as part of efforts to prevent cheating. Unfortunately, this refusal was short-lived, with shutdowns ultimately starting two weeks later.
In Iraq, two sets of shutdowns were observed: one impacted networks nationwide, except for the Kurdistan Region, while the other impacted networks within the Kurdistan Region. The former set of shutdowns were related to 9th and 12th grade exams, and were scheduled to occur from June 1 through July 15, between 04:00 and 08:00 local time (01:00 – 05:00 UTC). The graphs below show that during June, shutdowns took place on June 1, 4, 6, 8, 11, 13, 15, 17, 21, 22, 24, 25, and 26, resulting in significant disruptions to Internet connectivity. The shutdowns were implemented across a number of network providers, including AS203214 (HulumTele), AS59588 (Zain), AS199739 (Earthlink), AS203735 (Net Tech), AS51684 (Asiacell), and AS58322 (Halasat). The orange-highlighted areas in the graphs below show traffic on each network provider dropping to zero during the shutdowns.
As noted above, exam-related Internet shutdowns were also implemented in the Kurdistan region of Iraq. One report quoted the Minister of Education of the Kurdistan Regional Government as stating "The Internet will be turned off as needed during exams, but just like in previous years, the period of the Internet shutdown will not be lengthy, but rather short.” To that end, the observed shutdowns generally lasted about two hours, occurring between 06:30 and 08:30 local time (03:30 – 05:30 UTC) on June 3, 6, 10, 13, 17, and 24. The graphs below show the impact across three network providers in the region: AS21277 (Newroz Telecom), AS48492 (IQ Online), and AS59625 (KorekTel).
2023 marks the sixth year that Algeria has disrupted Internet connectivity to prevent cheating during nationwide exams. In 2022, we noted that “it appears that the Algerian government has shifted to a content blocking-based approach, instead of a wide-scale Internet shutdown.” It appears that the same approach was taken this year, as we again observed two nominal drops in traffic during each of the exam days, rather than a complete loss of traffic. These traffic shifts were observed on mobile network providers AS33779 (Ooredoo/Wataniya), AS327931 (Djezzy/Optimum), and AS327712 (Mobilis/Telecom Algeria). The first disruption takes place between 08:00 – 12:00 local time (07:00 – 11:00 UTC), with the second occurring between 14:00 – 17:00 local time (13:00 – 16:00 UTC).
Syria
After implementing four exam-related Internet shutdowns in 2022, this year saw just two. On June 25 and 26, Internet shutdowns took place between 05:00 – 08:30 local time (02:00 – 05:30 UTC). Syrian Telecom (AS29256), the government-affiliated telecommunications company, informed subscribers in a Facebook post that the Internet would be cut off at the request of the Ministry of Education.
Senegal
In Senegal, violent protests over the sentencing of opposition leader Ousmane Sonko to jail led the government to restrict access to platforms including WhatsApp, Facebook, Twitter, Instagram, TikTok, Telegram, Signal, and YouTube. On June 4, the Senegal Ministry of Communication issued a statement temporarily suspending mobile Internet access, with a followup statement on June 6 ending the suspension. These disruptions to mobile Internet access were visible on two network providers within the country: AS37196 (Sudatel Senegal) and AS37649 (Tigo/Free).
As shown in the graphs below, the shutdowns on Sudatel Senegal occurred from 15:00 local time on June 3 through 01:00 local time on June 5, and then again from 13:00 local time on June 5 until 01:00 local time on June 6. The three shutdowns seen on Tigo/Free took place between 15:30 – 19:00 local time on June 3, from 13:45 local time on June 4 until 02:05 local time on June 5, and from 13:05 local time on June 5 through 01:00 local time on June 6. (Senegal is UTC+0, so the local times are the same as UTC.)
Mauritania
In Mauritania, authorities cut off mobile Internet services after protests over the death of a young man in police custody. The shutdown began at 23:00 local time on May 30, and lasted six days, with connectivity returning at 23:00 local time on June 6. (Mauritania is UTC+0, so the local times are the same as UTC.) The graphs below show a near complete loss of Internet traffic during that period from AS37541 (Chinguitel) and AS37508 (Mattel), two mobile network providers within the country.
Pakistan
On May 9, Imran Khan, former Prime Minister of Pakistan was arrested on corruption charges. Following the arrest, violent protests erupted in several cities, leading the government of Pakistan to order the shutdown of mobile Internet services, as well as the blocking of several social media platforms. The figures below show the impact of the ordered shutdown to traffic on four mobile network providers within the country: AS24499 (Telenor Pakistan), AS59257 (China Mobile Pak), AS45669 (Mobilink/Jazz), and AS56167 (Ufone/PTML). The ordered shutdown caused a complete loss of Internet traffic from these networks that started at 22:00 local time (17:00 UTC) on May 9 at Telenor and China Mobile Pakistan, 18:00 local time (13:00 UTC) on Mobilink/Jazz, and 01:00 local time on May 10 (20:00 UTC on May 9) at Ufone/PTML. Traffic was restored at 22:00 local time (17:00 UTC) on May 12.
Looking at Cloudflare Radar’s recently launchedInternet Quality page for Pakistan during the duration of the shutdown, we observed that median latency within Pakistan dropped slightly after mobile networks were shut down, shown in the graph below. Prior to the shutdown, median latency (as observed to Cloudflare and a set of other providers) was in the 90-100ms range, while afterward, it averaged closer to 75ms. This may be a result of users shifting to lower latency fixed broadband connections – several fixed broadband providers in the country experienced increased traffic volumes while the mobile networks were unavailable.
Additional details about the mobile network shutdowns, content blocking, and the impact at an administrative unit and city level can be found in our May 12 blog post Cloudflare’s view of Internet disruptions in Pakistan.
India
Internet shutdowns are unfortunately frequent in India, with digital rights organization Access Now reporting at least 84 shutdowns within the country in 2022. The shutdowns are generally implemented at a more local level, and often last for a significant amount of time. One such shutdown took place in the northeastern Indian state of Manipur starting on May 3 after the escalation of ethnic conflict, and was reportedly intended to “thwart the design and activities of anti-national and anti-social elements… by stopping the spread of disinformation and false rumours'' and the likelihood of “serious disturbances to the entire peaceful coexistence of the communities and maintenance of public order”. Mobile data services were initially suspended for a five-day period, with the suspension continually extended through additional templated orders issued every five days.
The graphs below show the impact of the ordered shutdown to traffic from two major network providers in Manipur. Traffic from both AS45609 (Airtel) and AS9829 (BSNL) fell significantly around 18:00 local time (12:30 UTC) on May 4. Traffic on Airtel has remained low, and continued to drop further through the end of June. Traffic on BSNL showed slight signs of recovery starting in early June, but remains extremely low.
The shutdown order remains in place as of the time of this writing (late July).
Severe weather
Guam
On May 24, “Super Typhoon” Mawar wreaked havoc on the US territory of Guam, causing widespread physical damage after it made landfall, taking down trees, buildings, power lines, and communications infrastructure across the island. One result of this damage was a significant disruption to Internet connectivity, as shown in the country-level graph below. Restoration efforts started almost immediately, with Guam Power Authority, Docomo Pacific, and GTA Teleguam all posting regular status updates on their websites and/or social media accounts.
Among the two Internet providers, GTA Teleguam (AS9246) was largely able to complete service restoration in June, with traffic returning to pre-storm levels around June 17, as seen in the graph below. In fact, in a June 20 Facebook post they noted that “As of today, a majority of our wireless network cell sites are operational.” However, recovery at Docomo Pacific (AS3605) is taking significantly longer. The graph below shows that as of the end of June, traffic remained significantly below pre-storm levels.
Cable damage
Bolivia
On June 19, COTAS, a Bolivian telecommunications company, posted an update on their Facebook page that alerted users that a fiber optic cable had been cut in the town of Pongo. As seen in the graphs below, this cut significantly disrupted Internet connectivity across COTAS and two other network providers in the country: AS25620 (COTAS), AS27839 (Comteco), and AS52495 (Cotel) between 13:00 – 18:00 local time (17:00 – 22:00 UTC).
The Gambia
Gamtel, the state telecommunications company in The Gambia, notified subscribers via a Twitter post on June 7 of a localized fiber cut, and then of additional cable cuts on June 8. These fiber cuts disrupted Internet connectivity on AS25250 (Gamtel) between 14:00 local time on June 7 and 00:00 local time on June 9, with traffic volumes down as much as 80% as compared to the previous period. (The Gambia is UTC+0, so the local times are the same as UTC.)
Philippines
An advisory posted on Twitter by Philippines telecommunications provider PLDT at 18:43 local time (10:43 UTC) on June 5 stated “One of our submarine cable partners confirms a loss in some of its internet bandwidth capacity, and thus causing slower Internet browsing. We are working with our partners to provide alternate capacity that would restore the browsing experience in the next few hours.” The traffic graph below shows a minor disruption to Internet traffic for AS9299 (PLDT) starting around 14:00 local time (06:00 UTC), and the “slower Internet browsing” noted by PLDT is evident in the Internet quality graphs below, with increased latency and decreased bandwidth evident around that same time. PLDT stated in a subsequent tweet that as of 06:22 local time on June 6 (22:22 UTC on June 5), “Our submarine cable partner confirms supplementing additional capacity, restoring browser experience.”
Power outages
Curaçao
Aqualectra is the primary utility company in Curaçao, providing water and power services. On June 8, they posted a series of alerts to their Facebook page (1, 2, 3, 4) regarding a power outage impacting “all neighborhoods”, caused by a malfunction in one of the main power cables connected to the substation at Parera. This loss of power impacted Internet connectivity on the island, with a significant loss of traffic observed at a country level, as seen in the graph below, as well as across several Internet service providers, including AS11081 (UTS), AS52233 (Columbus Communications), and AS27660 (Curaçao Telecom). A followup Facebook post dated 01:25 local time on June 9 (05:25 UTC) confirmed the restoration of power to all neighborhoods.
Portugal
A power outage at an Equinix data center in Prior Velho (near Lisbon) on the afternoon of June 6 affected local utilities, banking services, and court networks, according to published reports (1, 2). Portuguese Internet service provider MEO was also impacted by the power outage, which caused a drop in traffic for AS3243 (MEO-RESIDENCIAL) and AS15525 (MEO-EMPRESAS), seen in the graphs below. The disruptions caused by the power outage also impacted connectivity quality within Portugal, as the Radar Internet quality graphs below highlight – a concurrent drop in bandwidth and increase in latency is visible, indicating that end users likely experienced poorer performance during that period of time.
Botswana
A countrywide power outage in Botswana on May 19 caused an Internet disruption that lasted about 90 minutes, from 10:45 until 12:15 local time (08:45 – 10:15 UTC), visible in the graph below. A tweet from Botswana Power Corporation provided public notice of the incident, but did not include a root cause.
Barbados
On April 4, The Barbados Light & Power Company tweeted an “Outage Notice”, stating “We are aware that our customers across the island are currently without electricity.” Posted at 11:46 local time (15:46 UTC), the notice comes shortly after a significant drop in traffic was observed country-wide, indicating that the power outage also impacted Internet connectivity across the country. After posting several additional updates throughout the day, a final update posted at 18:00 local time (22:00 UTC) indicated that power had been restored to 100% of impacted customers. The graph below shows that traffic took several additional hours to return to normal levels. (Note that the orange highlighting in the graph represents the duration of the disruption, and the red shading is related to an internal data collection issue.)
Technical problems
Namibia
A seven-hour Internet disruption observed in Namibia on June 15 and 16 was caused by unspecified “technical challenges” faced by Telecom Namibia. According to a tweet from the provider, “Telecom Namibia experienced technical challenges on its fixed and mobile data services on Thursday leading to intermittent Internet connectivity.” The impact of these challenges is visible in both the country- and network-level traffic graphs below.
Solomon Islands
Unspecified “technical reasons” also disrupted mobile Internet connectivity for Our Telekom customers in the Solomon Islands on April 26 and 27. An April 26 Facebook post from Our Telekom simply stated “Our mobile data network is currently down due to technical reasons.” The graphs below show a significant drop in traffic for AS45891 (Our Telekom/SBT) between 06:30 local time on April 27 (19:30 UTC on April 26) and 17:00 local time on April 27 (06:00 UTC). The loss of mobile traffic from Our Telekom also impacted traffic at a country level, as the graph shows a similar disruption for the Solomon Islands.
SpaceX Starlink
With an increasingly global service footprint, disruptions observed on SpaceX Starlink potentially impact users across multiple countries around the world. Just before midnight UTC on April 7, Internet traffic seen from AS14593 (SpaceX-Starlink) began to decline significantly. The disruption was short-lived, with traffic returning to expected levels within two hours. According to a Twitter post from Elon Musk, CEO of SpaceX, the problem was “Caused by expired ground station cert” (an expired digital certificate associated with one or more Starlink ground stations, likely preventing communication between the satellite constellation and the ground station(s)).
Madagascar
In Madagascar, a “problem with the backbone”, reported by Telma Madagascar, caused a loss of as much as two-thirds of Internet traffic between 09:15 – 14:00 local time (06:15 – 11:00 UTC) on April 7. The graphs below show that the backbone issue disrupted traffic at a national level, as well as for AS37054 (Telma Madagascar).
United Kingdom
On April 4, UK Internet provider Virgin Media suffered multiple service disruptions that impacted Internet connectivity for broadband customers. The first outage started just before 01:00 local time (midnight UTC)l, lasting until approximately 09:00 local time (08:00 UTC). The second outage started around 16:00 local time (15:00 UTC), with traffic volumes going up and down over the next several hours before appearing to stabilize around 21:30 local time (20:30 UTC).
Virgin Media’s Twitter account acknowledged the early morning disruption several hours after it began, posting “We’re aware of an issue that is affecting broadband services for Virgin Media customers as well as our contact centres. Our teams are currently working to identify and fix the problem as quickly as possible and we apologise to those customers affected.” A subsequent post after service restoration noted “We’ve restored broadband services for customers but are closely monitoring the situation as our engineers continue to investigate. We apologise for any inconvenience caused.”
However, the second disruption was acknowledged on Virgin Media’s Twitter account much more rapidly, with a post at 16:25 UTC stating “Unfortunately we have seen a repeat of an earlier issue which is causing intermittent broadband connectivity problems for some Virgin Media customers. We apologise again to those impacted, our teams are continuing to work flat out to find the root cause of the problem and fix it.”
Although no additional details have been shared via social media by Virgin Media about the outages or their resolution, some additional information was shared via Twitter by an apparent customer, who posted “Virgin Media engineers re-seated fibre cards and reset hub equipment to restore service. TTL was extended as a workaround to maintain stability whilst a permanent fix is implemented.”
A little more than a year later, on May 26, we observed an Internet outage at Miranda Media. Traffic started to fall around 16:30 local time (13:30 UTC), dropping to zero around 18:15 local time (15:15 UTC). The outage disrupted connectivity on the Crimean Peninsula and parts of occupied Ukraine and lasted until approximately 06:00 local time on May 27 (03:00 UTC). Published reports (1,2) suggest that the outage was due to a cyberattack targeting Miranda Media, reportedly carried out by Ukrainian hacktivists.
Russia
Russian satellite provider Dozor Teleport, whose customers include Russia’s Ministry of Defense, ships of the Northern Fleet, Russian energy firm Gazprom, remote oil fields, the Bilibino nuclear power plant, the Federal Security Service (FSB), Rosatom, and other organizations, experienced a multi-hour outage on June 29. The outage, which occurred between 01:30 – 17:30 UTC, was reportedly the result of a cyberattack that at least two groups claimed responsibility for.
Military action
Chad
Multiple Internet disruptions occurred in Chad on April 23 and 24, impacting several Internet providers, and were ultimately visible at a country level as well. As seen in the graphs below, the outages occurred from 04:30 – 06:00 local time (03:30 – 05:00 UTC) and 15:00 – 20:00 local time (14:00 – 19:00 UTC) on April 23, and 04:00 – 08:30 local time (03:00 – 07:30 UTC) on April 24. The impacted network providers in Chad included AS327802 (Millicom Chad), AS327756 (Airtel Chad), AS328594 (Sudat Chad), and AS327975 (ILNET-TELECOM). The outages were reportedly caused by damage to fiber infrastructure that links Chad with neighboring Cameroon and Sudan, with the latter experiencing Internet service disruptions amid clashes between the Sudanese Armed Forces (SAF) and Rapid Support Forces (RSF).
Sudan
As noted above, military action in Sudan disrupted Internet connectivity in Chad in April. Starting in mid-April, multiple Internet outages were observed at major Sudanese Internet providers, three of which are shown in the graphs below. The fighting in the country has led to fuel shortages and power cuts, ultimately disrupting Internet connectivity.
AS15706 (Sudatel) experienced complete Internet outages from 03:00 on April 23 to 17:00 on April 24 local time (01:00 on April 23 to 15:00 on April 24 UTC) and again from 03:00 on April 25 until 01:00 on April 28 local time (01:00 on April 25 to 23:00 on April 27 UTC). Internet connectivity on AS36972 (MTN) was disrupted between 03:00 and 12:00 local time on April 16 (01:00 – 10:00 UTC) and again between 20:00 on April 27 until 02:00 on April 29 (18:00 on April 27 to 00:00 on April 29). After a nominal multi-day recovery, a long-term near complete outage started on May 5, lasting for multiple weeks. Similar to MTN, multiple extended outages were also observed on AS33788 (Kanar Telecommunication). After seeing a significant drop in traffic midday on April 19, a near complete outage is visible between 12:00 on April 21 and 01:00 on April 29 (10:00 on April 21 to 23:00 on April 28 UTC), with a very brief minor recovery late in the day on April 24. A longer duration outage began around 00:00 local time on May 11 (22:00 on May 10 UTC), also lasting for multiple weeks.
Togo, Republic of Congo (Brazzaville), Burkina Faso
Repair work on the West Africa Cable System (WACS) submarine cable disrupted Internet connectivity across multiple countries, including Togo, Republic of Congo (Brazzaville), and Burkina Faso on April 6. According to the Google translation of a Facebook post from Canalbox Congo, the repair work was likely to cause “very strong disruptions on Internet connections with the risk of a total outage”. (Canalbox (GVA) is an African telecommunications operator that provides services across multiple countries in Africa.)
The graph below for AS36924 (GVA-Canalbox) shows three overlapping outage annotations, with each related to a disruption observed on that autonomous system (network) in one of the impacted countries. In the Republic of Congo (Brazzaville), a significant traffic disruption is visible between 16:15 – 23:15 local time (15:15 – 22:15 UTC). In Burkina Faso, the disruption happened earlier and was less severe, taking place between 09:15 – 18:00 local time (09:15 – 18:00 UTC), with a similar impact in Togo, where traffic was disrupted between 11:00 – 23:15 local time (11:00 – 23:15 UTC).
Conclusion
Because of how tightly interwoven the Internet has become with commerce, financial services, and everyday life around the world, any disruption to Internet connectivity ultimately carries an economic impact. The providers impacted by disruptions caused by unexpected or unavoidable events such as cable cuts or severe weather generally try to minimize the scope and duration of such disruptions, ultimately limiting the economic impact. However, in the case of government-directed Internet shutdowns, the damage to the economy is ultimately self-inflicted. The Internet Society’s new Net Loss Calculator now provides a way to quantify this damage, enabling the public, advocacy groups, and governments themselves to understand the potential cost of an Internet shutdown from gross domestic product (GDP), foreign direct investment (FDI), and unemployment perspectives.
To provide the best experiences, we use technologies like cookies to store and/or access device information. Consenting to these technologies will allow us to process data such as browsing behavior or unique IDs on this site. Not consenting or withdrawing consent, may adversely affect certain features and functions.
Functional
Always active
The technical storage or access is strictly necessary for the legitimate purpose of enabling the use of a specific service explicitly requested by the subscriber or user, or for the sole purpose of carrying out the transmission of a communication over an electronic communications network.
Preferences
The technical storage or access is necessary for the legitimate purpose of storing preferences that are not requested by the subscriber or user.
Statistics
The technical storage or access that is used exclusively for statistical purposes.The technical storage or access that is used exclusively for anonymous statistical purposes. Without a subpoena, voluntary compliance on the part of your Internet Service Provider, or additional records from a third party, information stored or retrieved for this purpose alone cannot usually be used to identify you.
Marketing
The technical storage or access is required to create user profiles to send advertising, or to track the user on a website or across several websites for similar marketing purposes.