Post Syndicated from Brian van Baekel original https://blog.zabbix.com/low-level-discovery-with-dependent-items/13634/
The low-level discovery was introduced in Zabbix 2.0 and still belongs to one of the all-time favorites. Before LLD was available, adding items was all manual work. For example adding new disks, new interfaces, network ports on switches and everything else was all manual labor. And then LLD came around and suddenly we were able to ‘discover’ entities, and based on those discovered entities we can add new items, triggers, and such automatically.
Contents
- Low-Level Discovery setup
- Dependent items
- Combing Low-Level Discovery and Dependent items
- Conclusion
For a video guide, check out the Zabbix YouTube here: Zabbix: Low Level Discovery with Dependent items – YouTube
Low-Level Discovery setup
Let’s go over the idea of Low-Level Discovery first.
For the sake of clarity, we will stick with the default Zabbix agent item. Of course, as we will discover it’s only the format that matters for Zabbix to consider a response as LLD information. Let’s use built-in agent key: vfs.fs.discovery. Once we force the Zabbix agent to execute this item, it will reply with something like this:
[{"{#FSNAME}":"/sys","{#FSTYPE}":"sysfs"},{"{#FSNAME}":"/proc","{#FSTYPE}":"proc"},{"{#FSNAME}":"/dev","{#FSTYPE}":"devtmpfs"},{"{#FSNAME}":"/sys/kernel/security","{#FSTYPE}":"securityfs"},{"{#FSNAME}":"/dev/shm","{#FSTYPE}":"tmpfs"},{"{#FSNAME}":"/dev/pts","{#FSTYPE}":"devpts"},{"{#FSNAME}":"/run","{#FSTYPE}":"tmpfs"},{"{#FSNAME}":"/sys/fs/cgroup","{#FSTYPE}":"tmpfs"},{"{#FSNAME}":"/sys/fs/cgroup/systemd","{#FSTYPE}":"cgroup"},{"{#FSNAME}":"/sys/fs/pstore","{#FSTYPE}":"pstore"},{"{#FSNAME}":"/sys/firmware/efi/efivars","{#FSTYPE}":"efivarfs"},{"{#FSNAME}":"/sys/fs/bpf","{#FSTYPE}":"bpf"},{"{#FSNAME}":"/sys/fs/cgroup/net_cls,net_prio","{#FSTYPE}":"cgroup"},{"{#FSNAME}":"/sys/fs/cgroup/devices","{#FSTYPE}":"cgroup"},{"{#FSNAME}":"/sys/fs/cgroup/hugetlb","{#FSTYPE}":"cgroup"},{"{#FSNAME}":"/sys/fs/cgroup/memory","{#FSTYPE}":"cgroup"},{"{#FSNAME}":"/sys/fs/cgroup/rdma","{#FSTYPE}":"cgroup"},{"{#FSNAME}":"/sys/fs/cgroup/freezer","{#FSTYPE}":"cgroup"},{"{#FSNAME}":"/sys/fs/cgroup/cpu,cpuacct","{#FSTYPE}":"cgroup"},{"{#FSNAME}":"/sys/fs/cgroup/cpuset","{#FSTYPE}":"cgroup"},{"{#FSNAME}":"/sys/fs/cgroup/perf_event","{#FSTYPE}":"cgroup"},{"{#FSNAME}":"/sys/fs/cgroup/blkio","{#FSTYPE}":"cgroup"},{"{#FSNAME}":"/sys/fs/cgroup/pids","{#FSTYPE}":"cgroup"},{"{#FSNAME}":"/sys/kernel/tracing","{#FSTYPE}":"tracefs"},{"{#FSNAME}":"/sys/kernel/config","{#FSTYPE}":"configfs"},{"{#FSNAME}":"/","{#FSTYPE}":"xfs"},{"{#FSNAME}":"/sys/fs/selinux","{#FSTYPE}":"selinuxfs"},{"{#FSNAME}":"/proc/sys/fs/binfmt_misc","{#FSTYPE}":"autofs"},{"{#FSNAME}":"/dev/hugepages","{#FSTYPE}":"hugetlbfs"},{"{#FSNAME}":"/dev/mqueue","{#FSTYPE}":"mqueue"},{"{#FSNAME}":"/sys/kernel/debug","{#FSTYPE}":"debugfs"},{"{#FSNAME}":"/sys/fs/fuse/connections","{#FSTYPE}":"fusectl"},{"{#FSNAME}":"/boot","{#FSTYPE}":"ext4"},{"{#FSNAME}":"/boot/efi","{#FSTYPE}":"vfat"},{"{#FSNAME}":"/home","{#FSTYPE}":"xfs"},{"{#FSNAME}":"/run/user/0","{#FSTYPE}":"tmpfs"}]
When we put this in a more readable format (truncated) it will look like this:
[
{
"{#FSNAME}":"/sys",
"{#FSTYPE}":"sysfs"
},
{
"{#FSNAME}":"/proc",
"{#FSTYPE}":"proc"
},
{
"{#FSNAME}":"/dev",
"{#FSTYPE}":"devtmpfs"
},
{
"{#FSNAME}":"/sys/kernel/config",
"{#FSTYPE}":"configfs"
},
{
"{#FSNAME}":"/",
"{#FSTYPE}":"xfs"
},
{
"{#FSNAME}":"/boot",
"{#FSTYPE}":"ext4"
},
{
"{#FSNAME}":"/home",
"{#FSTYPE}":"xfs"
}
]
In this format it suddenly becomes clear, we have the {#FSNAME} macro, with the name of a filesystem, combined with the type, captured in {#FSTYPE}.
Perfect! We feed this information into Zabbix, and LLD magic will happen.
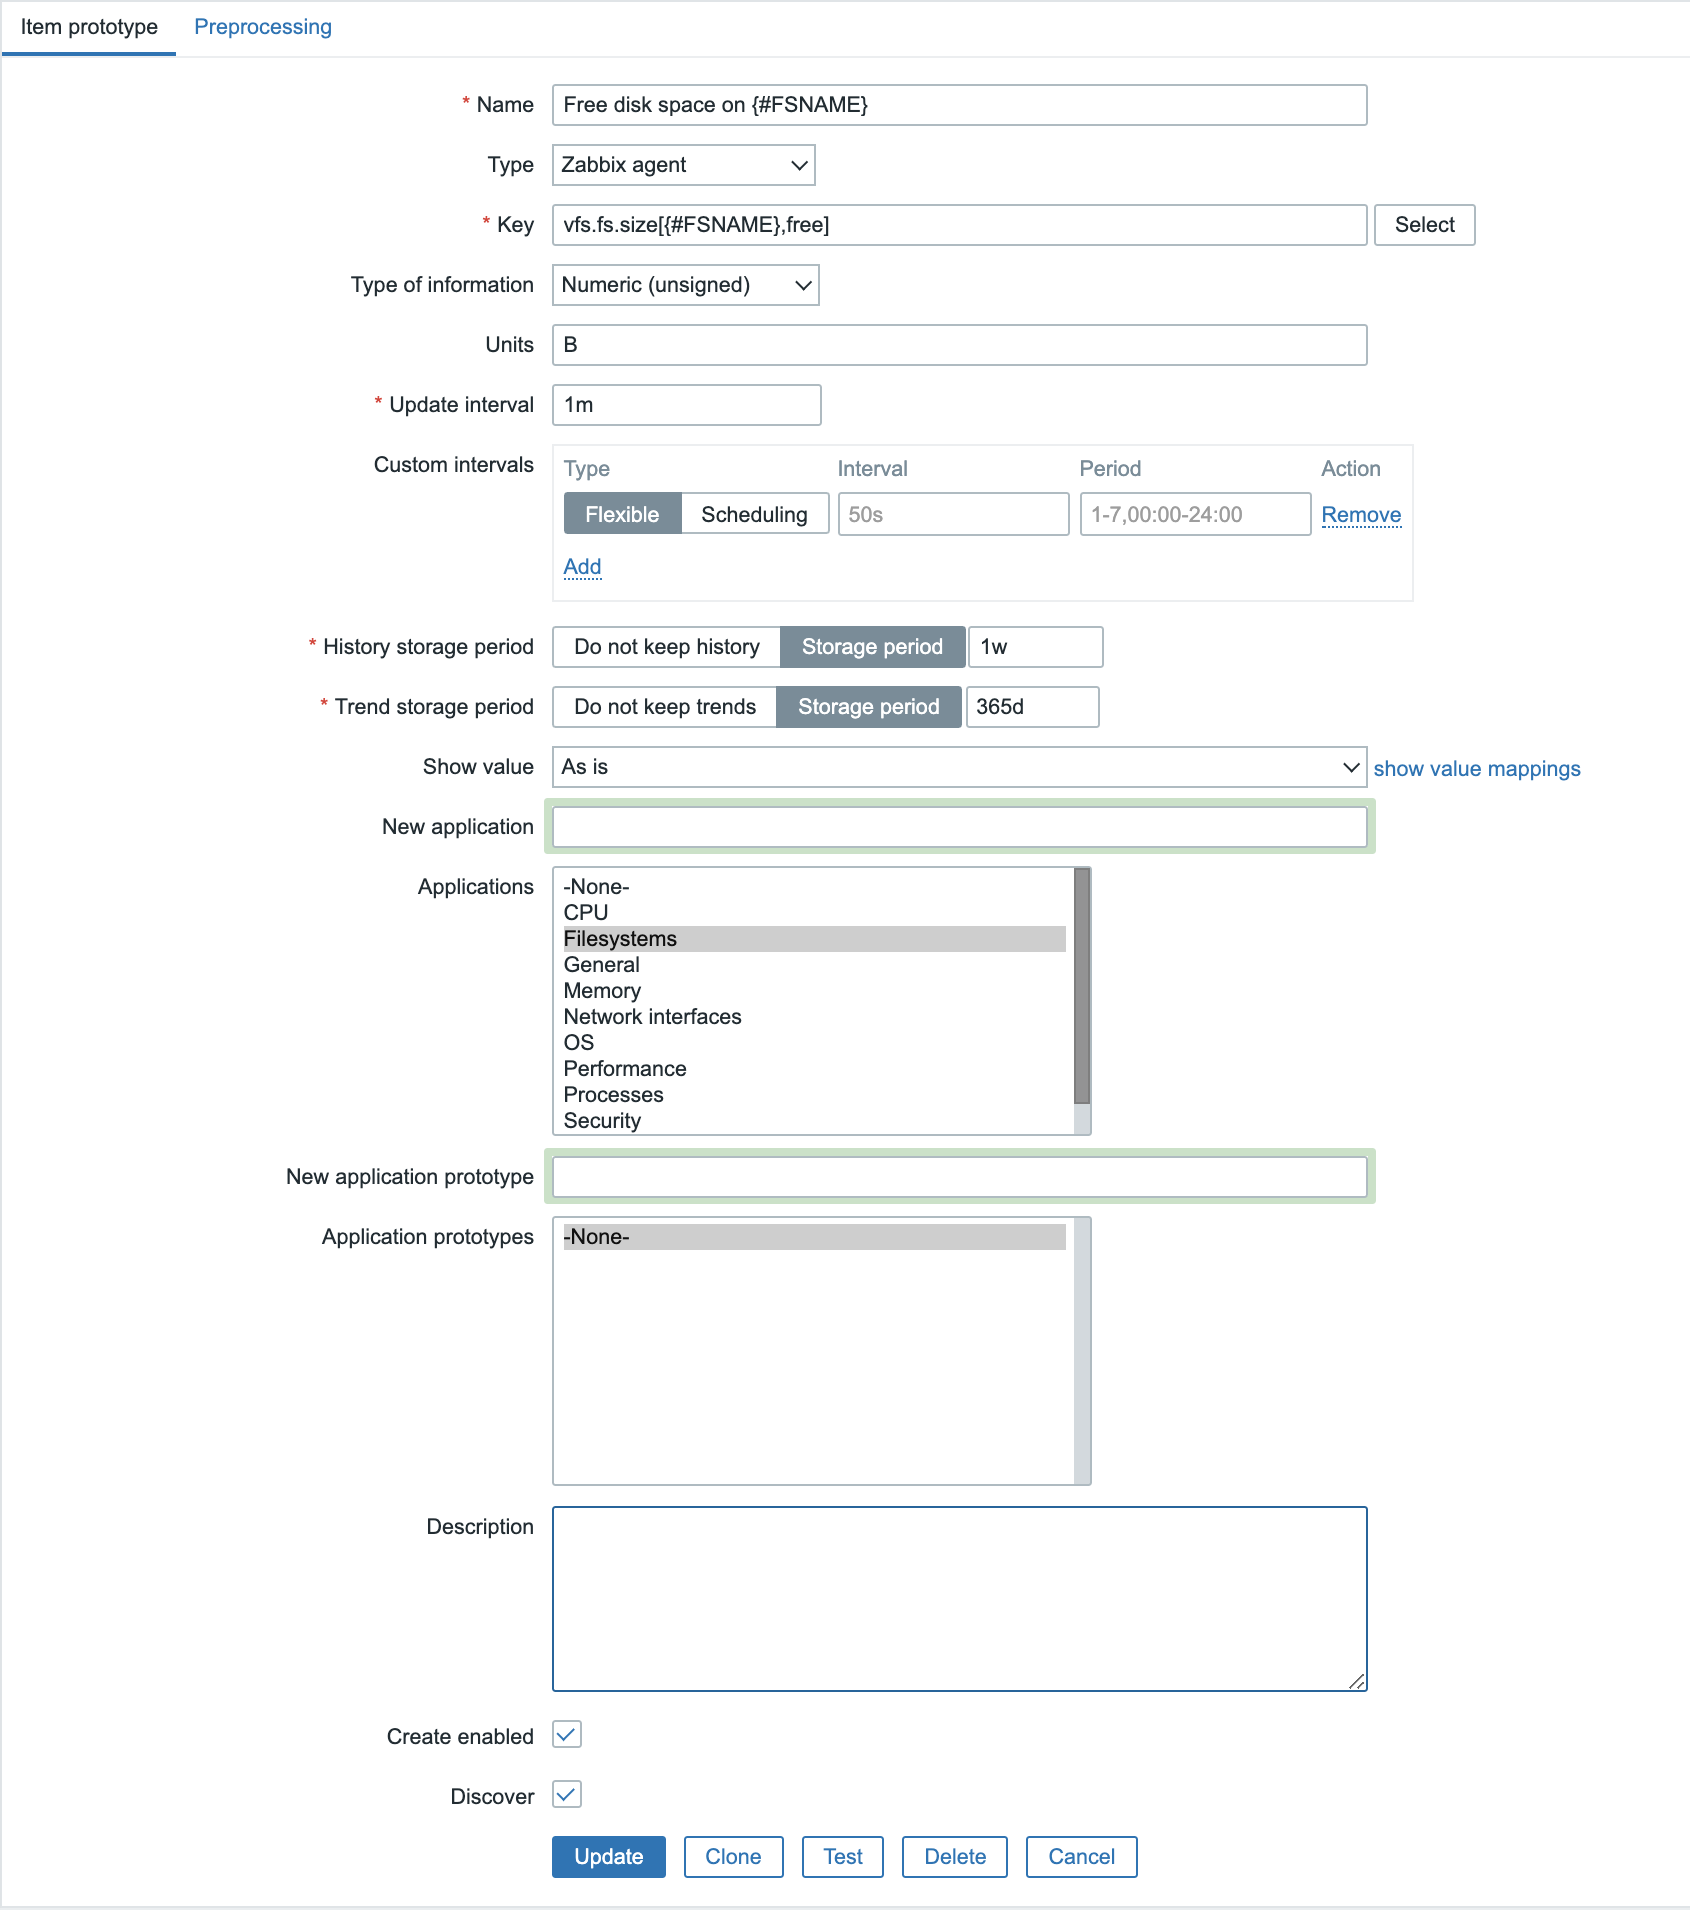
Based on the Item prototypes, new items per {#FSNAME} will be added, and monitoring will start on those items.
Looking at the Item prototypes, they look a lot like normal items:

So, we have one item prototype that is responsible for providing the LLD information, and then the created ‘normal’ items to query the filesystem statistics. As you can imagine, with just 5 filesystems and 1 metric per filesystem, queried once per minute, no problem. But what if we have 50 filesystems, 7 metrics per filesystem and they get queried every 10 seconds… That’s a lot of queries against the host! Not only does that add load to the Zabbix server, but obviously also to the monitored host. It works, but is it ideal? It certainly isn’t!
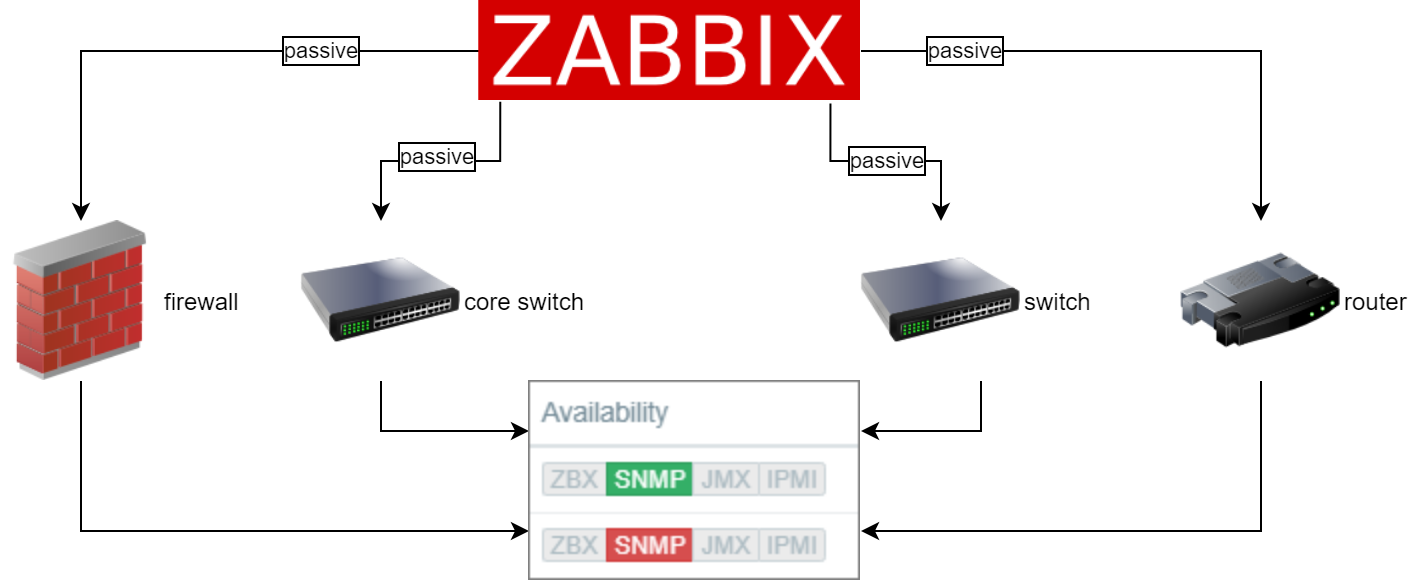
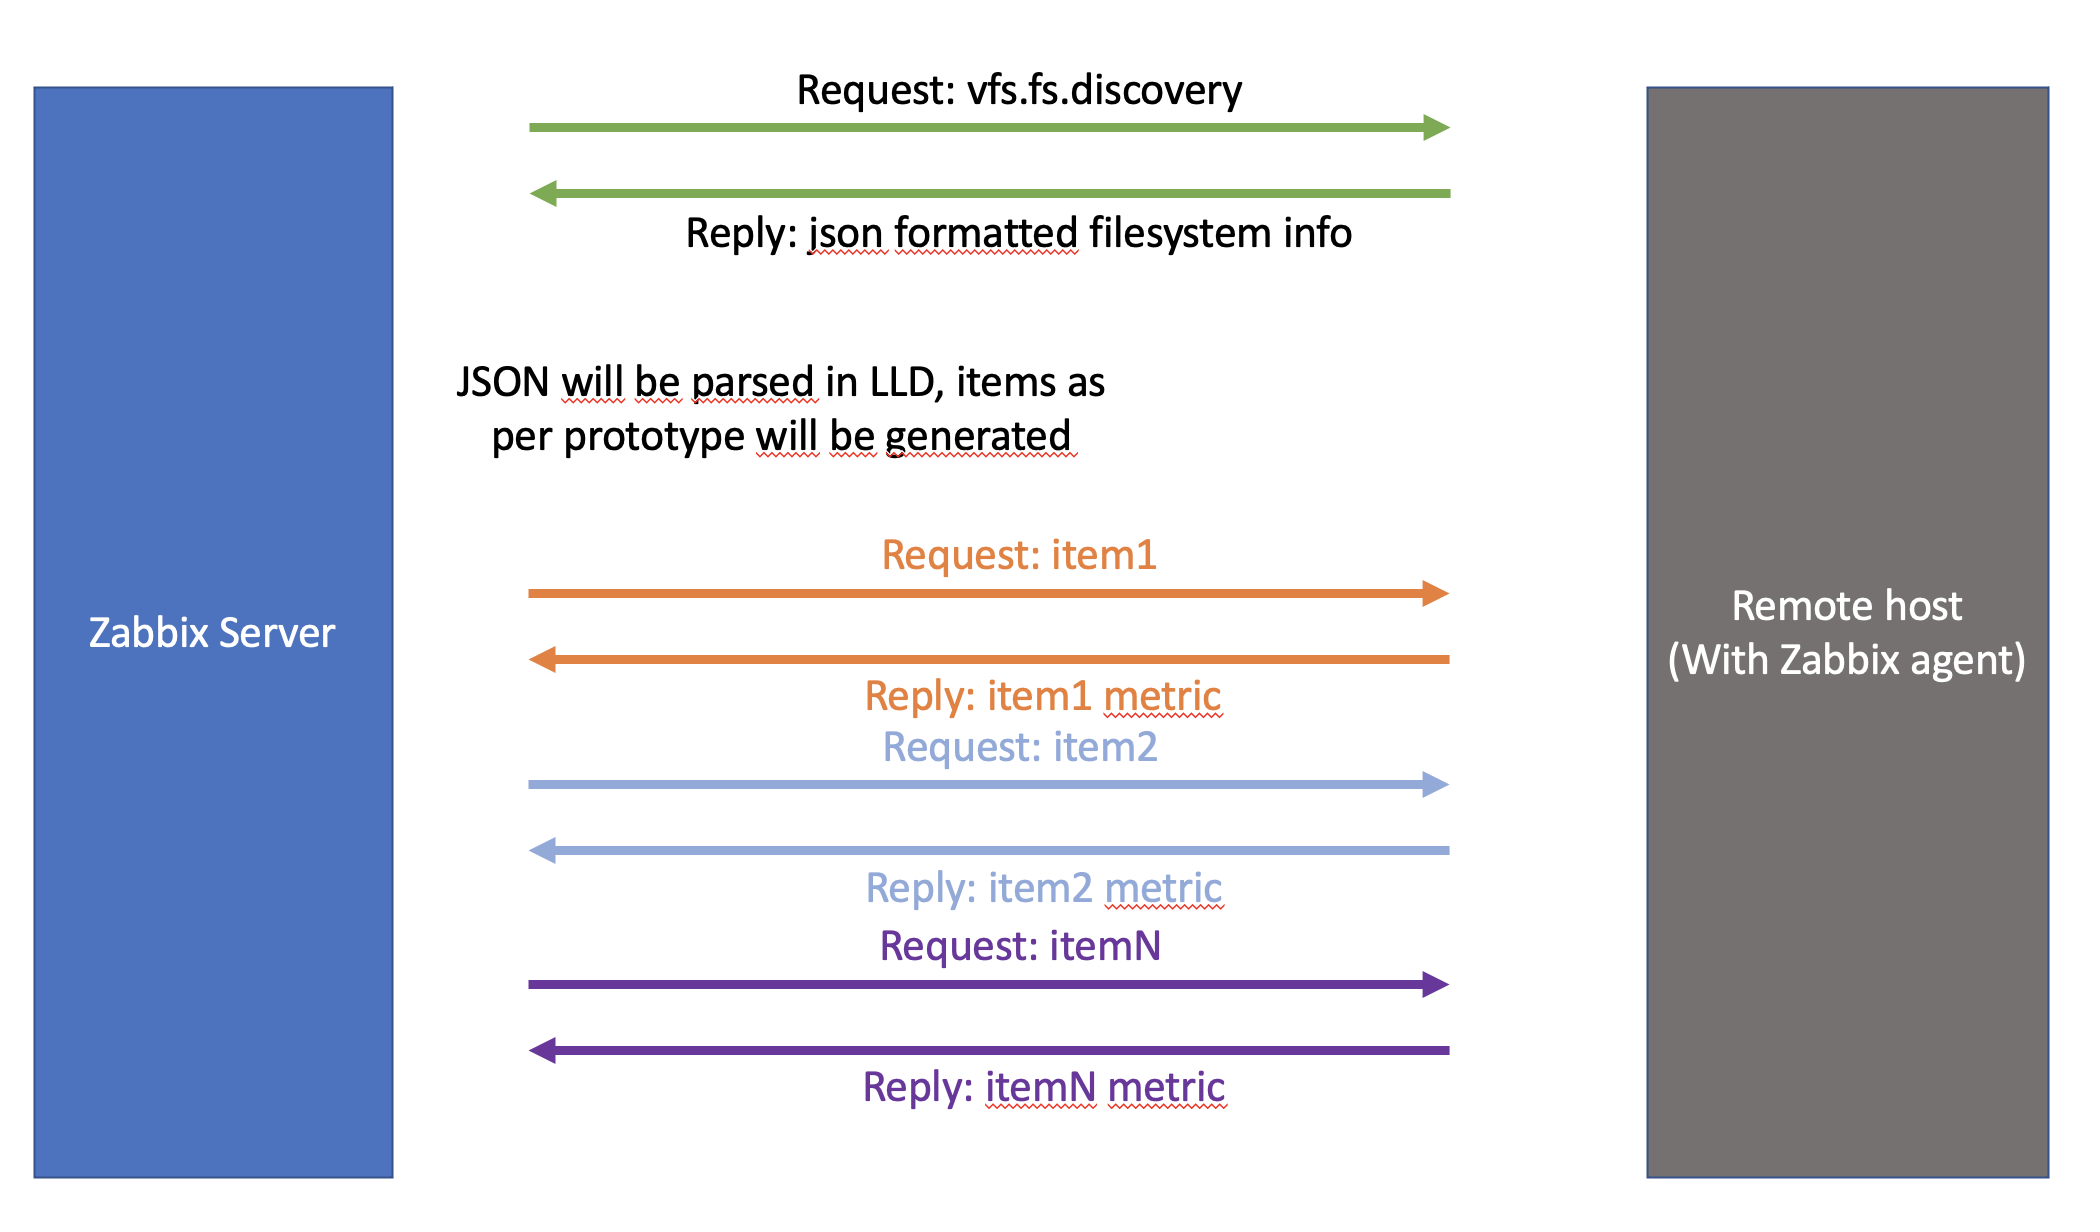
So we’ve basically just setup this:

Dependent items
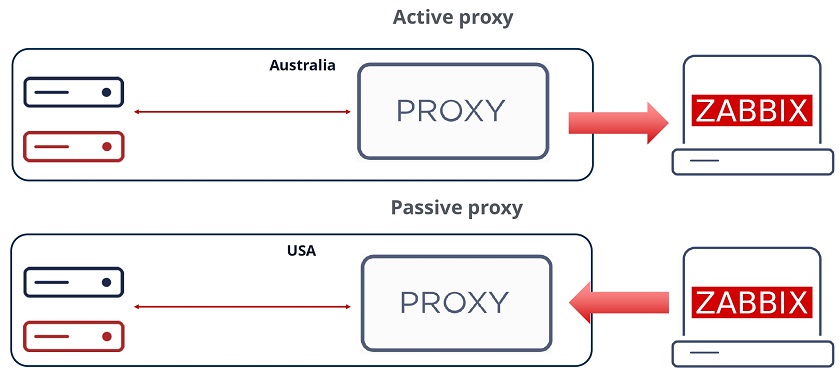
But then Zabbix introduced dependent items. Let’s take a quick look at dependent items and what they are
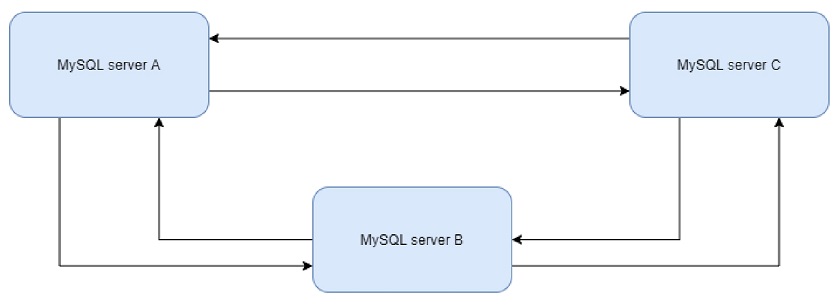
We have one master item that gathers all information (in bulk) and propagates that information to all the dependent items. On those dependent items we just do the cherry picking and filtering of the relevant metrics. Let’s put this to work and see how that goes.
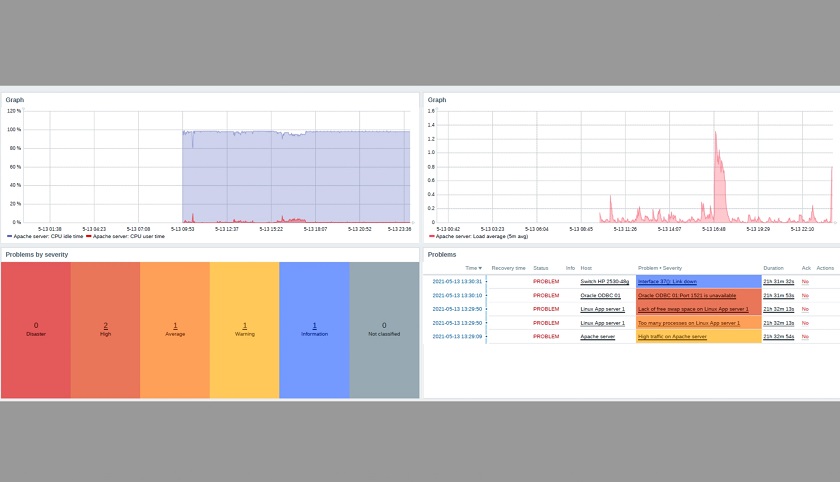
So we create an item, with, in this case, the http agent type, which will collect the following information regarding the server status in a single request:
ServerVersion: Apache/2.4.37 (centos)
ServerMPM: event
Server Built: Nov  4 2020 03:20:37
CurrentTime: Monday, 08-Mar-2021 14:35:20 CET
RestartTime: Monday, 08-Mar-2021 11:04:09 CET
ParentServerConfigGeneration: 1
ParentServerMPMGeneration: 0
ServerUptimeSeconds: 12671
ServerUptime: 3 hours 31 minutes 11 seconds
Load1: 0.01
Load5: 0.03
Load15: 0.00
Total Accesses: 1182
Total kBytes: 10829
Total Duration: 95552
CPUUser: 5.01
CPUSystem: 7.34
CPUChildrenUser: 0
CPUChildrenSystem: 0
CPULoad: .0974667
Uptime: 12671
ReqPerSec: .0932839
BytesPerSec: 875.14
BytesPerReq: 9381.47
DurationPerReq: 80.8393
BusyWorkers: 1
IdleWorkers: 99
Processes: 4
Stopping: 0
BusyWorkers: 1
IdleWorkers: 99
ConnsTotal: 4
ConnsAsyncWriting: 0
ConnsAsyncKeepAlive: 0
ConnsAsyncClosing: 0
Scoreboard: _________________________________________________________________________________________W__________............................................................................................................................................................................................................................................................................................................
Now, we create some dependent items, that depend on that first item (which we will call the Master item). Every time the Master item receives information, the complete reply will be pushed to the dependent items, without any altering of that data. So the master and dependent items are identical when no preprocessing is applied. That’s why on the dependent items we apply preprocessing to filter relevant information, for example, the BusyWorkers:

Perfect. So querying a host once, getting all the metrics in bulk, and then parsing it in Zabbix using preprocessing. Say bye to excessive load on the monitored host… (and due to preprocessing processes within Zabbix, no problem on the Zabbix server side).
Combining Low-Level Discovery and Dependent items
Ok, and what if we combine these to concepts? LLD with Dependent items? Wouldn’t that be the ultimate goal? Automatically creating new items without putting extra load to the monitored host? Let’s get this going!
To stick with the first example of LLD, we will discover filesystems, but now without the vfs.fs.discovery key, but the newly introduced vfs.fs.get key. Once we force the agent to execute this key, we will see this reply:
[{"fsname":"/dev","fstype":"devtmpfs","bytes":{"total":1940963328,"free":1940963328,"used":0,"pfree":100.000000,"pused":0.000000},"inodes":{"total":473868,"free":473487,"used":381,"pfree":99.919598,"pused":0.080402}},{"fsname":"/dev/shm","fstype":"tmpfs","bytes":{"total":1958469632,"free":1958469632,"used":0,"pfree":100.000000,"pused":0.000000},"inodes":{"total":478142,"free":478141,"used":1,"pfree":99.999791,"pused":0.000209}},{"fsname":"/run","fstype":"tmpfs","bytes":{"total":1958469632,"free":1892040704,"used":66428928,"pfree":96.608121,"pused":3.391879},"inodes":{"total":478142,"free":477519,"used":623,"pfree":99.869704,"pused":0.130296}},{"fsname":"/sys/fs/cgroup","fstype":"tmpfs","bytes":{"total":1958469632,"free":1958469632,"used":0,"pfree":100.000000,"pused":0.000000},"inodes":{"total":478142,"free":478125,"used":17,"pfree":99.996445,"pused":0.003555}},{"fsname":"/","fstype":"xfs","bytes":{"total":95516360704,"free":55329644544,"used":40186716160,"pfree":57.926877,"pused":42.073123},"inodes":{"total":46661632,"free":46535047,"used":126585,"pfree":99.728717,"pused":0.271283}},{"fsname":"/boot","fstype":"ext4","bytes":{"total":1023303680,"free":705544192,"used":247296000,"pfree":74.046435,"pused":25.953565},"inodes":{"total":65536,"free":65497,"used":39,"pfree":99.940491,"pused":0.059509}},{"fsname":"/home","fstype":"xfs","bytes":{"total":5358223360,"free":5286903808,"used":71319552,"pfree":98.668970,"pused":1.331030},"inodes":{"total":2621440,"free":2621428,"used":12,"pfree":99.999542,"pused":0.000458}},{"fsname":"/run/user/0","fstype":"tmpfs","bytes":{"total":391692288,"free":391692288,"used":0,"pfree":100.000000,"pused":0.000000},"inodes":{"total":478142,"free":478137,"used":5,"pfree":99.998954,"pused":0.001046}}]
And if we format it to be more readable, it will look like this (truncated):
[
  {
    "fsname":"/",
    "fstype":"xfs",
    "bytes":{
      "total":95516360704,
      "free":55329644544,
      "used":40186716160,
      "pfree":57.926877,
      "pused":42.073123
    },
    "inodes":{
      "total":46661632,
      "free":46535047,
      "used":126585,
      "pfree":99.728717,
      "pused":0.271283
    }
  },
  {
    "fsname":"/home",
    "fstype":"xfs",
    "bytes":{
      "total":5358223360,
      "free":5286903808,
      "used":71319552,
      "pfree":98.668970,
      "pused":1.331030
    },
    "inodes":{
      "total":2621440,
      "free":2621428,
      "used":12,
      "pfree":99.999542,
      "pused":0.000458
    }
  }
]
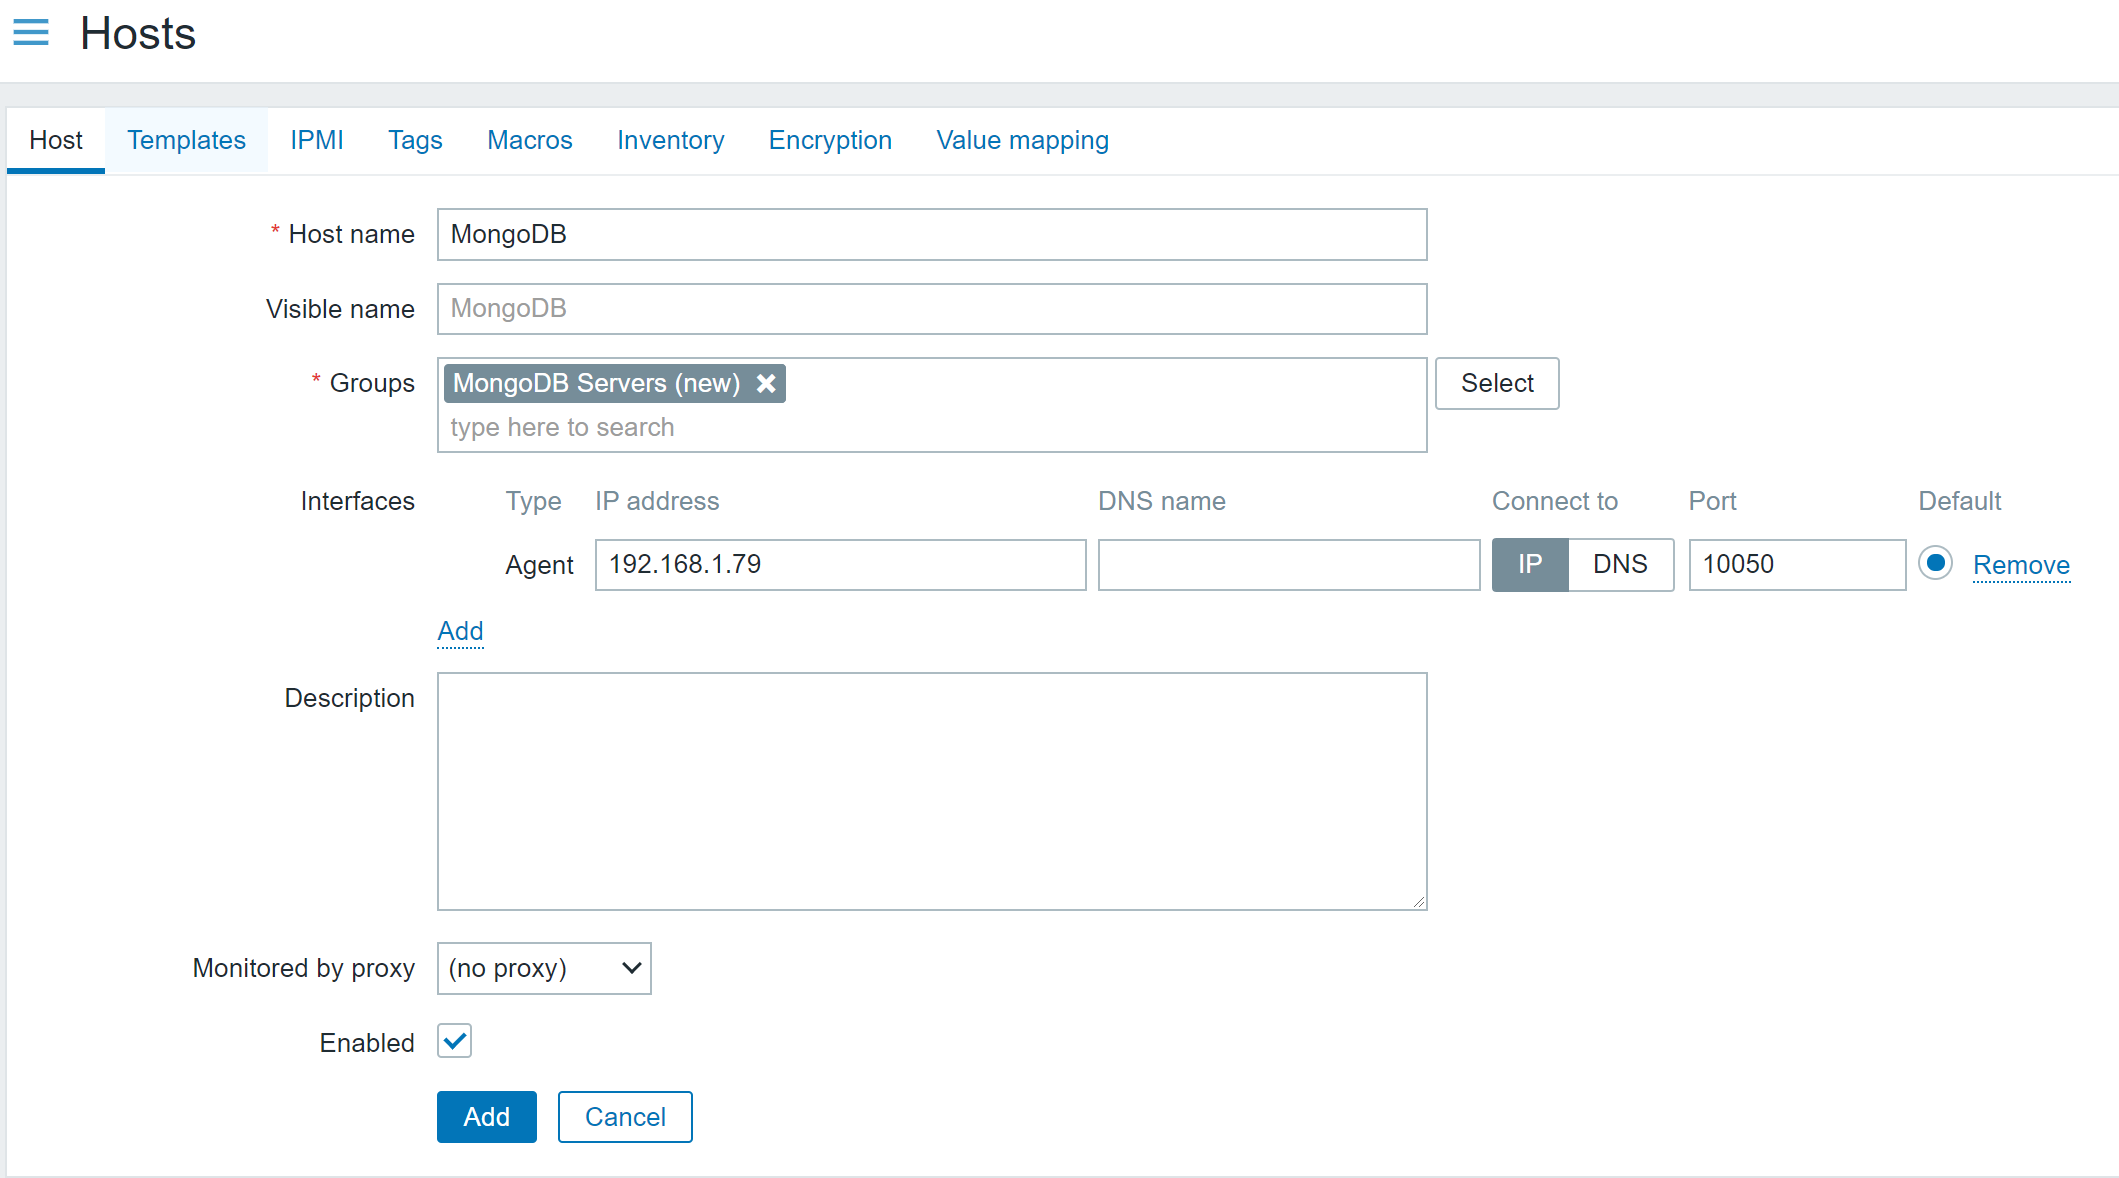
Per filesystem, we get the original information FSNAME and FSTYPE, but also the statistics of these filesystems… bulk metrics! So, we create a normal item (Which will serve as the master item) getting out all those metrics in a single query:

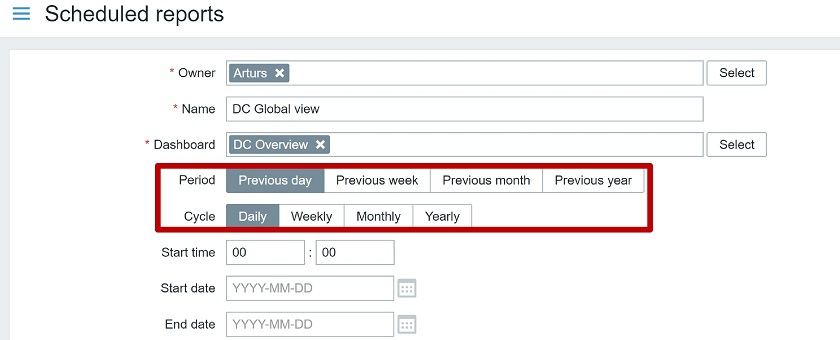
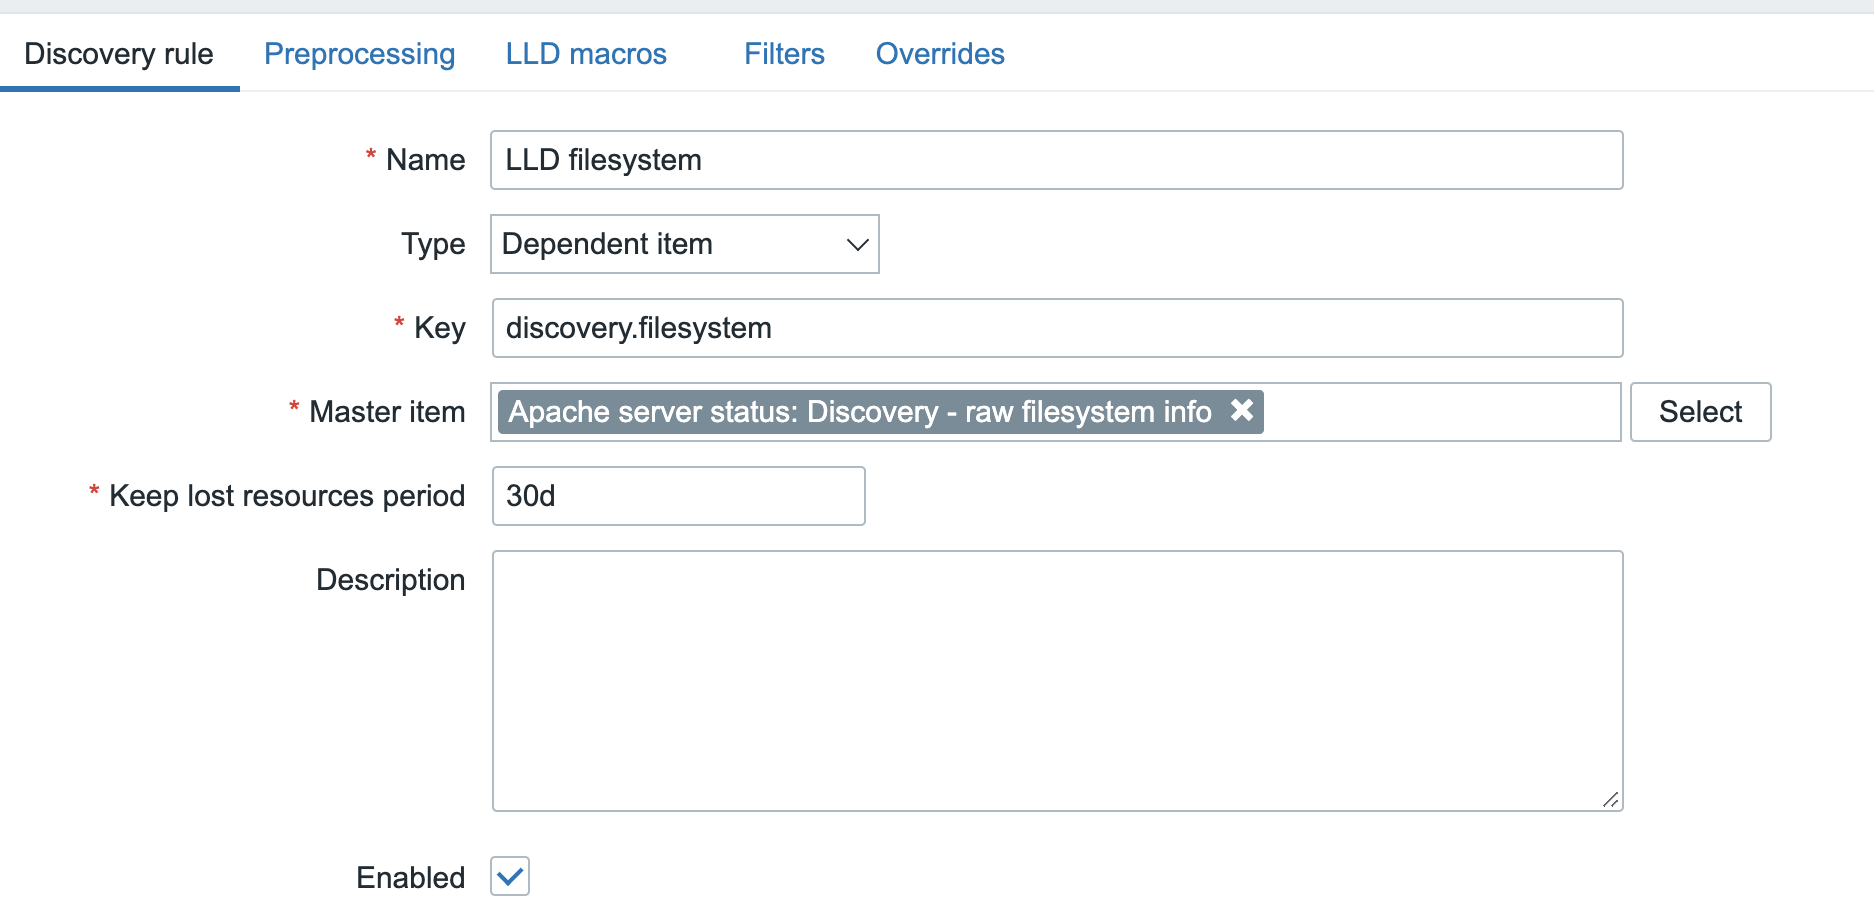
Once we’ve got this data in Zabbix, we feed it into the LLD rule, giving this LLD rule the dependent LLD type:

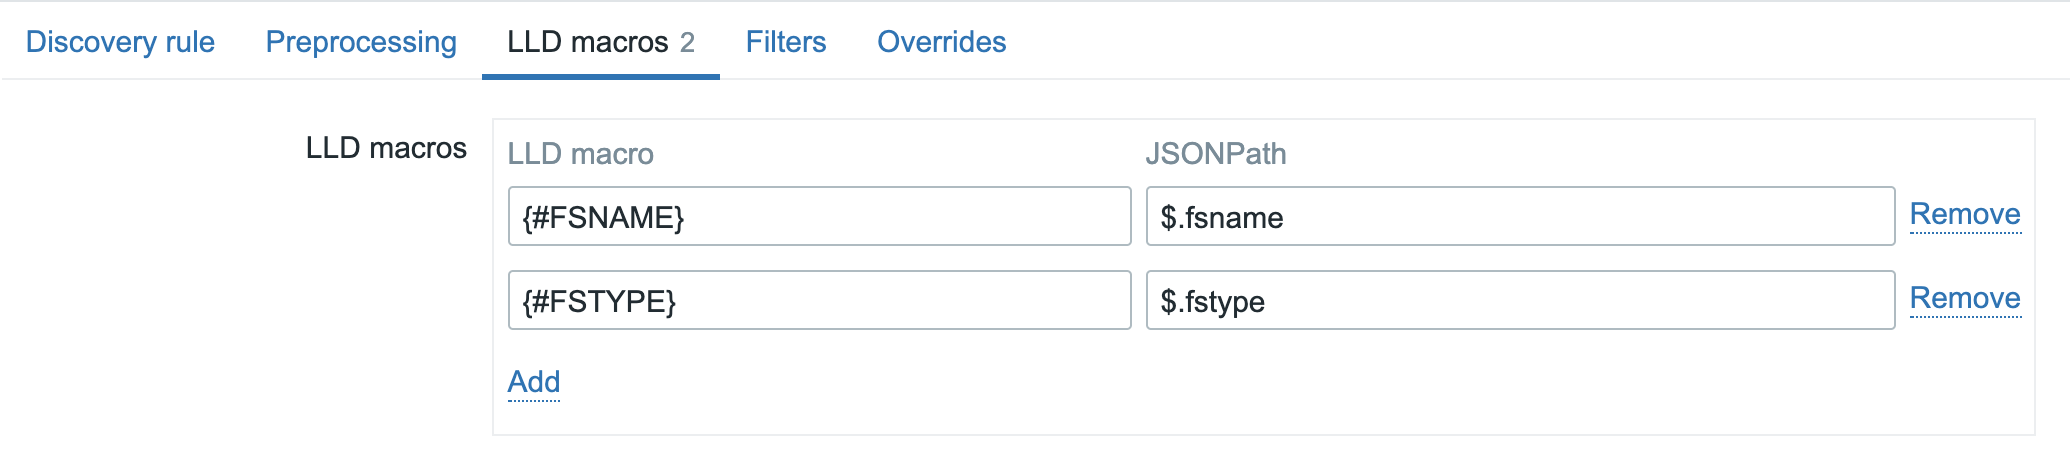
Of course there are no ready to use LLD macros in this data, but since it is in JSON format, it shouldn’t be too hard to create the LLD macros with the ‘LLD macros’ option in the frontend and the relevant JSONPath expression:

Note: Technically we do not need to create the {#FSTYPE} macro to get this working!
Once this is done, we should be ready to create the item prototypes for this LLD rule. The data is there, macros are available, nothing is going to stop us now!
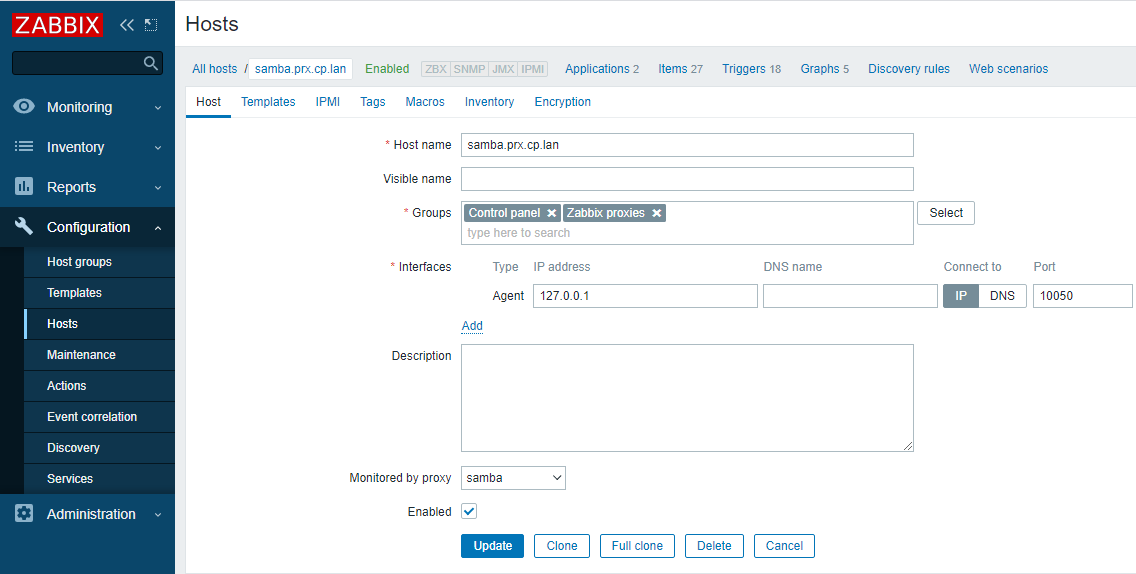
Let’s move on to item prototypes. But of course, we do not want to poll that remote host again per discovered filesystem. That means we will make this item prototype of the dependent item type as well, pointing it back to the master item we’ve created.
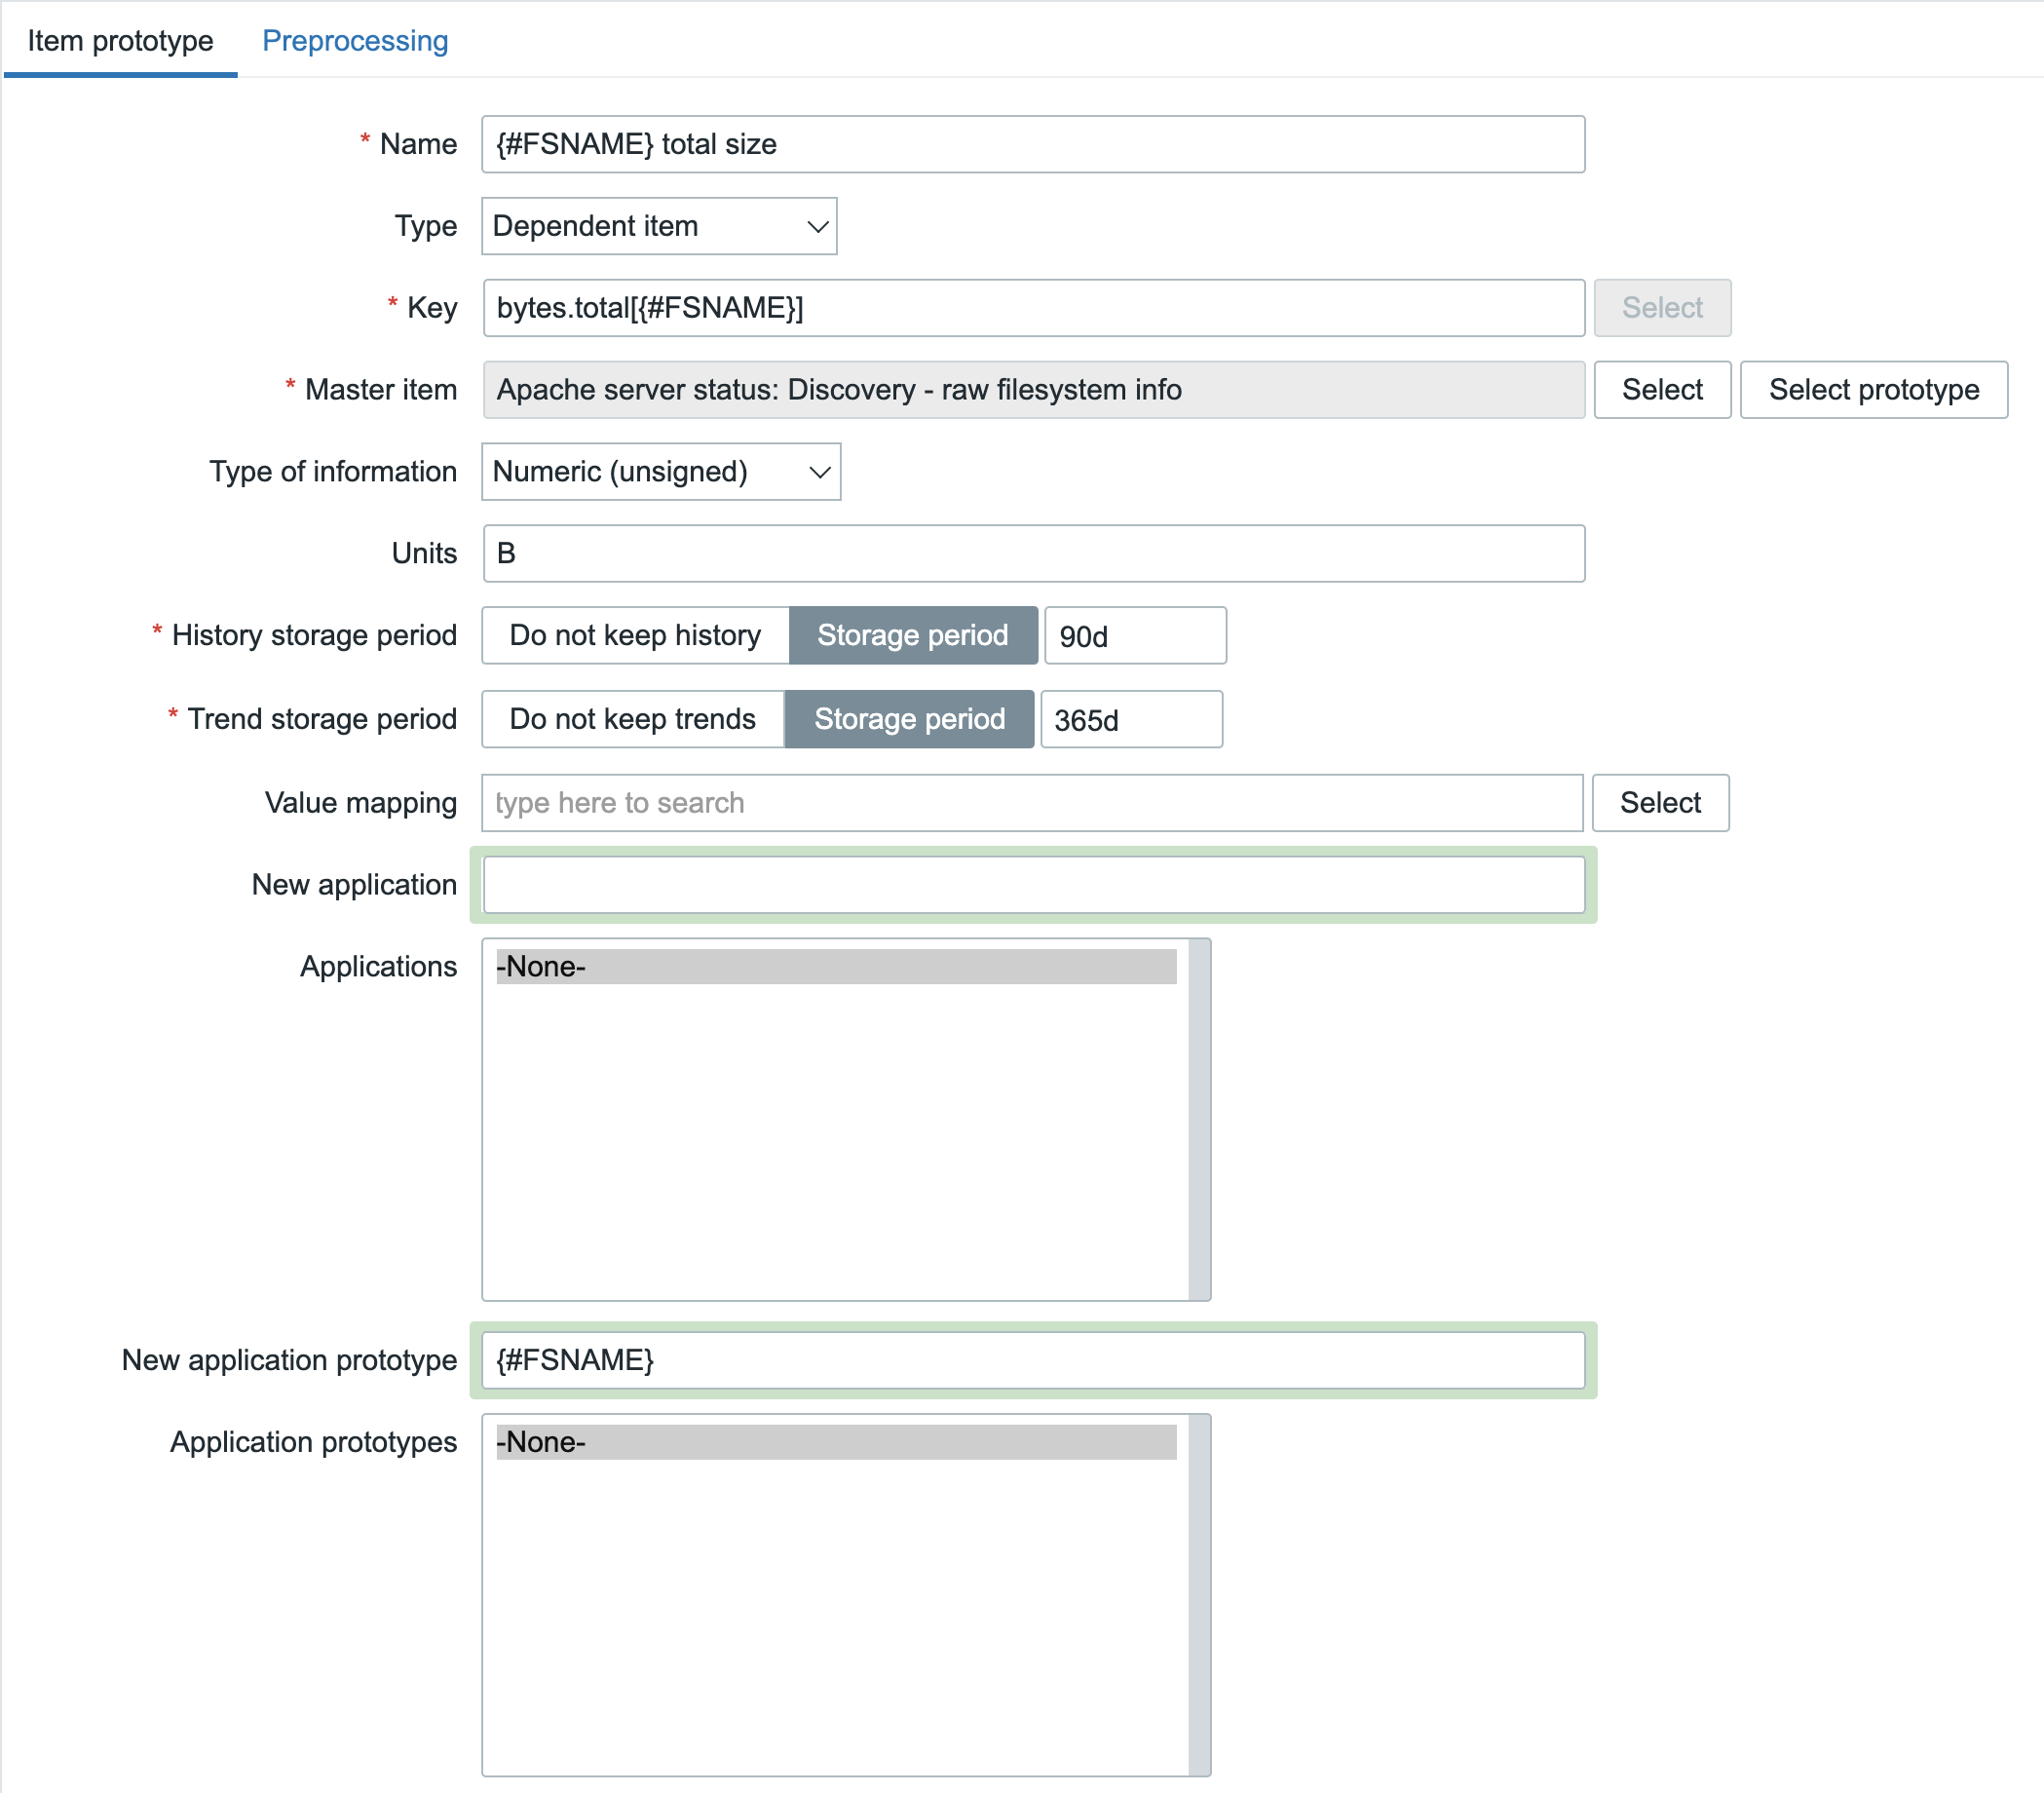
For the first item prototype, we want to obtain the total size per filesystem:

But, as I mentioned earlier: a dependent item without any preprocessing is identical to the master item and of course that would be wrong in this case. We just want to see the total bytes per filesystem and not all the collected statistics. In the configuration above we already know what to get out, so the Type of information and Units are filled already. What is not visible on that screenshot is the preprocessing rule that we need. Here the ‘JSONPath’ preprocessing step comes in handy since we receive JSON data. We would like to get out this part for our item (truncated):
[
  {
    "fsname":"/",
    "fstype":"xfs",
    "bytes":{
      "total":95516360704,
      "free":55329644544,
       "used":40186716160,
      "pfree":57.926877,
      "pused":42.073123
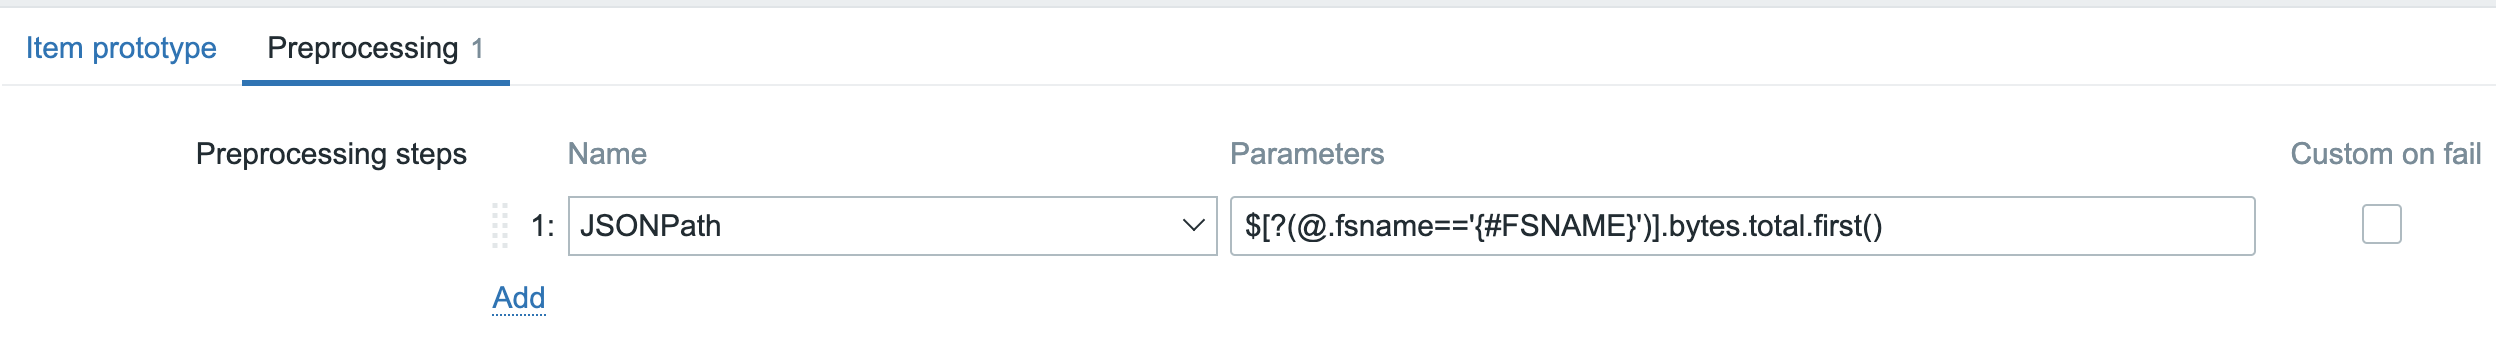
So, if we try to get this information out using JSONPath, it should look like: $.bytes.total.first() but this will match on any filesystem, so we need to configure it a bit more specific like: $[?(@.fsname==’/’)].bytes.total.first()
As you can see, the JSONPath is a bit more complex here. We are forcing it to match on @.fsname==’/’ and from that entity, get out the bytes.total. Now, to make it even more complex we shouldn’t configure the filesystem hardcoded in the JSONPath since we’re working with Item prototypes. It should be the LLD Macro {#FSNAME} instead!

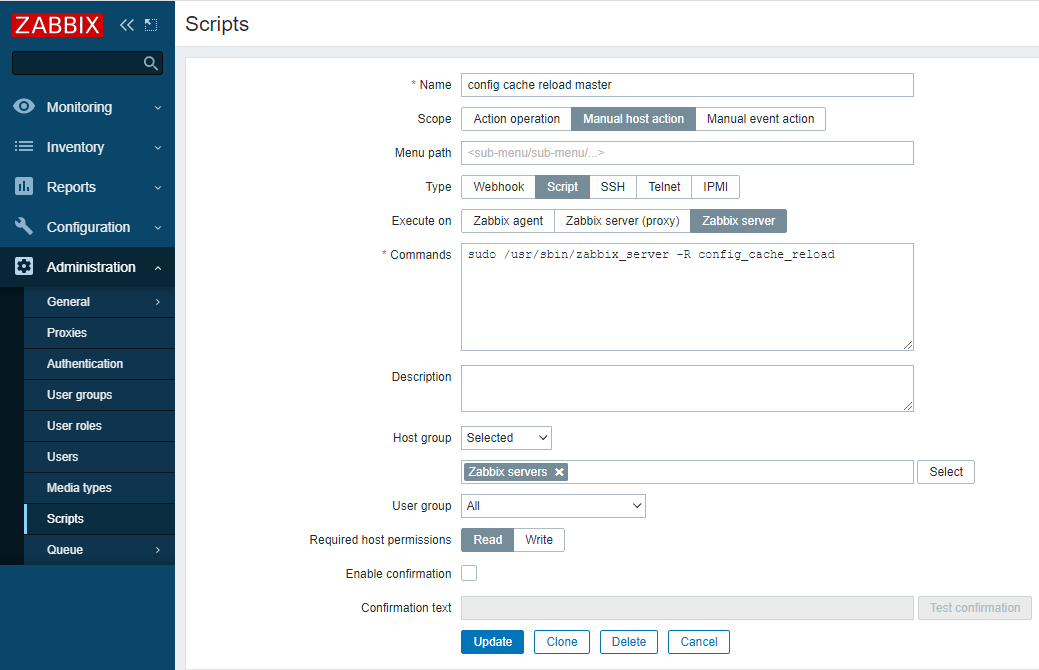
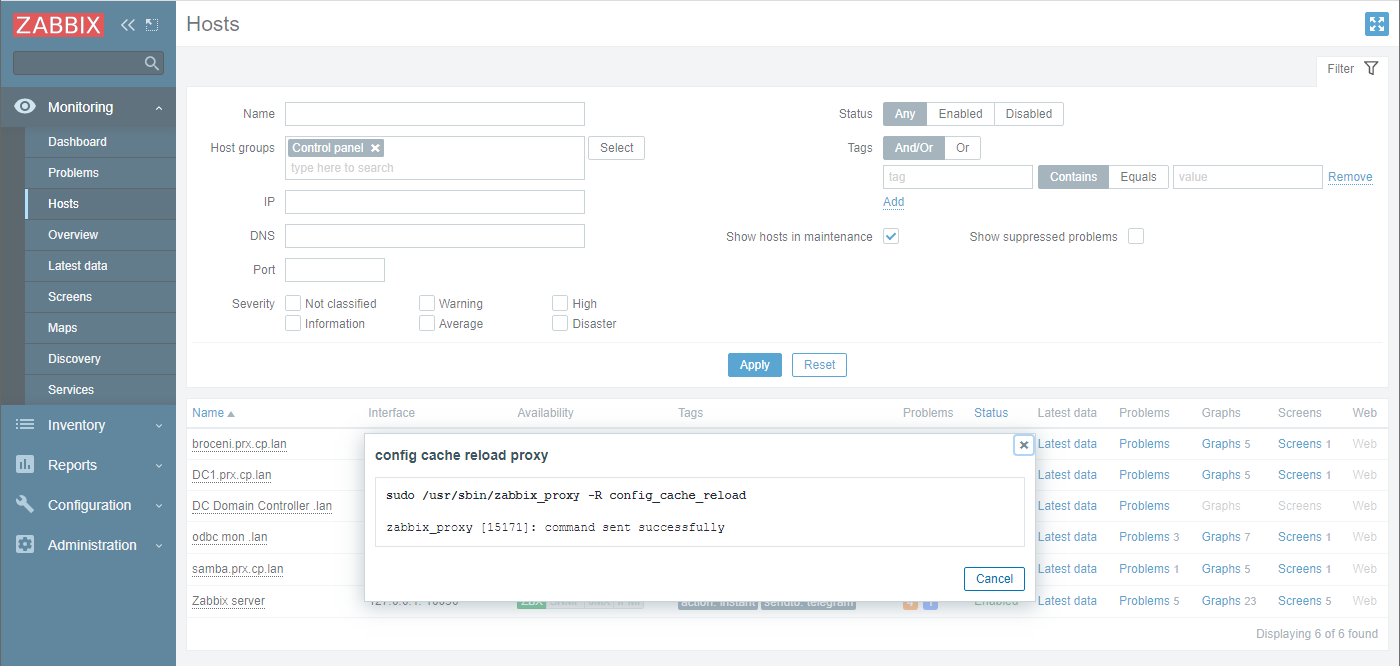
Now we save this item prototype, grab a cup of coffee (or just force a config_cache_reload on the server) and just wait for the magic to happen.
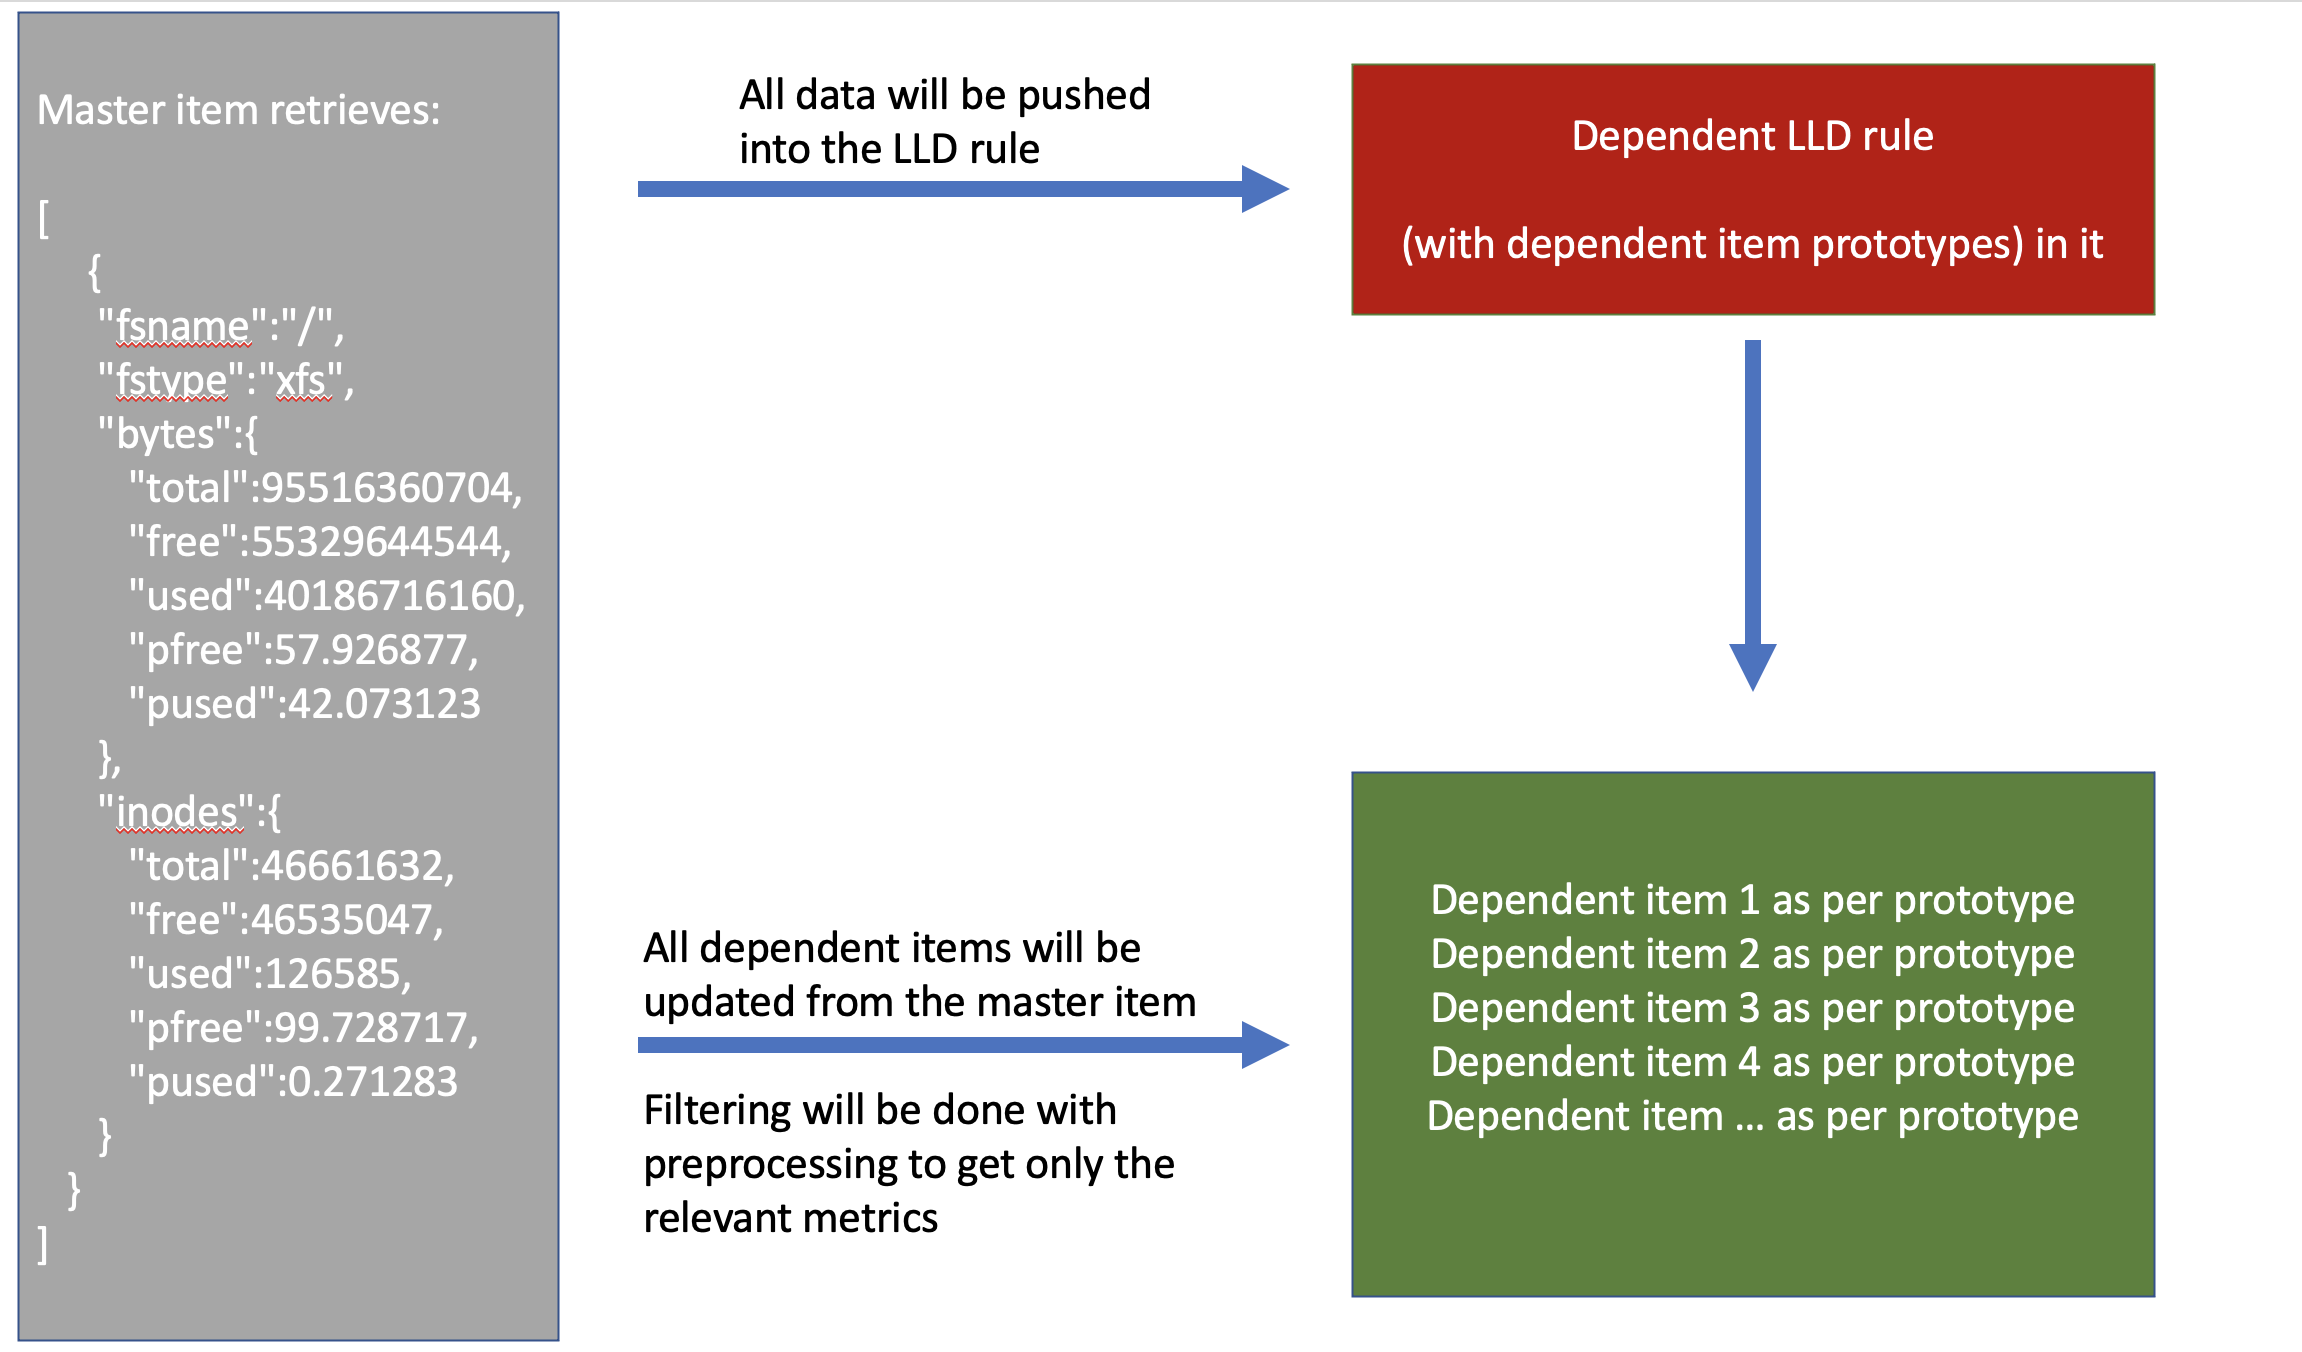
We’ve now built this setup:

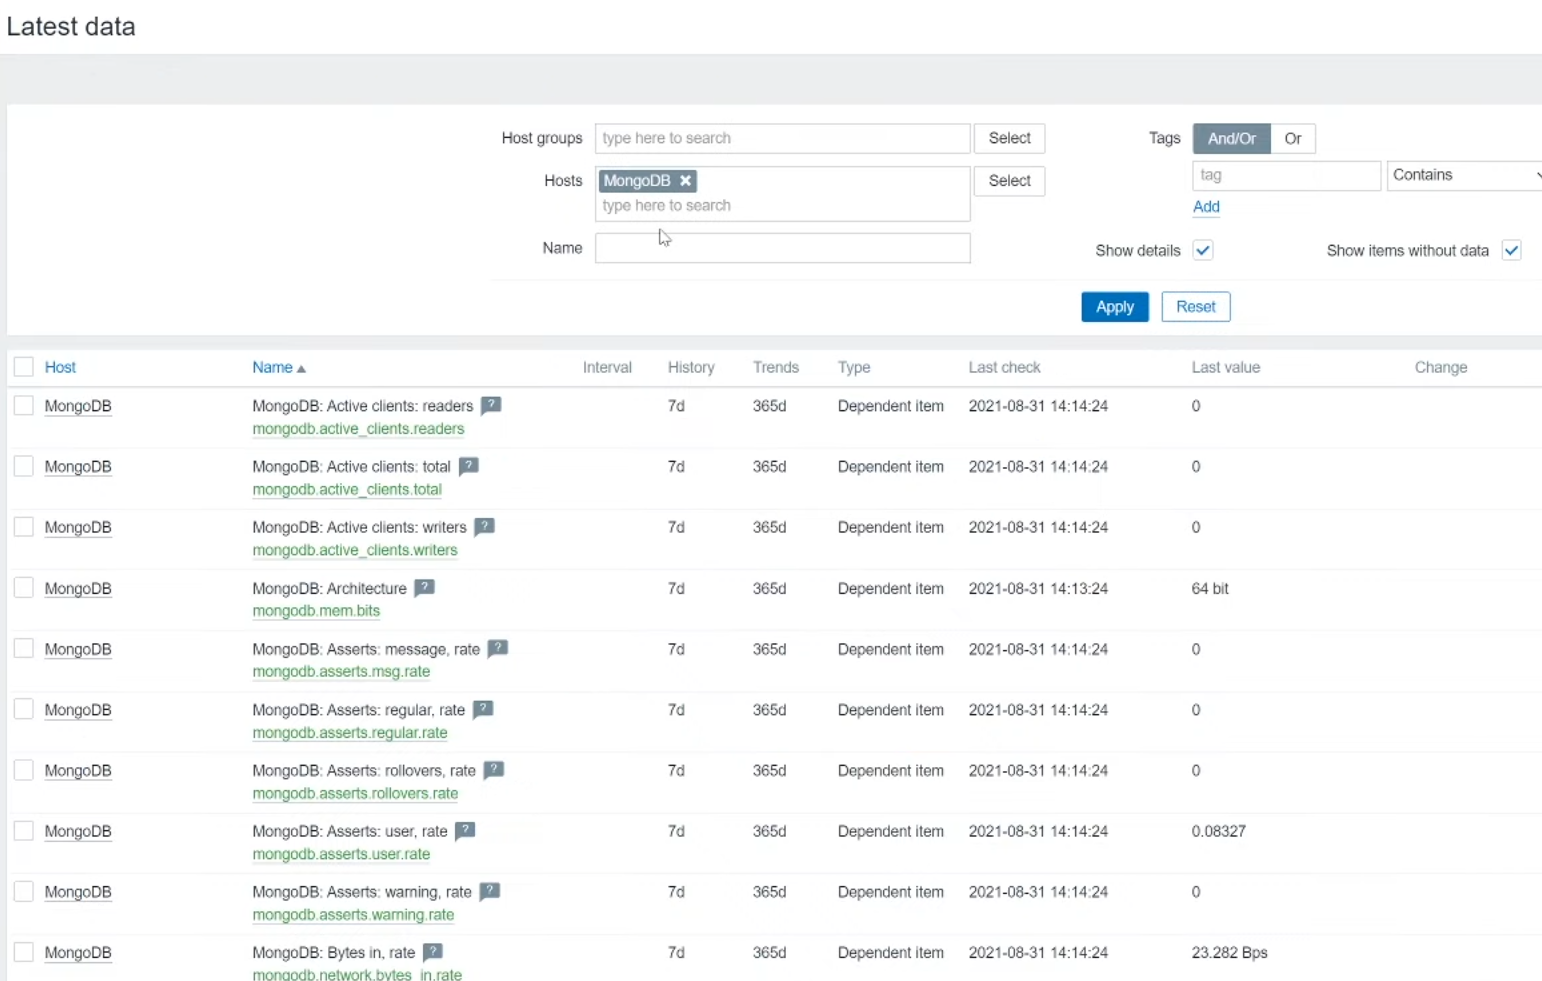
So the master item will get values (i.e. obtain bulk data every minute) and push it into the LLD rule. From there, as per item prototypes, items will be created and those are populated from the master item as well, filtering out only the relevant metrics using Preprocessing.
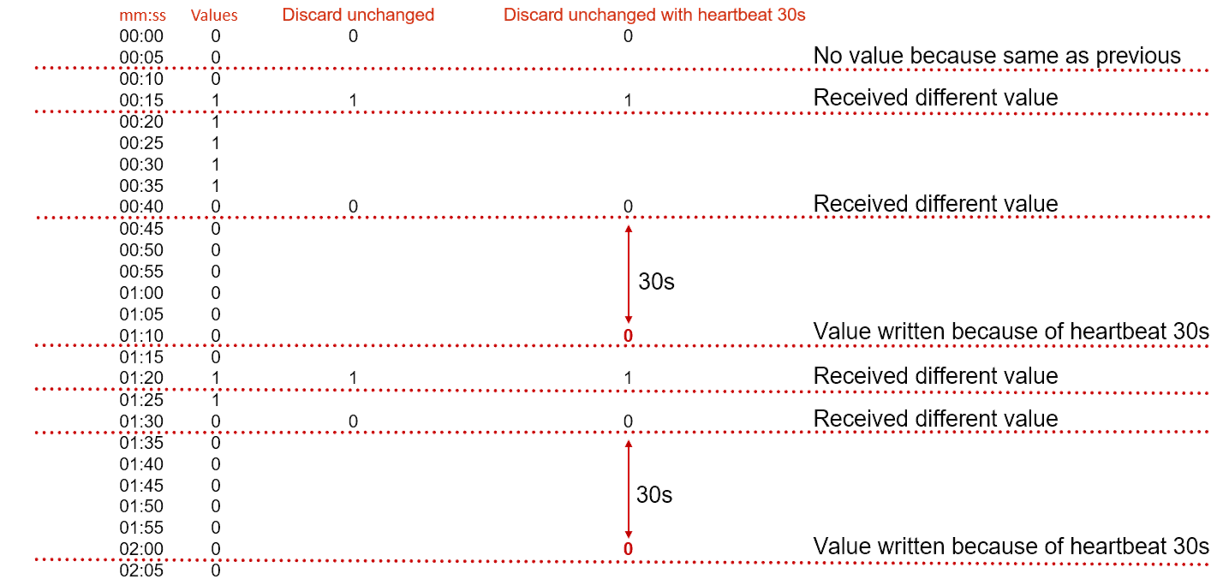
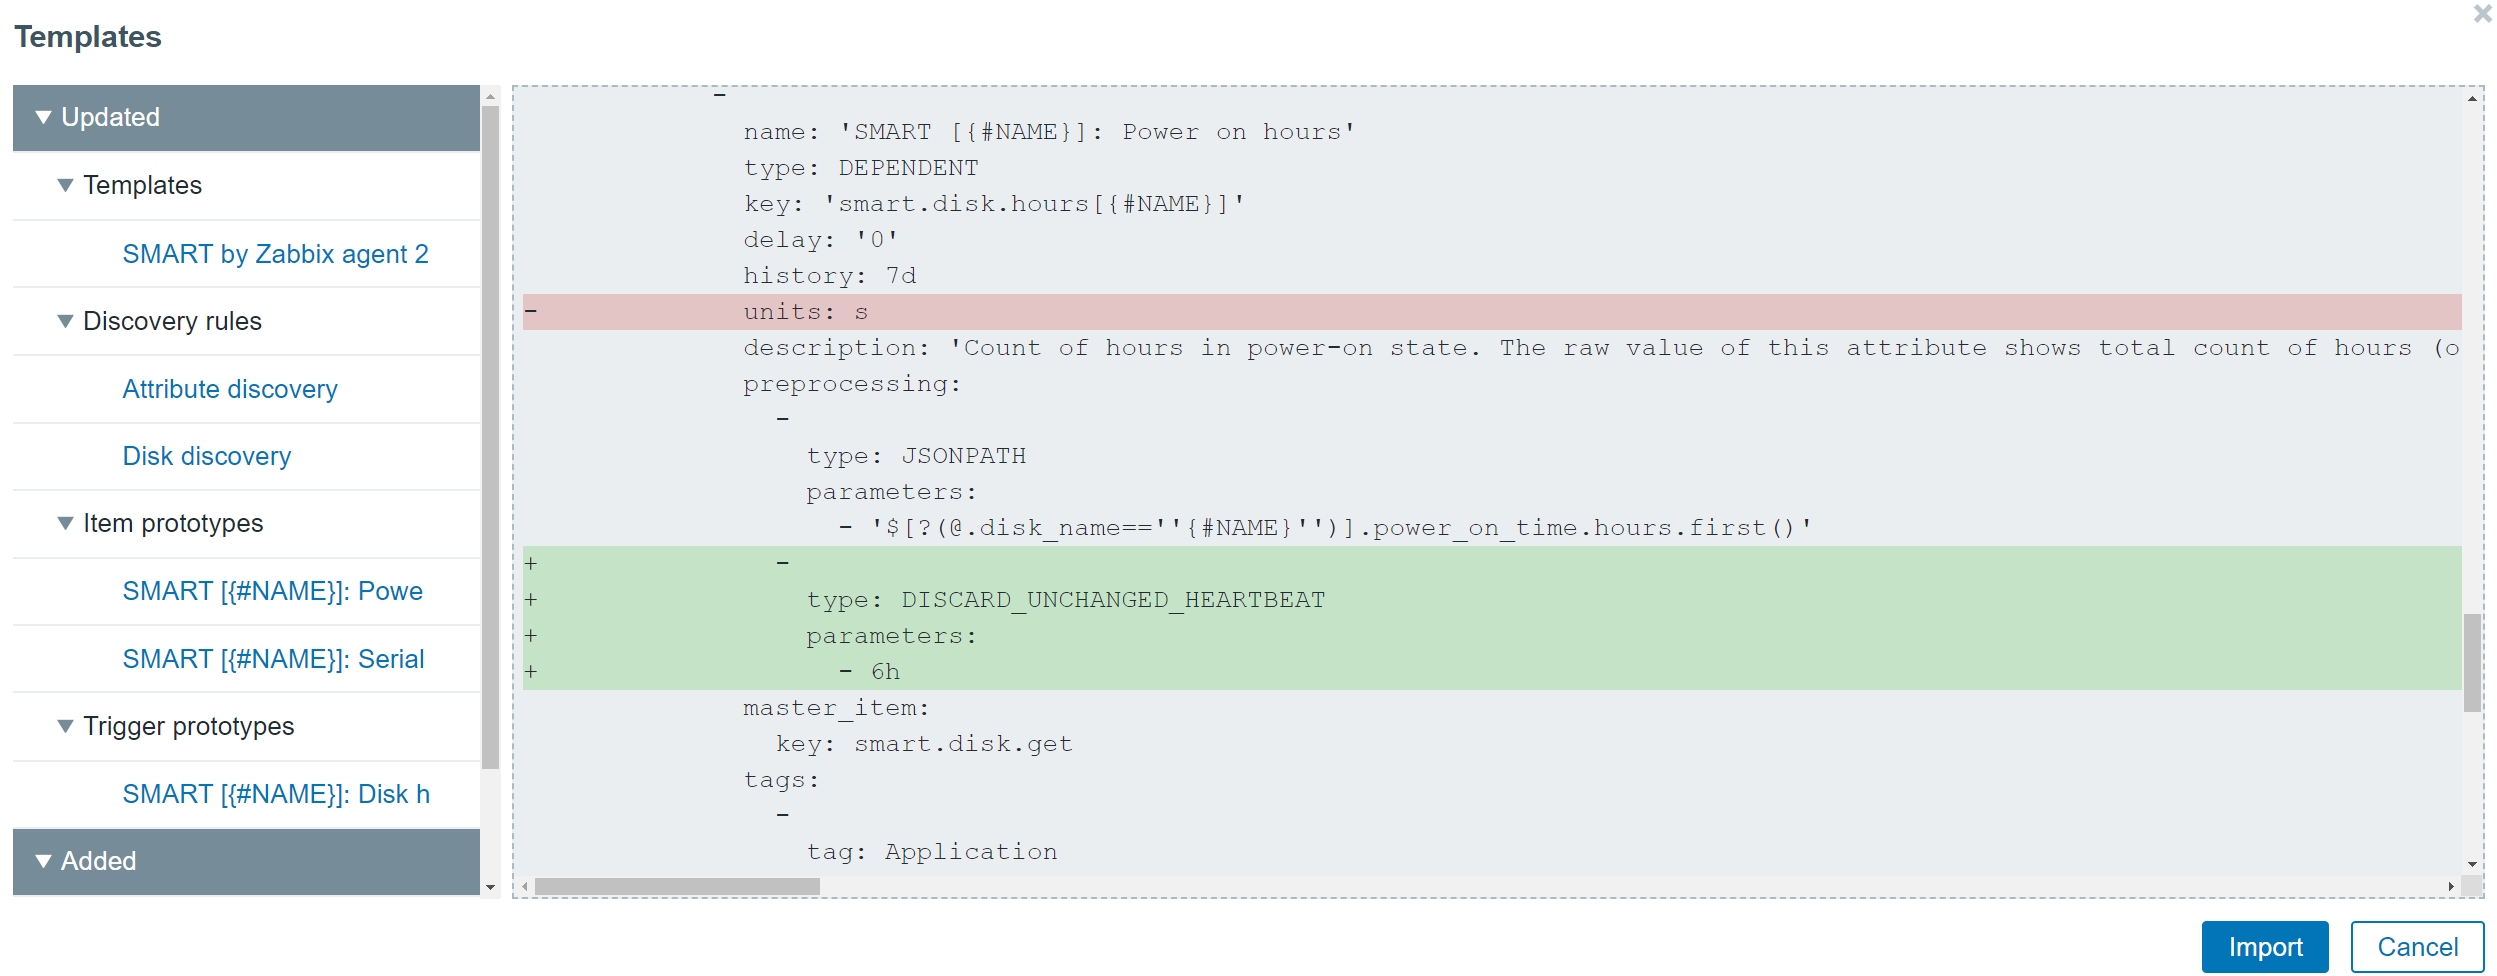
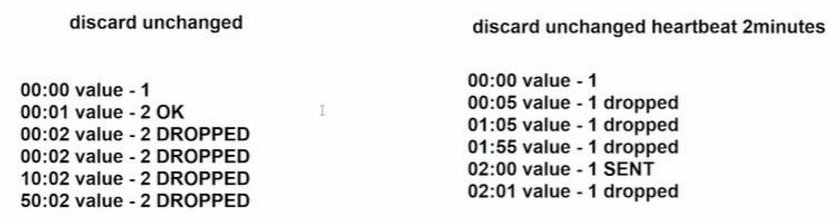
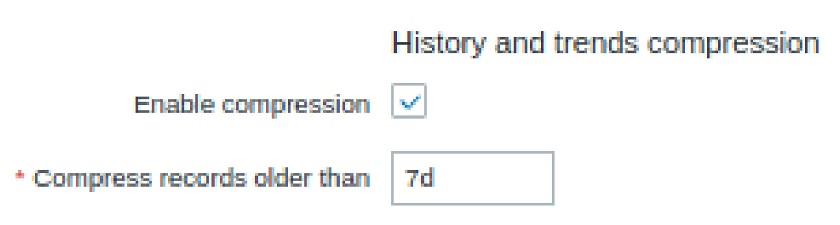
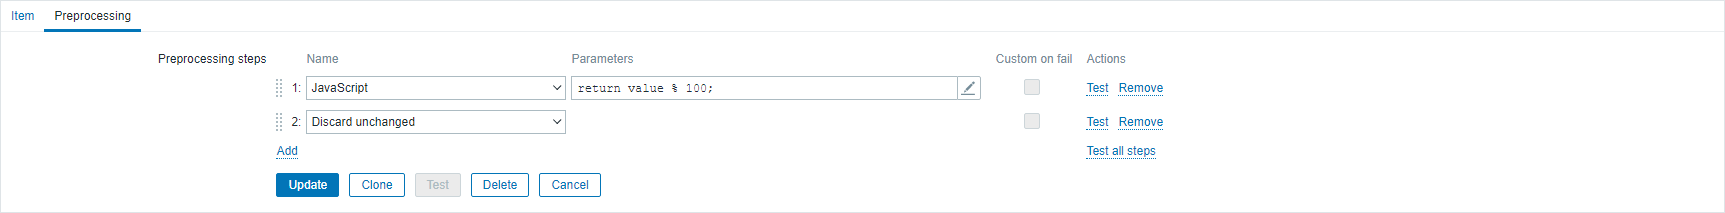
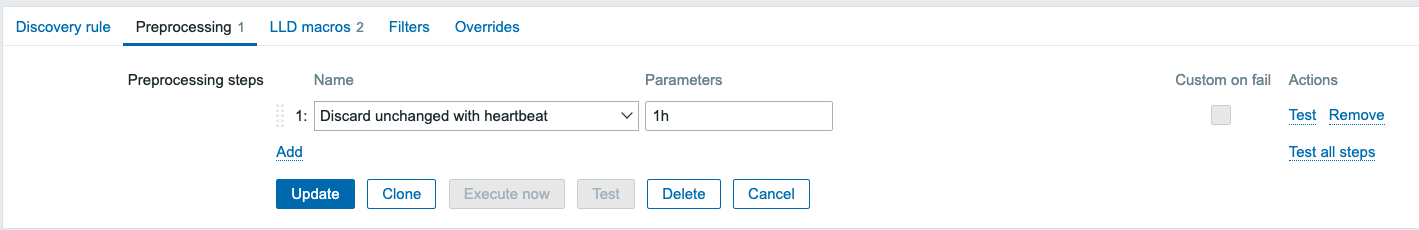
So far, so good, but we have one small problem to solve: We want to get metrics every minute or so, but since all those metrics will get pushed into the LLD rule, we might be adding unnecessary extra load due to the high frequency. Luckily, solving that problem is no too hard. Navigate to the discovery rule, go to the ‘Preprocessing tab’ and select ‘Discard unchanged with heartbeat’ parameter: 1h or even larger interval!

This is insane! With just one poll/query to a host, we will utilize the power of LLD and dependent items, getting all metrics without adding minimal extra load on that host.
Conclusion
That’s it. If you’ve setup everything correctly, you should now get out quite a few filesystem metrics without adding any extra performance overhead on the host by performing unnecessary data requests.
Of course, if you need help optimizing your Zabbix environment, support contracts, consultancy, or training, we from Opensource ICT Solutions are always available to assist you in every possible way, worldwide, 24×7.
Thanks for reading this blog post, see you in the next one.
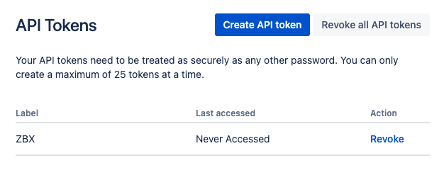
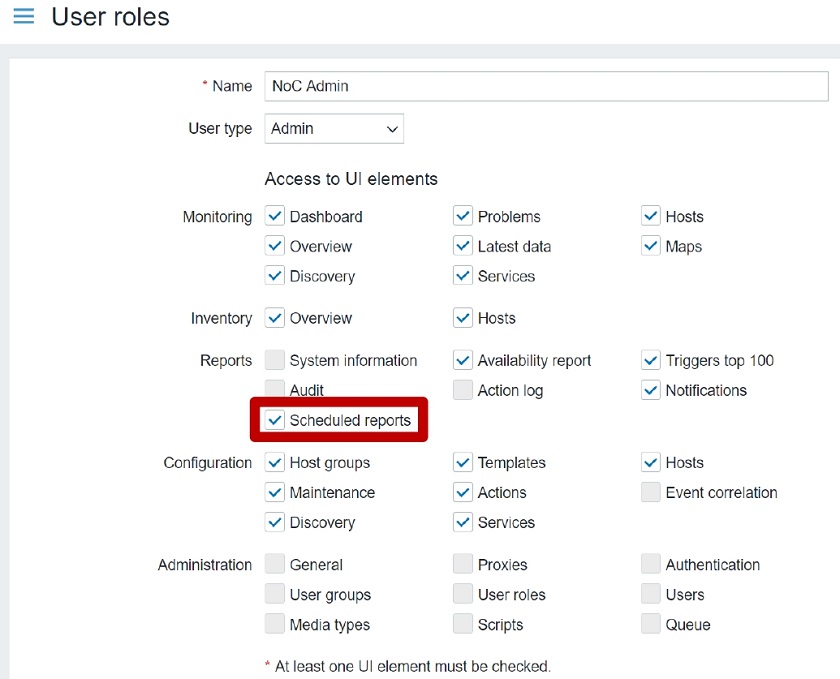
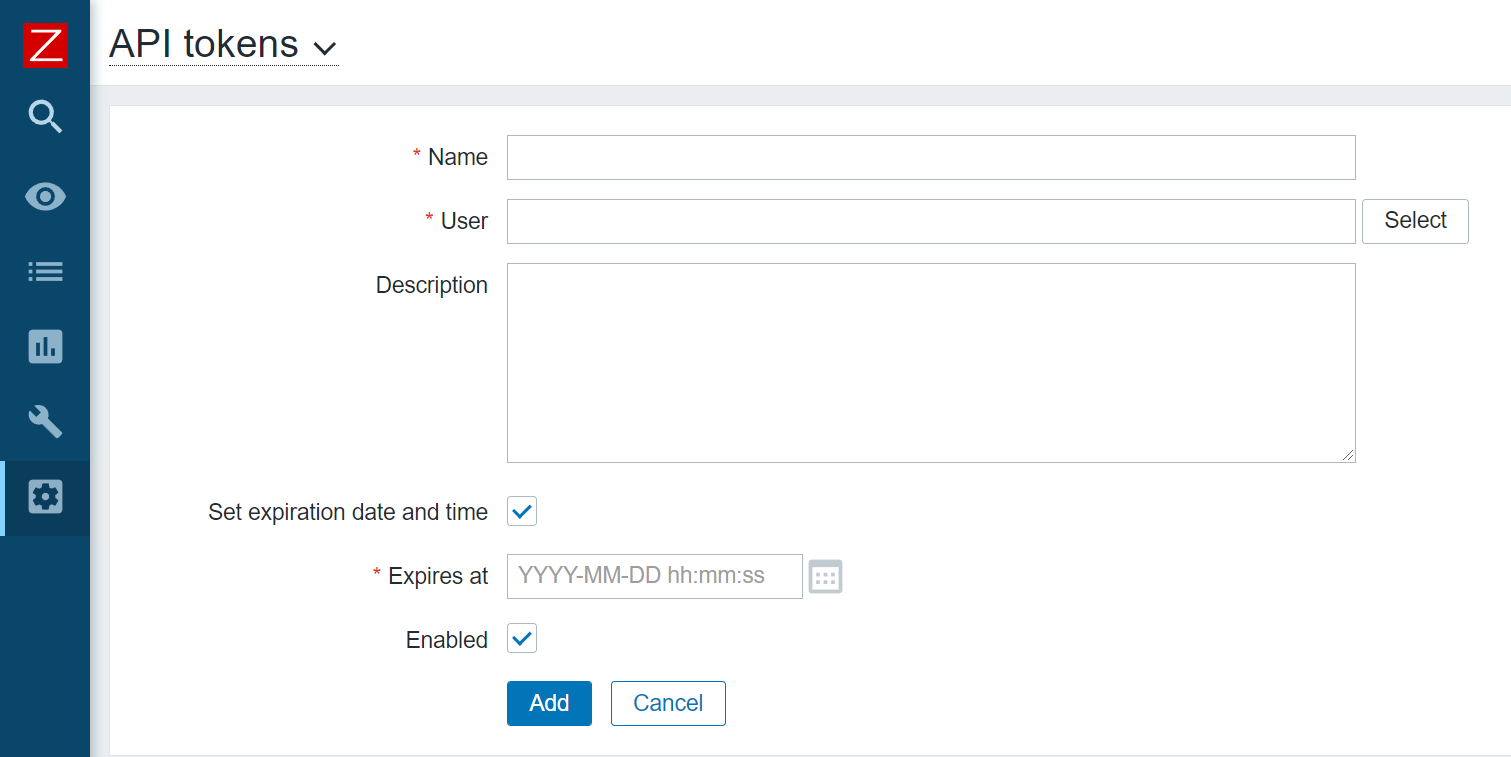 You can create a named API token in the API tokens section, under Administration – General
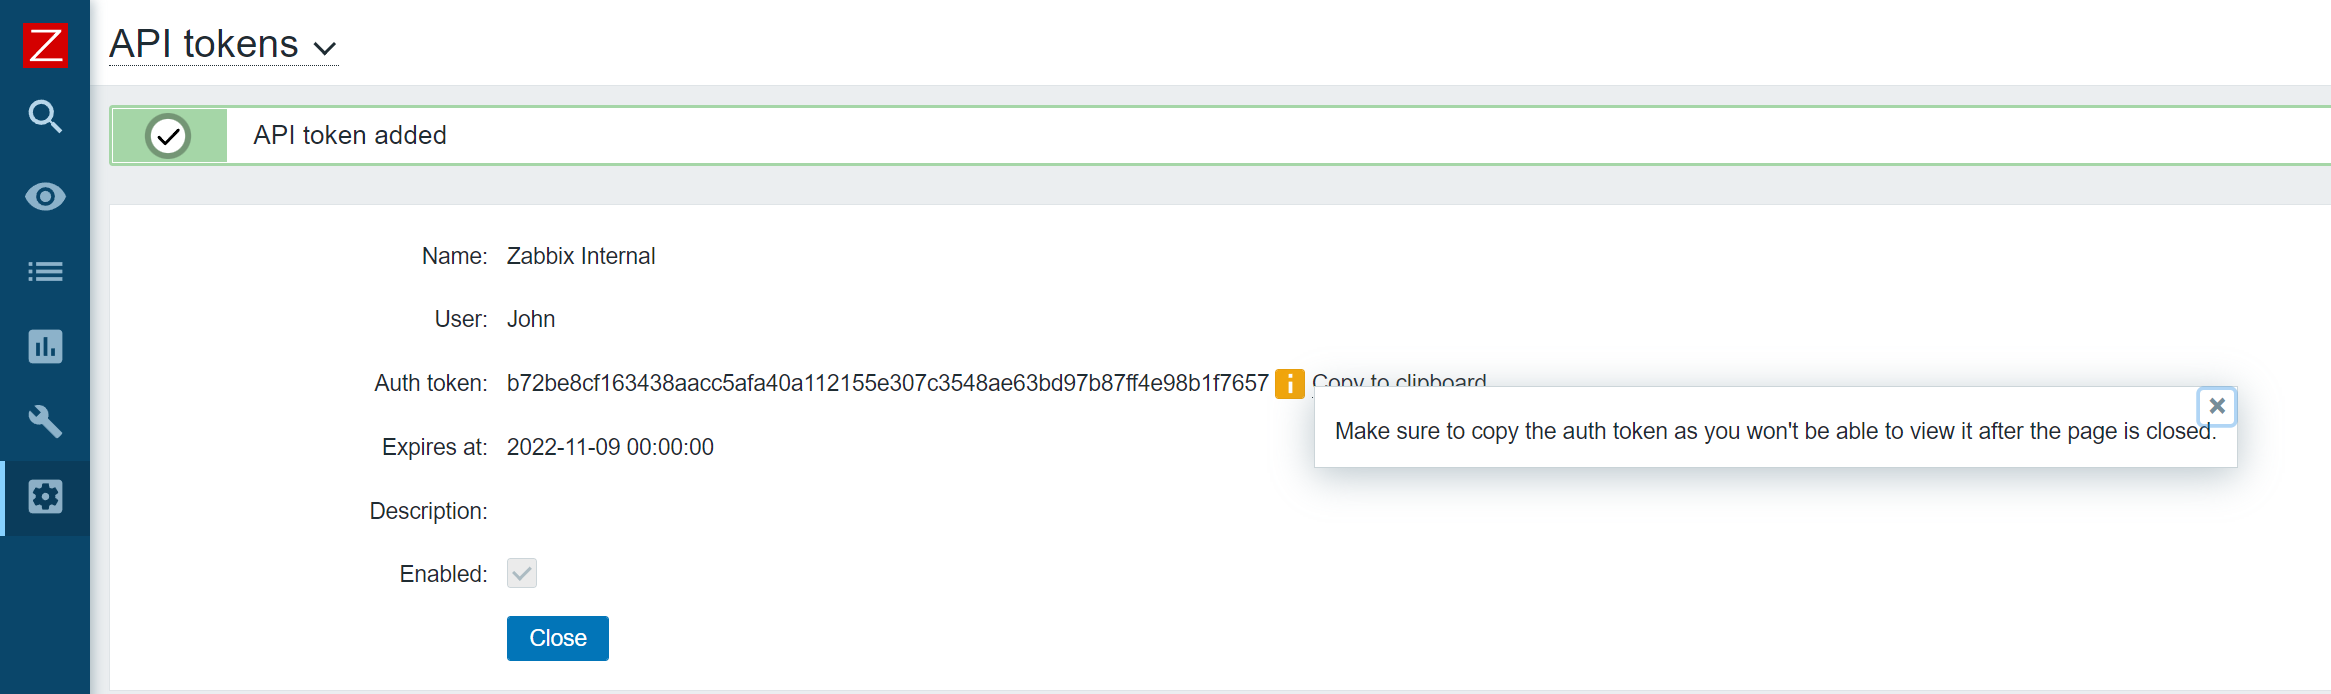 Make sure to store the auth token!
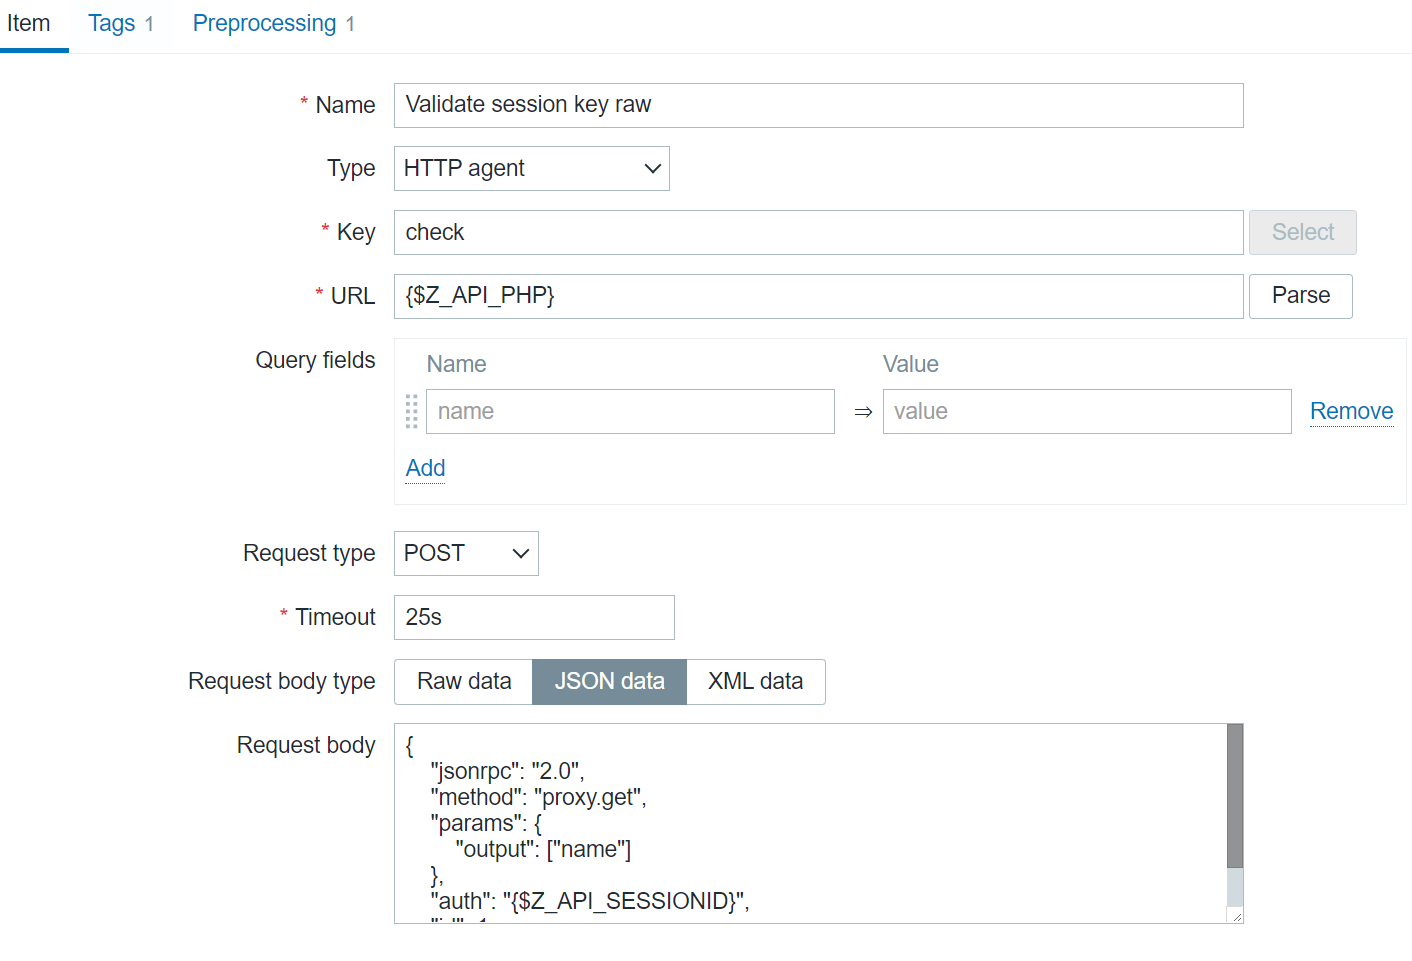
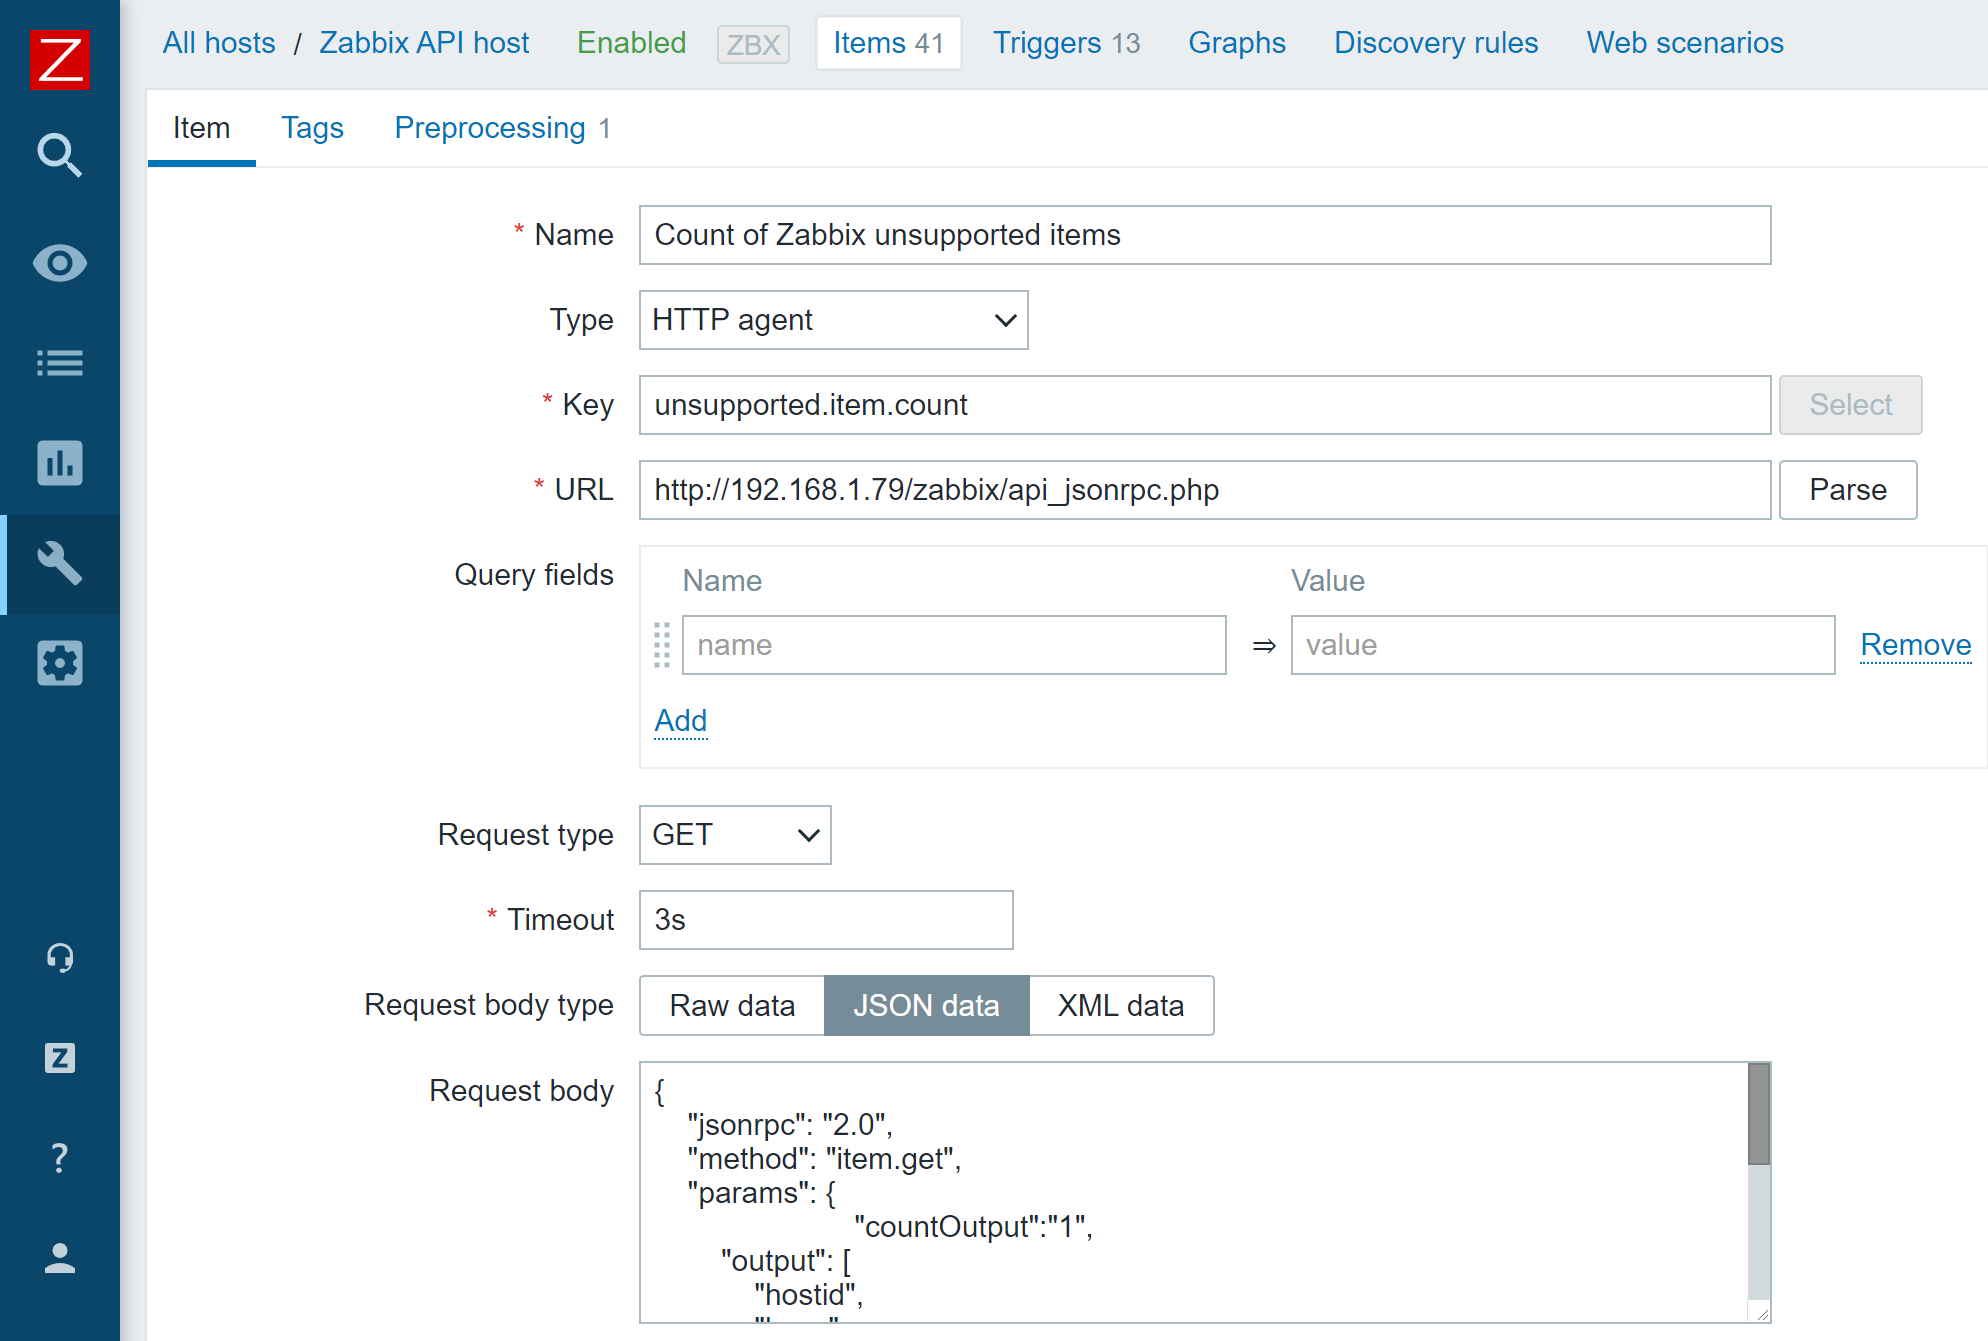 An HTTP agent item that uses a Zabbix API call in its request body
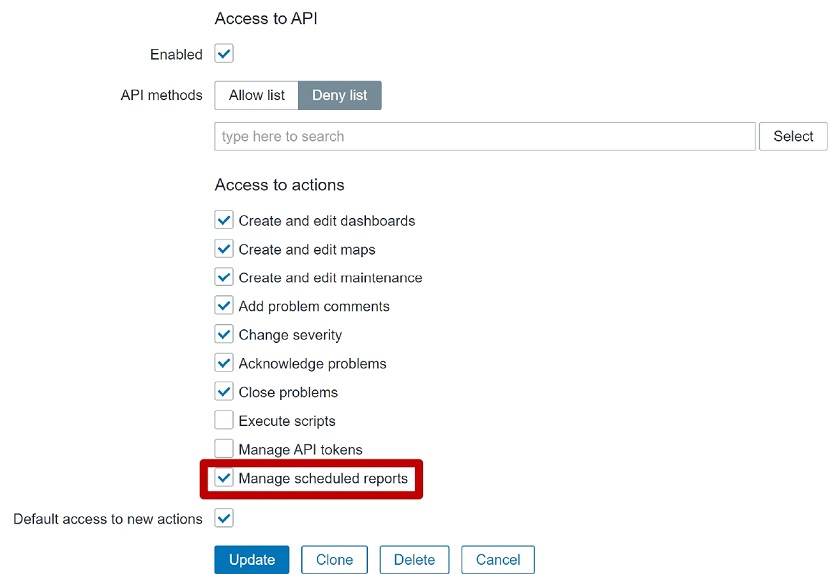
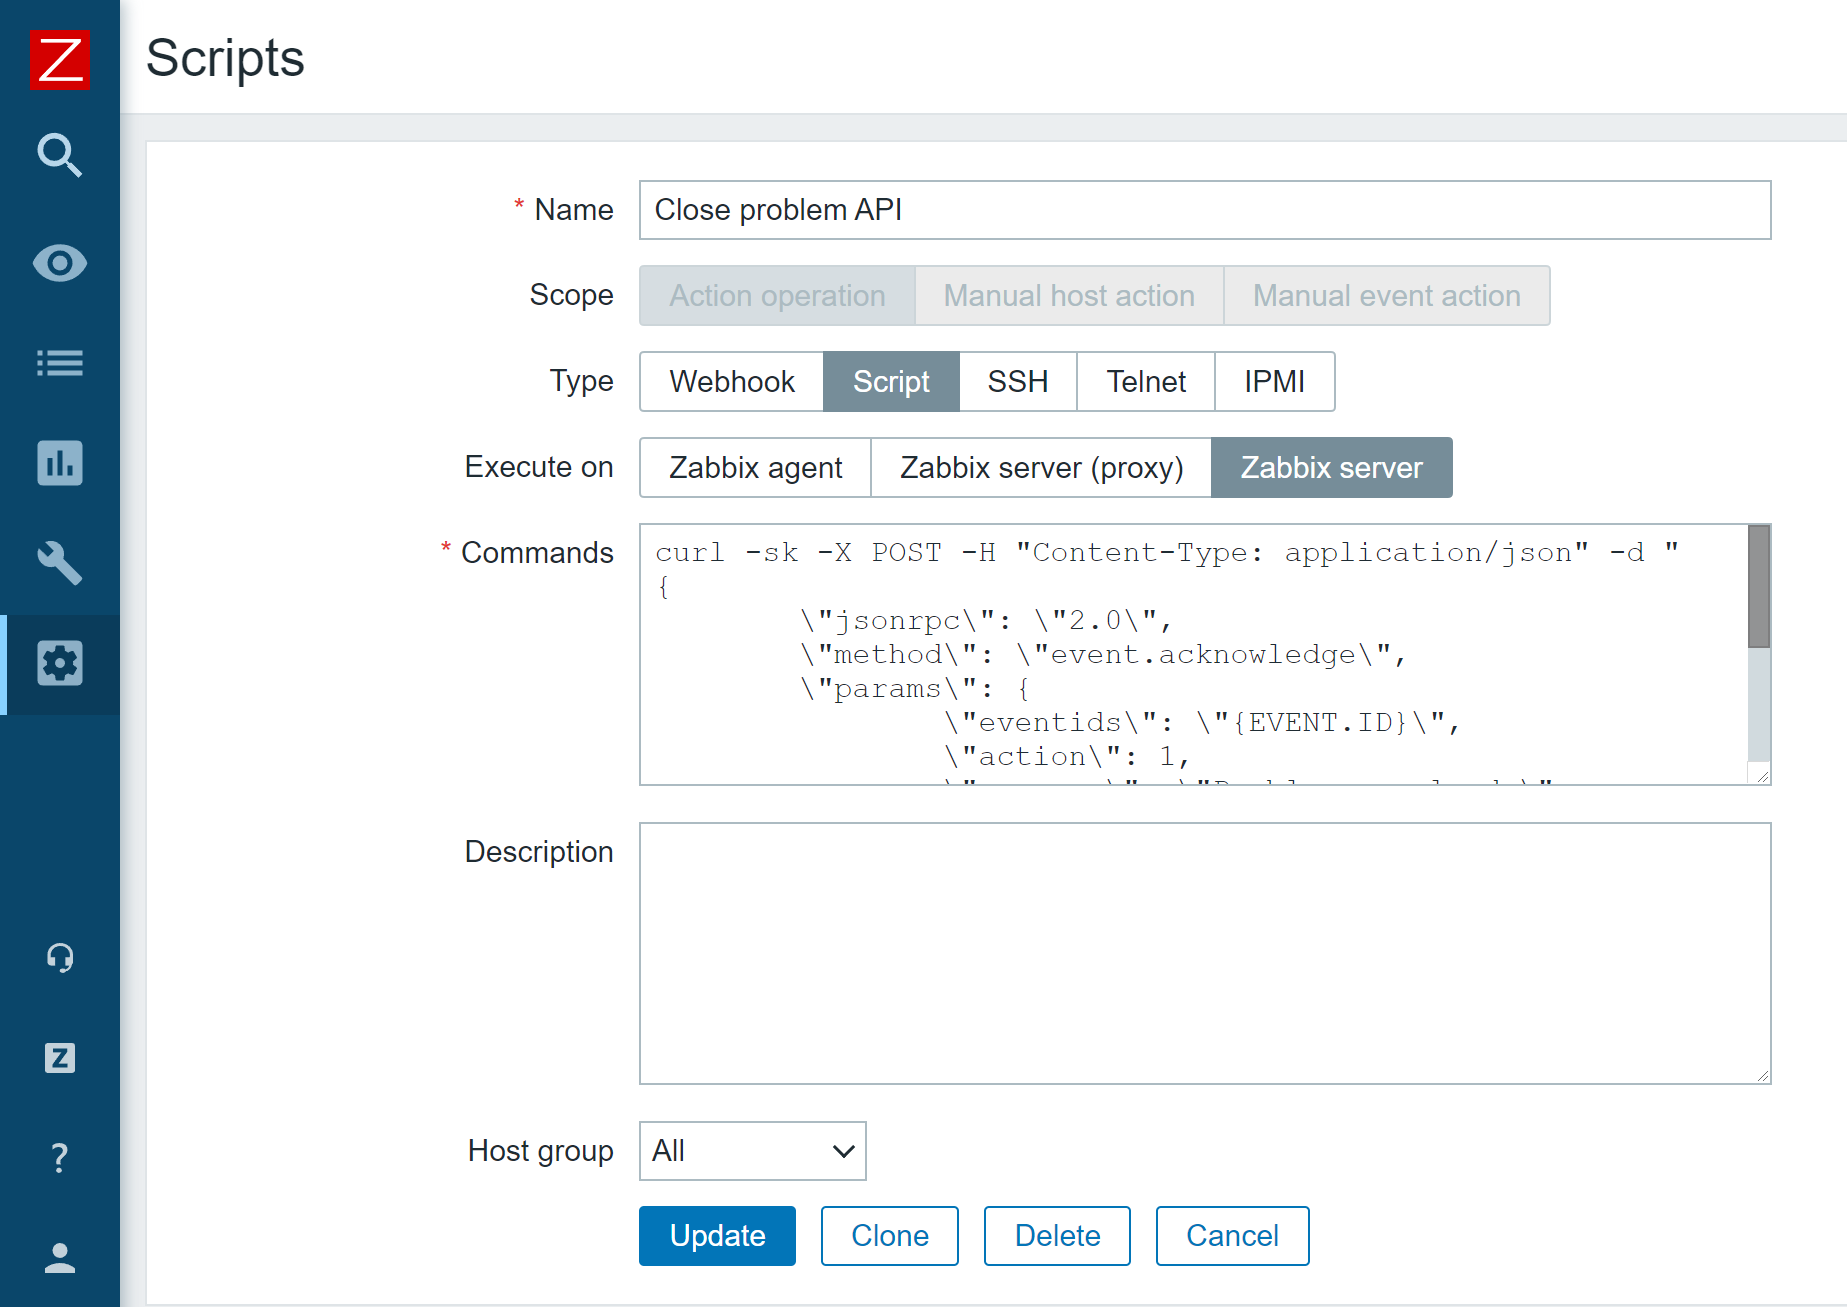 Action operation script that invokes Zabbix event.acknowledge API method
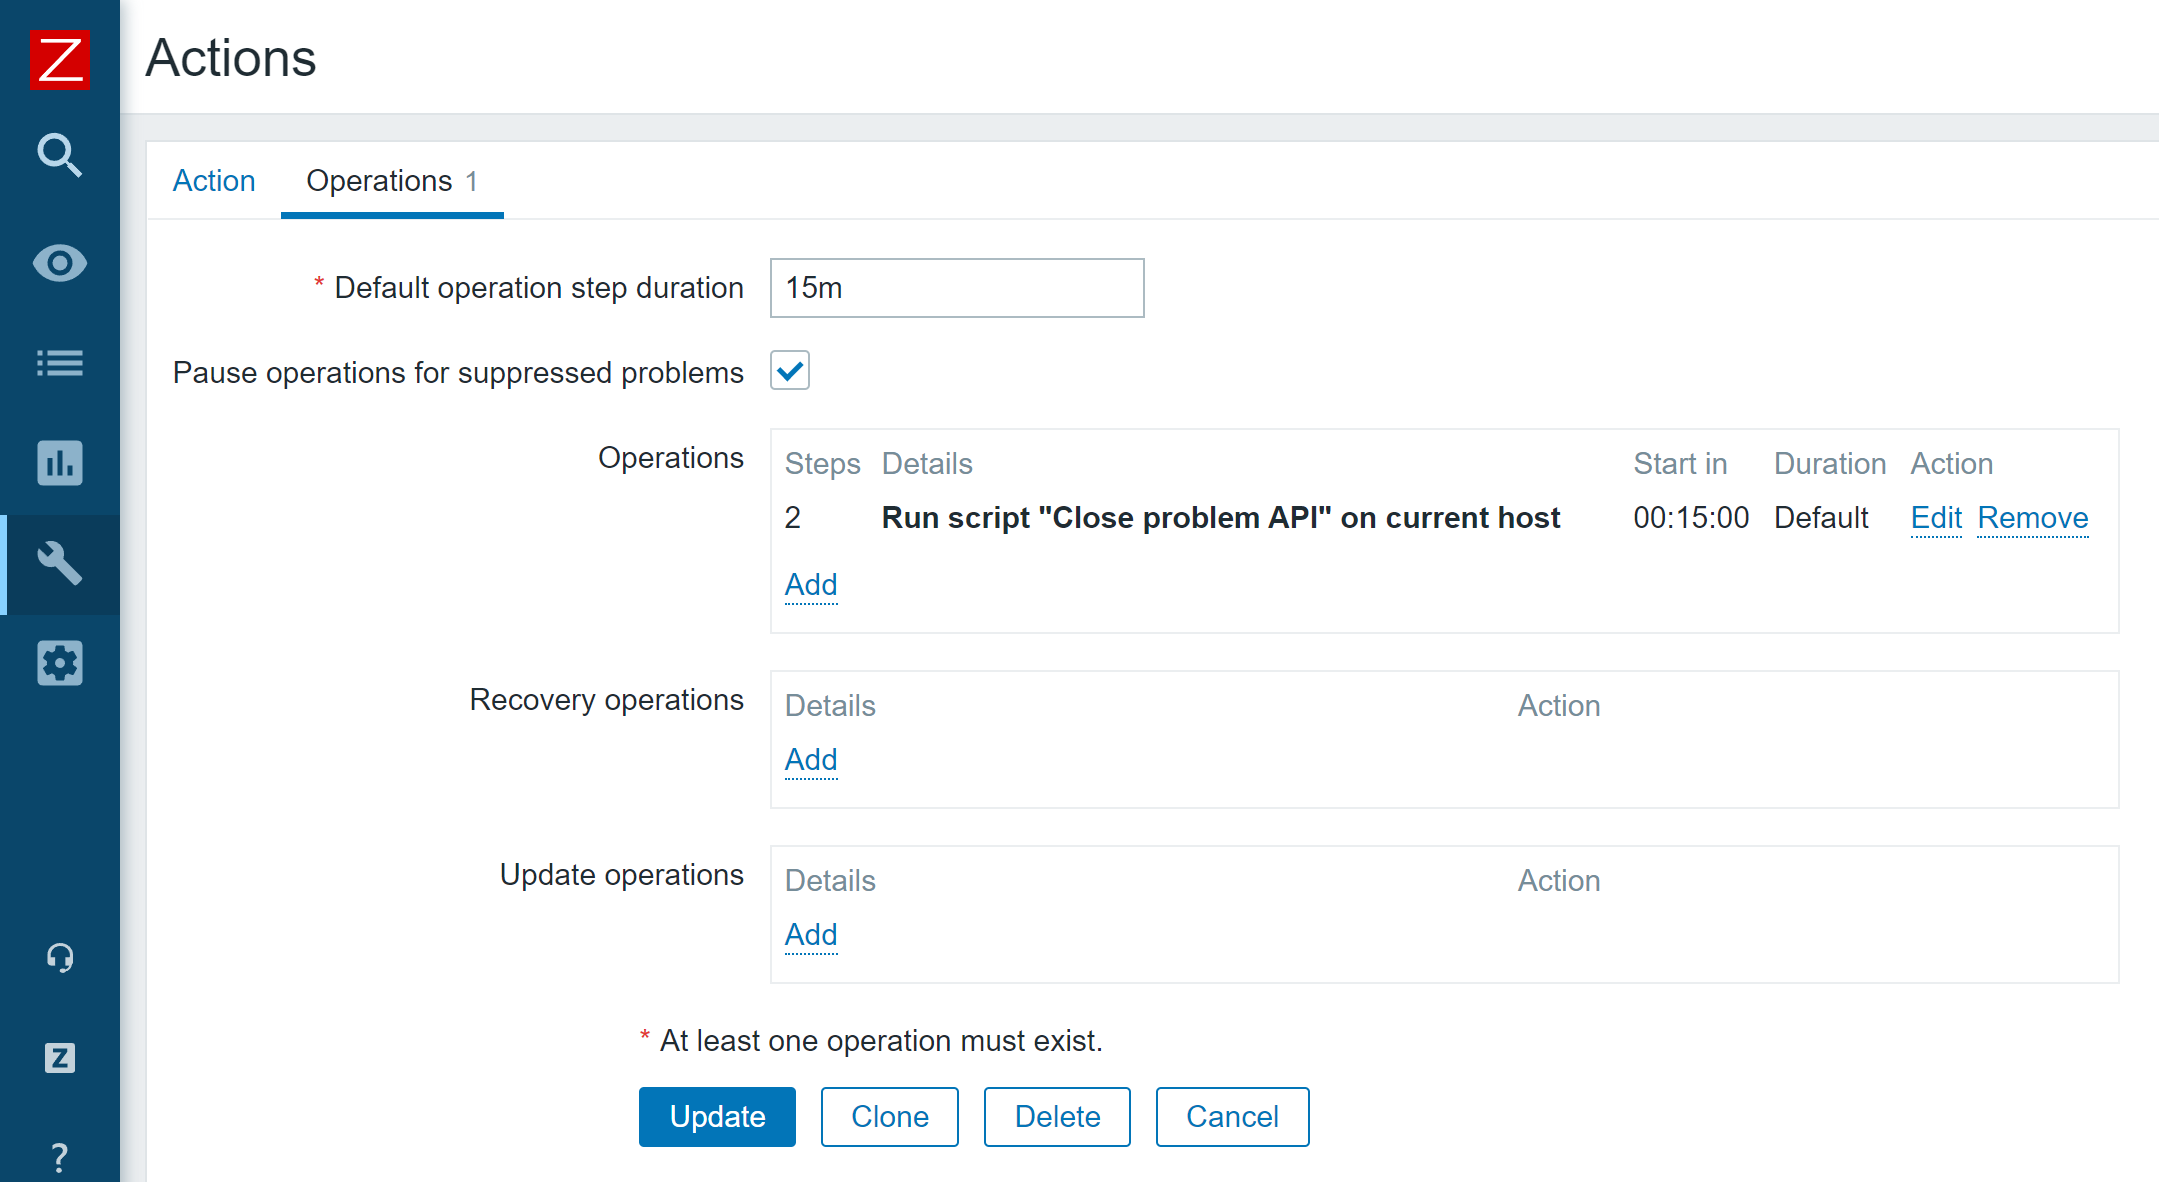 Action operation which runs our event.acknowledge Zabbix API script