Post Syndicated from Giedrius Stasiulionis original https://blog.zabbix.com/extending-zabbix-the-power-of-scripting/27401/
Scripts can extend Zabbix in various different aspects. If you know your ways around a CLI, you will be able to extend your monitoring capabilities and streamline workflows related to most Zabbix components.
What I like about Zabbix is that it is very flexible and powerful tool right out of the box. It has many different ways to collect, evaluate and visualize data, all implemented natively and ready to use.
However, in more complex environments or custom use cases, you will inevitably face situations when something can’t be collected (or displayed) in a way that you want. Luckily enough, Zabbix is flexible even here! It provides you with ways to apply your knowledge and imagination so that even most custom monitoring scenarios would be covered. Even though Zabbix is an open-source tool, in this article I will talk about extending it without changing its code, but rather by applying something on top, with the help of scripting. I will guide you through some examples, which will hopefully pique your curiosity and maybe you will find them interesting enough to experiment and create something similar for yourself.
Although first idea which comes to ones mind when talking about scripts in Zabbix is most likely data collection, it is not the only place where scripts can help. So I will divide those examples / ideas into three sub categories:
- Data collection
- Zabbix internals
- Visualization
Data collection
First things first. Data collection is a starting point for any kind of monitoring. There are multiple ways how to collect data in “custom” ways, but the easiest one is to use UserParameter capabilities. Basics of it are very nicely covered by official documentation or in other sources, e.g. in this video by Dmitry Lambert, so I will skip the “Hello World” part and provide some more advanced ideas which might be useful to consider. Also, the provided examples use common scripting themes/scenarios and you can find many similar solutions in the community, so maybe this will serve better as a reminder or a showcase for someone who has never created any custom items before.
Data collection: DB checks
There is a lot of good information on how to setup DB checks for Zabbix, so this is just a reminder, that one of the ways to do it is via custom scripts. I personally have done it for various different databases: MySQL, Oracle, PostgreSQL, OpenEdge Progress. Thing is ODBC is not always a great or permitted way to go, since some security restrictions might be in place and you can’t get direct access to DB from just anywhere you want. Or you want to transform your retrieved data in a ways that are complex and could hardly be covered by preprocessing. Then you have to rely on Zabbix agent running those queries either from localhost where DB resides or from some other place which is allowed to connect to your DB. Here is an example how you can do it for PostgreSQL
#!/bin/bash

my_dir="$(dirname ${0})"
conf_file="${my_dir}/sms_queue.conf"

[[ ! -f $conf_file ]] && echo -1 && exit 1

. ${conf_file}

export PGPASSWORD="${db_pass}"

query="SELECT COUNT(*) FROM sms WHERE sms.status IN ('retriable', 'validated');"

psql -h "${db_host}" -p "${db_port}" -U "${db_user}" -d "${db}" -c "${query}" -At 2>/dev/null

[[ $? -ne 0 ]] && echo -1 && exit 1

exit 0
Now what’s left is to feed the output of this script into Zabbix via UserParameter. Similar approach can be applied to Oracle (via sqlplus) or MySQL.
Data collection: log delay statistics
I once faced a situation when some graphs which are based on log data started having gaps. It meant something was wrong either with data collection (Zabbix agent) or with data not being there at the moment of collection (so nothing to collect). Quick check suggested it was the second one, but I needed to prove it somehow.
Since these log lines had timestamps of creation, it was a logical step to try to measure, how much do they differ from “current time” of reading. And this is how I came up with the following custom script to implement such idea.
First of all, we need to read the file, say once each minute. We are talking about log with several hundreds of thousands lines per minute, so this script should be made efficient. It should read the file in portions created between two script runs. I have explained such reading in details here so now we will not focus on it.
Next what this script does is it greps timestamps only from each line and counts immediately number of unique lines with the same timestamp (degree of seconds). That is where it becomes fast – it doesn’t need to analyze each and every line individually but it can analyze already grouped content!
Finally, delay is calculated based on the difference between “now” and collected timestamps, and those counters are exactly what is then passed to Zabbix.
#!/bin/bash

my_log="${1}"

my_project="${my_log##*\/}"
my_project="${my_project%%.log}"

me="$(basename ${0})"
my_dir="/tmp/log_delays/${my_project}"

[[ ! -d ${my_dir} ]] && mkdir -p ${my_dir}

# only one instance of this script at single point of time
# this makes sure you don't damage temp files

me_running="${my_dir}/${me}.running"

# allow only one process
# but make it more sophisticated:
# script is being run each minute
# if .running file is here for more than 10 minutes, something is wrong
# delete .running and try to run once again

[[ -f $me_running && $(($(date +%s)-$(stat -c %Y $me_running))) -lt 600 ]] && exit 1

touch $me_running

[[ "${my_log}" == "" || ! -f "${my_log}" ]] && exit 1

log_read="${my_dir}/${me}.read"

# get current file size in bytes

current_size=$(wc -c < "${my_log}")

# remember how many bytes you have now for next read
# when run for first time, you don't know the previous

[[ ! -f "${log_read}" ]] && echo "${current_size}" > "${log_read}"

bytes_read=$(cat "${log_read}")
echo "${current_size}" > "${log_read}"

# if rotated, let's read from the beginning

if [[ ${bytes_read} -gt ${current_size} ]]; then
  bytes_read=0
fi


# get the portion

now=$(date +%s)

delay_1_min=0
delay_5_min=0
delay_10_min=0
delay_30_min=0
delay_45_min=0
delay_60_min=0
delay_rest=0

while read line; do

  [[ ${line} == "" ]] && continue

  line=(${line})

  ts=$(date -d "${line[1]}+00:00" +%s)

  delay=$((now-ts))

  if [[ ${delay} -lt 60 ]]; then
    delay_1_min=$((${delay_1_min}+${line[0]}))
  elif [[ ${delay} -lt 300 ]]; then
    delay_5_min=$((${delay_5_min}+${line[0]}))
  elif [[ ${delay} -lt 600 ]]; then
    delay_10_min=$((${delay_10_min}+${line[0]}))
  elif [[ ${delay} -lt 1800 ]]; then
    delay_30_min=$((${delay_30_min}+${line[0]}))
  elif [[ ${delay} -lt 2700 ]]; then
    delay_45_min=$((${delay_45_min}+${line[0]}))
  elif [[ ${delay} -lt 3600 ]]; then
    delay_60_min=$((${delay_60_min}+${line[0]}))
  else
    delay_rest=$((${delay_rest}+${line[0]}))
  fi

done <<< "$(tail -c +$((bytes_read+1)) "${my_log}" | head -c $((current_size-bytes_read)) | grep -Po "(?<=timestamp\":\")(\d{4}-\d{2}-\d{2}T\d{2}:\d{2}:\d{2})(?=\.)" | sort | uniq -c | sort -k1nr)"

echo "delay_1_min=${delay_1_min}
delay_5_min=${delay_5_min}
delay_10_min=${delay_10_min}
delay_30_min=${delay_30_min}
delay_45_min=${delay_45_min}
delay_60_min=${delay_60_min}
delay_rest=${delay_rest}"


rm -f "${me_running}"

exit 0
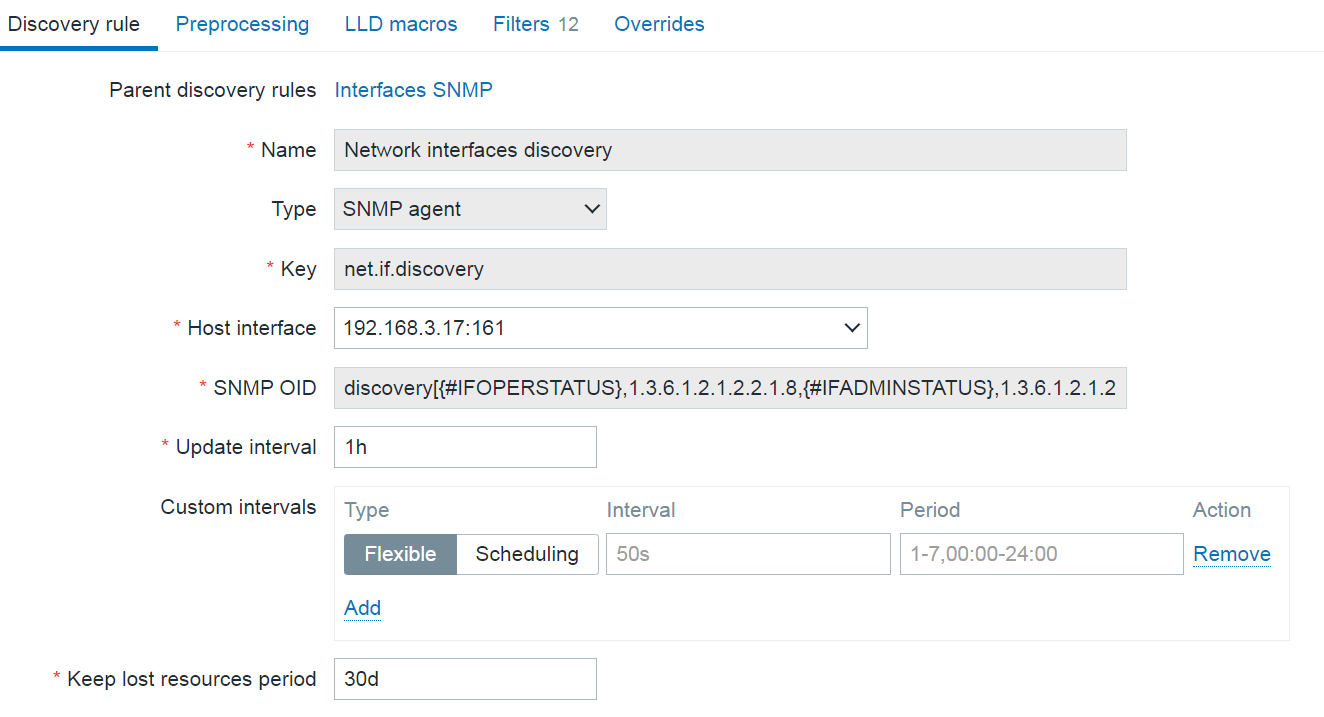
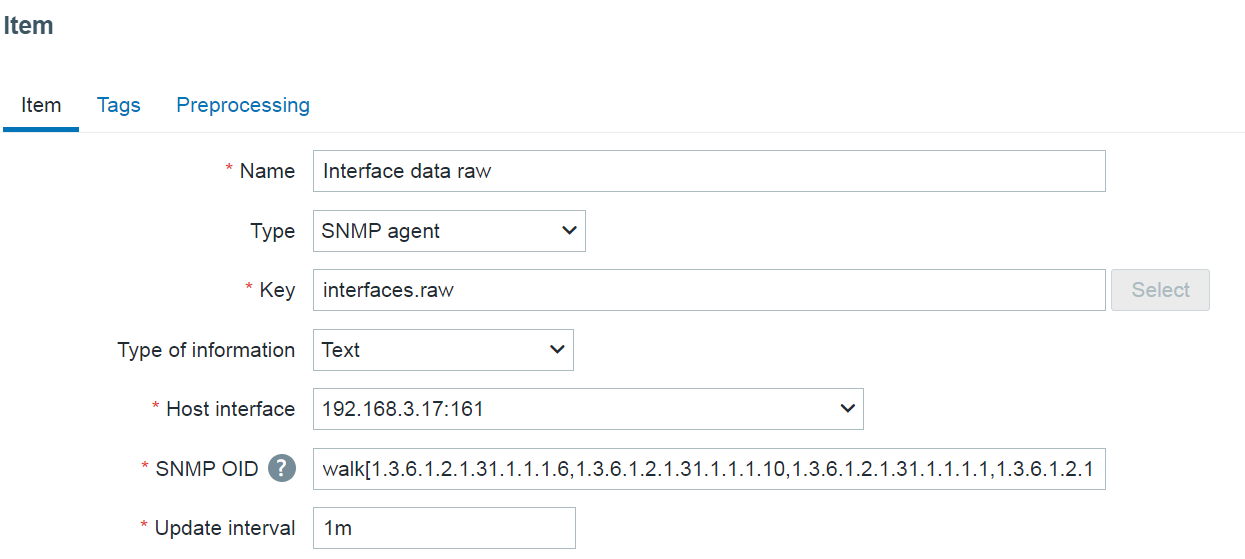
Now on Zabbix side, there is an item running this script and 7 dependent items, representing the degree of delay. Since there are many logs for which this data is collected, it is all put into LLD based on contents of specific directory:
vfs.dir.get[/var/log/logs,".*log$",,,,,1000]
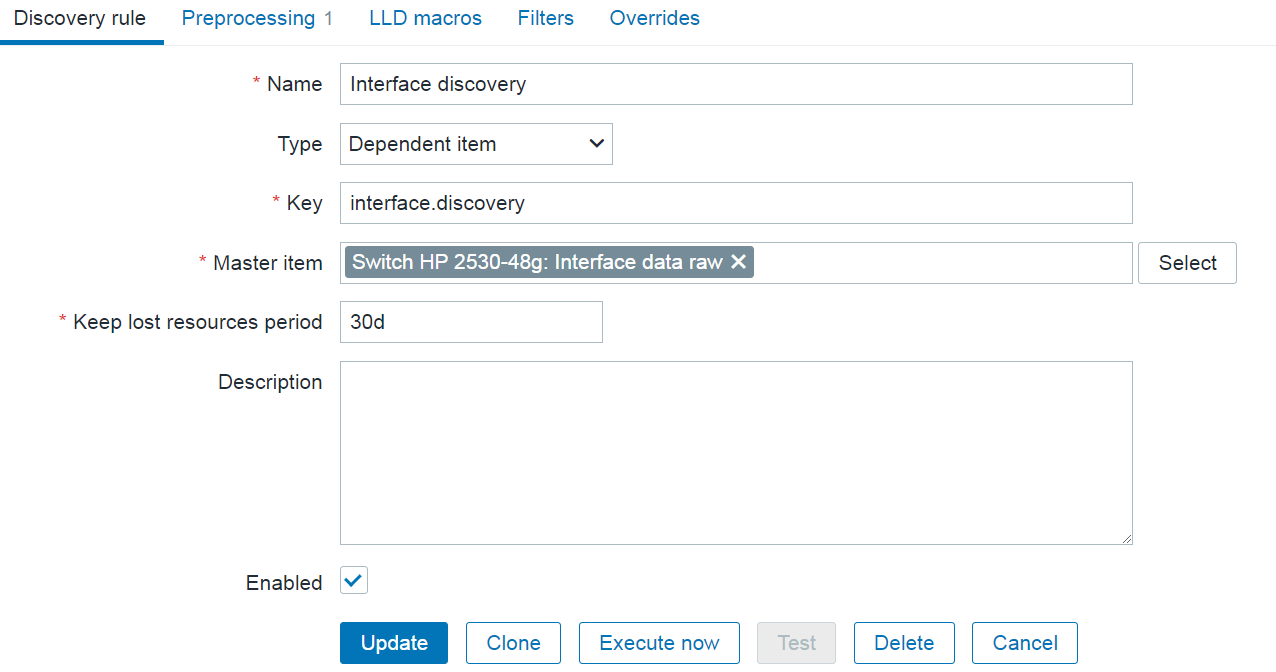
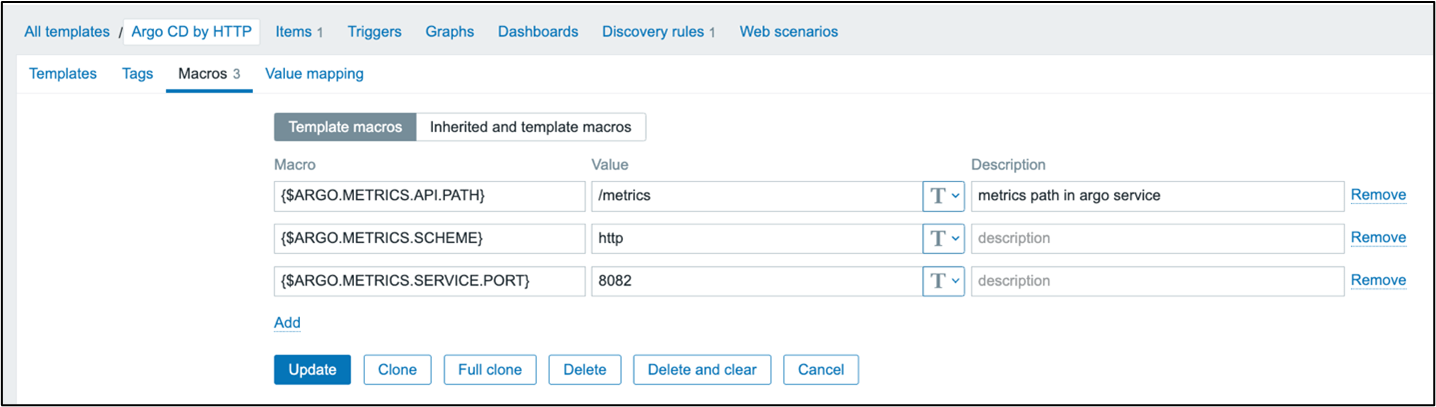
This LLD then provides two macros:
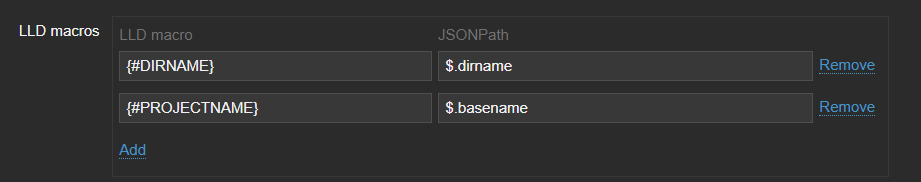
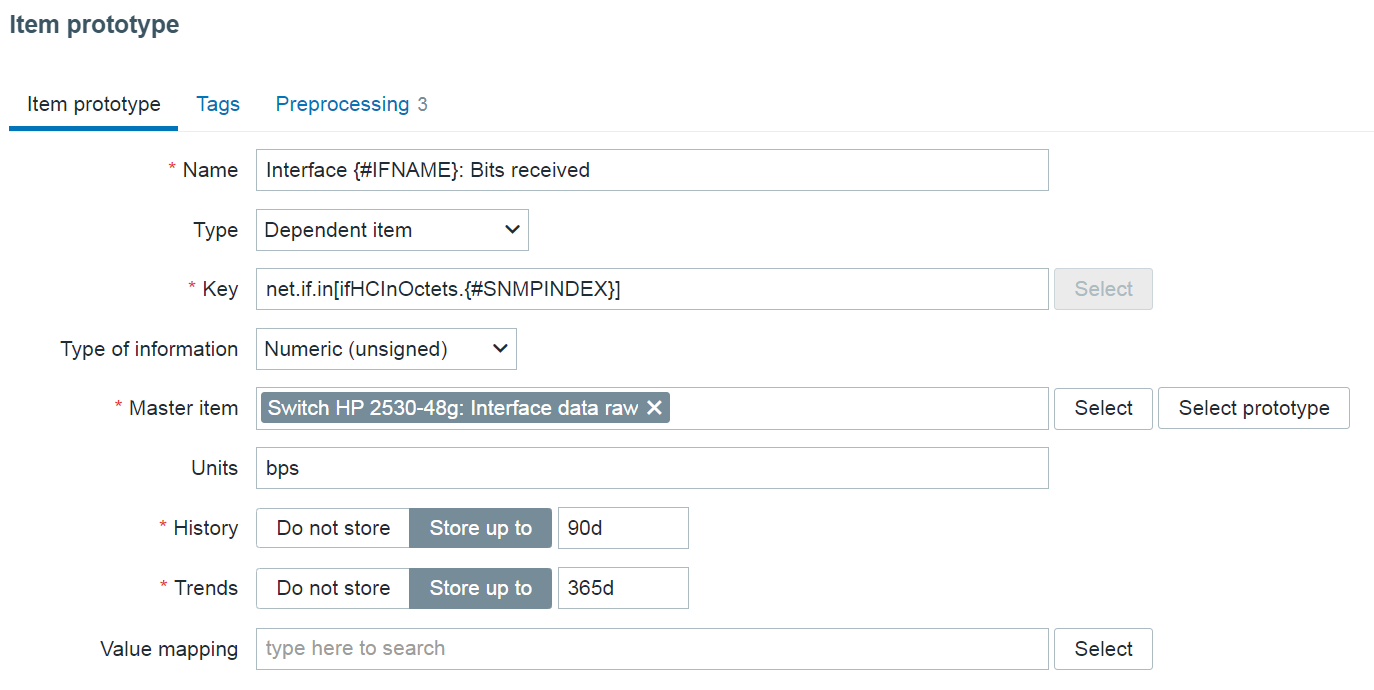
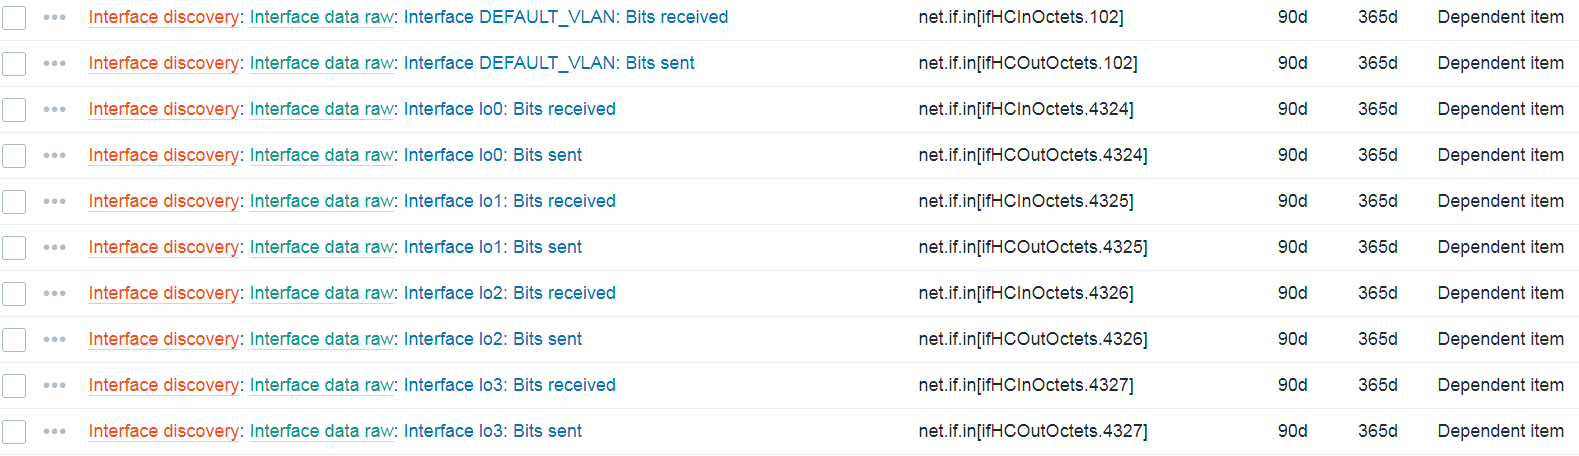
And item prototypes will look like:
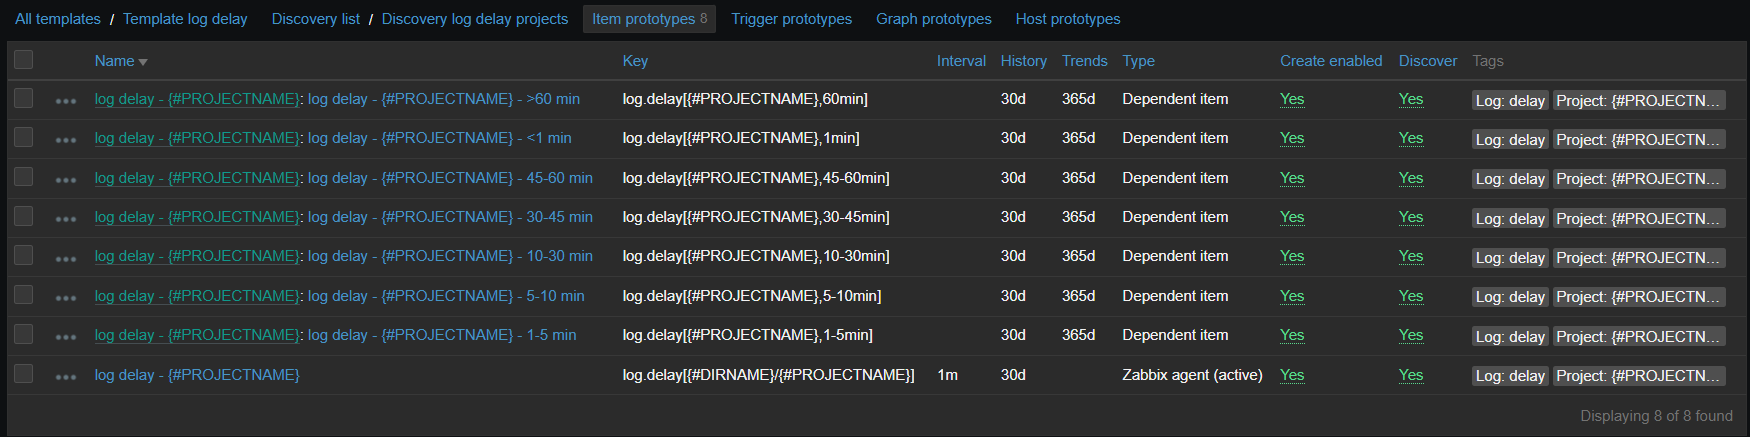
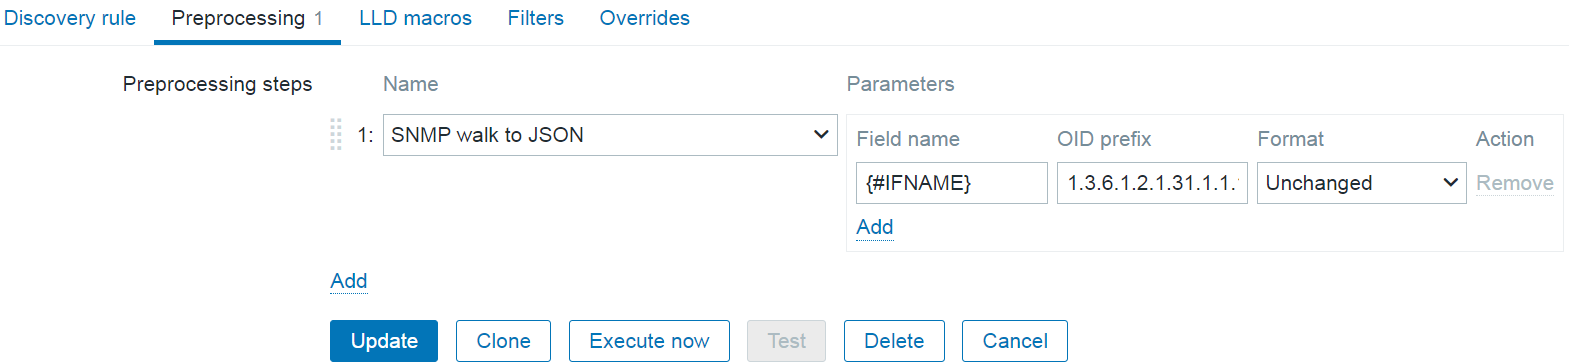
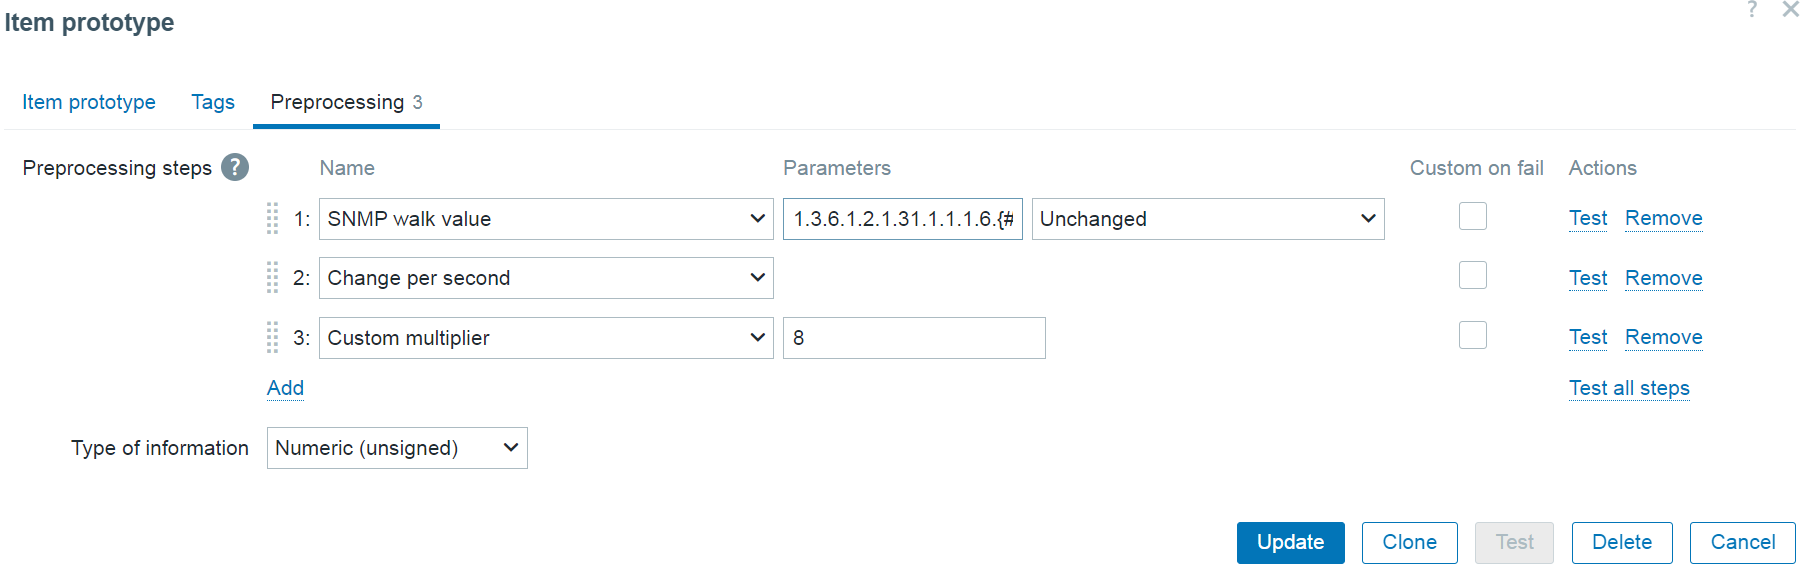
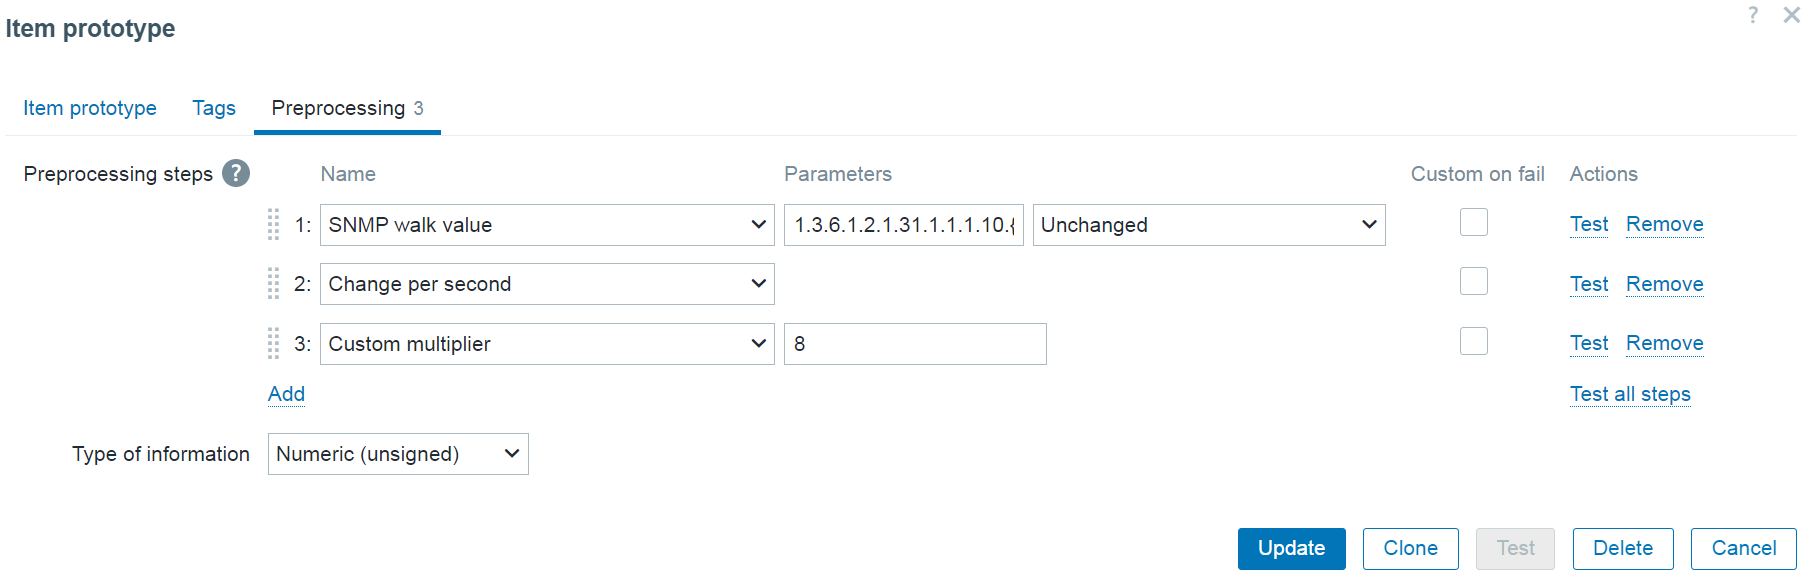
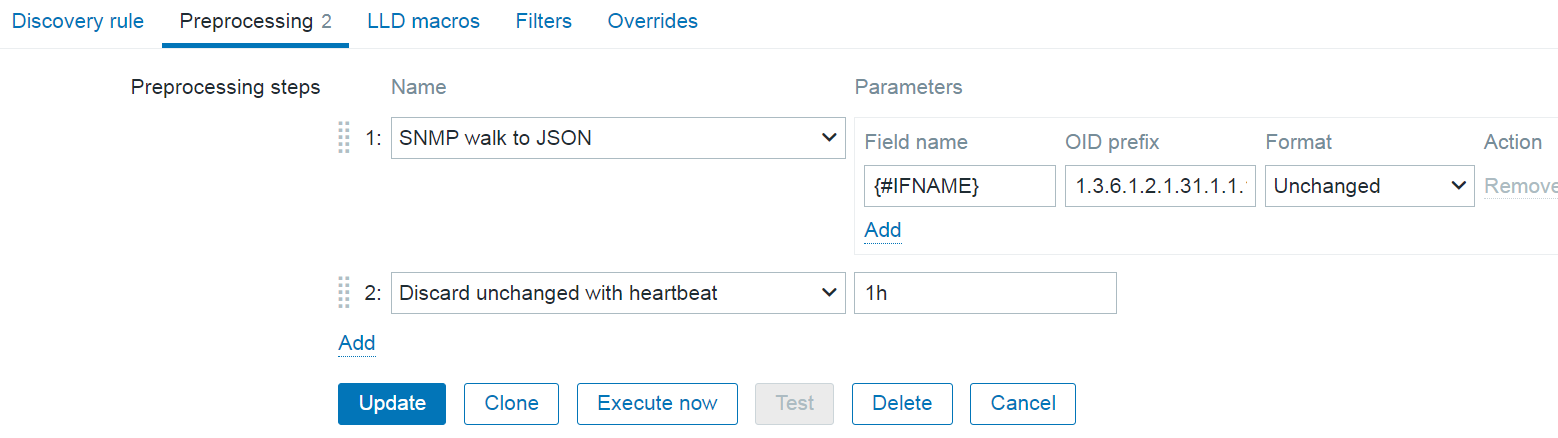
Those dependent items have one simple preprocessing step which takes needed number out of the script output:

So the final result is the nice graph in dashboard, showing exactly when and what degree delays do appear:
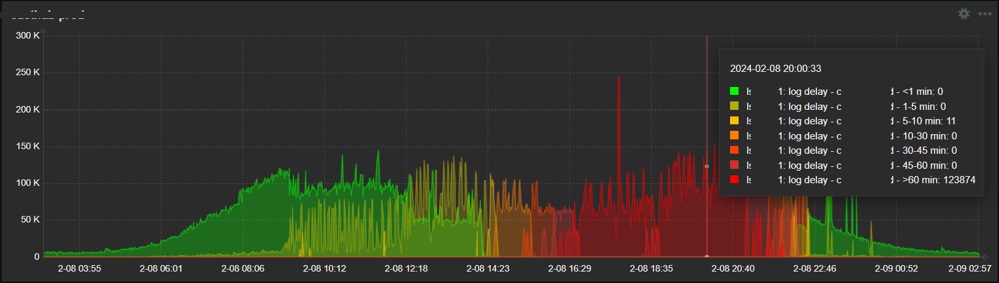
So as you see, it is relatively easy to collect just about any data you wish, once you know how. As you can see from these examples, it might be something more complex but it can also be just a simple one-liner – in any case it should be obvious that possibilities are endless when talking about scripts in data collection. If something is executable from the CLI and has a valuable output, go ahead and collect it!
Zabbix internals
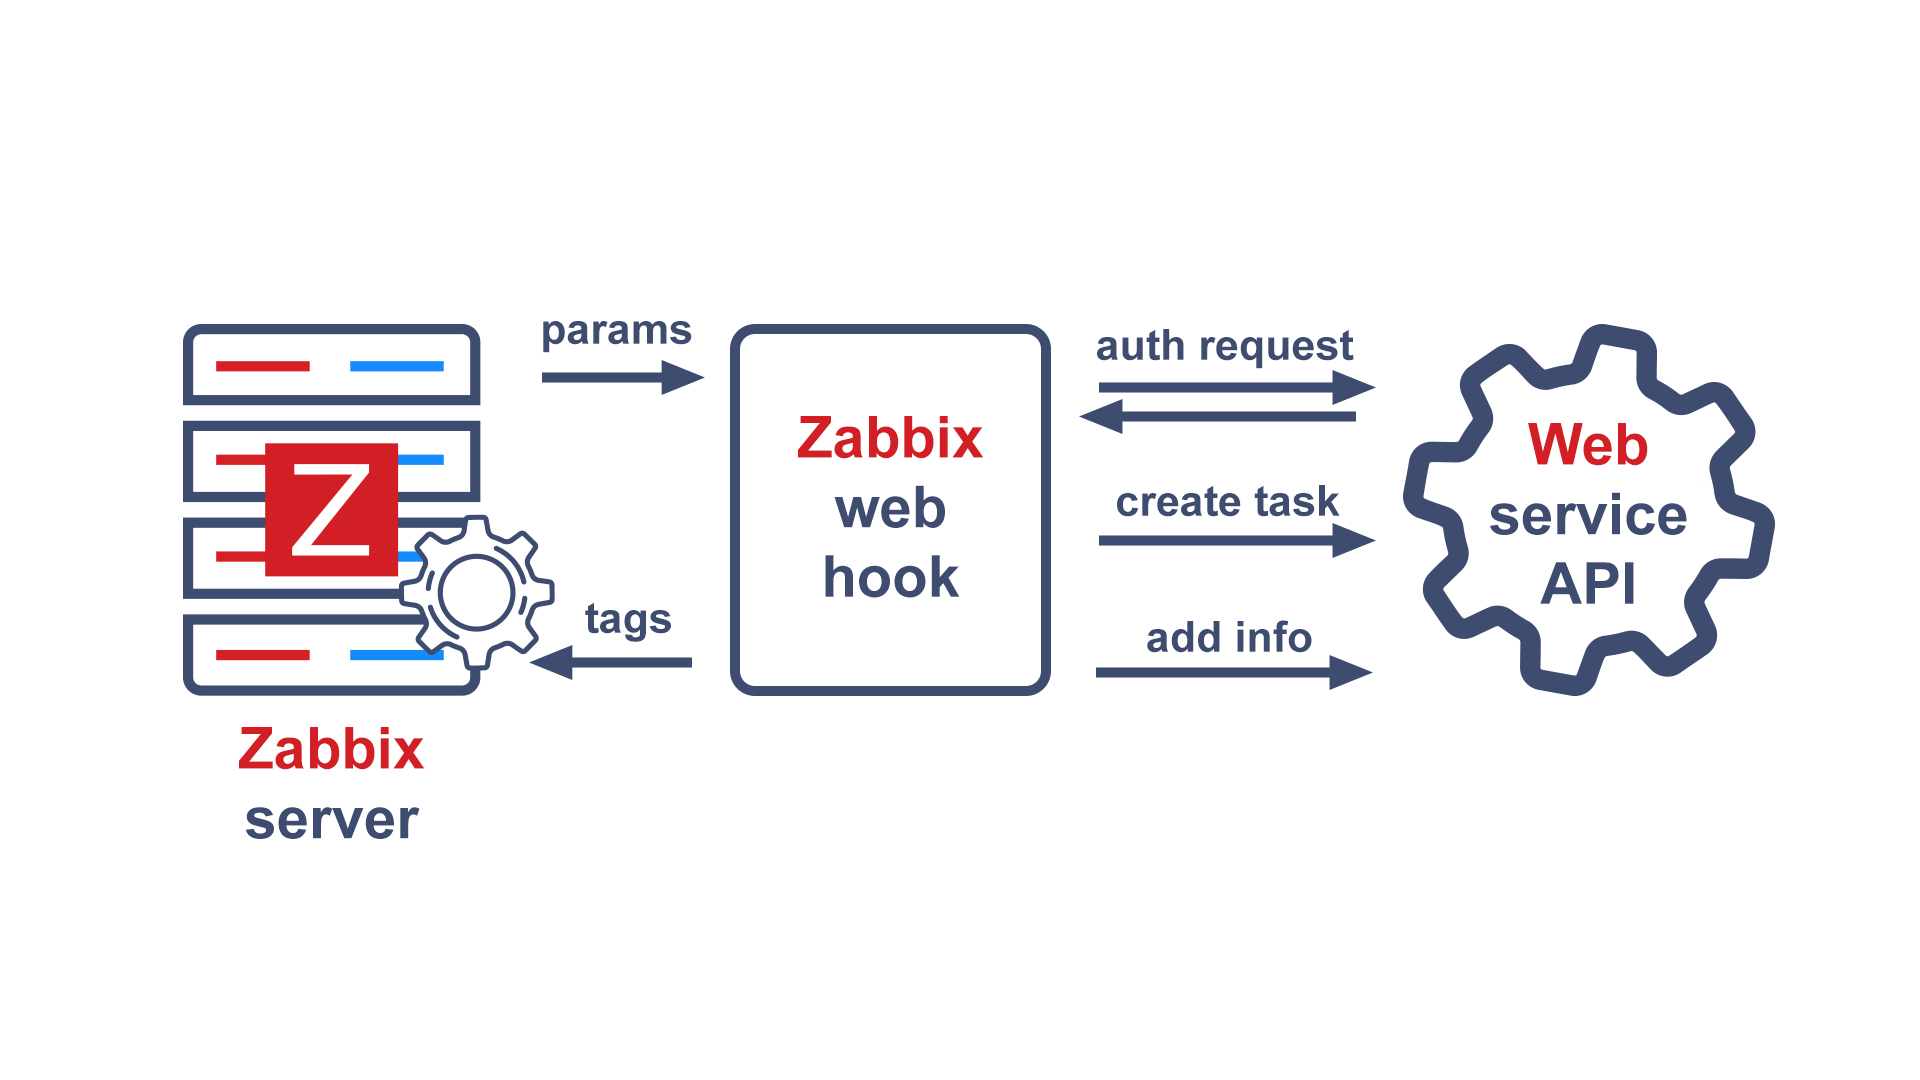
Another area where scripts can be really useful is adjusting how Zabbix behaves or controlling this behavior automatically. And in this case, we will employ Zabbix API, since it’s designed exactly for such or similar purposes.
Zabbix internals: automatically disabling problematic item
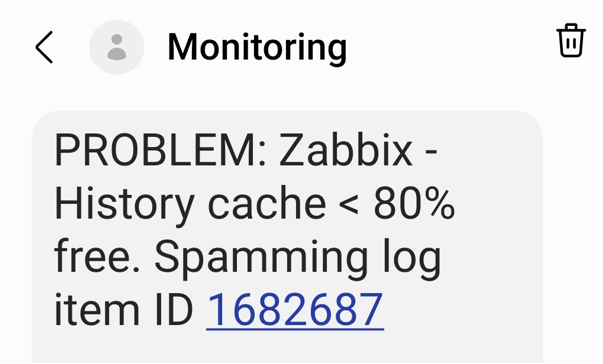
In our environment, we have many logs to be analyzed. And some of them sometimes go crazy – something that we intend to catch starts appearing there too often and requires attention – typically we would have to adjust the regexp, temporarily suppress some patterns and inform responsible teams about too extensive logging. If you don’t (or can’t) pay attention quick, it might kill Zabbix – history write cache starts filling up. So what we do is automatically detect such an item with most values received during some most recent short period of time and automatically disable it.
First of all there are two items – the one measuring history write cache and the other one extracting top item in the given table
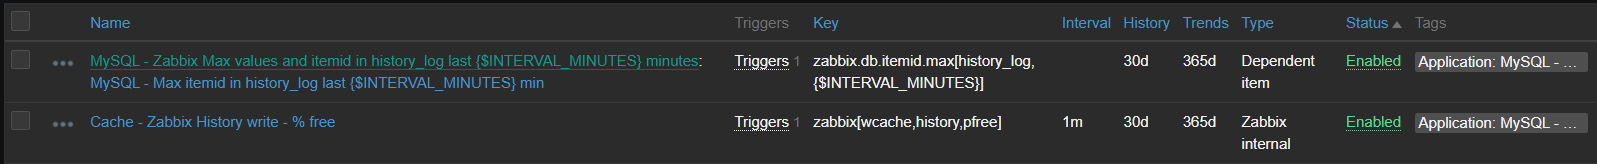
[root@linux ~]# zabbix_agentd -t zabbix.db.max[history_log,30] 2>/dev/null
zabbix.db.max[history_log,30] [t|463 1997050]
[root@linux ~]#
First number here is values gathered during provided period, second one is item id. The script behind this item looks like this
[root@linux ~]# grep zabbix.db.max /etc/zabbix/zabbix_agentd.d/userparameter_mysql.conf
UserParameter=zabbix.db.max[*],HOME=/etc/zabbix mysql -BN -e "USE zabbix; SELECT count(*), itemid FROM $1 WHERE clock >= unix_timestamp(NOW() - INTERVAL $2 MINUTE) GROUP BY itemid ORDER BY count(*) DESC LIMIT 1;"
[root@linux ~]#
And now relying on the history write cache item values showing us drop, we construct a trigger:

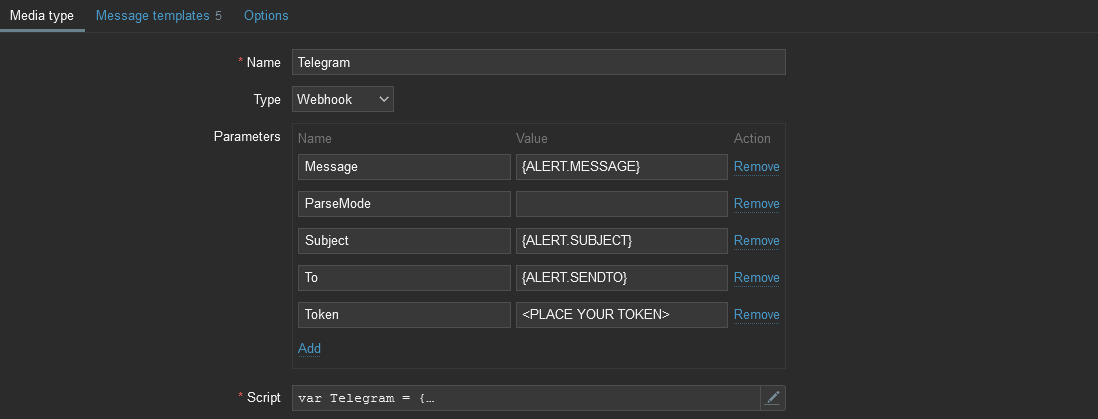
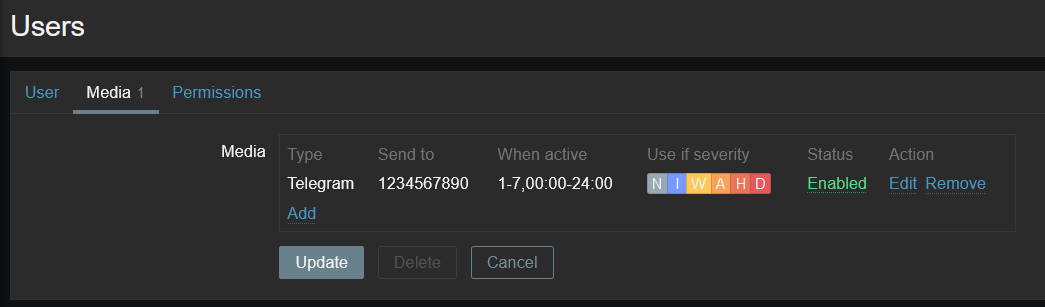
And as a last step, such trigger invokes action, which is running the script that disables the item with given ID with the help of Zabbix API, method “item.update”
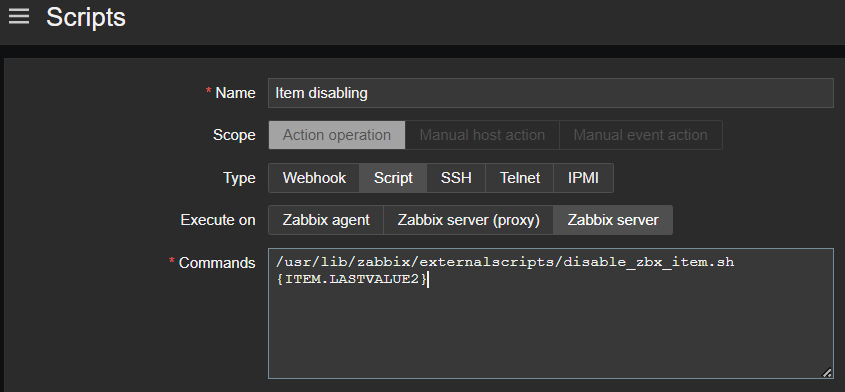
Now we are able to avoid unexpected behavior of our data sources affecting Zabbix performance, all done automatically – thanks to the scripts!
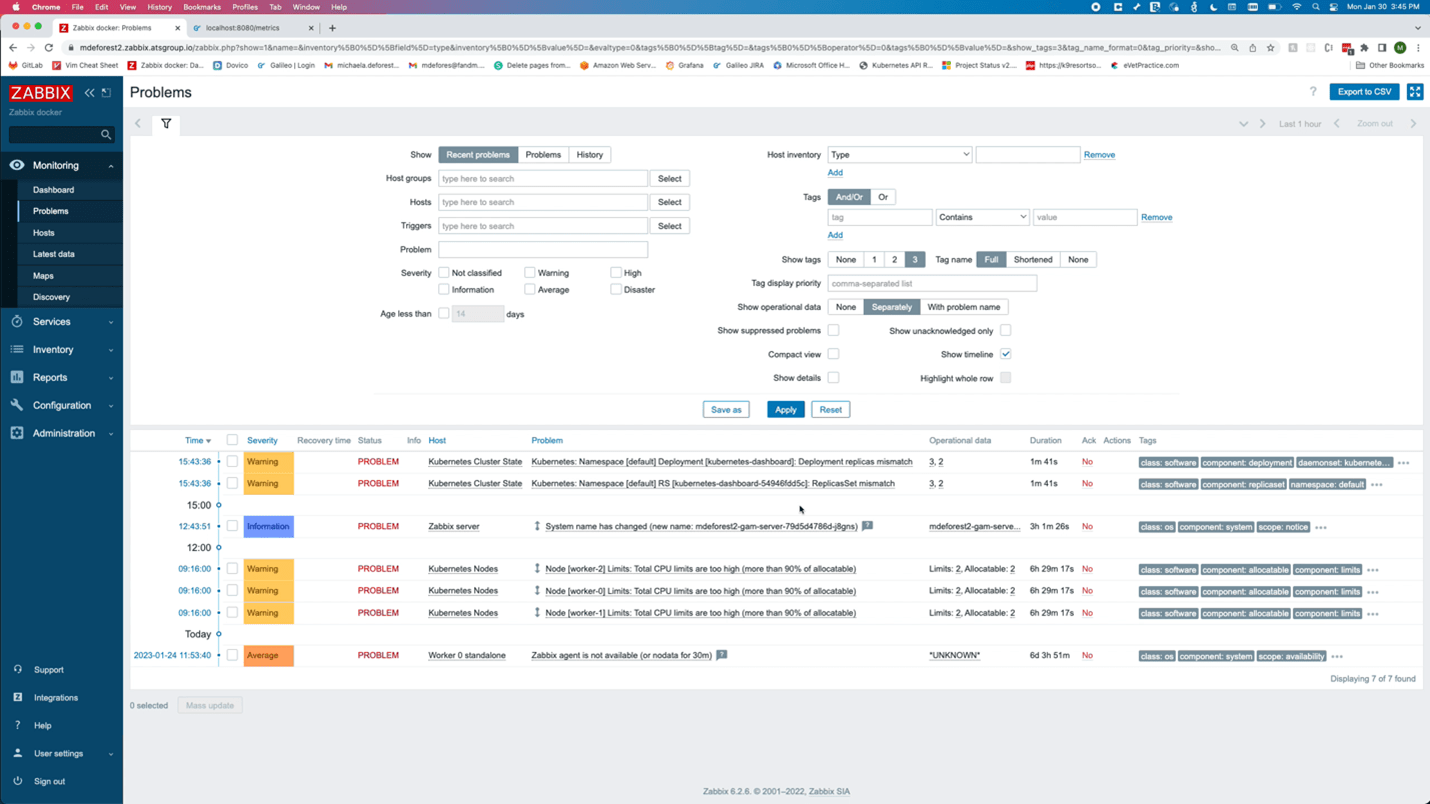
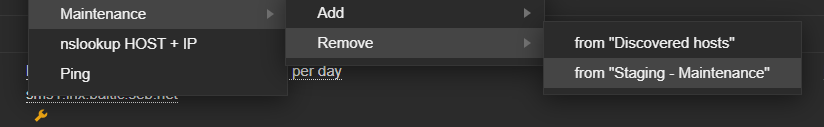
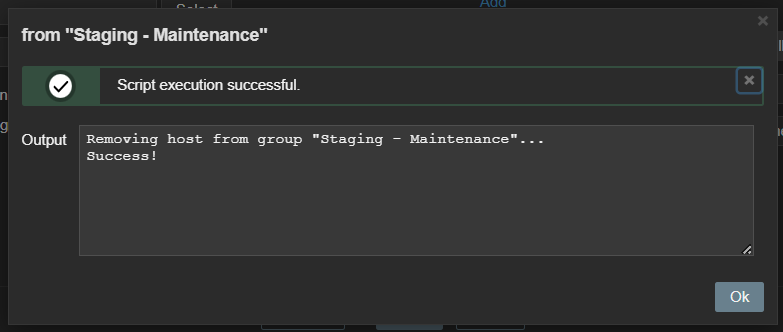
Zabbix internals: add host to group via frontend scripts
Zabbix maintenance mode is a great feature allowing us to reduce noise or avoid some false positive alerts once specific host is known to have issues. At some point we found it would be convenient to be able to add (or remove) specific host into (from) maintenance directly from “Problems” window. And that is possible and achieved via a frontend script, again with the help of Zabbix API, this time methods “host.get”, “hostgroup.get”, “hostgroup.massadd” and “hostgroup.massremove”

Data visualization
Zabbix has many different widgets that are able to cover various different ways of displaying your collected data. But in some cases, you might find yourself missing some small type of “something” which would allow your dashboards to shine even more – at least I constantly face it. Starting From version 6.4 Zabbix allows you to create your own widgets but it might be not such a straightforward procedure if you have little or no programming experience. However, you can employ two already existing widgets in order to customize your dashboard look in pretty easy way.
Data visualization: URL widget
First one example is done using the URL widget. You might feed just about any content there, so if you have any web development skills, you can easily create something which would look like custom widget. Here is an example. I need a clock but not the one already provided by Zabbix as a separate clock widget – I want to have a digital clock and I also want this clock to have a section, which would display the employee on duty now and in an upcoming shift. So with a little bit of HTML, CSS and JavaScript / AJAX, I have this
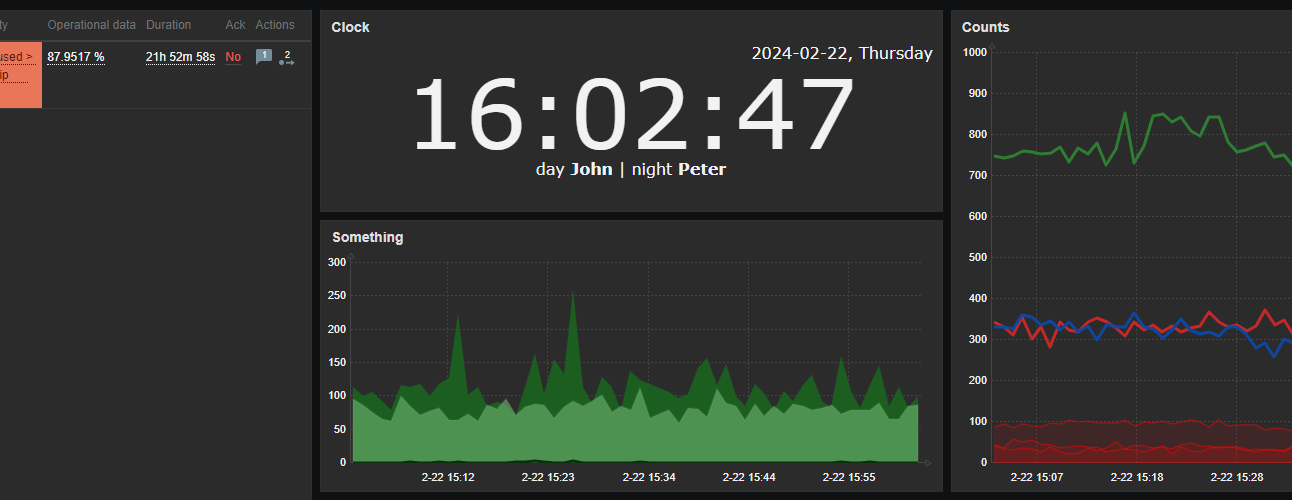
With styles properly chosen, such content can be smoothly integrated into dashboards, along with other widgets.
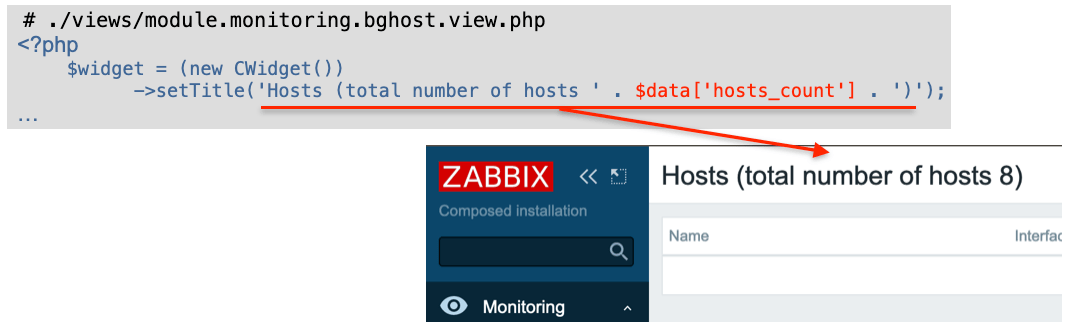
Data visualization: plain text widget with HTML formatting
Another useful widget which is often overlooked is the “Plain text” widget – in combination with the following parameters:

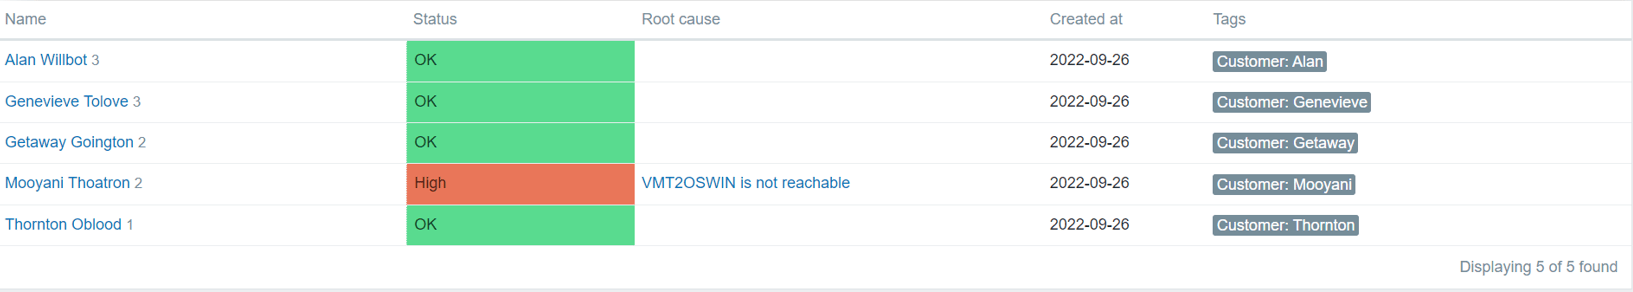
It becomes a very powerful tool to display nicely formatted data snapshots. Simple yet very good example here would be to display some content, which requires human readable structure – a table.
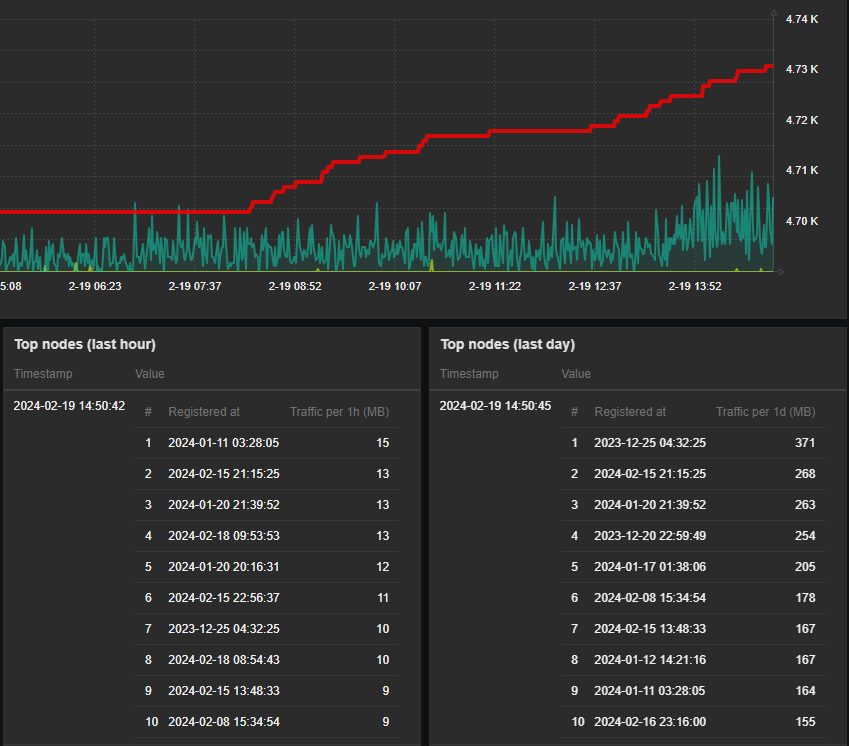
So again, integration with other dashboard widgets is so smooth – with just some custom HTML / CSS around your data you wrap it into something that looks like brand new “table” widget. Isn’t it awesome? And you are of course not limited to tables… Just use your imagination!
Conclusion
Although I personally prefer bash as the first option to solve things, there is no big difference regarding which scripting or programming languages to choose when extending Zabbix in these ways. Just try anything you feel most comfortable with.
I hope that examples shown here inspired you in some ways. Happy scripting!
The post Extending Zabbix: the power of scripting appeared first on Zabbix Blog.