Post Syndicated from Goutham Veeramachaneni (@Gouthamve) and Carrie Edwards (@carrieedwards) original https://prometheus.io/blog/2024/03/14/commitment-to-opentelemetry/
Yearly Archives: 2024
HVAC sizing follow-up (aux heat, shared walls, sizing for heating, "runs all the time," etc)
Post Syndicated from Technology Connextras original https://www.youtube.com/watch?v=ZA_EifQu6is
Comic for 2024.03.13 – Boobies
Post Syndicated from Explosm.net original https://explosm.net/comics/boobies
New Cyanide and Happiness Comic
Our commitment to OpenTelemetry
Post Syndicated from Goutham Veeramachaneni (@Gouthamve) and Carrie Edwards (@carrieedwards) original https://prometheus.io/blog/2024/03/14/commitment-to-opentelemetry/
The OpenTelemetry project is an Observability framework and toolkit designed to create and manage telemetry data such as traces, metrics, and logs. It is gaining widespread adoption due to its consistent specification between signals and promise to reduce vendor lock-in which is something that we’re excited about.
Looking back at 2023
Over the past few years, we have collaborated with the OpenTelemetry community to make sure that OpenTelemetry and Prometheus support each other bidirectionally. This led to the drafting of the official specification to convert between the two systems, as well as the implementations that allow you to ingest Prometheus metrics into OpenTelemetry Collector and vice-versa.
Since then, we have spent a significant amount of time understanding the challenges faced by OpenTelemetry users when storing their metrics in Prometheus and based on those, explored how we can address them. Some of the changes proposed need careful considerations to avoid breaking either side’s operating promises, e.g. supporting both push and pull. At PromCon Berlin 2023, we attempted to summarize our ideas in one of the talks.
At our dev summit in Berlin, we spent the majority of our time discussing these changes and our general stance on OpenTelemetry in depth, and the broad consensus is that we want “to be the default store for OpenTelemetry metrics”!
We’ve formed a core group of developers to lead this initiative, and we are going to release a Prometheus 3.0 in 2024 with OTel support as one of its more important features. Here’s a sneak peek at what’s coming in 2024.
The year ahead
OTLP Ingestion GA
In Prometheus v2.47.0, released on 6th September 2023, we added experimental support for OTLP ingestion in Prometheus. We’re constantly improving this and we plan to add support for staleness and make it a stable feature. We will also mark our support for out-of-order ingestion as stable. This involves also GA-ing our support for native / exponential histograms.
Support UTF-8 metric and label names
OpenTelemetry semantic conventions push for “.” to be the namespacing character. For example, http.server.request.duration. However, Prometheus currently requires a more limited character set, which means we convert the metric to http_server_request_duration when ingesting it into Prometheus.
This causes unnecessary dissonance and we’re working on removing this limitation by adding UTF-8 support for all labels and metric names. The progress is tracked here.
Native support for resource attributes
OpenTelemetry differentiates between metric attributes (labels to identify the metric itself, like http.status_code) and resource attributes (labels to identify the source of the metrics, like k8s.pod.name), while Prometheus has a more flat label schema. This leads to many usability issues that are detailed here.
We’re exploring several solutions to this problem from many fronts (Query, UX, storage, etc.), but our goal is to make it quite easy to filter and group on resource attributes. This is a work in progress, and feedback and help are wanted!
OTLP export in the ecosystem
Prometheus remote write is supported by most of the leading Observability projects and vendors already. However, OpenTelemetry Protocol (OTLP) is gaining prominence and we would like to support it across the Prometheus ecosystem.
We would like to add support for it to the Prometheus server, SDKs and the exporters. This would mean that any service instrumented with the Prometheus SDKs will also be able to push OTLP and it will unlock the rich Prometheus exporter ecosystem for OpenTelemetry users.
However, we intend to keep and develop the OpenMetrics exposition format as an optimized / simplified format for Prometheus and pull-based use-cases.
Delta temporality
The OpenTelemetry project also supports Delta temporality which has some use-cases for the Observability ecosystem. We have a lot of Prometheus users still running statsd and using the statsd_exporter for various reasons.
We would like to support the Delta temporality of OpenTelemetry in the Prometheus server and are working towards it.
Call for contributions!
As you can see, a lot of new and exciting things are coming to Prometheus! If working in the intersection between two of the most relevant open-source projects around observability sounds challenging and interesting to you, we’d like to have you on board!
This year there is also a change of governance in the works that will make the process of becoming a maintainer easier than ever! If you ever wanted to have an impact on Prometheus, now is a great time to get started.
Our first focus has always been to be as open and transparent as possible on how we are organizing all the work above so that you can also contribute. We are looking for contributors to support this initiative and help implement these features. Check out the Prometheus 3.0 public board and Prometheus OTel support milestone to track the progress of the feature development and see ways that you can contribute.
Conclusion
Some of the changes proposed are large and invasive or involve a fundamental departure from the original data model of Prometheus. However, we plan to introduce these gracefully so that Prometheus 3.0 will have no major breaking changes and most of the users can upgrade without impact.
We are excited to embark on this new chapter for Prometheus and would love your feedback on the changes suggested.
Earth
Post Syndicated from xkcd.com original https://xkcd.com/2906/

Today’s hardware vulnerability: register file data sampling
Post Syndicated from corbet original https://lwn.net/Articles/965167/
The mainline kernel has just received a set of commits addressing the
“register file data sampling” hardware vulnerability.
RFDS may allow a malicious actor to infer data values previously
used in floating point registers, vector registers, or integer
registers. RFDS does not provide the ability to choose which data
is inferred
Only Atom cores are affected, but those cores can be found inside a number
of processors. See this documentation
commit for more information.
Infrastructure as Code development with Amazon CodeWhisperer
Post Syndicated from Eric Z. Beard original https://aws.amazon.com/blogs/devops/infrastructure-as-code-development-with-amazon-codewhisperer/
At re:Invent in 2023, AWS announced Infrastructure as Code (IaC) support for Amazon CodeWhisperer. CodeWhisperer is an AI-powered productivity tool for the IDE and command line that helps software developers to quickly and efficiently create cloud applications to run on AWS. Languages currently supported for IaC are YAML and JSON for AWS CloudFormation, Typescript and Python for AWS CDK, and HCL for HashiCorp Terraform. In addition to providing code recommendations in the editor, CodeWhisperer also features a security scanner that alerts the developer to potentially insecure infrastructure code, and offers suggested fixes than can be applied with a single click.
In this post, we will walk you through some common scenarios and show you how to get the most out of CodeWhisperer in the IDE. CodeWhisperer is supported by several IDEs, such as Visual Studio Code and JetBrains. For the purposes of this post, we’ll focus on Visual Studio Code. There are a few things that you need to follow along with the examples, listed in the prerequisites section below.
Prerequisites
- An AWS Builder ID or an AWS Identity Center login controlled by your organization
- A supported IDE, like Visual Studio Code
- The AWS Toolkit IDE extension
- Authenticate and Connect
CloudFormation
Now that you have the toolkit configured, open a new source file with the yaml extension. Since YAML files can represent a wide variety of different configuration file types, it helps to add the AWSTemplateFormatVersion: '2010-09-09' header to the file to let CodeWhisperer know that you are editing a CloudFormation file. Just typing the first few characters of that header is likely to result in a recommendation from CodeWhisperer. Press TAB to accept recommendations and Escape to ignore them.

AWSTemplateFormatVersion header
If you have a good idea about the various resources you want to include in your template, include them in a top level Description field. This will help CodeWhisperer to understand the relationships between the resources you will create in the file. In the example below, we describe the stack we want as a “VPC with public and private subnets”. You can be more descriptive if you want, using a multi-line YAML string to add more specific details about the resources you want to create.

Creating a CloudFormation template with a description
After accepting that recommendation for the parameters, you can continue to create resources.

Creating CloudFormation resources
You can also trigger recommendations with inline comments and descriptive logical IDs if you want to create one resource at a time. The more code you have in the file, the more CodeWhisperer will understand from context what you are trying to achieve.
CDK
It’s also possible to create CDK code using CodeWhisperer. In the example below, we started with a CDK project using cdk init, wrote a few lines of code to create a VPC in a TypeScript file, and CodeWhisperer proposed some code suggestions using what we started to write. After accepting the suggestion, it is possible to customize the code to fit your needs. CodeWhisperer will learn from your coding style and make more precise suggestions as you add more code to the project.

Create a CDK stack
You can choose whether you want to get suggestions that include code with references with the professional version of CodeWhisperer. If you choose to get the references, you can find them in the Code Reference Log. These references let you know when the code recommendation was a near exact match for code in an open source repository, allowing you to inspect the license and decide if you want to use that code or not.

References
Terraform HCL
After a close collaboration between teams at Hashicorp and AWS, Terraform HashiCorp Configuration Language (HCL) is also supported by CodeWhisperer. CodeWhisperer recommendations are triggered by comments in the file. In this example, we repeat a prompt that is similar to what we used with CloudFormation and CDK.

Terraform code suggestion
Security Scanner
In addition to CodeWhisperer recommendations, the toolkit configuration also includes a built in security scanner. Considering that the resulting code can be edited and combined with other preexisting code, it’s good practice to scan the final result to see if there are any best-practice security recommendations that can be applied.
Expand the CodeWhisperer section of the AWS Toolkit to see the “Run Security Scan” button. Click it to initiate a scan, which might take up to a minute to run. In the example below, we defined an S3 bucket that can be read by anyone on the internet.

Security scanner
Once the security scan completes, the code with issues is underlined and each suggestion is added to the ‘Problems’ tab. Click on any of those to get more details.

Scan results
CodeWhisperer provides a clickable link to get more information about the vulnerability, and what you can do to fix it.

Scanner Link
Conclusion
The integration of generative AI tools like Amazon CodeWhisperer are transforming the landscape of cloud application development. By supporting Infrastructure as Code (IaC) languages such as CloudFormation, CDK, and Terraform HCL, CodeWhisperer is expanding its reach beyond traditional development roles. This advancement is pivotal in merging runtime and infrastructure code into a cohesive unit, significantly enhancing productivity and collaboration in the development process. The inclusion of IaC enables a broader range of professionals, especially Site Reliability Engineers (SREs), to actively engage in application development, automating and optimizing infrastructure management tasks more efficiently.
CodeWhisperer’s capability to perform security scans on the generated code aligns with the critical objectives of system reliability and security, essential for both developers and SREs. By providing insights into security best practices, CodeWhisperer enables robust and secure infrastructure management on the AWS cloud. This makes CodeWhisperer a valuable tool not just for developers, but as a comprehensive solution that bridges different technical disciplines, fostering a collaborative environment for innovation in cloud-based solutions.
Bio
Eric Beard is a Solutions Architect at AWS specializing in DevOps, CI/CD, and Infrastructure as Code, the author of the AWS Sysops Cookbook, and an editor for the AWS DevOps blog channel. When he’s not helping customers to design Well-Architected systems on AWS, he is usually playing tennis or watching tennis.
Amar Meriche is a Sr Technical Account Manager at AWS in Paris. He helps his customers improve their operational posture through advocacy and guidance, and is an active member of the DevOps and IaC community at AWS. He’s passionate about helping customers use the various IaC tools available at AWS following best practices.
AWS completes the annual Dubai Electronic Security Centre certification audit to operate as a Tier 1 cloud service provider in the Emirate of Dubai
Post Syndicated from Vishal Pabari original https://aws.amazon.com/blogs/security/aws-completes-the-annual-dubai-electronic-security-centre-certification-audit-to-operate-as-a-tier-1-cloud-service-provider-in-the-emirate-of-dubai/
We’re excited to announce that Amazon Web Services (AWS) has completed the annual Dubai Electronic Security Centre (DESC) certification audit to operate as a Tier 1 cloud service provider (CSP) for the AWS Middle East (UAE) Region.
This alignment with DESC requirements demonstrates our continuous commitment to adhere to the heightened expectations for CSPs. Government customers of AWS can run their applications in AWS Cloud-certified Regions with confidence.
The independent third-party auditor BSI evaluated AWS on behalf of DESC on January 23, 2024. The Certificate of Compliance that illustrates the compliance status of AWS is available through AWS Artifact. AWS Artifact is a self-service portal for on-demand access to AWS compliance reports. Sign in to AWS Artifact in the AWS Management Console, or learn more at Getting Started with AWS Artifact.
The certification includes 25 additional services in scope, for a total of 87 services. This is a 40% increase in the number of services in the Middle East (UAE) Region that are in scope of the DESC CSP certification. For up-to-date information, including when additional services are added, see the AWS Services in Scope by Compliance Program webpage and choose DESC CSP.
AWS strives to continuously bring services into the scope of its compliance programs to help you meet your architectural and regulatory needs. If you have questions or feedback about DESC compliance, reach out to your AWS account team.
To learn more about our compliance and security programs, see AWS Compliance Programs. As always, we value your feedback and questions; reach out to the AWS Compliance team through the Contact Us page.
If you have feedback about this post, submit comments in the Comments section below.
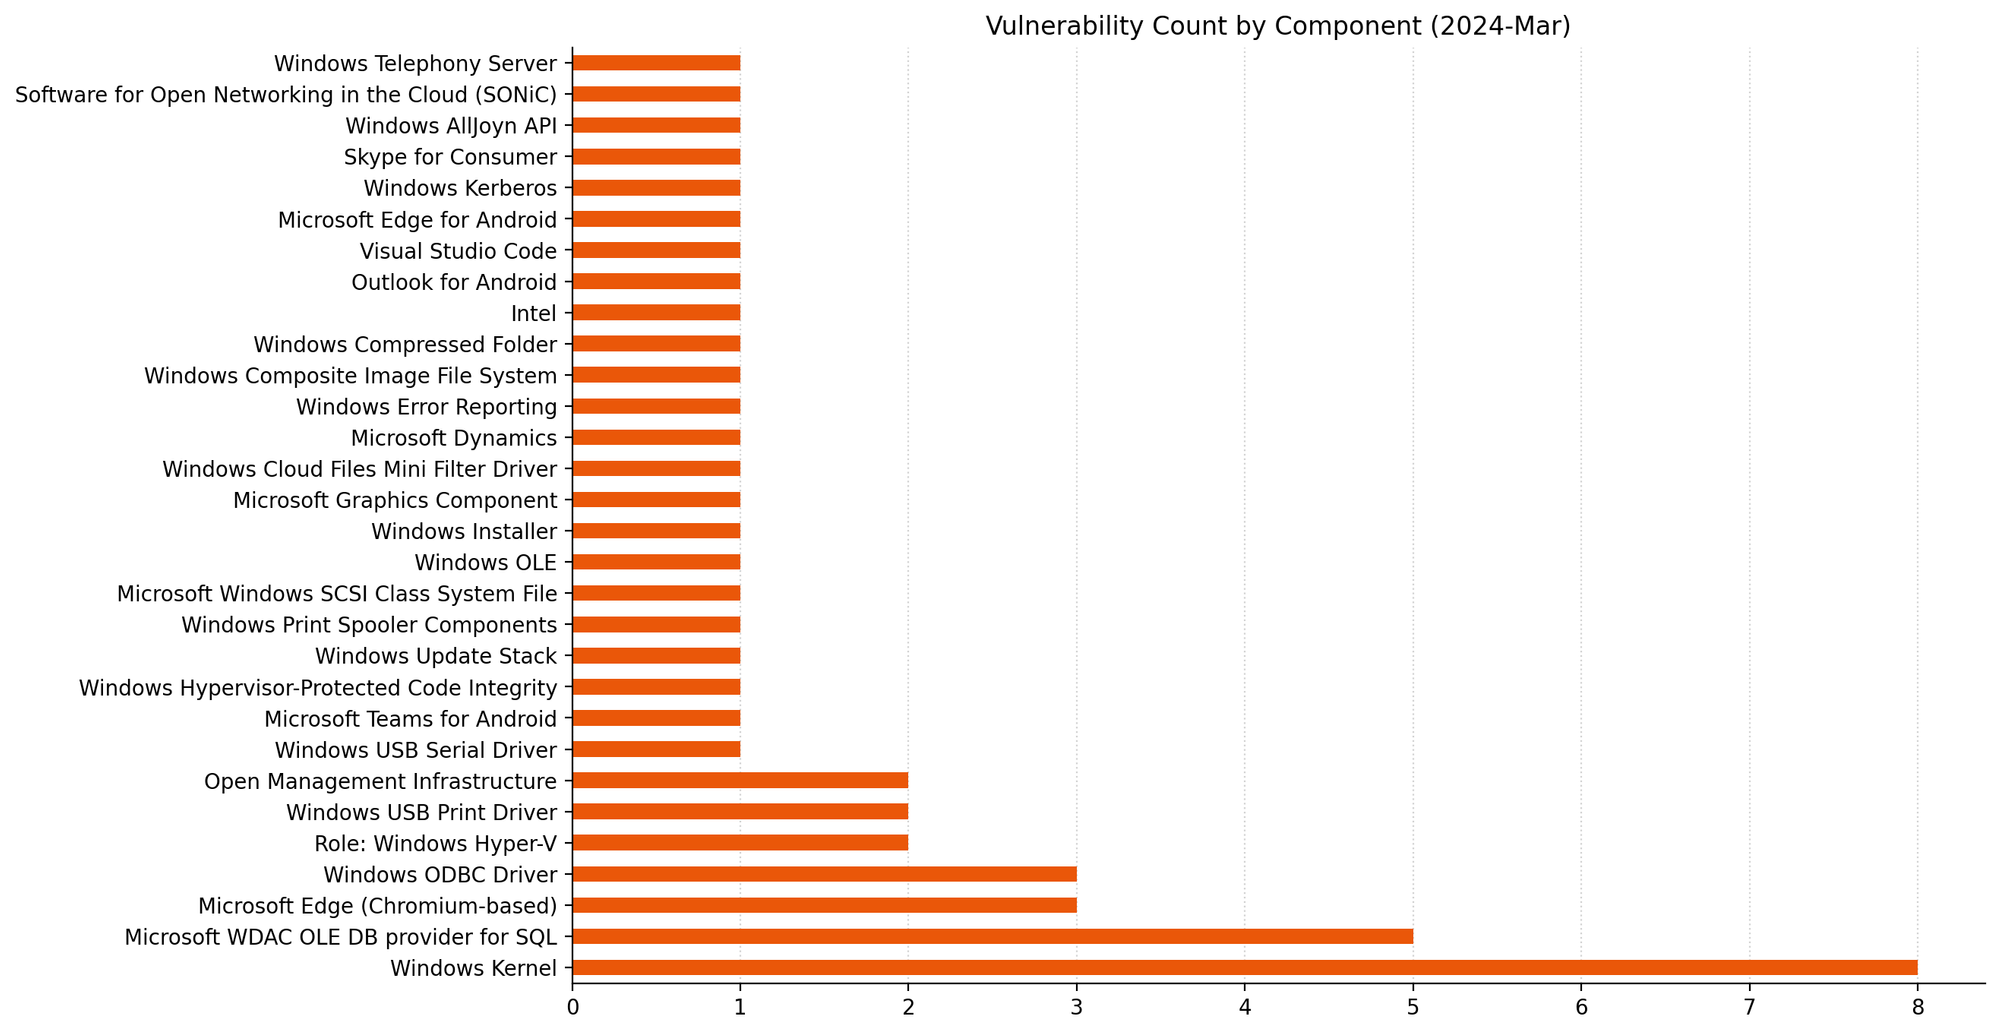
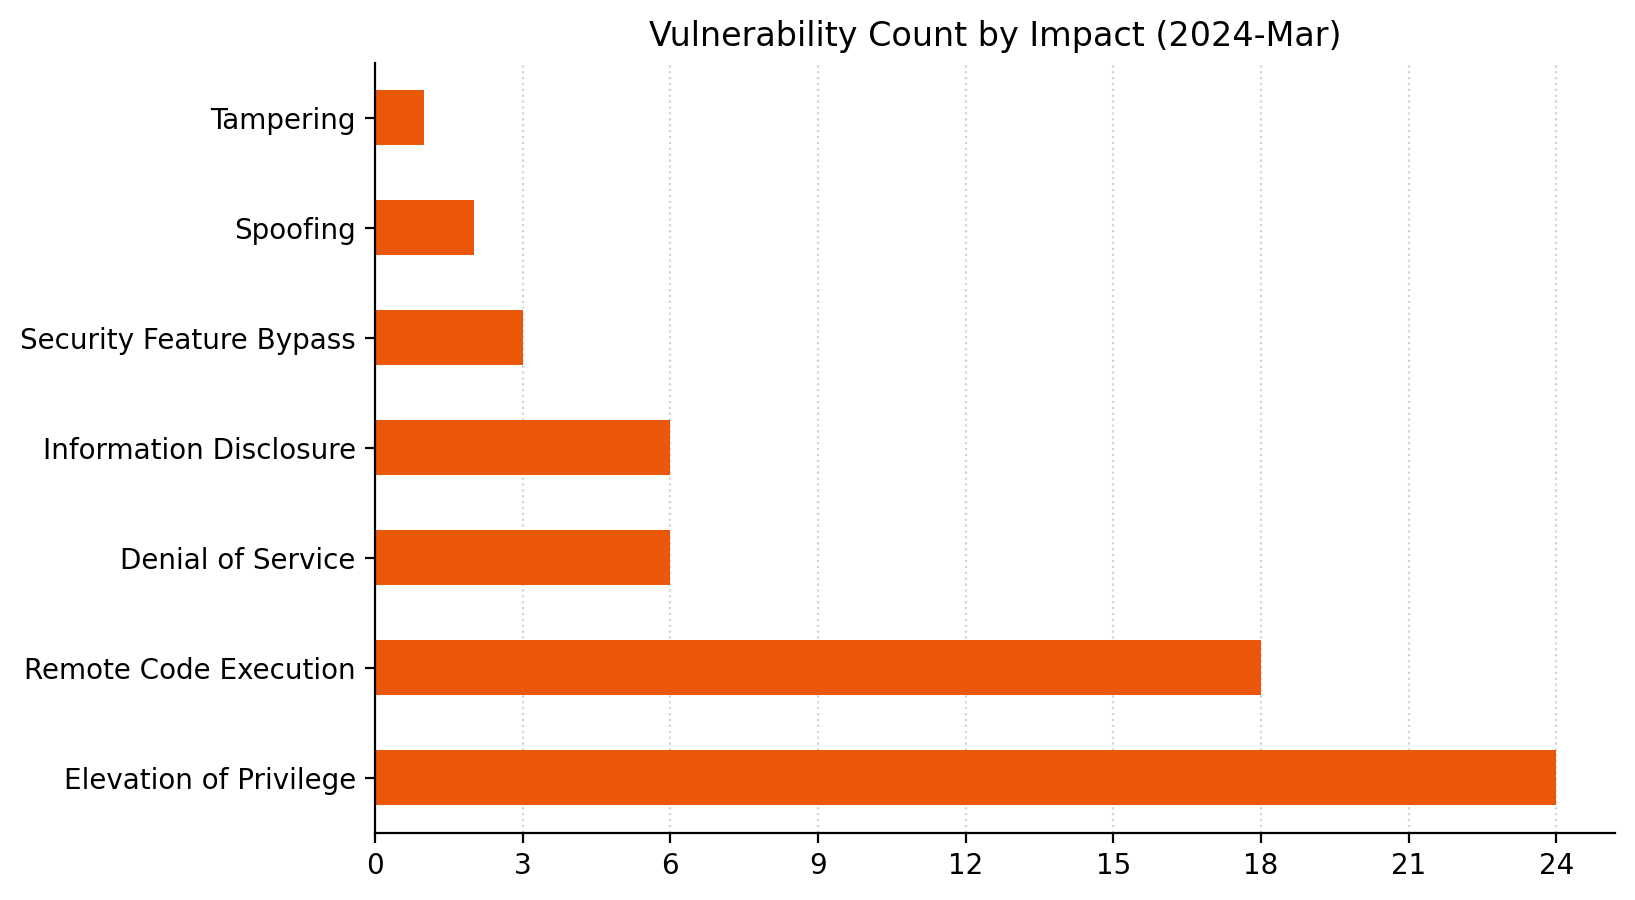
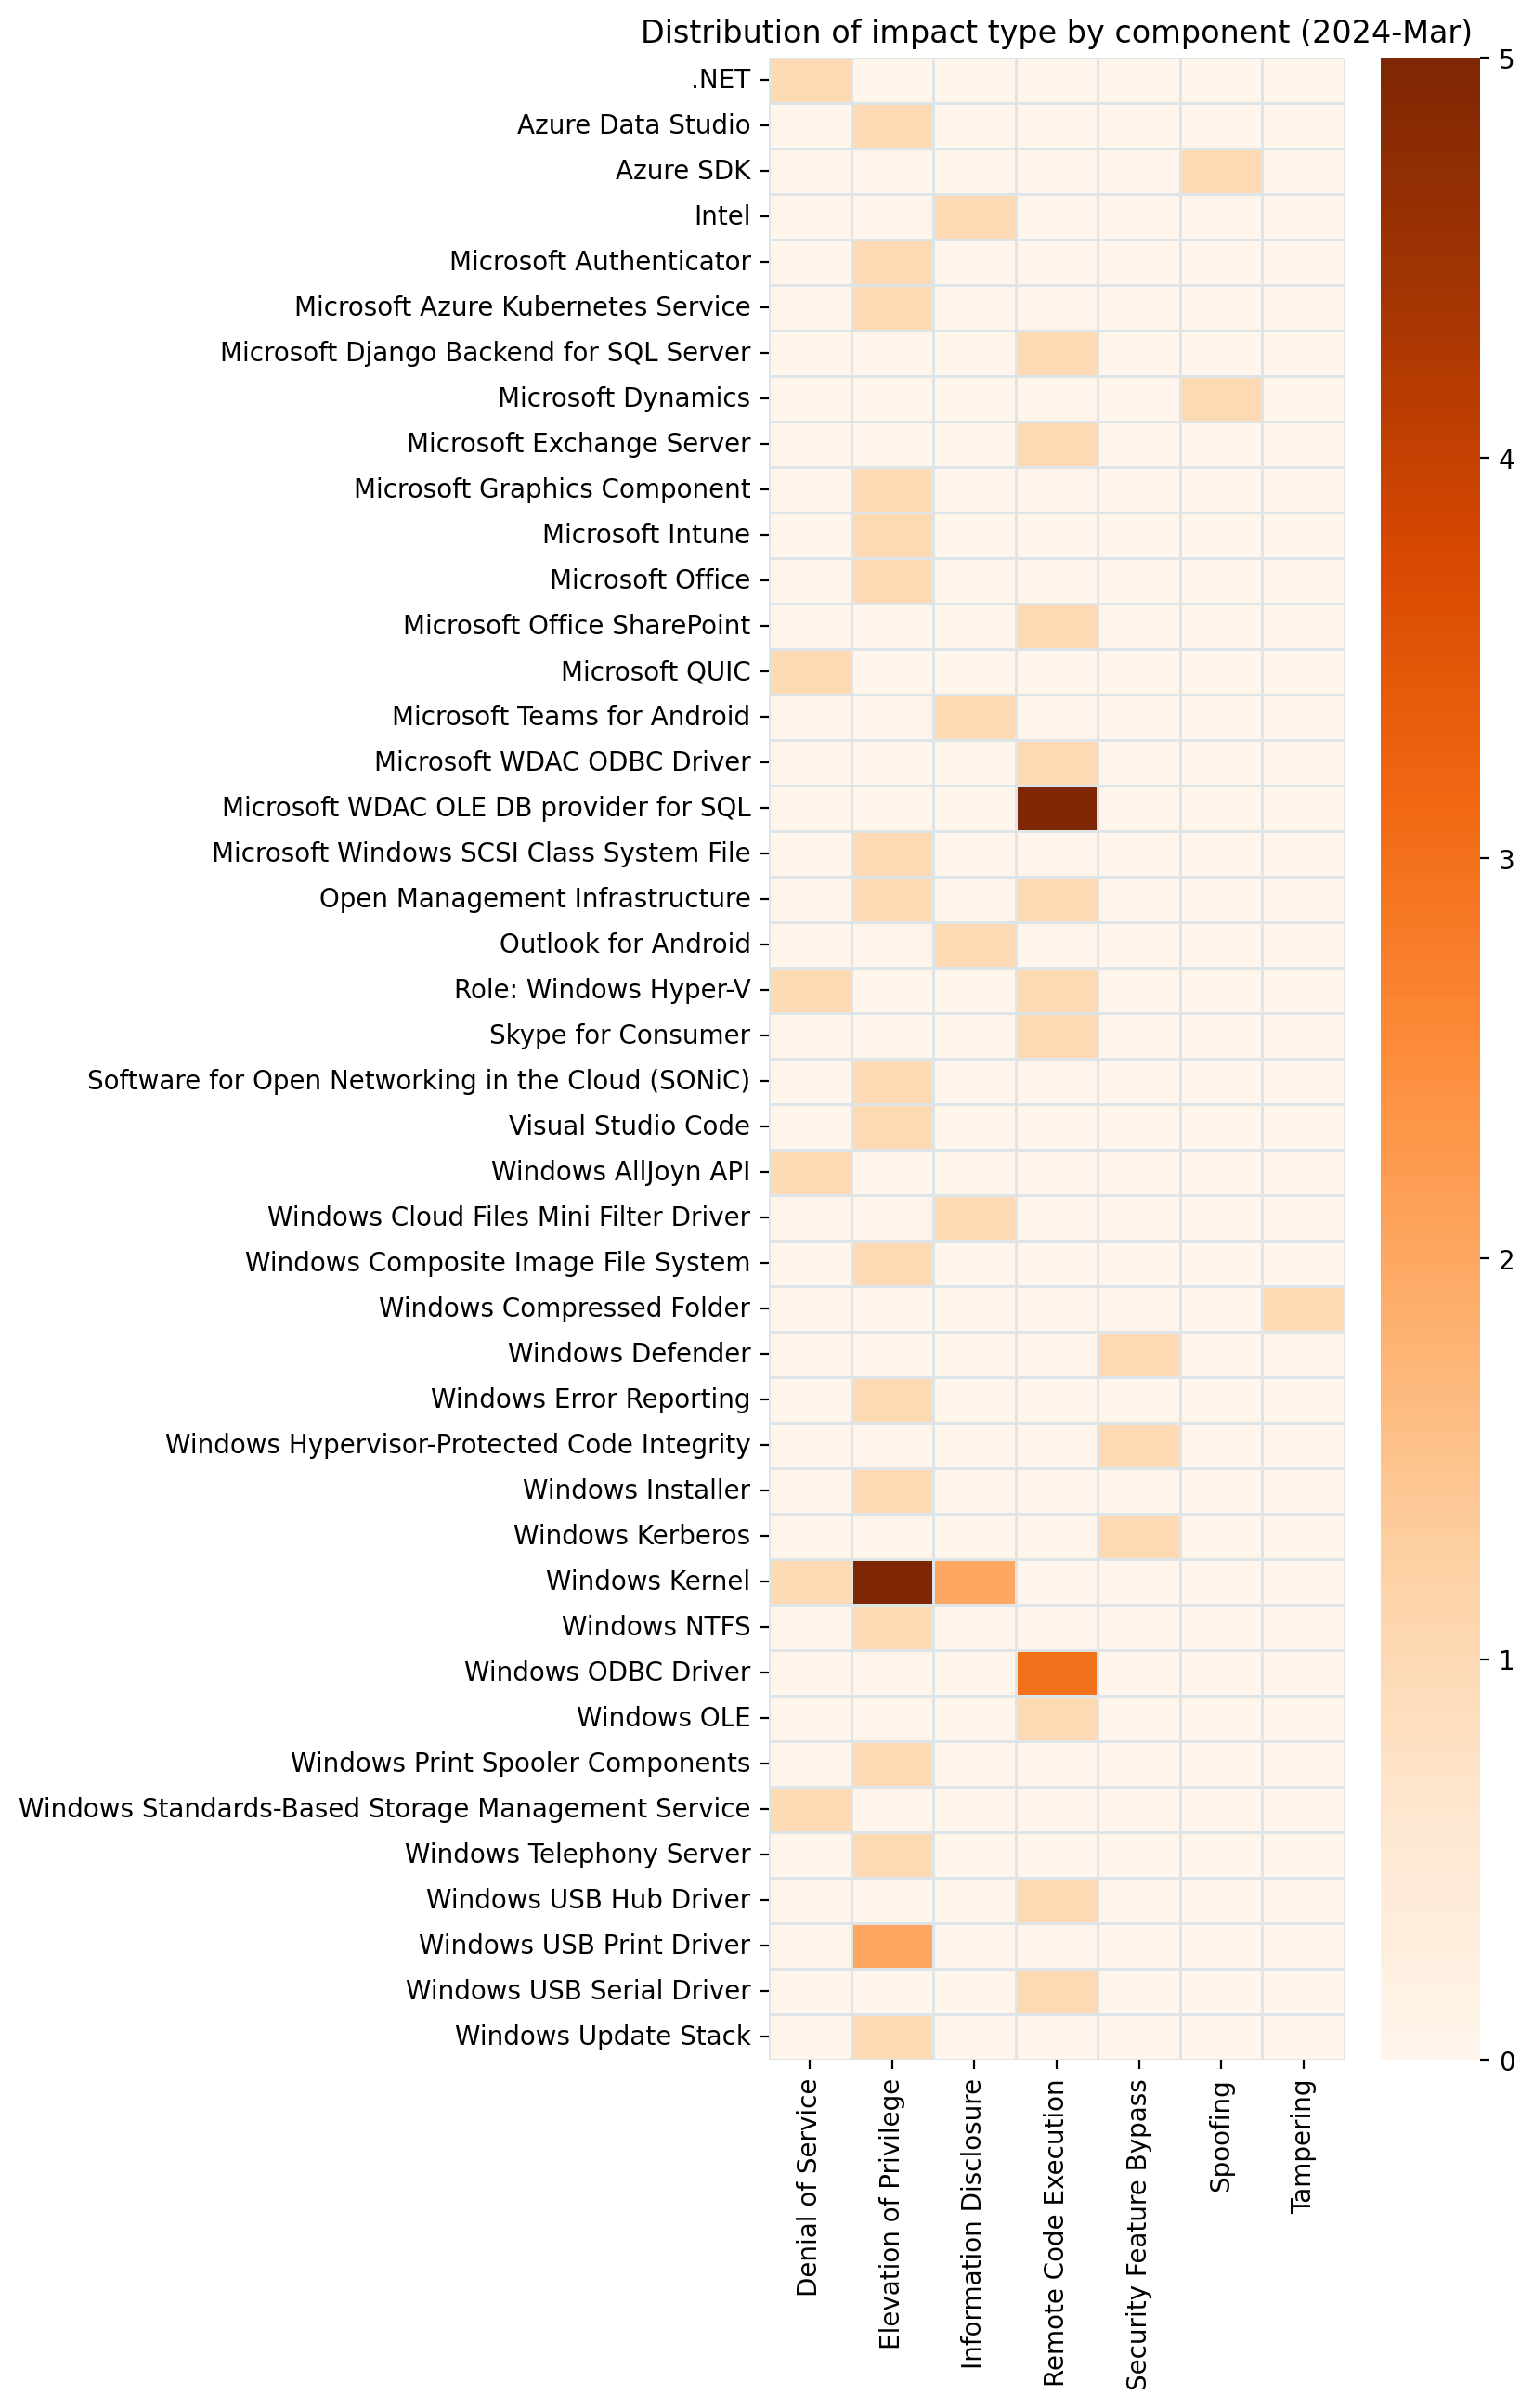
Patch Tuesday – March 2024
Post Syndicated from Adam Barnett original https://blog.rapid7.com/2024/03/12/patch-tuesday-march-2024/

Microsoft is addressing 60 vulnerabilities this March 2024 Patch Tuesday. Microsoft indicated that they aren’t aware of prior public disclosure or exploitation in the wild for any of the vulnerabilities patched today, which means no new additions to CISA KEV at time of writing. Microsoft is patching a single critical remote code execution (RCE) in Windows, which could allow virtual machine escape from a Hyper-V guest. Four browser vulnerabilities were published separately this month, and are not included in the total.
Windows Hyper-V: critical RCE VM escape
Attackers hoping to escape from a Hyper-V guest virtual machine (VM) and achieve RCE on the Hyper-V host will be interested in CVE-2024-21407. Microsoft describes attack complexity as high: an attacker must first gather information specific to the environment and carry out unspecified preparatory work. Exploitation is via specially crafted file operation requests on the VM to hardware resources on the VM. Every supported version of Windows receives a patch. The advisory describes that no privileges are required for exploitation of the Hyper-V host, although an attacker will presumably need an existing foothold on a guest VM.
Exchange: RCE
A single Exchange vulnerability receives a patch this month. Microsoft describes CVE-2024-26198 as a RCE vulnerability for Exchange, where an attacker places a specially-crafted DLL file into a network share or other file-sharing resource, and convinces the user to open it. Although the FAQ on the advisory asks: “What is the target context of the remote code execution?”, the answer boils down to ”[exploitation] results in loading a malicious DLL”. Since the context of the user opening the malicious file is not specified — an Exchange admin? a user running a mail client connecting to Exchange? something else altogether? — it remains unclear what an attacker might be able to achieve.
It remains vitally important to patch any on-premises instances of Exchange, a perennial attacker favourite. Exchange 2016 admins who were dismayed by the lack of patch for last month’s CVE-2024-21410 may feel somewhat reassured that Microsoft has issued a patch which claims to fully remediate this month’s CVE-2024-26198, but in the absence of any explicit advice to the contrary, a fully-patched Exchange 2016 remains unprotected against CVE-2024-21410 unless the guidance on that advisory is followed.
SharePoint: arbitrary code execution
SharePoint receives a patch for CVE-2024-21426, which Microsoft describes as RCE via the attacker convincing a user to open a malicious file. Although the context of code execution isn’t stated in the advisory, exploitation is local to the user, and could lead to a total loss of confidentiality, integrity, and availability, including downtime for the affected environment.
Azure Kubernetes Service Confidential Containers: confidentiality impact
Azure Kubernetes admins should take note of CVE-2024-21400, which allows an unauthenticated attacker to take over confidential guests and containers, with other outcomes including credential theft and resource impact beyond the scope managed by the Azure Kubernetes Service Confidential Containers (AKSCC). Microsoft describes AKSCC as providing a set of features and capabilities to further secure standard container workloads when working with sensitive data such as PII. The advisory describes additional steps for remediation beyond merely patching AKSCC, including upgrading to the latest version of the az confcom Azure CLI confidential computing extension and Kata Image.
Windows 11: compressed folder tampering
Defenders responsible for Windows 11 assets can protect assets against exploitation of CVE-2024-26185, which Microsoft describes as a compressed folder tampering vulnerability. The advisory is sparse on detail, so while we know that an attacker must convince the user to open a specially crafted file, it’s not clear what the outcome of successful exploitation might be. Since the only impact appears to be to integrity, it’s possible that an attacker could modify a compressed folder but not necessarily read from it. Microsoft expects that exploitation is more likely.
Windows Print Spooler: elevation to SYSTEM
Another site of “exploitation more likely” vulnerabilities this month: the Windows Print Spooler service. A local attacker who successfully exploits CVE-2024-21433 via winning a race condition could elevate themselves to SYSTEM privileges.
Exploitation in the wild: status updates
In the days following February 2024 Patch Tuesday, Microsoft announced several updates where the known exploited status of more than one vulnerability changed, as noted by Rapid7. It remains to be seen if those changes were exceptional or the start of a pattern.
Microsoft products lifecycle review
There are no significant changes to the lifecycle phase of Microsoft products this month.
Summary Charts
Summary Tables
Apps vulnerabilities
| CVE | Title | Exploited? | Publicly disclosed? | CVSSv3 base score |
|---|---|---|---|---|
| CVE-2024-21411 | Skype for Consumer Remote Code Execution Vulnerability | No | No | 8.8 |
| CVE-2024-26204 | Outlook for Android Information Disclosure Vulnerability | No | No | 7.5 |
| CVE-2024-21390 | Microsoft Authenticator Elevation of Privilege Vulnerability | No | No | 7.1 |
| CVE-2024-26201 | Microsoft Intune Linux Agent Elevation of Privilege Vulnerability | No | No | 6.6 |
Azure vulnerabilities
| CVE | Title | Exploited? | Publicly disclosed? | CVSSv3 base score |
|---|---|---|---|---|
| CVE-2024-21400 | Microsoft Azure Kubernetes Service Confidential Container Elevation of Privilege Vulnerability | No | No | 9 |
| CVE-2024-21418 | Software for Open Networking in the Cloud (SONiC) Elevation of Privilege Vulnerability | No | No | 7.8 |
| CVE-2024-21421 | Azure SDK Spoofing Vulnerability | No | No | 7.5 |
| CVE-2024-26203 | Azure Data Studio Elevation of Privilege Vulnerability | No | No | 7.3 |
Azure System Center vulnerabilities
| CVE | Title | Exploited? | Publicly disclosed? | CVSSv3 base score |
|---|---|---|---|---|
| CVE-2024-21334 | Open Management Infrastructure (OMI) Remote Code Execution Vulnerability | No | No | 9.8 |
| CVE-2024-21330 | Open Management Infrastructure (OMI) Elevation of Privilege Vulnerability | No | No | 7.8 |
Browser vulnerabilities
| CVE | Title | Exploited? | Publicly disclosed? | CVSSv3 base score |
|---|---|---|---|---|
| CVE-2024-26167 | Microsoft Edge for Android Spoofing Vulnerability | No | No | 4.3 |
| CVE-2024-2176 | Chromium: CVE-2024-2176 Use after free in FedCM | No | No | N/A |
| CVE-2024-2174 | Chromium: CVE-2024-2174 Inappropriate implementation in V8 | No | No | N/A |
| CVE-2024-2173 | Chromium: CVE-2024-2173 Out of bounds memory access in V8 | No | No | N/A |
Developer Tools vulnerabilities
| CVE | Title | Exploited? | Publicly disclosed? | CVSSv3 base score |
|---|---|---|---|---|
| CVE-2024-26165 | Visual Studio Code Elevation of Privilege Vulnerability | No | No | 8.8 |
| CVE-2024-21392 | .NET and Visual Studio Denial of Service Vulnerability | No | No | 7.5 |
Developer Tools Windows vulnerabilities
| CVE | Title | Exploited? | Publicly disclosed? | CVSSv3 base score |
|---|---|---|---|---|
| CVE-2024-26190 | Microsoft QUIC Denial of Service Vulnerability | No | No | 7.5 |
ESU Windows vulnerabilities
| CVE | Title | Exploited? | Publicly disclosed? | CVSSv3 base score |
|---|---|---|---|---|
| CVE-2024-21441 | Microsoft WDAC OLE DB provider for SQL Server Remote Code Execution Vulnerability | No | No | 8.8 |
| CVE-2024-21444 | Microsoft WDAC OLE DB provider for SQL Server Remote Code Execution Vulnerability | No | No | 8.8 |
| CVE-2024-21450 | Microsoft WDAC OLE DB provider for SQL Server Remote Code Execution Vulnerability | No | No | 8.8 |
| CVE-2024-26161 | Microsoft WDAC OLE DB provider for SQL Server Remote Code Execution Vulnerability | No | No | 8.8 |
| CVE-2024-26166 | Microsoft WDAC OLE DB provider for SQL Server Remote Code Execution Vulnerability | No | No | 8.8 |
| CVE-2024-21451 | Microsoft ODBC Driver Remote Code Execution Vulnerability | No | No | 8.8 |
| CVE-2024-26159 | Microsoft ODBC Driver Remote Code Execution Vulnerability | No | No | 8.8 |
| CVE-2024-21440 | Microsoft ODBC Driver Remote Code Execution Vulnerability | No | No | 8.8 |
| CVE-2024-26162 | Microsoft ODBC Driver Remote Code Execution Vulnerability | No | No | 8.8 |
| CVE-2024-21407 | Windows Hyper-V Remote Code Execution Vulnerability | No | No | 8.1 |
| CVE-2024-26173 | Windows Kernel Elevation of Privilege Vulnerability | No | No | 7.8 |
| CVE-2024-26176 | Windows Kernel Elevation of Privilege Vulnerability | No | No | 7.8 |
| CVE-2024-26178 | Windows Kernel Elevation of Privilege Vulnerability | No | No | 7.8 |
| CVE-2024-21436 | Windows Installer Elevation of Privilege Vulnerability | No | No | 7.8 |
| CVE-2024-21437 | Windows Graphics Component Elevation of Privilege Vulnerability | No | No | 7.8 |
| CVE-2024-26169 | Windows Error Reporting Service Elevation of Privilege Vulnerability | No | No | 7.8 |
| CVE-2024-21446 | NTFS Elevation of Privilege Vulnerability | No | No | 7.8 |
| CVE-2024-21427 | Windows Kerberos Security Feature Bypass Vulnerability | No | No | 7.5 |
| CVE-2024-21432 | Windows Update Stack Elevation of Privilege Vulnerability | No | No | 7 |
| CVE-2024-21439 | Windows Telephony Server Elevation of Privilege Vulnerability | No | No | 7 |
| CVE-2024-21433 | Windows Print Spooler Elevation of Privilege Vulnerability | No | No | 7 |
| CVE-2024-21429 | Windows USB Hub Driver Remote Code Execution Vulnerability | No | No | 6.8 |
| CVE-2024-26197 | Windows Standards-Based Storage Management Service Denial of Service Vulnerability | No | No | 6.5 |
| CVE-2024-21430 | Windows USB Attached SCSI (UAS) Protocol Remote Code Execution Vulnerability | No | No | 5.7 |
| CVE-2024-26174 | Windows Kernel Information Disclosure Vulnerability | No | No | 5.5 |
| CVE-2024-26177 | Windows Kernel Information Disclosure Vulnerability | No | No | 5.5 |
| CVE-2024-26181 | Windows Kernel Denial of Service Vulnerability | No | No | 5.5 |
| CVE-2023-28746 | Intel: CVE-2023-28746 Register File Data Sampling (RFDS) | No | No | N/A |
Exchange Server vulnerabilities
| CVE | Title | Exploited? | Publicly disclosed? | CVSSv3 base score |
|---|---|---|---|---|
| CVE-2024-26198 | Microsoft Exchange Server Remote Code Execution Vulnerability | No | No | 8.8 |
Microsoft Dynamics vulnerabilities
| CVE | Title | Exploited? | Publicly disclosed? | CVSSv3 base score |
|---|---|---|---|---|
| CVE-2024-21419 | Microsoft Dynamics 365 (on-premises) Cross-site Scripting Vulnerability | No | No | 7.6 |
Microsoft Office vulnerabilities
| CVE | Title | Exploited? | Publicly disclosed? | CVSSv3 base score |
|---|---|---|---|---|
| CVE-2024-21426 | Microsoft SharePoint Server Remote Code Execution Vulnerability | No | No | 7.8 |
| CVE-2024-26199 | Microsoft Office Elevation of Privilege Vulnerability | No | No | 7.8 |
| CVE-2024-21448 | Microsoft Teams for Android Information Disclosure Vulnerability | No | No | 5 |
SQL Server vulnerabilities
| CVE | Title | Exploited? | Publicly disclosed? | CVSSv3 base score |
|---|---|---|---|---|
| CVE-2024-26164 | Microsoft Django Backend for SQL Server Remote Code Execution Vulnerability | No | No | 8.8 |
System Center vulnerabilities
| CVE | Title | Exploited? | Publicly disclosed? | CVSSv3 base score |
|---|---|---|---|---|
| CVE-2024-20671 | Microsoft Defender Security Feature Bypass Vulnerability | No | No | 5.5 |
Windows vulnerabilities
| CVE | Title | Exploited? | Publicly disclosed? | CVSSv3 base score |
|---|---|---|---|---|
| CVE-2024-21435 | Windows OLE Remote Code Execution Vulnerability | No | No | 8.8 |
| CVE-2024-21442 | Windows USB Print Driver Elevation of Privilege Vulnerability | No | No | 7.8 |
| CVE-2024-26182 | Windows Kernel Elevation of Privilege Vulnerability | No | No | 7.8 |
| CVE-2024-26170 | Windows Composite Image File System (CimFS) Elevation of Privilege Vulnerability | No | No | 7.8 |
| CVE-2024-21434 | Microsoft Windows SCSI Class System File Elevation of Privilege Vulnerability | No | No | 7.8 |
| CVE-2024-21431 | Hypervisor-Protected Code Integrity (HVCI) Security Feature Bypass Vulnerability | No | No | 7.8 |
| CVE-2024-21438 | Microsoft AllJoyn API Denial of Service Vulnerability | No | No | 7.5 |
| CVE-2024-21443 | Windows Kernel Elevation of Privilege Vulnerability | No | No | 7.3 |
| CVE-2024-21445 | Windows USB Print Driver Elevation of Privilege Vulnerability | No | No | 7 |
| CVE-2024-26185 | Windows Compressed Folder Tampering Vulnerability | No | No | 6.5 |
| CVE-2024-21408 | Windows Hyper-V Denial of Service Vulnerability | No | No | 5.5 |
| CVE-2024-26160 | Windows Cloud Files Mini Filter Driver Information Disclosure Vulnerability | No | No | 5.5 |
Технология на скалъпването
Post Syndicated from Екип на Биволъ original https://bivol.bg/valya_ahchieva.html
вторник 12 март 2024

След убийството на Мартин Божанов – Нотариуса, отново се заговори за кръгове на влияние в съдебната ни система, за мрежа за рекет и за паралелно правосъдие. Болезнено стои въпросът –…
Herb Sutter on increasing safety in C++
Post Syndicated from daroc original https://lwn.net/Articles/965147/
Herb Sutter, chair of the ISO C++ standards committee,
writes about the current problems with writing secure C++,
and his personal opinion on next steps to address this while maintaining
backward compatibility.
If there were 90-98% fewer C++ type/bounds/initialization/lifetime
vulnerabilities we wouldn’t be having this discussion. All languages have CVEs,
C++ just has more (and C still more); so far in 2024,
Rust has 6 CVEs, and
C and C++ combined have 61 CVEs. So zero isn’t the goal; something like a 90%
reduction is necessary, and a 98% reduction is sufficient, to achieve security
parity with the levels of language safety provided by MSLs [memory-safe languages]… and has the strong
benefit that I believe it can be achieved with perfect backward link
compatibility (i.e., without changing C++’s object model, and its lifetime
model which does not depend on universal tracing garbage collection and is not
limited to tree-based data structures) which is essential to our being able to
adopt the improvements in existing C++ projects as easily as we can adopt other
new editions of C++. — After that, we can pursue additional improvements to
other buckets, such as thread safety and overflow safety.
Testing your most REQUESTED Lightbulbs from IKEA, Costco, Walmart, and Amazon
Post Syndicated from The Hook Up original https://www.youtube.com/watch?v=QEvIUA7Ffp4
Message delivery status tracking with Amazon Pinpoint
Post Syndicated from Brijesh Pati original https://aws.amazon.com/blogs/messaging-and-targeting/message-delivery-status-tracking-with-amazon-pinpoint/
In the vast landscape of digital communication, reaching your audience effectively is key to building successful customer relationships. Amazon Pinpoint – Amazon Web Services’ (AWS) flexible, user-focused messaging and targeting solution goes beyond mere messaging; it allows businesses to engage customers through email, SMS, push notifications, and more.
What sets Amazon Pinpoint apart is its scalability and deliverability. Amazon Pinpoint supports a multitude of business use cases, from promotional campaigns and transactional messages to customer engagement journeys. It provides insights and analytics that help tailor and measure the effectiveness of communication strategies.
For businesses, the power of this platform extends into areas such as marketing automation, customer retention campaigns, and transactional messaging for updates like order confirmations and shipping alerts. The versatility of Amazon Pinpoint can be a significant asset in crafting personalized user experiences at scale.
Use Case & Solution overview – Tracking SMS & Email Delivery Status
In a business setting, understanding whether a time-sensitive email or SMS was received can greatly impact customer experience as well as operational efficiency. For instance, consider an e-commerce platform sending out shipping notifications. By quickly verifying that the message was delivered, businesses can preemptively address any potential issues, ensuring customer satisfaction.
Amazon Pinpoint tracks email and SMS delivery and engagement events, which can be streamed using Amazon Kinesis Firehose for storage or further processing. However, third party applications don’t have a direct API to query and obtain the latest status of a message.
To address the above challenge, this blog presents a solution that leverages AWS services for data streaming, storage, and retrieval of Amazon Pinpoint events using a simple API call. At the core of the solution is Amazon Pinpoint event stream capability, which utilizes Amazon Kinesis services for data streaming.
The architecture for message delivery status tracking with Amazon Pinpoint is comprised of several AWS services that work in concert. To streamline the deployment of these components, they have been encapsulated into an AWS CloudFormation template. This template allows for automated provisioning and configuration of the necessary AWS resources, ensuring a repeatable and error-free deployment.
![]() The key components of the solution are as follows:
The key components of the solution are as follows:
- Event Generation: An event is generated within Amazon Pinpoint when a user interacts with an application, or when a message is sent from a campaign, journey, or as a transactional communication. The event name and metadata depends on the channel SMS or Email.
- Amazon Pinpoint Event Data Streaming: The generated event data is streamed to Amazon Kinesis Data Firehose. Kinesis Data Firehose is configured to collect the event information in near real-time, enabling the subsequent processing and analysis of the data.
- Pinpoint Event Data Processing: Amazon Kinesis Data Firehose is configured to invoke a specified AWS Lambda function to transform the incoming source data. This transformation step is set up during the creation of the Kinesis Data Firehose delivery stream, ensuring that the data is in the correct format before it is stored, enhancing its utility for immediate and downstream analysis. The Lambda function acts as a transformation mechanism for event data ingested through Kinesis Data Firehose. The function decodes the base64-encoded event data, deserializes the JSON payload, and processes the data depending on the event type (email or SMS)- it parses the raw data, extracting relevant attributes before ingesting it into Amazon DynamoDB. The function handles different event types, specifically email and SMS events, discerning their unique attributes and ensuring they are formatted correctly for DynamoDB’s schema.
- Data Ingestion into Dynamo DB: Once processed, the data is stored in Amazon DynamoDB. DynamoDB provides a fast and flexible NoSQL database service, which facilitates the efficient storage and retrieval of event data for analysis.
- Data Storage: Amazon DynamoDB stores the event data after it’s been processed by AWS Lambda. Amazon DynamoDB is a highly scalable NoSQL database that enables fast queries, which is essential for retrieving the status of messages quickly and efficiently, thereby facilitating timely decision-making based on customer interactions.
- Customer application/interface: Users or integrated systems engage with the messaging status through either a frontend customer application or directly via an API. This interface or API acts as the conduit through which message delivery statuses are queried, monitored, and managed, providing a versatile gateway for both user interaction and programmatic access.
- API Management: The customer application communicates with the backend systems through Amazon API Gateway. This service acts as a fully managed gateway, handling all the API calls, data transformation, and transfer between the frontend application and backend services.
- Event Status Retrieval API: When the API Gateway receives a delivery status request, it invokes another AWS Lambda function that is responsible for querying the DynamoDB table. It retrieves the latest status of the message delivery, which is then presented to the user via the API.
DynamoDB Table Design for Message Tracking:
The tables below outline the DynamoDB schema designed for the efficient storage and retrieval of message statuses, detailing distinct event statuses and attributes for each message type such as email and SMS:
| Attribute | Data type | Description |
|---|---|---|
| message_id | String | The unique message ID generated by Amazon Pinpoint. |
| event_type | String | The value would be ’email’. |
| aws_account_id | String | The AWS account ID used to send the email. |
| from_address | String | The sending identity used to send the email. |
| destination | String | The recipient’s email address. |
| client | String | The client ID if applicable |
| campaign_id | String | The campaign ID if part of a campaign |
| journey_id | String | The journey ID if part of a journey |
| send | Timestamp | The timestamp when Amazon Pinpoint accepted the message and attempted to deliver it to the recipient |
| delivered | Timestamp | The timestamp when the email was delivered, or ‘NA’ if not delivered. |
| rejected | Timestamp | The timestamp when the email was rejected (Amazon Pinpoint determined that the message contained malware and didn’t attempt to send it.) |
| hardbounce | Timestamp | The timestamp when a hard bounce occurred (A permanent issue prevented Amazon Pinpoint from delivering the message. Amazon Pinpoint won’t attempt to deliver the message again) |
| softbounce | Timestamp | The timestamp when a soft bounce occurred (A temporary issue prevented Amazon Pinpoint from delivering the message. Amazon Pinpoint will attempt to deliver the message again for a certain amount of time. If the message still can’t be delivered, no more retries will be attempted. The final state of the email will then be SOFTBOUNCE.) |
| complaint | Timestamp | The timestamp when a complaint was received (The recipient received the message, and then reported the message to their email provider as spam (for example, by using the “Report Spam” feature of their email client). |
| open | Timestamp | The timestamp when the email was opened (The recipient received the message and opened it.) |
| click | Timestamp | The timestamp when a link in the email was clicked. (The recipient received the message and clicked a link in it) |
| unsubscribe | Timestamp | The timestamp when a link in the email was unsubscribed (The recipient received the message and clicked an unsubscribe link in it.) |
| rendering_failure | Timestamp | The timestamp when a link in the email was clicked (The email was not sent due to a rendering failure. This can occur when template data is missing or when there is a mismatch between template parameters and data.) |
| Attribute | Data type | Description |
|---|---|---|
| message_id | String | The unique message ID generated by Amazon Pinpoint. |
| event_type | String | The value would be ‘sms’. |
| aws_account_id | String | The AWS account ID used to send the email. |
| origination_phone_number | String | The phone number from which the SMS was sent. |
| destination_phone_number | String | The phone number to which the SMS was sent. |
| record_status | String | Additional information about the status of the message. Possible values include: – SUCCESSFUL/DELIVERED – Successfully delivered. – PENDING – Not yet delivered. – INVALID – Invalid destination phone number. – UNREACHABLE – Recipient’s device unreachable. – UNKNOWN – Error preventing delivery. – BLOCKED – Device blocking SMS. – CARRIER_UNREACHABLE – Carrier issue preventing delivery. – SPAM – Message identified as spam. – INVALID_MESSAGE – Invalid SMS message body. – CARRIER_BLOCKED – Carrier blocked message. – TTL_EXPIRED – Message not delivered in time. – MAX_PRICE_EXCEEDED – Exceeded SMS spending quota. – OPTED_OUT – Recipient opted out. – NO_QUOTA_LEFT_ON_ACCOUNT – Insufficient spending quota. – NO_ORIGINATION_IDENTITY_AVAILABLE_TO_SEND – No suitable origination identity. – DESTINATION_COUNTRY_NOT_SUPPORTED – Destination country blocked. – ACCOUNT_IN_SANDBOX – Account in sandbox mode. – RATE_EXCEEDED – Message sending rate exceeded. – INVALID_ORIGINATION_IDENTITY – Invalid origination identity. – ORIGINATION_IDENTITY_DOES_NOT_EXIST – Non-existent origination identity. – INVALID_DLT_PARAMETERS – Invalid DLT parameters. – INVALID_PARAMETERS – Invalid parameters. – ACCESS_DENIED – Account blocked from sending messages. – INVALID_KEYWORD – Invalid keyword. – INVALID_SENDER_ID – Invalid Sender ID. – INVALID_POOL_ID – Invalid Pool ID. – SENDER_ID_NOT_SUPPORTED_FOR_DESTINATION – Sender ID not supported. – INVALID_PHONE_NUMBER – Invalid origination phone number. |
| iso_country_code | String | The ISO country code associated with the destination phone number. |
| message_type | String | The type of SMS message sent. |
| campaign_id | String | The campaign ID if part of a campaign, otherwise N/A. |
| journey_id | String | The journey ID if part of a journey, otherwise N/A. |
| success | Timestamp | The timestamp when the SMS was successfully accepted by the carrier/delivered to the recipient, or ‘NA’ if not applicable. |
| buffered | Timestamp | The timestamp when the SMS is still in the process of being delivered to the recipient, or ‘NA’ if not applicable. |
| failure | Timestamp | The timestamp when the SMS delivery failed, or ‘NA’ if not applicable. |
| complaint | Timestamp | The timestamp when a complaint was received (The recipient received the message, and then reported the message to their email provider as spam (for example, by using the “Report Spam” feature of their email client). |
| optout | Timestamp | The timestamp when the customer received the message and replied by sending the opt-out keyword (usually “STOP”), or ‘NA’ if not applicable. |
| price_in_millicents_usd | Number | The amount that was charged to send the message. |
Prerequisites
- AWS Account Access (setup) with admin-level permission.
- AWS CLI version 2 with named profile setup. If a locally configured IDE is not convenient, you can use the AWS CLI from the AWS CloudShell in your browser.
- A Pinpoint project that has never been configured with an event stream (PinpointEventStream).“
- The Pinpoint ID from the project you want to monitor. This ID can be found in the AWS Pinpoint console on the project’s main page (it will look something like “79788ecad55555513b71752a4e3ea1111”). Copy this ID to a text file, as you will need it shortly.
- Note, you must use the ID from a Pinpoint project that has never been configured with the PinpointEventStream option.
Solution Deployment & Testing
Deploying this solution is a straightforward process, thanks to the AWS CloudFormation template we’ve created. This template automates the creation and configuration of the necessary AWS resources into an AWS stack. The CloudFormation template ensures that the components such as Kinesis Data Firehose, AWS Lambda, Amazon DynamoDB, and Amazon API Gateway are set up consistently and correctly.
Deployment Steps:
- Download the CloudFormation Template from this GitHub sample repository. The CloudFormation template is authored in JSON and named PinpointAPIBlog.yaml.
- Access the CloudFormation Console: Sign into the AWS Management Console and open the AWS CloudFormation console.
- Create a New Stack:
- Choose Create Stack and select With new resources (standard) to start the stack creation process.
- Under Prerequisite – Prepare template, select Template is ready.
- Under ‘Specify template’, choose Upload a template file, and then upload the CloudFormation template file you downloaded in Step 1.
- Configure the Stack:
- Provide a stack name, such as “pinpoint-yourprojectname-monitoring” and paste the Pinpoint project (application) ID. Press Next.
- Review the stack settings, and make any necessary changes based on your specific requirements. Next.
- Initiate the Stack Creation: Once you’ve configured all options, acknowledge that AWS CloudFormation might create IAM resources with custom names, and then choose Create stack.
- AWS CloudFormation will now provision and configure the resources as defined in the template This will take about 20 minutes to fully deploy. You can view the status in the AWS CloudFormation console.
Testing the Solution:
After deployment is complete you can test (and use) the solution.
- Send Test Messages: Utilize the Amazon Pinpoint console to send test email and SMS messages. Documentation for this can be found at:
- Verify Lambda Execution:
- Navigate to the AWS CloudWatch console.
- Locate and review the logs for the Lambda functions specified in the solution (`aws/lambda/{functionName}`) to confirm that the Kinesis Data Firehose records are being processed successfully. In the log events you should see messages including INIT_START, Raw Kinesis Data Firehouse Record, etc.
- Check Amazon DynamoDB Data:
- Navigate to Amazon DynamoDB in the AWS Console.
- Select the table created by the CloudFormation template and choose ‘Explore Table Items‘.
- Confirm the presence of the event data by checking if the message IDs appear in the table.
- The table should have one or more message_id entries from the test message(s) you sent above.
- Click on a message_id to review the data, and copy the message_id to a text editor on your computer. It will look like “0201123456gs3nroo-clv5s8pf-8cq2-he0a-ji96-59nr4tgva0g0-343434”
- API Gateway Testing:
- In the API Gateway console, find the MessageIdAPI.
- Navigate to Stages and copy the Invoke URL provided.

-
- Open the text editor on your computer and paste the APIGateway invoke URL.
- Create a curl command with you API Gateway + ?message_id=message_id. It should look like this: “https://txxxxxx0.execute-api.us-west-2.amazonaws.com/call?message_id=020100000xx3xxoo-clvxxxxf-8cq2-he0a-ji96-59nr4tgva0g0-000000”
- Copy the full curl command in your browser and enter.
- The results should look like this (MacOS, Chrome):

By following these deployment and testing steps, you’ll have a functioning solution for tracking Pinpoint message delivery status using Amazon Pinpoint, Kinesis Fire Hose, DynamoDB and CloudWatch.
Clean Up
To help prevent unwanted charges to your AWS account, you can delete the AWS resources that you used for this walkthrough.
To delete the stack follow these following instructions:
Open the AWS CloudFormation console.
- In the AWS CloudFormation console dashboard, select the stack you created (pinpoint-yourprojectname-monitoring).
- On the Actions menu, choose Delete Stack.
- When you are prompted to confirm, choose Yes, Delete.
- Wait for DELETE_COMPLETE to appear in the Status column for the stack.
Next steps
The solution on this blog provides you an API endpoint to query messages’ status. The next step is to store and analyze the raw data based on your business’s requirements. The Amazon Kinesis Firehose used in this blog can stream the Pinpoint events to an AWS database or object storage like Amazon S3. Once the data is stored, you can catalogue them using AWS Glue, query them via SQL using Amazon Athena and create custom dashboards using Amazon QuickSight, which is a cloud-native, serverless, business intelligence (BI) with native machine learning (ML) integrations.
Conclusion
The integration of AWS services such as Kinesis, Lambda, DynamoDB, and API Gateway with Amazon Pinpoint transforms your ability to connect with customers through precise event data retrieval and analysis. This solution provides a stream of real-time data, versatile storage options, and a secure method for accessing detailed information, all of which are critical for optimizing your communication strategies.
By leveraging these insights, you can fine-tune your email and SMS campaigns for maximum impact, ensuring every message counts in the broader narrative of customer engagement and satisfaction. Harness the power of AWS and Amazon Pinpoint to not just reach out but truly connect with your audience, elevating your customer relationships to new heights.
Considerations/Troubleshooting
When implementing a solution involving AWS Lambda, Kinesis Data Streams, Kinesis Data Firehose, and DynamoDB, several key considerations should be considered:
- Scalability and Performance: Assess the scalability needs of your system. Lambda functions scale automatically, but it’s important to configure concurrency settings and memory allocation based on expected load. Similarly, for Kinesis Streams and Firehose, consider the volume of data and the throughput rate. For DynamoDB, ensure that the table’s read and write capacity settings align with your data processing requirements.
- Error Handling and Retries: Implement robust error handling within the Lambda functions to manage processing failures. Kinesis Data Streams and Firehose have different retry behaviors and mechanisms. Understand and configure these settings to handle failed data processing attempts effectively. In DynamoDB, consider the use of conditional writes to handle potential data inconsistencies.
- Security and IAM Permissions: Secure your AWS resources by adhering to the principle of least privilege. Define IAM roles and policies that grant the Lambda function only the necessary permissions to interact with Kinesis and DynamoDB. Ensure that data in transit and at rest is encrypted as required, using AWS KMS or other encryption mechanisms.
- Monitoring and Logging: Utilize AWS CloudWatch for monitoring and logging the performance and execution of Lambda functions, as well as Kinesis and DynamoDB operations. Set up alerts for any anomalies or thresholds that indicate issues in data processing or performance bottlenecks.
About the Authors

Brijesh Pati
Brijesh Pati is an Enterprise Solutions Architect at AWS. His primary focus is helping enterprise customers adopt cloud technologies for their workloads. He has a background in application development and enterprise architecture and has worked with customers from various industries such as sports, finance, energy and professional services. His interests include serverless architectures and AI/ML.

Pavlos Ioannou Katidis
Pavlos Ioannou Katidis is an Amazon Pinpoint and Amazon Simple Email Service Senior Specialist Solutions Architect at AWS. He enjoys diving deep into customers’ technical issues and help in designing communication solutions. In his spare time, he enjoys playing tennis, watching crime TV series, playing FPS PC games, and coding personal projects.

Anshika Singh
Anshika Singh is an Associate Solutions Architect at AWS specializing in building for GenAI applications. She helps enable customers to use the cloud through the use of code samples and starter projects.
Comic for 2024.03.12 – Marathon
Post Syndicated from Explosm.net original https://explosm.net/comics/marathon-2
New Cyanide and Happiness Comic
Measure performance of AWS Glue Data Quality for ETL pipelines
Post Syndicated from Ruben Afonso original https://aws.amazon.com/blogs/big-data/measure-performance-of-aws-glue-data-quality-for-etl-pipelines/
In recent years, data lakes have become a mainstream architecture, and data quality validation is a critical factor to improve the reusability and consistency of the data. AWS Glue Data Quality reduces the effort required to validate data from days to hours, and provides computing recommendations, statistics, and insights about the resources required to run data validation.
AWS Glue Data Quality is built on DeeQu, an open source tool developed and used at Amazon to calculate data quality metrics and verify data quality constraints and changes in the data distribution so you can focus on describing how data should look instead of implementing algorithms.
In this post, we provide benchmark results of running increasingly complex data quality rulesets over a predefined test dataset. As part of the results, we show how AWS Glue Data Quality provides information about the runtime of extract, transform, and load (ETL) jobs, the resources measured in terms of data processing units (DPUs), and how you can track the cost of running AWS Glue Data Quality for ETL pipelines by defining custom cost reporting in AWS Cost Explorer.
|
This post is Part 6 of a six-part series of posts to explain how AWS Glue Data Quality works. Check out the other posts in the series:
|
Solution overview
We start by defining our test dataset in order to explore how AWS Glue Data Quality automatically scales depending on input datasets.
Dataset details
The test dataset contains 104 columns and 1 million rows stored in Parquet format. You can download the dataset or recreate it locally using the Python script provided in the repository. If you opt to run the generator script, you need to install the Pandas and Mimesis packages in your Python environment:
The dataset schema is a combination of numerical, categorical, and string variables in order to have enough attributes to use a combination of built-in AWS Glue Data Quality rule types. The schema replicates some of the most common attributes found in financial market data such as instrument ticker, traded volumes, and pricing forecasts.
Data quality rulesets
We categorize some of the built-in AWS Glue Data Quality rule types to define the benchmark structure. The categories consider whether the rules perform column checks that don’t require row-level inspection (simple rules), row-by-row analysis (medium rules), or data type checks, eventually comparing row values against other data sources (complex rules). The following table summarizes these rules.
| Simple Rules | Medium Rules | Complex Rules |
| ColumnCount | DistinctValuesCount | ColumnValues |
| ColumnDataType | IsComplete | Completeness |
| ColumnExist | Sum | ReferentialIntegrity |
| ColumnNamesMatchPattern | StandardDeviation | ColumnCorrelation |
| RowCount | Mean | RowCountMatch |
| ColumnLength | . | . |
We define eight different AWS Glue ETL jobs where we run the data quality rulesets. Each job has a different number of data quality rules associated to it. Each job also has an associated user-defined cost allocation tag that we use to create a data quality cost report in AWS Cost Explorer later on.
We provide the plain text definition for each ruleset in the following table.
| Job name | Simple Rules | Medium Rules | Complex Rules | Number of Rules | Tag | Definition |
| ruleset-0 | 0 | 0 | 0 | 0 | dqjob:rs0 | – |
| ruleset-1 | 0 | 0 | 1 | 1 | dqjob:rs1 | Link |
| ruleset-5 | 3 | 1 | 1 | 5 | dqjob:rs5 | Link |
| ruleset-10 | 6 | 2 | 2 | 10 | dqjob:rs10 | Link |
| ruleset-50 | 30 | 10 | 10 | 50 | dqjob:rs50 | Link |
| ruleset-100 | 50 | 30 | 20 | 100 | dqjob:rs100 | Link |
| ruleset-200 | 100 | 60 | 40 | 200 | dqjob:rs200 | Link |
| ruleset-400 | 200 | 120 | 80 | 400 | dqjob:rs400 | Link |
Create the AWS Glue ETL jobs containing the data quality rulesets
We upload the test dataset to Amazon Simple Storage Service (Amazon S3) and also two additional CSV files that we’ll use to evaluate referential integrity rules in AWS Glue Data Quality (isocodes.csv and exchanges.csv) after they have been added to the AWS Glue Data Catalog. Complete the following steps:
- On the Amazon S3 console, create a new S3 bucket in your account and upload the test dataset.
- Create a folder in the S3 bucket called
isocodesand upload the isocodes.csv file. - Create another folder in the S3 bucket called exchange and upload the exchanges.csv file.
- On the AWS Glue console, run two AWS Glue crawlers, one for each folder to register the CSV content in AWS Glue Data Catalog (
data_quality_catalog). For instructions, refer to Adding an AWS Glue Crawler.
The AWS Glue crawlers generate two tables (exchanges and isocodes) as part of the AWS Glue Data Catalog.

Now we will create the AWS Identity and Access Management (IAM) role that will be assumed by the ETL jobs at runtime:
- On the IAM console, create a new IAM role called
AWSGlueDataQualityPerformanceRole - For Trusted entity type, select AWS service.
- For Service or use case, choose Glue.
- Choose Next.

- For Permission policies, enter
AWSGlueServiceRole - Choose Next.

- Create and attach a new inline policy (
AWSGlueDataQualityBucketPolicy) with the following content. Replace the placeholder with the S3 bucket name you created earlier:

Next, we create one of the AWS Glue ETL jobs, ruleset-5.
- On the AWS Glue console, under ETL jobs in the navigation pane, choose Visual ETL.
- In the Create job section, choose Visual ETL.x

- In the Visual Editor, add a Data Source – S3 Bucket source node:
- For S3 URL, enter the S3 folder containing the test dataset.
- For Data format, choose Parquet.

- Create a new action node, Transform: Evaluate-Data-Catalog:
- For Node parents, choose the node you created.
- Add the ruleset-5 definition under Ruleset editor.

- Scroll to the end and under Performance Configuration, enable Cache Data.


- Under Job details, for IAM Role, choose
AWSGlueDataQualityPerformanceRole.

- In the Tags section, define dqjob tag as rs5.

This tag will be different for each of the data quality ETL jobs; we use them in AWS Cost Explorer to review the ETL jobs cost.

- Choose Save.
- Repeat these steps with the rest of the rulesets to define all the ETL jobs.

Run the AWS Glue ETL jobs
Complete the following steps to run the ETL jobs:
- On the AWS Glue console, choose Visual ETL under ETL jobs in the navigation pane.
- Select the ETL job and choose Run job.
- Repeat for all the ETL jobs.

When the ETL jobs are complete, the Job run monitoring page will display the job details. As shown in the following screenshot, a DPU hours column is provided for each ETL job.

Review performance
The following table summarizes the duration, DPU hours, and estimated costs from running the eight different data quality rulesets over the same test dataset. Note that all rulesets have been run with the entire test dataset described earlier (104 columns, 1 million rows).
| ETL Job Name | Number of Rules | Tag | Duration (sec) | # of DPU hours | # of DPUs | Cost ($) |
| ruleset-400 | 400 | dqjob:rs400 | 445.7 | 1.24 | 10 | $0.54 |
| ruleset-200 | 200 | dqjob:rs200 | 235.7 | 0.65 | 10 | $0.29 |
| ruleset-100 | 100 | dqjob:rs100 | 186.5 | 0.52 | 10 | $0.23 |
| ruleset-50 | 50 | dqjob:rs50 | 155.2 | 0.43 | 10 | $0.19 |
| ruleset-10 | 10 | dqjob:rs10 | 152.2 | 0.42 | 10 | $0.18 |
| ruleset-5 | 5 | dqjob:rs5 | 150.3 | 0.42 | 10 | $0.18 |
| ruleset-1 | 1 | dqjob:rs1 | 150.1 | 0.42 | 10 | $0.18 |
| ruleset-0 | 0 | dqjob:rs0 | 53.2 | 0.15 | 10 | $0.06 |
The cost of evaluating an empty ruleset is close to zero, but it has been included because it can be used as a quick test to validate the IAM roles associated to the AWS Glue Data Quality jobs and read permissions to the test dataset in Amazon S3. The cost of data quality jobs only starts to increase after evaluating rulesets with more than 100 rules, remaining constant below that number.
We can observe that the cost of running data quality for the largest ruleset in the benchmark (400 rules) is still slightly above $0.50.
Data quality cost analysis in AWS Cost Explorer
In order to see the data quality ETL job tags in AWS Cost Explorer, you need to activate the user-defined cost allocation tags first.
After you create and apply user-defined tags to your resources, it can take up to 24 hours for the tag keys to appear on your cost allocation tags page for activation. It can then take up to 24 hours for the tag keys to activate.
- On the AWS Cost Explorer console, choose Cost Explorer Saved Reports in the navigation pane.
- Choose Create new report.

- Select Cost and usage as the report type.
- Choose Create Report.

- For Date Range, enter a date range.
- For Granularity¸ choose Daily.
- For Dimension, choose Tag, then choose the
dqjobtag.

- Under Applied filters, choose the
dqjobtag and the eight tags used in the data quality rulesets (rs0, rs1, rs5, rs10, rs50, rs100, rs200, and rs400).

- Choose Apply.


The Cost and Usage report will be updated. The X-axis shows the data quality ruleset tags as categories. The Cost and usage graph in AWS Cost Explorer will refresh and show the total monthly cost of the latest data quality ETL jobs run, aggregated by ETL job.

Clean up
To clean up the infrastructure and avoid additional charges, complete the following steps:
- Empty the S3 bucket initially created to store the test dataset.
- Delete the ETL jobs you created in AWS Glue.
- Delete the
AWSGlueDataQualityPerformanceRoleIAM role. - Delete the custom report created in AWS Cost Explorer.
Conclusion
AWS Glue Data Quality provides an efficient way to incorporate data quality validation as part of ETL pipelines and scales automatically to accommodate increasing volumes of data. The built-in data quality rule types offer a wide range of options to customize the data quality checks and focus on how your data should look instead of implementing undifferentiated logic.
In this benchmark analysis, we showed how common-size AWS Glue Data Quality rulesets have little or no overhead, whereas in complex cases, the cost increases linearly. We also reviewed how you can tag AWS Glue Data Quality jobs to make cost information available in AWS Cost Explorer for quick reporting.
AWS Glue Data Quality is generally available in all AWS Regions where AWS Glue is available. Learn more about AWS Glue Data Quality and AWS Glue Data Catalog in Getting started with AWS Glue Data Quality from the AWS Glue Data Catalog.
About the Authors
 Ruben Afonso is a Global Financial Services Solutions Architect with AWS. He enjoys working on analytics and AI/ML challenges, with a passion for automation and optimization. When not at work, he enjoys finding hidden spots off the beaten path around Barcelona.
 Kalyan Kumar Neelampudi (KK) is a Specialist Partner Solutions Architect (Data Analytics & Generative AI) at AWS. He acts as a technical advisor and collaborates with various AWS partners to design, implement, and build practices around data analytics and AI/ML workloads. Outside of work, he’s a badminton enthusiast and culinary adventurer, exploring local cuisines and traveling with his partner to discover new tastes and experiences.

Gonzalo Herreros is a Senior Big Data Architect on the AWS Glue team.
AWS completes the annual UAE Information Assurance Regulation compliance assessment
Post Syndicated from Vishal Pabari original https://aws.amazon.com/blogs/security/aws-completes-the-annual-uae-information-assurance-regulation-compliance-assessment/
Amazon Web Services (AWS) is pleased to announce the publication of our annual compliance assessment report on the Information Assurance Regulation (IAR) established by the Telecommunications and Digital Government Regulatory Authority (TDRA) of the United Arab Emirates (UAE). The report covers the AWS Middle East (UAE) Region.
The IAR provides management and technical information security controls to help establish, implement, maintain, and continuously improve information assurance. AWS alignment with IAR requirements demonstrates our ongoing commitment to adhere to the heightened expectations for cloud service providers. As such, IAR-regulated customers can continue to use AWS services with confidence.
Independent third-party auditors from BDO evaluated AWS for the period of November 1, 2022, to October 31, 2023. The assessment report that illustrates the status of AWS compliance is available through AWS Artifact. AWS Artifact is a self-service portal for on-demand access to AWS compliance reports. Sign in to AWS Artifact in the AWS Management Console, or learn more at Getting Started with AWS Artifact.
AWS strives to continuously bring services into the scope of its compliance programs to help you meet your architectural and regulatory needs. If you have questions or feedback about IAR compliance, reach out to your AWS account team.
To learn more about our compliance and security programs, see AWS Compliance Programs. As always, we value your feedback and questions; reach out to the AWS Compliance team through the Contact Us page.
If you have feedback about this post, submit comments in the Comments section below.
How the GoDaddy data platform achieved over 60% cost reduction and 50% performance boost by adopting Amazon EMR Serverless
Post Syndicated from Brandon Abear original https://aws.amazon.com/blogs/big-data/how-the-godaddy-data-platform-achieved-over-60-cost-reduction-and-50-performance-boost-by-adopting-amazon-emr-serverless/
This is a guest post co-written with Brandon Abear, Dinesh Sharma, John Bush, and Ozcan IIikhan from GoDaddy.
GoDaddy empowers everyday entrepreneurs by providing all the help and tools to succeed online. With more than 20 million customers worldwide, GoDaddy is the place people come to name their ideas, build a professional website, attract customers, and manage their work.
At GoDaddy, we take pride in being a data-driven company. Our relentless pursuit of valuable insights from data fuels our business decisions and ensures customer satisfaction. Our commitment to efficiency is unwavering, and we’ve undertaken an exciting initiative to optimize our batch processing jobs. In this journey, we have identified a structured approach that we refer to as the seven layers of improvement opportunities. This methodology has become our guide in the pursuit of efficiency.
In this post, we discuss how we enhanced operational efficiency with Amazon EMR Serverless. We share our benchmarking results and methodology, and insights into the cost-effectiveness of EMR Serverless vs. fixed capacity Amazon EMR on EC2 transient clusters on our data workflows orchestrated using Amazon Managed Workflows for Apache Airflow (Amazon MWAA). We share our strategy for the adoption of EMR Serverless in areas where it excels. Our findings reveal significant benefits, including over 60% cost reduction, 50% faster Spark workloads, a remarkable five-times improvement in development and testing speed, and a significant reduction in our carbon footprint.
Background
In late 2020, GoDaddy’s data platform initiated its AWS Cloud journey, migrating an 800-node Hadoop cluster with 2.5 PB of data from its data center to EMR on EC2. This lift-and-shift approach facilitated a direct comparison between on-premises and cloud environments, ensuring a smooth transition to AWS pipelines, minimizing data validation issues and migration delays.
By early 2022, we successfully migrated our big data workloads to EMR on EC2. Using best practices learned from the AWS FinHack program, we fine-tuned resource-intensive jobs, converted Pig and Hive jobs to Spark, and reduced our batch workload spend by 22.75% in 2022. However, scalability challenges emerged due to the multitude of jobs. This prompted GoDaddy to embark on a systematic optimization journey, establishing a foundation for more sustainable and efficient big data processing.
Seven layers of improvement opportunities
In our quest for operational efficiency, we have identified seven distinct layers of opportunities for optimization within our batch processing jobs, as shown in the following figure. These layers range from precise code-level enhancements to more comprehensive platform improvements. This multi-layered approach has become our strategic blueprint in the ongoing pursuit of better performance and higher efficiency.

The layers are as follows:
- Code optimization – Focuses on refining the code logic and how it can be optimized for better performance. This involves performance enhancements through selective caching, partition and projection pruning, join optimizations, and other job-specific tuning. Using AI coding solutions is also an integral part of this process.
- Software updates – Updating to the latest versions of open source software (OSS) to capitalize on new features and improvements. For example, Adaptive Query Execution in Spark 3 brings significant performance and cost improvements.
- Custom Spark configurations – Tuning of custom Spark configurations to maximize resource utilization, memory, and parallelism. We can achieve significant improvements by right-sizing tasks, such as through
spark.sql.shuffle.partitions,spark.sql.files.maxPartitionBytes,spark.executor.cores, andspark.executor.memory. However, these custom configurations might be counterproductive if they are not compatible with the specific Spark version. - Resource provisioning time – The time it takes to launch resources like ephemeral EMR clusters on Amazon Elastic Compute Cloud (Amazon EC2). Although some factors influencing this time are outside of an engineer’s control, identifying and addressing the factors that can be optimized can help reduce overall provisioning time.
- Fine-grained scaling at task level – Dynamically adjusting resources such as CPU, memory, disk, and network bandwidth based on each stage’s needs within a task. The aim here is to avoid fixed cluster sizes that could result in resource waste.
- Fine-grained scaling across multiple tasks in a workflow – Given that each task has unique resource requirements, maintaining a fixed resource size may result in under- or over-provisioning for certain tasks within the same workflow. Traditionally, the size of the largest task determines the cluster size for a multi-task workflow. However, dynamically adjusting resources across multiple tasks and steps within a workflow result in a more cost-effective implementation.
- Platform-level enhancements – Enhancements at preceding layers can only optimize a given job or a workflow. Platform improvement aims to attain efficiency at the company level. We can achieve this through various means, such as updating or upgrading the core infrastructure, introducing new frameworks, allocating appropriate resources for each job profile, balancing service usage, optimizing the use of Savings Plans and Spot Instances, or implementing other comprehensive changes to boost efficiency across all tasks and workflows.
Layers 1–3: Previous cost reductions
After we migrated from on premises to AWS Cloud, we primarily focused our cost-optimization efforts on the first three layers shown in the diagram. By transitioning our most costly legacy Pig and Hive pipelines to Spark and optimizing Spark configurations for Amazon EMR, we achieved significant cost savings.
For example, a legacy Pig job took 10 hours to complete and ranked among the top 10 most expensive EMR jobs. Upon reviewing TEZ logs and cluster metrics, we discovered that the cluster was vastly over-provisioned for the data volume being processed and remained under-utilized for most of the runtime. Transitioning from Pig to Spark was more efficient. Although no automated tools were available for the conversion, manual optimizations were made, including:
- Reduced unnecessary disk writes, saving serialization and deserialization time (Layer 1)
- Replaced Airflow task parallelization with Spark, simplifying the Airflow DAG (Layer 1)
- Eliminated redundant Spark transformations (Layer 1)
- Upgraded from Spark 2 to 3, using Adaptive Query Execution (Layer 2)
- Addressed skewed joins and optimized smaller dimension tables (Layer 3)
As a result, job cost decreased by 95%, and job completion time was reduced to 1 hour. However, this approach was labor-intensive and not scalable for numerous jobs.
Layers 4–6: Find and adopt the right compute solution
In late 2022, following our significant accomplishments in optimization at the previous levels, our attention moved towards enhancing the remaining layers.
Understanding the state of our batch processing
We use Amazon MWAA to orchestrate our data workflows in the cloud at scale. Apache Airflow is an open source tool used to programmatically author, schedule, and monitor sequences of processes and tasks referred to as workflows. In this post, the terms workflow and job are used interchangeably, referring to the Directed Acyclic Graphs (DAGs) consisting of tasks orchestrated by Amazon MWAA. For each workflow, we have sequential or parallel tasks, and even a combination of both in the DAG between create_emr and terminate_emr tasks running on a transient EMR cluster with fixed compute capacity throughout the workflow run. Even after optimizing a portion of our workload, we still had numerous non-optimized workflows that were under-utilized due to over-provisioning of compute resources based on the most resource-intensive task in the workflow, as shown in the following figure.

This highlighted the impracticality of static resource allocation and led us to recognize the necessity of a dynamic resource allocation (DRA) system. Before proposing a solution, we gathered extensive data to thoroughly understand our batch processing. Analyzing the cluster step time, excluding provisioning and idle time, revealed significant insights: a right-skewed distribution with over half of the workflows completing in 20 minutes or less and only 10% taking more than 60 minutes. This distribution guided our choice of a fast-provisioning compute solution, dramatically reducing workflow runtimes. The following diagram illustrates step times (excluding provisioning and idle time) of EMR on EC2 transient clusters in one of our batch processing accounts.

Furthermore, based on the step time (excluding provisioning and idle time) distribution of the workflows, we categorized our workflows into three groups:
- Quick run – Lasting 20 minutes or less
- Medium run – Lasting between 20–60 minutes
- Long run – Exceeding 60 minutes, often spanning several hours or more
Another factor we needed to consider was the extensive use of transient clusters for reasons such as security, job and cost isolation, and purpose-built clusters. Additionally, there was a significant variation in resource needs between peak hours and periods of low utilization.
Instead of fixed-size clusters, we could potentially use managed scaling on EMR on EC2 to achieve some cost benefits. However, migrating to EMR Serverless appears to be a more strategic direction for our data platform. In addition to potential cost benefits, EMR Serverless offers additional advantages such as a one-click upgrade to the newest Amazon EMR versions, a simplified operational and debugging experience, and automatic upgrades to the latest generations upon rollout. These features collectively simplify the process of operating a platform on a larger scale.
Evaluating EMR Serverless: A case study at GoDaddy
EMR Serverless is a serverless option in Amazon EMR that eliminates the complexities of configuring, managing, and scaling clusters when running big data frameworks like Apache Spark and Apache Hive. With EMR Serverless, businesses can enjoy numerous benefits, including cost-effectiveness, faster provisioning, simplified developer experience, and improved resilience to Availability Zone failures.
Recognizing the potential of EMR Serverless, we conducted an in-depth benchmark study using real production workflows. The study aimed to assess EMR Serverless performance and efficiency while also creating an adoption plan for large-scale implementation. The findings were highly encouraging, showing EMR Serverless can effectively handle our workloads.
Benchmarking methodology
We split our data workflows into three categories based on total step time (excluding provisioning and idle time): quick run (0–20 minutes), medium run (20–60 minutes), and long run (over 60 minutes). We analyzed the impact of the EMR deployment type (Amazon EC2 vs. EMR Serverless) on two key metrics: cost-efficiency and total runtime speedup, which served as our overall evaluation criteria. Although we did not formally measure ease of use and resiliency, these factors were considered throughout the evaluation process.
The high-level steps to assess the environment are as follows:
- Prepare the data and environment:
- Choose three to five random production jobs from each job category.
- Implement required adjustments to prevent interference with production.
- Run tests:
- Run scripts over several days or through multiple iterations to gather precise and consistent data points.
- Perform tests using EMR on EC2 and EMR Serverless.
- Validate data and test runs:
- Validate input and output datasets, partitions, and row counts to ensure identical data processing.
- Gather metrics and analyze results:
- Gather relevant metrics from the tests.
- Analyze results to draw insights and conclusions.
Benchmark results
Our benchmark results showed significant enhancements across all three job categories for both runtime speedup and cost-efficiency. The improvements were most pronounced for quick jobs, directly resulting from faster startup times. For instance, a 20-minute (including cluster provisioning and shut down) data workflow running on an EMR on EC2 transient cluster of fixed compute capacity finishes in 10 minutes on EMR Serverless, providing a shorter runtime with cost benefits. Overall, the shift to EMR Serverless delivered substantial performance improvements and cost reductions at scale across job brackets, as seen in the following figure.

Historically, we devoted more time to tuning our long-run workflows. Interestingly, we discovered that the existing custom Spark configurations for these jobs did not always translate well to EMR Serverless. In cases where the results were insignificant, a common approach was to discard previous Spark configurations related to executor cores. By allowing EMR Serverless to autonomously manage these Spark configurations, we often observed improved outcomes. The following graph shows the average runtime and cost improvement per job when comparing EMR Serverless to EMR on EC2.

The following table shows a sample comparison of results for the same workflow running on different deployment options of Amazon EMR (EMR on EC2 and EMR Serverless).
| Metric | EMR on EC2 (Average) |
EMR Serverless (Average) |
EMR on EC2 vs EMR Serverless |
| Total Run Cost ($) | $ 5.82 | $ 2.60 | 55% |
| Total Run Time (Minutes) | 53.40 | 39.40 | 26% |
| Provisioning Time (Minutes) | 10.20 | 0.05 | . |
| Provisioning Cost ($) | $ 1.19 | . | . |
| Steps Time (Minutes) | 38.20 | 39.16 | -3% |
| Steps Cost ($) | $ 4.30 | . | . |
| Idle Time (Minutes) | 4.80 | . | . |
| EMR Release Label | emr-6.9.0 | . | |
| Hadoop Distribution | Amazon 3.3.3 | . | |
| Spark Version | Spark 3.3.0 | . | |
| Hive/HCatalog Version | Hive 3.1.3, HCatalog 3.1.3 | . | |
| Job Type | Spark | . | |
AWS Graviton2 on EMR Serverless performance evaluation
After seeing compelling results with EMR Serverless for our workloads, we decided to further analyze the performance of the AWS Graviton2 (arm64) architecture within EMR Serverless. AWS had benchmarked Spark workloads on Graviton2 EMR Serverless using the TPC-DS 3TB scale, showing a 27% overall price-performance improvement.
To better understand the integration benefits, we ran our own study using GoDaddy’s production workloads on a daily schedule and observed an impressive 23.8% price-performance enhancement across a range of jobs when using Graviton2. For more details about this study, see GoDaddy benchmarking results in up to 24% better price-performance for their Spark workloads with AWS Graviton2 on Amazon EMR Serverless.
Adoption strategy for EMR Serverless
We strategically implemented a phased rollout of EMR Serverless via deployment rings, enabling systematic integration. This gradual approach let us validate improvements and halt further adoption of EMR Serverless, if needed. It served both as a safety net to catch issues early and a means to refine our infrastructure. The process mitigated change impact through smooth operations while building team expertise of our Data Engineering and DevOps teams. Additionally, it fostered tight feedback loops, allowing prompt adjustments and ensuring efficient EMR Serverless integration.
We divided our workflows into three main adoption groups, as shown in the following image:
- Canaries – This group aids in detecting and resolving any potential problems early in the deployment stage.
- Early adopters – This is the second batch of workflows that adopt the new compute solution after initial issues have been identified and rectified by the canaries group.
- Broad deployment rings – The largest group of rings, this group represents the wide-scale deployment of the solution. These are deployed after successful testing and implementation in the previous two groups.

We further broke down these workflows into granular deployment rings to adopt EMR Serverless, as shown in the following table.
| Ring # | Name | Details |
| Ring 0 | Canary | Low adoption risk jobs that are expected to yield some cost saving benefits. |
| Ring 1 | Early Adopters | Low risk Quick-run Spark jobs that expect to yield high gains. |
| Ring 2 | Quick-run | Rest of the Quick-run (step_time <= 20 min) Spark jobs |
| Ring 3 | LargerJobs_EZ | High potential gain, easy move, medium-run and long-run Spark jobs |
| Ring 4 | LargerJobs | Rest of the medium-run and long-run Spark jobs with potential gains |
| Ring 5 | Hive | Hive jobs with potentially higher cost savings |
| Ring 6 | Redshift_EZ | Easy migration Redshift jobs that suit EMR Serverless |
| Ring 7 | Glue_EZ | Easy migration Glue jobs that suit EMR Serverless |
Production adoption results summary
The encouraging benchmarking and canary adoption results generated considerable interest in wider EMR Serverless adoption at GoDaddy. To date, the EMR Serverless rollout remains underway. Thus far, it has reduced costs by 62.5% and accelerated total batch workflow completion by 50.4%.
Based on preliminary benchmarks, our team expected substantial gains for quick jobs. To our surprise, actual production deployments surpassed projections, averaging 64.4% faster vs. 42% projected, and 71.8% cheaper vs. 40% predicted.
Remarkably, long-running jobs also saw significant performance improvements due to the rapid provisioning of EMR Serverless and aggressive scaling enabled by dynamic resource allocation. We observed substantial parallelization during high-resource segments, resulting in a 40.5% faster total runtime compared to traditional approaches. The following chart illustrates the average enhancements per job category.

Additionally, we observed the highest degree of dispersion for speed improvements within the long-run job category, as shown in the following box-and-whisker plot.

Sample workflows adopted EMR Serverless
For a large workflow migrated to EMR Serverless, comparing 3-week averages pre- and post-migration revealed impressive cost savings—a 75.30% decrease based on retail pricing with 10% improvement in total runtime, boosting operational efficiency. The following graph illustrates the cost trend.

Although quick-run jobs realized minimal per-dollar cost reductions, they delivered the most significant percentage cost savings. With thousands of these workflows running daily, the accumulated savings are substantial. The following graph shows the cost trend for a small workload migrated from EMR on EC2 to EMR Serverless. Comparing 3-week pre- and post-migration averages revealed a remarkable 92.43% cost savings on the retail on-demand pricing, alongside an 80.6% acceleration in total runtime.

Layer 7: Platform-wide improvements
We aim to revolutionize compute operations at GoDaddy, providing simplified yet powerful solutions for all users with our Intelligent Compute Platform. With AWS compute solutions like EMR Serverless and EMR on EC2, it provided optimized runs of data processing and machine learning (ML) workloads. An ML-powered job broker intelligently determines when and how to run jobs based on various parameters, while still allowing power users to customize. Additionally, an ML-powered compute resource manager pre-provisions resources based on load and historical data, providing efficient, fast provisioning at optimum cost. Intelligent compute empowers users with out-of-the-box optimization, catering to diverse personas without compromising power users.
The following diagram shows a high-level illustration of the intelligent compute architecture.

Insights and recommended best-practices
The following section discusses the insights we’ve gathered and the recommended best practices we’ve developed during our preliminary and wider adoption stages.
Infrastructure preparation
Although EMR Serverless is a deployment method within EMR, it requires some infrastructure preparedness to optimize its potential. Consider the following requirements and practical guidance on implementation:
- Use large subnets across multiple Availability Zones – When running EMR Serverless workloads within your VPC, make sure the subnets span across multiple Availability Zones and are not constrained by IP addresses. Refer to Configuring VPC access and Best practices for subnet planning for details.
- Modify maximum concurrent vCPU quota – For extensive compute requirements, it is recommended to increase your max concurrent vCPUs per account service quota.
- Amazon MWAA version compatibility – When adopting EMR Serverless, GoDaddy’s decentralized Amazon MWAA ecosystem for data pipeline orchestration created compatibility issues from disparate AWS Providers versions. Directly upgrading Amazon MWAA was more efficient than updating numerous DAGs. We facilitated adoption by upgrading Amazon MWAA instances ourselves, documenting issues, and sharing findings and effort estimates for accurate upgrade planning.
- GoDaddy EMR operator – To streamline migrating numerous Airflow DAGs from EMR on EC2 to EMR Serverless, we developed custom operators adapting existing interfaces. This allowed seamless transitions while retaining familiar tuning options. Data engineers could easily migrate pipelines with simple find-replace imports and immediately use EMR Serverless.
Unexpected behavior mitigation
The following are unexpected behaviors we ran into and what we did to mitigate them:
- Spark DRA aggressive scaling – For some jobs (8.33% of initial benchmarks, 13.6% of production), cost increased after migrating to EMR Serverless. This was due to Spark DRA excessively assigning new workers briefly, prioritizing performance over cost. To counteract this, we set maximum executor thresholds by adjusting
spark.dynamicAllocation.maxExecutor, effectively limiting EMR Serverless scaling aggression. When migrating from EMR on EC2, we suggest observing the max core count in the Spark History UI to replicate similar compute limits in EMR Serverless, such as--conf spark.executor.coresand--conf spark.dynamicAllocation.maxExecutors. - Managing disk space for large-scale jobs – When transitioning jobs that process large data volumes with substantial shuffles and significant disk requirements to EMR Serverless, we recommend configuring
spark.emr-serverless.executor.diskby referring to existing Spark job metrics. Furthermore, configurations likespark.executor.corescombined withspark.emr-serverless.executor.diskandspark.dynamicAllocation.maxExecutorsallow control over the underlying worker size and total attached storage when advantageous. For example, a shuffle-heavy job with relatively low disk usage may benefit from using a larger worker to increase the likelihood of local shuffle fetches.
Conclusion
As discussed in this post, our experiences with adopting EMR Serverless on arm64 have been overwhelmingly positive. The impressive results we’ve achieved, including a 60% reduction in cost, 50% faster runs of batch Spark workloads, and an astounding five-times improvement in development and testing speed, speak volumes about the potential of this technology. Furthermore, our current results suggest that by widely adopting Graviton2 on EMR Serverless, we could potentially reduce the carbon footprint by up to 60% for our batch processing.
However, it’s crucial to understand that these results are not a one-size-fits-all scenario. The enhancements you can expect are subject to factors including, but not limited to, the specific nature of your workflows, cluster configurations, resource utilization levels, and fluctuations in computational capacity. Therefore, we strongly advocate for a data-driven, ring-based deployment strategy when considering the integration of EMR Serverless, which can help optimize its benefits to the fullest.
Special thanks to Mukul Sharma and Boris Berlin for their contributions to benchmarking. Many thanks to Travis Muhlestein (CDO), Abhijit Kundu (VP Eng), Vincent Yung (Sr. Director Eng.), and Wai Kin Lau (Sr. Director Data Eng.) for their continued support.
About the Authors
 Brandon Abear is a Principal Data Engineer in the Data & Analytics (DnA) organization at GoDaddy. He enjoys all things big data. In his spare time, he enjoys traveling, watching movies, and playing rhythm games.
 Dinesh Sharma is a Principal Data Engineer in the Data & Analytics (DnA) organization at GoDaddy. He is passionate about user experience and developer productivity, always looking for ways to optimize engineering processes and saving cost. In his spare time, he loves reading and is an avid manga fan.
 John Bush is a Principal Software Engineer in the Data & Analytics (DnA) organization at GoDaddy. He is passionate about making it easier for organizations to manage data and use it to drive their businesses forward. In his spare time, he loves hiking, camping, and riding his ebike.
 Ozcan Ilikhan is the Director of Engineering for the Data and ML Platform at GoDaddy. He has over two decades of multidisciplinary leadership experience, spanning startups to global enterprises. He has a passion for leveraging data and AI in creating solutions that delight customers, empower them to achieve more, and boost operational efficiency. Outside of his professional life, he enjoys reading, hiking, gardening, volunteering, and embarking on DIY projects.
 Harsh Vardhan is an AWS Solutions Architect, specializing in big data and analytics. He has over 8 years of experience working in the field of big data and data science. He is passionate about helping customers adopt best practices and discover insights from their data.
a9iii Review preview
Post Syndicated from Matt Granger original https://www.youtube.com/watch?v=csmME6A6BI0
AtomStack X24 pro – beginner friendly Laser Cutter & Engraver
Post Syndicated from BeardedTinker original https://www.youtube.com/watch?v=jw8kiPAmuYk
[$] Insecurity and Python pickles
Post Syndicated from daroc original https://lwn.net/Articles/964392/
Serialization is the process of transforming Python objects into a sequence of
bytes which can be used to recreate a copy of the object later — or on another
machine.
pickle is Python’s native serialization module. It can store complex Python
objects,
making it an appealing prospect for moving data without having to write
custom serialization code. For example, pickle is an integral component of
several file
formats used for machine learning. However, using pickle to deserialize
untrusted files is a major security risk, because doing so can invoke arbitrary
Python functions. Consequently, the machine-learning community is working to address the
security issues caused by widespread use of pickle.