Post Syndicated from Shan Kandaswamy original https://aws.amazon.com/blogs/devops/accelerate-incident-resolution-with-pagerduty-and-aws-devops-agent/
When something breaks in production, you find out fast. Understanding why it broke, before the damage spreads, is the hard part. That is where Site Reliability Engineering (SRE) teams lose the most time.
Think about the last time you got paged at 2 a.m. The alert said something broke, not why. You open four or five dashboards, cross-reference deployment logs with AWS CloudTrail events, and scroll through metrics. Twenty or thirty minutes burn before the picture comes together. That manual correlation is where resolution time balloons.
What if the investigation started before you opened your first dashboard?
That’s the idea behind connecting the new native PagerDuty Capability Provider in AWS DevOps Agent. The two systems now talk directly over a built-in OAuth 2.0 connection. When a PagerDuty incident triggers, the DevOps Agent starts investigating while responders are still getting oriented. Connecting them takes a few fields in a console.
What AWS DevOps Agent does
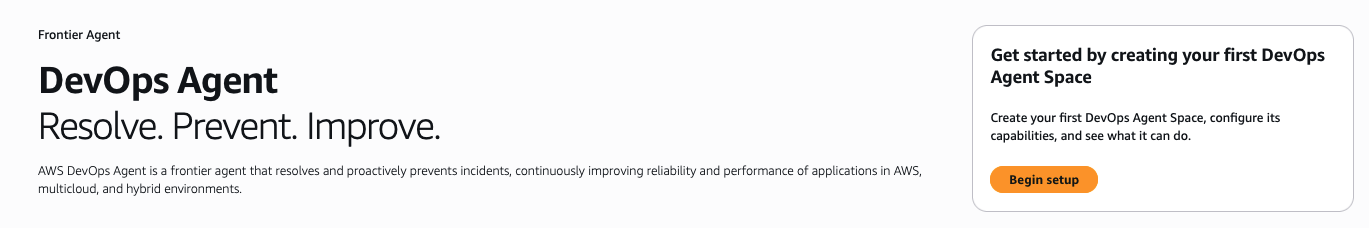
AWS DevOps Agent is a frontier agent built to help engineering teams investigate and resolve production incidents faster. The DevOps Agent works as a first responder, conducting federated investigations across your observability stack, tracing incidents from code changes all the way through to cloud infrastructure impact, and producing detailed mitigation plans. Beyond reactive investigations, it also proactively recommends improvements to your observability, infrastructure, and deployment pipelines to help prevent recurring issues. Through the AWS DevOps Agent web app, you can observe investigations as they unfold, access findings, and steer the analysis in real time.
The central concept is the Agent Space. Think of it as the boundary that defines what your agent can access. Your AWS account serves as the primary source, and from there you layer on secondary capabilities from telemetry providers like Datadog, Dynatrace, New Relic, or Splunk; pipeline tools like GitHub and GitLab; communications from PagerDuty and Slack; and custom Model Context Protocol (MCP) servers for anything else. Every investigation the agent runs, it learns. It maps relationships between your resources such as load balancers to services, services to databases, and deployments to config changes. One team we’ve worked with had the agent map hundreds of infrastructure relationships, and that number keeps growing with each investigation it completes.
PagerDuty, of course, needs no introduction to anyone who’s been responsible for resolving critical, customer-impacting incidents. Engineering teams rely on it to detect, triage, resolve, and learn from incidents. The native PagerDuty Capability Provider in AWS DevOps Agent connects the two directly. PagerDuty incident events drive AWS DevOps Agent investigations automatically. Findings flow back to the originating PagerDuty incident record, including root cause analysis and recommended mitigation steps. They are also available in the AWS DevOps Agent console and web app, giving your whole team visibility into what the agent discovered.
There’s a second piece to this integration worth understanding. By adding the PagerDuty MCP Server as a capability and configuring an AWS DevOps Agent skill for working with PagerDuty, you enable AWS DevOps Agent to query PagerDuty’s institutional memory during investigations. This includes past incidents, diagnostics, resolution patterns, and operational context across both AWS and non-AWS environments. This PagerDuty MCP Server-based connection is separate from the Capability Provider event flow and requires its own setup (covered in Step 6 below). The result is investigations informed by both current signals and prior incident history.
Why this matters
These are practical, tangible changes for your team:
Faster time to root cause. When a PagerDuty incident triggers, AWS DevOps Agent kicks off an investigation automatically. No one has to sign in to another tool, step through a wizard, or remember to initiate anything. The investigation is already running by the time you acknowledge your alert.
Real contextual analysis. The agent correlates PagerDuty incident data with Amazon CloudWatch metrics, AWS CloudTrail logs, application topology, and deployment history, plus telemetry from whichever third-party observability providers you’ve connected, like Datadog, Splunk, New Relic, or Dynatrace. It connects dots that would otherwise take humans significant time to even start connecting.
Investigations start when an incident triggers. AWS DevOps Agent automatically conducts the deep-dive investigation behind the scenes. It reports back its root cause analysis and proposed mitigation steps into the originating PagerDuty incident, with a link to the AWS DevOps Agent web app for more details.
Less time playing detective, more time fixing things. That manual data correlation across four or five tools? The agent handles it. Your people can focus on actually resolving the issue instead of building the investigation timeline by hand.
Nothing extra to host. The native PagerDuty Capability Provider means you’re not standing up additional infrastructure. No servers to manage, no endpoints to maintain on your side.
How the integration works
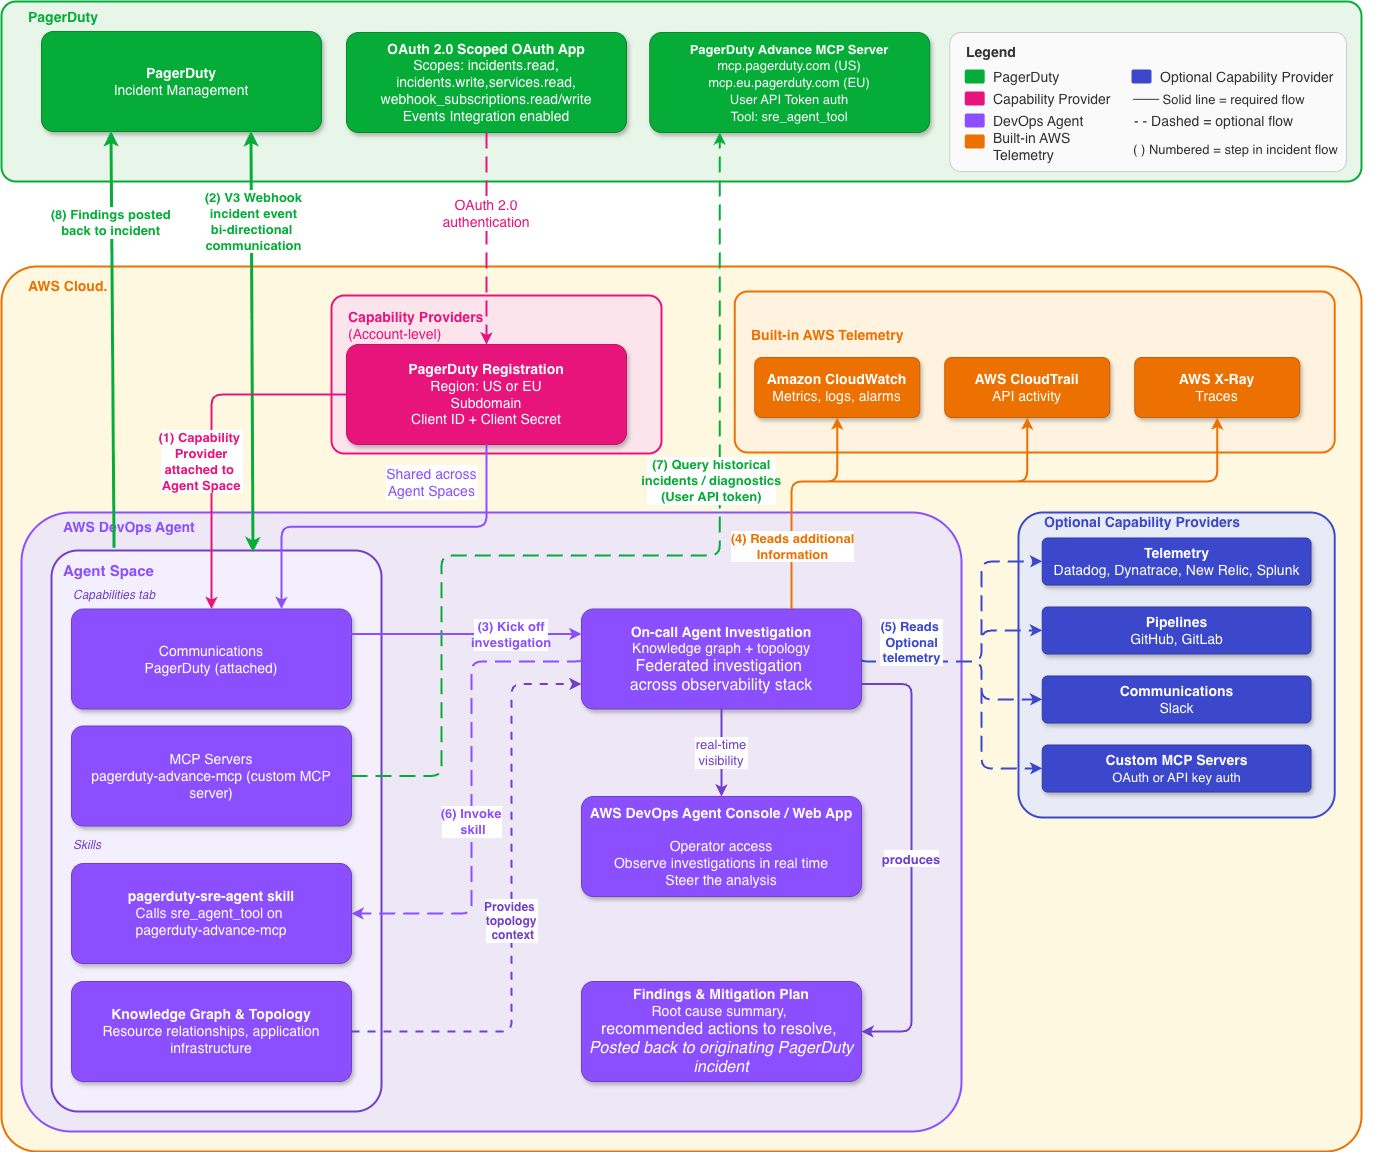
The architecture is straightforward. Here’s the flow:

Figure 1: High-level architecture, native PagerDuty Capability Provider in AWS DevOps Agent.
AWS DevOps Agent and PagerDuty authenticate to each other using OAuth 2.0 Scoped OAuth. You register PagerDuty once at the AWS account level as a Capability Provider, and then add it to whichever Agent Spaces need it. Registration is shared across Agent Spaces in the account, so you don’t have to repeat the setup per team.
Once a PagerDuty incident triggers, AWS DevOps Agent picks up the event over the native connection and begins investigating:
- Receives the PagerDuty incident event (service, severity, and initial context) via the native Capability Provider connection
- If the PagerDuty MCP capability and AWS DevOps Agent skill are configured, queries PagerDuty for related historical incidents, past diagnostics, and resolution patterns to enrich the investigation
- Examines AWS resource topology and the relationships between your infrastructure components through its knowledge graph
- Reviews AWS CloudTrail logs for recent changes or anything that looks off
- Queries Amazon CloudWatch and connected telemetry providers (Datadog, Dynatrace, New Relic, Splunk) for relevant metrics and traces
- Cross-references deployment events from configured pipeline tools (GitHub, GitLab) against the incident timeline
- Synthesizes potential root causes from all the evidence it’s gathered
The agent builds up a comprehensive picture by introspecting AWS observability data, pulling from connected capability providers, and leveraging the topology mapping that creates a knowledge graph of your application infrastructure. Every investigation it runs expands its understanding of how your resources connect. It discovers relationships you might not have explicitly documented, building a richer map with each incident it works.
Beyond raw data, the agent produces detailed mitigation plans with specific actions to resolve the issue, validate the fix, and revert if needed. The agent posts its findings, root cause summary, and recommended next steps directly to the originating PagerDuty incident record, giving your on-call team actionable information without them having to go digging.
A quick note on security, because it matters. The native connection uses OAuth 2.0 Scoped OAuth with a minimum set of PagerDuty scopes (incidents.read incidents.write services.read webhook_subscriptions.read webhook_subscriptions.write). AWS DevOps Agent only supports the newer scoped OAuth flow; legacy PagerDuty OAuth with a redirect URI is not supported. For inbound events from PagerDuty, only V3 webhooks are supported. Earlier webhook versions won’t work. Traffic flows over HTTPS.
Getting it set up
Setup comes in four phases: register PagerDuty as a Capability Provider at the account level, attach it to your Agent Space, configure the PagerDuty MCP server and AWS DevOps Agent skill for working with PagerDuty to enrich investigations, and verify things work end to end.
What you’ll need
- An active AWS account with permissions to use AWS DevOps Agent
- AWS DevOps Agent enabled in a supported AWS Region. You’ll create an Agent Space, which needs two AWS Identity and Access Management (IAM) roles (one for Agent Space operations, one for web app functionality). Both can be auto-created during setup
- A PagerDuty account with permission to register OAuth apps, plus an Administrator role for Events Integration
- A PagerDuty Advance license and a PagerDuty User API token (for the MCP integration in Step 6)
- Your PagerDuty account subdomain (so if your PagerDuty URL is
https://your-company.pagerduty.com, the subdomain is your-company)
- An OAuth client ID and client secret from a PagerDuty app registered with OAuth 2.0 Scoped OAuth
Step 1: Create your Agent Space
Stand up an Agent Space in the AWS DevOps Agent console. This defines the boundary for what the agent can reach into and investigate.
- Head to the AWS DevOps Agent console home page.

AWS DevOps Agent console home page.
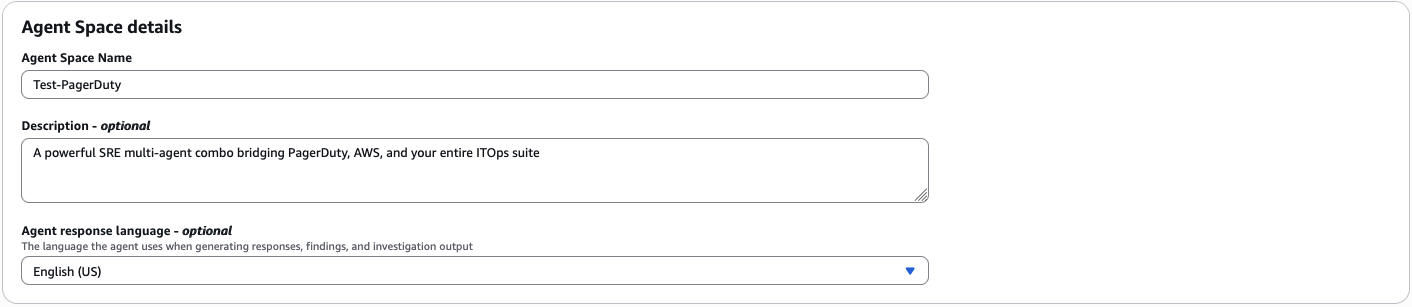
- Create a new Agent Space with a name and a short description, usually scoped to a service or application team’s responsibilities

Creating a new Agent Space with a name and description.
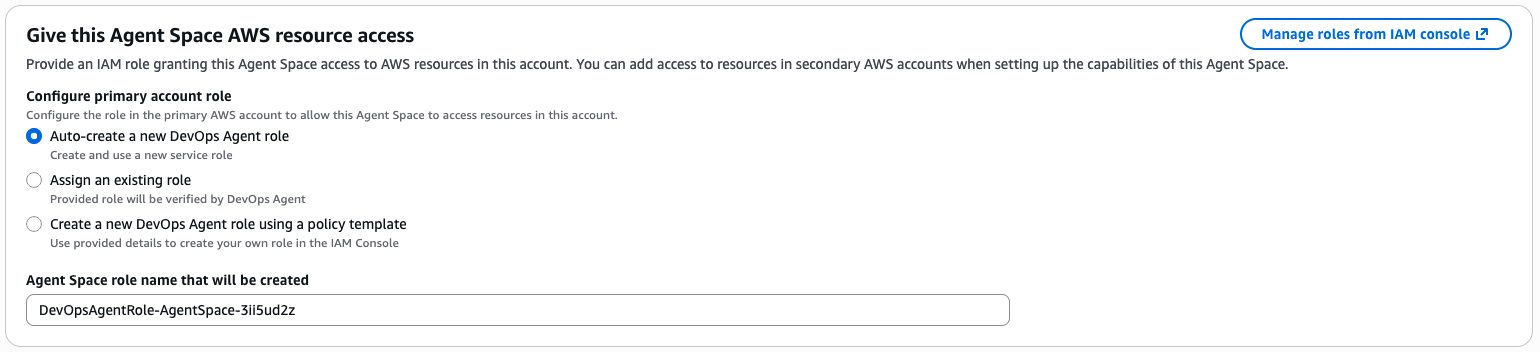
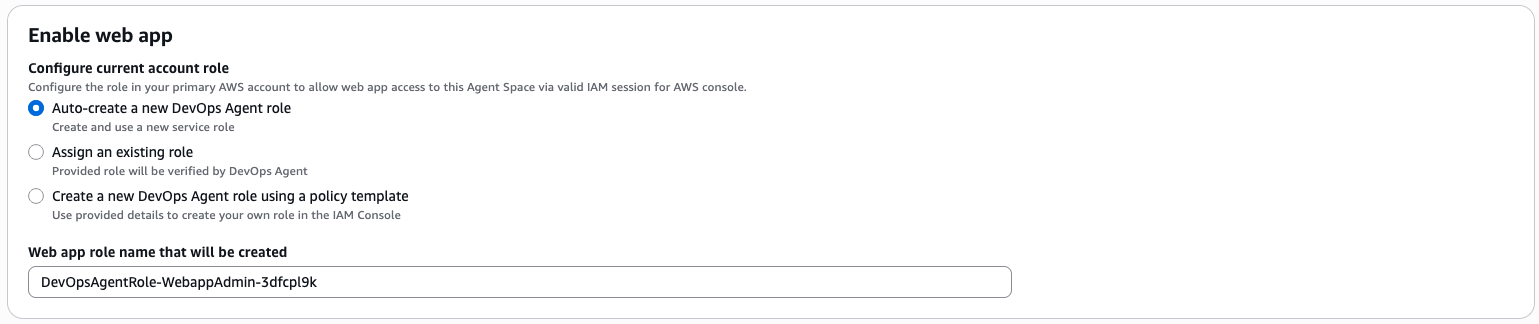
- Create the Agent Space IAM roles (AWS DevOps Agent requires two IAM roles: one for Agent Space operations and another for its associated web app functionality). You can auto-create them during setup

Configuring the two IAM roles required for the Agent Space.

IAM roles can be auto-created during setup.
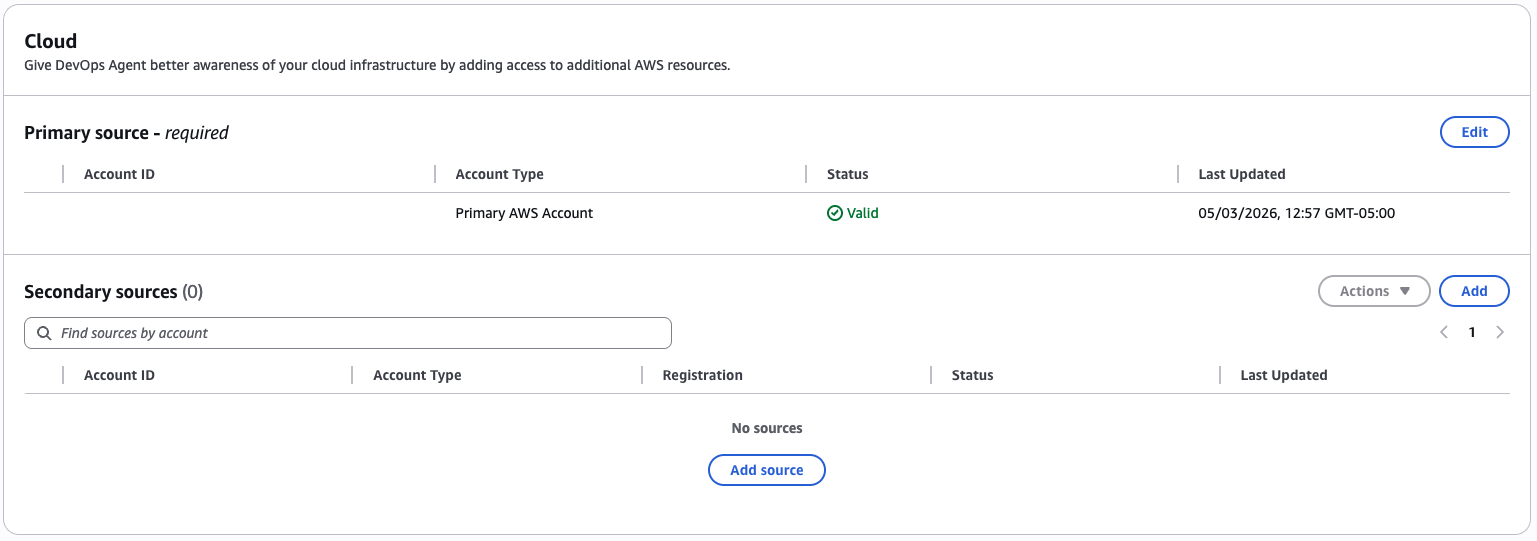
- Your primary source (the AWS account you’re creating the Agent Space in) is added automatically. If you need the agent to investigate resources in other accounts, add those as secondary sources

The AWS account is added automatically as the primary source.
Step 2: Add supporting capabilities
Out of the box, the agent connects to Amazon CloudWatch for metrics, logs, and alarms, and can investigate AWS CloudTrail API activity and AWS X-Ray traces through its read-only permissions. That said, most teams don’t live entirely inside AWS tooling, and that’s where third-party capability providers pull their weight. You can wire in external tools to give the agent a fuller picture of your world:
- Telemetry: Datadog, Dynatrace, New Relic, or Splunk, so the agent can pull metrics and traces beyond Amazon CloudWatch during investigations
- Pipelines: GitHub or GitLab, so it can correlate deployments and code changes with incidents
- Communications: Slack, for team coordination and investigation updates (PagerDuty is configured separately as a Capability Provider in Step 4)
- MCP Servers: Custom integrations via OAuth or API keys for anything else in your stack
You don’t need everything connected on day one. Start with what makes sense and add more as you go. Each new capability helps the agent discover more infrastructure relationships and investigate more effectively.
Step 3: Set up application topology
Help the agent understand what your application landscape looks like:
- Configure IAM roles to define the AWS topology scope for your Agent Space. The agent uses these permissions to determine which resources it can see and investigate
- Give the agent time to discover and map the relationships between your resources (it does this automatically as it runs investigations)
- Check the interactive topology visualization in the console and make sure your critical components are showing up correctly
- If you want the agent to focus on certain tags or resource subsets, add those instructions to your skills
Step 4: Register PagerDuty as a Capability Provider
You register PagerDuty once at the AWS account level. From there, it’s shared across every Agent Space in the account.
First, create the OAuth app in PagerDuty:
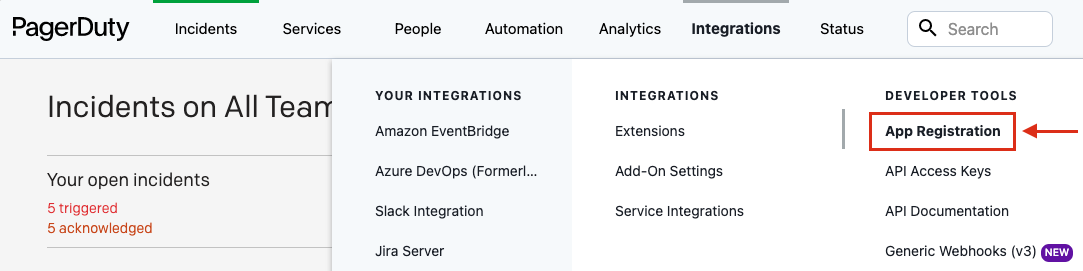
- In a separate browser tab, sign in to PagerDuty and go to Integrations > App Registration

In PagerDuty, navigate to Integrations then App Registration.

PagerDuty App Registration page.
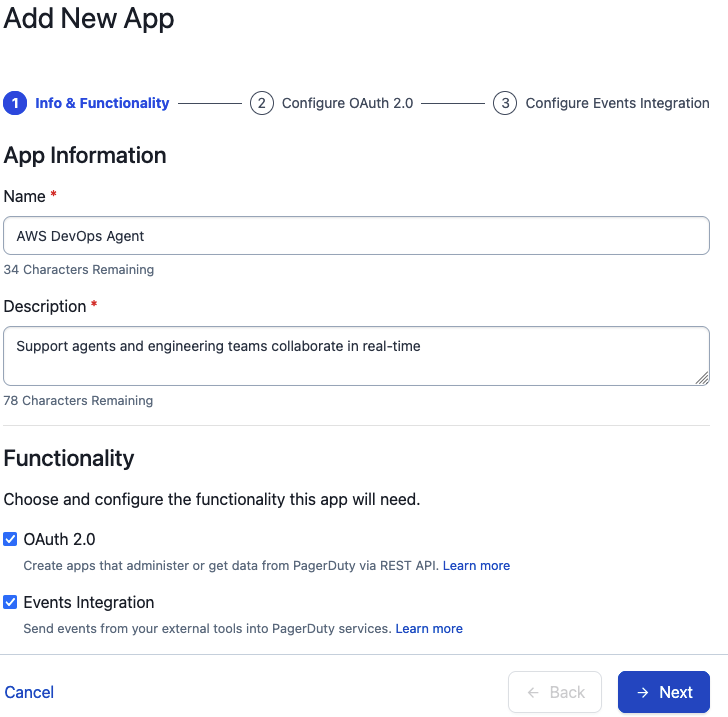
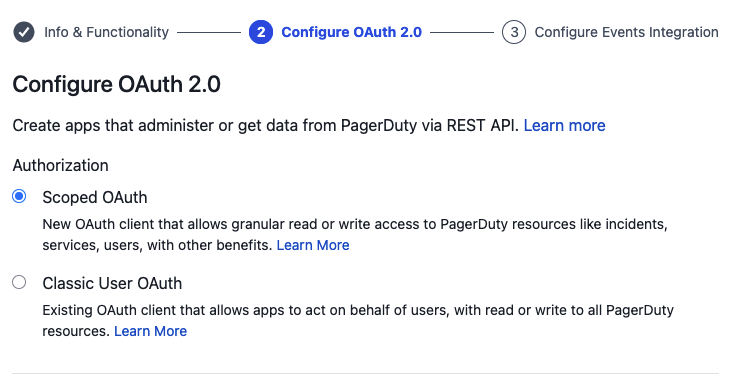
- Create a new app using OAuth 2.0 Scoped OAuth. AWS DevOps Agent does not support legacy PagerDuty OAuth with redirect URI

Create the app using OAuth 2.0 Scoped OAuth.
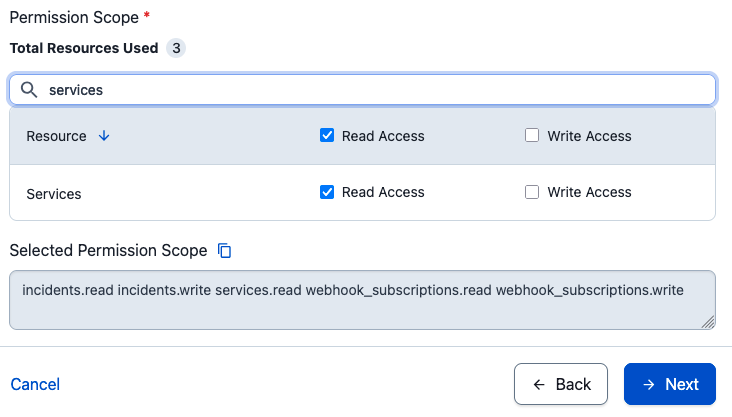
- Under Permissions, grant the minimum scopes:
incidents.read incidents.write services.read webhook_subscriptions.read webhook_subscriptions.write

Granting the minimum required OAuth scopes.
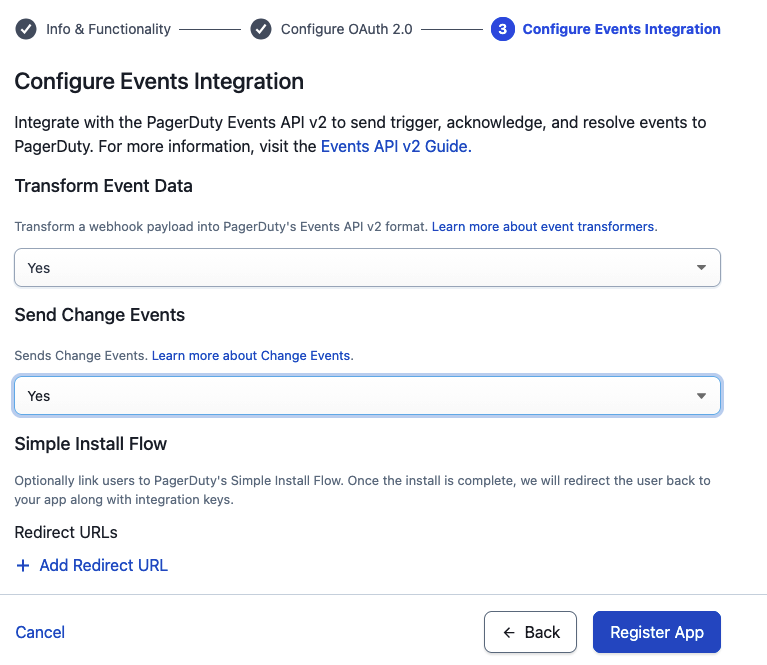
- Turn on Events Integration so AWS DevOps Agent and PagerDuty can talk in both directions

Turn on Events Integration for two-way communication.
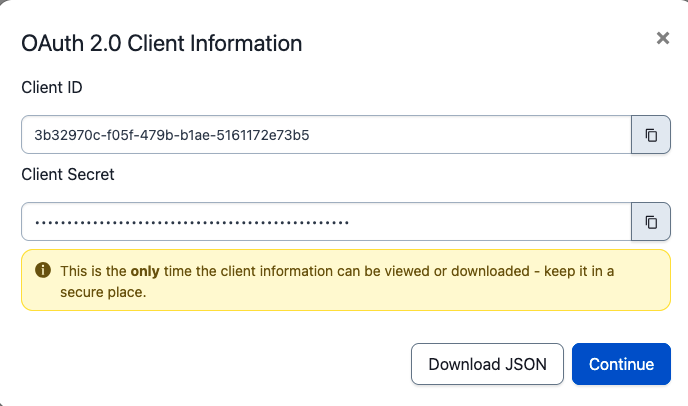
- Copy your Client ID and Client Secret. You’ll paste them into the AWS console in a minute

Copy the Client ID and Client Secret from PagerDuty.
Then, register PagerDuty in the AWS DevOps Agent console:
- In the AWS DevOps Agent console, open the Capability Providers page from the side navigation
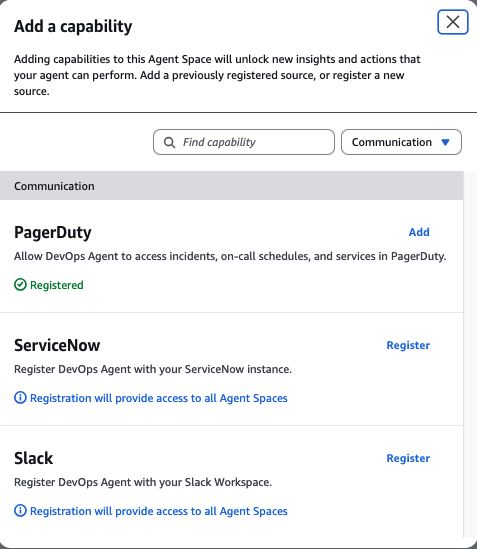
- In the Available providers section, find PagerDuty under Communication and choose Register

Find PagerDuty under Communication and choose Register.
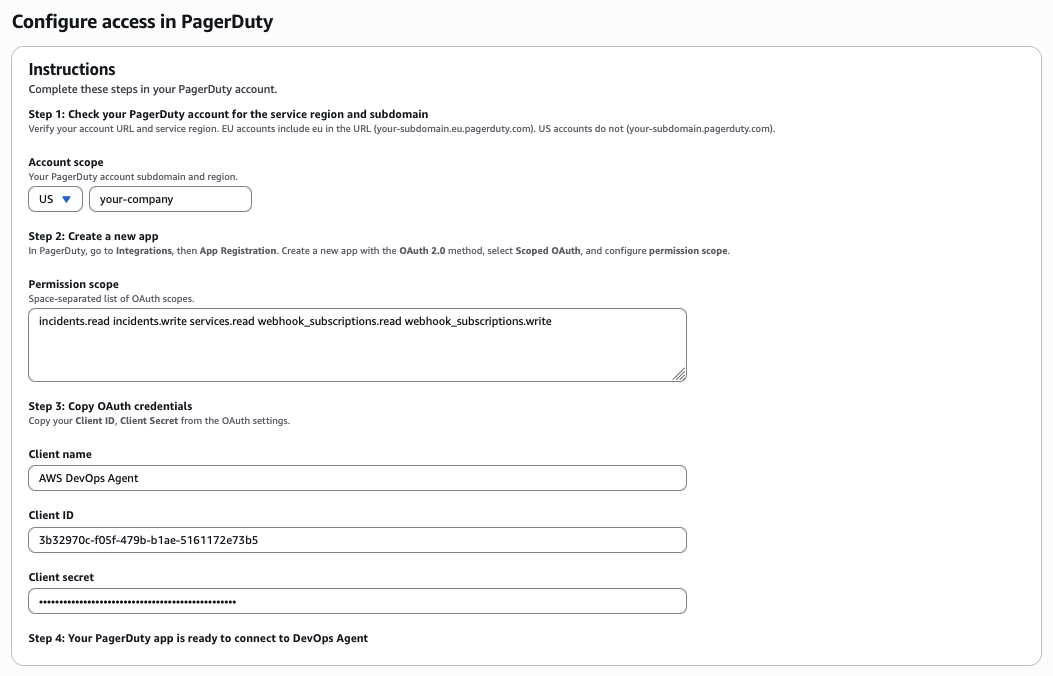
- On the Configure access in PagerDuty page, pick your PagerDuty region (US or EU) and enter your PagerDuty subdomain (if your PagerDuty URL is
https://your-company.pagerduty.com, the subdomain is your-company)
- Paste in the OAuth Client name, Client ID, and Client secret from PagerDuty. Confirm the minimum scopes (
incidents.read incidents.write services.read webhook_subscriptions.read webhook_subscriptions.write)

Enter your PagerDuty region, subdomain, and OAuth credentials.
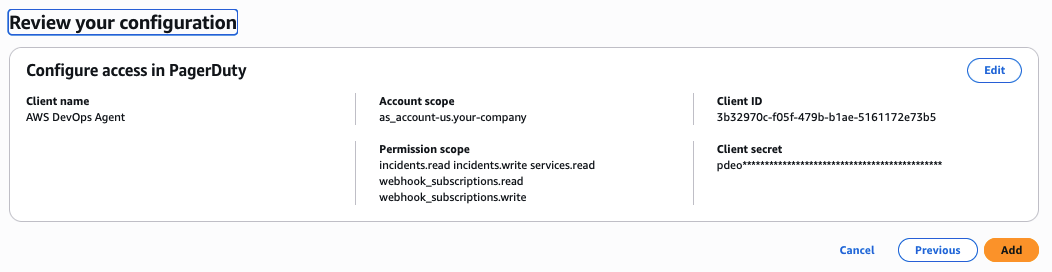
- Review the configuration and choose Add

Review the configuration and choose Add.
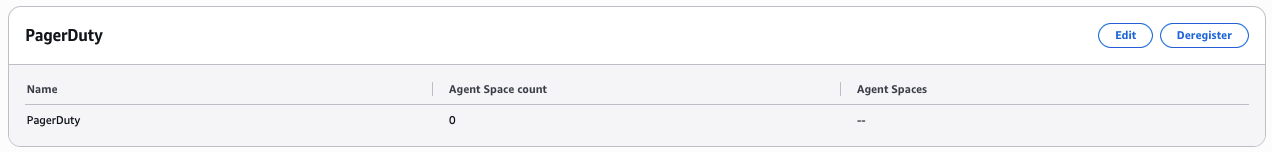
Once registration goes through, PagerDuty shows up under the Currently registered section of the Capability Providers page.

PagerDuty appears under Currently registered after registration.
Step 5: Add PagerDuty to your Agent Space
PagerDuty is registered at the account level. Now connect it to the Agent Space that needs it:
- In the AWS DevOps Agent console, pick your Agent Space
- Open the Capabilities tab
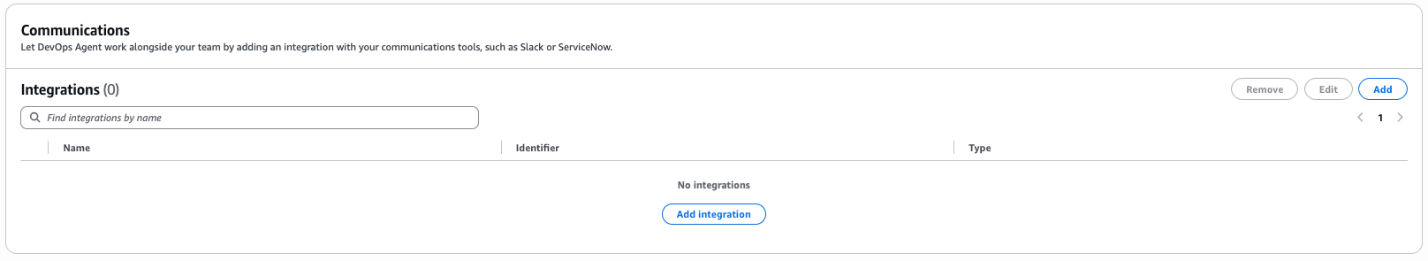
- In the Communications section, choose Add

On the Capabilities tab, choose Add in the Communications section.
- Select PagerDuty from the list of available providers

Select PagerDuty from the list of available providers.
- Choose Associate service
To update OAuth credentials or remove PagerDuty from an Agent Space, see the AWS DevOps Agent documentation.
Step 6: Add PagerDuty MCP Server and configure the agent skill
The Capability Provider from the previous steps handles the event flow. When a PagerDuty incident triggers, AWS DevOps Agent investigates and posts findings back to the originating PagerDuty incident. To let the agent also pull context from PagerDuty during those investigations, you add two things: the PagerDuty MCP server as a custom MCP capability, and an AWS DevOps Agent skill for working with PagerDuty that tells the agent when and how to use it.
Prerequisites:
- PagerDuty Advance license
- A PagerDuty User API token (generate one at User Settings > API Access in PagerDuty)
Add the PagerDuty MCP server:
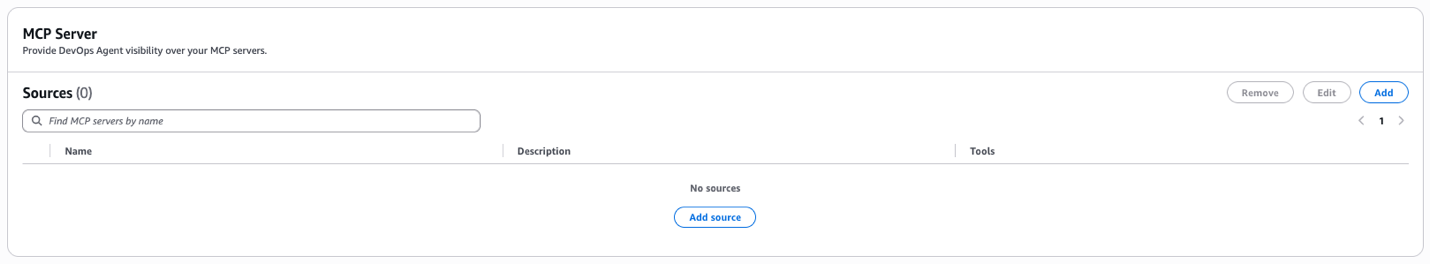
- In your Agent Space, go to Capabilities tab > MCP Servers

Open the MCP Servers section on the Capabilities tab.
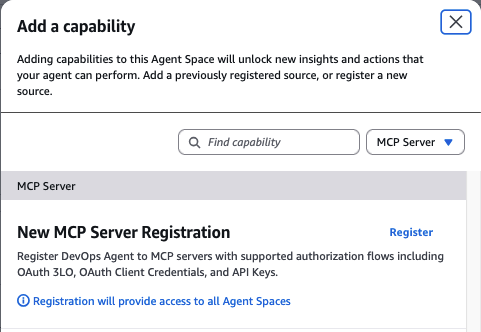
- Add a new custom MCP server with the following configuration:
- Server URL:
https://mcp.pagerduty.com/mcp
- For EU region PagerDuty accounts, use
https://mcp.eu.pagerduty.com/mcp instead
- Authentication: PagerDuty User API token in the format
Token token=<your-pagerduty-api-key>

Add a new custom MCP server.

Configure the server URL and PagerDuty User API token.
Add the AWS DevOps Agent skill for working with PagerDuty:
The MCP server gives the agent access to PagerDuty tools. The skill tells the agent when and how to use them during investigations.
- In your Agent Space, choose Operator access to open the web app in a separate browser window

Choose Operator access to open the web app.
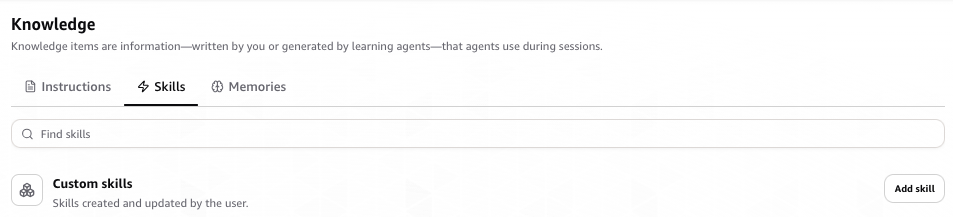
- In the Agent Space Operator web app, navigate to Knowledge and the Skills tab, then choose Add skill

On the Skills page, choose Add skill.
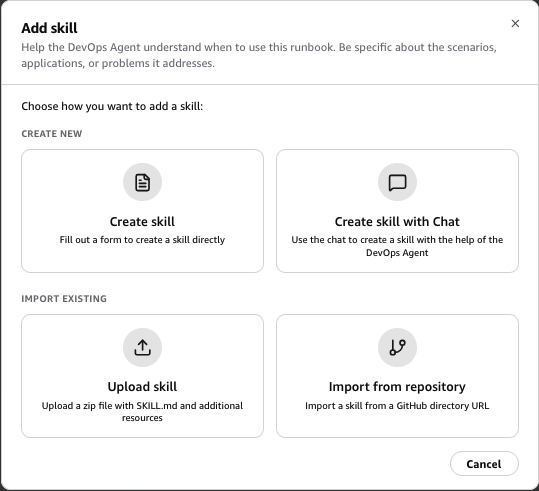
- You can select Create skill to create a skill through a wizard, interactively chat with the agent to create a skill, or upload a skill zip file if you already have one

Choose how to create the skill.
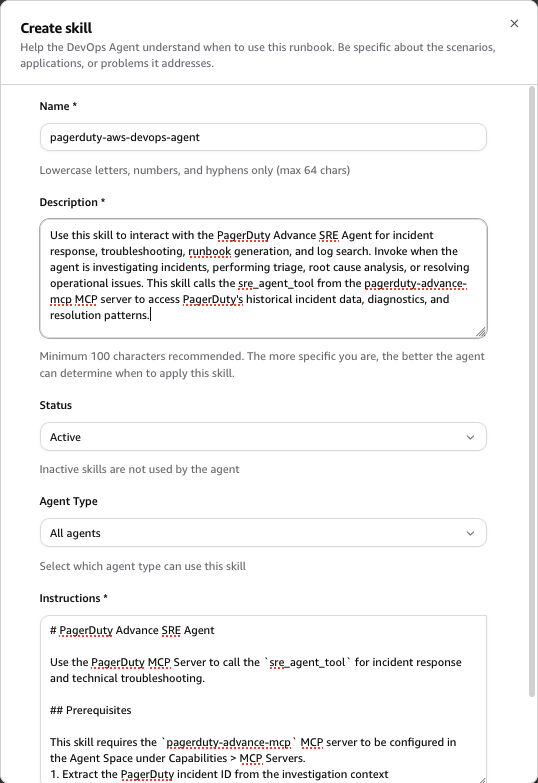
- Choose Create skill and fill out the skill instructions from the table below to create a skill

Fill out the skill instructions.
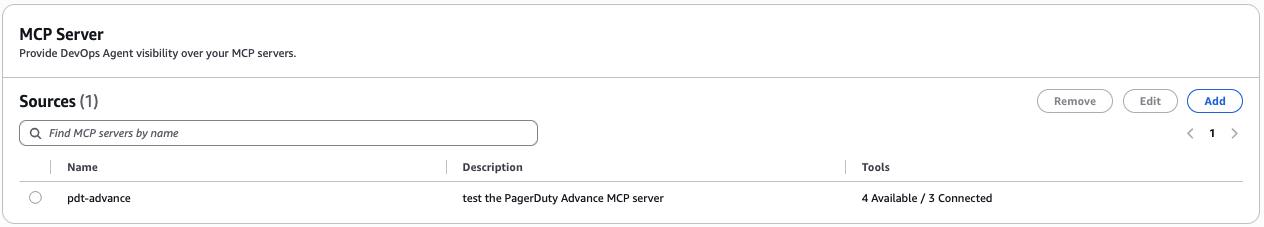
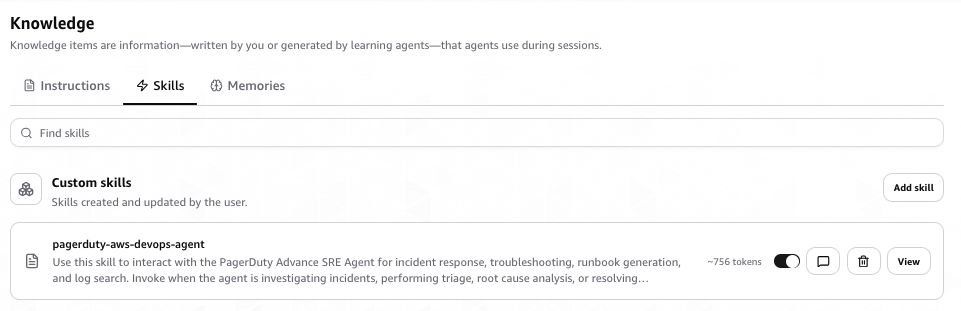
- You should see the pagerduty-aws-devops-agent skill added to the AWS DevOps Agent

The pagerduty-aws-devops-agent skill added to AWS DevOps Agent.
Skill form instructions:
| Field |
Value |
| Name |
pagerduty-aws-devops-agent |
| Description |
Use this skill to interact with the PagerDuty Advance SRE Agent for incident response, troubleshooting, runbook generation, and log search. Invoke when the agent is investigating incidents, performing triage, root cause analysis, or resolving operational issues. This skill calls the sre_agent_tool from the pagerduty-advance-mcp MCP server to access PagerDuty’s historical incident data, diagnostics, and resolution patterns. |
| Status |
Active |
| Agent Type |
Generic |
| Instructions |
See the skill instructions code block below. |
Skill instructions (paste into the Instructions field):
# PagerDuty Advance SRE Agent

Use the PagerDuty MCP Server to call the `sre_agent_tool` for incident response and technical troubleshooting.

## Prerequisites

This skill requires the `pagerduty-advance-mcp` MCP server to be configured in the Agent Space under Capabilities > MCP Servers.

1. Extract the PagerDuty incident ID from the investigation context
2. Call the `sre_agent_tool` from the `pagerduty-advance-mcp` MCP server with:
   - `message`: a natural language question about the incident
   - `incident_id`: the PagerDuty incident ID
3. If follow-up queries are needed, continue calling `sre_agent_tool` with the same `incident_id` and a new `message`. Pass the `session_id` from the previous response to maintain conversation

## Tool Details

- **Tool name:** `sre_agent_tool`
- **MCP Server:** `pagerduty-advance-mcp`
- **Parameters:**
  - `message` (string, required) — natural language question about the incident
  - `incident_id` (string, required) — the PagerDuty incident ID
  - `session_id` (string, optional) — reuse from previous response for conversation continuity

## What the SRE Agent Can Help With

- Active incident analysis, triage, and resolution
- Root cause analysis and technical explanations
- Incident summaries and catch-ups
- Status updates for stakeholders
- Diagnostic checks and remediation recommendations
- Log interpretation and troubleshooting guidance
- Alert trigger analysis and explanations
- Change event analysis and impact assessment
- Playbook and runbook generation
- Past incident correlation and pattern recognition
- Service dependencies and related system analysis
- Real-time incident monitoring and alerting questions
Step 7: Test and validate
Before you call it finished, confirm things work end to end:
- Create a test incident in PagerDuty
- Confirm AWS DevOps Agent picks up the event and starts an investigation
- Watch the investigation move along in the AWS DevOps Agent console or web app
- Review the root cause summary, the mitigation plan, and the investigation findings
- Verify that root cause analysis and mitigation steps appear on the originating PagerDuty incident record. If you’ve also connected Slack, check that updates land in your configured channel
Start with a limited scope for your initial Agent Space. Focus on a single application or service first. Get comfortable with the integration, tune your configuration, and then expand from there.
Troubleshooting
A handful of things we’ve seen trip people up:
Registration fails with invalid credentials. Double-check that the Client ID and Client secret were copied from the right PagerDuty OAuth 2.0 Scoped OAuth app. Legacy PagerDuty OAuth apps (the ones configured with a redirect URI) aren’t supported. When credentials do need to change, deregister from the Capability Providers page and re-register with the new values, rather than trying to edit in place.
Webhook events don’t trigger an investigation. AWS DevOps Agent only supports PagerDuty V3 webhooks. If your PagerDuty subscription is still on an older webhook version, upgrade to V3. Full details live in Webhooks Overview in the PagerDuty developer documentation.
PagerDuty shows as registered, but isn’t active in an Agent Space. Registering at the account level and adding the provider to an Agent Space are two separate actions. On the Agent Space’s Capabilities tab, check that PagerDuty appears under Communications. If it doesn’t, add it there.
Region or subdomain mismatch. If your PagerDuty account is on the EU service region, make sure you picked EU during registration. The subdomain has to match the first label of your PagerDuty URL exactly (for example, your-company from https://your-company.pagerduty.com).
Conclusion
Most of what happens in the first several minutes of incident response is undifferentiated heavy lifting like opening dashboards, tailing logs, correlating deployments with AWS CloudTrail events. With the native PagerDuty Capability Provider in AWS DevOps Agent, investigations automatically begin by the time you’ve acknowledged your alert, giving your engineers a head start on root cause analysis before responders have finished triaging.
To get started, check out the AWS DevOps Agent documentation or reach out to your PagerDuty or AWS account team.
Resources
About the authors
 |
Shan Kandaswamy
Shan is a Senior Partner Solutions Architect specializing in generative AI at AWS, dedicated to solving complex user challenges. He advocates for innovative AI solutions, distributed architecture, and serverless technologies, helping users harness the power of generative AI in their cloud journey. You can reach him on LinkedIn.
|
 |
Laith Al-Saadoon
Laith Al-Saadoon is a Principal AI Engineer at AWS. He created and launched AWS MCP Servers (30M+ PyPI downloads) and contributes to Strands Agents SDK — AWS’s open-source framework for building AI agents — along with other agentic AI open-source projects like Mem0 and Agno. He drives AWS’s autonomous software development and agentic AI strategy and builds production agentic systems that make agents work for the world’s largest companies. In his personal time, Laith enjoys the outdoors — fishing, photography, drone flights, and hiking with his wife.
|
|
Scott Schreckengaust
Scott Schreckengaust brings a biomedical engineering degree and decades of deep domain expertise in healthcare and life sciences to emerging technologies and AI. He’s spent his career building—from automating lab workflows and integrating enterprise systems to architecting full-stack software deployments in regulated environments. Now working as an AI engineer, Scott continues what he’s always done best: partner with customers to uncover their scientific and operational challenges, then engineer solutions that scale. His journey from the bench to the cloud reflects a consistent belief: the best technology is invisible—it just works.
|