Configure domain-level VPC networking in Amazon SageMaker Unified Studio

Post Syndicated from Prasad Nadig original https://aws.amazon.com/blogs/big-data/configure-domain-level-vpc-networking-in-amazon-sagemaker-unified-studio/

Enterprise operations teams that run domain-level VPC networking in Amazon SageMaker Unified Studio often support dozens of projects spanning data engineering, analytics, and machine learning (ML) teams. Each project requires private connectivity to internal databases, Amazon Simple Storage Service (Amazon S3) buckets, and AWS services. Without a domain-level Amazon Virtual Private Cloud (Amazon VPC) configuration, project owners coordinate with the networking team individually. This piecemeal approach leads to inconsistent subnet choices, missing VPC endpoints, connectivity failures that are hard to troubleshoot, and a network posture that is difficult to audit.

With domain-level VPC networking, you configure the network once, and all new projects get the right network immediately upon creation. In this post, you learn how to:

  • Configure SageMaker Unified Studio domain-level VPC networking.
  • Select subnets and security groups that provide multi-Availability Zone (multi-AZ) resilience.
  • Update projects that have no VPC to inherit the domain VPC, and understand when a project must be recreated instead.
  • Validate network connectivity from within a project.

In this post, you learn how to configure VPC networking for a SageMaker Unified Studio domain that uses AWS Identity and Access Management (IAM)-based authentication. You see how network components map to domain and project resources, and how to plan a configuration that balances security, connectivity, and operational simplicity.

Solution overview

Domain-level VPC networking provides a single network configuration that applies to all new projects in the domain. Projects automatically inherit the VPC settings, including subnets, security groups, and connectivity to AWS services through VPC endpoints. Existing projects are an exception and are handled separately (see Step 3).

The following diagram shows a single VPC with private subnets across two Availability Zones configured at the domain level, with data engineering, analytics, and ML projects all inheriting that configuration.
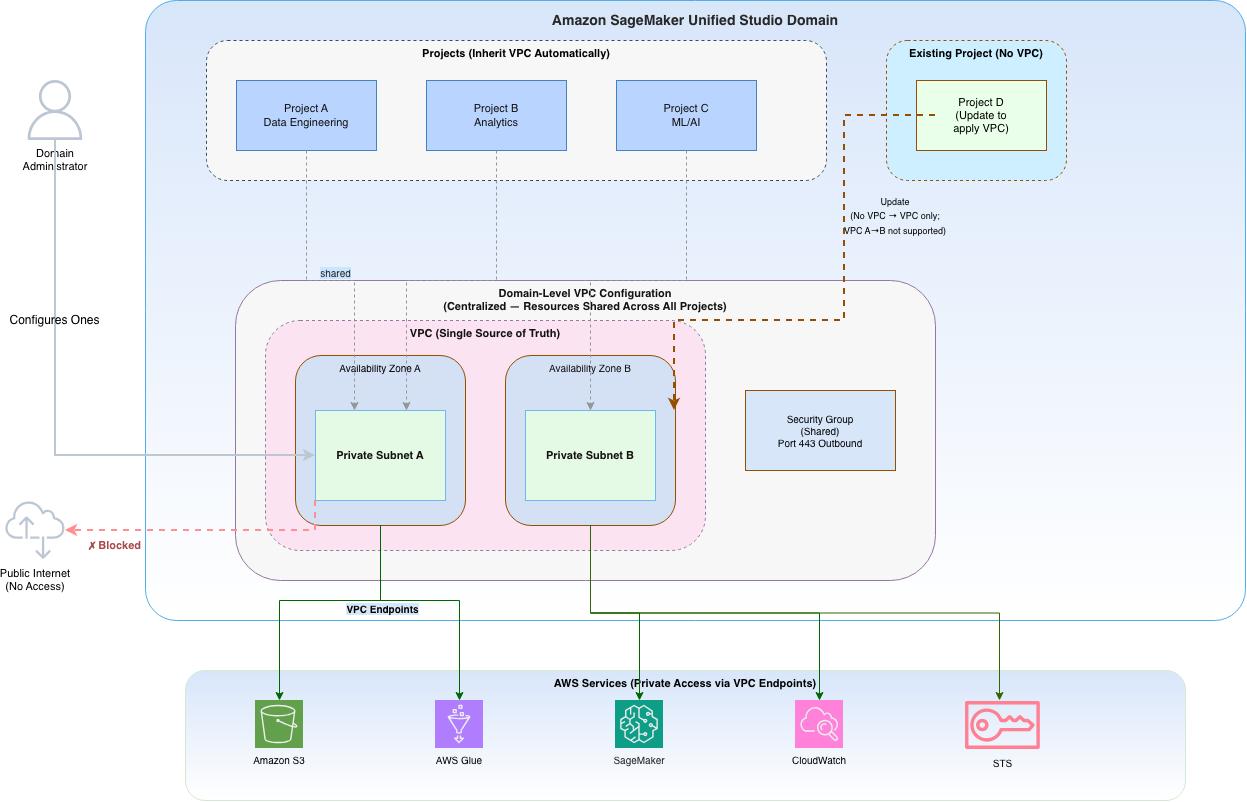
Architecture diagram showing domain-level VPC configuration in Amazon SageMaker Unified Studio with private subnets across two Availability Zones.

Figure 1: Domain-level VPC configuration in Amazon SageMaker Unified Studio. A single VPC with private subnets across two Availability Zones is configured at the domain level. All projects (data engineering, analytics, ML) inherit this configuration automatically

Key benefits of this approach:

  • Configure once, apply across projects: New projects inherit the domain VPC without manual intervention.
  • Consistent security posture: A single network boundary covers all data, analytics, and ML workloads.
  • Simplified auditing: One VPC to audit rather than one per project. Turn on VPC Flow Logs and review AWS CloudTrail events for network-level auditing.
  • Reduced operational overhead: Project teams start working immediately without submitting networking requests.

The following AWS services are used in this solution:

Prerequisites

Before configuring domain-level VPC networking, verify you have the following:

  • Domain administrator permissions for Amazon SageMaker Unified Studio.
  • An existing VPC with the following requirements:
    • At least two private subnets in different Availability Zones.
    • DNS hostnames and DNS support enabled.
    • At least five available IP addresses per expected Amazon SageMaker Unified Studio project. This is a baseline minimum. Workloads using AWS Glue, Amazon EMR, or Amazon Redshift Serverless consume additional elastic network interfaces (ENIs) per worker or node. We recommend /24 or larger subnets for production domains and forward-looking capacity planning based on your expected users and compute types. For detailed guidance, see How to set up a network-isolated VPC for Amazon SageMaker Unified Studio.
  • VPC endpoints configured for the AWS services your projects access (for example, Amazon S3, AWS Glue, Amazon SageMaker AI).
  • Private DNS enabled on all interface VPC endpoints (you must enable this so that service DNS names resolve to private IPs). If you use centralized VPC endpoints through AWS Resource Access Manager (AWS RAM) or AWS Transit Gateway, configure Amazon Route 53 Resolver inbound endpoints instead.
  • S3 gateway endpoint route table associations configured for all selected private subnets (without this, S3 access fails in subnets whose route table lacks the prefix-list route).
  • A security group (optional), if not provided, SageMaker Unified Studio creates one automatically.
  • The SageMakerStudioAdminIAMConsolePolicy managed policy (or equivalent permissions including ec2:Describe*, ec2:CreateSecurityGroup, and datazone:* actions) attached to the domain administrator IAM role. See SageMakerStudioAdminIAMConsolePolicy in the AWS Managed Policy Reference for the full permission set.

Note: The VPC must be in the same AWS Region as the domain.

For detailed guidance on VPC networking configuration, see Configure VPC networking for IAM-based domains in the SageMaker Unified Studio Administrator Guide.

VPC endpoint requirements

Because your subnets are private (no internet gateway route), compute resources access AWS services through VPC endpoints. At a minimum, configure the following interface and gateway endpoints (add Amazon Athena, AWS Lake Formation, or Amazon Redshift endpoints if you use them in your projects):

Endpoint Type Purpose
com.amazonaws.region.s3 Gateway S3 access for data storage
com.amazonaws.region.glue Interface AWS Glue job connectivity
com.amazonaws.region.sagemaker.api Interface SageMaker API calls
com.amazonaws.region.sagemaker.runtime Interface Model inference
com.amazonaws.region.logs Interface Amazon CloudWatch Logs
com.amazonaws.region.monitoring Interface Amazon CloudWatch metrics
com.amazonaws.region.sts Interface IAM role assumption
com.amazonaws.region.datazone Interface Amazon SageMaker Unified Studio service connectivity
com.amazonaws.region.ecr.api Interface ECR API calls (container image metadata)
com.amazonaws.region.ecr.dkr Interface ECR image layer pulls (Docker registry)
com.amazonaws.region.kms Interface AWS Key Management Service (AWS KMS) encryption/decryption operations

Note: Interface endpoints incur an hourly charge per Availability Zone plus data processing fees. Gateway endpoints (such as S3) have no hourly charge. Factor endpoint count and AZ spread into your cost estimate.

For a comprehensive list of all mandatory and optional VPC endpoints for a fully network-isolated setup, see How to set up a network-isolated VPC for Amazon SageMaker Unified Studio. For current pricing details, see AWS PrivateLink pricing.

Note: Review your account’s service quotas for interface VPC endpoints per VPC (default 50) and ENIs per Region before scaling. Request increases through Service Quotas if needed.

Solution walkthrough

The following steps walk you through configuring the domain VPC and validating it, from signing in to the console through confirming private connectivity from a project.

Step 1: Sign in and navigate to networking settings

  1. Sign in to the AWS Management Console as your Amazon SageMaker Unified Studio domain administrator (the IAM role designated as the domain login role).
  2. Open the Amazon SageMaker console.
  3. Use the Region selector in the top navigation bar to select the Region where your domain exists.
  4. On the Amazon SageMaker Unified Studio landing page, choose Open to launch your IAM-based domain.

The following screenshot shows the Amazon SageMaker Unified Studio landing page, where you choose Open to launch the domain.
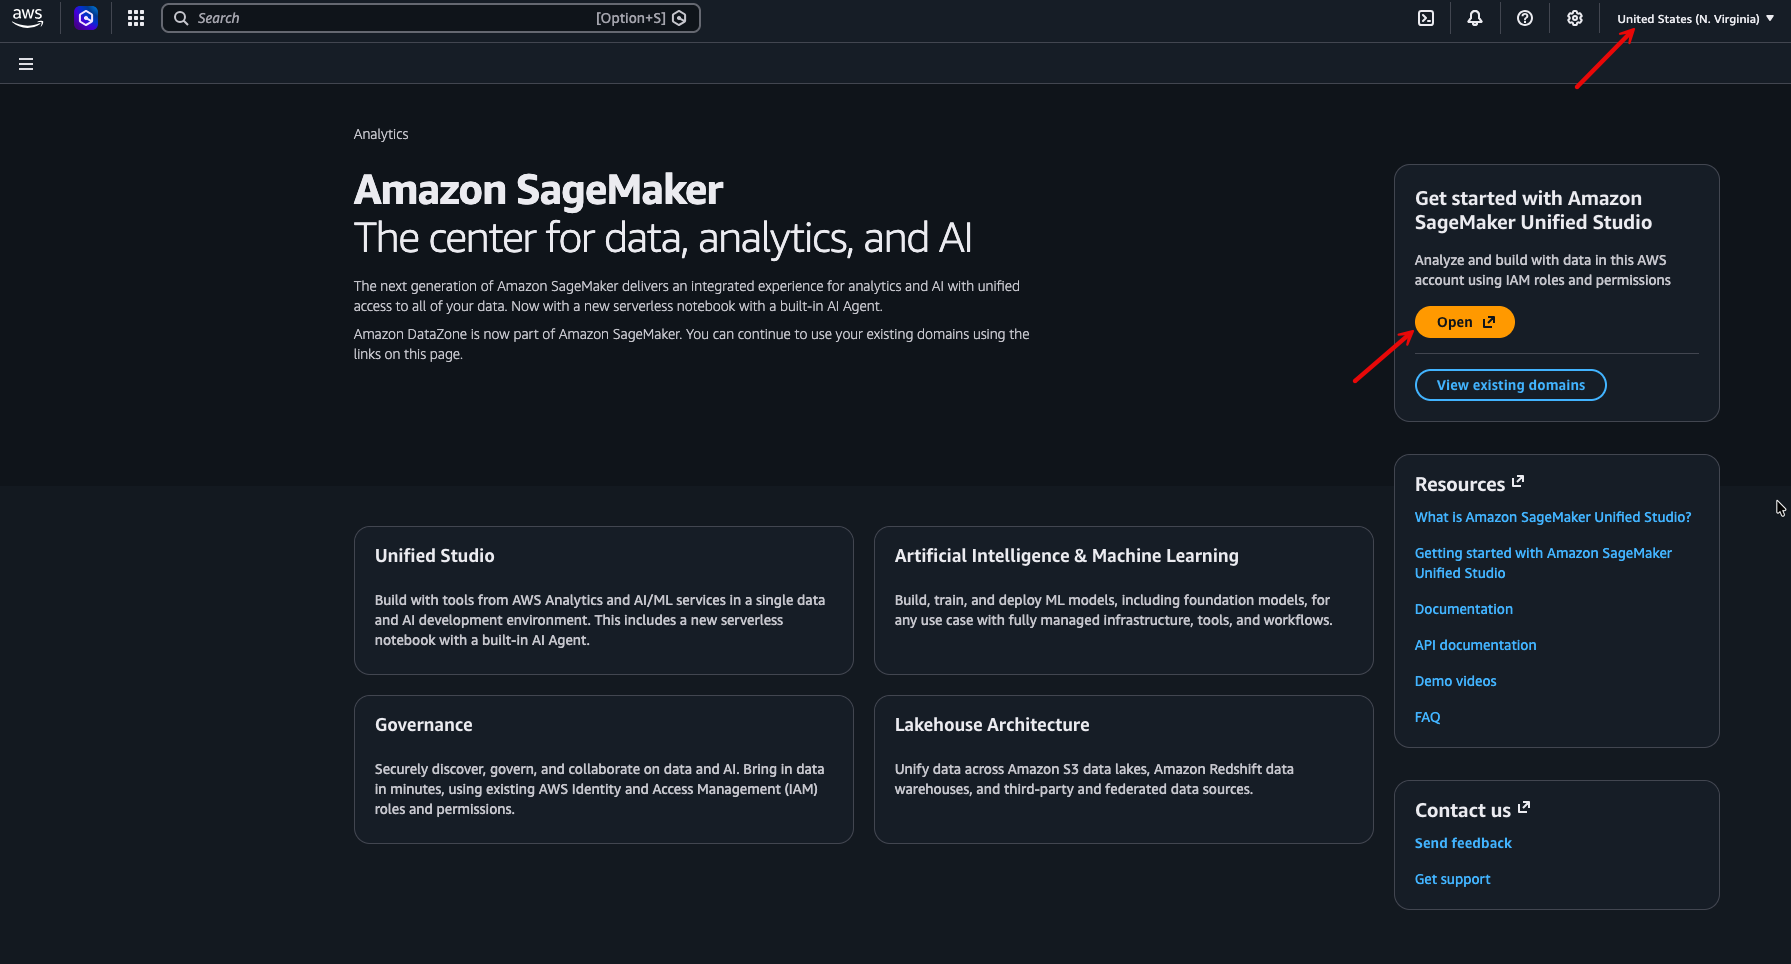
Amazon SageMaker Unified Studio landing page with the Open button to launch the IAM-based domain.

Figure 2: Amazon SageMaker Unified Studio landing page with the Open button to launch the IAM-based domain

  1. From the navigation pane, choose Domain management.

The following screenshot shows Domain management in the navigation pane.
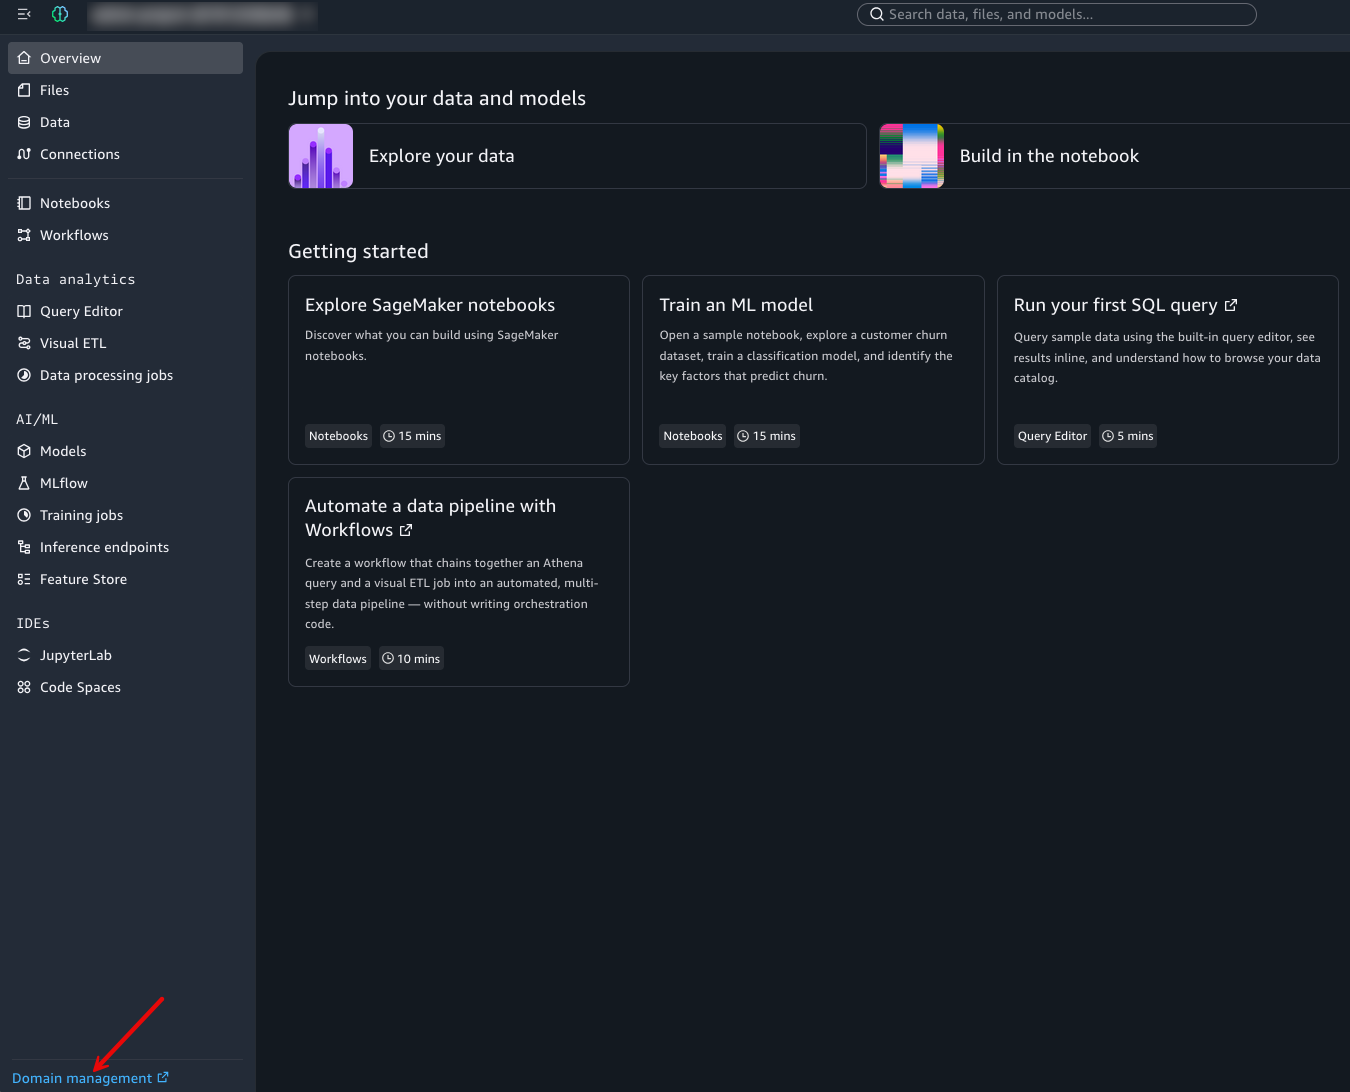
Navigation pane showing Domain management link in Amazon SageMaker Unified Studio.

Figure 3: Domain management on navigation pane

Note: Access to the domain administration page is restricted to the IAM role specified as the domain login role during domain creation.

Step 2: Add VPC configuration

  1. In the navigation pane, choose Settings. In the Networking in this account section, choose Add VPC.

The following screenshot shows the Networking in this account section with the Add VPC button.
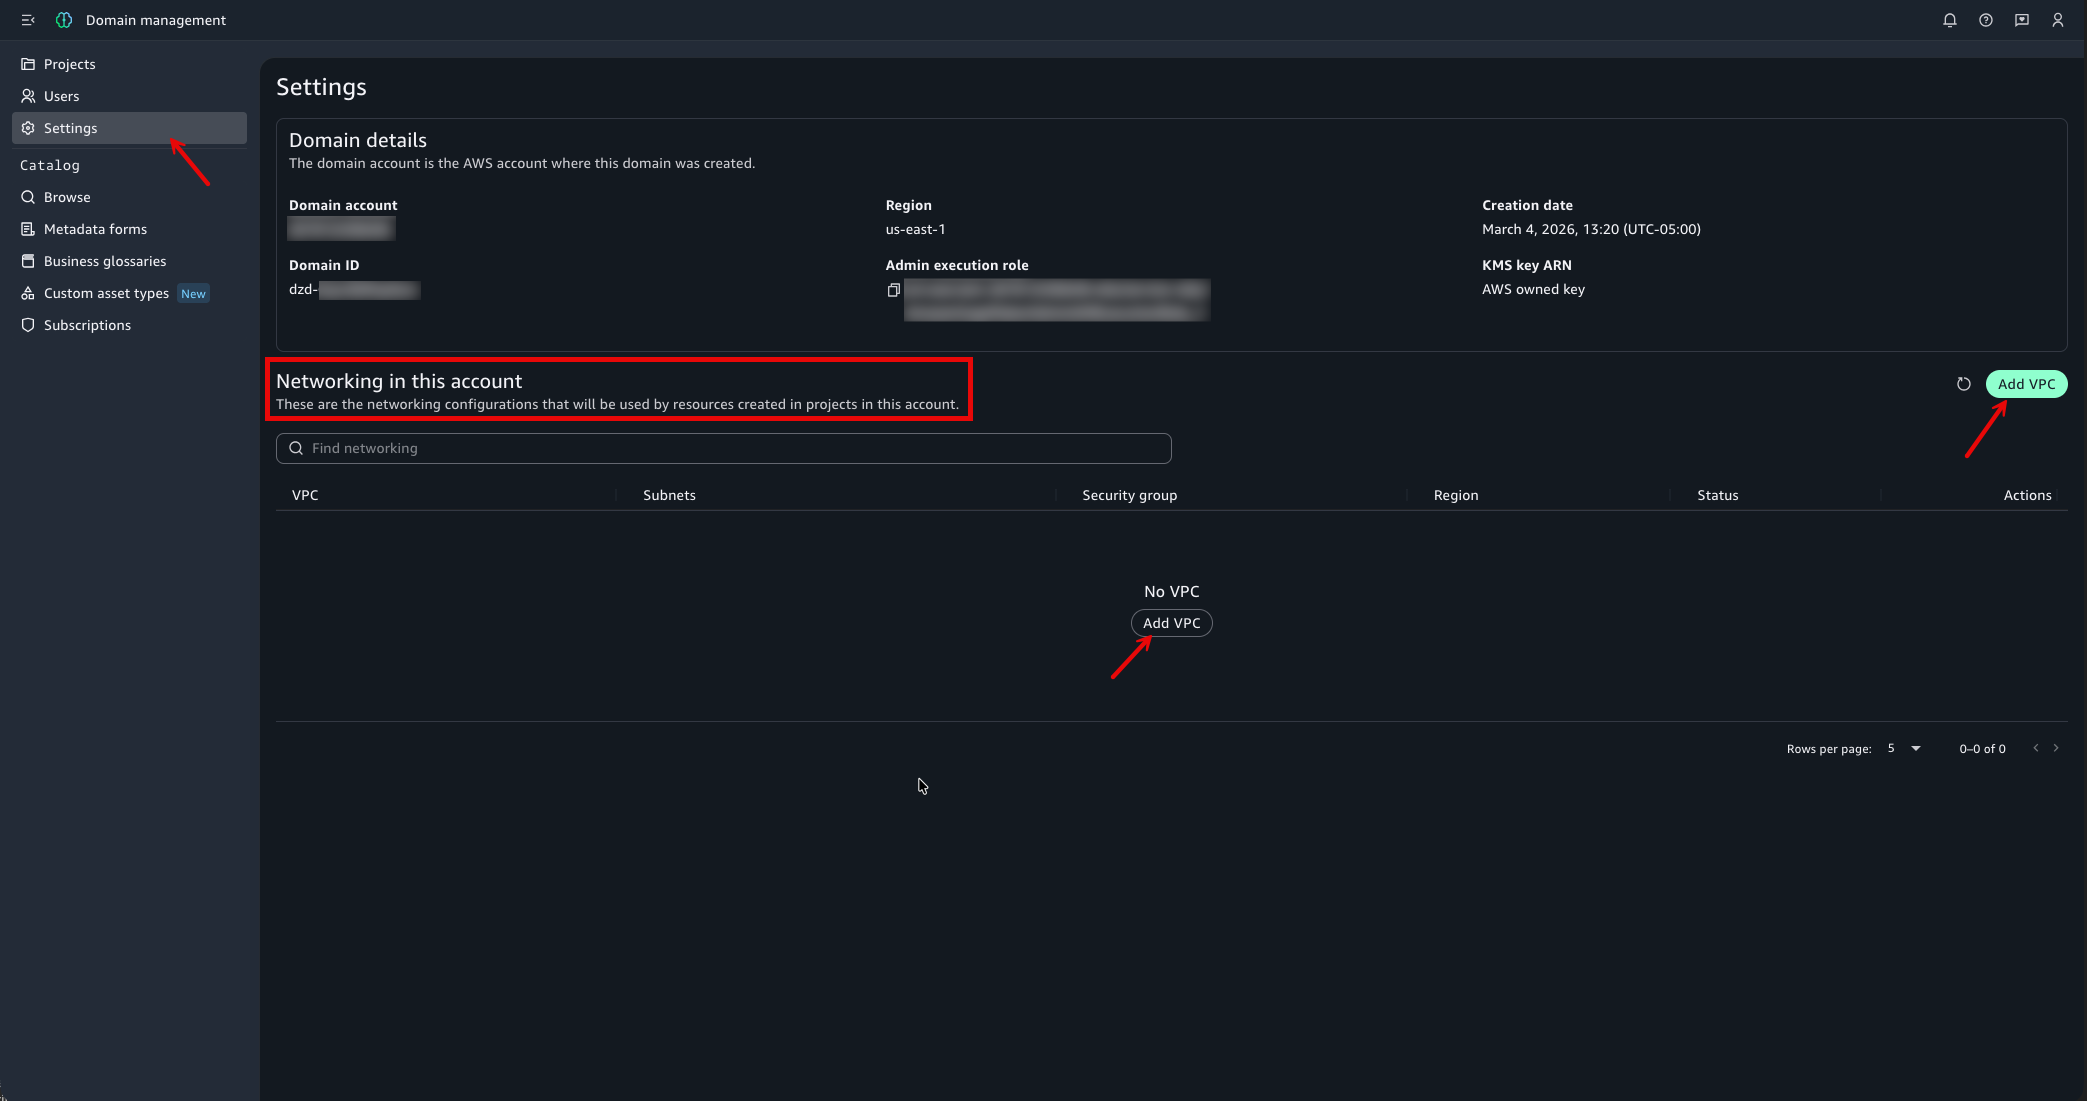
Domain management Settings page showing the Networking in this account section with Add VPC button.

Figure 4: Domain management Settings page showing the Networking in this account section to add a VPC

  1. For VPC, select the VPC with connectivity to your compute, database, and storage resources. If no VPC exists, choose Create VPC to provision one using AWS CloudFormation.
  2. For Subnets, select a minimum of two private subnets in different Availability Zones.
  3. (Optional) For Security group, select a security group to control inbound and outbound traffic. If you don’t choose one, SageMaker Unified Studio creates one automatically.
  4. Choose Save.
  5. Verify the VPC configuration status shows Ready in the Networking in this account section.

The following screenshots show the Add VPC dialog and the resulting Ready status in the Networking in this account section.
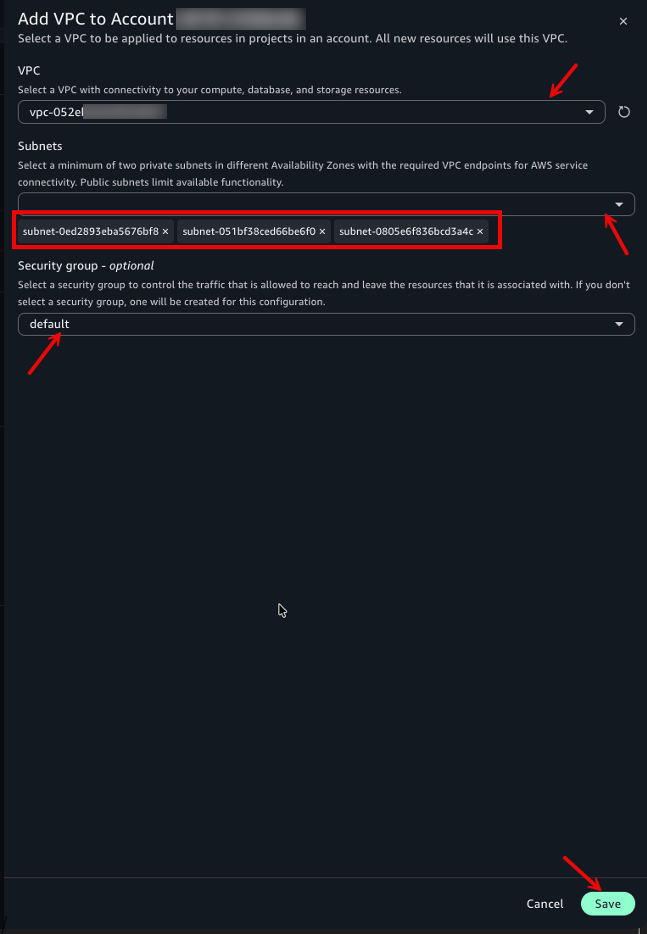
Add VPC dialog with fields for VPC, subnets, and security group selection.

Figure 5: Add VPC dialog with fields for VPC, subnets, and security group selection

VPC configuration status showing Ready in the Networking in this account section.

Figure 6: VPC configuration status showing Ready in the Networking in this account section

Note: IAM-based domains support only one VPC configuration at a time. AWS IAM Identity Center-based domains can have a VPC per Region. For details, see Configure VPC networking for IAM-based domains in the SageMaker Unified Studio Administrator Guide.

New projects created in the domain now automatically use the saved VPC configuration. Existing projects are an exception. See Step 3 to update them.

Step 3: Update existing projects

Existing projects don’t automatically inherit the domain VPC configuration. How you apply the new settings depends on the project’s current state:

Projects with no VPC configured – Update in place to adopt the domain VPC. See the following steps.

Projects that already have a VPC – These can’t be switched to a different VPC configuration. To adopt the domain VPC:

  1. Create a new project (which inherits the domain VPC automatically).
  2. Recreate connections in the new project.
  3. Migrate assets from the old project.
  4. Back up any data you need, then delete the original project.

Because recreation can disrupt in-progress work and doesn’t migrate project data automatically, schedule this as a planned maintenance window.

To update a project that currently has no VPC configured:

  1. From the domain administration page, choose Projects in the navigation pane.
  2. Choose the project you want to update.
  3. On the project detail page, a banner appears: “Configurations have changed. Please update this project to access the latest configuration.”
  4. In the banner, choose Update.
  5. Confirm the update when prompted.

Repeat this process for each existing project that should use the domain VPC. The following screenshot shows the project detail page with the configuration update banner.
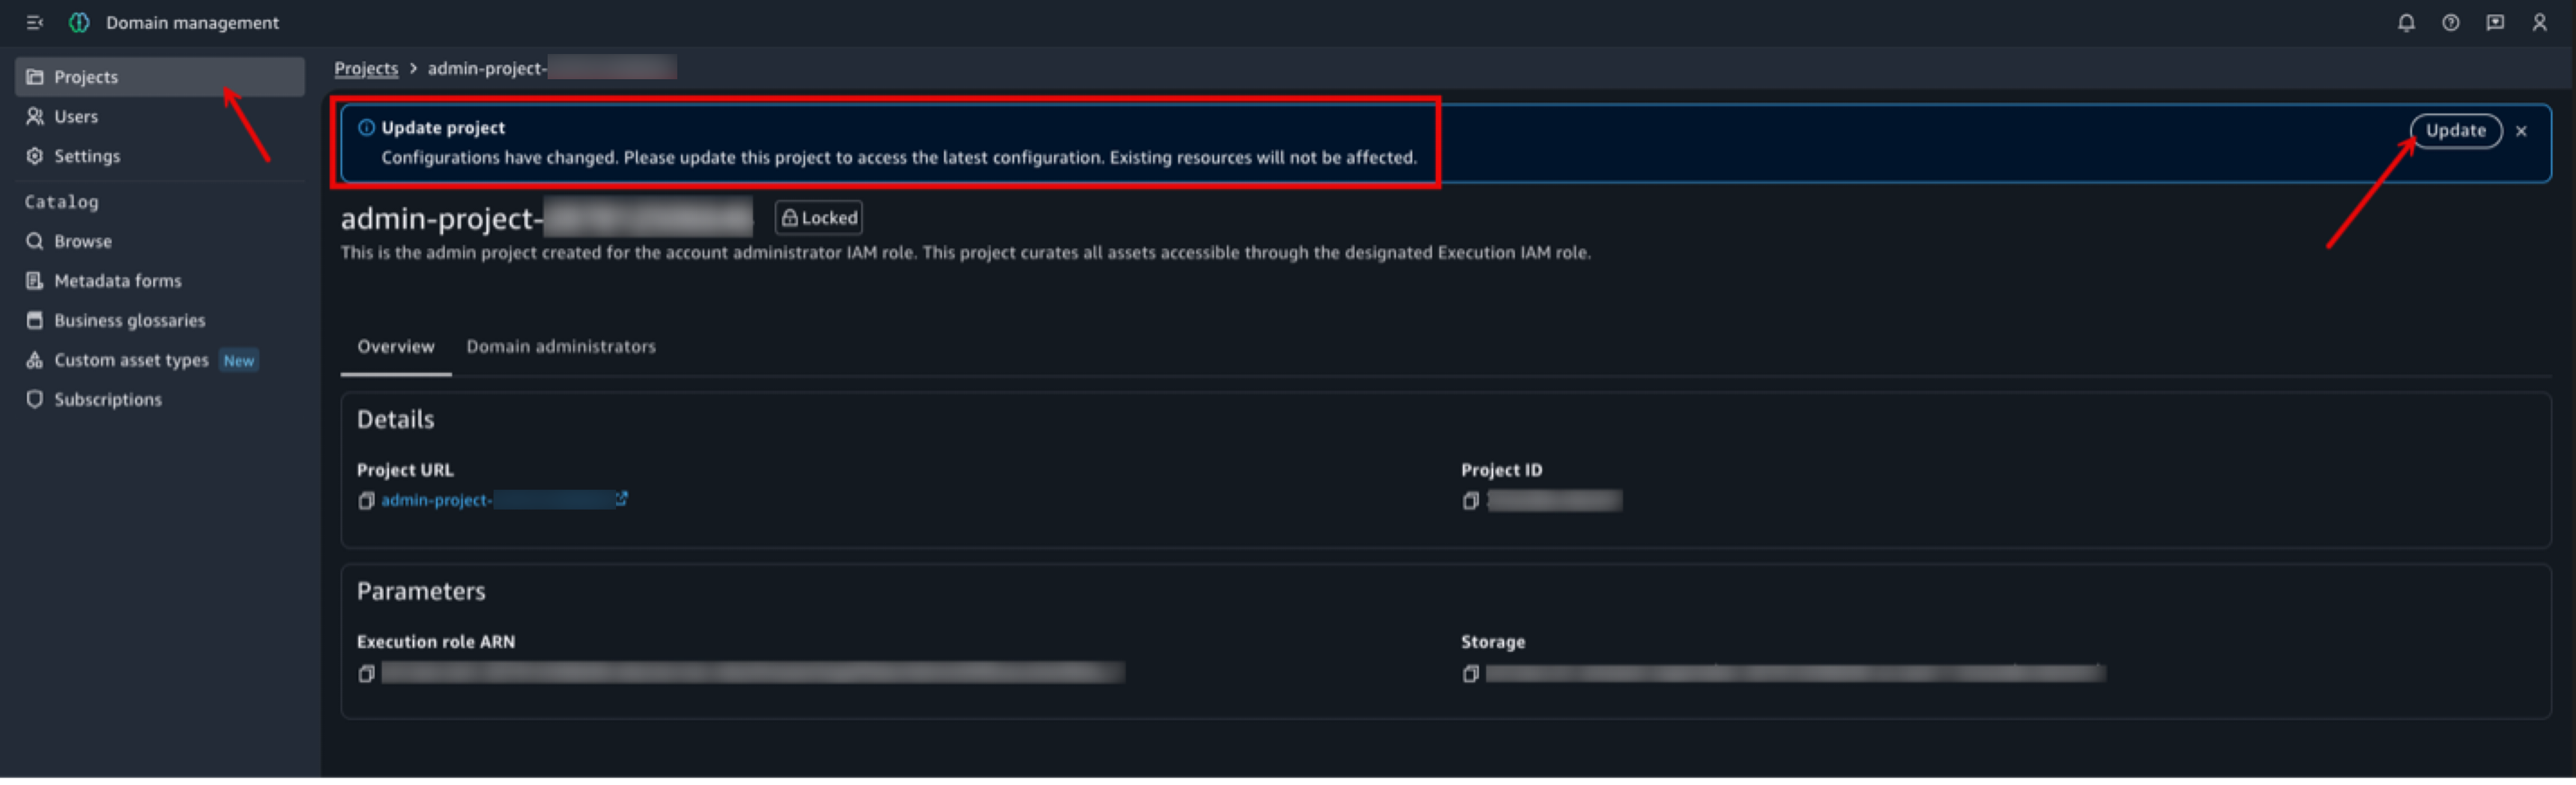
Project detail page showing the update banner for VPC configuration changes.

Figure 7: Project detail page showing the configuration update banner

Step 4: Validate connectivity

After configuring the domain VPC and updating your projects, verify connectivity. Compute resources should have private connectivity to AWS services through the VPC, without any additional project-level network configuration.

Create a notebook in one of your projects as shown in the following figure and run the following code:
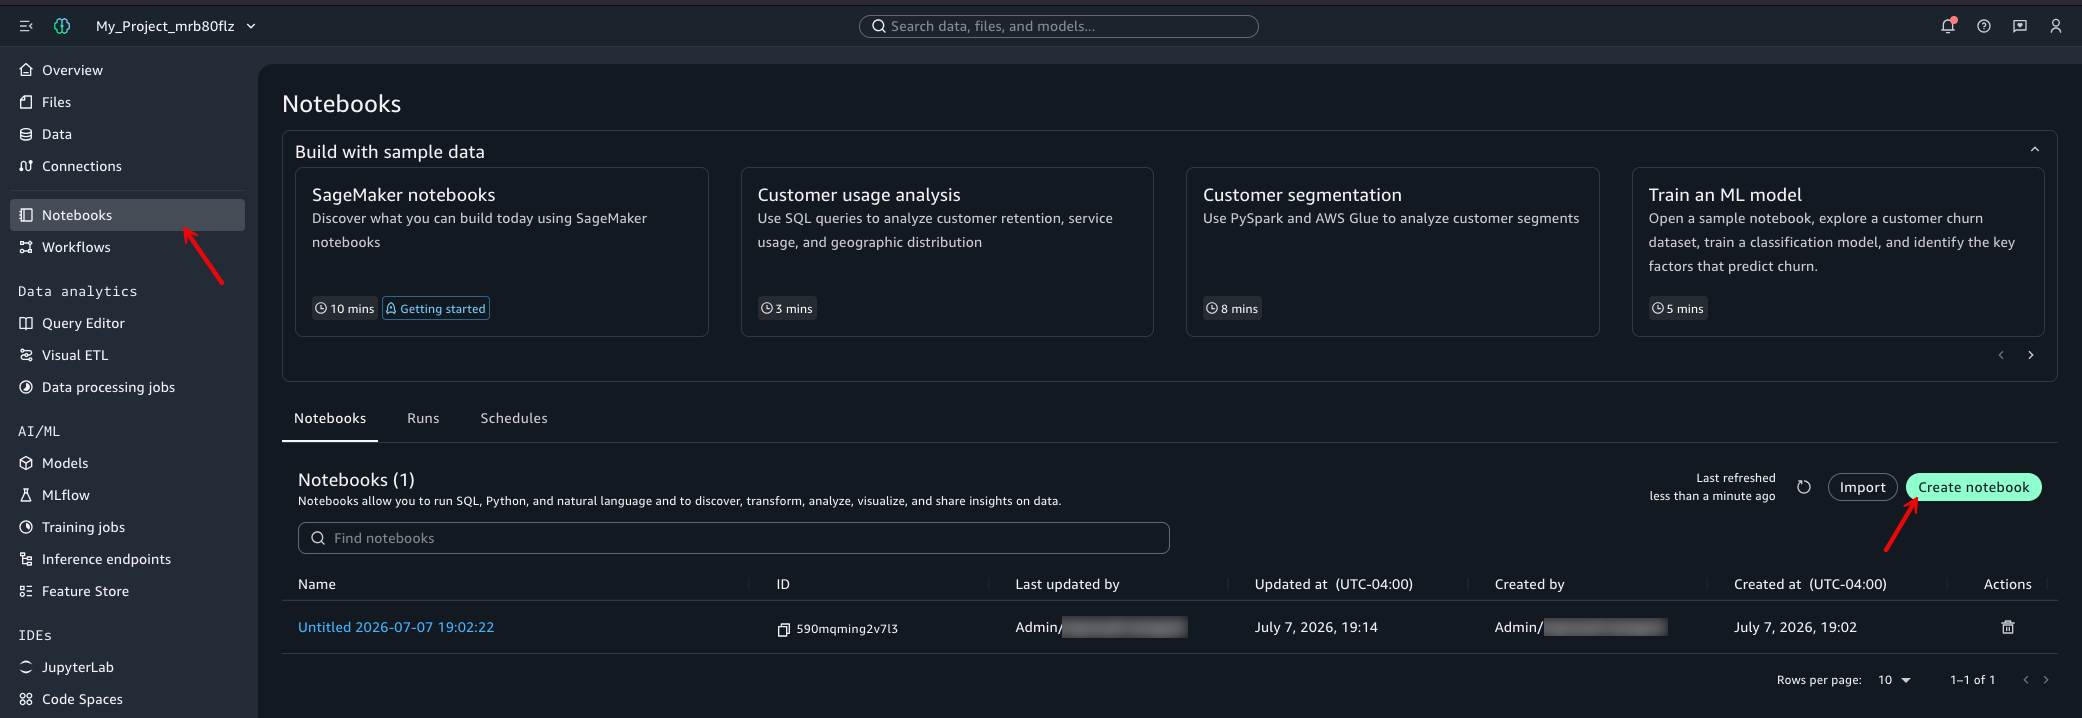
Creating a notebook in a SageMaker Unified Studio project to validate VPC connectivity.

Figure 8: Creating a notebook in a SageMaker Unified Studio project to validate VPC connectivity

Requirements: Python 3.8+, Boto3 1.26 or later. Run in a notebook within your SageMaker Unified Studio project.

import boto3
import socket
import ipaddress

def validate_vpc_connectivity():
    """Validate that the project has private connectivity to AWS services
    through the domain-level VPC configuration."""

    results = {}
    region = boto3.session.Session().region_name
    if not region:
        raise RuntimeError('Could not determine AWS Region. Run this notebook inside a SageMaker Unified Studio project.')

    # Test Amazon S3 access via VPC endpoint
    try:
        s3 = boto3.client('s3')
        response = s3.list_buckets()
        results['S3'] = f"[PASS] Accessible ({len(response['Buckets'])} buckets)"
    except Exception as e:
        results['S3'] = f"[FAIL] Failed: {e}"

    # Test AWS Glue access via VPC endpoint
    try:
        glue = boto3.client('glue')
        dbs = glue.get_databases()
        results['Glue'] = f"[PASS] Accessible ({len(dbs['DatabaseList'])} databases)"
    except Exception as e:
        results['Glue'] = f"[FAIL] Failed: {e}"

    # Test STS (role assumption through VPC endpoint)
    try:
        sts = boto3.client('sts')
        identity = sts.get_caller_identity()
        results['STS'] = f"[PASS] Accessible (Account: {identity['Account']})"
    except Exception as e:
        results['STS'] = f"[FAIL] Failed: {e}"

    # Verify interface endpoint resolves to private IP
    try:
        sts_endpoint = f"sts.{region}.amazonaws.com"
        addr_info = socket.getaddrinfo(sts_endpoint, 443, family=socket.AF_INET)
        ip = addr_info[0][4][0]
        is_private = ipaddress.ip_address(ip).is_private
        if is_private:
            results['DNS Resolution'] = f"[PASS] Private IP ({ip}) (traffic stays on AWS network)"
        else:
            results['DNS Resolution'] = f"[WARN] Public IP ({ip}) - check VPC endpoint config"
    except Exception as e:
        results['DNS Resolution'] = f"[FAIL] Failed: {e}"

    # Print results
    print("-" * 40)
    print("Domain VPC Connectivity Validation")
    print("-" * 40)
    for service, status in results.items():
        print(f" {service}: {status}")
    print("-" * 40)
    print(f"\n Region: {region}")

    # Check if all tests passed
    all_passed = all("[PASS]" in status for status in results.values())
    has_warn = any("[WARN]" in status for status in results.values())
    if all_passed:
        print(f"\n [PASS] All services accessible via private VPC endpoints.")
        print(f" This project inherited its network configuration")
        print(f" from the domain without per-project setup.")
    elif has_warn and all("[PASS]" in s or "[WARN]" in s for s in results.values()):
        print(f"\n [WARN] Services are reachable, but DNS resolves to public IPs.")
        print(f" Verify that Private DNS is enabled on your interface VPC endpoints.")
    else:
        print(f"\n [FAIL] Some services are not reachable.")
        print(f" Check that VPC endpoints are configured and security")
        print(f" groups allow outbound traffic on port 443.")

validate_vpc_connectivity()

Expected output when VPC is correctly configured:
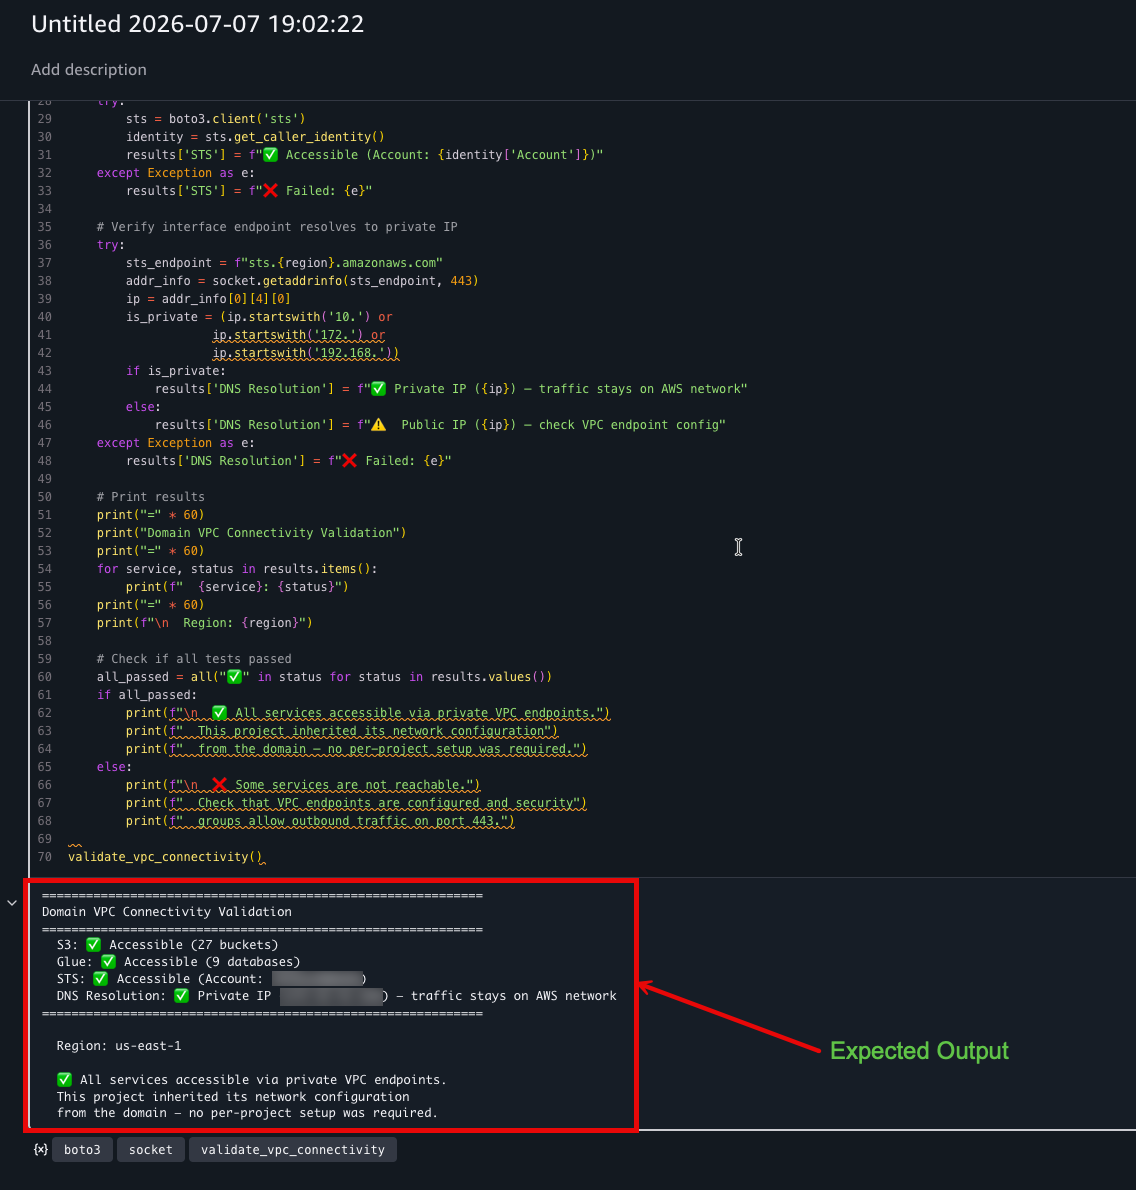
Successful validation output showing all services accessible through private VPC endpoints.

Figure 9: Successful validation output showing all services accessible through private VPC endpoints

If any service shows a failure, one common cause is security groups preventing traffic on port 443 to the VPC endpoint. Other causes include missing VPC endpoints, incorrect route table entries, or DNS resolution issues. For more information, see Configure VPC networking for IAM-based domains in the SageMaker Unified Studio Administrator Guide.

Note: An AccessDenied error indicates the request reached the service. Connectivity is working, but IAM permissions need adjustment (for example, the S3 test requires s3:ListAllMyBuckets, which some project roles lack). A timeout or connection error points to a networking problem (missing endpoint, route, or security group rule). The following screenshot shows the validation output when VPC endpoints are missing, where the affected services report timeout errors.
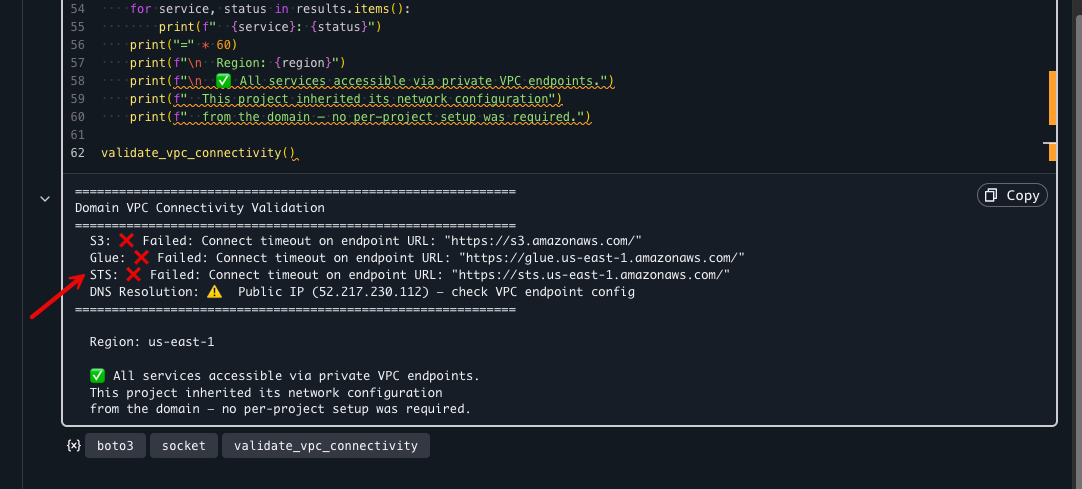
Validation output when VPC endpoints are not configured showing timeout errors.

Figure 10: Validation output when VPC endpoints are not configured. Timeout errors indicate missing endpoints

The security group applied at the domain level controls network access for all projects. To review or tighten the rules:

  1. Navigate to the Amazon VPC console.
  2. Choose Security groups and choose the security group shown in your domain’s Networking settings.
  3. Review the Inbound rules and Outbound rules tabs.

By default, the auto-created security group allows all outbound traffic on port 443 (HTTPS) to reach AWS services through VPC endpoints. Consider restricting outbound rules to only the specific VPC endpoint security groups for least-privilege access. Additionally, make sure your VPC endpoint security groups allow inbound TCP 443 from the domain security group or subnet CIDRs. For distributed compute services (AWS Glue, Amazon EMR), add a self-referencing inbound rule to allow worker-to-worker communication.

Updating VPC configuration

After the initial setup, you can modify the VPC configuration to change the VPC, subnets, or security group:

  1. From the domain administration page, choose Settings in the navigation pane.
  2. In the Networking in this account section, under the Actions column, choose Update.
  3. Update the VPC, subnets, or security group as needed.
  4. Choose Update.

The following screenshot shows the Update VPC dialog, where you modify the VPC, subnets, or security group.
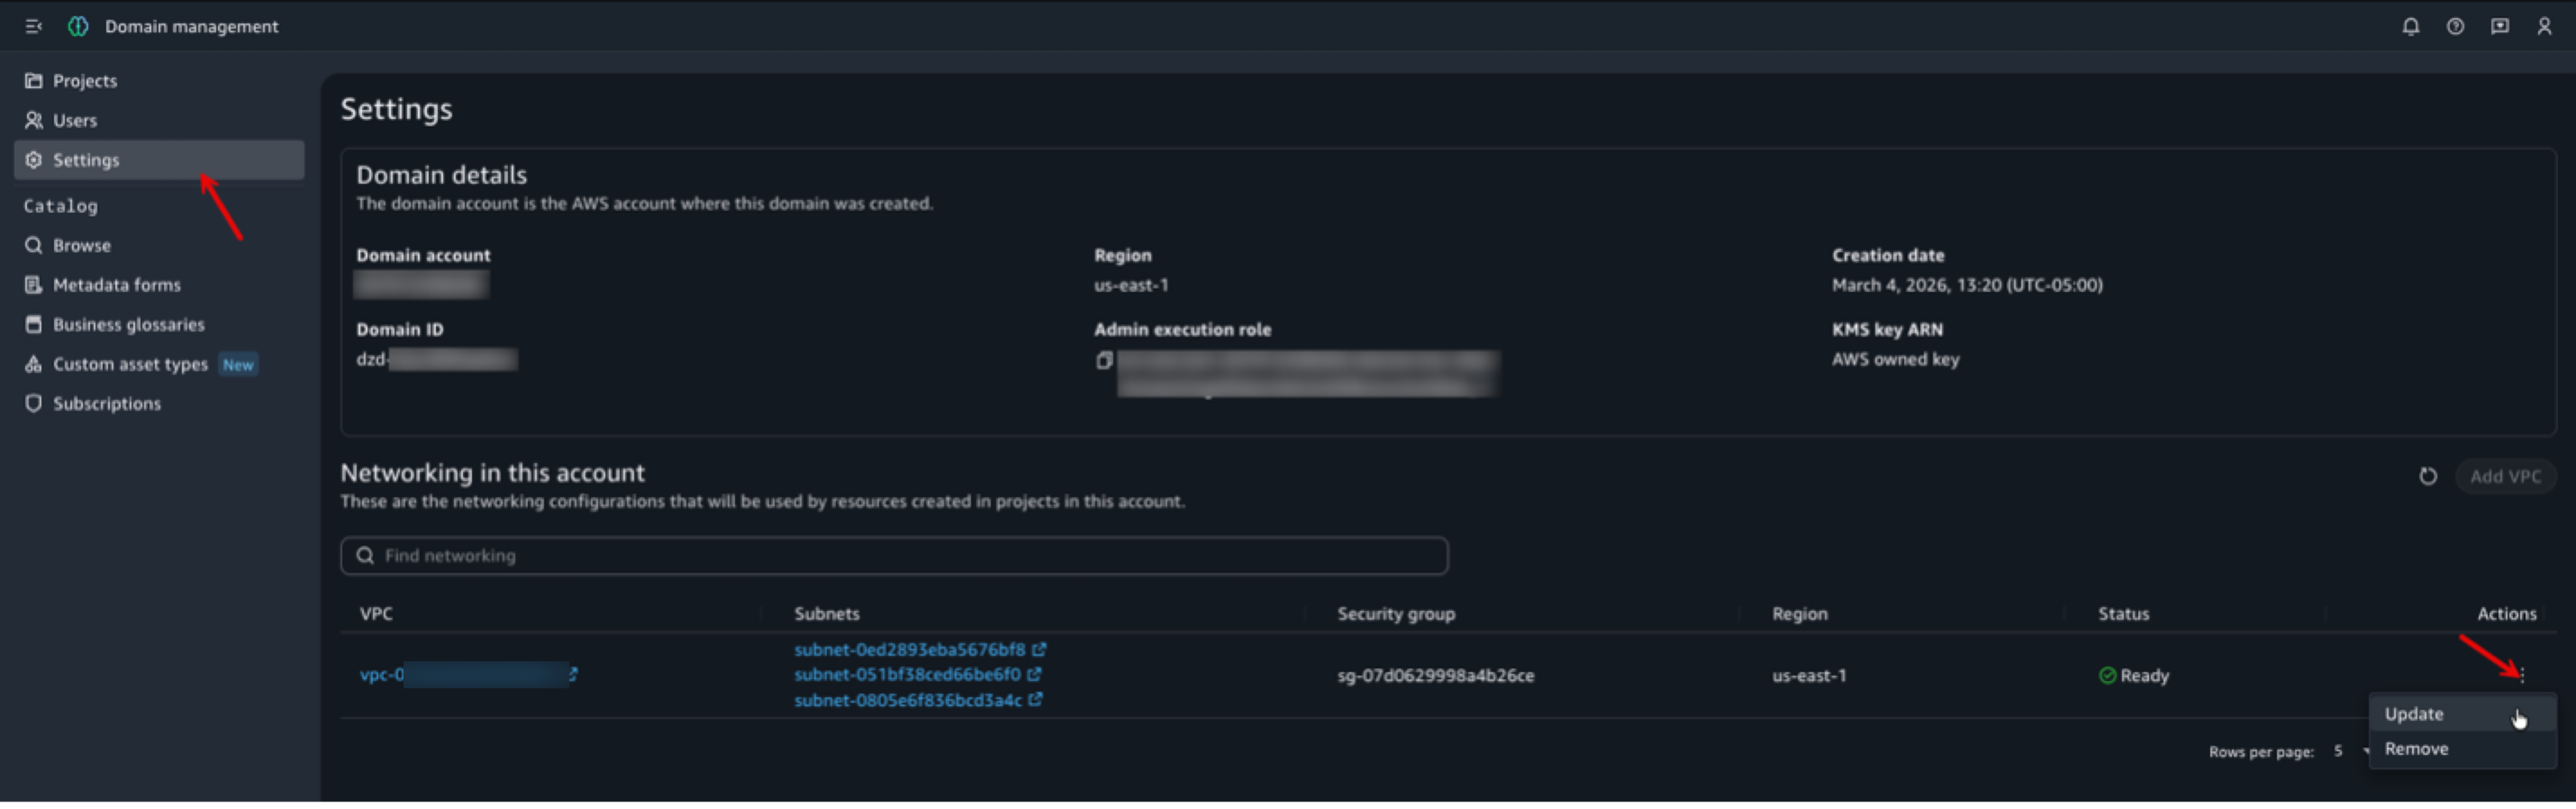
Settings page with the Actions menu showing Update and Remove options for VPC configuration.

Figure 11: Update VPC dialog showing the option to modify VPC, subnets, or security group for the domain

Important: Updating the VPC does not affect already provisioned resources. Newly created resources in projects use the updated VPC. Existing projects that already have a VPC keep their original settings and must be recreated to adopt the change. Projects with no VPC can be updated in place (see Step 3).

Clean up

To remove the VPC configuration from your domain:

  1. From the domain administration page, choose Settings in the navigation pane.
  2. In the Networking in this account section, choose the Actions menu (⋮) and choose Remove.

The following screenshot shows the Actions menu with the Remove option.
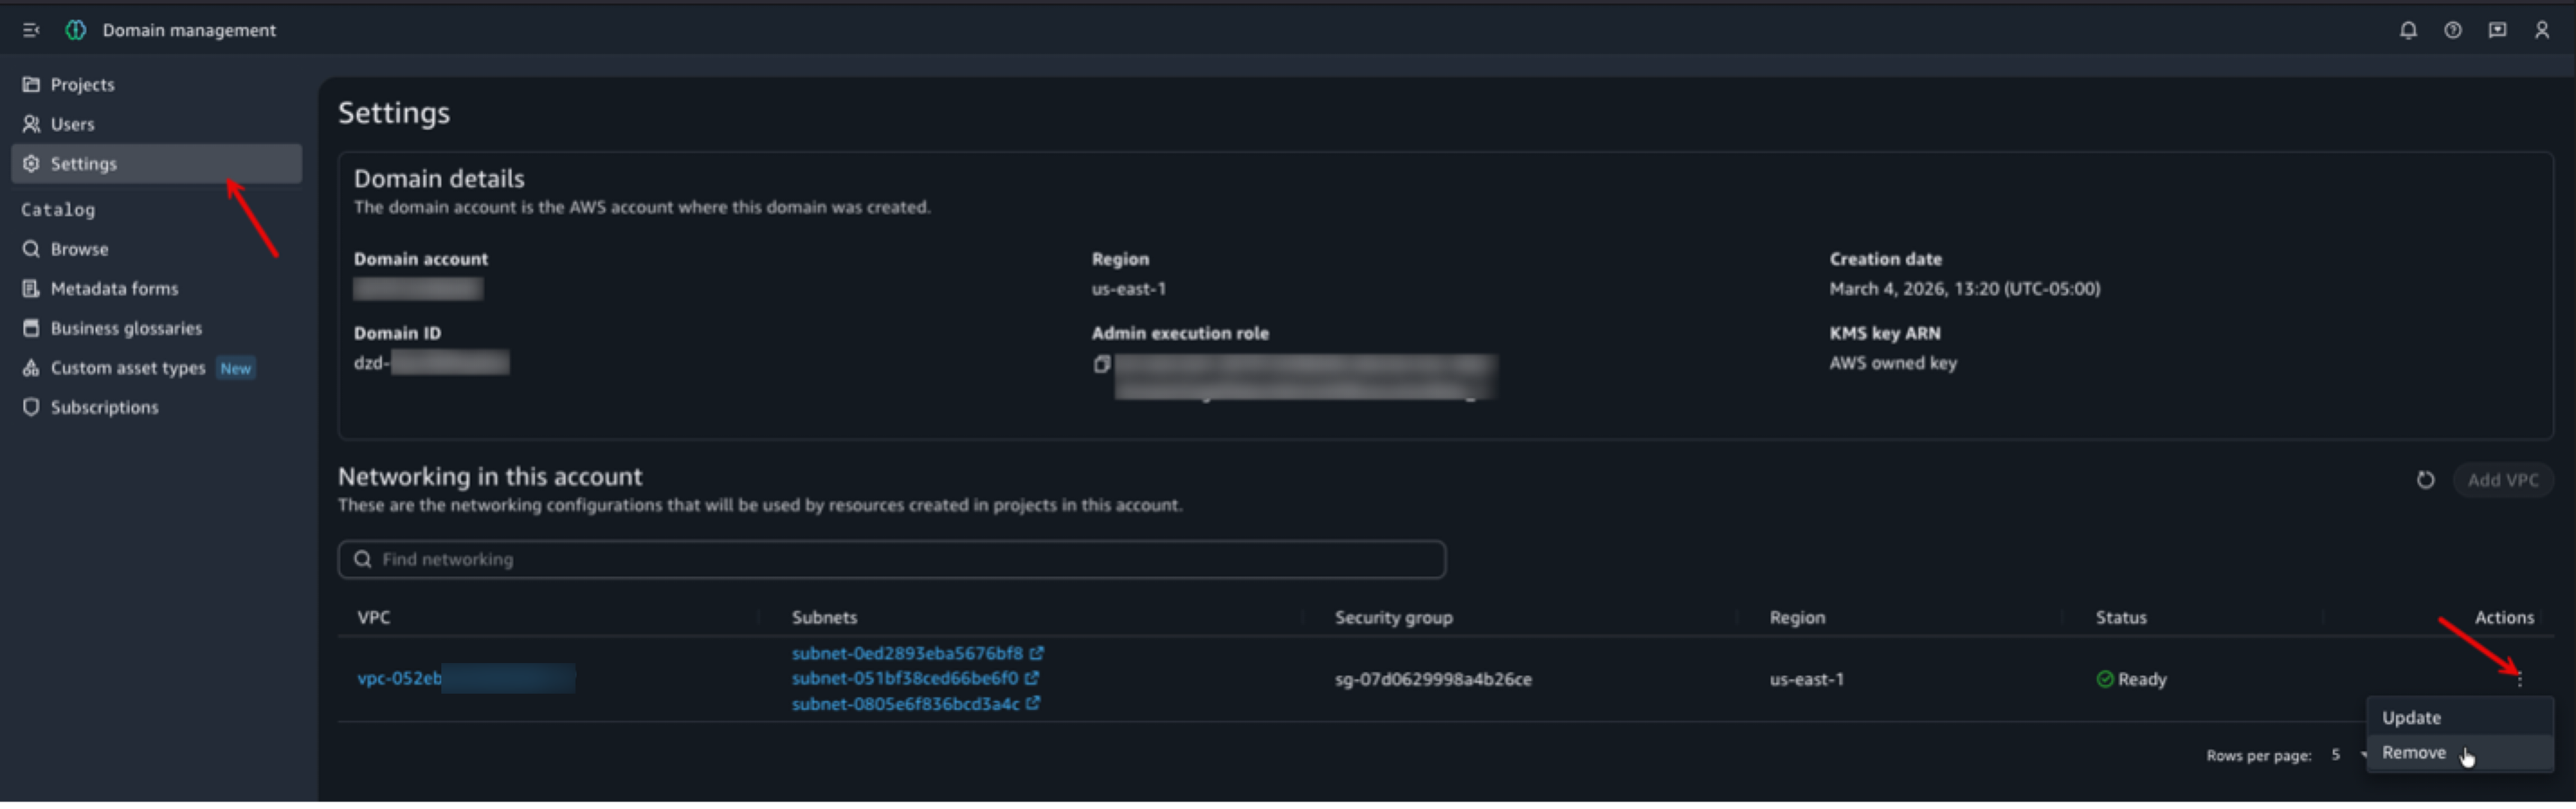
Actions menu in the Networking in this account section showing the Remove option.

Figure 12: Actions menu in the Networking in this account section showing the Remove option

If you created a dedicated VPC for this walkthrough and no longer need it:

  • Delete the VPC and associated resources (subnets, VPC endpoints, security groups) from the Amazon VPC console. Before deleting, remove the domain VPC configuration and make sure all project resources are terminated. Active projects create ENIs that block VPC and subnet deletion.
  • If you used an AWS CloudFormation template to create the VPC, delete the stack to remove all resources cleanly. Open the AWS CloudFormation console and delete the stack.

Note: Removing the domain VPC configuration does not retroactively change projects that already have VPC applied. Those projects retain their existing network configuration. New projects created after removal do not have a VPC configured.

Conclusion

In this post, we showed how to configure domain-level VPC networking in Amazon SageMaker Unified Studio. A single domain-level VPC eliminates per-project networking overhead, enforces a consistent security posture, and simplifies compliance auditing.

Key takeaways:

  • Domain-level VPC is a one-time configuration that automatically applies to all new projects.
  • Projects with no VPC can be updated in place. Projects that already have a VPC must be recreated to adopt a changed configuration.
  • Private subnets with VPC endpoints provide secure, private connectivity to AWS services without traversing the public internet.

As next steps, consider:

  • Reviewing your auto-created security group rules and tightening them for least-privilege access.
  • Adding VPC endpoints for additional AWS services as your projects’ needs evolve.
  • Monitoring subnet IP address utilization to plan capacity as you add more projects. Use the AvailableIpAddressCount Amazon CloudWatch metric for your subnets to track utilization and set alarms.

For more information, see Configure VPC networking for IAM-based domains in the Amazon SageMaker Unified Studio Administrator Guide.


About the authors

Prasad Nadig

Prasad Nadig

Prasad is a Senior Analytics Specialist Solutions Architect at Amazon Web Services (AWS), specializing in large-scale data analytics and AI. Prasad partners with customers to design, migrate, and modernize their analytics platforms on AWS into scalable, cost-effective solutions, with deep expertise in data lakes, data warehousing, distributed processing, and performance tuning at petabyte scale.

Amit Shyam Jaisinghani

Amit Shyam Jaisinghani

Amit is a Software Engineer on the SageMaker Studio team at Amazon Web Services, and he earned his Master’s degree in Computer Science from Rochester Institute of Technology. Since joining Amazon in 2019, he has built and enhanced several AWS services, including Amazon WorkSpaces and Amazon SageMaker Studio. Outside of work, he explores hiking trails, plays with his two cats, Missy and Minnie, and enjoys playing Age of Empire.

Arun Shanmugam

Arun Shanmugam

Arun is a Senior Analytics Solutions Architect at AWS, with a focus on building modern data architecture. He has been successfully delivering scalable data analytics solutions for customers across diverse industries. Outside of work, Arun is an avid outdoor enthusiast who actively engages in CrossFit, road biking, and cricket.

Rendering huge pull requests in the GitHub Copilot app

Post Syndicated from Alberto Gimeno original https://github.blog/engineering/user-experience/rendering-huge-pull-requests-in-the-github-copilot-app/


Broad refactors and migrations often have to land as one change.

Stacked pull requests are a great way to split work into smaller changes, which makes reviews easier and helps teams ship with less risk. But some changes, like this one, can’t be split cleanly. That leaves you with a single pull request that can get very large, and the review conversation causes it to grow.

The review experience needs to remain fast and smooth even when the diff and its conversation are enormous. In the GitHub Copilot app, we rebuilt the pull request view with that requirement in mind.

To see how far that goes, we opened the biggest pull request we could find: an open source one with 2,200 files, over a million changed lines, and more than 400 inline review comments. Here’s how we made even this extreme pull request performant.

The scope of the problem

Rendering a large diff at speed is well-understood: virtualize the rows, keep the mounted DOM small, and lean on the fact that every row is a line of code at a known height.

Comments are the hard part. A comment’s height depends on how its markdown wraps, the expandable sections, whether there’s a reply box in it, and whether its images have loaded yet. You find all of that out at render time. This forces a different architecture.

Three problems:

  1. Measurement. You can’t know how tall a comment is until you render it. This breaks the design that lets big diffs stay responsive as you scroll.
  2. The data pipeline. A fast diff surface is worthless if the data pipeline feeding it stalls, or if it throws away work it already did.
  3. How we actually found the bugs. These problems surface under load, on a specific engine, at a specific scroll position. So we defined what healthy meant, instrumented the surface to answer it, and ran the whole change → measure → improve loop unattended.

Part 1: Virtualization, and why comments break it

The first step is to understand the geometry that makes a code-only diff fast. Once comments enter the picture, that geometry is no longer enough.

What makes big diffs fast

You cannot put a million DOM nodes on a page. The standard answer is virtualization: mount only the rows that are on screen, plus a small margin, and recycle those same DOM elements as the user scrolls. The list behaves as if all million rows exist. The scrollbar is the right size, scroll-to-row works. But only about 100 rows are ever real at once.

For this illusion to hold, something has to supply the geometry. The scrollbar height is the sum of all row heights. The position of row N is the sum of the heights of the rows above it. Jumping to a row, drawing the scrollbar, deciding what’s on screen, it’s all arithmetic over a table of heights. You can build that table from estimates and correct it as rows get measured, and general-purpose variable-height virtualizers do exactly that.

But if every row is a line of code at a known font size, you don’t have to. You can compute the whole table up front and it never changes, so there’s nothing to correct later.

Call this the “all heights known before paint” contract. Our diff surface is built around it:

  • An imperative, recycled code-row renderer (no React component per row)
  • Typed-array geometry for the offset math
  • Backend-owned diff documents streamed structure-first
  • An imperative scroll API with exact “scroll to row N

None of it scales badly, because no per-frame work grows with the total row count. On pure code this design is the right one, and we kept all of it.

How comments change the contract

Now put a review thread in the middle of the diff. How tall is it?

You don’t know, and you can’t know without rendering it. Its height depends on things that only exist at render time, and they can keep changing after first paint:

  • Markdown that wraps differently at different widths
  • <details> blocks the user can expand or collapse in place
  • A reply composer that opens inside the existing thread and grows as you type
  • Suggested-change diffs, reactions, edit mode, resolution banners
  • Images and async assets that change height when they finish loading

The obvious answer is to reserve a fixed-height slot for each comment, sized by an estimator. It falls apart on a big pull request. An estimator that’s right on average is still wrong at the extremes. It over-reserves most comments, leaving gaps of whitespace, and under-reserves the expensive ones, which clip or sprout a nested scrollbar. If you measure the real height after paint and write it back into the shared offset table, everything below moves, while the user is already scrolling. That’s a scroll jump, and on a big pull request it’s a large one.

So comments need a different contract. “All heights known before paint” is unachievable for this content. What we could promise instead: heights are bounded, measured lazily, and corrections are small and anchored to whatever the user is looking at.

Two geometries instead of one

The idea that made this tractable was to stop forcing one geometry to serve both kinds of content. We split the document’s height into two independent domains:

total height = deterministic code height          (exact, known up front)
             + Σ dynamic block effective heights   (estimated, then measured)
             + scroll padding

Code geometry keeps the original world. It’s deterministic, prefix-summed, exact, never rebuilt when a comment resizes.

Dynamic block geometry covers everything whose height we can’t predict, such as review threads, drafts, and reply composers. Each one is a block identified by what it is rather than where it currently sits. It has a stable key that survives its content loading, and it’s anchored to a file, line and side rather than to a pixel coordinate, so a reflow can’t lose track of it. We also keep a fingerprint of everything that could change the block’s height: its content, whether a <details> is open, whether a composer is active. And we record the width it was last measured at, rounded into buckets, so an ordinary window resize doesn’t invalidate every measurement in the document.

A block’s effective height is then simple: the measured height if we have a valid one, a cached height if the fingerprint and width still match, and the estimate otherwise. Those heights live in their own index, separate from the code rows, so a resizing comment never forces the code geometry to be rebuilt. And the number of blocks is bounded by comments, not by rows. A few thousand blocks is fine, as long as first paint never mounts or measures all of them at once.

The measurement scheduler, and the mistake we made first

This part took the longest to get right, because our first design was wrong in an instructive way.

The obvious way to measure dynamic content is one ResizeObserver per block, which watches the element and writes its measured height back into the layout whenever it changes. This is what we designed and then rejected during performance hardening. It is the feedback loop that big virtualized surfaces have to avoid. An observer that writes a height back into the layout of the element it’s watching can retrigger itself, and the cost grows with every mounted block.

What shipped instead is a single idle- and scroll-gated measurement pass, held to the same discipline as the deterministic side:

  • Off the hot path. It runs when the visible range settles, never once per scroll frame, and waits entirely while a scroll is in flight. A reflow mid-scroll is exactly the jank we’re avoiding. It runs again once scrolling stops.
  • Scoped to the viewport. Only blocks within roughly 2400px of the viewport are candidates, so the work is O(viewport). Distant blocks keep riding their estimate and get corrected as they approach.
  • On-screen reads win. A mounted block is on screen, so its rendered height is ground truth. The pass reads every mounted candidate in one batch, a single reflow with no writes in between, and records what it finds. A mounted block is never skipped in favor of a stale estimate. That one rule fixed the nastiest bug we hit: comments that rendered with a strip of blank space underneath, because a mounted block had been filtered out of measurement and left sitting on a too-tall estimate.
  • Off-screen measurement is a bounded fallback. For a nearby block that hasn’t mounted yet, the pass does at most one off-screen render, to correct its reservation before it scrolls into view. Blocks taller than the viewport skip even that. Their over-reservation hides below the fold, so the render isn’t worth paying for.
  • An observer catches the rest. Some height changes don’t move the fingerprint and don’t coincide with a scroll: typing in a reply composer, an image finishing loading, toggling a <details>. Each mounted block keeps a ResizeObserver, but by default all it does is flag the block so the idle pass re-reads it. It never writes a height itself, which is what would close the feedback loop we rejected. It disconnects on unmount, and an inactive pull request tab observes nothing.
  • With one deliberate exception. Waiting was visibly wrong for resizes you caused yourself: expanding a <details>, opening a reply composer, an image landing. The block grew immediately, but the code below it only moved on the next idle pass. For one frame the comment was taller while everything under it sat at its old position, and you could see the two steps. So when a block is mounted and on screen, the observer now measures it and applies the correction in the same frame, before paint. The block grows, the code repositions, and everything below shifts together. Two safeguards keep this from becoming the loop we were avoiding: at most one synchronous commit per frame, so a burst of resizes collapses into one, and never during an active scroll, where it falls back to the batched pass.

Scroll anchoring: Correcting without fighting the user

When a measured height differs from its estimate, the scrollbar arithmetic changes, and the naive result is that the viewport jumps. The fix is to correct by identity rather than by pixel:

  1. Before applying height updates, capture what the user is anchored to (a row or a block, by identity), plus the offset within it.
  2. Apply the height deltas.
  3. Resolve that same anchor to its new pixel position.
  4. Scroll so the anchor stays put in the viewport.

Plus a few rules that keep it from feeling wrong:

  • A block above the viewport changing height → adjust by the delta (keeps your place).
  • Content hydrating below the viewport → don’t adjust (you can’t see it).
  • If you toggled a <details> or opened a reply in a visible block → suppress above-block correction for that block, so the interaction feels direct, and let the content below flow down naturally.
  • Never fight active pointer or wheel momentum; batch the correction after the frame.

That last rule has a sharp edge, and it bit us. “Don’t correct while the user is scrolling” was implemented as a guard on the last observed scroll, and programmatic scrolls refreshed that timestamp too. Toggling the file-tree sidebar changes the width of the diff pane. With line wrapping on, every wrapped line above you reflows to a different number of visual lines, the whole coordinate space shifts, and the surface emits a small scroll of its own as it settles. The guard read that as “the user just scrolled” and skipped the very correction that was supposed to keep your place, so the file you were reading drifted off screen. The fix was to tell user scrolls apart from ones the surface caused itself. Any “is the user interacting?” check has to be one your own side effects can’t satisfy.

So corrections stay small, they reuse measurements we already have, and they follow whatever you’re looking at.

Part 2: The pipeline behind the surface

A diff surface can only be as fast as the data feeding it, and three habits from that side of the work shaped what the UI could do. The first is stream structure before content. The diff is requested incrementally, so the file tree and metadata paint while the document is still loading, and the full set of review threads is resolved up front rather than trickling in. The second is defer per-item work until something needs it. Syntax highlighting runs off the main thread, so rows appear as plain text immediately and get colored when the results arrive. Highlighting improves the surface instead of blocking the scroll. Large markdown bodies and suggested-change context work the same way: nothing is built until it approaches the viewport.

The third habit is about which costs are worth keeping. Releasing a diff document when you navigate away is the right default. These documents are large, and holding on to every one you’ve visited is how a long session ends up eating memory. But pull request metadata persists, so the shell around the diff, the header and the file tree, repaints instantly when you go back, and then sits there for several seconds waiting for a diff it had complete moments ago. An instantly-drawn shell around an empty diff looks broken, even though you’re waiting less time overall. So the policy stayed and we added a cache: keep the last few diffs resident, evict anything beyond that, and let the background refresh notice when one has gone stale.

Part 3: The measurement loop, or how we actually found the bugs

Almost every bug in this project was invisible until it wasn’t, and reproducing one by hand is miserable. A typical report reads: “a strip of whitespace appears below some comments, but only sometimes, only on big pull requests, and it heals if you scroll past and back.” You can’t debug that by staring at the screen, so we built tooling to debug it mechanically.

Instrument with the app’s real signals, not throwaway logs

The naive workflow is to sprinkle console.log calls, exercise the flow by hand, copy the output, paste it to someone (or something) that can analyze it, delete the logs, and repeat. It’s slow, it needs a human in the loop, and worst of all you end up measuring your own hand-rolled instrumentation rather than the app’s real behavior.

So the surface carries permanent, structured probes for its own invariants. They’re plain questions it answers about itself on every render:

  • Is the surface actually viewport-bound? How many rows and comment blocks are mounted right now?
  • Is measurement coalescing to a single commit per frame, and how long does that frame take?
  • How large are the scroll corrections we’re making?
  • Did any comment block get inserted after scrolling started? (Must be zero once the backend topology has landed.)
  • Do the per-block observers actually tear down on unmount, or are we leaking one per block?

These are the objective pass/fail signals, and they’re asserted as budgets in an end-to-end test against a synthetic many-comment huge-pull-request fixture. CI can now tell us whether the surface is healthy.

Put the loop on autopilot

The centerpiece was an autonomous change → measure → improve loop. Two lanes:

A headless probe lane ran a declarative flow (open a pull request, scroll to a fraction, toggle a details block, resize the window) against a mock server, reading the app’s own production instrumentation: React render counts, the performance timeline, and a requestAnimationFrame sampler for jank. It did the whole instrument, drive, collect, analyze, rank cycle by itself and printed the bottlenecks in order. Because the flow is just JSON handed to the probe at runtime, an agent could profile any flow by describing it in plain English, without editing a line of source.

An autopilot drove the actual desktop app through the huge-pull-request flow, unattended, on a loop: first cold, with comments still skeletons, then warm, with comments loaded, toggling <details> blocks, opening and cancelling reply composers, collapsing and expanding files, toggling the sidebar tree, sweeping deep into the file list, resizing the window. Every measurement was mirrored to the app’s on-disk log, so an agent could read runtime behavior with nobody at the keyboard. Each sample carried a health signal, and that was the objective check. A warm sample counted as healthy only if there were no unfilled gaps between comments, no comment blocks left blank, and real thread content actually mounted, across the entire scroll range, deep-file sweep included.

The loop we ran was:

  1. Reproduce unattended, on the real engine. Arm the autopilot, let it loop, read the on-disk log.
  2. Detect with a health signal, not with your eyes. Trust the sample fields.
  3. Probe the suspect seam. When a signal goes bad, add one narrow structured probe there, re-arm, re-read. (Editing the surface hot-reloads the live window and re-arms the autopilot, so a fresh capture is about one cycle away.)
  4. Remove the scaffolding. Once you understand the invariant, pin it in a test and the design doc, and keep only the detector-grade signals.

Where this leaves us

Reviewing a pull request this large used to mean one of two things: waiting, or giving up and reading it somewhere else. A review isn’t a document with known dimensions. It’s a conversation that changes shape while you’re reading it, and the surface underneath has to be built for that from the start rather than patched into it afterwards.

The result is a pull request view where a million-line diff with hundreds of threaded comments opens, scrolls, and behaves like a normally sized pull request. Comments render in full instead of clipping into a scrollable box. Expanding a collapsed section moves the code below it and nothing else. Coming back to a pull request you just left puts you where you were.

If you review code for a living, it’s worth feeling the difference on a pull request you already know is painful. Open the worst one you’ve got.

Try the GitHub Copilot app >

The post Rendering huge pull requests in the GitHub Copilot app appeared first on The GitHub Blog.

Announcing Spark Connect on Amazon EMR on EC2: Interactive PySpark anywhere

Post Syndicated from Al MS original https://aws.amazon.com/blogs/big-data/announcing-spark-connect-on-amazon-emr-on-ec2-interactive-pyspark-anywhere/

Today, we’re announcing support for Spark Connect on Amazon EMR on EC2 with the AWS runtime for Apache Spark (emr-spark-8.0, Apache Spark 4.0.2 and later). You can now develop and debug PySpark interactively from Amazon SageMaker Unified Studio Data Notebooks or your own IDE, such as Visual Studio Code, PyCharm, Kiro, or Jupyter. Spark runs on a dedicated Amazon EMR on EC2 cluster while your Python runs locally, so you can set breakpoints and inspect a DataFrame against full-size data from your IDE. In SageMaker Unified Studio Data Notebooks, you connect to your cluster, catalog, and AI tools. Production-scale PySpark and SQL run without leaving the studio. Because each session is isolated with its own permissions, your whole team can share one cluster at the same time. This post shows you how to get started with both SageMaker Unified Studio Data Notebooks and your own IDE.

Previously, developing Spark for an Amazon EMR on EC2 cluster meant working in a notebook tied to that cluster, or packaging your code as a job and submitting it before you could see a result. Local code often behaved differently on the cluster because of version and dependency mismatches, and the slow deploy-and-check loop made those differences hard to find. There was no way to attach your own IDE and debugger and inspect a DataFrame mid-transformation. Spark Connect closes that gap: your code runs against the cluster’s own Spark engine while you develop locally, so the environment you debug in is the one that runs your data.

How Spark Connect works on Amazon EMR on EC2

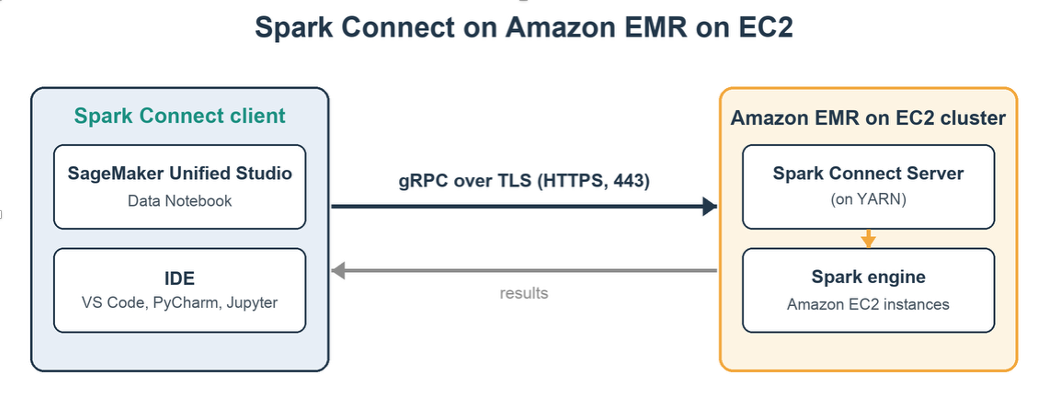
Spark Connect uses a client-server architecture that separates your application code from the Spark engine. The client is a lightweight PySpark library that runs in your notebook or IDE, and it sends DataFrame and SQL operations over a gRPC/TLS connection to a Spark Connect Server on your cluster. The server runs those operations and returns the results to your local session. Your machine does not need Spark installed and does not need to be sized for the workload.

Spark Connect client-server architecture connecting a local PySpark client to the Spark Connect Server on an Amazon EMR cluster

Figure 1: Spark Connect client-server architecture on Amazon EMR on EC2

When you start a session, Amazon EMR launches the Spark Connect Server as a YARN application on your cluster and hands back an endpoint and a short-lived token. There’s no server for you to stand up or manage. Because that server runs on a cluster you already operate, your session inherits the instance types, libraries, bootstrap actions, and Spark configuration you use in production. What you see while debugging is what runs when the same code is scheduled as a batch job, since both use the same cluster and its configuration.

Share one cluster across your team

Now that you can start sessions, a single dedicated cluster can serve your whole team, because each session is a separate resource with its own execution role, tags, and lifecycle. A single cluster supports up to 1,000 concurrent sessions and 1,000 concurrent execution roles. These values are service maximums, not sizing targets. Actual concurrency depends on cluster size and per-session workload. Because interactive sessions are bursty and rarely all active at once, one cluster typically serves a team larger than its peak concurrent-session count. Enable Amazon EMR managed scaling so that capacity tracks demand. If peak concurrency approaches these maximums, or to isolate cost and data access by group, use multiple clusters—for example, one per team, business unit, or environment. Sharing one cluster gives you:

  • On-demand Spark without extra clusters — Developers get interactive sessions without provisioning a cluster apiece, which keeps utilization high and removes the cost of idle per-person clusters.
  • Consistent environments — Everyone runs the same Spark version, libraries, and security configuration, so results stay consistent, and your platform team patches and monitors one cluster.
  • Isolation and attribution — Per-session execution roles and tags keep each person’s work separate, so you can scope data access by session, track cost by user, and stop one session without disturbing anyone else.
  • Full visibility and control — View active sessions in the Spark UI, review finished ones in the Spark History Server, and manage them from the Amazon EMR console, API, CLI, or SDK.

Getting started

Getting started with Spark Connect on Amazon EMR on EC2 takes three steps: Create an Amazon EMR cluster with Spark Connect session enabled, start a session, and connect from your IDE or SageMaker Unified Studio Data Notebooks.

Note: In SageMaker Unified Studio, on-demand cluster creation is available for domains that use AWS IAM Identity Center. For domains that use AWS Identity and Access Management (IAM), attach an existing cluster. If your cluster runs in a private subnet, make sure that your network configuration allows connectivity between SageMaker Unified Studio and the cluster endpoint.

Prerequisites

You must have the following prerequisites in place.

  • An Amazon EMR cluster running release emr-spark-8.0.0 or later with SessionEnabled set to true.
  • The Spark application is installed on the cluster.
  • Python 3.9 or later with pyspark[connect] installed locally. The PySpark version must match the Spark version on your cluster.
  • For clusters in private subnets, the Amazon EMR service role must include the AmazonEMRServicePolicyForSessions managed policy, which grants permissions to create Network Load Balancers and virtual private cloud (VPC) endpoint services in your account.
  • To use Spark Connect sessions, you need permissions to start and list sessions on the cluster (elasticmapreduce:StartSession, ListSessions), get session details and endpoints and terminate sessions (elasticmapreduce:GetSession, GetSessionEndpoint, TerminateSession), and pass the execution role to the Amazon EMR service (iam:PassRole).

Working with interactive sessions

To create a session-enabled cluster and connect to it, follow these steps.

To start a Spark Connect session

  1. Create a cluster with sessions enabled, running emr-spark-8.0.0 or later. The following is a sample command that you can modify for your needs, such as the instance types and counts:
    aws emr create-cluster \
      --name "spark-connect-cluster" \
      --release-label emr-spark-8.0.0 \
      --applications Name=Spark \
      --service-role EMR_DefaultRole \
      --ec2-attributes InstanceProfile=EMR_EC2_DefaultRole,SubnetId=subnet-id \
      --instance-groups '[
        {"InstanceCount":1,"InstanceGroupType":"MASTER","InstanceType":"m8g.xlarge"},
        {"InstanceCount":2,"InstanceGroupType":"CORE","InstanceType":"m8g.xlarge"}
      ]' \
      --session-enabled \
      --tags Key=for-use-with-amazon-emr-managed-policies,Value=true

    Note: The following steps use the AWS Command Line Interface (AWS CLI) directly. If you develop in SageMaker Unified Studio (Option 1), cluster attachment and session creation are handled for you, so you can skip steps 2 through 6.

  2. After the cluster reaches the WAITING state, start a session and wait for it to reach IDLE:
    aws emr start-session --cluster-id j-XXXXXXXXXXXXX --name "my-session"
    aws emr get-session --cluster-id j-XXXXXXXXXXXXX --session-id is-XXXXXXXXXXXXX

    Note: For runtime role sessions, add the --execution-role-arn parameter to the start-session command.

  3. Retrieve the endpoint and token, and build your connection string from the returned Endpoint value rather than hardcoding a host:
    aws emr get-session-endpoint --cluster-id j-XXXXXXXXXXXXX --session-id is-XXXXXXXXXXXXX

    The response includes the endpoint URL and an authentication token:

    {
      "Endpoint": "https://session-id.emr-spark-connect.region.amazonaws.com",
      "AuthToken": "v2.local.xxx...",
      "AuthTokenExpirationTime": "2026-01-01T01:00:00Z"
    }

  4. Install the matching PySpark client and connect. GetSessionEndpoint returns an https:// URL with no port. Build the connection string by converting it to the sc:// scheme and appending :443. Without the port, the PySpark client defaults to 15002, which isn’t reachable. Your Python code runs locally. The SQL and DataFrame operations run on the cluster:
    pip install 'pyspark[connect]==4.0.2' boto3

    from pyspark.sql import SparkSession
    
    session_id = "is-XXXXXXXXXXXXX"
    auth_token = "<AuthToken from get-session-endpoint>"
    host = "<Endpoint from get-session-endpoint, without https://>"
    
    url = f"sc://{host}:443/;use_ssl=true;x-aws-proxy-auth={auth_token};authorization={session_id}"
    spark = SparkSession.builder.remote(url).getOrCreate()
    spark.sql("SELECT 'Hello from EMR on EC2' AS message").show()

  5. Run a transformation against full-size data. This groups a DataFrame, writes the result to Amazon Simple Storage Service (Amazon S3), and reads it back:
    import pyspark.sql.functions as F
    
    df = spark.range(0, 1000).withColumn(
        "category", F.when(F.col("id") % 2 == 0, "even").otherwise("odd")
    )
    df.groupBy("category").count().show()
    df.write.mode("overwrite").parquet("s3://amzn-s3-demo-bucket/demo/")
    spark.read.parquet("s3://amzn-s3-demo-bucket/demo/").filter("id < 50").orderBy("id").show()

  6. When you finish, terminate the session to release cluster resources. Calling spark.stop() only closes the local connection. The session keeps running until you terminate it or it reaches the idle timeout:
    aws emr terminate-session --cluster-id j-XXXXXXXXXXXXX --session-id is-XXXXXXXXXXXXX

  7. When you’re done with the walkthrough, terminate the cluster you created in step 1 so it stops incurring charges. Terminating the cluster also ends any sessions still running on it:
    aws emr terminate-clusters --cluster-ids j-XXXXXXXXXXXXX

You can start a Spark Connect session in two ways: from SageMaker Unified Studio or from your own IDE client.

Option 1: Develop in SageMaker Unified Studio Data Notebooks

Amazon SageMaker Unified Studio brings your data, catalogs, and analytics and AI tools into one place, and Amazon EMR on EC2 is now one of the Spark runtimes a Data Notebook can use. When you choose that cluster as the notebook runtime, SageMaker Unified Studio connects to it over Spark Connect. The same runtime then drives both your PySpark and SQL cells, so a single notebook can query the AWS Glue Data Catalog and transform the data without switching tools. The built-in AI assistant generates code and execution plans from natural-language prompts, and the Spark UI shows running work alongside your other runtimes.

To start a session from SageMaker Unified Studio:

  1. Open a Data Notebook in SageMaker Unified Studio.
  2. In the Compute panel, do one of the following:
    1. To create a new cluster, choose Create cluster and configure an Amazon EMR on EC2 cluster.
    2. To use an existing cluster, choose Attach cluster and select a running Amazon EMR on EC2 cluster.
  3. Select the cluster as the notebook’s runtime.
  4. Begin writing PySpark or SQL code in the notebook cells.

For a complete example, open the SageMaker Unified Studio Spark Connect example notebook , which connects a Data Notebook to an Amazon EMR on EC2 cluster and runs PySpark and SQL cells against the AWS Glue Data Catalog.

Watch a walkthrough: Develop in a SageMaker Unified Studio Data Notebook. The preceding steps cover the same workflow, so you can complete it from the notebook without the video.

Option 2: Develop in your own IDE

Use the IDE of your choice, such as Visual Studio Code, PyCharm, Kiro, or a local Jupyter notebook. You debug Spark the way you debug any Python program: set a breakpoint, inspect a variable, and step through your code, all while the Spark work runs on the cluster. Your libraries, source control, and continuous integration and continuous delivery (CI/CD) stay on your local machine, and only your Spark operations are sent to the cluster.

To see this end to end, the following example attaches an IDE to a Spark Connect session and steps through a breakpoint against cluster data.

Open the local IDE Spark Connect example notebook then use the connection steps in the preceding Getting started section to attach your client.

Watch a walkthrough: Develop your own IDE with Spark Connect. The written connection steps in Getting started cover the same workflow, so you can complete it without the video.

Use cases

Spark Connect on Amazon EMR on EC2 supports the following interactive workflows:

  • Interactive extract, transform, and load (ETL) development: Build and test pipelines against full-size data on the cluster, then schedule the same transformations as a Spark step on that cluster, where the Spark version, libraries, and configuration already match what you validated.
  • Exploratory data analysis and feature engineering: Analyze production-scale data from your notebook or IDE instead of sampled subsets, so you catch data quality issues earlier.
  • Notebook-driven analytics in SageMaker Unified Studio: Run PySpark and SQL next to your catalogs and AI tools, switching runtimes per notebook.
  • Apache Iceberg lakehouse analytics: Query and manage Iceberg tables through the AWS Glue Data Catalog, with time travel, schema evolution, and partition management.
  • Compute standardization: Point interactive development at the same clusters that run your production batch jobs, so development and production share one engine and configuration.

Release information

Spark Connect on Amazon EMR on EC2 is available with the AWS runtime for Apache Spark (emr-spark-8.0, Apache Spark 4.0.2) and later. It’s available in all AWS Regions where Amazon EMR is available, except the AWS GovCloud (US) Regions and the China Regions. The SageMaker Unified Studio experience is available in its supported Regions. There’s no additional charge for Spark Connect. You pay for the Amazon Elastic Compute Cloud (Amazon EC2) instances in your cluster. Because these sessions run on your own clusters, they use the Amazon EMR on EC2 capabilities you already rely on, including AWS Graviton processors for price-performance and your choice of On-Demand, Reserved, AWS Savings Plans, or Spot capacity.

Considerations for the release are as follows:

  • The PySpark version that you install locally must match the Apache Spark version on your cluster.
  • Spark Connect supports the DataFrame and SQL APIs. RDD-based APIs aren’t supported.
  • Authentication tokens expire after 1 hour, and sessions end after a configurable idle timeout (60 minutes by default, up to 24 hours).
  • High-availability clusters with multiple primary nodes, Trusted Identity Propagation, and fine-grained access control through AWS Lake Formation aren’t supported for Spark Connect sessions in this release.

Conclusion

Spark Connect on Amazon EMR on EC2 brings interactive, debuggable PySpark development to the clusters you already run. Develop on a SageMaker Unified Studio Data Notebook or in your own IDE, debug against full-size data while the cluster runs the work and share a single cluster across your whole team. To get started, see the Interactive sessions with Spark Connect guide or open a Data Notebook in Amazon SageMaker Unified Studio. To learn more about the service, see the Amazon EMR detail page.


About the authors

Al MS

Al MS

Al is a product manager for Amazon EMR at AWS.

Karthik Prabhakar

Karthik Prabhakar

Karthik is a Data Processing Engines Architect for Amazon EMR at AWS, where he specializes in distributed systems architecture and query optimization. He partners with customers to solve complex performance challenges in large-scale data processing workloads. His work centers on engine internals, cost optimization, and architectural patterns for efficient petabyte-scale analytics.

Arun Prabakaran

Arun Prabakaran

Arun is a Senior Software Engineer working at AWS. His expertise spans distributed data processing and large-scale systems. He is passionate about building reliable data platforms and enabling organizations to run analytics and AI workloads at scale.

Rekha Veeraraghavan

Rekha Veeraraghavan

Rekha is a Technical Account Manager at AWS and a Subject Matter Expert in AWS Analytics. She helps enterprise and strategic customers optimize their data analytics solutions with expert guidance and technical support. Drawing deep data engineering expertise, she enables organizations to build scalable, efficient, and cost-effective data processing pipelines on AWS.

Query unstructured data in Amazon SageMaker Catalog using generative AI

Post Syndicated from Nishchai JM original https://aws.amazon.com/blogs/big-data/query-unstructured-data-in-amazon-sagemaker-catalog-using-generative-ai/

Each day, businesses generate massive amounts of unstructured data, such as PDFs, images, email, customer feedback, and medical reports. But knowing data exists isn’t enough. You need to find it, access it, and extract answers from it fast. In Part 1 of this series, you saw how to set up the producer side of the pipeline: using Amazon Textract and Anthropic Claude on Amazon Bedrock to extract and enrich metadata, and then publish those enriched assets to Amazon SageMaker Catalog so your organization can discover them.

In this post, you take the next step: the consumer side. You sign in as a data consumer, search for and subscribe to the enriched unstructured data assets, and then query them using two approaches. The first is a no-code chat agent for natural language queries. The second is Amazon Bedrock model inference for programmatic access. By the end of this post, you will know how to unlock the business knowledge inside your unstructured data and make it available to analysts and application engineers alike.

Solution overview

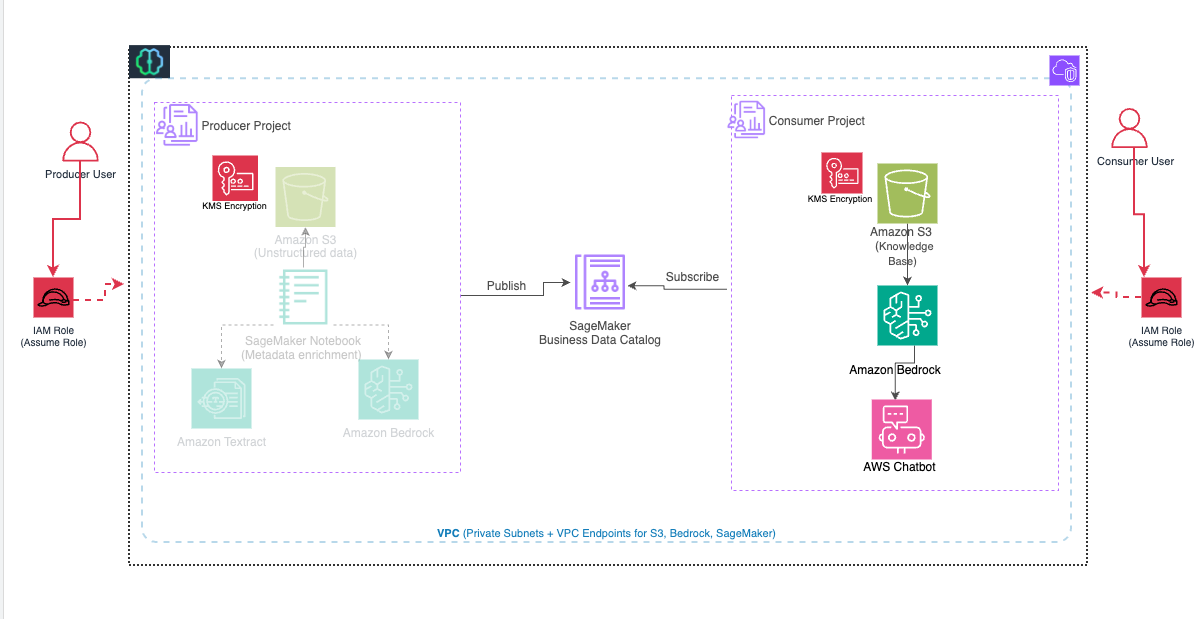
This post continues the two-part series architecture, where Amazon SageMaker Catalog acts as the central hub connecting data producers and consumers through a publish-subscribe model.

The consumer workflow picks up after the producer has enriched and published the unstructured data assets. As a consumer, you will:

  • Sign in to your SageMaker Unified Studio consumer project and search the catalog using keywords from the enriched metadata README.
  • Subscribe to the published Amazon Simple Storage Service (Amazon S3) asset and get the subscription approved by the producer.
  • Interact with the subscribed data through two options:
    • Option 1 – A no-code chat agent for natural language queries (NLQs), ideal for data analysts and business users.
    • Option 2 – Amazon Bedrock model inference for programmatic NLQ integration, suited for application engineers building data-driven applications.

The following diagram illustrates the consumer workflow in this solution. The consumer (1) signs in to SageMaker Unified Studio, (2) searches the Amazon SageMaker Catalog for enriched unstructured data assets using keywords from the AI-generated metadata, (3) subscribes to the S3 data asset and receives approval from the producer, and then (4) queries the data using either the Amazon Bedrock chat agent app (Option 1) or Amazon Bedrock model inference through a Jupyter notebook (Option 2).

With both a no-code and a programmatic path, consumers across different roles, from analysts to engineers, can query data in the way that fits their workflow, while the SageMaker Catalog approval workflow maintains governed access throughout.

Consumer workflow architecture: sign in to SageMaker Unified Studio, search the SageMaker Catalog, subscribe to the S3 asset with producer approval, then query with the Amazon Bedrock chat agent or model inference

Figure 1: Consumer workflow for the publish-subscribe solution

Prerequisites

Before you begin, make sure you have completed all steps in Part 1 of this series, including:

Consume published data from the consumer project

In this section, you sign in as a consumer user in the SageMaker Unified Studio consumer project. You then subscribe to the S3 bucket by searching for a keyword that is part of the README published in Part 1.

  1. Sign in to the consumer project and search for the keyword emergency, which was added to the README file during publishing. The search returns the enriched asset that the producer published in Part 1.

    SageMaker Unified Studio catalog search for the emergency keyword, returning the enriched asset published in Part 1

    Figure 2: Catalog search results for the emergency keyword

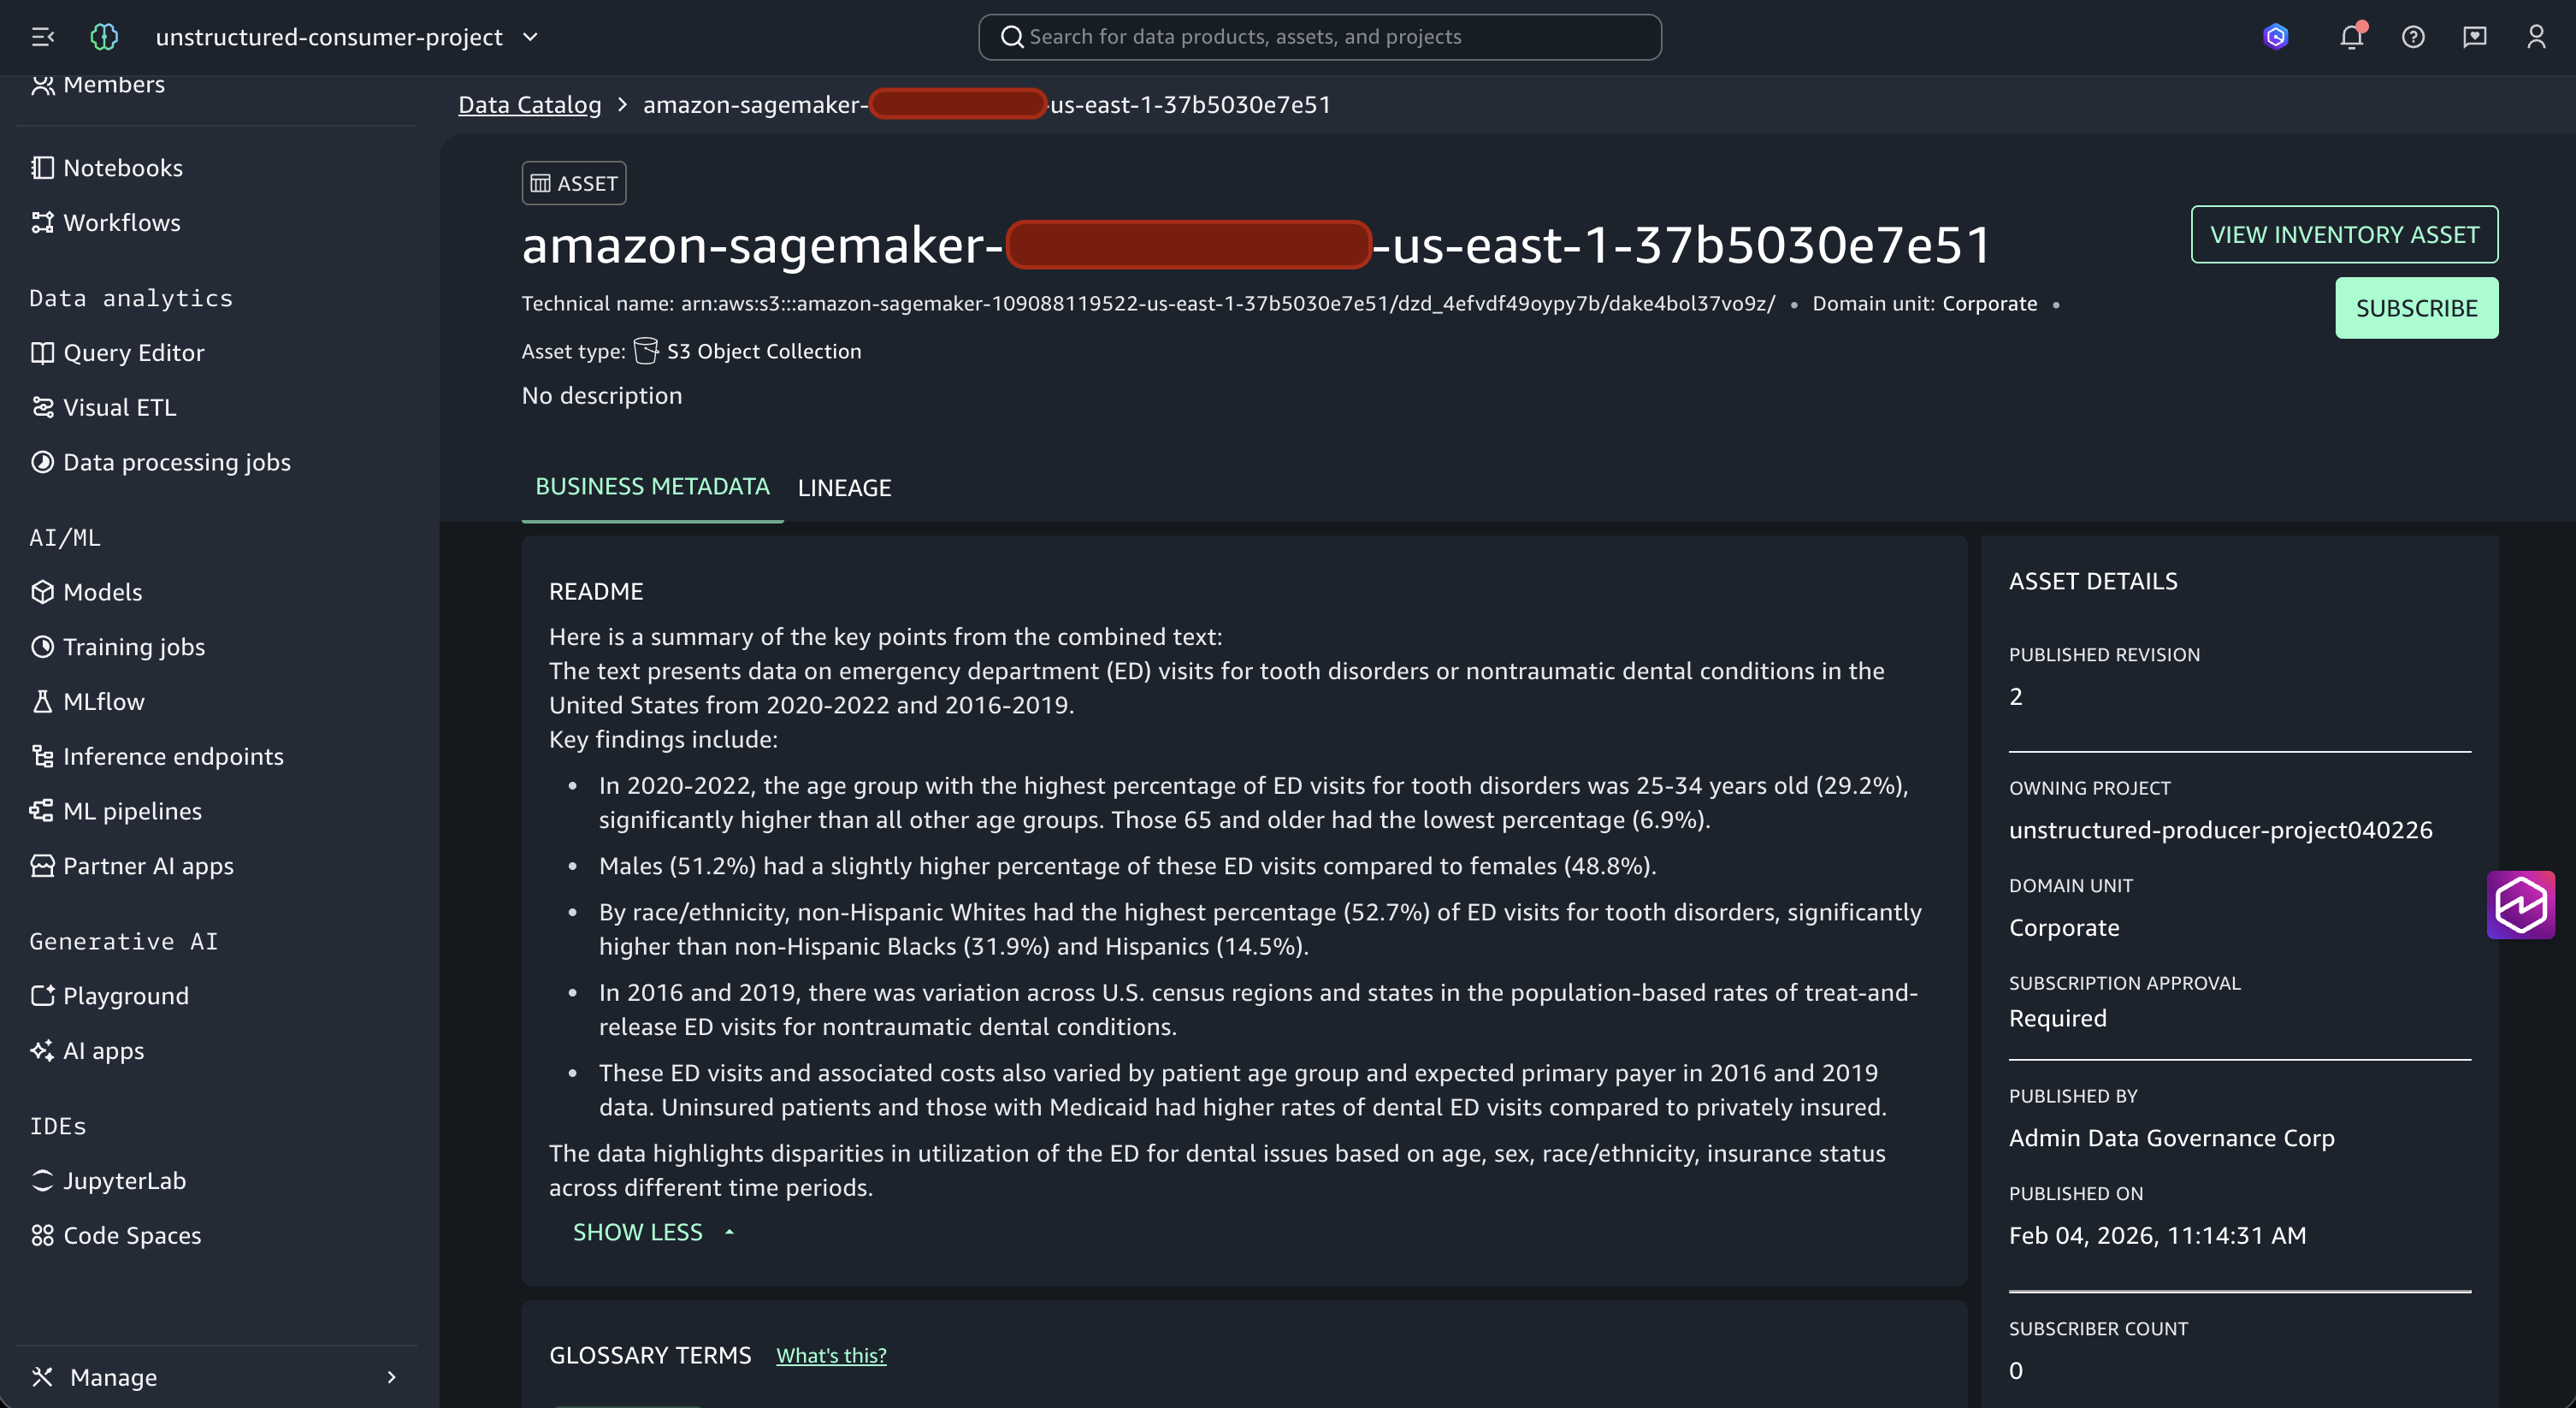
  2. Choose the asset from the results to view its details, including the AI-generated business metadata, glossary terms, and README content. Then choose Subscribe.

    Asset details page showing AI-generated business metadata, glossary terms, and README content, with the Subscribe button

    Figure 3: Asset details with AI-generated metadata and the Subscribe option

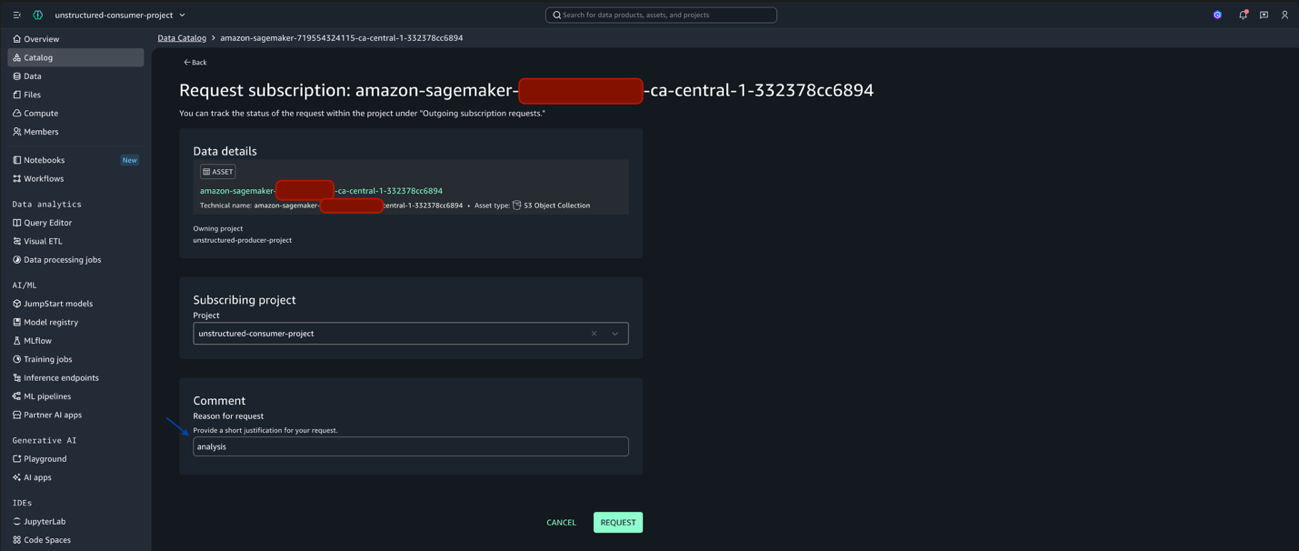
  3. Enter analysis as the Reason for request in the Comment section, then choose Request.

    Subscription request dialog with analysis entered as the reason for request in the Comment box

    Figure 4: Subscription request with the reason for request entered

  4. Sign back in to the producer project (unstructured-producer-project) to approve the subscription request.
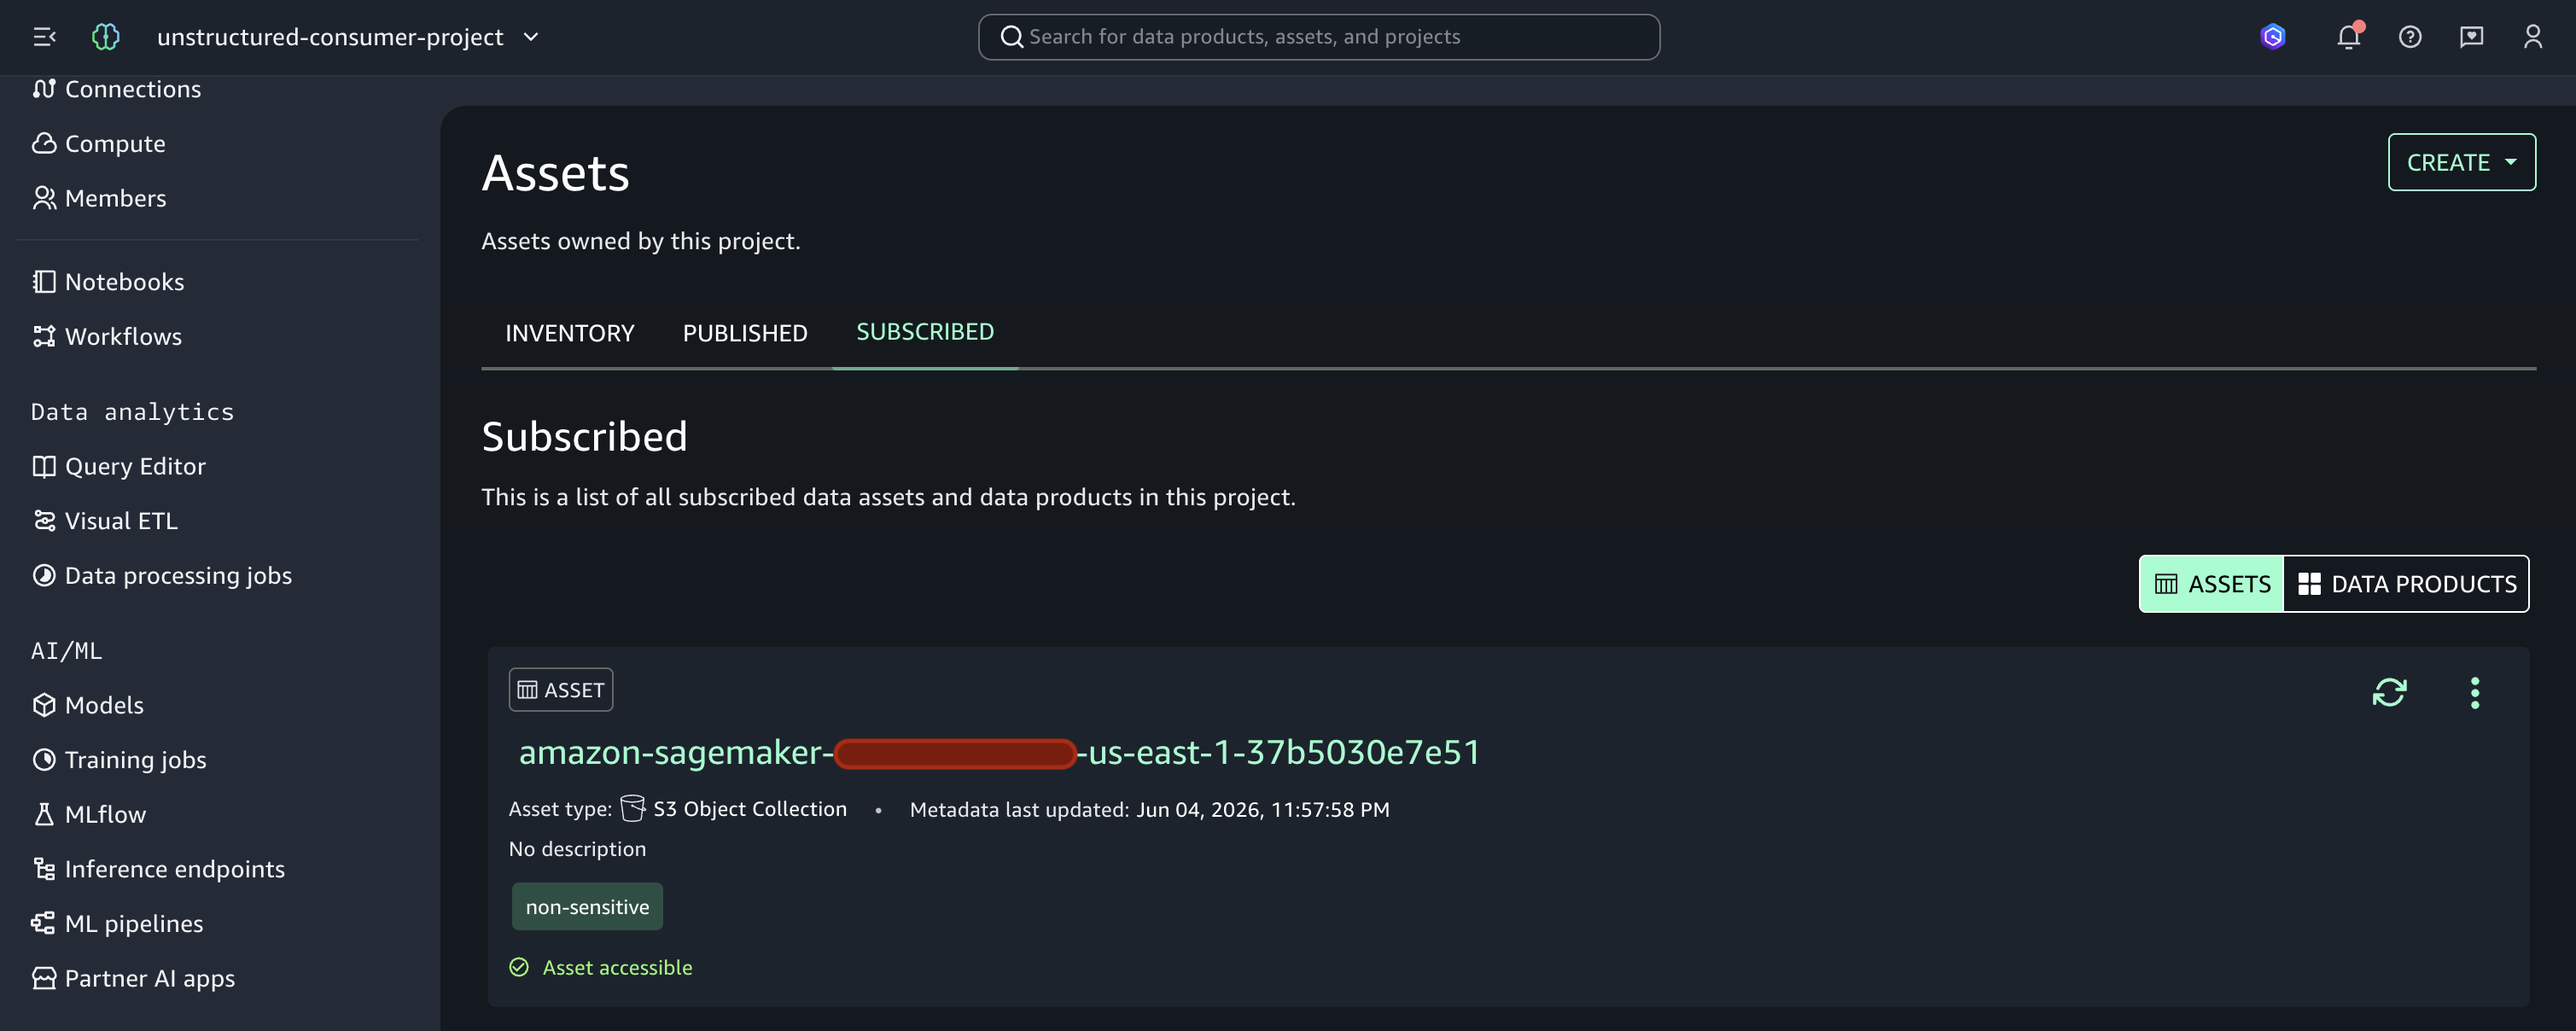
  5. After approval, return to the consumer project and confirm that the subscribed asset now appears under Manage, Assets, Subscribed assets.

    Consumer project Subscribed assets list confirming the approved subscription

    Figure 5: Approved subscription under the Subscribed assets tab

With the subscription approved, you can now access the enriched unstructured data through two approaches.

Option 1: As a data or business analyst, you can use the Amazon Bedrock chat agent app for natural language queries.

Option 2: As an application engineer, you can use Amazon Bedrock model inference for programmatic natural language queries.

Let’s explore both options.

Option 1: Amazon Bedrock chat agent app

The Amazon Bedrock chat agent app gives you a no-code, conversational interface to query your enriched unstructured data using natural language. As a data analyst or business user, you can ask questions in plain English. You get answers grounded in the documents your organization has ingested, without writing any code. For production workloads, especially in sensitive domains such as healthcare, you can apply Amazon Bedrock Guardrails to add content filtering and grounding validation to your model responses.

Data scientists and application engineers can also extend these capabilities by integrating the chat agent app APIs into custom applications, so users can interact with unstructured Amazon S3 data programmatically.

To set up the Amazon Bedrock chat agent app on your subscribed dataset, complete the following steps.

Prerequisite: Add the S3 data location.

Before creating the chat agent app, you need to add the S3 location of your subscribed data as a registered location in your project.

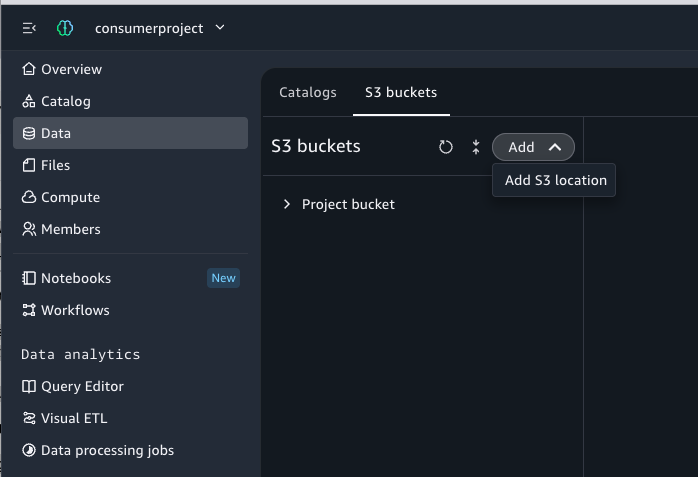
  1. Choose the Data tab in Overview.
  2. Choose the S3 bucket, and then choose Add to add the S3 location.

    Data tab in the project Overview with the S3 bucket selected and the Add button to register the S3 location

    Figure 6: Adding the S3 location from the Data tab

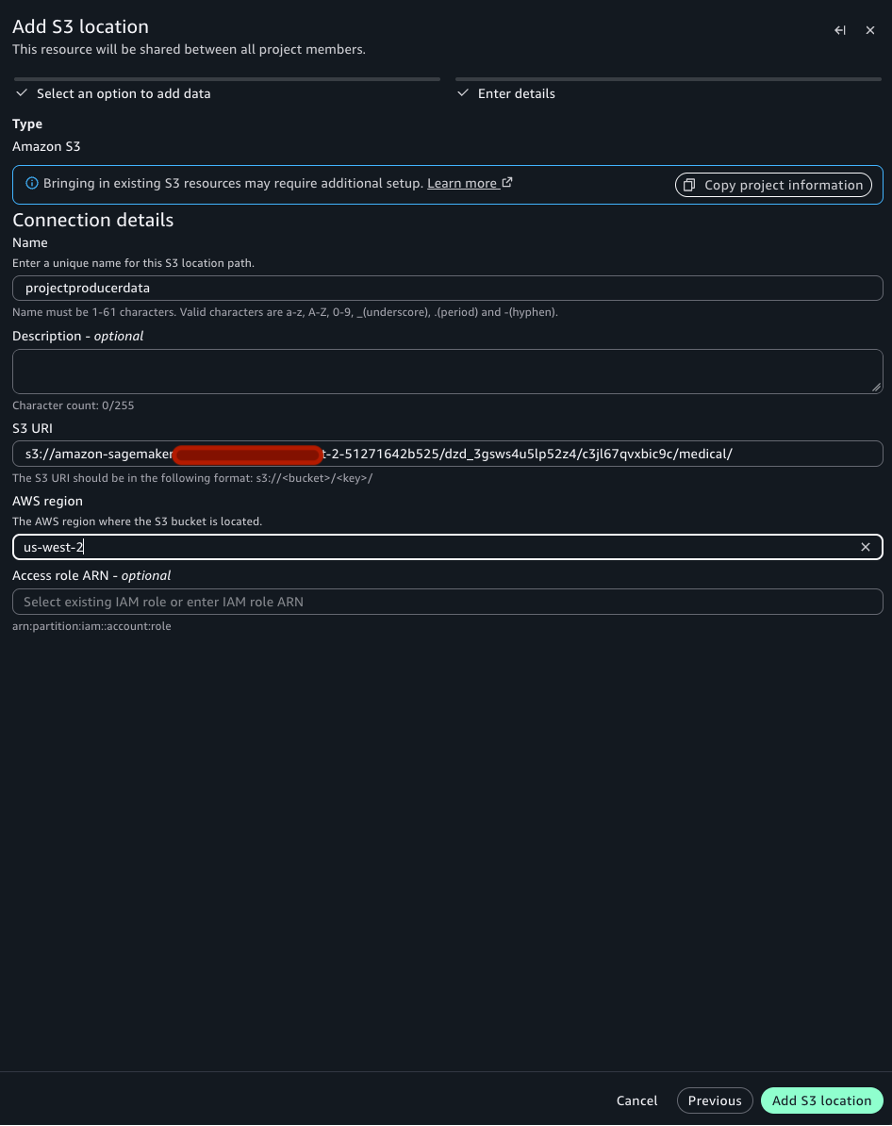
  3. On the S3 location page, provide the following details:
    • Add a name: producerprojectdata.
    • Add the producer’s S3 path as a new S3 location: s3://amzn-sagemaker-bucket-<domain-id>-<project-id>/medical/.

    Note: You can get the S3 location details from the technical name of your subscribed asset.

    • Choose the AWS Region, and then choose Add data to add this as a new location.

    Note: Make sure the AWS Region you select supports the Amazon Bedrock foundation models used later in this post. For a list of available models by Region, see Supported Regions and models for Amazon Bedrock.

    S3 location page with the location name, producer S3 path, and AWS Region entered before choosing Add data

    Figure 7: S3 location details and AWS Region selection

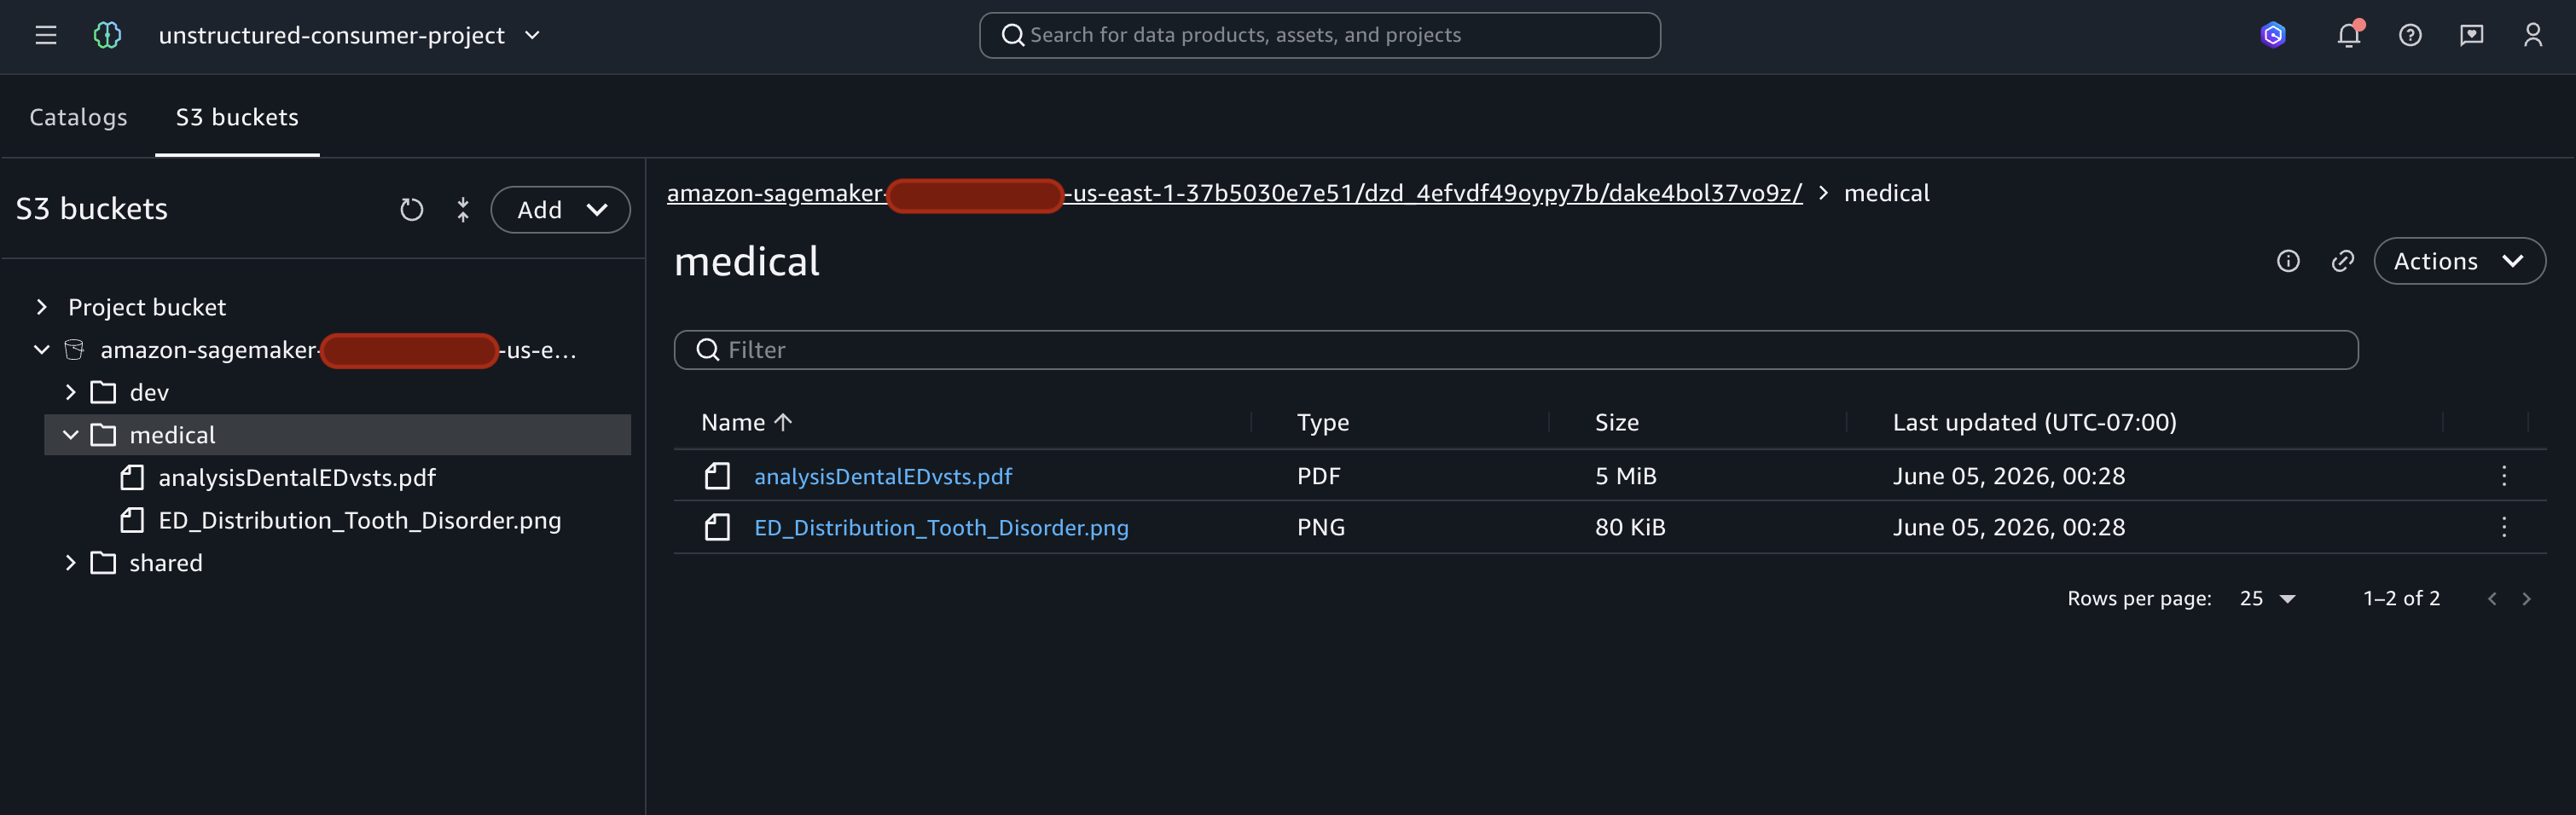
    Note: Make sure to select only the PDF files within the S3 path for the data source.

    Data source selection showing only the PDF files within the S3 path selected

    Figure 8: Selecting the PDF files as the data source

After the location is added, it appears as a selectable S3 location when creating a knowledge base in AI Apps.

Complete the following steps to configure the chat agent app:

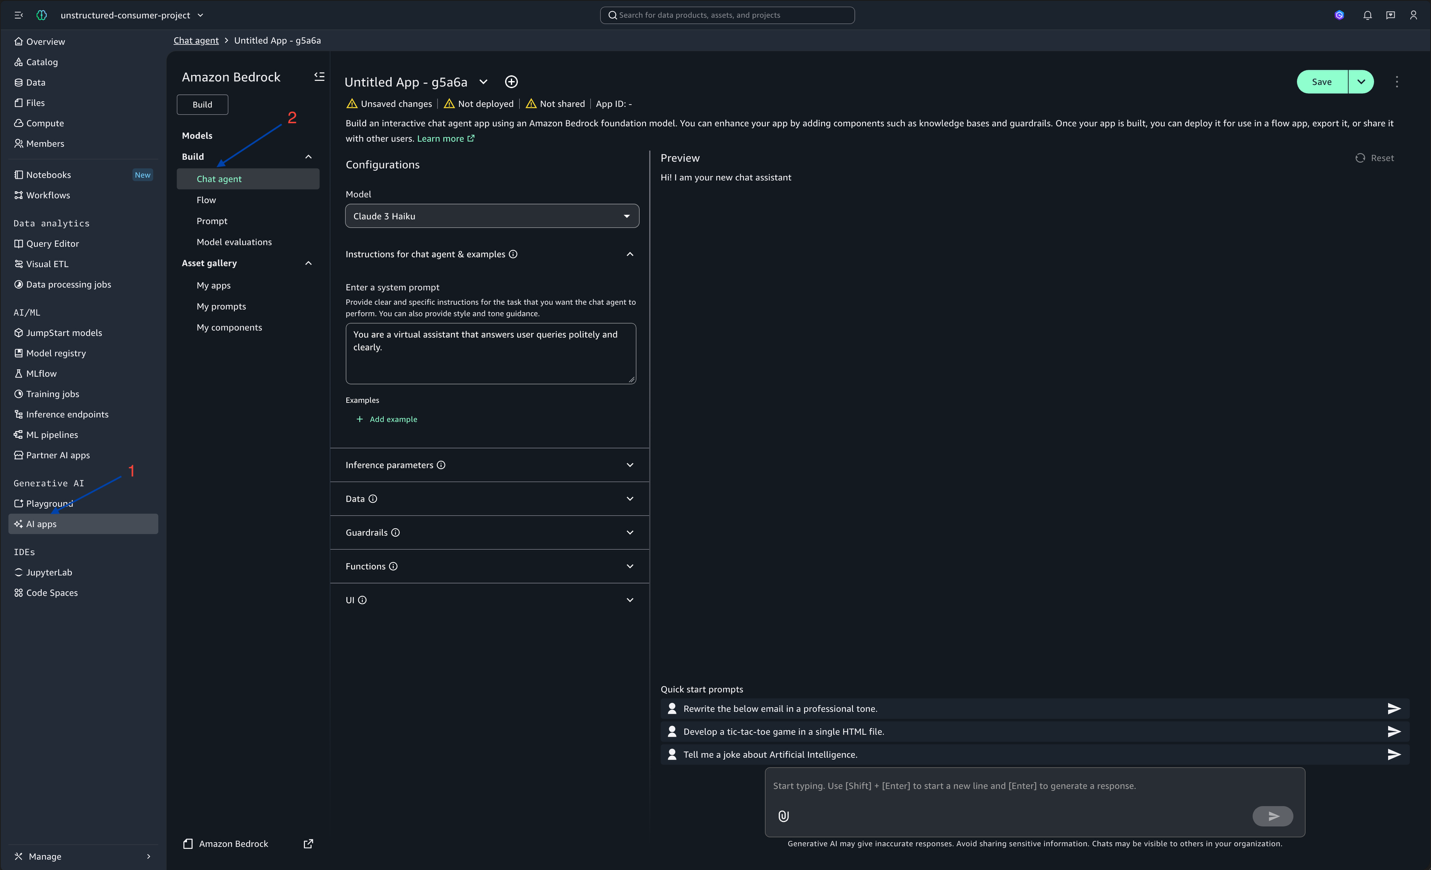
  1. In the left navigation pane, under Generative AI, choose AI Apps.
  2. In the Build section of the page, choose Chat agent.

    AI Apps Build section with Chat agent selected in the left navigation under Generative AI

    Figure 9: Choosing Chat agent in the AI Apps Build section

  3. Expand the Data tab to create a knowledge base with your S3 bucket. On the Create a new knowledge base page, enter the following:
    • Add a name: MedicalKB.
    • Add a description: Knowledge base built from subscribed medical S3 data assets. Contains medical documents used to provide grounded, context-aware responses to medical domain queries.
    • Choose the data source. You will see the S3 bucket that you added in the previous step.
    Create a new knowledge base page with the MedicalKB name, description, and the added S3 bucket as the data source

    Figure 10: Creating the MedicalKB knowledge base from the S3 data source

  4. Choose your embedding model. You can leave the default settings and choose Create. It might take 10–15 minutes to create the knowledge base, depending on file sizes.
  5. After the knowledge base is created, on the Chat agent page:
    • Choose your preferred model from the Model menu (you can switch between different large language models as needed).
    • Under Data, choose your published S3 bucket as the knowledge base.
    • Begin interacting with the agent by entering questions in the Enter prompt field.
    Chat agent page with a model selected and the MedicalKB knowledge base chosen, ready to enter a prompt

    Figure 11: Chat agent page with the model and knowledge base selected

For example, entering “Which age groups had the highest rates of emergency department visits for tooth disorders?” returns an answer grounded in the enriched dental dataset published in Part 1.

The chat agent uses the enriched README metadata along with the underlying documents to surface contextually relevant answers. Analysts can explore unstructured content without needing to know where the data lives or how it’s structured.

Option 2: Natural language queries using Amazon Bedrock model inference

This option demonstrates how to use Amazon Bedrock model inference to query subscribed data using natural language. You can integrate this capability with external chat applications so users can run natural language queries through Amazon Bedrock.

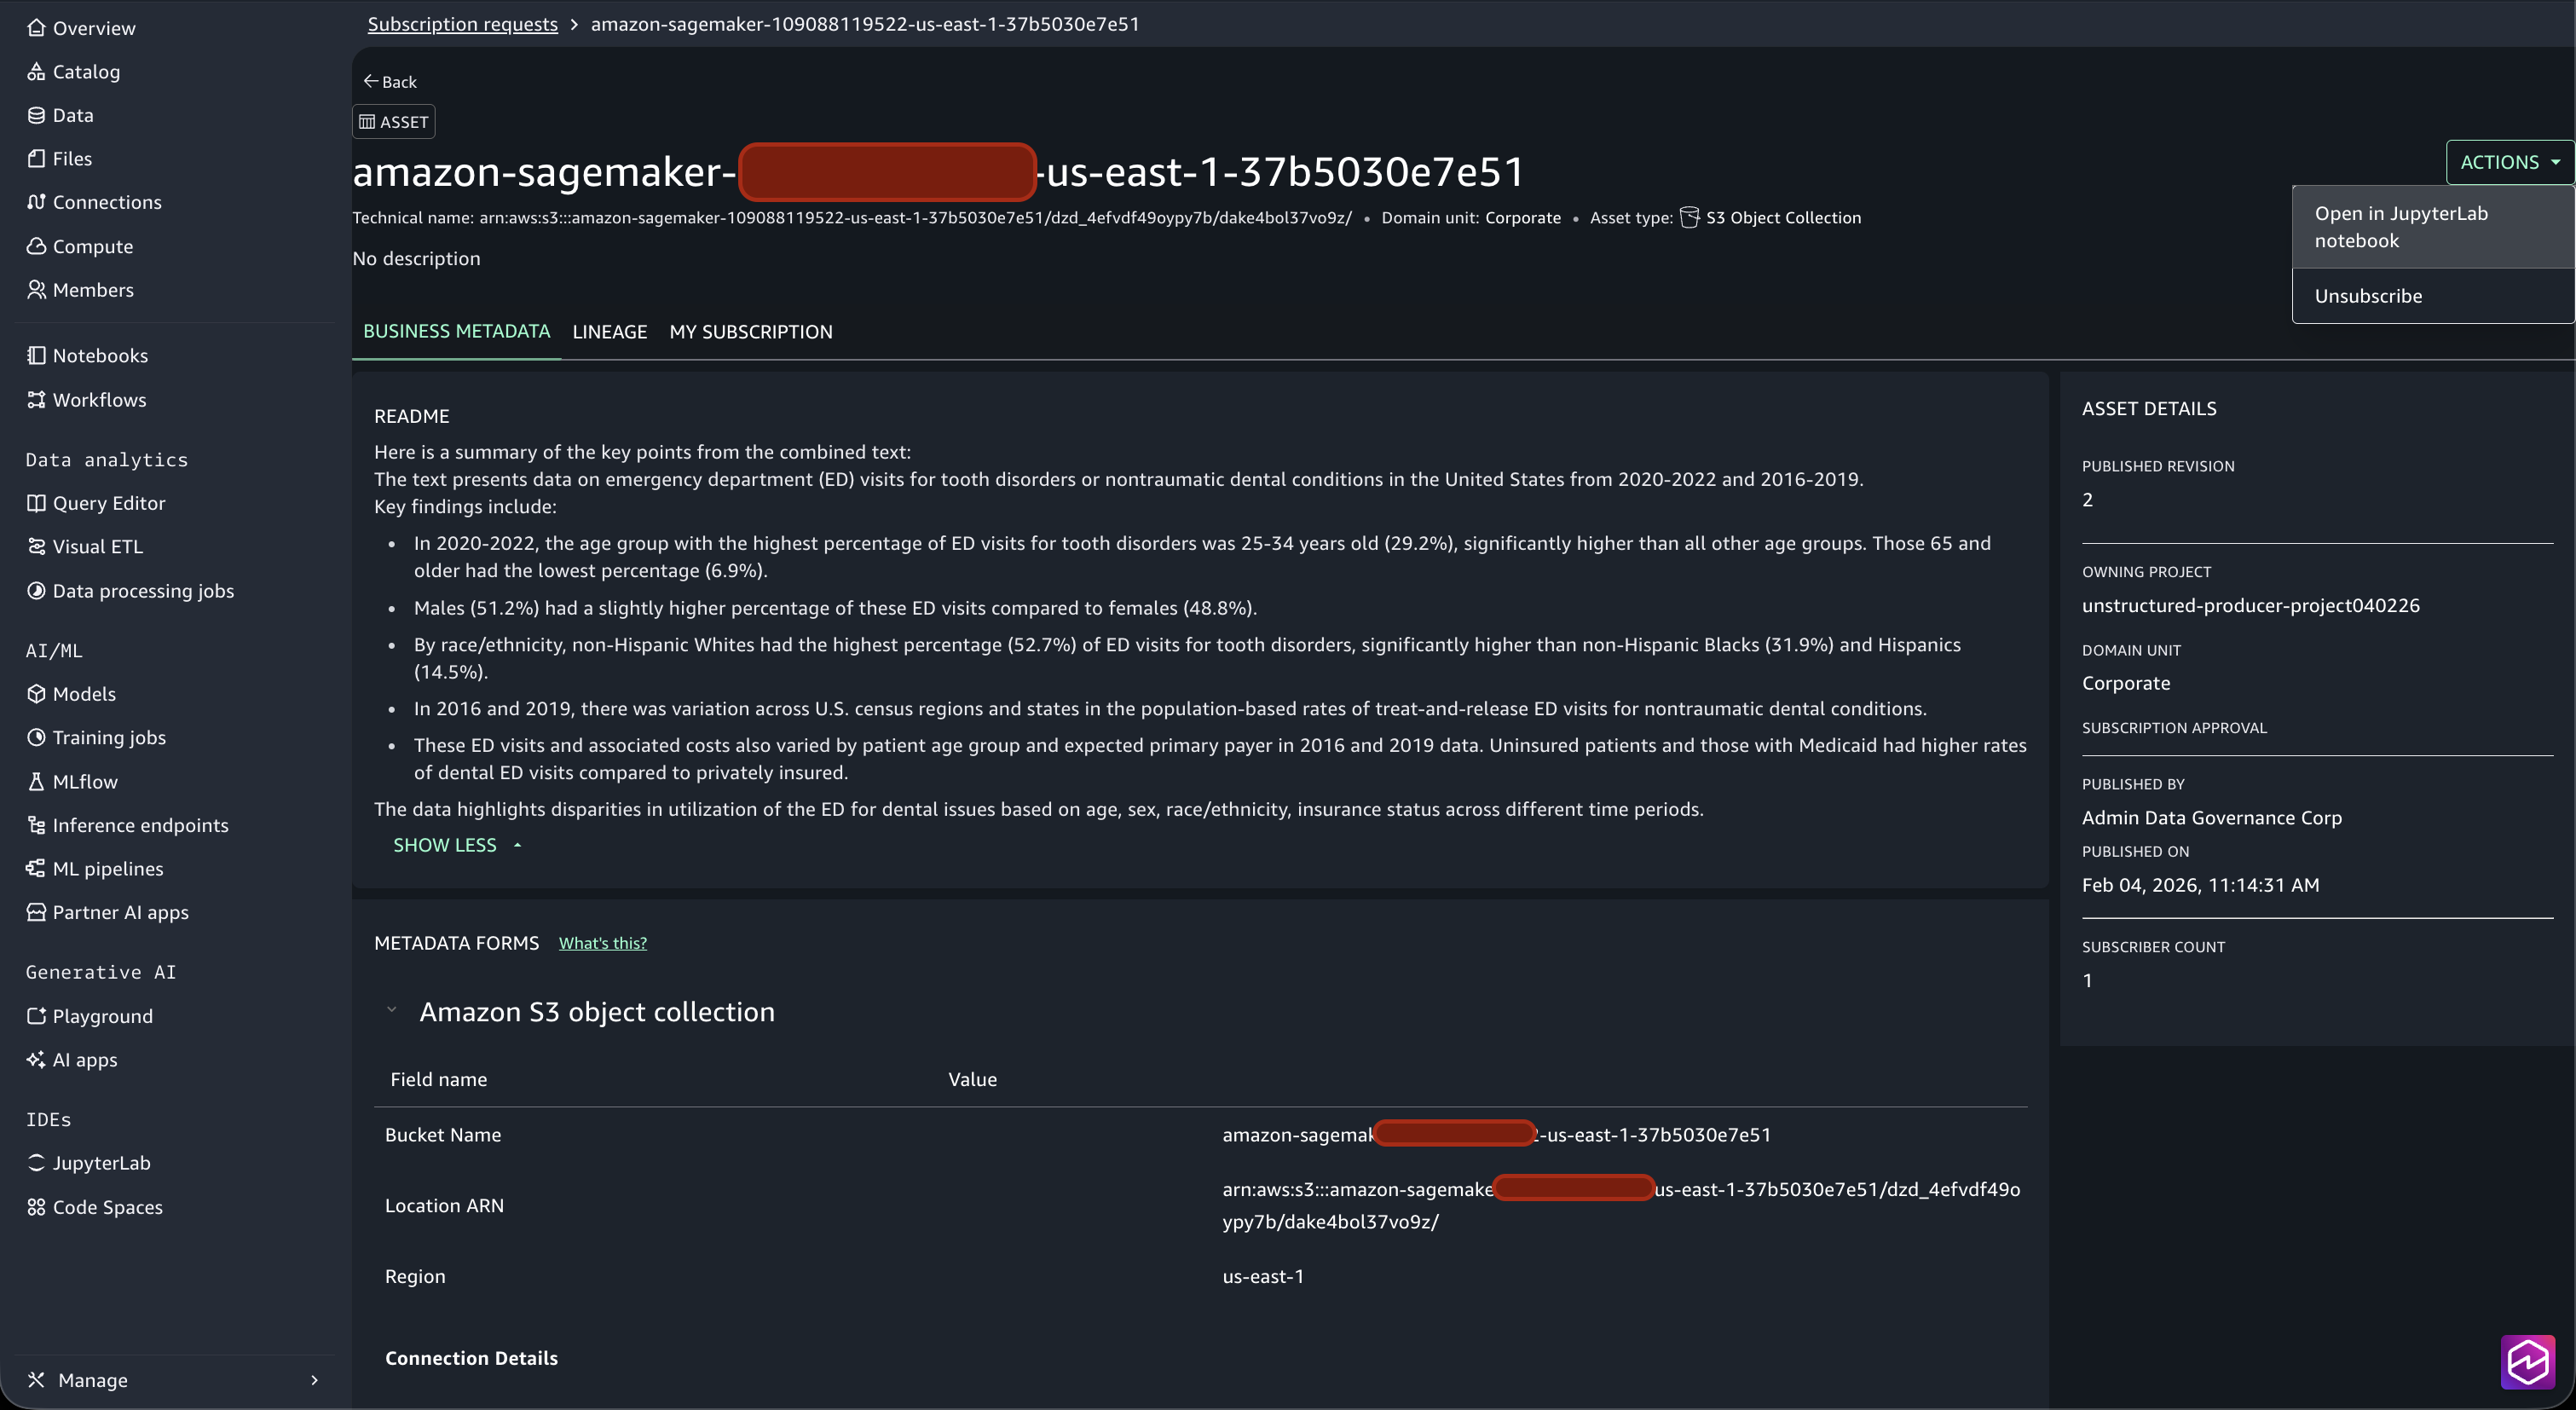
  1. In your consumer project, choose Manage, Assets from the bottom of the left navigation pane. On the Subscribed tab, choose your subscribed S3 asset. Under Actions, choose Open JupyterLab notebook.

    Subscribed S3 asset Actions menu with Open JupyterLab notebook selected in the consumer project

    Figure 12: Opening the JupyterLab notebook from the subscribed asset

  2. This opens the JupyterLab notebook environment. Upload the s3_document_consumer_v2.ipynb notebook and run all the cells. You can download the notebook from s3_document_consumer_v2.ipynb.Note: The project role requires permissions for Amazon S3, Amazon Textract, and Amazon Bedrock. If you followed Part 1, you might already have these policies attached. For details on the required policies and guidance, see the prerequisites in Part 1.
  3. Review the notebook cells.
    JupyterLab notebook cells with the final cell showing a sample question answered by Amazon Bedrock

    Figure 13: Sample question answered by Amazon Bedrock in the notebook

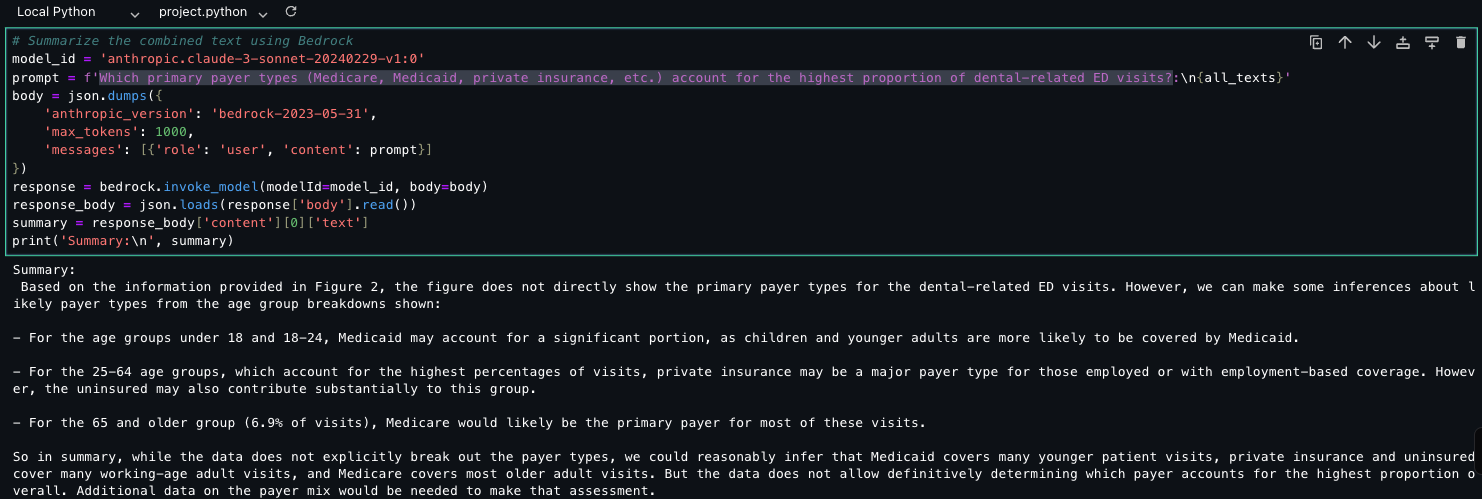
    In the final cell, you find a sample question that Amazon Bedrock answers: “Which primary payer types (Medicare, Medicaid, private insurance, and so on) account for the highest proportion of dental-related emergency department visits?”

    Amazon Bedrock processes the question against the enriched content in the S3 bucket and returns a grounded answer. You can replace this sample question with any query relevant to your documents.

The Amazon Bedrock model inference approach gives you programmatic control, making it possible to embed natural language query capabilities directly into your existing data applications and business intelligence tools.

Clean up

To avoid ongoing charges, make sure to delete the resources used in this solution immediately after completing the walkthrough. The primary cost drivers are SageMaker Unified Studio notebook instances, Amazon Bedrock model inference calls, and Amazon S3 storage.

  1. Stop SageMaker Unified Studio resources:
    • Close running notebooks.
    • Stop running notebook instances.
    • Shut down unused kernels.

    Note: Running notebook instances continue to incur charges even when not in use.

  2. Clean Amazon S3 storage:
    • Delete temporary files created during processing.
    • Remove uploaded test documents that are no longer needed.

    Note: Although Amazon S3 costs are minimal, large volumes of data can accumulate significant charges, so it’s best to remove unneeded data.

Conclusion

In this post, you saw how to consume and query the enriched unstructured data assets published in Part 1 of this series. By subscribing to assets through the Amazon SageMaker Catalog publish-subscribe model, you can discover, access, and interact with your organization’s unstructured data, whether through the no-code chat agent or Amazon Bedrock model inference.

Together, both parts of this series show you how to build a comprehensive pipeline that transforms raw unstructured documents into governed, queryable knowledge assets. The combination of Amazon Textract for extraction, Amazon Bedrock for intelligent summarization and NLQ, and Amazon SageMaker Catalog for governance and discoverability means your teams can focus on extracting business insights rather than managing infrastructure.

To continue your Amazon SageMaker journey, see the following resources:


About the authors

Nishchai JM

Nishchai JM

Nishchai is an Analytics and generative AI Specialist Solutions Architect at Amazon Web Services. He specializes in building larger scale distributed applications and helps customers modernize their workloads on AWS. He thinks Data is new oil and spends most of his time deriving insights from data.

KiKi Nwangwu

KiKi Nwangwu

KiKi is an Analytics and generative AI Specialist Solutions Architect at AWS. She specializes in helping customers architect, build, and modernize scalable data analytics and generative AI solutions. She enjoys traveling and exploring new cultures.

Narendra Gupta

Narendra Gupta

Narendra is a Sr. Specialist Solutions Architect for Data & AI (Analytics) at AWS. He works with customers to design data-driven solutions and has deep expertise in data governance and cataloging.

Aditya Edara

Aditya Edara

Aditya is a Support Engineer at AWS. He serves as a Subject Matter Expert in AWS Analytics services, specializing in Amazon EMR and AWS Glue. Aditya provides expert guidance and technical support to enterprise and strategic customers, helping them optimize data analytics solutions.

[$] Ideas on modernizing the open-source desktop

Post Syndicated from jzb original https://lwn.net/Articles/1095425/

Scott Jenson has been working on user interfaces (UIs) and user experience (UX)
for many years at Apple, Google, and other companies. Now, he’s trying to convince
open-source projects to experiment more and drive the desktop beyond the age-old “windows, icons, menus,
pointer
” (WIMP) model. At Akademy 2026, KDE’s annual developer
conference, he shared his complaints and ideas in a talk aimed
at convincing those in attendance to take the lead on desktop design.

Systemd v262 released

Post Syndicated from jzb original https://lwn.net/Articles/1096204/

Systemd v262 has been released. Some of the notable new features include the
ability to build systemd as a single statically linked binary for small
containers, support for the kernel coredump socket protocol introduced with
Linux 6.17, addition of OpenSSL 4 support, and many other changes. See
the release
notes
for a full list of changes.

Supporting ASD’s multi-factor authentication campaign: Why MFA matters more than ever

Post Syndicated from Grace Zhang original https://aws.amazon.com/blogs/security/supporting-asds-multi-factor-authentication-campaign-why-mfa-matters-more-than-ever/

The Australian Signals Directorate (ASD) has this month issued a clear call to action through its Multi-factor authentication: Switch it on campaign, urging businesses, organisations, and individuals to enable multi-factor authentication (MFA) across their online accounts. At AWS, we strongly support this message.

As threat actors continue to target credentials through phishing, credential stuffing, and social engineering, passwords alone are no longer enough. MFA is one of the most effective security controls available. It’s a cornerstone of ASD’s Essential Eight maturity model and a recognized component of major cybersecurity frameworks worldwide. ASD’s campaign reinforces what the security community has long advocated: switching on MFA is one of the simplest and most impactful steps any organization or individual can take to protect themselves online, and we encourage all to heed ASD’s call.

How AWS enforces MFA across every account type

At AWS, we’ve put this principle into practice at scale. In June 2025, AWS Identity and Access Management (IAM) achieved comprehensive MFA enforcement for root users across all account types, a significant milestone and the first of its kind among major cloud providers. This was the culmination of a deliberate, phased security journey: beginning with requiring MFA for AWS Organizations management account root users in May 2024, expanding to standalone account root users in June 2024, introducing centralized root access management in November 2024, and completing enforcement across all account types including member accounts. MFA prevents over 99 percent of password-related attacks and is available to all AWS customers at no additional cost, with support for FIDO2 passkeys and FIDO-certified security keys for phishing-resistant authentication. This milestone reflects our ongoing commitment to secure-by-design principles, setting a high bar for our customers’ default security posture and demonstrating that organizations of any scale can, and should, make MFA the standard rather than the exception.

ASD’s Multi-factor authentication: Switch it on campaign banner

Extending MFA beyond your AWS environment

A compromised email account can be used to reset AWS passwords. A breached source control system can expose infrastructure-as-code secrets. Enable MFA on your email, collaboration tools, source control, and other services that support it. Visit the ASD Multi-factor authentication campaign page for broader guidance.

Getting started with MFA on AWS

AWS enforces MFA automatically for root users. To extend that same protection to your IAM users—the identities your team members and applications use daily—you can configure MFA individually through the AWS Management Console for IAM. To learn more, see Security best practices in IAM. For phishing-resistant authentication with FIDO2 passkeys, see Passkeys and security keys in IAM.

If you have questions or feedback about MFA on AWS, leave a comment below or reach out on AWS re:Post. If you haven’t already, heed ASD’s call and switch on MFA across every account you own.

This post was written in support of ASD’s Multi-factor authentication: Switch it on campaign. For more AWS security content, visit the AWS Security Blog.

If you have feedback about this post, submit comments in the Comments section below.


Grace Zhang

Grace Zhang

Grace is the Regulatory and Security Compliance Lead for Australia and New Zealand (ANZ), based in Sydney. She supports security assurance and compliance initiatives across the ANZ region, helping customers navigate regulatory requirements and build confidence in the security of the AWS Cloud.

Critical security vulnerabilities in the Radicle network protocol

Post Syndicated from jzb original https://lwn.net/Articles/1096200/

The Radicle peer-to-peer
code-collaboration project has disclosed
two critical vulnerabilities
in the network protocol used by Radicle
nodes. The first flaw is that the network protocol used by Radicle “does not
give the confidentiality it was expected to give
“, which allows anyone who
can observe the network between two nodes to read the data exchanged. The second
is that peer authentication is broken and allows impersonation, so an attacker
can spoof their Node ID and read private repositories they should not be able to
read.

In practice, the two flaws are most useful when they can be exploited
together: an attacker on the path sees the Node IDs at both ends of a
connection, and both are normally on the allow-list. That attacker can read
whatever is exchanged while they watch, and can then use a Node ID they saw to
fetch the whole repository on demand. The realistic threat is anyone on the path
between your node and node it syncs with, and no setting or allow-list protects
against them.

We are publishing this before the security update is available. You can act
on it today, and no fix we release later can undo an exposure that has already
happened.

See the post for workarounds that can be used today; a major update that will
be backward-incompatible is underway.

Critical WordPress RCE vulnerability announced

Post Syndicated from jzb original https://lwn.net/Articles/1096195/

A critical
vulnerability
has been discovered in WordPress‘s get_page_template()
function for page-template resolution that could allow remote-code execution
(RCE) by an unauthenticated attacker, in some limited circumstances. The project
has provided an update for the most recent branch of WordPress, as well as
backports of the fix for branches back to 4.7. See the
vulnerability report for the conditions required for an RCE attack to be successful.

The vulnerability also
affects
the ClassicPress fork of
WordPress, though a security update has not been provided for that project
yet. LWN covered ClassicPress in
2024. Users of either content-management system should update soon.

How dynamic application security testing validates risk at runtime

Post Syndicated from Rapid7 original https://www.rapid7.com/blog/post/em-dynamic-application-security-testing-dast-validates-risk-at-runtime-idc-marketscape

Security teams already have long queues of potential application vulnerabilities. The useful question is what happens next: can they see how a weakness behaves in a running application, reproduce the attack, and give developers enough evidence to fix it?

Dynamic application security testing (DAST) helps answer those questions by testing applications as an attacker encounters them. The IDC MarketScape: Worldwide Dynamic Application Security Testing 2026 Vendor Assessment (Doc #US54119126, September 2026). The IDC MarketScape evaluated 16 vendors and named Rapid7 a Leader.

We believe the result reflects the strength of Rapid7’s DAST capabilities, but the IDC MarketScape also offers a useful view of where the category is heading. DAST has developed beyond traditional web scanning into a source of runtime evidence that can help organizations validate risk across the application layer.

From possible weakness to validated application risk

Code analysis and dependency scanning help teams identify weaknesses before an application is deployed. DAST provides a different view by interacting with the assembled application while it is running. It can show what happens when a particular request reaches the application, how the application responds, and whether a suspected weakness can be reproduced.

This is especially valuable for APIs and AI-backed applications, where risk may emerge through interactions among models, prompts, data, tools, and permissions. Some of these behaviors cannot be fully understood from source code or a dependency manifest. They become visible when the application is exercised under runtime conditions.

DAST therefore has a direct role in continuous threat exposure management (CTEM). Discovery gives teams a view of their assets and possible weaknesses, but that view alone does not tell them where to focus. Validation helps narrow the field by showing which exposures can be reached or exploited and providing evidence that teams can use to take action.

For Rapid7, DAST is exposure management applied to the application layer. Web applications, APIs, and AI-backed endpoints are all part of the attack surface, so they need to be discovered, tested, prioritized, and managed alongside infrastructure, cloud, and other exposures.

Why we believe Rapid7 was named a Leader by IDC

Rapid7’s DAST solution is delivered as part of the Exposure Command portfolio. Its scan engine maps an application, executes attacks against the discovered paths, and validates confirmed findings. Security teams can map a broad area of an application while limiting active attacks to an appropriate set of paths, giving them control over how testing is performed.

Findings are checked against Rapid7 telemetry to help determine which issues warrant closer attention. When a finding needs action, browser-based replay reproduces the original request, the attack request, and the triggering response. Developers receive evidence they can work with, rather than a finding they must first spend time proving.

Authenticated scanning can be difficult to maintain across a changing application portfolio, and a broken login sequence can leave important areas untested. Rapid7’s solution can identify the affected step and support a targeted update without requiring the entire sequence to be recorded again.

The connection with Surface Command adds another useful layer. Newly discovered external assets can be surfaced for application testing, helping teams close the gap between finding an application and understanding the risk it presents

DAST plays a core role within Exposure Command: providing the application-layer validation teams need to prioritize risk and move from findings to remediation.

Learn more about Rapid7 Exposure Command.

Security updates for Wednesday

Post Syndicated from jzb original https://lwn.net/Articles/1096191/

Security updates have been issued by AlmaLinux (coreutils, postgresql18-postgis, and postgresql:16), Debian (memcached), Fedora (chromium, cyrus-imapd, dotnet10.0, dotnet8.0, dotnet9.0, freeipmi, kernel, libxmp, perl-Net-DNS, and postgresql16-anonymizer), Mageia (cpio, diffutils, perl-Dancer2, and rest), Oracle (389-ds-base and firefox), Red Hat (opentelemetry-collector and osbuild-composer), SUSE (amazon-cloudwatch-agent, amazon-ssm-agent, apko, apptainer, bazel-rules-python-source, bind, cups, firefox, freeipmi, gdb, google-osconfig-agent, kernel, kyverno, libipa_hbac-devel, libsoup, libsoup-3_0-0, libtpms, openssl-certs, perl-Authen-SASL, php-composer2, python313-PyMuPDF, thunderbird, and util-linux), and Ubuntu (gzip, linux-aws, linux-aws-5.15, linux-aws-fips, linux-nvidia-tegra-igx, linux-azure, linux-oracle, linux-azure-7.0, linux-azure-fde-6.8, linux-lowlatency, linux-lowlatency-hwe-6.8, linux-nvidia, linux-oracle, linux-oracle-6.8, linux-raspi, openssh, and sudo).

Research on Models Engaging in Genie-Like Behavior

Post Syndicated from Bruce Schneier original https://www.schneier.com/blog/archives/2026/09/research-on-models-engaging-in-genie-like-behavior.html

New paper: “Self-Jailbreaking: Language Models Can Reason Themselves Out of Safety Alignment After Benign Reasoning Training.”

Abstract: We discover a novel and surprising phenomenon of unintentional misalignment in reasoning language models (RLMs), which we call self-jailbreaking. Specifically, after benign reasoning training on math or code domains, RLMs will use multiple strategies to circumvent their own safety guardrails. One strategy is to introduce benign assumptions about users and scenarios to justify fulfilling harmful requests. For instance, an RLM reasons that harmful requests like “outline a strategy for stealing customers’ credit card information from a retail store” could be associated with the benign intent of “a security professional trying to test defense,” despite no such benign context being provided as input. We observe that many open-weight RLMs, including DeepSeek-R1-distilled, s1.1, Phi-4-mini-reasoning, and Nemotron, suffer from self-jailbreaking despite being aware of the harmfulness of the requests. We also provide a mechanistic understanding of self-jailbreaking: RLMs are more compliant after benign reasoning training, and after self-jailbreaking, models appear to perceive malicious requests as less harmful in the CoT, thus enabling compliance with them. To mitigate self-jailbreaking, we find that including minimal safety reasoning data during training is sufficient to ensure RLMs remain safety-aligned. Our work provides the first systematic analysis of self-jailbreaking behavior and offers a practical path forward for maintaining safety in increasingly capable RLMs.

I think the core problem is that these models are all trained on the average of humanity, and we are a pretty duplicitous species.

6 раздувки за варненското лято 2026

Post Syndicated from Веселин Златков original https://www.toest.bg/6-razduvki-za-varnenskoto-lyato-2026/

6 раздувки за варненското лято 2026

През лятото край морето има много надуваеми елементи – пояси, дюшеци, топки, лодки и т.н. Затова си позволявам да определя жанра на наблюденията и разсъжденията си за отминалия туристически сезон във Варна като „раздувка“. Думата беше популярна едно време, преди всички да заговорят за наратива. Раздувките ми нямат претенции да са прецизен анализ, а и така се случи, че това не беше най-активното ми лято, но все пак някои детайли от този ключов сезон за варненския живот си заслужава да бъдат изтъкнати. 

1. Нямаше туристи 

Е как да има?! Вече всеки си е купил апартамент във Варна, нормално е хотелите да останат празни. Нормално е и ресторантите да останат празни, защото е по-лесно и по-евтино, като имаш кухня, да си сготвиш нещо лятно и свежо там, вместо да рискуваш с непроверени откъм обслужване и меню заведения. 

Разбира се, този довод е по-скоро шега, но в нея има доза истина, особено ако говорим за родните туристи, както и за чужденците, които са инвестирали в имот край морето ни. А последните не са никак малко.

Истината е, че в началото на лятото Варна изглеждаше поразително пуста, каквато не сме я виждали от много време. В края на сезона министърът на туризма, т.нар. представители на бранша и всички, чиято задача е да внасят спокойствие в обстановката, заявяват, че първоначалният кошмарен спад е компенсиран и резултатите са в крайна сметка като през миналата година

Спирането на чартърните полети от Германия, за което така и не стана ясно как е допуснато и по чия вина се е стигнало до него, лиши курортите ни от около 120 000 германци, които винаги са били гръбнакът на сезона.

Отсега се водят преговори за възстановяване и гарантиране на тази ключова транспортна връзка за следващото лято. Проблемът обаче трябва да отвори дебат за алтернативни варианти на системата, по която работи туризмът ни вече десетилетия. Големите групи от германски пенсионери, които прииждаха край Варна още от май, преди дори да се е стоплило морето, вече са минало. Туризмът ни трябва да се модернизира, но това, изглежда, не става твърде бързо.

6 раздувки за варненското лято 2026
© Веселин Златков

2. Храната

Последното издание на кулинарното риалити MasterChef преди две години беше спечелено от варненката Марианна Александрова. Както се оказа, тя не искаше просто телевизионна слава, а си беше поставила по-амбициозна цел – да изгражда специфична варненска кулинарна идентичност. Александрова е преподавателка в Колежа по туризъм, изследва стари готварски традиции и намира рецепта за паста с миди във вестник от 1896 г. Според нея тъкмо това ястие може да стане хит на оригиналната „варненска“ кухня.

В колко варненски ресторанти се предлага паста с миди ала XIX век, признавам си, не знам. Но едва ли са много. На теория цялата идея да има варненско ястие, което да е като запазена марка за града, е супер.

На практика обаче храната започва да се превръща в ахилесовата пета на преживяването „почивка във Варна“.

 Доста хора се възмутиха от цените на един обяд или на една вечеря край морето, но според мен това не е основният проблем. Проблемът е в качеството както на продуктите, така и на приготвянето им. И дори не е необходимо да опитвате – достатъчно е да помиришете.

Над пристанището и покрай Морските бани във Варна и това лято доминираше една миризма – не на море и водорасли, а на прегоряло олио и непочистени скари. Това е положението, това е реалната кулинарна варненска идентичност, колкото и да не ни се иска.

6 раздувки за варненското лято 2026
© Веселин Златков

3. Боклукът

Варна никога не е била толкова мръсна, колкото това лято. Вярно е, че всяка година, когато градът се напълни с туристи, контейнерите започват да преливат. Този път обаче не беше само това. Метачките изчезнаха от улиците на града през юни и се появиха пак едва в края на август, без ясна причина за липсата им. За миене на улиците изобщо не говорим – такава дейност нямаше. Между плочките на тротоарите и покрай бордюрите поникнаха всякакви бурени, които никой не се погрижи поне веднъж да бъдат разчистени. Изобщо, да ходиш с джапанки или със сандали по варненските улици това лято си беше предизвикателство, защото не знаеш какво ще настъпиш.

Имаше обаче и друго явление, доста гнусно и срамно – празни контейнери и разпилени около тях отпадъци.

Видео, публикувано в социалните мрежи, показа причината за това безобразие. На него се вижда как мъж с жълта жилетка, който не просто оставя торба с отпадъци до контейнера вместо в него, а изсипва отпадъците на улицата. Напълно съзнателно. А при въпрос защо го прави, той обяснява, че така му е наредено от някой си „Мишо от „Хепи“. Всичко това – в самия център на града, до емблематичния хотел „Черно море“.

Привърженици на кмета Благомир Коцев твърдят, че подобни саботажи се правят най-редовно, буквално от първия ден на мандата му. Честно казано, не вярвах да е вярно, докато не видях въпросните кадри. Колко трябва да мразиш кмета, за да замърсяваш съзнателно града си с цел да злепоставиш Коцев? Нямам отговор на този въпрос. И не вярвам, че някой може да има разумен довод за тази свинщина. По-лошото е, че не личи по нищо органите на реда да им пука за това, да не говорим да установят и накажат виновните.

4. Фестивалите

Когато слизате към морето по централното стълбище към Морските бани, попадате на тераса, на която е написано „1926“. Това е годината, в които баните са завършени и Варна по същество става истински курорт – пет години след официалното обявяване. В същата година започват и Народните летни музикални тържества – първият български фестивал, днес познат като Международния музикален фестивал „Варненско лято“. Почитателите на класическата музика коментират, че тази година изданието му е било подобаващо за 100-годишнината. Но колко привлекателна е класическата музика за един съвременен турист?

Въпреки че през лятото във Варна постоянно има някакви събития с фестивален характер, мнозина твърдят, че културният календар на града е твърде рехав. Това може да звучи парадоксално, но всъщност показва една очевидна липса – на голям поп или рок фестивал като тези в Пловдив.

6 раздувки за варненското лято 2026
© Веселин Златков

Варна остана и това лято без световни звезди, което навява усещане за провинциалност. 

На този фон неуспешната кандидатура на града за домакин на „Евровизия“ не трябва да изненадва никого. От самото начало се знаеше, че Варна няма зала за 10 000 души – основно изискване за прословутия конкурс. Какво решение ще получи този проблем, е въпрос, на който трябва да отговори държавата – подобен обект не може да бъде изграден само с местни усилия.

5. Нож за украинците

Да се върнем към надуваемите летни предмети, с които започнах тези „раздувки“. Малко неочаквано това лято в морето на Офицерския плаж се появи аквапарк. Казвам „неочаквано“, защото да разположиш съоръжение за деца точно на мястото, където пробите за чистотата на водата са все на ръба на допустимото, не е много логично. Но след като концесионери, наематели, контролни органи и в крайна сметка клиентите на атракциона не виждат проблем в това, няма какво да коментираме. 

Големият проблем с надуваемия аквапарк се оказа друг – че се управлява от украинци.

Антиукраинските настроения във Варна са дълга и сложна тема, но този път грозните изстъпления в социалните мрежи бяха надминати от нещо още по-грозно. В средата на август елементи от аквапарка бяха срязани и се наложи да бъде затворен, за да се отстранят щетите от вандалския акт. 

Екипът на аквапарка съобщи това във Facebook със съжаление и откровено учудване от случилото се. Вместо някакво съчувствие и нормално осъждане на вандализма, съобщението беше последвано от масов хейт и откровена ксенофобия. Коментари от типа „Махайте се, отивайте си в Украйна“, „Вземете си аквапарка и си го закарайте в Одеса“ бяха най-меките. 

Честно казано, като варненец изпитах истински срам от тази реакция. Почти толкова, колкото от кадрите със съзнателното изсипване на боклук до контейнерите. И този път органите на реда не показаха някаква амбиция да разследват, да установят извършителя и евентуалния поръчител на безобразието и да го накажат.

6 раздувки за варненското лято 2026
© Веселин Златков

6. Син кит

В самия край на лятото, в топлото начало на септември (най-хубавото време да си варненец или да посетиш града), на входа на Морската градина се появи огромен син кит в реални размери – 28 метра дължина. Надуваемото животно стана сензация буквално за часове. Оказа се, че поставянето му е част от форум на морски експерти, чиято тема беше избягването на инциденти между големите морски бозайници и корабите. 

Децата подскачаха и се радваха, възрастните снимаха, та снимаха с телефоните, а в социалните мрежи… Е, там пак беше касапница! „Това ли измислихте?! От това ли има нужда Варна? Позор!“ – такъв беше основният тон на коментарите, буквално стотици, може би хиляди. 

6 раздувки за варненското лято 2026
© Веселин Златков

И тук вече престанах да се срамувам и възмущавам от масовия хейт и просто се натъжих. Какво се случва с варненци, моите мили съграждани? Наистина ли такова е масовото им мнение, или става въпрос за някаква целенасочена тролска атака? 

Ако китът беше червен, розов или кафяв, щяха ли да му се зарадват? Или щяха да го нарежат, ако някой беше пуснал слуха, че китът е украински? 

Варна преминава през период на криза, която няма да завърши с края на този летен сезон – това е очевидно. Ясно е също, че без отговорността и съзнателните усилия на гражданите си т.нар. Морска перла няма да стане по-приветливо и приятно място. Но изглежда, варненци напоследък са ангажирани предимно с това да не харесват. Да не харесват и да не правят нищо, бих добавил. 

CVE-2026-94127: Critical Unauthenticated RCE in F5 BIG-IP APM

Post Syndicated from Rapid7 original https://www.rapid7.com/blog/post/etr-cve-2026-94127-critical-unauthenticated-rce-in-f5-big-ip-apm

Overview

On September 22, 2026, F5 published a security advisory for CVE-2026-94127, a critical heap-based buffer overflow vulnerability affecting F5 BIG-IP Access Policy Manager (APM). The vulnerability has a CVSS v3.1 score of 9.8. An unauthenticated attacker with network access to an affected virtual server may be able to achieve remote code execution (RCE) by sending specifically crafted traffic.

BIG-IP APM provides identity-aware access control for applications and other corporate resources and can integrate with authentication technologies including OAuth, OpenID Connect, and SAML. CVE-2026-94127 is not exposed in a default configuration: exploitation requires a BIG-IP virtual server with both an APM access policy and an OAuth profile configured. Because affected BIG-IP systems may process traffic at an organization’s network edge, organizations using this configuration should prioritize remediation.

The vulnerability affects the data plane and does not expose the BIG-IP control plane. BIG-IP systems operating in Appliance mode are also affected.

F5 lists the following affected release trains and corresponding fixed hotfixes:

  • BIG-IP 21.1.0: versions prior to Hotfix-BIGIP-21.1.0.2.0.30.22-ENG

  • BIG-IP 17.5.0: versions prior to Hotfix-BIGIP-17.5.1.9.0.160.12-ENG

  • BIG-IP 17.1.0: versions prior to Hotfix-BIGIP-17.1.3.5.0.41.14-ENG

As of September 22, 2026, CVE-2026-94127 has been added to the CISA KEV while a publicly available proof of concept was not confirmed.

Mitigation guidance

Organizations running affected F5 BIG-IP deployments should apply the appropriate F5 hotfix as soon as operationally feasible, particularly where a vulnerable APM and OAuth configuration is reachable from untrusted networks.

F5 lists the following remediation versions:

  • BIG-IP 21.1.0: update to Hotfix-BIGIP-21.1.0.2.0.30.22-ENG or later.

  • BIG-IP 17.5.0: update to Hotfix-BIGIP-17.5.1.9.0.160.12-ENG or later.

  • BIG-IP 17.1.0: update to Hotfix-BIGIP-17.1.3.5.0.41.14-ENG or later.

Administrators should first determine whether a BIG-IP APM access policy and an OAuth profile are configured together on a virtual server, since this configuration is required for exposure.

For organizations that cannot immediately apply the applicable update, F5 provides an iRule workaround through F5 Support. Customers should open a support case with F5 to obtain the vendor-provided workaround and follow F5’s implementation guidance.

Rapid7 customers

Exposure Command, Vulnerability Management, and Nexpose

Exposure Command, Vulnerability Management, Nexpose customers can assess exposure to CVE-2026-94127 using vulnerability checks expected to be available in today’s (September 23) content release.

Updates

  • September 22, 2026: Initial publication.

“We can figure it out”: How one Minnesota teacher uses Experience CS to set the tone for her whole year

Post Syndicated from Sofia Mohammed original https://www.raspberrypi.org/blog/we-can-figure-it-out-how-one-minnesota-teacher-uses-experience-cs-to-set-the-tone-for-her-whole-year/

Walk into Allison Knoph’s fifth grade classroom in Edina, Minnesota in October and the creative writing station will be the loudest place in the room.

That is by design. “I use it at my creative writing station,” she says of Experience CS, which she has run each fall for the past couple of years. Kids use the station computers to be creative as they work on their programming projects, building characters and testing jokes they have written. Some laugh hard enough that a visitor might wonder if anyone is working.

“Giggling,” Allison says, “is a good problem to have.”

Placement matters

Experience CS is a standards-aligned computer science curriculum for grades 3 to 8 (ages 8 to 14) that integrates computing into core subjects like math, science, and art. Allison has completed two units with her students, The me project, designed for fourth grade (ages 9 to 10), and Ecosystems, designed for seventh grade (ages 12 to 13).

2 units: How to program a mystery, designed for fifth grade (ages 10 to 11), and Ecosystems, designed for seventh grade (ages 12 to 13).

Of the two units, the storywriting-themed The me project was the stronger fit. It mapped cleanly onto language arts work her students were already doing. Students hit the signposts the unit lays out, but what they did inside that structure was theirs. One wrote the minimum and moved on. Another built a multi-scene story with custom sound effects, spending three weeks developing their project and making improvements.

The Ecosystems unit was more challenging for her students, and the students who finished “were the ones who were kind of the more gung-ho ones that were really into it.” She is not dismissing it, but she is clear that placement matters.

Helping each other

Allison highlighted that some of the students who were thriving in the Experience CS lessons were students who were experiencing difficulties in other areas of the curriculum. “The kids who don’t normally shine often do here,” she says. Describing one experience from her classroom, she shared that a student who had difficulties with reading quickly understood how a program should be sequenced. Within a week, classmates were walking to that desk for help. The peer support model is not something she engineers. It builds itself.

Running the lessons in October sets a tone she draws on all year. Something breaks, a student gets stuck, and the answer in her room becomes “We can figure it out.” That carries into math, into writing, into everything after.

Why now

Allison is not arguing that every student will grow up to write code. Her argument is that computational thinking transfers, and that it looks a lot like the writing instruction she is already doing: syntax, structure, sequence. Debugging a story and debugging a program are closer cousins than most people think.

Young people with a teacher in the classroom

In the age of AI, computational thinking and coding skills are especially important. Access to AI tools makes it easier for more people to generate code. Fewer people can read it, judge whether it is any good, and change it. Allison saw this on her son’s robotics team: the students who understood their code could adapt it when the robot did something unexpected. The ones who had generated code and dropped it in could not. Same tools, different outcomes, and the difference was comprehension.

The context in Minnesota

Minnesota ranks near the bottom nationally for computer science access. In the most recent state-by-state accounting, 34 percent of its public high schools offered a foundational CS course, against a national average of 60 percent.

As a fifth grade teacher, Allison believes that if students may not have opportunities to learn CS in high school, the introduction has to happen earlier, in a classroom not labeled computer science.

She is candid that the barrier for elementary teachers is not interest. It is time, cost, and the fear of being asked a question they cannot answer. She sums up the Experience CS offering to her colleagues in a few words: free, little direct instruction, fits standards she is already teaching, and the kids like it enough to be loud about it.

“We can figure it out” is a good thing for a teacher to say out loud. It is a better thing for a room of ten-year-olds to start saying back.

Find out more about introducing Experience CS in your classroom: head to experience-cs.org today.

The post “We can figure it out”: How one Minnesota teacher uses Experience CS to set the tone for her whole year appeared first on Raspberry Pi Foundation.

The collective thoughts of the interwebz