All posts by Anton Aleksandrov

More room to build: serverless services now support payloads up to 1 MB

Post Syndicated from Anton Aleksandrov original https://aws.amazon.com/blogs/compute/more-room-to-build-serverless-services-now-support-payloads-up-to-1-mb/

To support cloud applications that increasingly depend on rich contextual data, AWS has raised the maximum payload size from 256 KB to 1 MB for asynchronous AWS Lambda function invocations, Amazon Simple Queue Service (Amazon SQS), and Amazon EventBridge. Developers can use this enhancement to build and maintain context-rich event-driven systems and reduce the need for complex workarounds such as data chunking or external large object storage.

Overview

Modern cloud applications rely on context-rich, structured data to drive intelligent behavior. Large language model (LLM) prompts, telemetry signals, personalization data, machine learning (ML) outputs, and user interaction logs are no longer simple strings. Instead, they’re typically complex, nested JSON or YAML objects carrying meaningful context. Previously, developers working with serverless services such as Amazon SQS, Lambda (asynchronous invocations and Amazon SQS event-source mapping), or EventBridge had to carefully manage their data to fit within the 256 KB payload size limit. This commonly meant chunking larger payloads, externalizing payloads to object stores such as Amazon S3, or using data compression. These workarounds added complexity and latency, creating edge cases that were difficult to monitor and debug.

With the recent launches, you can now transmit payloads up to 1 MB, significantly reducing the need for complex data chunking and architectural workarounds. This increased capacity streamlines design patterns, reduces operational overhead, and makes event-driven systems more intuitive to build and maintain. Developers can now include richer data in single payloads—from detailed LLM prompts and full system states to comprehensive context and complete transaction histories.

The new 1 MB payload size limit applies to asynchronous Lambda function invocations, whether you trigger them using either SQS event-source mapping, AWS Command Line Interface (AWS CLI), AWS SDKs, Lambda Invoke API, or AWS services such as EventBridge. The increased limit also extends to all messages and events flowing through Amazon SQS queues and EventBridge Event Buses.

Getting started

There’s nothing you need to do to get started. This enhancement is automatically applied to all new and existing Lambda functions, SQS queues, and EventBridge Event Buses.

If you were previously chunking data at 256KB (or lower) threshold, then you might need to make changes to your service configurations or business logic code to start using the new limit. For example, if you’ve explicitly set Amazon SQS MaximumMessageSize attribute, then you might need to adjust it to a new desired value. Larger payloads might also result in higher costs, as described in the following section.

Real-world example: rich event context in agentic event-driven architectures

Event-driven architectures allow services to operate independently without centralized coordination. In these systems, comprehensive event context is essential. With the increased 1 MB payload limit, events can now carry more comprehensive data—from user profiles and order details to historical interactions. This enables services such as inventory, shipping, and notifications to act autonomously.

Consider the following example. In hospitality and quick-service industries, customer satisfaction depends on timely, thoughtful service recovery. When a guest submits negative feedback through a survey, review, or complaint form, service teams must gather context, interpret the issue, and craft a response. Traditionally, this meant manually piecing together visit logs, loyalty data, and prior complaints. Now, this can be fully automated using an AI agent powered by AWS serverless services and Amazon Bedrock, as shown in the following figure.

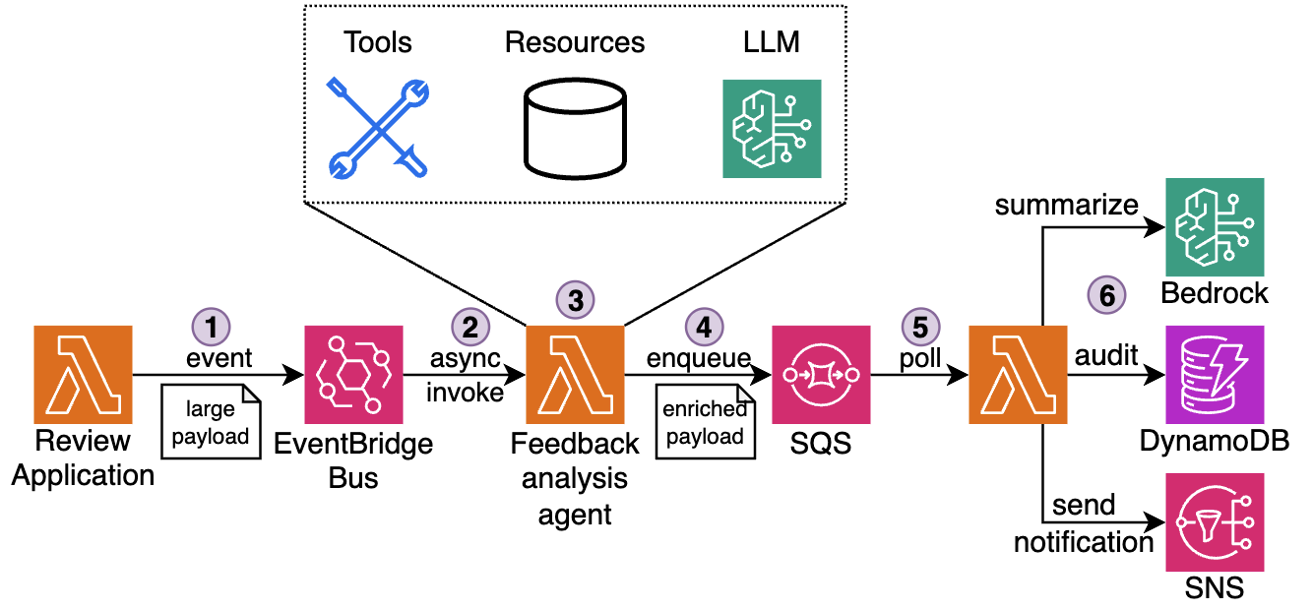
Figure 1: Customer feedback processing pipeline

The workflow:

  1. Receive: A new review is submitted through the Review application and emitted as an event to EventBridge Event Bus.
  2. Detect: Event Bus delivers the event to downstream Feedback analysis agent. The agent running in a Lambda function recognizes the review as low-rating or complaint.
  3. Enrich: The agent collects the guest’s visit metadata, booking details, loyalty activity, and complaint history using attached MCP tools into a single structured JSON payload (up to 1 MB).
  4. Queue: The payload is sent to an SQS queue for further asynchronous processing by downstream components.
  5. Generate: A separate Lambda function polls messages from Amazon SQS and invokes an Amazon Bedrock model to analyze the full complaint context, draft a personalized response, suggest a gesture (such as a refund or credit), and classify issue severity.
  6. Deliver: The message is logged and sent to the customer, and to the service team for further analysis.

This use case demonstrates the importance of having a rich context: current and previous visits details, loyalty tier, prior interactions, and feedback history. Previously, teams had to offload pieces of context to Amazon S3 and reference them externally, adding latency and architectural complexity. The new 1 MB payload size means that all this information can be transported together, improving the serverless agentic workflow efficiency and streamlining maintenance.

Best practices when using large payloads

The following sections outline best practices that you should apply when using larger payloads.

Performance considerations

Monitor Lambda function memory usage carefully when working with larger payloads, because parsing and processing complex JSON objects can increase memory usage and execution duration. Test your systems thoroughly under load, especially for high-throughput applications, by benchmarking with realistic payload sizes and traffic patterns. Although the payload limit has increased to 1 MB, the Lambda 15-minute timeout and memory limits remain unchanged. When applicable, you can use compression to process even larger datasets efficiently, but remember to account for the added CPU overhead of compression and decompression in your performance calculations. Read the Monitoring best practices for event delivery with Amazon EventBridge post for more best practices to tune your event-driven architectures performances.

Operational guidelines

Configure dead-letter-queues (DLQ) to make sure that failed messages are retained for inspection and troubleshooting. This becomes especially important with larger payloads, because debugging complex data structures necessitates access to the complete message context. Implement robust error handling and retries to manage transient failures, particularly when processing rich payload content that may contain nested structures or complex relationships.

To further optimize throughput, you can batch similar smaller events together into a single payload. However, avoid mixing unrelated events and maintain clear boundaries between different business domains and processes.

Always make sure that your downstream dependencies are capable of handling larger payloads.

When to use external storage

Even with the increased 1 MB payload limit, there are scenarios where patterns such as claim check remain a sound architectural choice. These patterns involve storing a full payload in an external system, such as Amazon S3, and passing a lightweight reference through your event stream. This approach continues to provide value when payloads exceed the new limit, when data needs to be reused by multiple consumers, or when strict governance, traceability, and security requirements are involved. For example, audit logs, image metadata, or large ML inference inputs may still surpass the 1 MB boundary, even when compressed. Instead of risking truncation or fragmentation, a claim check enables consistent, scalable access to the complete data set.

You can use open source libraries such as the Kafka sink connector for EventBridge and Amazon SQS Extended Client Library (available for Python and Java) that abstract complexities of storing large objects in external storage.

Cost management

Although larger payloads enable richer context in your applications, logging full payloads can increase storage and processing costs. Services such as CloudWatch Logs charge based on data volume, thus implementing selective logging, payload truncation, or sampling becomes crucial for high-volume events. Consider logging only essential fields or implementing smart sampling strategies based on business importance.

For full payload archival and retention, evaluate cost-effective storage solutions such as Amazon S3 with appropriate lifecycle policies. This can include moving older logs to cheaper storage tiers or implementing automated cleanup procedures for non-critical data. Balance your retention needs with cost optimization by defining clear policies for what data needs to be kept and for how long.

Review the pricing pages for AWS Lambda, Amazon EventBridge, and Amazon SQS to learn about the costs of delivering and processing events and messages.

Conclusion

The increase in maximum payload size from 256 KB to 1 MB enables developers to build more efficient distributed architectures. You can use this enhancement to transport richer context in event and message payloads, reducing the need for complex workarounds that previously added architectural complexity and operational overhead. This added room to transmit rich context means that you can streamline your workflows, improve observability, and reduce architectural complexity whether using choreography or orchestration patterns.

Go to the developer guides for AWS Lambda, Amazon EventBridge, and Amazon SQS, to learn more about how to take advantage of this update.

To learn more about serverless architectures, visit Serverless Land.

Architecting conversational observability for cloud applications

Post Syndicated from Anton Aleksandrov original https://aws.amazon.com/blogs/architecture/architecting-conversational-observability-for-cloud-applications/

Modern cloud applications are commonly built as a collection of loosely coupled microservices running on services like Amazon Elastic Kubernetes Service (Amazon EKS), Amazon Elastic Container Service (Amazon ECS), or AWS Lambda. This architecture gives engineering teams flexibility and scalability, but its inherently distributed nature also makes troubleshooting more difficult. When something breaks, engineers often find themselves digging through logs, events, and metrics scattered across different observability layers. With Kubernetes, for example, without a deep understanding of the service, troubleshooting can turn into a time-consuming effort to manually correlate information from different sources.

In this post, we walk through building a generative AI–powered troubleshooting assistant for Kubernetes. The goal is to give engineers a faster, self-service way to diagnose and resolve cluster issues, cut down Mean Time to Recovery (MTTR), and reduce the cycles experts spend finding the root cause of issues in complex distributed systems.

Overview

One of the challenges of architecting a modern cloud application is keeping observability intact across many moving pieces. Anyone who has ever tailed logs in one terminal while running kubectl describe and curl commands in another, knows how tedious this can get. Distributed systems are powerful, but they’re also complex. Kubernetes, for example, offers strong orchestration capabilities, yet troubleshooting inside a cluster often means navigating multiple layers of abstractions such as pods, nodes, networking, logs, and events. On top of that, the system generates a large volume of telemetry, including kubelet logs, application logs, cluster events, and metrics. Making sense of these layers requires both expertise on the system and application knowledge.

This skill gap shows up in the numbers. According to the 2024 Observability Pulse Report, 48% of organizations say that lack of team knowledge is their biggest challenge to observability in cloud-native environments. MTTR has also been going up for three years straight, with most teams (82%) saying it can take more than an hour to resolve production issues.

When something goes wrong and your applications start to fail for an unknown reason, engineers often must start stitching together signals from multiple sources to find the root cause. That can be tedious for specialists, and it gets worse when the issue is intermittent or spans across services. Often, multiple teams need to get involved – application engineers may not know Kubernetes well, while platform teams may not have deep insight into the applications. This can result in longer troubleshooting cycles, potentially degraded user experience, and pulling engineers away from planned work that drives business goals.

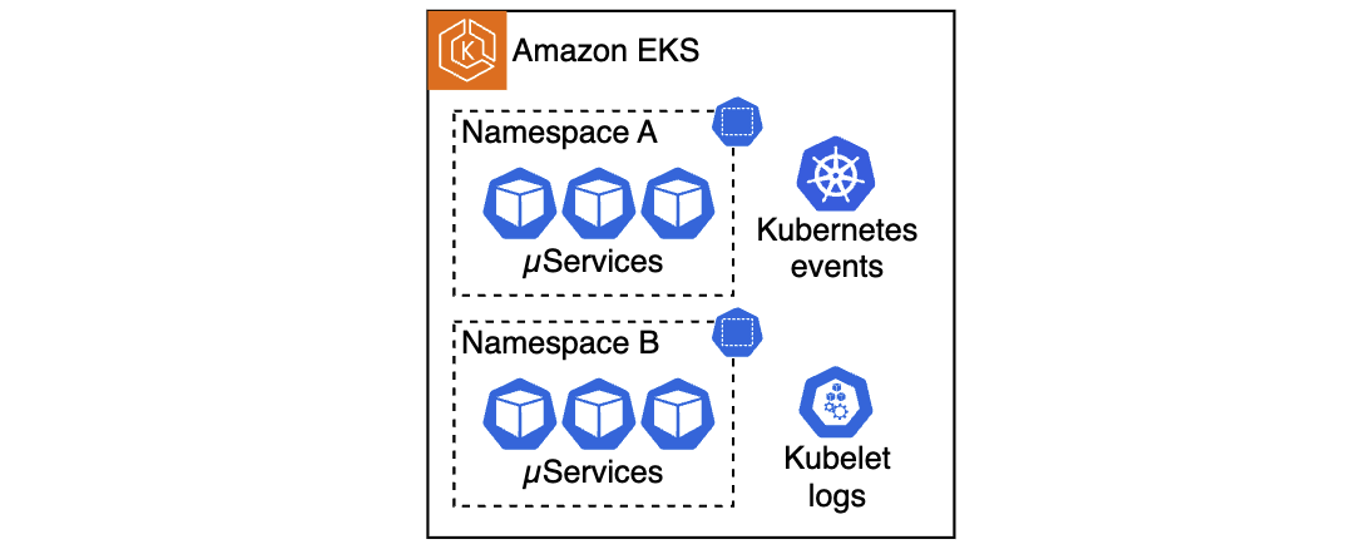
Figure 1. A multitude of telemetry sources in Kubernetes clusters

This is where generative artificial intelligence (AI) can help. Users can build an AI assistant that combines large language model (LLM)-driven analysis and guidance with existing telemetry data. This assistant enables engineers to troubleshoot issues faster, in a self-service way, without requiring every team to become Kubernetes experts. In the following sections, we show how to build such an assistant for Amazon EKS, however, keep in mind that a similar approach can be extended to other compute services like Amazon ECS or AWS Lambda.

Solution architecture

Architecting this AI-powered troubleshooting assistant consists of three primary parts:

  • Deployment approach selection: The solution supports two architectures – a traditional Retrieval-Augmented Generation (RAG)-based chatbot and a modern Strands-based agentic system that uses the Strands Agents SDK with EKS MCP Server integration for direct EKS API access.
  • Telemetry collection and storage: Collecting telemetry from various sources and storing it as vector embeddings in Amazon OpenSearch (RAG approach) or as 1024-dimensional embeddings in Amazon S3 Vectors (Strands approach).
  • Interactive troubleshooting interface: Building either a web-based chatbot that retrieves relevant telemetry and injects it into LLM prompts, or a Slack integrated multi-agent system that uses MCP tools for real-time Kubernetes diagnostics.

For this architecture walkthrough, we focus on the RAG-based approach. The first step is setting up a pipeline that can reliably collect, process, and store telemetry data. This pipeline aggregates telemetry from the relevant data sources, such as application logs, kubelet logs, and Kubernetes events. In Kubernetes environments, this can be done with a telemetry processor and forwarder, such as Fluent Bit, which streams telemetry into Amazon Kinesis Data Streams. On the receiving end, we use a Lambda function to normalize collected data, Amazon Bedrock to generate vector embeddings, and OpenSearch Serverless to store this embedded representation for efficient retrieval. Because these services are serverless, we can avoid the overhead of managing infrastructure and can focus on the troubleshooting workflow itself.

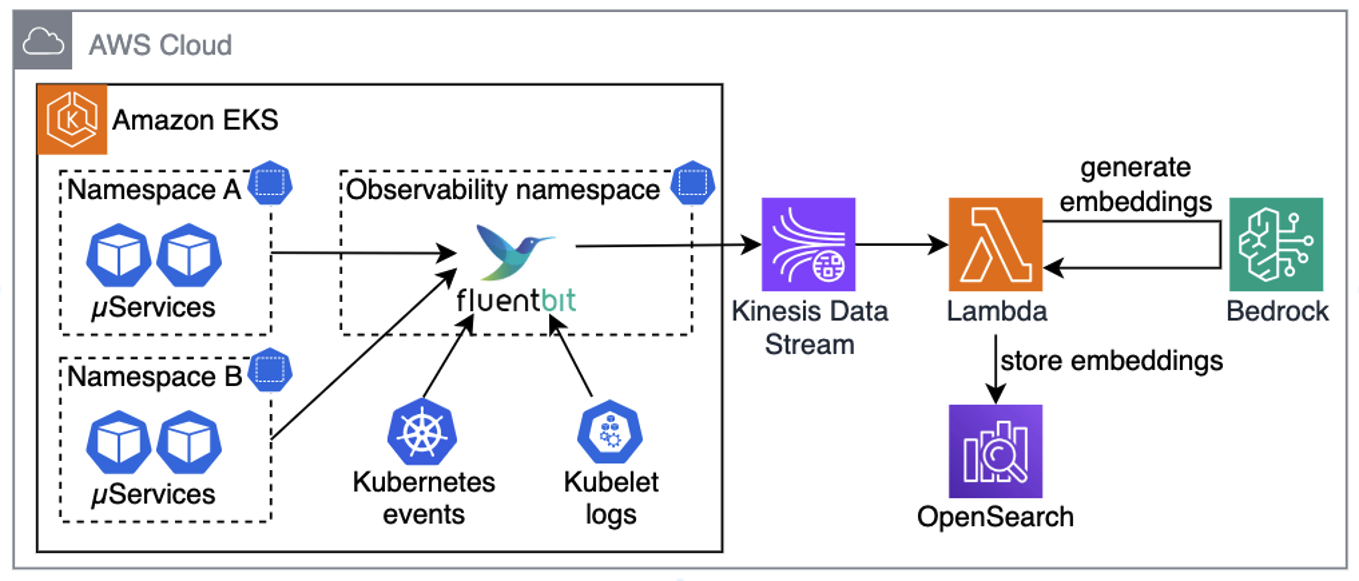
Figure 2. Collecting telemetry from sources, generating embeddings, and saving in OpenSearch

Pro tip: for better performance and cost-efficiency, your Lambda functions should use batching when ingesting data from Kinesis, generating embeddings, and storing them in OpenSearch.

Once telemetry is collected, converted to embeddings, and stored in OpenSearch, the next step is building a chatbot that uses RAG. Using RAG means that when a user asks a question, the chatbot looks up semantically similar telemetry in OpenSearch, adds it to the prompt, and sends it to the LLM. Instead of generic answers, the model now has relevant telemetry and cluster-specific details it can use to generate useful next steps, such as precise kubectl commands for the troubleshooting assistant, as illustrated in the following diagram.

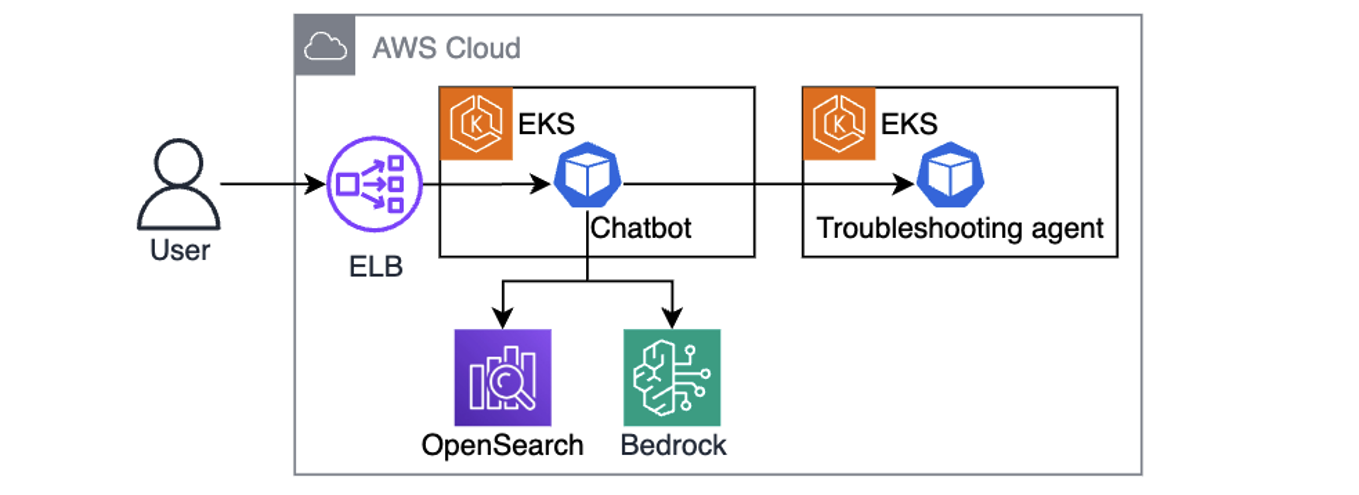
Figure 3. Chatbot is using user queries augmented with telemetry context to send kubectl commands to the troubleshooting assistant. 

One powerful aspect of this design is its iterative nature. The chatbot hands instructions to a troubleshooting assistant running in the cluster, which executes a set of allowlisted, read-only kubectl commands. The output comes back to the LLM, which can decide whether it needs to investigate further (by asking the troubleshooting assistant to run more kubectl commands), or present a clear resolution path to the engineer. This cycle gradually builds a richer picture of the issue by combining historical telemetry with real-time cluster state to speed up root cause analysis.

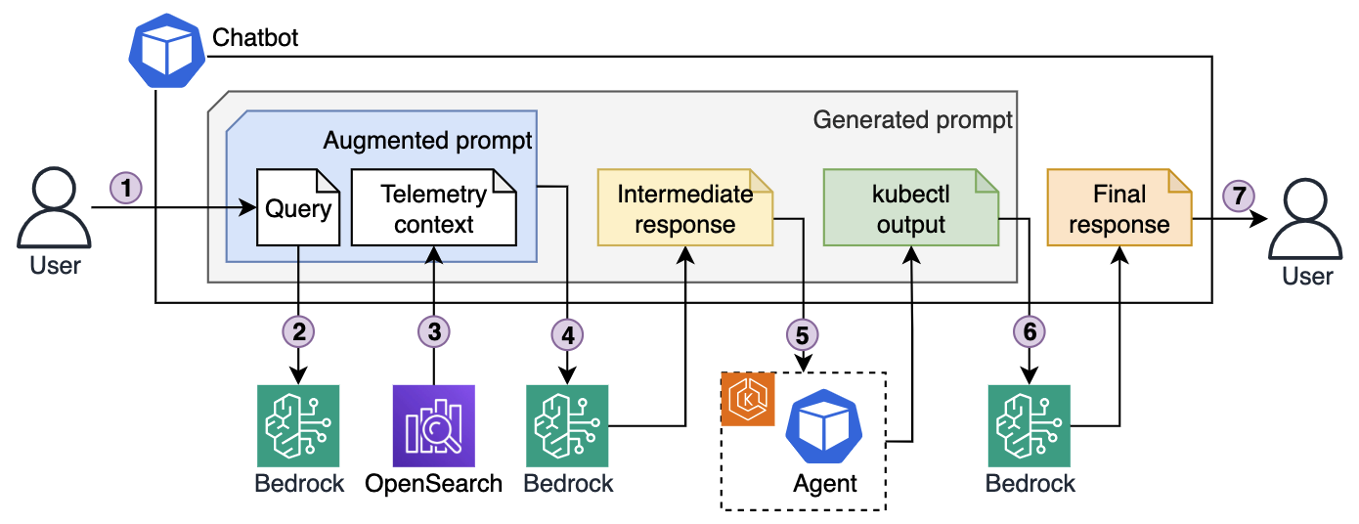
Figure 4. Iterative troubleshooting process.

Here’s the end-to-end troubleshooting flow illustrated in the preceding diagram:

  1. An engineer enters a query into the chatbot interface, for example “My pod is stuck in pending state. Investigate.”
  2. The chatbot sends the query to Bedrock, which converts it into vector embeddings.
  3. Using those embeddings, the chatbot retrieves semantically matching telemetry that was previously stored in OpenSearch.
  4. The chatbot generates an augmented prompt, which contains both the original query and semantically relevant telemetry, and passes it to the LLM. The LLM responds with a list of kubectl commands to run for further diagnostics.
  5. The chatbot forwards those commands to the troubleshooting assistant running in the EKS cluster. The agent executes them with a service account that has read-only permissions, following the principle of least privilege, and sends the output back.
  6. Based on the output, the chatbot asks LLM to decide whether to continue investigation (by asking the agent to run more commands), or whether it has enough context to produce an answer.
  7. Once enough information has been gathered (investigation concluded), the chatbot composes a final prompt, including the query, telemetry, and investigation results, and asks the LLM for a final resolution, which it then returns to the engineer.

Example implementation

Use the example repo to deploy the solution in your AWS account. Follow the instructions in README.md for provisioning and testing the sample project using Terraform. Resources provisioned by the example project incur costs in your AWS account. Make sure to clean up the project as described in the README.md to avoid unexpected costs.

The repository provides two deployment architectures controlled by the deployment_type Terraform variable:

  1. RAG-based deployment (default): See the ./terraform/modules directory for the “ingestion-pipeline” module that creates a Kinesis Data Stream and Lambda function to generate embeddings using "amazon.titan-embed-test-v2:0" and store them in OpenSearch. The “agentic-chatbot” module handles the Gradio web interface and kubectl command execution.
  2. Strands agentic deployment: this approach uses the Strands Agents SDK to create a multi-agent system with three specialized agents:
    1. Agent Orchestrator: Coordinates troubleshooting workflows
    2. Memory Agent: Manages conversation context and historical insights
    3. K8s Specialist: Handles Kubernetes diagnostics

The agentic system stores knowledge as 1024-dimensional embeddings in Amazon S3 Vectors, providing cost-optimized vector storage for AI agents. EKS MCP Server integration enabled direct EKS API access through standardized MCP tools located in ./apps/agentic-troubleshooting/src/tools/. Engineers interact via Slack bot integration, where the Strands agents can execute kubectl commands through the MCP protocol while maintaining Pod Identity security for AWS service access.

The following screenshot shows an example chatbot response to a query about a pod being stuck in pending state. The assistant generated and ran multiple kubectl commands to build the output and came up with recommendations for issue remediation.

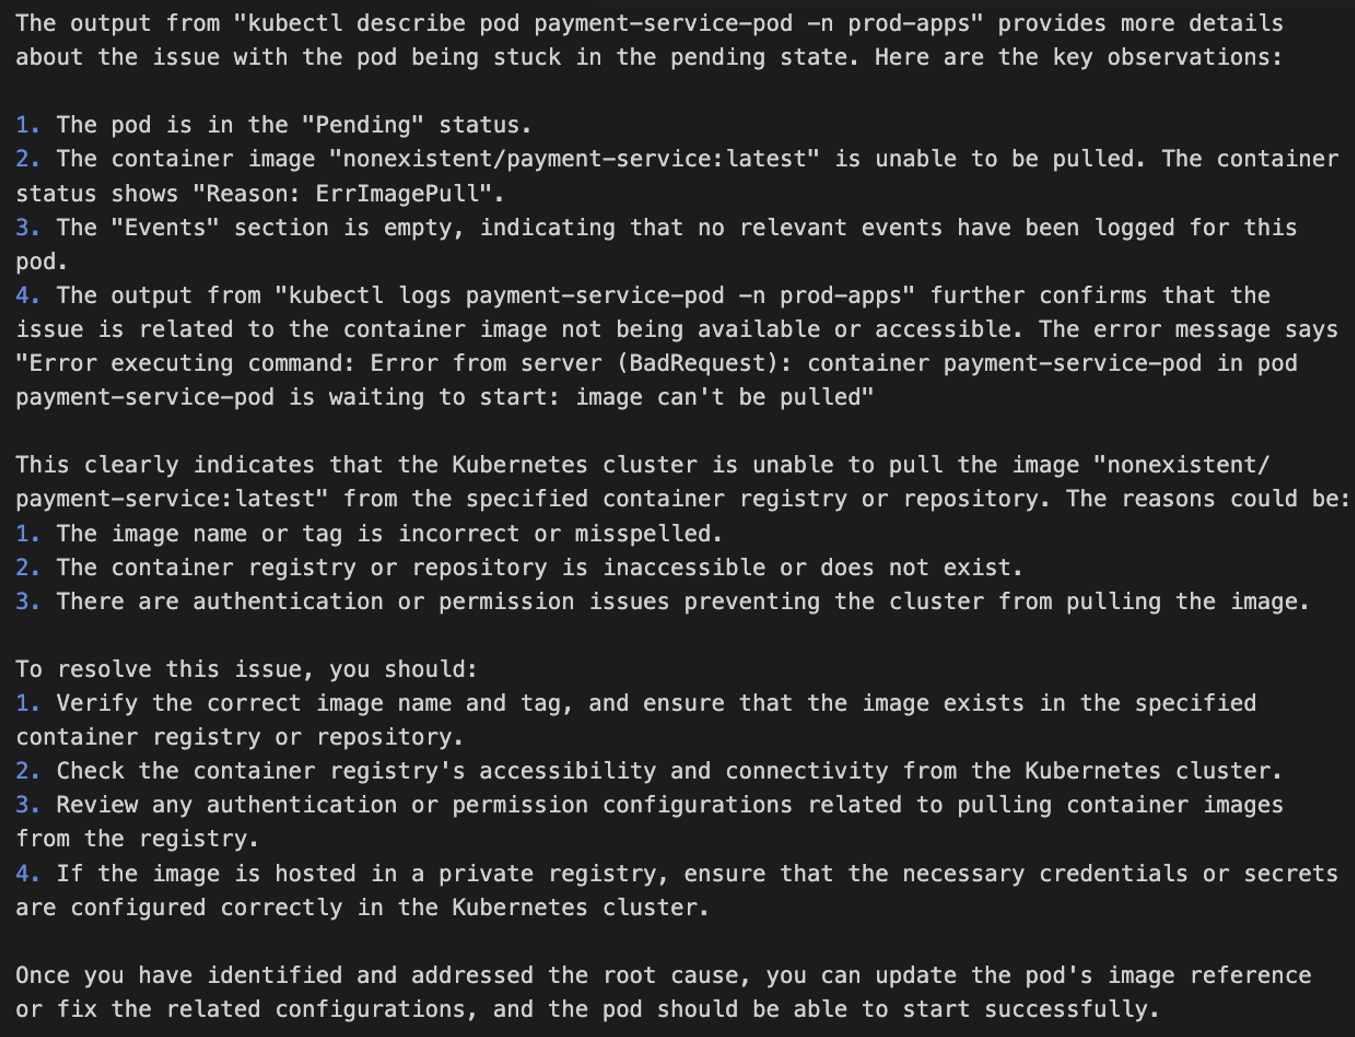
Figure 5. EKS cluster troubleshooting, example output

See AWS re:Invent 2025 – Streamline Amazon EKS operations with Agentic AI and KubeCon – From Logs To Insights: Real-time Conversational Troubleshooting for Kubernetes with GenAI sessions for a deeper dive into solution implementation.

Security considerations

When implementing AI agents for Kubernetes environments, security must be a primary consideration throughout the architecture. The solution requires secure communication channels between the chatbot and EKS clusters, with interactions authenticated through AWS Identity and Access Management (AWS IAM) roles.

Permissions-wise, command execution security is critical. Implementing strict allowlists that only allow read-only kubectl operations to help prevent unauthorized cluster modifications while maintaining diagnostic capabilities. The troubleshooting assistant should also operate with minimal Kubernetes RBAC permissions, limited to viewing pods, services, events, and logs within specific namespaces.

Data protection measures must include sanitizing application logs before embedding generation to help prevent sensitive information exposure, encrypting the telemetry data in transit through Kinesis and at rest in OpenSearch using AWS Key Management Service (AWS KMS).

Follow the AWS Well-Architected Framework Security Pillar principles, deploy components within Amazon Virtual Private Cloud (Amazon VPC) using private subnets and VPC endpoints to minimize network exposure, implement comprehensive logging of troubleshooting activities for audit purposes, and validate user inputs to protect against prompt injection attacks that could manipulate the AI assistant’s behavior.

Conclusion

In this post, we walked through how to architect a generative AI-powered troubleshooting assistant that gives engineers a way to solve Kubernetes issues in a self-service way, without always needing service experts to step in. By combining telemetry analysis with AI-driven context, engineers can get to the root causes faster and keep MTTR low. Assistant’s ability to pull from multiple telemetry sources, run safe diagnostic commands, and provide actionable recommendations helps to make the troubleshooting process more efficient and less disruptive to ongoing work.

As distributed systems continue to grow in scale and complexity, solutions like the one described in this post become essential. Putting AI on top of your observability data helps to practically handle these challenges today, while also setting you up for more autonomous, resilient operations in the future.

Enhancing API security with Amazon API Gateway TLS security policies

Post Syndicated from Anton Aleksandrov original https://aws.amazon.com/blogs/compute/enhancing-api-security-with-amazon-api-gateway-tls-security-policies/

As compliance frameworks evolve and cryptographic standards advance, organizations are looking for additional controls to improve their cloud security posture. One of the neccesary controls is a more granular TLS configuration, for example when regulatory requirements mandate disabling older ciphers like CBC or enforcing TLS 1.3 as a minimum version.

In this post, you will learn how the new Amazon API Gateway’s enhanced TLS security policies help you meet standards such as PCI DSS, Open Banking, and FIPS, while strengthening how your APIs handle TLS negotiation. This new capability increases your security posture without adding operational complexity, and provides you with a single, consistent way to standardize TLS configuration across your API Gateway infrastructure.

Overview

Previously, API Gateway offered limited control over TLS configuration, and only for custom domain names. Default endpoints used fixed security policies, which meant you often had to introduce additional infrastructure, such as custom Amazon CloudFront distributions, to meet your organization’s security or compliance requirements.

With this launch, you can configure TLS behavior directly on all REST API endpoint types, including Regional, edge-optimized, and private, and apply consistent TLS settings across both your APIs and their custom domain names. You can choose from predefined enhanced security policies to enforce the minimum TLS versions and cipher suites that your workloads require. For example, you can enforce TLS 1.3, use hardened TLS 1.2 without CBC ciphers, adopt FIPS-aligned suites for government workloads, or prepare for the future with policies that include post-quantum cryptography (PQC). The new security policies provide finer-grained control without adding operational complexity, helping you align your APIs with evolving security and compliance expectations.

Understanding API Gateway security policies

A security policy in API Gateway is a predefined combination of a minimum TLS version and a curated set of cipher suites. When a client connects to your REST API or custom domain name, API Gateway uses the selected policy to determine which protocol versions and ciphers it will accept during the TLS handshake. This gives you a predictable and enforceable way to control how clients establish encrypted connections to your APIs.

API Gateway supports two categories of security policies. Legacy policies, such as TLS_1_0 or TLS_1_2, remain available for backwards compatibility. Enhanced policies, identified by the SecurityPolicy_* prefix, provide stricter and more modern controls for regulated workloads, advanced governance, or cryptographic hardening. When you use an enhanced policy, you must also specify an endpoint access mode, which adds additional validation for how traffic reaches your API, as described in the following sections.

Enhanced policies follow a consistent naming patterns that helps you quickly understand what each policy enforces. For example, for REGIONAL and PRIVATE endpoint types, the following pattern applies:

SecurityPolicy_[TLS-Versions]_[Variant]_[YYYY-MM]

From this structure, you can identify the minimum TLS versions supported, any specialized cryptographic variants (such as FIPS, PFS, or PQ), and the release date of the policy. For example, SecurityPolicy_TLS13_1_3_2025_09 accepts only TLS 1.3 traffic, while SecurityPolicy_TLS13_1_2_PFS_PQ_2025_09 supports TLS 1.2 as lowest and TLS 1.3 as highest TLS version with forward secrecy and post-quantum enhancements.

Each policy maps to a curated combination of ciphers. For instance, SecurityPolicy_TLS13_1_3_2025_09 accepts only three TLS 1.3 cipher suites (TLS_AES_128_GCM_SHA256, TLS_AES_256_GCM_SHA384, and TLS_CHACHA20_POLY1305_SHA256) and rejects any other protocol versions or ciphers. For a full list of supported policies and ciphers, and naming pattern for the EDGE endpont type, see the API Gateway documentation.

How security policies apply to default endpoints and custom domains

You can use API Gateway to attach different security policies to your default API endpoint and custom domain names. During TLS negotiation, API Gateway selects the policy based on the Server Name Indication (SNI) value in the client’s TLS handshake, not the HTTP Host header. This means the policy depends on the hostname the client uses when initiating TLS.

For example, if a client connects directly to your default endpoint, such as:

https://abcdef1234.execute-api.us-east-1.amazonaws.com

API Gateway uses the policy attached to that default endpoint because the SNI value matches its hostname.

If the client instead connects through a custom domain name, such as:

https://api.example.com

API Gateway uses the policy attached to that custom domain. In this case, the SNI value api.example.com determines which policy is enforced.

This distinction is important even if you disable your default endpoint. TLS negotiation always occurs before API Gateway evaluates endpoint settings, so the default endpoint security policy still applies to clients that connect directly to its hostname. To avoid unexpected client behavior, you should keep the API and its custom domain name aligned with the same security policy whenever possible.

Understanding endpoint access mode

When you use an enhanced security policy (SecurityPolicy_*), you must also specify an endpoint access mode. Endpoint access mode defines how strictly API Gateway validates the network path a request takes before it reaches your API. This gives you an additional layer of governance and helps you prevent unauthorized or misrouted traffic.

You can choose between two modes:

  • BASIC mode provides standard API Gateway behavior. It is the recommended starting point when you migrate an existing API to an enhanced security policy. Clients can continue reaching your API as they do today, without additional validation.
  • STRICT mode adds enforcement checks to ensure that requests originate from the correct endpoint type, and TLS negotiation aligns with your configuration.

When you enable STRICT mode, API Gateway performs additional validations, such as:

  • The SNI and HTTP Host header values match
  • The request originates from the same endpoint type as your API (Regional, edge-optimized, or private)

If any of these validations fail, API Gateway rejects the request. STRICT is a viable choice when you need stronger security guarantees, such as when running regulated or sensitive workloads. See API Gateway documentation for additional details.

When you switch from BASIC to STRICT mode, it takes up to 15 minutes for the change to fully propagate. Your API remains available during this period. If your endpoint access mode is set to STRICT, you cannot change the endpoint type until you revert the mode back to BASIC.

Applying security policies to new and existing APIs

You can apply a security policy when you create a new REST API or custom domain name, or update an existing resource to use one of the enhanced SecurityPolicy_* options. When migrating existing APIs, the recommended approach is to start with BASIC mode, validate client behavior (SNI and HTTP Host header values match, request originates from the same endpoint type as your API), and then move to STRICT mode once you confirm compatibility.

The following code snippets illustrate how to apply security policies to different scenarios:

Create a REST API with a security policy and STRICT endpoint access mode

You can attach a security policy directly during API creation, removing the need for extra infrastructure just to control TLS negotiation.

aws apigateway create-rest-api \
  --name "your-private-api-name" \
  --endpoint-configuration '{"types":["PRIVATE"]}' \
  --security-policy "SecurityPolicy_TLS13_1_3_2025_09" \
  --endpoint-access-mode STRICT \
  --policy file://api-policy.json

Create a custom domain name with a security policy and STRICT endpoint access mode

You can also specify the security policy when creating a custom domain name. API Gateway applies the selected policy during TLS negotiation based on the SNI value the client provides.

aws apigateway create-domain-name \
  --domain-name api.example.com \
  --regional-certificate-arn arn:aws:acm:region:account-id:certificate/certificate-id \
  --endpoint-configuration '{"types":["REGIONAL"]}' \
  --security-policy SecurityPolicy_TLS13_1_3_2025_09 \
  --endpoint-access-mode STRICT

Updating existing REST API

If you are migrating an existing API, start by applying the enhanced security policy with BASIC mode. After confirming that your clients can connect with BASIC mode as expected, proceed to enable the STRICT mode.

1. Apply the new policy with BASIC mode

aws apigateway update-rest-api --rest-api-id abcd123 --patch-operations '[
    {
         "op": "replace",
         "path": "/securityPolicy",
         "value": "SecurityPolicy_TLS13_1_3_2025_09"
    },
    {
         "op": "replace",
         "path": "/endpointAccessMode",
         "value": "BASIC"
     }
]'

Verify your clients can consume the API as expected using access logs and performance metrics in Amazon CloudWatch.

2. Enable the STRICT mode after validation

aws apigateway update-rest-api --rest-api-id abcd123 --patch-operations '[
    {
        "op": "replace",
        "path": "/endpointAccessMode",
        "value": "STRICT"
     }
]'

Updating existing custom domain name

Custom domain names follow the same migration approach as REST APIs.

1. Apply the new policy with BASIC mode and validate clients can successfully connect.

aws apigateway update-domain-name --domain-name api.example.com --patch-operations '[
    {
        "op": "replace",
        "path": "/securityPolicy",
        "value": "SecurityPolicy_TLS13_1_3_2025_09"
    },
    {
        "op": "replace",
        "path": "/endpointAccessMode",
        "value": "BASIC"
     }
]'

2. Enable the STRICT mode after validation

aws apigateway update-domain-name --domain-name api.example.com --patch-operations '[
    {
        "op": "replace",
        "path": "/endpointAccessMode",
        "value": "STRICT"
     }
]'

After you update your REST API or custom domain configuration, redeploy your API so that stages receive the new settings. When you change a security policy, the update takes up to 15 minutes to complete. The API status appears as UPDATING while the change propagates and returns to AVAILABLE when complete. Your API remains fully functional throughout this process.

Rolling back endpoint access mode

If you notice clients failing to connect to your API after applying the STRICT mode, you can revert the endpoint access mode back to BASIC at any time. Below code snippet illustrates doing this for a REST API.

aws apigateway update-rest-api --rest-api-id abcd123 --patch-operations '[
    {
      "op": "replace",
      "path": "/endpointAccessMode",
      "value": "BASIC"
    }
  ]'

You can use the same approach to update a custom domain name.

Monitoring TLS usage and policy migrations

As you adopt enhanced security policies, it is important to understand how clients negotiate encrypted connections with your API. Monitoring helps you verify client readiness, identify legacy consumers that may require updates, and validate that STRICT endpoint access mode behaves as expected during rollout. Use the following API Gateway access logs variables to monitor protocol and cipher usage over time.

  • $context.tlsVersion – the negotiated TLS version
  • $context.cipherSuite – the cipher suite selected during the handshake

You can use these variables to confirm that:

  • Clients are using the expected minimum TLS version
  • BC-based ciphers are no longer used after you move to a hardened policy
  • PQC and FIPS-aligned policies are being exercised by the appropriate clients

Access logs are especially useful during migrations, where validating the actual client behavior is a prerequisite before enabling STRICT mode. For example, if you still observe live clients negotiating TLS 1.0 or TLS 1.2 CBC ciphers after applying a hardened policy in BASIC mode, you can identify the affected clients and plan remediation before switching to STRICT mode.

Future-proof security configurations

Some of the new policies combine TLS 1.3 with post-quantum cryptography (PQC) to help you prepare for a future where quantum-capable threat actors exist. With these policies you can start testing and adopting quantum-resistant algorithms without redesigning your API architecture.

As standards evolve and new cipher suites are introduced, API Gateway’s policy model provides you with a clear path for adding new variants while keeping your configuration simple and predictable.

Conclusion and next steps

Enhanced TLS security policies and endpoint access mode in the Amazon API Gateway gives you direct control over how clients establish secure connections to your APIs. You can choose the policies that match your compliance needs, such as PCI DSS, FIPS, Open Banking, PQC, and use STRICT mode to control how traffic reaches your endpoints and apply additional domain-level validations, further hardening security of your APIs

To get started:

  1. Review the list of available security policies in the API Gateway documentation.
  2. Identify which REST APIs and domains require stronger TLS controls.
  3. Apply an appropriate SecurityPolicy-* policy with BASIC mode.
  4. Validate client behavior using access logs and CloudWatch metrics.
  5. Move to STRICT mode when you are ready to enforce additional connection-level protection.

For more information about building Serverless architectures, see ServerlessLand.com

Improving throughput of serverless streaming workloads for Kafka

Post Syndicated from Anton Aleksandrov original https://aws.amazon.com/blogs/compute/improving-throughput-of-serverless-streaming-workloads-for-kafka/

Event-driven applications often need to process data in real-time. When you use AWS Lambda to process records from Apache Kafka topics, you frequently encounter two typical requirements: you need to process very high volumes of records in close to real-time, and you want your consumers to have the ability to scale rapidly to handle traffic spikes. Achieving both necessitates understanding how Lambda consumes Kafka streams, where the potential bottlenecks are, and how to optimize configurations for high throughput and best performance.

In this post, we discuss how to optimize Kafka processing with Lambda for both high throughput and predictable scaling. We explore the Lambda’s Kafka Event Source Mappings (ESMs) scaling, optimization techniques available during record consumption, how to use ESM Provisioned Mode for bursty workloads, and which observability metrics you need to use for performance optimization.

Overview

To start processing records from a Kafka topic with a Lambda function, whether using Amazon Managed Streaming for Apache Kafka (Amazon MSK) or a self-managed Kafka cluster, you create an ESM: a lightweight serverless resource that consumes records from Kafka topics and invokes your function.

The scaling behavior of Kafka ESMs is based on the offset lag. This is a metric indicating the number of records in the topic that have not yet been consumed by the Lambda function. This metric typically grows when producers publish new records faster than consumers process them. As the lag grows, the Lambda service gradually adds more Kafka consumers (also known as pollers) to your ESM. To preserve ordering guarantees, the maximum number of pollers is capped by the number of partitions in the topic. Lambda also scales pollers down automatically when lag decreases.

Each ESM follows a consistent polling workflow: poll -> filter -> batch -> invoke, as shown in the following diagram. Every stage has configurable options that directly affect performance, latency, and cost.


Figure 1. ESM processing workflow.

Polling: Increasing predictability with Provisioned Mode

By default, Kafka ESM uses the on-demand polling mode. In this mode, ESM starts with one poller, automatically adds more pollers when the offset lag grows, and scales the number of pollers down as lag decreases. On-demand mode does not need upfront scaling configuration and is the lowest-cost option for steady workloads. For many applications, this behavior is sufficient: scaling up can take several minutes, but the throughput eventually catches up, and you only pay for the resources you use, such as number of invocations.

However, if your workloads are bursty and latency-sensitive, then on-demand scaling may not be fast enough and can result in a rapidly growing lag. This can be addressed by switching to Provisioned Mode, which gives you more fine-grained control to configure a minimum and maximum number of always-on pollers for your Kafka ESM. These pollers remain connected even when traffic is low, so consumption begins immediately when a spike occurs, and scaling within the configured range is faster and more predictable.

The following diagram shows the performance improvements of using the ESM in Provisioned Mode for bursty workloads. You can see that in on-demand mode it took ESM over 15 minutes to eventually catch up to the new traffic volume, while in Provisioned Mode the ESM handled the traffic increase instantly.


Figure 2. Comparing Kafka ESM on-demand and Provisioned Mode.

Best practices for using Provisioned Mode:

  • Start small: Provisioned Mode is a paid capability. AWS recommends that for smaller topics (less than 10 partitions) you start with a single provisioned poller to evaluate throughput and observe workload behavior. For larger topics, you can start with a higher number of provisioned pollers to accommodate the baseline consumption. You can adjust this configuration at any time as you learn traffic patterns and refine your performance targets.
  • Estimate throughput: A single provisioned poller can process up to 5 MB/s of Kafka data. Monitor your average record size and per-record processing time to establish a baseline for minimum and maximum pollers, then validate with real workload metrics.
  • Set a low floor and flexible ceiling: Choose a minimum number of pollers that makes sure that latency targets are met when a traffic burst occurs, then allow the ESM to scale toward a higher maximum as needed.

See Low latency processing for Kafka event sources for more information.

To summarize:

  • Use Provisioned Mode for bursty traffic, strict SLOs, or when backlogs pose downstream risk.
  • Use on-demand polling mode for steady traffic, flexible latency requirements, or when minimizing cost is the primary objective.

Filtering: Drop irrelevant records early

By default, all records from Kafka are delivered to your Lambda function. This approach is direct and flexible. Your handler code decides which records to process and which to ignore. This default behavior is highly efficient for workloads where nearly all records are valuable.

When you find yourself discarding a large portion of records in your handler code, you can use native ESM filtering capabilities to drop irrelevant records before they reach your function. You can filter early to reduce cost, free up concurrency, increase throughput, and make sure that your Lambda function spends cycles on valuable work only.

The following diagram shows the application of an ESM filter to only process telemetry that meets a specified condition.


Figure 3. ESM filtering configuration.

Batching: Processing more records per invocation

You can batch multiple Kafka records together to process more data per invocation and increase the efficiency of your Lambda functions. Larger batches help you achieve higher throughput and reduce costs by making better use of each invocation run. To get the best results, you should balance batch size and latency targets and adjust the configuration based on your workload’s specific traffic patterns and SLOs.

Lambda gives you two primary controls for configuring ESM batching behavior:

  • Batch window: This is how long the ESM waits to accumulate records before invoking your function. A shorter window produces smaller batches and more frequent invocations. A longer window (up to 5 minutes) produces larger batches and less frequent invocations.
  • Batch size: This is the maximum number of records that the ESM can accumulate before invoking your function, up to 10,000.

There’s no single setting that universally works for all workloads. Your optimal configuration depends on workload characteristics such as latency tolerance and record size. AWS recommends starting with the default values and then gradually adjusting the configuration based on your requirements. For example, you can increase the batch size while monitoring function duration, error rates, and end-to-end latency.

The following diagram shows how to configure batch window and size using Terraform:


Figure 4. ESM batch window and batch size configuration with Terraform.

The ESM invokes your function when one of the following three conditions is met:

  1. The batch window elapses.
  2. The accumulated batch reaches the configured maximum batch size.
  3. The accumulated payload approaches the 6 MB maximum invocation payload limit of Lambda.

When using higher batch window values during traffic spikes, you typically see more records-per-batch and longer function invocation durations. This is normal: larger batches can take longer to process. Always interpret the Duration metric in the context of the batch size being processed.

Invoke: Process each batch faster and more efficiently

You control how quickly each batch completes through two main factors: the efficiency of your function code and the compute resources you allocate to your functions. You can improve both to process more records per second, reduce the necessary concurrency, and lower cost.

Optimize your code: Review your function handler code to identify where you can reduce work per record. For example, eliminate redundant serialization, initialize dependencies once during function startup, and consider parallel processing within the handler (where applicable). For performance-critical workloads, you can also choose languages that compile to binary, such as Go or Rust, which typically deliver high performance with lower resource usage.

Tune compute resources: Increasing the memory function allocation proportionally increases vCPU. Use the Lambda PowerTuning tool to find the memory configuration that best balances performance and cost for your workload.

Correlate metrics: As you optimize, monitor Duration and Concurrency. You should see the concurrency drop as duration improves. That correlation confirms that your changes are improving the system throughput and efficiency.

When you combine handler optimizations with early filtering and efficient batching, even small improvements can make your pipeline noticeably faster to operate under load.

Observability drives good decisions

You can’t optimize what you can’t see. To tune your data processing pipeline, use a combination of OffsetLag, function invocation metrics, and Kafka broker metrics to understand your data processing performance. OffsetLag tells you whether your function is keeping up with incoming records, as shown in the following figure. Function metrics such as Duration, Concurrency, Errors, and Throttles show how efficiently your code is processing record batches. If you use Provisioned Mode, then you can use the Provisioned Pollers metric to track the poller capacity.


Figure 5. Kafka consumption observability with Amazon CloudWatch.

Always interpret function duration in the context of batch size. During traffic spikes, you can typically observe both duration and actual batch size increase, which is expected amortization, not a regression. For alerting, monitor lag growth, unexpected drops in invocation rate, and error spikes. With these signals in place, you can detect issues early and tune your configuration with confidence.

A sample step-by-step optimization loop

  1. Establish a clean baseline: Make your handler idempotent and batch-aware, start with a short batch window and moderate batch size. Monitor your ESM and confirm offset lag stays near zero at steady state.
  2. Filter early: Move static checks (record type, version, other custom properties) into ESM filtering and verify invoked counts drop relative to polled counts, proving the filter saves cost and concurrency.
  3. Increase batch size gradually while monitoring the duration, error rates, and latency metrics. Extend the batch window slightly if spikes cause too many invocations.
  4. Speed up the handler: Increase memory for more CPU, reduce per-record I/O, remove redundant serialization, and parallelize safely inside the batch while tracking duration and concurrency metrics together.
  5. Prove spike readiness: Replay realistic surges, monitor offset lag and drain time, and enable Provisioned Mode with a small minimum if recovery takes too long, adjusting with MB/s-per-poller estimates.
  6. Implement alerting: Watch for sustained lag growth, unexpected gaps between polled and invoked, and error spikes tied to partitions or large batches. Always read metrics in context with batch size.
  7. Re-evaluate periodically: Re-measure system throughput, confirm filter effectiveness, and retune batch and memory settings regularly as workloads evolve.

Conclusion

Optimizing Kafka streams processing with AWS Lambda necessitates understanding how ESMs work and tuning consumption components: polling, filtering, batching, and invoking. Filtering redundant records early removes unnecessary work, batching helps you process more records per invocation, and handler optimizations make sure that you make the most of the compute that you allocate. Together, these adjustments let you scale efficiently and keep offset lag under control.

When your workload is bursty, use Provisioned Mode to absorb spikes without long recovery times. With the right alerts on lag, errors, and unexpected polled versus invoked behavior, you can spot problems early and adjust before they impact users. Following this optimization guide gives you a practical way to measure, tune, and revisit your setup as traffic patterns change.

To learn more about optimizing Kafka consumption, see the AWS re:Invent 2024 session about Improving throughput and monitoring of serverless streaming workloads.

To learn more about building Serverless architectures see Serverless Land.

Building multi-tenant SaaS applications with AWS Lambda’s new tenant isolation mode

Post Syndicated from Anton Aleksandrov original https://aws.amazon.com/blogs/compute/building-multi-tenant-saas-applications-with-aws-lambdas-new-tenant-isolation-mode/

Today, AWS announced a new tenant isolation mode for AWS Lambda, that allows you to process function invocations in separate execution environments for each application end-user or tenant invoking your Lambda function. This capability simplifies building secure multi-tenant SaaS applications by managing tenant-level compute environment isolation and request routing for you. As a result, you can focus on your core business logic rather than implementing your own tenant-aware compute environment isolation.

Overview

Lambda runs your function code in secure execution environments that leverage Firecracker virtualization to provide isolation. These execution environments never share or reuse virtual resources (such as vCPU, disk, or memory) across functions, or even across different versions of the same function. However, Lambda can reuse execution environments for multiple invocations of the same function version, as these execution environments are fully set-up and can therefore deliver faster request processing for your functions.

Figure 1. Incoming invocations processed by a collection of execution environments that belong to a single function.

Figure 1. Incoming invocations processed by a collection of execution environments that belong to a single function.

Multi-tenant SaaS applications that handle sensitive tenant-specific data or execute code supplied dynamically by tenants may need a higher degree of isolation—at the individual application tenant level rather than at the function level—for secure code execution and to reduce the risk of cross-tenant data access.

Prior to today’s launch, developers would implement custom solutions, such as SDKs or application logic to manage isolation within function code. This approach was bug-prone, required more work from application development teams, and didn’t ensure isolation at the compute environment level.

Alternatively, developers adopted the approach of creating separate functions per application tenant, replicating the same code across hundreds or thousands of tenants. This approach provided stronger compute environment isolation than sharing compute environments across multiple tenants of the same function, but increased implementation overhead and operational complexity as workloads grew to support a larger number of tenants over time.

Figure 2. Using function-per-tenant model, each tenant’s requests are processed by a separate function.

Figure 2. Using function-per-tenant model, each tenant’s requests are processed by a separate function.

Starting today, AWS Lambda offers a new tenant isolation mode that lets you isolate execution environments used across different tenants of your multi-tenant SaaS applications, even when all of the tenants invoke the same function. When you enable the new tenant isolation mode, you include a tenant identifier with each function invocation. Lambda uses this identifier to route the request to the correct execution environment. As a result, each execution environment is reused only for invocations from the same tenant. This means you still get the performance benefits of warm execution environments, while ensuring that each tenant’s workloads remain isolated.

Figure 3. With the new tenant isolation capability, Lambda creates separate execution environments per tenant for a single function.

Figure 3. With the new tenant isolation capability, Lambda creates separate execution environments per tenant for a single function.

For organizations handling sensitive tenant-specific data or running untrusted code supplied dynamically by end-users, Lambda’s new tenant isolation mode provides the security benefits of per-tenant compute environment separation without the operational complexity of managing individual functions or infrastructure for each tenant.

Example scenario

Consider building a multi-tenant serverless SaaS application. To optimize performance, your function handler can retrieve tenant-specific configuration and data, cache it in memory, and reuse it for subsequent invocations from the same tenant. For example, you might cache tenant-specific database location, feature flags, or business rules that are frequently accessed during request processing. You may store this information within the application runtime process as global variables or as files in the /tmp directory. However, if the underlying execution environment is used to serve multiple tenants, this approach can potentially expose data across tenants.

With tenant isolation mode you can address this risk with much simpler architecture and configuration. This built-in capability makes Lambda an excellent choice for multi-tenant SaaS applications needing isolated compute environments for individual tenants.

Getting Started with Lambda Tenant Isolation Mode

Use the new tenancy-config parameter to configure tenant isolation mode when you create your function. You can only apply this configuration at function creation time; it cannot be updated for existing functions. The following snippet creates a function with tenancy config using the AWS CLI.

aws lambda create-function \
   --function-name my-function1 \
   --runtime nodejs22.x \
   --zip-file fileb://my-function1.zip \
   --handler index.handler \
   --role arn:aws:iam:1234567890:role/my-function-role \
   --tenancy-config '{"TenantIsolationMode": "PER_TENANT"}'

After the function is created, you must provide the tenant ID parameter with each invocation. Lambda uses this identifier to ensure that the execution environment used for a particular tenant is never reused for other tenants. For subsequent invocations from the same tenant, Lambda may reuse the execution environment to optimize performance. Specify this tenant-id parameter as illustrated below:

aws lambda invoke \
   --function-name my-function \
   --tenant-id BlueTenant \
   response.json

The new tenant-id parameter is required for functions using the tenant isolation mode. Function invocations omitting this parameter will fail with an invocation error, as shown below:

aws lambda invoke --function-name multitenant-function out.json

An error occurred (InvalidParameterValueException) when calling the Invoke operation:
The invoked function is enabled with tenancy configuration. 
Add a valid tenant ID in your request and try again.

Lambda makes the tenant ID parameter available through your function handler’s context object. This allows you to access tenant-specific information in your code, for example if you wish to implement custom logic based on the tenant identity, as shown below:

exports.handler = async function (event, context) {
   const tenantId = context.tenantId;

   // Process tenant-specific logic

   return {
      statusCode: 200,
      body: `OK for tenantId=${tenantId}`
   };
};

The following table outlines differences between Lambda functions with and without tenant isolation mode enabled:

Feature Without the new
tenant isolation mode
With the new
tenant isolation mode
Execution environment isolation Isolated per function version. Isolated per end-user or tenant invoking a function version.
Execution environment reuse Can be reused to process all invocations of a function version. Can only be reused to process invocations from the same tenant invoking a function version.
Data stored on local disk and in-memory Potentially accessible across all invocations of a function version. Potentially accessible across invocations from the same tenant. Not accessible for invocations from other tenants.
Cold starts Occur when there are no warm execution environments available to process incoming invocation. Occur when there are no tenant-specific warm execution environments available to process incoming invocation. More cold starts expected due to tenant-specific execution environments.

Integrating with Amazon API Gateway

Amazon API Gateway uses Lambda’s Invoke API to invoke Lambda functions. When using the Invoke API, Lambda expects the tenant ID parameter to be passed using the X-Amz-Tenant-Id HTTP header. You can configure API Gateway to inject this HTTP header into the Lambda invocation request with a value obtained from client request properties such as HTTP header, query parameter, or path parameter. When using Lambda Authorizers, you can obtain the value from authorization context information returned by the authorizer, such as principal ID or JWT claim. See API Gateway documentation to learn how you can return authorization information from Lambda authorizers to be used for the X-Amz-Tenant-Id header value.

Figure 4. Obtaining X-Amz-Tenant-Id header value from authentication sources.

Figure 4. Obtaining X-Amz-Tenant-Id header value from authentication sources.

The following screenshot illustrates API Gateway Lambda integration configuration, where the incoming request to API Gateway includes an x-tenant-id header that is mapped to the X-Amz-Tenant-Id request header to invoke a Lambda function using tenant isolation mode.

Figure 5. Mapping client request header to Lambda tenant-id header.

Figure 5. Mapping client request header to Lambda tenant-id header.

The following code snippet illustrates this configuration implemented with the AWS CDK.

const lambdaIntegration = new ApiGw.LambdaIntegration(fn, {
   requestParameters: {
      // This configures API Gateway to inject X-Amz-Tenant-Id header
      // into downstream requests. The header value is obtained from 
      // x-tenant-id header in the client request.
      'integration.request.header.X-Amz-Tenant-Id': 'method.request.header.x-tenant-id'
   }
});

resource.addMethod('GET', lambdaIntegration, {
   requestParameters: {
      // This enables API Gateway to use the x-tenant-id header value 
      // obtained from the client request. The header name is arbitrary.
      // you can use any other header name. 
      'method.request.header.x-tenant-id': true
   }
});

Tenant-aware observability

For functions using tenant isolation, Lambda automatically includes the tenant ID in function logs when you have JSON logging enabled, making it easier to monitor and debug tenant-specific issues. Note that the tenantId property is available during function invocation, rather than during function initialization. The tenantId property is included for both platform events (like platform.start and platform.report) and custom logs you print in your function code, as shown in the following screenshot:

Figure 6. Lambda function logs with tenantId.

Figure 6. Lambda function logs with tenantId.

Lambda creates a separate CloudWatch log stream for each execution environment. You can use CloudWatch Log Insights to find log streams that belong to a particular tenant by filtering by tenant Id:

fields @logStream, @message
| filter tenantId=='BlueTenant' or record.tenantId=='BlueTenant'
| stats count() as logCount by @logStream
| sort @timestamp desc

You can also retrieve tenant-specific logs across all log streams:

fields @message
| filter tenantId=='BlueTenant' or record.tenantId=='BlueTenant'
| limit 1000

Each log stream starts with function initialization logs followed by the invocation logs. This structure helps you to debug tenant-specific issues and understand the lifecycle of each tenant’s execution environments.

Considerations

When using the new tenant isolation for Lambda functions, consider the following:

  • Each tenant’s execution environments are isolated from other tenants so that tenant-specific data stored on disk or in memory remain separated from other tenants invoking the same Lambda function.
  • All tenants share the function’s execution role. For more fine-grained permissions for individual tenants, consider propagating tenant-scoped credentials from the upstream application components invoking your Lambda function.
  • Your application may experience higher percentage of cold starts, as Lambda processes requests in separate execution environments for each tenant invoking your functions.
  • You pay a fee for each new tenant-specific execution environment created, depending on the memory configured for your function. See Lambda pricing page for details.

Best practices

When using the new tenant isolation mode for Lambda functions, AWS recommends the following best practices:

  • Implement robust tenant ID validation at the application layer to prevent unauthorized access through tenant ID manipulation. Consider using a dedicated service or database to maintain valid tenant IDs.
  • Monitor and audit tenant access patterns regularly to detect potential security anomalies or unauthorized cross-tenant access attempts.
  • Be aware of Lambda concurrency quotas when building multi-tenant applications. You might need to request quota increases based on your tenant count and usage patterns.

Sample code

Follow the instructions in this GitHub repository to provision a sample project in your own account and see the new Lambda tenant isolation mode in action. The sample project illustrates how to integrate a function using the new tenant isolation mode with Amazon API Gateway and propagate tenant identity from client requests.

Conclusion

The new tenant isolation mode for Lambda simplifies building serverless multi-tenant SaaS applications on AWS. By automatically managing application tenant-level compute environment isolation, this capability eliminates the need for custom isolation logic or separate tenant functions, allowing you to focus on the core business logic while AWS handles the complexities of tenant-aware compute environment isolation.

Combined with the existing security features in Lambda, rapid scaling, and pay-per-use pricing, tenant isolation mode makes Lambda an even more compelling choice for modern SaaS applications, whether you’re building new solutions or enhancing existing ones.

To learn more, refer to the documentation for tenant isolation. For details on pricing, refer to Lambda’s pricing page.

Building responsive APIs with Amazon API Gateway response streaming

Post Syndicated from Anton Aleksandrov original https://aws.amazon.com/blogs/compute/building-responsive-apis-with-amazon-api-gateway-response-streaming/

Today, AWS announced support for response streaming in Amazon API Gateway to significantly improve the responsiveness of your REST APIs by progressively streaming response payloads back to the client. With this new capability, you can use streamed responses to enhance user experience when building LLM-driven applications (such as AI agents and chatbots), improve time-to-first-byte (TTFB) performance for web and mobile applications, stream large files, and perform long-running operations while reporting incremental progress using protocols such as server-sent events (SSE).

In this post you will learn about this new capability, the challenges it addresses, and how to use response streaming to improve the responsiveness of your applications.

Overview

Consider this scenario – you’re running an AI-powered agentic application that uses an Amazon Bedrock foundation model. Your users interact with the application through an API, asking complex questions that require detailed responses. Before response streaming, users would send their prompts and wait to eventually receive the application response, sometimes for tens of seconds. This awkward pause between questions and responses created a disconnected, unnatural experience.

With the new API Gateway response streaming capability, the interaction through the API becomes much more fluid and natural. As soon as your application starts processing the model response, you can stream it back to your users using the API Gateway.

The following animation illustrates this significant user experience improvement. The prompt on the left is processed using a non-streaming response with user having to wait for several seconds to receive the result. The prompt on the right is using the new API Gateway response streaming, significantly reducing TTFB and improving user experience.

Figure 1. Comparing user experience before (left) and after (right) enabling API Gateway response streaming when returning a response from a Bedrock foundational model.

Your users can now see AI responses appear in real-time, word by word, just like watching someone type. This immediate feedback makes your applications feel more responsive and engaging, keeping users connected throughout the interaction. In addition, you don’t have to worry about response size limits or implement complex workarounds – the streaming happens automatically and efficiently, letting you focus on building great user experiences rather than managing infrastructure constraints.

Understanding response steaming

In the traditional request-response model, responses must be fully computed before being sent to the client. This can negatively impact user experience – the client must wait for the complete response to be generated on the server-side and transmitted over-the-wire. This is especially pronounced in interactive, latency-sensitive cloud applications such as AI agents, chatbots, virtual assistants, or music generators.

Figure 2. Response is returned to the client only after it’s been fully generated, increasing time-to-first-byte latency.

Another important scenario is returning larger response payloads, such as images, large documents, or datasets. In some cases, these payloads may exceed the 10 MB response size limit or default integration timeout limit of 29 seconds of API Gateway. Before the launch of response streaming, developers worked around these limitations by using pre-signed Amazon S3 URLs to download large responses or accepting lower RPS for an increase in timeout. While functional, these workarounds introduced additional latency and architectural complexity.

With response streaming support you can address these challenges. You can now update your REST APIs to return streamed responses, significantly enhancing user experience, improving TTFB performance, supporting response payload sizes to exceed 10 MB, and serving requests that can take up to 15 minutes.

Figure 3. Response streaming reduces time-to-first-byte and improves user experience.

The response streaming capability is already delivering significant performance for organizations:

“Working closely with the AWS teams to enable response streaming was instrumental in advancing our roadmap to deliver the most performant storefront experiences for our largest customers at Salesforce Commerce Cloud. Our collaboration exceeded our Core Web Vital goals; we saw our Total Blocking Time metrics drop by over 98%, which will enable our customers to drive higher revenue and conversion rates.”, says Drew Lau, Senior Director of Product Management at Salesforce.

Response streaming is supported for any HTTP-proxy integration, AWS Lambda functions (using proxy integration mode), and private integrations. To get started, configure your API integration to stream the response from your backend, as described in the following sections, and redeploy your API for changes to take effect.

Getting started with response streaming

To enable response streaming for your REST APIs, update your integration configuration to set the response transfer mode to STREAM. This enables API Gateway to start streaming the response to the client as soon as response bytes become available. When using response streaming, you can configure request timeout up to 15 minutes. For best time to first byte user experience, AWS strongly recommends your backend integration also implements response streaming.

You can enable response streaming in several different ways, as illustrated in the following snippets:

Using the API Gateway console, when creating method integrations, select Stream for the Response transfer mode.

Figure 4. Enabling response streaming in API Gateway Console.

Setting response transfer mode using the Open API spec:

paths:
  /products:
    get:
      x-amazon-apigateway-integration:
        httpMethod: "GET"
        uri: "https://example.com"
        type: "http_proxy"
        timeoutInMillis: 300000
        responseTransferMode: "STREAM"

Setting response transfer mode using infrastructure-as-code (IaC) frameworks, such as AWS CloudFormation. Note the /response-streaming-invocations Uri fragment, it tells API Gateway to use the Lambda InvokeWithResponseStreaming endpoint:

MyProxyResourceMethod:
  Type: 'AWS::ApiGateway::Method'
  Properties:
    RestApiId: !Ref LambdaSimpleProxy
    ResourceId: !Ref ProxyResource
    HttpMethod: ANY
    Integration:
      Type: AWS_PROXY
      IntegrationHttpMethod: POST
      ResponseTransferMode: STREAM
      Uri: !Sub arn:aws:apigateway:${APIGW_REGION}:lambda:path/2021-11-
           15/functions/${FN_ARN}/response-streaming-invocations

Updating response transfer mode using the AWS CLI:

aws apigw update-integration \
   --rest-api-id a1b2c2 \
   --resource-id aaa111 \
   --http-method GET \
   --patch-operations "op='replace',path='/responseTransferMode',value=STREAM" \
   --region us-west-2

Using response streaming with Lambda functions

When using Lambda functions as a downstream integration endpoint, your Lambda functions must be streaming-enabled. The API Gateway uses the InvokeWithResponseStreaming API to invoke functions, as illustrated in the following diagram, and requires Lambda proxy integration. See the API Gateway documentation for additional guidance.

Figure 5. Using API Gateway response streaming with Lambda functions for interactive AI applications.

When you use response streaming with Lambda functions, API Gateway expects the handler response stream to contain the following components (in order):

  • JSON response metadata – Must be a valid JSON object and can only contain statusCode, headers, multiValueHeaders, and cookies fields (all optional). Metadata cannot be an empty string; at a minimum it must be an empty JSON object.
  • The 8-null-byte delimiter – Lambda adds this delimiter automatically when you use the built-in awslambda.HttpResponseStream.from() method, as illustrated below. When not using this method, you’re responsible for adding the delimiter yourself.
  • Response payload – Can be empty.

The following code snippet illustrates how you can return a streamed response from your Lambda functions so it will be compatible with API Gateway response streaming:

export const handler = awslambda.streamifyResponse(
   async (event, responseStream, context) => {

      const httpResponseMetadata = {
         statusCode: 200,
         headers: {
            'Content-Type': 'text/plain',
            'X-Custom-Header': 'some-value'
         }
      };

      responseStream = awslambda.HttpResponseStream.from(
         responseStream,
         httpResponseMetadata
      );

      responseStream.write('hello');
      await new Promise(r => setTimeout(r, 1000));
      responseStream.write(' world');
      await new Promise(r => setTimeout(r, 1000));
      responseStream.write('!!!');
      responseStream.end();
   }
);

Refer to the API Gateway documentation for further implementation guidelines.

Using response streaming with HTTP Proxy integrations

You can stream HTTP responses from your applications used as downstream integration endpoints, for example web servers running on Amazon Elastic Container Service (Amazon ECS) or Amazon Elastic Kubernetes Service (Amazon EKS). In this case, you must use HTTP_PROXY integration and specify the response transfer mode as STREAM (using the console, AWS CLI, or IaC). Redeploy your API after modifying it.

Figure 6. Using API Gateway response streaming with HTTP server applications.

Once API Gateway receives a streaming response from your application, it will wait until the HTTP headers block transfer is complete. Then, it will send to the client an HTTP response status code and headers, followed by the content from your application as it gets received by the API Gateway service. It will continue streaming response from your application to the client until the stream ends (up to 15 minutes).

Many popular API and web application development frameworks provide response streaming abstractions. The following code snippet illustrates how you can implement HTTP response streaming using FastAPI:

app = FastAPI()

async def stream_response():
   yield b"Hello "
   await asyncio.sleep(1)
   yield b"World "
   await asyncio.sleep(1)
   yield b"!"

@app.get("/")
async def main():
   return StreamingResponse(stream_response(), media_type="text/plain")

Adding real-time response streaming to your HTTP clients

Different HTTP clients have different ways to process streamed response fragments as they arrive. The following code snippet illustrates how to process a streamed response with a Node.js application:

const request = http.request(options, (response)=>{
   response.on('data', (chunk) => {
      console.log(chunk);
   });

   response.on('end', () => {
      console.log('Response complete’);
   });
});

request.end();

When using CURL, you can use the –no-buffer argument to print response fragments as they arrive.

curl --no-buffer {URL}

Sample code

Clone this sample project from GitHub to see API Gateway response streaming in action. Follow instructions in the README.md to provision the sample project in your AWS account.

Considerations

Before you enable response streaming, consider:

  • Response streaming is available for REST APIs and can be used with HTTP_PROXY integrations, Lambda integrations (in proxy mode), and private integrations.
  • You can use API Gateway response streaming with any endpoint type, such as Regional, Private, and Edge-optimized, with or without custom domain names.
  • When using response streaming, you can configure response timeouts up to 15 minutes, according to your scenario requirements.
  • All streaming responses from Regional or Private endpoints are subject to a 5-minute idle timeout. All streaming responses from edge-optimized endpoints are subject to a 30-second idle timeout.
  • Within each streaming response, the first 10MB of response payload is not subject to any bandwidth restrictions. Response payload data exceeding 10MB is restricted to 2MB/s.
  • Response streaming is compatible with API Gateway security capabilities such as authorizers, WAF, access controls, TLS/mTLS, request throttling, and access logging.
  • When processing streamed responses, the following features are not supported: response transformation with VTL, integration response caching, and content encoding.
  • Always protect your APIs against unauthorized access and other potential security threats by implementing proper authorization with Lambda Authorizers or Amazon Cognito User Pools. Read REST API protection documentation and API Gateway security documentation for additional details.

Observability

You can continue using existing observability capabilities, such as execution logs, access logs, AWS X-Ray integration, and Amazon CloudWatch metrics with API Gateway response streaming.

In addition to the existing access logs variables, the following new variables are available:

  • $content.integration.responseTransferMode – the response transfer mode of your integration. This can be either BUFFERED or STREAMED.
  • $context.integration.timeToAllHeaders – the time between when API Gateway establishes the integration connection to when it receives all integration response headers from the client.
  • $context.integration.timeToFirstContent – the time between when API Gateway establishes the integration connection to when it receives the first content bytes.

See API Gateway documentation for more information.

Pricing

With this new capability, you continue to pay the same API Invoke rates for streamed responses. Each 10MB of response data, rounded up to the nearest 10MB, is billed as a single request. See API Gateway pricing page for additional details.

Conclusion

The new response streaming capability for Amazon API Gateway enhances how you can build and deliver responsive APIs in the cloud. With immediate streaming of response data as it becomes available, you can significantly improve time-to-first-byte performance and overcome traditional payload size and timeout limitations. This is particularly valuable for AI-powered applications, file transfers, and interactive web experiences that demand real-time responsiveness.

To learn more about API Gateway response streaming see the service documentation.

To learn more about building Serverless architectures see Serverless Land.

Effectively building AI agents on AWS Serverless

Post Syndicated from Anton Aleksandrov original https://aws.amazon.com/blogs/compute/effectively-building-ai-agents-on-aws-serverless/

Imagine an AI assistant that doesn’t just respond to prompts – it reasons through goals, acts, and integrates with real-time systems. This is the promise of agentic AI.

According to Gartner, by 2028 over 33% of enterprise applications will embed agentic capabilities – up from less than 1% today. While early generative AI efforts focused on GPUs and model training, agentic systems shift the focus to CPUs, orchestration, and integration with live data – the places where organizations are starting to see real return on investment (ROI).

In this post, you’ll learn how to build and run serverless AI agents on AWS using services such as Amazon Bedrock AgentCore (preview as of this post publication), AWS Lambda, and Amazon Elastic Container Service (Amazon ECS), which provide scalable compute foundations for agentic workloads. You’ll also explore architectural patterns, state management, identity, observability, and tool usage to support production-ready deployments.

Overview

Early AI assistants were stateless and reactive – each prompt processed in isolation, with no memory of prior interactions or awareness of broader context. Gradually, AI assistants became more capable by injecting system prompts, preserving conversation history, and incorporating enterprise knowledge using Retrieval-Augmented Generation (RAG), as illustrated in the following diagram.

Despite these improvements, traditional AI assistants still lacked true autonomy. They couldn’t reason through multi-step goals, make decisions on their own, or adjust workflows dynamically based on outcomes. As a result, they worked well for simpler Q&A or predefined workflows, but struggled with dynamic, more complex, real-world tasks that require planning, using external tools, and making decisions along the way.

Agentic AI systems shift from passive content generation to autonomous, goal-driven behavior. Powered by Large Language Models (LLMs) and enhanced with memory, planning, and tool use, these systems can break down complex tasks into smaller steps, reason through each step, and take real-time actions, such as calling APIs, executing tools, or interacting with live data. By referencing the LLM within a control cycle that manages context, memory, and decision-making, these systems can choose the right tools, adapt workflows, and integrate deeply into enterprise environments, with use cases ranging from travel booking and financial analysis to DevOps automation and code debugging. This is referred to as an agentic loop. In this system, the agent relies on the LLM’s reasoning output to execute tools, capture tool results, and feed these results to the LLM as updated context (as shown in the following diagram). This happens in a loop until LLM instructs the agent to return the final output to the caller.

While agentic loop is a lightweight approach to structuring these systems, other control flow paradigms, such as graph, swarm, and workflows, are also available in open-source frameworks like LangGraph.

Introducing Strands Agents SDK

Strands Agents SDK is a code-first framework to build production-ready AI agents with minimal boilerplate. It utilizes the above-mentioned agentic loop system and abstracts common challenges like memory management, tool integration, and multi-step reasoning in a lightweight, modular Python framework. Strands SDK handles state, tool orchestration, and multi-step reasoning so agents can remember past conversations, call external APIs, enforce business rules, and adapt to changing inputs. This allows you to focus on the application’s business logic.

Because agents built with Strands SDK are essentially Python apps, they’re portable and can run across different compute options, such as Bedrock AgentCore Runtime, Lambda functions, ECS tasks, or even locally. This makes Strands Agents SDK a powerful foundation for building scalable and goal-driven AI systems. The following sections assume you’re running your AI agents built with Strands Agents SDK on Lambda functions.

Building your first serverless AI agent

Imagine you’re building an AI-powered corporate travel assistant on AWS, and you have the following technical requirements:

  1. Define the system prompts, memory, and model you want to use
  2. Integrate tools for API calls, business logic, and knowledge bases
  3. Ensure authentication and observability

Strands SDK handles heavy lifting, so you can focus on building smart, responsive agents with minimal overhead. The following code snippet creates a simple agent, according to your configuration.

from strands import Agent

agent = Agent(
    system_prompt=
      """You're a travel assistant that helps 
         employees book business trips 
         according to policy.""",
    model=my_model,
    tools=[get_policies, get_hotels, get_cars, book_travel]
)

response = agent("Book me a flight to NYC next Monday.")

That’s it. Your agent now has a personality, memory, and ability to use external tools. The Agent class in the Strands SDK abstracts agentic logic, such as maintaining conversation history, handling LLM interactions, orchestrating tools and external knowledge sources, and running the full agentic loop.

Session state management

Session state management is critical for agentic workflows. It allows agents to track goals across interactions – enabling coherent conversations, retaining context, and providing personalized experiences. Without state management, each prompt is handled in isolation, making it impossible for the agent to reference prior context or track ongoing tasks. In cloud environments, where applications need to be stateless and scalable, the solution is to externalize session state to persistent storage, such as Amazon Simple Storage Service (Amazon S3). This allows any agent instance to reconstruct the conversation history on demand, delivering a seamless, stateful user experience while keeping the agentic app itself stateless for scalability and resilience.

AI agents built with Strands store conversation history in the agent.messages property (see documentation). To support stateless compute environments, you can externalize the agent state, persisting it after each interaction and restoring it before the next. This preserves continuity across invocations while keeping your agent instances stateless. In user-aware agentic applications, you want to persist state for each user, typically associated with the user’s unique ID. The following example illustrates how you can do it with the built-in S3SessionManager class when running your agent in a stateless environment such as a Lambda function:

    session_manager = S3SessionManager(
        session_id=f"session_for_user_{user.id}",
        bucket=SESSION_STORE_BUCKET_NAME,
        prefix="agent_sessions"
    )

    agent = Agent(
        session_manager=session_manager
    )

When using Bedrock AgentCore, use the fully managed, serverless AgentCore Memory primitive to manage sessions and long-term memory. It provides relevant context to models while helping agents learn from past interactions. You can make Strands’ session manager work with AgentCore Memory similar to S3SessionManager.

Authentication and authorization

For enterprise AI agents to operate safely, they must know who the user is and what they are allowed to do. This goes beyond basic identity validation – AI agents often act on behalf of users, so they might need to enforce role-based access controls, support audit, and comply with corporate policies.

AWS services like Amazon CognitoAmazon Identity and Access Management (IAM), and Amazon API Gateway provide a solid foundation for authentication and authorization. For example, you can use Cognito to authenticate users through user pools or federated identity providers, combined with API Gateway and Lambda authorizer to validate user access permissions before forwarding requests to the agent, as shown in the preceding diagram. IAM policies define what the agent is allowed to do. After the user is both authenticated and authorized, the agent can extract the identity context, for example, from a JSON Web Token (JWT), to personalize prompts, enforce rules, or dynamically restrict actions.

The following code snippet illustrates retrieving user’s identity from the Authorization header and passing it to an agent:

def handler(event: dict, ctx):
    user_id = extract_user_id(event["headers"]["Authorization"])
    user_prompt: dict = json.loads(event["body"])["prompt"]
    agent_response = agent.prompt(user_id, user_prompt)
  
    return {
        "statusCode": 200,
        "body": json.dumps({"text": agent_response.text})
    }

The identity context can become a part of the agent’s execution loop. An agent might check the user’s department before booking travel or restrict access to sensitive tools unless the user has the appropriate permissions. By integrating authentication early, you not only enhance security, but also unlock rich personalization and audit capabilities that make agents enterprise-ready from day one.

When using Bedrock AgentCore, the AgentCore Identity primitive allows your AI agents to securely access AWS services and third-party tools either on behalf of users or as themselves with pre-authorized user consent. It provides managed OAuth 2.0 supported providers for both inbound and outbound authentication. During the preview phase, AgentCore Identity supports identity providers like Amazon Cognito, Auth0 by Okta, Microsoft Entra ID, GitHub, Google, Salesforce, and Slack. Refer to the samples for implementation details.

Building portable Strands agents on AWS

Strands Agents SDK is compute-agnostic. The agents you build are standard Python applications, which can run on any compute type.

For portability and maintainability, separate your agent’s business logic from the interface layer. By doing this, you can reuse the same core agent code across environments, whether invoked through API Gateway and Lambda functions, accessed through Application Load Balancer and Amazon ECS, running on AgentCore Runtime, or even executed locally during development, as shown in the following figure.

The following code snippets illustrate this technique.

Lambda handler code:

def handler(event: dict, ctx):
     user_id = extract_user_id(event)
     user_prompt = json.loads(event["body"])["prompt"]
     agent_response = call_agent(user_id, user_prompt)
     return {
          "statusCode":200,
          "body": json.dumps({
               "text": agent_response.mesage
          })
     }

AgentCore code:

@app.entrypoint
def invoke(payload):
     user_id = extract_user_id(payload)
     user_prompt = payload.get("prompt")
     agent_response = call_agent(user_id, user_prompt)
     return {"result": agent_response.message)

HTTP Handler code:

@app.post("/prompt")
async def prompt(request: Request, prompt_request: PromptRequest):
    user_id=extract_user_id(request)
    user_prompt = prompt_request.prompt
    agent_response = call_agent(user_id, user_prompt)
    return {"text": agent_response.message)

For local testing:

if __name__ == "__main__":
     user_id="local-testing-user"
     user_prompt="book me a trip to NYC"
     agent_response = call_agent(user_id, user_prompt)
     return agent_response.message

Agent code:

def call_agent(user_id, user_prompt):
     agent = Agent(
          system_prompt="You’re a travel agent…",
          model=my_model,
          session_manager = my_session_manager,    
      )
     agent_response = agent(user_prompt)
     return agent_response

Extending agent functionality with tools

A key strength of agentic systems is their ability to invoke tools that perform actions or retrieve real-time data, enabling agents to interact with the outside world, not just generate text. The Strands Agents SDK includes built-in tools and allows you to define your own custom tools, as either in-process Python functions or external tools accessible over HTTP using the Model Context Protocol (MCP). These tools can fetch data, call APIs, or trigger workflows, and can be registered for the agent to reason over and use during execution.

The following snippet illustrates creating an in-process tool. See the documentation for more examples.

from strands import tool 

@tool
def get_weather(city: str) -> str:
    weather = call_weather_api(city)
    return f"The current weather in {city} is {weather}"

Integrating with remote MCP servers

Model Context Protocol (MCP) is an open standard that decouples agents from tools using a client-server model. Instead of embedding tool logic directly into the agent, your agent becomes an MCP client that connects to one or more MCP servers – each exposing tools, resources, and reusable prompts.

Running remote MCP servers is especially valuable when tools span multiple business domains or are provided by third-party vendors, just like how microservices separate responsibilities across teams and systems. This separation allows each domain team to manage their own tools independently while exposing a consistent, standardized interface to agents. It also enables reuse, versioning, and centralized governance without tightly coupling logic into the agent itself. By decoupling tools from agents, MCP unlocks composability, scalability, and long-term ecosystem growth.

The following snippet illustrates configuring an MCP client to connect to a remote MCP Server, retrieving the list of tools, and integrating those tools with an agent.

mcp_client = MCPClient(lambda: streamablehttp_client(
    url=mcp_endpoint,
    headers={"Authorization": f"Bearer {token}"},
))

with mcp_client:
  tools = mcp_client.list_tools_sync()
  agent = Agent(tools=tools)

When using Bedrock AgentCore, you can operate MCP at scale through AgentCore Gateway. It provides an easy and secure way for developers to build, deploy, discover, and connect to remote tools like above at scale. With AgentCore Gateway, developers can convert APIs, Lambda functions, and existing services into Model Context Protocol (MCP)-compatible tools and make them available to agents through Gateway endpoints with just a few lines of code.

Monitoring and observability

Observability is essential when running AI agents. Beyond traditional metrics such as uptime and latency, agentic systems introduce new telemetry dimensions, such as LLM latency, token consumption, and tracing reasoning cycles. These new metrics are essential for understanding both the performance and cost of your agentic systems.

When deploying agents using AWS services such as Bedrock AgentCore, Lambda, or ECS, you inherit the built-in observability capabilities, such as seamless integration with Amazon CloudWatch for metrics, logs, and distributed tracing. This simplifies tracking invocation counts, errors, request duration, and concurrency, as shown in the following figure – essential for operating reliable and scalable agentic applications.

In addition, the Strands Agents SDK provides built-in agent observability features. It uses OpenTelemetry (OTEL) to automatically trace each agent interaction, including spans for LLM calls, tool usage, and context updates. It also exports detailed metrics such as token counts, tool execution times, and decision cycle durations. These metrics can be sent to any OTEL-compatible backend, giving you deep, real-time visibility into how your agents reason, act, and adapt. The following snippet shows built-in token usage metrics:

{
  "accumulated_usage": {
    "inputTokens": 1539,
    "outputTokens": 122,
    "totalTokens": 1661
  },
  "average_cycle_time": 0.881234884262085,
  "total_cycles": 2,
  "total_duration": 1.881234884262085,
  ... redacted ...
}

Learn more about observability and evaluation of Strands agents from this sample code.

When using Bedrock AgentCore, the AgentCore Observability primitive helps you to log and capture metrics and traceability from other AgentCore primitives like runtime, memory, and gateway, as described in this tutorial.

Security considerations

You should build secure communication and access controls layers deploying AI agents that integrate with remote MCP servers. All client-server interactions should be encrypted using TLS, ideally with mutual TLS for bidirectional authentication. Access to tools should be validated through authorization checks with fine-grained permissions to enforce least privilege access. Deploying MCP servers behind an API Gateway provides additional security layers like DDoS protection, WAF, and centralized authentication. Use API Gateway logging capabilities to capture caller identity and execution outcomes. Using trusted, versioned MCP repositories helps protect against supply chain attacks and ensures consistent tool governance across teams. Protocols such as MCP are evolving rapidly, you should always use the most recent versions to minimize potential security vulnerabilities risk.

In addition, you should leverage security best practices described in the AWS Well-Architected Framework Security Pillar, such as enforcing strict IAM role scoping, integrating with identity providers for user context, encrypting all data in transit and at rest, and using VPC endpoints and PrivateLink to limit network exposure. To protect against prompt injection attacks, sanitize inputs, and ensure you maintain comprehensive audit logs for compliance and governance.

Sample project

Follow instructions in this GitHub repo to deploy a sample project implementing the practices described in this post using the AWS Serverless compute. The repo includes a travel agent implemented with Strands Agents SDK and a remote MCP server, both running as Lambda functions.

Conclusion

Agentic AI moves beyond simple prompt-response interactions to enable dynamic, goal-driven workflows. In this post, you learned how to build scalable, production-ready agents on AWS using the Strands Agents SDK and serverless services such as Lambda and Amazon ECS.

By externalizing state, integrating authentication, and adding observability, agents can operate securely and at scale. With support for in-process and remote tools through the MCP, you can cleanly separate responsibilities and build composable, enterprise-ready systems. You can combine these patterns to deliver intelligent, adaptable AI agents that fit naturally into modern cloud and event-driven architectures.

Useful resources

To learn more about Serverless architectures see Serverless Land.

How Zapier runs isolated tasks on AWS Lambda and upgrades functions at scale

Post Syndicated from Anton Aleksandrov original https://aws.amazon.com/blogs/architecture/how-zapier-runs-isolated-tasks-on-aws-lambda-and-upgrades-functions-at-scale/

Zapier is a leading no-code automation provider whose customers use their solution to automate workflows and move data across over 8,000 applications such as Slack, Salesforce, Asana, and Dropbox. Zapier runs these automations through integrations called Zaps, which are implemented using a serverless architecture running on Amazon Web Services (AWS). Each Zap is powered by an AWS Lambda function.

In this post, you’ll learn how Zapier has built their serverless architecture focusing on three key aspects: using Lambda functions to build isolated Zaps, operating over a hundred thousand Lambda functions through Zapier’s control plane infrastructure, and enhancing security posture while reducing maintenance efforts by introducing automated function upgrades and cleanup workflows into their platform architecture.

Architecting a secure and isolated runtime environment

Zaps created by Zapier’s users implement tenant-specific business logic, hence they require cross-tenant compute isolation. Code implementing one Zap can’t share an execution environment with code implementing another Zap. Moreover, the same Zap type used by two different tenants can’t share execution environments as well.

To achieve the required level of isolation, Zapier’s engineering team adopted AWS Lambda, a serverless compute service that runs code in response to events and automatically manages cloud compute resources. Minimal operational overhead, built-in high availability, automated scaling, high level of isolation, and pay-per-use model made Lambda a great fit for this use case. Currently, Zapier’s architecture is running over a hundred thousand Lambda functions to support their customer’s integration workflows.

Because they’re powered by the open source Firecracker microVMs, each function is completely isolated from the others. Moreover, each execution environment belonging to the same function (sometimes referred to as function instances) is also isolated from other execution environments. The following architecture topology diagram uses red lines to represent isolation boundaries. Each execution environment of every function is isolated from its peers and is getting its own virtual resources such as disk, memory, and CPU. For more details, read Security in AWS Lambda.

Isolation boundary

Zapier’s control plane is architected using Amazon Elastic Kubernetes Service (Amazon EKS). A designated database is used to maintain the up-to-date function inventory. Whenever a user creates a new Zap, the control plane creates a corresponding Lambda function and stores a reference in the inventory database. When a Zap is triggered, the control plane retrieves information about a relevant Lambda function and invokes it to facilitate the integration workflow, as illustrated in the following diagram.

Control and Data planes

Understanding the runtime deprecation process

When building architectures using the traditional non-serverless compute, cloud engineers are the ones responsible for keeping operating systems and software on their compute instances up to date and applying security and maintenance patches. With serverless architectures and Lambda functions, security patches and minor runtime upgrades are handled by AWS automatically, which means customers can focus on delivering business value instead of the undifferentiated heavy lifting of infrastructure management.

When a major Lambda managed runtime version reaches end-of-life, AWS initiates a deprecation process through the AWS Health Dashboard and direct email communications to affected customers. Because deprecated runtimes eventually lose access to security updates and support, organizations must upgrade to supported runtime versions to avoid potential security risks. Read more about the shared responsibility model, runtime use after deprecation, and receiving runtime deprecation notifications.

As Zapier’s user base and architectural complexity – and consequently the number of Zaps – were growing, keeping all functions on the most up-to-date major runtime versions became a laborious task. Top contributing factors were:

  • High number of functions. At its peak, the Zapier platform was running Zaps using hundreds of thousands of unique Lambda functions. Approximately 35% of these functions were using a runtime that was scheduled for deprecation in the next 12 months.
  • Zapier architected their data plane environment to be ephemeral – the control plane creates and deletes Lambda functions on demand and manages their lifecycle dynamically. Identifying a specific owner for each affected function wasn’t always straightforward.
  • Security is paramount at Zapier and upgrading affected functions runtime prior to the deprecation date was an absolute must. At no point could Zapier functions use runtimes after their deprecation date. This was a task which required extra resources.
  • The upgrade process shouldn’t have had any impact on the end customer experience. At no point should customer experience be affected.

With a short runway, high-volume workload, and the strict requirements of not impacting customer experience, Zapier’s Platform Engineering team took on this challenge of maintaining high security posture in their platform architecture.

Applying the solution

The solution had three work streams:

  1. Reducing the risk by analyzing the architecture and identifying and cleaning up unused functions.
  2. Prioritizing upgrades by identifying the most critical and impactful functions.
  3. Empowering engineering teams with automated tools and knowledge to streamline the upgrade process in future.

Identify and clean up unused functions

The first step in streamlining the upgrade process was identifying and removing unused functions. This reduced the total number of functions in Zapier’s architecture that required upgrades, eliminating unnecessary work for the team.

Zapier started by augmenting the function inventory with runtime information using AWS Trusted Advisor and Amazon Cloud Intelligence Trusted Advisor dashboards, as illustrated in the following diagram.

Gathering data

This meant the team could build a detailed inventory of functions that were running on soon-to-be deprecated runtimes. Using Amazon CloudWatch, Zapier’s platform team started to monitor metrics such as number of invocations. They identified which functions were active, which functions weren’t used for an extended period, and which functions didn’t have an active owner and could be removed.

One of the primary mechanisms for ownership validation within the organization was using resource tags. Functions that were active, but didn’t have clear ownership, were flagged for additional review before removal. Functions that were confirmed as unused or didn’t have an active owner were marked for deletion. Removing such functions allowed Zapier to significantly simplify their architecture and reduce the number of functions that had to be upgraded.

Prioritizing upgrades

With a smaller volume of functions to upgrade, Zapier’s platform team prioritized function upgrades based on usage patterns, criticality, and potential customer impact. Three primary prioritization categories were:

  • Customer-facing functions – Any functions directly involved in executing user Zaps were marked as high priority. These had to be upgraded first to avoid service disruptions.
  • Backend infrastructure functions – Internal functions that supported system operations were evaluated based on their importance to platform stability.
  • High-volume functions – Functions with the highest execution frequency were prioritized because upgrading them would have the greatest impact on reducing operational risk.

Using these factors, Zapier’s platform team has created an upgrade roadmap, ensuring that critical assets were addressed first while minimizing potential disruptions.

Refer to Retrieve data about Lambda functions that use a deprecated runtime in the Lambda Developer Guide to learn how to identify most commonly and most frequently used Lambda functions in your serverless architecture.

Empowering engineering teams with automated tools and knowledge

To ensure a smooth and efficient upgrade process across their serverless architecture, Zapier’s team empowered engineering teams with clear guidelines and automated solutions. The platform incorporated two main approaches: Terraform-managed functions and a custom-built Lambda runtime canary tool. Implementing and adopting these tools and practices resulted in reducing the number of functions using soon-to-be deprecated runtimes by 95%.

For functions managed through infrastructure-as-code (IaC), Zapier’s team developed standardized Terraform modules that specified supported runtime versions. Development teams implemented these modules in their configurations:

resource "aws_lambda_function" "example" {
    runtime = "python3.13"  # Updated to supported runtime
}

After applying the new module version, teams validated changes by testing the new runtime in staging environments and monitoring Terraform plan outputs to ensure proper runtime version updates.

To efficiently manage most Lambda functions in their architecture, Zapier developed the Lambda runtime canary tool suite. Using this solution, they automated the runtime upgrade process for thousands of active Lambda functions with minimal manual intervention. The tool suite implements several key features:

  • Architected for gradual traffic shifting with the Lambda built-in routing mechanism through function version and aliasing. The tool can gradually shift traffic distribution from an old to a new function version. During this gradual traffic shift, the system monitors CloudWatch metrics for errors and automatically rolls back if error rates exceed acceptable thresholds.
  • Optimistic upgrade strategy implements direct upgrades for infrequently used functions using a flag value stored in a cache to detect potential issues during the first post-upgrade invocation. If this invocation fails, the control plane retries it using the previous function version. If the retried invocation succeeds, Zapier’s control plane initiates a rollback, assuming the error is most likely due to the runtime upgrade. After rollback, it will log the error and alert relevant stakeholders.
  • Integration with existing infrastructure uses an administrative interface and task queue for automated traffic shifting. A database ledger maintains tracking of function states and rollback information.
  • Operational controls provide manual rollback capabilities and implement centralized control switches for process management. After a function was upgraded to a new runtime and no rollback activity was detected within a set time period, an automated pruning task cleans up older versions.

Zapier’s Lambda canary tool, through its integration of gradual traffic shifting, real-time CloudWatch monitoring, and automated rollback mechanisms, established a sustainable framework for managing runtime upgrades across their serverless architecture. This approach not only automated the upgrade process and minimized operational risks but also created a scalable solution that provides continuous runtime upgrades, preventing the use of deprecated runtimes at any point. By allowing continuous function runtime updates with minimal disruption to end user experience, Zapier maintains security and stability while requiring minimal manual intervention. This framework efficiently manages their growing serverless infrastructure, providing both security and operational efficiency for future runtime updates.

Conclusion

In this post, you’ve learned how Zapier architected their software-as-a-service (SaaS) platform to provide secure, isolated execution environments using AWS Lambda and Amazon EKS, enabling their customers to create hundreds of thousands of Zaps. You’ve learned how Zapier’s team implemented the function runtime upgrade process at scale and reduced the number of functions running on soon-to-be deprecated runtimes by 95%. You’ve seen best practices that were established and techniques that helped Zapier to keep high security posture without impacting customer experience.

Use the following links to learn more about Lambda runtimes and upgrading your functions to the latest runtime versions:


About the authors

Dynamically routing requests with Amazon API Gateway routing rules

Post Syndicated from Anton Aleksandrov original https://aws.amazon.com/blogs/compute/dynamically-routing-requests-with-amazon-api-gateway-routing-rules/

Effective API management and routing capabilities are crucial for organizations managing complex application architectures. Whether you’re a technology company rolling out new API versions to millions of users, or a financial services organization conducting A/B tests to optimize customer experiences, the ability to route API traffic dynamically and efficiently is essential.

Today, Amazon API Gateway announces support for dynamic routing rules for custom domain names in all supported AWS Regions. This new capability enables you to route API requests based on HTTP header values, either independently or in combination with URL paths. In this post, you will learn how to use this new capability to implement routing strategies such as API versioning and gradual rollouts without modifying your API endpoints.

Dynamic Routing Rules Overview

Many organizations require dynamic API routing capabilities to support their evolving business needs. As a line-of-business persona, you want to be able to test new user experiences with specific customer segments, while maintaining their existing flows intact. As an engineer, you want to be able to maintain multiple API versions across different client applications while ensuring regulatory compliance. Prior to this launch, developers using API Gateway implemented dynamic routing by using different URL paths, such as “/v1/products” and “/v2/products”.

With this new launch, you can implement dynamic routing logic with a simple declarative configuration within the custom domain name settings. The new routing rule mechanism allows you to make routing decisions based on HTTP headers, base paths, or a combination of both. Developers are no longer required to create new or alter existing paths to smoothly transition between API versions, they can simply specify the desired value in the request HTTP header. Among other possibilities, you can implement cell-based architecture routing, A/B testing, or dynamic backend selection based on hostname, tenant ID, accepted response media type, or cookie value. By implementing routing logic directly within the API Gateway, you can eliminate proxy layers and complex URL structures while maintaining fine-grained control over your API traffic. This new feature seamlessly integrates with existing API Gateway capabilities and supports both public and private REST APIs. The following diagram shows how you can use routing rules for header and base-path based routing. This example uses a single level resource /products to show path matching, however depending on your use-case you could also use multi-level paths like /products/items.

Figure 1. Using routing rules for header and base-path based routing

In the following section you’ll learn how to implement header-based routing, use the new routing rules construct for common scenarios like API versioning and A/B testing, and configure rules with different routing conditions and priorities to achieve the desired behavior.

What is a routing rule

A routing rule is a new resource type uniquely associated with a single custom domain. It represents a collection of conditions that, when matched, cause the incoming request to be forwarded to a specific API and stage. Routing rules have three configuration properties:

  • The Conditions property defines the criteria that must be met for actions to be taken. A rule can include up to two header conditions and one base path condition, and all specified conditions must be met to trigger the action. If no conditions are defined for a rule, it serves as a catch-all rule matching all requests.
  • The Actions property defines what actions will be taken when rule conditions are met. At the time of this launch the supported action is invoking any stage of any REST API within the same account and region boundaries.
  • The Priority property defines the order that rules are evaluated in, with 1 being highest priority and 1,000,000 the lowest. You cannot reuse same priority value for more than one rule. AWS recommends you leave ample space between sequential rules to make it easy to add new rules in future, for example use 100, 200, 300 instead of 1, 2, 3.

Header conditions, specified via a MatchHeaders property, are used to match HTTP request header values, such as x-version=v1. Conforming to RFC 7230, header names are not case sensitive, while header values are. You can also use wildcards in header values for prefix, suffix, and contains match. See the following examples using AWS CloudFormation templates:

Exact match:

- MatchHeaders: 
	AnyOf: 
		- Header: "x-version" 
		ValueGlob: "alpha-v2-latest"

Will only match x-version=alpha-v2-latest

Prefix match:

- MatchHeaders: 
	AnyOf: 
	- Header: "x-version" 
	ValueGlob: "*latest"

Matches x-version=alpha-v2-latest, but not x-version=alpha-v2

Suffix match:

- MatchHeaders: 
	AnyOf: 
		- Header: "x-version" 
		ValueGlob: "alpha*"

Will match x-version=alpha-v2-latest and x-version=alpha-v1, but not x-version=beta-v1

Prefix and suffix match.

- MatchHeaders: 
	AnyOf: 
		- Header: "x-version" 
		ValueGlob: "*v2*"

Matches x-version=alpha-v2-latest and x-version=beta-v2-test, but not x-version=alpha-v1

Base path condition, specified via MatchBasePaths property, is used to match the incoming request path. The matching is case sensitive.

- MatchBasePaths: 
	AnyOf: 
		- "products"

You can have up to two MatchHeaders and one MatchBasePaths conditions per routing rule. Conditions are evaluated using the AND operator, meaning all conditions must be met for the action to be taken. Both condition types support a single comparison value under AnyOf property. The following snippet illustrates a sample routing rule with two MatchHeaders conditions and a single MatchBasePaths condition.

ProductsV1RoutingRule: 
	Type: 'AWS::ApiGatewayV2::RoutingRule' 
	Properties: 
		DomainNameArn: !Sub "arn:aws:apigateway:${AWS::Region}::/domainnames/${ApiCustomDomain}" 
		Priority: 100 
		Conditions: 
			- MatchHeaders: 
				AnyOf: 
					- Header: "x-version" 
					ValueGlob: "v2" 
			- MatchHeaders: 
				AnyOf: 
					- Header: "x-user-cohort" 
					ValueGlob: "beta-testers" 
			- MatchBasePaths: 
				AnyOf: 
					- "products" 
		Actions: 
				- InvokeApi:
					ApiId: !Ref ProductsV2Api 
					Stage: !Ref ProductsV2Stage

This rule matches requests to https://example.com/products when both header conditions are met – x-version=v2 and x-user-cohort=beta-testers. This rule does not match requests to any other base path, such as https://example.com/orders, or requests that do not match at least one header condition.

For scenarios like API versioning, you can create rules that evaluate headers such as “accept” or “version” to route traffic to different API implementations. For example, to route requests containing “x-version: api-beta” to your beta API, you would create a rule specifying this header condition and set the action to route to your beta API deployment.

Header-based routing also simplifies A/B testing by allowing you to define client cohorts based on custom headers, allowing controlled experiments with different configurations. You can create rules that check for a custom header like “x-test-group” to route specific users to different API implementations. The priority system ensures predictable routing behavior – when multiple rules match a request, the rule with the lowest priority number (highest precedence) determines the routing. Combining header and path conditions within a single rule enables complex routing scenarios such as version-specific routing for specific API resources instead of the entire API, as illustrated in the following diagram.

Figure 2. A routing configuration with two header and one path conditions in API Gateway Console.

Review the API Gateway documentation for detailed guide on creating routing rules.

Configuring Routing Mode

Before you begin creating routing rules, you must first create at least one API, stage, and a custom domain name. You can configure your custom domain name with the new routing mode setting.

  • API mappings only. This is the default mode. When using this mode, you can continue to use base path mappings to route requests to different APIs, and not use Routing Rules at all. This mode maintains the current behavior, where requests are routed based on base path mappings only.
  • Routing rules then API mappings. With this mode you can use Routing Rules while continuing to keep base path mappings as a fallback. When you use this mode, the Routing Rules always take precedence, and unmatched requests are evaluated against base path mappings. This mode is useful for gradually transitioning your APIs to Routing Rules.
  • Routing rules only. This mode gives you the flexibility to use routing rules only, and not rely on the base paths that you may have previously created on the domain using API mappings. This is the recommended routing mode; it is helpful when you are starting off with a new custom domain or finished transitioning from API mappings to Routing Rules for an existing custom domain.

When switching from one routing mode to another, always test your new configuration in non-production environments first. For example, when switching mode from API mappings only to routing rules only, your traffic will only be routed with routing rules; existing API mappings will no longer take effect.

Onboarding to Header-Based Routing

You can adopt the new Header-Based Routing for your existing API Gateway custom domains with zero-downtime, risk-minimized approach. The first step is to configure your custom domain to use the Routing rules then API mappings mode using the API Gateway console, AWS CLI, or your infrastructure-as-code (IaC) tool. This configuration ensures that while you gradually create Routing Rules, your existing base path mappings continue to function as fallback routes. Since Routing Rules are evaluated before base path mappings, and in the absence of any matching rules, requests automatically fall back to your existing base path mappings, your current API traffic remains unaffected during this transition.

Once you’ve configured the routing mode, you can progressively introduce Routing Rules alongside your existing setup. For example, you might start by creating a rule with a specific test header that routes to a new API version, allowing you to validate the routing behavior with controlled test traffic while production traffic continues flowing through your existing base path mappings. As you gain confidence in the new routing configuration, you can gradually expand your rules, adjust priorities, and optionally migrate away from base path mappings entirely. This incremental approach, combined with API Gateway’s observability capabilities described in the next section, enables you to validate each change and ensure your API consumers experience no disruption during the transition.

Observability

API Gateway provides comprehensive visibility into how your routing rules are processing requests through access logging. Each request now includes additional context variables that help you understand the routing decision process. The $context.customDomain.routingRuleIdMatched variable identifies which rule was matched and applied to the request, while existing variables like $context.domainName, $context.apiId, and $context.stage provide the complete routing context. By analyzing these access logs, you can verify routing behavior, troubleshoot unexpected routes, and gather insights about traffic patterns across different API versions or test variants.

End-to-end example

Consider a real-world scenario where a team needs to gradually migrate users to a new API version, such as an e-commerce platform updating its checkout API from v1 to v2. First, the team creates two different REST APIs – one for each version. Then, they set up a Routing Rule with priority 100 that checks for the header x-version=v2 and routes matching requests to the v2 API. They also create another rule with priority 200 that routes all requests with paths starting with /checkout to v1 API as a fallback.

Figure 3. Gradually transitioning clients from v1 to v2 API.

In the application code they add the x-version header for a small percentage of users. They monitor the performance and error rates using API Gateway’s telemetry capabilities by tracking the access and execution logs, along with emitted metrics. As their confidence grows, they gradually increase the percentage of users sending the v2 header. This approach ensures a controlled migration with minimal risk and ability to quickly rollback by simply removing the header from requests or changing a routing rule.

Sample

Follow the instructions in this GitHub repository to provision the sample in your AWS account. The project illustrates using dynamic routing with API Gateway.

Conclusion

Header-based routing brings significant advantages to API Gateway users. The feature’s backward compatibility ensures a smooth transition path – you can maintain existing base path mappings while gradually adopting Routing Rules, or use both mechanisms simultaneously with the fallback option. This flexibility allows you to migrate at your own pace without disrupting existing applications. The solution is cost-effective, with no additional charges for using Routing Rules on REST APIs. It reduces requirements to leverage extra service and infrastructure for dynamic routing. The priority-based evaluation system provides deterministic routing behavior, making it easier to understand and troubleshoot routing decisions.

To learn more about API Gateway header-based routing see the service documentation.

To learn more about Serverless architectures see Serverless Land.

How Launchpad from Pega enables secure SaaS extensibility with AWS Lambda

Post Syndicated from Anton Aleksandrov original https://aws.amazon.com/blogs/architecture/how-launchpad-from-pega-enables-secure-saas-extensibility-with-aws-lambda/

Large organizations increasingly adopt software as a service (SaaS) solutions to focus on business priorities, reduce infrastructure management overhead, and optimize costs. These organizations expect SaaS vendors to provide customizability facilities for tailoring the solution behavior according to their needs. Although traditional approaches like feature flags and webhooks offer some flexibility, they often fall short of providing a high degree of customizability. A new emerging pattern in this space is tenant-supplied custom code execution, which allows tenants to inject their own code into specific workflow points, enabling deep customization while preserving the core SaaS solutions’ integrity and security.

In this post, we share how Pegasystems (Pega) built Launchpad, its new SaaS development platform, to solve a core challenge in multi-tenant environments: enabling secure customer customization. By running tenant code in isolated environments with AWS Lambda, Launchpad offers its customers a secure, scalable foundation, eliminating the need for bespoke code customizations.

Solution overview

Launchpad, which is built on AWS, is an end-to-end platform on which software providers can build, launch, and operate workflow-centric B2B SaaS applications and AI solutions. It provides a managed, secure, scalable cloud environment for hosting multi-tenant applications and data. It accelerates the build experience with generative AI-powered low code tools, prebuilt capabilities, and subscriber-level configuration. Being a multi-tenant platform at its core, Launchpad had to maintain stringent isolation across tenants in its architecture.

One of the requirements Launchpad had was to allow their tenants to augment the workflows natively by providing custom code. Some common scenarios included communicating with external systems with proprietary non-industry-standard protocols, reuse of existing business logic, and SDK-based custom code development.

The solution necessitated the ability for tenants to provide custom code that would implement the required business logic, which Launchpad would be executing. This required architecting a secure runtime environment for custom code execution that maintains the highest degree of cross-tenant isolation within the multi-tenant architecture, at the same time allowing sufficient access to platform APIs and services. It was essential to build an architecture that would decouple the environment running tenant code from the core SaaS platform, as illustrated in the following diagram.

Architecting the solution topology

To achieve the required high level of compute isolation for running code provided by different tenants, Launchpad has adopted Lambda functions in its architecture as the secure ephemeral compute environment. Each untrusted code snippet provided by tenants is bootstrapped as a stand-alone Lambda function, with strong Firecracker-based isolation across different functions and execution environments addressing Launchpad’s requirements. This isolation provides dedicated resources, customizable access permissions, independent monitoring and operations, and automatic scaling for each function, while maintaining complete separation from other functions and their execution environments, as illustrated in the following diagram.

With Lambda being a serverless compute service, adopting it for the Launchpad architecture yielded several significant benefits. The major business benefit was that tenants could implement thousands of custom workflow augmentations on their own simply by providing code snippets, instead of the Launchpad engineering team being responsible for implementing them in the core platform code. Other benefits included:

  • Managed runtimes – AWS handles patching and updating the underlying infrastructure, operating system, and runtimes for customers, reducing the potential attack surface.
  • Fine-grained permissions – Each function can have its own set of access policies to tightly control what resources and actions it can access.
  • No need to pre-provision and pay for overprovisioned capacity – Lambda functions scale up and down automatically based on traffic patterns.
  • Built-in monitoring – Lambda functions emit detailed metrics, logs, and traces through Amazon CloudWatch and AWS X-Ray out of the box, making it straightforward to monitor tenant code execution.

To further reduce risks, Launchpad runs these Lambda functions with untrusted code in a dedicated AWS account. This account is separated from the core SaaS platform account. When end-users create a new function in the Launchpad authoring portal, they upload their code and specify the code handler to be executed during the invocation. Users can also map function input and output to Launchpad fields for further processing to enable an even higher degree of customizability and integration. The multi-tenant authoring service is a Control Plane component that runs as a microservice on the Amazon Elastic Kubernetes Service (Amazon EKS) cluster and uses the Lambda API for function lifecycle management, as illustrated in the following diagram. After a function resource is created, it can be used for further invocations.

Runtime architecture

At runtime, when Launchpad needs to invoke a function, it calls the Lambda Invoke API. Before the function is invoked, the multi-tenant runtime service performs a tenancy check to make sure the request is coming from an authorized tenant by doing the token validation. After a successful validation, the service invokes the required Lambda function. To invoke functions hosted in a different AWS account, the multi-tenant runtime service uses an AWS Identity and Access Management (IAM) role to assume the required permissions and invokes the Lambda service using the AWS SDK. The sequence of interactions is shown in the following architecture diagram.

The workflow consists of the following steps:

  1. An incoming user request reaches the application gateway service.
  2. The application gateway authenticates the request using the tenancy security service.
  3. After it’s authenticated, the request is forwarded to the multi-tenant runtime service
  4. The multi-tenant runtime service validates the supplied token and performs a tenancy check. This makes sure tenants can only invoke own functions they have permissions for (for example, functions they own).
  5. The multi-tenant runtime service pod assumes the IAM role required for invoking the tenant-specific Lambda function in a different AWS account.
  6. The multi-tenant runtime service pod invokes the required Lambda function.

Invoking the platform API from custom code is as straightforward as connecting to any external API. The custom code can authenticate with the platform using OAuth2. To facilitate the authentication, the developer can pass along the credentials as input parameters to the function from the core platform. Then the developer can create a corresponding record (isolated by tenant) in the platform that stores the credentials per function, and pass credentials as input parameters during invocation.

Distributed architecture observability

Operating a distributed architecture that runs untrusted code across multiple AWS accounts requires a comprehensive observability strategy. Launchpad’s approach combines centralized logging and monitoring with cross-account aggregation to provide a unified operational view of the platform.

The monitoring architecture uses CloudWatch Metrics to observe the Lambda functions, aggregating them through a centralized observability layer. This setup empowers platform operators to correlate Lambda function metrics with the core platform services running on Amazon EKS. Launchpad also collects per-function telemetry like function invocations, error rates, and execution time, which allows them to observe per-tenant metrics. These telemetry dimensions enable both a platform-wide and tenant-specific monitoring perspective.

For logging and troubleshooting, Launchpad implements a unified logging pipeline that aggregates Lambda function logs with application gateway and runtime service logs. Each request flowing through the system carries a correlation ID, so operators can trace execution paths across the core SaaS services and into the tenant functions running in the AWS account running tenant Lambda functions.

With this multi-layer observability architecture, Launchpad can maintain operational excellence while running tenant code securely at scale. Regular operational reviews drive continuous improvements in monitoring coverage and incident response procedures. Having per-tenant Lambda functions make it possible for Launchpad to use tenant-specific cost allocation tags, further empowering them to understand the cost footprint of running tenant custom code.

Best practices

When building a SaaS solution, maintaining a unified core code base is essential for scalability and manageability. Implementing per-tenant variations within the core platform code can lead to maintenance complexity and technical debt. Instead, architect your SaaS solution to have extension points, which allow your tenants to inject their custom code at specific points in the workflow, enabling customization without compromising the platform’s maintainability. This pattern makes sure the core SaaS platform remains clean and standardized while offering the flexibility that customers demand.

Additional best practices include:

  • Use separate accounts for running Lambda functions with untrusted tenant-provided code to make sure it’s isolated from your core SaaS platform code.
  • Grant absolute minimum required access permissions to the execution role assigned to the function. The custom code running within the execution environment gets permissions defined in the execution role when making requests to AWS API endpoints. If the function doesn’t need to reach out to AWS API endpoints, remove all permissions from the execution role and add an explicit AWSDenyAll policy.
  • Use separate Lambda functions for each code snippet and each tenant. This will provide the highest degree of cross-tenant isolation. Resources are not reused across different functions and execution environments.
  • Use Lambda layers in case you need to add a layer of vendor-provided code in order to keep it separated from the untrusted tenant-provided code.
  • Implement additional security controls, such as using Amazon Virtual Private Cloud (Amazon VPC) constructs to restrict network access and VPC Flow Logs for network activity monitoring.

Conclusion

The implementation of a secure untrusted code execution environment within SaaS platforms addresses a critical need for tenant customization while maintaining architectural integrity. Lambda offers a built-in isolation model, fine-grained security controls, and serverless scalability, so SaaS providers such as Launchpad can address the requirements of executing tenant-provided code in a multi-tenant environment and offer robust customization capabilities while maintaining strict security boundaries and operational efficiency. This architectural pattern enables providers to focus on core platform development while confidently supporting tenant-specific workflows through the secure and scalable Lambda execution environment.

To learn more, refer to the Security Overview of AWS Lambda white paper. For additional serverless architectural patterns, see Serverlessland.com.


About the authors

Enhancing multi-account activity monitoring with event-driven architectures

Post Syndicated from Anton Aleksandrov original https://aws.amazon.com/blogs/compute/enhancing-multi-account-activity-monitoring-with-event-driven-architectures/

Enterprise cloud environments are growing increasingly complex as they scale, with organizations managing hundreds to thousands of Amazon Web Services (AWS) accounts across multiple business units and AWS Regions. Organizations need efficient ways to collect, transport, and analyze activity data for threat detection and compliance monitoring. This presents unique challenges for enterprise Application Security (AppSec) teams, cloud security vendors, and DevSecOps professionals, because traditional polling-based monitoring approaches struggle to provide real-time activity insights needed for modern cloud operations.

In this post, you will learn to use AWS CloudTrail and Amazon EventBridge for real-time cloud activity monitoring and automated response.

Overview

As organizations expand their cloud footprint, account activity monitoring that comprehensively tracks user actions and successfully identifies security threats becomes crucial for threat detection and compliance. Although AWS provides native tools—such as CloudTrail for API activity capture, EventBridge for real-time event routing, AWS Organizations for multi-account management, and AWS Config for resource evaluation—many enterprises struggle with the volume of activities while maintaining efficiency and controlling costs. Organizations need to carefully architect solutions to effectively use these tools as their environments scale.

Traditional polling-based techniques, which worked well for smaller environments, can become unsustainable when scaled to enterprise deployments, where the volume of activity data grows exponentially with each new account and service. API polling limitations, growing data volumes, and increasing demand for real-time analysis are pushing teams to rethink their architectural approach.

Figure 1. Poll model, periodically retrieving the latest state.

Adopting push-based event-driven architectures offers a compelling solution for AppSec teams and cloud security vendors facing these challenges. Using AWS services, such as CloudTrail and EventBridge, allows these teams and vendors to build scalable activity monitoring solutions that overcome the limitations of traditional polling-based approaches and provide real-time notifications across thousands of AWS accounts. This approach not only enables security use cases but also supports broader real-time operational monitoring, compliance reporting, and automation requirements.

“By integrating AWS CloudTrail and Amazon EventBridge, we’ve built a scalable architecture to monitor activity across thousands of AWS accounts. This provides the visibility needed to detect threats in real time and protect large, distributed AWS environments.” — Rob Solomon, Senior Cloud Solution Architect, CrowdStrike

Solution components

Enterprise AppSec teams and cloud security vendors share common requirements when building multi-account monitoring solutions. They need to efficiently collect activity data across thousands of accounts, transport it to a centralized location for analysis, and process it in real-time to detect threats and compliance violations. The solution must scale seamlessly from dozens to thousands of accounts while remaining highly-performant and cost-efficient. At its core, a scalable multi-account activity monitoring solution consists of three components: activity data collection, cross-account transport to a centralized location, and processing. In the following sections, you will learn how AppSec teams and cloud security vendors can implement each step efficiently while avoiding common pitfalls.

Figure 2. Push model. Account activity is collected at the source, and pushed to the AppSec or cloud security vendor account for further processing.

Data collection strategies

Many teams begin their cloud activity monitoring journey by polling the resource status through service management APIs. Although this approach works good for retrieving the latest resource state on-demand, its fundamental limitation is inability to detect state changes efficiently, necessitating continuous querying of all resources at fixed intervals. Consider a scenario where you’re monitoring 1,000 accounts, with 100 resources in each account. A single polling cycle would necessitate 100,000 API requests, consuming over 28 million API calls daily if running at five-minute intervals. This inefficiency compounds as environments grow, leading to throttling issues, increased costs, and scaling challenges.

AWS Config improved upon this by offering continuous resource configuration tracking without manual polling. Although this works excellent for configuration compliance and a history of changes for auditing, AWS Config reports changes on a best-effort basis and is not optimal for real-time threat detection.

To overcome this constraint, your solution can use services such as CloudTrail and EventBridge as primary data sources, complemented by intelligent on-demand targeted API polling. CloudTrail records API activity across AWS services, providing a detailed history of actions taken by users, roles, and AWS services in your accounts. Over 250 AWS services automatically report their activity and API calls to CloudTrail and EventBridge in real-time. This allows you to capture this information, providing a detailed history of actions taken in your accounts, and enabling security analysis, resource state change tracking, and compliance audit.

Figure 3. Over 250 AWS services are automatically emitting activity events to CloudTrail.

When a resource state changes, commonly as a result of a management API call, the affected service sends an event to CloudTrail and EventBridge. Your monitoring solution can examine the event payload to determine if polling for supplementary data is necessary, particularly when the initial payload lacks complete information. This provides you with comprehensive service coverage with reduced maintenance effort. This hybrid approach guarantees delivery of activity data to eliminate monitoring blind spots, while significantly reducing AWS management API quota consumption.

Cross-account data transport

Your solution should transport activity data from thousands of tenant accounts into a small number of centralized accounts, such as a regional AppSec account, for further processing and analysis. The solution must be secure, scalable, resilient, and cost-efficient while maintaining real-time delivery.

The most direct way to achieve it is to enable Amazon S3 event notifications for new objects that are created in the CloudTrail trails S3 bucket. When you receive the notification, you can retrieve and process new activities.

Figure 4. Exporting CloudTrail events into an S3 bucket and retrieving after receiving a notification.

This direct way to consume CloudTrail events has one important consideration: typically it can take an average of five minutes to deliver events to Amazon S3. Teams and vendors looking for lower mean-time-to-detect (MTTD) and mean-time-to-respond (MTTR) should evaluate transporting CloudTrail events across accounts with EventBridge, which provides close-to-real-time delivery.

Transporting events with EventBridge

EventBridge is a serverless event router that connects applications. It receives events from various sources, such as CloudTrail, and routes them to multiple targets based on defined rules.

Using EventBridge for cross-account data transport comes with several major benefits:

There are two approaches you can take for delivering cross-account events with EventBridge: direct service-to-service or service-to-API-endpoint.

The first approach uses the EventBridge direct bus-to-bus and bus-to-service delivery capabilities. This method is most suitable when you want AWS to handle data ingestion on the receiving end. The delivery target is always either an EventBridge bus, or another AWS service, such as an Amazon Simple Queue Service (Amazon SQS) queue, Amazon Kinesis Data Streams stream, or an AWS Lambda function. With support for up to 18,750 target invocations per second and native AWS Identity and Access Management (IAM) integration, this method is particularly suitable for large multi-account deployments.

The second approach uses the EventBridge API destinations feature. This method is most suitable when you have existing HTTP-based ingestion endpoints in place. Although it offers lower throughput, it provides greater flexibility for ingestion endpoint and authentication methods implementation, making it attractive for AppSec teams and cloud security vendors integrating with existing ingestion infrastructure.

Figure 5. Emitting CloudTrail events in real-time through EventBridge.

The following table summarizes two approaches for transporting events across accounts with EventBridge.

Direct bus-to-bus or bus-to-service API destinations
Data ingestion implementation effort Minimal Needed
Default target invocations per second (TPS) quotas Up to 18,750 (region dependent) Up to 300 (region dependent)
Can the TPS quota be increased Yes Yes
Authorization support Native AWS IAM, fully handled by AWS Basic, OAuth2, API Key. You’re responsible for implementing credentials validation during ingestion.
Cross-account delivery costs $1 per million events $0.20 per million events

Go to the EventBridge quotas and pricing pages for more details.

Processing architecture

Processing would commonly be done by existing products and services the AppSec team or cloud security vendor provides for activity analysis. The architecture for event processing pipeline operating at enterprise scale must consider design decisions to handle large and potentially irregular event volumes while maintaining high performance, as shown in the following figure.

Figure 6. An activity event processing pipeline, with priority-based processing.

Use the following best practices for a robust processing architecture:

  • Buffer ingested events Use services such as Amazon SQS, Amazon Kinesis Data Streams, or Amazon Managed Streaming for Apache Kafka to buffer incoming events, handle traffic surges, and make sure of reliable processing.
  • Use serverless services that scale automatically, or invest in automated scaling mechanisms that adjust processing capacity based on event volume
  • Minimize polling: Resort to intelligent on-demand polling, only poll when you need additional data that is not available in the CloudTrail event payload.
  • Routing and classification: Rather than processing all events equally, implement intelligent classification and routing early in your pipeline. Security-related events such as IAM changes or security group modifications should take priority over routine activities or data events. This approach helps to control costs while maintaining rapid detection of important security events.
  • Cost optimization: At the enterprise scale, cost optimization becomes crucial. Use EventBridge rules in source accounts to filter out irrelevant events before they enter your processing pipeline. Consider implementing regional collection points to optimize data transfer costs. When using Lambda functions for data processing, use batch processing to reduce invocation costs. Evaluate which event types must be delivered in real-time through EventBridge, which event types can be delayed and collected through S3 bucket export, and which events should be discarded.
  • Observability: Monitor the ingestion and processing throughput to react to potential slowdowns early. Detect when source accounts are approaching EventBridge quotas. Consider using AWS Service Quotas to request quota increases automatically through APIs.
  • Cross-Region considerations: Design your architecture to support efficient cross-Region event collection while respecting data sovereignty requirements. Consider implementing regional processing nodes with centralized aggregation for global security analysis.
  • Integration patterns: Modern security solutions must integrate with existing security tools and workflows. Implement standardized output formats that allow seamless integration with SIEM systems, ticketing platforms, and automation frameworks. Consider publishing security findings back to EventBridge buses to enable automated remediation workflows. If you’re a cloud security vendor, then consider integrating with EventBridge as an SaaS partner.

Conclusion

Event-driven architectures present a powerful opportunity for building scalable multi-account activity monitoring solutions. Using services such as AWS CloudTrail and Amazon EventBridge allows teams to overcome the limitations of traditional polling-based approaches while achieving close to real-time delivery.The shift to event-driven security monitoring isn’t just an architectural choice—it’s becoming a necessity for teams operating at enterprise scale. This approach enables security teams to achieve the real-time threat detection capabilities needed in today’s cloud environments while maintaining operational efficiency and cost control.

Monitoring network traffic in AWS Lambda functions

Post Syndicated from Anton Aleksandrov original https://aws.amazon.com/blogs/compute/monitoring-network-traffic-in-aws-lambda-functions/

Network monitoring provides essential visibility into cloud application traffic patterns across large organizations. It enables security and compliance teams to detect anomalies and maintain compliance, while allowing development teams to troubleshoot issues, optimize performance, and track costs in multi-tenant software as a service (SaaS) environments. Implementing robust network monitoring allows organizations to effectively manage their security, compliance, and operational requirements while continuously enhancing their applications.

In this post, you will learn methods for network monitoring in AWS Lambda functions and how to apply them to your scenarios.

Overview

Lambda is a secure and highly scalable serverless compute service where each function operates in an isolated execution environment with strict security boundaries. This architecture delivers key advantages, such as enhanced security, automatic compute capacity scaling, and minimal operational overhead. Minimizing infrastructure management allows Lambda to enable organizations to redirect their focus from managing servers to other critical aspects, such as performance optimization and network traffic analysis. In turn, these enable organizations to build more secure and efficient applications.

Lambda network monitoring addresses diverse organizational needs, such as compliance requirements for audit logs and anomaly detection, business needs for traffic metering and customer billing, and development needs for troubleshooting network issues. Traditional agent-based or host-based monitoring methods often aren’t compatible with the strongly isolated, ephemeral execution environment of Lambda, which necessitates alternative approaches to meet these critical requirements.

You can use AWS-native, integrated network monitoring solutions, such as Amazon Virtual Private Cloud (Amazon VPC) Flow Logs, or build your own custom solution, as detailed in this post. Each solution offers distinct capabilities with varying levels of granularity and real-time visibility. When choosing an approach, you must evaluate key factors such as the desired data granularity, operational complexity, latency tolerance, and cost implications.

Using VPC Flow Logs

VPC Flow Logs is the AWS-recommended tool for network activity monitoring. If your scenario necessitates monitoring of the network activity of Lambda functions, then you can attach these functions to a VPC and enable Flow Logs. This captures detailed network traffic data, such as source and destination IPs, ports, protocols, and traffic volume for all traffic flowing through the network interfaces used by your functions.

When you attach your functions to a VPC, the Lambda service automatically creates an Elastic Network Interface (ENI) for functions to communicate with VPC-based resources. By default, VPC-attached functions can only access private resources within the VPC. If you need your functions to communicate with other AWS services, then you should use VPC Endpoints. If your function needs to communicate with the public internet, then you should use an NAT Gateway for egress traffic. The following diagram shows how you can use VPC Flow Logs for Lambda functions.

Flow Logs provide detailed insights into the IP traffic flowing to and from the network interfaces within a VPC, offering valuable data for network audits and activity monitoring. This approach promotes a clear separation of concerns between application and networking layers, with VPC constructs typically managed by a dedicated operations or infrastructure team.

VPC Flow Logs provides a robust network monitoring solution. However, when using it with Lambda functions, you should evaluate the following considerations:

  • It captures ENI-level information. ENIs can be reused across multiple functions, thus it won’t provide per-function or per-invoke granularity.
  • It only logs IP addresses, not DNS names (if capturing DNS names is a requirement for you).
  • It introduces infrastructure management into your serverless applications. You must learn VPC constructs or involve your infrastructure team.
  • Potential added data transfer costs. Go to the pricing for NAT Gateway, VPC Endpoints, and Flow Logs for more details.

The following sections explore Lambda network monitoring methods that can either be augmented with VPC Flow Logs for better granularity or used without attaching your functions to a VPC.

Proxying network traffic

You can configure the Lambda runtime to route egress network traffic through a side-car proxy that runs as a Lambda layer within the Lambda execution environment and logs network activity. The proxy layer should be agnostic to the language runtime. AWS recommends that you use compiled languages such as Rust or Golang for maximum reusability and minimal added latency. The following diagram shows emitting logs from a network proxy layer.

Applying proxy configuration differs across language runtimes. In Python you set proxy_http and proxy_https environment variables. Java uses JVM flags. Node.js doesn’t provide a native way to configure proxy using command line flags or environment variables. Therefore, you need to make code changes, such as configuring a proxy for your AWS SDK or using a third-party open source libraries such as global-agent or Interceptors.

The proxy approach is most suitable if you’re okay with making function code or configuration changes that might vary across runtimes. Furthermore, adding a network proxy server process inside the execution environment consumes resources shared with the function code, which can add network latency.

Refer to the post Enhancing runtime security and governance with the AWS Lambda Runtime API proxy extension for ways to intercept inbound requests/responses between the Lambda Runtime API and Runtime process.

Runtime-agnostic techniques

Following techniques use the fact that the Lambda execution environment is a Linux-based micro-VM. Lambda runtimes operate within a restricted user space that prevents the use of traditional OS-level monitoring tools needing elevated privileges, such as tcpdump, iptables, ptrace, or eBPF. The following techniques are specifically designed to work under these user space constraints, allowing their use without needing elevated privileges.

Reading OS networking layer information from procfs

Use this method when you need to obtain the OS-level information, such as metering transferred bytes, or see all open connections. You can use it to implement tenant chargebacks or detect network traffic pattern changes. The method is based on the proc pseudo-filesystem (also known as procfs) available in Linux OS, which provides an interface to kernel data and allows you to read OS-level information. For example, /proc/cpuinfo and /proc/meminfo pseudo-files provide information about current CPU and memory usage, while /proc/net/* provides you with network layer information. Reading /proc/net/tcp and /proc/net/udp gives you a list of active TCP/UDP connections, such as remote IP addresses and ports. Reading /proc/net/dev provides the list of network devices with detailed usage statistics, such as bytes transferred and received.

“The procfs method provides a simple but powerful way to collect critical network telemetry data from Lambda functions, such as up-to-date network statistics and file descriptor counts, which enables us to monitor outbound connections from Lambda functions. Better yet, it enables us to support multiple Lambda runtimes with a single implementation in our Rust-based, next-generation Lambda Extension”—AJ Stuyvenberg, Staff Engineer at Datadog.

The sample project provides the LambdaNetworkMonitor-Procfs stack to show this technique. For every invocation, the function reads /proc/net/dev, and sends network statistics to log and Amazon CloudWatch Metrics, as shown in the following figure.

Reading the /proc/net/dev pseudo-file is a simple and effective way to monitor Lambda functions networking without adding latency. However, it doesn’t capture DNS names and the IP addresses to which they resolve.

Intercepting network-related libc calls

Low-level network operations in Linux, such as DNS lookup and connection creation, are managed by the C Standard Library (libc). You can intercept libc function calls made by Lambda runtimes to monitor network traffic at the OS level. This is a significantly more advanced and complex mechanism, enabling visibility into OS-level activities, as shown in the following figure.

Intercepting libc function calls, such as getaddrinfo (DNS lookup) and connect, allows you to log details such as DNS name, IP addresses, ports, and protocols at a granular level, as shown in the following figure. This method allows you to capture comprehensive information about DNS queries and initiated network connections. It can provide precise per-function and per-invoke network monitoring, such as hostnames and IP addresses.

The following is a simplified flow:

  1. A function sends a request to example.com.
  2. The runtime calls libc getaddrinfo to resolve the DNS name.
  3. You intercept this call, log the DNS name, and forward the call to the original libc getaddrinfo.
  4. The original libc getaddrinfo returns resolved IP addresses. You log them and return to the runtime.
  5. The runtime calls libc connect method to create a new connection.
  6. You intercept this call, log the IP address, forward the call to the original libc connect, and so on.

To implement this technique, you need to use a language that compiles to a shared object (.so) file. To implement libc method signatures you should use a language such as C, C++, or Rust. The following sample code uses Rust for its strong safety guarantees and implements overriding the getaddrinfo libc function (DNS lookup).

pub extern "C" fn getaddrinfo(
    node: *const c_char,
    service: *const c_char,
    hints: *const addrinfo,
    res: *mut *mut addrinfo,
) -> c_int {
    let printable_node = format!("{}", PrintableCString::from(node));
    let printable_service = format!("{}", PrintableCString::from(service));

    log::debug!("> getaddrinfo node={printable_node} service={printable_service}");

    LIBC_GETADDRINFO(node, service, hints, res)
}

The following should be considered:

  • The method signature fully matches the libc function signature of the same name.
  • The node and service arguments would commonly be DNS name and port.
  • At the end, the function invokes the real libc getaddrinfo and returns the result.

When compiled to an .so file, you must package it as a Lambda layer, attach the layer to your functions, and configure the execution environment to use it through the Linux dynamic linker capability called preloading. Set the LD_PRELOAD environment variable to point to your .so file to instruct the OS to preload it before it loads any other library, such as libc. You can configure this either as a function environment variable or through a wrapper script, as shown in the following figure.

#!/bin/sh
echo "running wrapper..."
args=("$@")
export LD_PRELOAD=/opt/liblambda_network_monitor.so
exec "${args[@]}"

This technique allows you to get detailed connection-level monitoring such as DNS lookups, resolved IP addresses, ports, protocols, and count bytes transferred. Depending on your requirements, it can be adapted to track further network-related information as needed.

The sample project provides the LambdaNetworkMonitor-LdPreload stack to show this technique, as shown in the following figure. For every invocation, the function prints intercepted libc functions, DNS names, and connection IP addresses.

Considerations

  • OS-level techniques necessitate strong understanding of Linux fundamentals and careful implementation. AWS recommends that you closely evaluate which methods to use and keep your solution minimally invasive.
  • LD_PRELOAD is an advanced low-level technique that allows you to override libc methods and OS behavior. Incorrectly implemented hooks could lead to undefined behavior and crashes. Make sure your code is robust to recursion and thread-safe. Test it thoroughly in a controlled environment before using it in production.
  • The LD_PRELOAD technique relies on dynamic linking. It works with dynamically linked runtimes such as Node.js, Python, and Java. It doesn’t work with runtimes that use static linking, such as Golang.
  • When using runtime-dependent functionality, consider using Lambda runtime update controls to make sure that runtimes are only updated when the next function update occurs.
  • Always install layers from trusted sources only. Use infrastructure as code (IaC) tools to attach and audit layer configurations, such as AWS Identity and Access Management (IAM) permissions.

Conclusion

Monitoring network traffic in Lambda functions is a common requirement for many organizations. In case you need to audit IP-level network logs, AWS recommends that you to attach your functions to a VPC and use Flow Logs. If you need per-function or per-invoke granularity, then you can augment it with techniques described in this post.

These techniques provide valuable insights for debugging, auditing, and monitoring, but they also necessitate a solid understanding of Linux fundamentals and careful implementation. They offer a practical solution for organizations that need Lambda network monitoring, allowing them to troubleshoot issues and maintain compliance.

To learn more about Serverless architectures and asynchronous Lambda invocation patterns, go to Serverless Land.

How Smartsheet reduced latency and optimized costs in their serverless architecture

Post Syndicated from Anton Aleksandrov original https://aws.amazon.com/blogs/architecture/how-smartsheet-reduced-latency-and-optimized-costs-in-their-serverless-architecture/

Cloud software as a service (SaaS) companies are often looking for ways to enhance their architectures for performance and cost-efficiency. Serverless technologies offload infrastructure management, allowing development teams to focus on innovation and delivering business value. As application architectures grow and face more demanding requirements, continued optimization helps maximize both the technical and financial advantages of the serverless approach.

In this post, we discuss Smartsheet’s journey optimizing its serverless architecture. We explore the solution, the stringent requirements Smartsheet faced, and how they’ve achieved an over 80% latency reduction. This technical journey offers valuable insights for organizations looking to enhance their serverless architectures with proven enterprise-grade optimization techniques.

Solution overview

Smartsheet is a leading cloud-based enterprise work management platform, enabling millions of users worldwide to plan, manage, track, automate, and report on work at scale. At the core of the platform lies an event-driven architecture that processes real-time user activity across various document types. Given the collaborative nature of the platform, multiple users can work on these documents concurrently. Every document interaction triggers a series of events that must be processed with minimal latency to maintain data consistency and provide immediate feedback. Processing delays can impact user experience and productivity, making consistently low latency a fundamental business requirement.

Smartsheet’s traffic pattern is spiky during business hours and mostly dormant during nights and weekends. Within peak periods, traffic can fluctuate as users collaborate in real time. To efficiently manage dynamic workloads, which can surge from hundreds to tens of thousands of events per second within minutes, Smartsheet implements a serverless event processing architecture using services such as Amazon Simple Queue Service (Amazon SQS) and AWS Lambda. This architecture uses the elasticity of serverless services and the ability to automatically scale dynamically based on the traffic volume. It makes sure Smartsheet can efficiently handle sudden traffic surges while automatically scaling down during off-peak hours, optimizing for both performance and cost-efficiency.

The following diagram illustrates the high-level architecture of the Smartsheet event processing pipeline.

high-level architecture of the Smartsheet event processing pipeline

Optimization opportunity

Smartsheet uses Lambda functions to serve both batch jobs and API requests. The primary runtime used for building those functions is Java. Lambda automatically scales the number of execution environments allocated to your function on demand to accommodate traffic volume. When Lambda receives an incoming request, it attempts to serve it with an existing execution environment first. If no execution environments are available, the service initializes a new one. During initialization, the Smartsheet’s function code commonly sends several requests to external dependencies, such as databases and REST APIs, which might take time to reply.

The following diagram illustrates how Lambda functions reach out to external dependencies during initialization.

Lambda functions reach out to external dependencies during initialization

These tasks introduced execution environment initialization latency, commonly referred to as a cold start. Although cold starts typically affect less than 1% of requests, Smartsheet had stringent low latency requirements for their architecture to further prioritize the best possible end-user experience.

“To reduce customer request latency while keeping costs low, our engineering team utilized Lambda provisioned concurrency with auto scaling and Graviton, which resulted in an 83% reduction in P95 latency while providing a high quality of service as we continue to scale our platform and its limits,” says Abhishek Gurunathan, Sr Director of Engineering at Smartsheet.

Addressing the cold start with provisioned concurrency

To reduce cold start latency, the Smartsheet team adopted provisioned concurrency in their architecture, a capability that allows developers to specify the number of execution environments that Lambda should keep warm to instantly handle invocations. The following diagram illustrates the difference. Without provisioned concurrency, execution environments are created on demand, which means some invocations (typically less than 1%) need to wait for the execution environment to be created and initialization code to be run. With provisioned concurrency, Lambda creates execution environments and runs initialization code preemptively, making sure invocations are served by warm execution environments.

invocations are served by warm execution environments

Provisioned concurrency includes a dynamic spillover mechanism, making your serverless architecture highly resilient to traffic spikes. When incoming traffic exceeds the preconfigured provisioned concurrency, additional requests are automatically served by on-demand concurrency rather than being throttled. This provides seamless scalability and maintains service availability even during traffic surges, while still providing the performance benefits of pre-warmed execution environments for the majority of requests.

The Smartsheet team configured provisioned concurrency to match their historical P95 concurrency needs. This resulted in immediate improvements—the number of cold starts dropped dramatically and P95 invocation latency dropped by 83%. As the team monitored system performance, they quickly identified another architecture optimization opportunity—the Lambda functions were heavily used during work hours but had significantly fewer invocations at night and on weekends, as illustrated in the following graph.

Lambda functions were heavily used during work hours but had significantly fewer invocations at night and on weekends

Setting a static provisioned concurrency configuration worked great for busy periods, but was underutilized during off-times. The Smartsheet team wanted to further fine-tune their architecture and increase provisioned concurrency utilization rates to achieve higher cost-efficiency. This led them to look into provisioned concurrency auto scaling to match traffic patterns as well as adopting an AWS Graviton architecture.

Auto scaling provisioned concurrency and Graviton architecture

Two common approaches to enable provisioned concurrency are setting a static value and using auto scaling. With static configuration, you specify a fixed number of pre-initialized execution environments that remain continuously warm to serve invocations. This approach is highly effective for architectures that handle predictable traffic patterns. Unpredictable traffic patterns, however, can lead to under-provisioning during peak periods (with spillover to on-demand concurrency resulting in more cold starts) or underutilization during low-usage periods. To address that, provisioned concurrency with auto scaling dynamically adjusts the configuration based on utilization metrics, automatically scaling the number of execution environments up or down to match the actual demand. This dynamic approach optimizes for cost-efficiency and is particularly recommended for architectures with fluctuating traffic patterns.

The following figure compares static and dynamic provisioned concurrency.

static and dynamic provisioned concurrency

To further optimize the architecture for cost-efficiency, the Smartsheet team has implemented provisioned concurrency auto scaling based on utilization metrics. Smartsheet used an infrastructure as code (IaC) approach with Terraform to define auto scaling policies for maximum reusability across hundreds of functions. The policies track the LambdaProvisionedConcurrencyUtilization metric and define the scaling threshold according to the function purpose. For functions implementing interactive APIs, the auto scale threshold is 60% utilization to pre-provision execution environments early, keeping latency extra-low, and making functions more resilient towards traffic surges. For functions that implement asynchronous data processing, Smartsheet’s goal was to achieve the highest utilization rate and cost-efficiency, so they’ve defined the auto scale threshold at 90%.

The following diagram illustrates the architecture of auto scaling policies based on provisioned concurrency utilization rate and workload type.auto scaling policies based on provisioned concurrency utilization rate and workload type

Another optimization technique Smartsheet employed was switching the CPU architecture used by their Lambda functions from x86_64 to arm64 Graviton. To achieve this, Smartsheet adopted the ARM versions of Lambda layers they’ve used, such as Datadog and Lambda Insights extensions. This was required because binaries built using one architecture might be incompatible with a different one. Because Smartsheet functions were implemented with Java and packaged as JAR files, they didn’t have any compatibility issues when moving to Graviton. With Terraform used for codifying the infrastructure, this architecture switch was a simple property change in aws_lambda_function resources, as illustrated in the following code:

property change in aws_lambda_function resources

By switching to a Graviton architecture, Smartsheet saved 20% on function GB-second costs. See AWS Lambda pricing for details.

Best practices

Use the following techniques and best practices to optimize your serverless architectures, reduce cold starts, and increase cost-efficiency:

  • Fine-tune your Lambda functions to find the optimal balance between cost and performance. Increasing memory allocation also adds CPU capacity, which often means faster execution and can lead to reduced overall costs.
  • Use a Graviton2 architecture for compatible workloads to benefit from a better price-performance ratio. Depending on the workload type, switching to Graviton can yield up to 34% improvement.
  • Use provisioned concurrency and Lambda SnapStart to reduce cold starts in your serverless architectures. Start with static provisioned concurrency based on your historical concurrency requirements, monitor utilization, and introduce auto scaling into your architecture to achieve the optimal cost-performance profile.

Conclusion

Serverless architectures using services like Lambda and Amazon SQS offload the infrastructure management and scaling concerns to AWS, allowing teams to focus on innovation and delivering business value. As Smartsheet’s journey demonstrates, using provisioned concurrency and Graviton in your architectures can help significantly improve user experience by reducing latencies while also achieving better cost-efficiency, providing a practical blueprint for optimization across the organization. Whether you’re running large-scale enterprise applications or building new cloud solutions, these proven techniques can help you unlock similar performance gains and cost-efficiencies in your serverless architectures.

To learn more about serverless architectures, see Serverless Land.


About the authors


How CyberArk is streamlining serverless governance by codifying architectural blueprints

Post Syndicated from Anton Aleksandrov original https://aws.amazon.com/blogs/architecture/how-cyberark-is-streamlining-serverless-governance-by-codifying-architectural-blueprints/

This post was co-written with Ran Isenberg, Principal Software Architect at CyberArk and an AWS Serverless Hero.

Serverless architectures enable agility and simplified cloud resource management. Organizations embracing serverless architectures build robust, distributed cloud applications. As organizations grow and the number of development teams increases, maintaining architectural consistency, standardization, and governance across projects becomes crucial.

In this post, you will discover how CyberArk, a leading identity security company, efficiently implements serverless architecture governance, reduces duplicative efforts, and saves months of development time by codifying architectural blueprints. This approach helps to prevent redundant efforts and promotes uniform architectural standards, facilitating the seamless adoption of organizational best practices and governance across diverse teams.

Overview

The risk of duplicative efforts and architectural inconsistencies is particularly pronounced in large organizations, especially for requirements unrelated to specific business domains owned by individual teams. Diverse approaches to Infrastructure-as-Code, CI/CD, observability, and security can lead to inconsistent implementations across teams. Application developers should focus on delivering business value efficiently, rather than navigating the complexities of building and operating distributed architectures while adhering to organizational best practices. To achieve this, you need an approach that empowers developers and provides guardrails to ensure vetted architectural patterns are consistently applied. This solution should enable accelerated delivery without sacrificing agility and innovation.

Some organizations implement internal wiki consolidating architectural guidance. While well-intentioned, relying solely on documentation assumes development teams diligently follow the guidelines, which often requires manual validation and limits scalability. To overcome this limitation, organizations should adopt a scalable approach that codifies, automates, and promotes architectural best practices. This mechanism allows developers to focus on delivering business-domain value and drives standardized operational excellence, governance, and organizational policies adherence.

Introducing serverless blueprints

CyberArk engineering team had over 900 developers. It was looking for ways to ensure they build their serverless services based on vetted architectural and security best practices with fully automated governance controls enforcement. The solution came in the form of codified architecture blueprints and automated tooling.

Serverless architectures are composed using loosely coupled services, integrated based on the application requirements. Application developers use IaC tools such as AWS CDK and HashiCorp Terraform to define their serverless architectures and integration patterns. CyberArk has augmented the IaC with governance tools, such as cdk-nag, AWS Config, and AWS Control Tower. With these complementary tools in place, they’ve built serverless blueprints which include architectural definitions based on organizational best practices, as well as automatically applied governance controls

To illustrate this, consider a simple serverless architecture pattern. In this common pattern, an SQS queue serves as the event source for a Lambda function, which parses incoming messages and updates an Amazon S3 bucket.

A simple serverless architecture with SQS Queue, Lambda function, and S3 Bucket

Figure 1. A simple serverless architecture with SQS Queue, Lambda function, and S3 Bucket

While this pattern seems simple, turning it into an enterprise-ready service requires additional effort. You must consider aspects like resiliency, security, governance, observability, and coding best practices. Let’s examine several examples codified in architectural blueprints at CyberArk.

Error-handling best practices

Your services should be resilient. Retries can help to overcome occasional network hiccups, but you also need to handle scenarios when your function consistently fails to process particular messages (known as poison message) – for example, because of a code bug. This can lead to endless processing loops, data loss, and potential extra charges. To address this, a blueprint can implement a failure handling mechanism with a dead letter queue, alerting, and redrive. This pattern is straightforward to implement and adds extra resiliency to your architecture. It is also generic and does not contain any business domain code. This is a typical example of an architectural pattern that can be codified in a blueprint and reused across development teams.

The simple serverless architecture with added resiliency best practices

Figure 2. The simple serverless architecture with added resiliency best practices

Security best practices

Another example is securing S3 buckets. Organizations must enforce S3 security best practices, such as enabling access logs, blocking public access, and enabling encryption at rest. Codifying these guardrails in architectural blueprints adds an extra layer that allows your developers to comply with organization standards without having to explicitly implement adherence to each best practice and policy on their own.

The simple serverless architecture with added security best practices

Figure 3. The simple serverless architecture with added security best practices

The following code snippet uses AWS CDK to create an S3 bucket with common best practices:

def _create_bucket(self, server_access_logs_bucket: s3.Bucket, is_production_env: bool) -> s3.Bucket:
    # Create an S3 bucket with AWS-managed keys encryption
    bucket = s3.Bucket(
        self,
        constants.BUCKET_NAME,
        versioned=True if is_production_env else False,
        encryption=s3.BucketEncryption.S3_MANAGED,
        block_public_access=s3.BlockPublicAccess.BLOCK_ALL,
        enforce_ssl=True,
        server_access_logs_bucket=server_access_logs_bucket, 
        # redacted
    )

Additional security best practices you can codify in your blueprints include the principle of least privilege access, VPC-attachment, and code signing for sensitive Lambda functions, and using KMS keys for encryption.

Lambda best practices

Your Lambda functions are another example of where blueprints can help. By providing a function blueprint implementing the baseline for capabilities like observability, idempotency, and batch processing out-of-the-box, you enable developers to focus on their business domain code.

Layered view of a Lambda function in CyberArk’s serverless architecture blueprint

Figure 4. Layered view of a Lambda function in CyberArk’s serverless architecture blueprint

CyberArk embeds Powertools for AWS Lambda, a toolkit that implements serverless best practices to increase developer velocity, into their blueprints. The following code snippets embed Powertools for enabling enhanced observability and implementing batch processing.

# CDK code
lambda_function = lambda.Function(
    environment={
        constants.POWERTOOLS_SERVICE_NAME: constants.SERVICE_NAME,
        constants.POWER_TOOLS_LOG_LEVEL: 'INFO',  
    },
    tracing=lambda.Tracing.ACTIVE,
    layers=["powertools-layer"],
    log_format=lambda.LogFormat.JSON.value,
    system_log_level=lambda.SystemLogLevel.INFO.value
    # redacted
)

# Function handler code
processor = BatchProcessor(event_type=EventType.SQS, model=OrderSqsRecord)

@logger.inject_lambda_context
@metrics.log_metrics
@tracer.capture_lambda_handler(capture_response=False)
def lambda_handler(event, context: LambdaContext):
    return process_partial_response(
        event=event,
        record_handler=record_handler,
        processor=processor,
        context=context,
)

Governance controls

Blueprints are not static; they evolve as you adopt new best practices and governance policies. Developers start with a vetted blueprint but can deviate as they evolve their serverless apps. To enable continuous adherence, it is important to use a combination of organizational governance tools, such as AWS Control Tower and Service Control Policies, and architecture blueprints that embed governance controls automatically enforced by CI/CD. This ensures that any architectural modification will be validated for adhering to organizational standards.

AWS defines proactive controls as mechanisms that prevent developers from deploying resources that violate governance policies. Detective controls are mechanisms that detect, log, and alert on resource or configuration changes that violate governance policies.

Applying governance controls at all stages of CI/CD

Figure 5. Applying governance controls at all stages of CI/CD

Depending on the IaC tool, you can leverage different types of governance tools for proactive control enforcement. The following screenshot shows a proactive control violation identified during CI/CD via the cdk-nag framework. You can see cdk-nag throwing an error for the stack deployment due to Lambda execution role being assigned wild-card permissions.

Exception thrown by cdk-nag for using wildcard permissions

Figure 6. Exception thrown by cdk-nag for using wildcard permissions

See the practical guide for implementing serverless governance.

Sample code

Ran Isenberg has open-sourced a sample Lambda Handler Cookbook blueprint illustrating some of the patterns CyberArk has adopted.

Additional serverless architecture patterns you might consider implementing in your blueprints are server-side encryption for an Amazon SNS topic with an encrypted Amazon SQS queue subscribed, auto-adjusting provisioned concurrency for Lambda functions, secure Serverless Aurora Cluster with bastion host, and more.

See more patterns implemented at serverlessland.com and cdkpatterns.com

Conclusion

Translating architectural and security best practices into modular IaC definitions, such as CDK constructs or Terraform modules, is a scalable and reusable technique that allows CyberArk to reduce duplicative efforts and save months of development time. Using IaC tools like AWS CDK or Terraform, augmented with governance tools like cdk-nag or checkov, enabled CyberArk to share implementation best practices and encode governance policies into architectural blueprints. Development teams adopting these blueprints do not need to reinvent the wheel, each trying to solve the same problem on their own. Instead, they leverage the knowledge codified in the blueprint.

Further reading