All posts by Grab Tech

Our Journey to Continuous Delivery at Grab (Part 1)

Post Syndicated from Grab Tech original https://engineering.grab.com/our-journey-to-continuous-delivery-at-grab

This blog post is a two-part presentation of the effort that went into improving the continuous delivery processes for backend services at Grab in the past two years. In the first part, we take stock of where we started two years ago and describe the software and tools we created while introducing some of the integrations we’ve done to automate our software delivery in our staging environment.


Continuous Delivery is the principle of delivering software often, every day.

As a backend engineer at Grab, nothing matters more than the ability to innovate quickly and safely. Around the end of 2018, Grab’s transportation and deliveries backend architecture consisted of roughly 270 services (the majority being microservices). The deployment process was lengthy, required careful inputs and clear communication. The care needed to push changes in production and the risk associated with manual operations led to the introduction of a Slack bot to coordinate deployments. The bot ensures that deployments occur only during off-peak and within work hours:

Overview of the Grab Delivery Process

Once the build was completed, engineers who desired to deploy their software to the Staging environment would copy release versions from the build logs, and paste them in a Jenkins job’s parameter. Tests needed to be manually triggered from another dedicated Jenkins job.

Prior to production deployments, engineers would generate their release notes via a script and update them manually in a wiki document. Deployments would be scheduled through interactions with a Slack bot that controls release notes and deployment windows. Production deployments were made once again by pasting the correct parameters into two dedicated Jenkins jobs, one for the canary (a.k.a. one-box) deployment and the other for the full deployment, spread one hour apart. During the monitoring phase, engineers would continuously observe metrics reported on our dashboards.

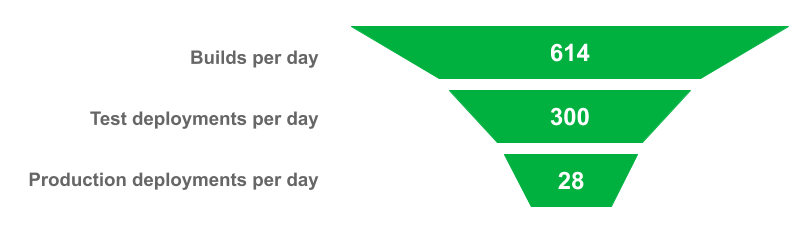
In spite of the fragmented process and risky manual operations impacting our velocity and stability, around 614 builds were running each business day and changes were deployed on our staging environment at an average rate of 300 new code releases per business day, while production changes averaged a rate of 28 new code releases per business day.

Our Deployment Funnel, Towards the End of 2018

These figures meant that, on average, it took 10 business days between each service update in production, and only 10% of the staging deployments were eventually promoted to production.

Automating Continuous Deployments at Grab

With an increased focus on Engineering efficiency, in 2018 we started an internal initiative to address frictions in deployments that became known as Conveyor. To build Conveyor with a small team of engineers, we had to rely on an already mature platform which exhibited properties that are desirable to us to achieve our mission.

Hands-off deployments

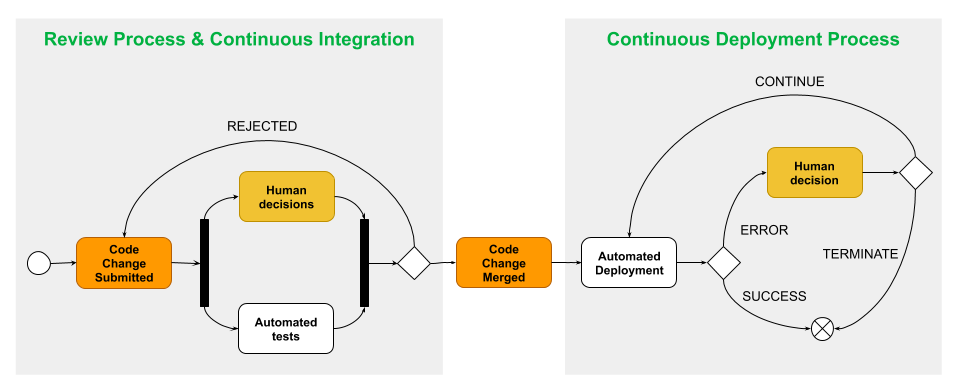
Deployments should be an afterthought. Engineers should be as removed from the process as possible, and whenever possible, decisions should be taken early, during the code review process. The machine will do the heavy lifting, and only when it can’t decide for itself, should the engineer be involved. Notifications can be leveraged to ensure that engineers are only informed when something goes wrong and a human decision is required.

Hands-off Deployment Principle

Confidence in Deployments

Grab’s focus on gathering internal Engineering NPS feedback helped us collect valuable metrics. One of the metrics we cared about was our engineers’ confidence in their production deployments. A team’s entire deployment process to production could last for more than a day and may extend up to a week for teams with large infrastructures running critical services. The possibility of losing progress in deployments when individual steps may last for hours is detrimental to the improvement of Engineering efficiency in the organisation. The deployment automation platform is the bedrock of that confidence. If the platform itself fails regularly or does provide a path of upgrade that is transparent to end-users, any features built on top of it would suffer from these downtimes and ultimately erode confidence in deployments.

Tailored To Most But Extensible For The Few

Our backend engineering teams are working on diverse stacks, and so are their deployment processes. Right from the start, we wanted our product to benefit the largest population of engineers that had adopted the same process, so as to maximize returns on our investments. To ease adoption, we decided to tailor a deployment pipeline such that:

  1. It would model the exact sequence of manual processes followed by this population of engineers.
  2. Switching to use that pipeline should require as little work as possible by service teams.

However, in cases where this model would not fit a team’s specific process, our deployment platform should be open and extensible and support new customizations even when they are not originally supported by the product’s ecosystem.

Cloud-Agnosticity

While we were going to target a specific process and team, to ensure that our solution would stand the test of time, we needed to ensure that our solution would support the variety of environments currently used in production. This variety was also likely to increase, and we wanted a platform that would mature together with the rest of our ecosystem.

Overview Of Conveyor

Setting Sail With Spinnaker

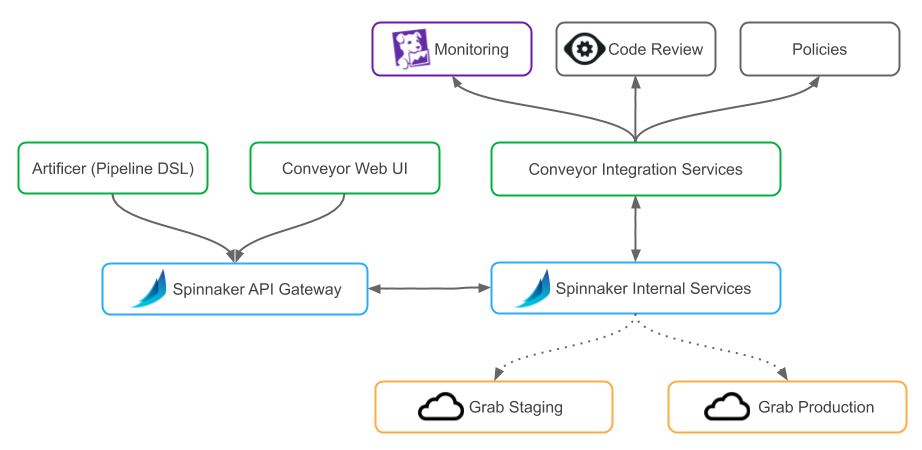
Conveyor is based on Spinnaker, an open-source, multi-cloud continuous delivery platform. We’ve chosen Spinnaker over other platforms because it is a mature deployment platform with no single point of failure, supports complex workflows (referred to as pipelines in Spinnaker), and already supports a large array of cloud providers. Since Spinnaker is open-source and extensible, it allowed us to add the features we needed for the specificity of our ecosystem.

To further ease adoption within our organization, we built a tailored  user interface and created our own domain-specific language (DSL) to manage its pipelines as code.

Outline of Conveyor's Architecture
Outline of Conveyor’s Architecture

Onboarding To A Simpler Interface

Spinnaker comes with its own interface, it has all the features an engineer would want from an advanced continuous delivery system. However, Spinnaker interface is vastly different from Jenkins and makes for a steep learning curve.

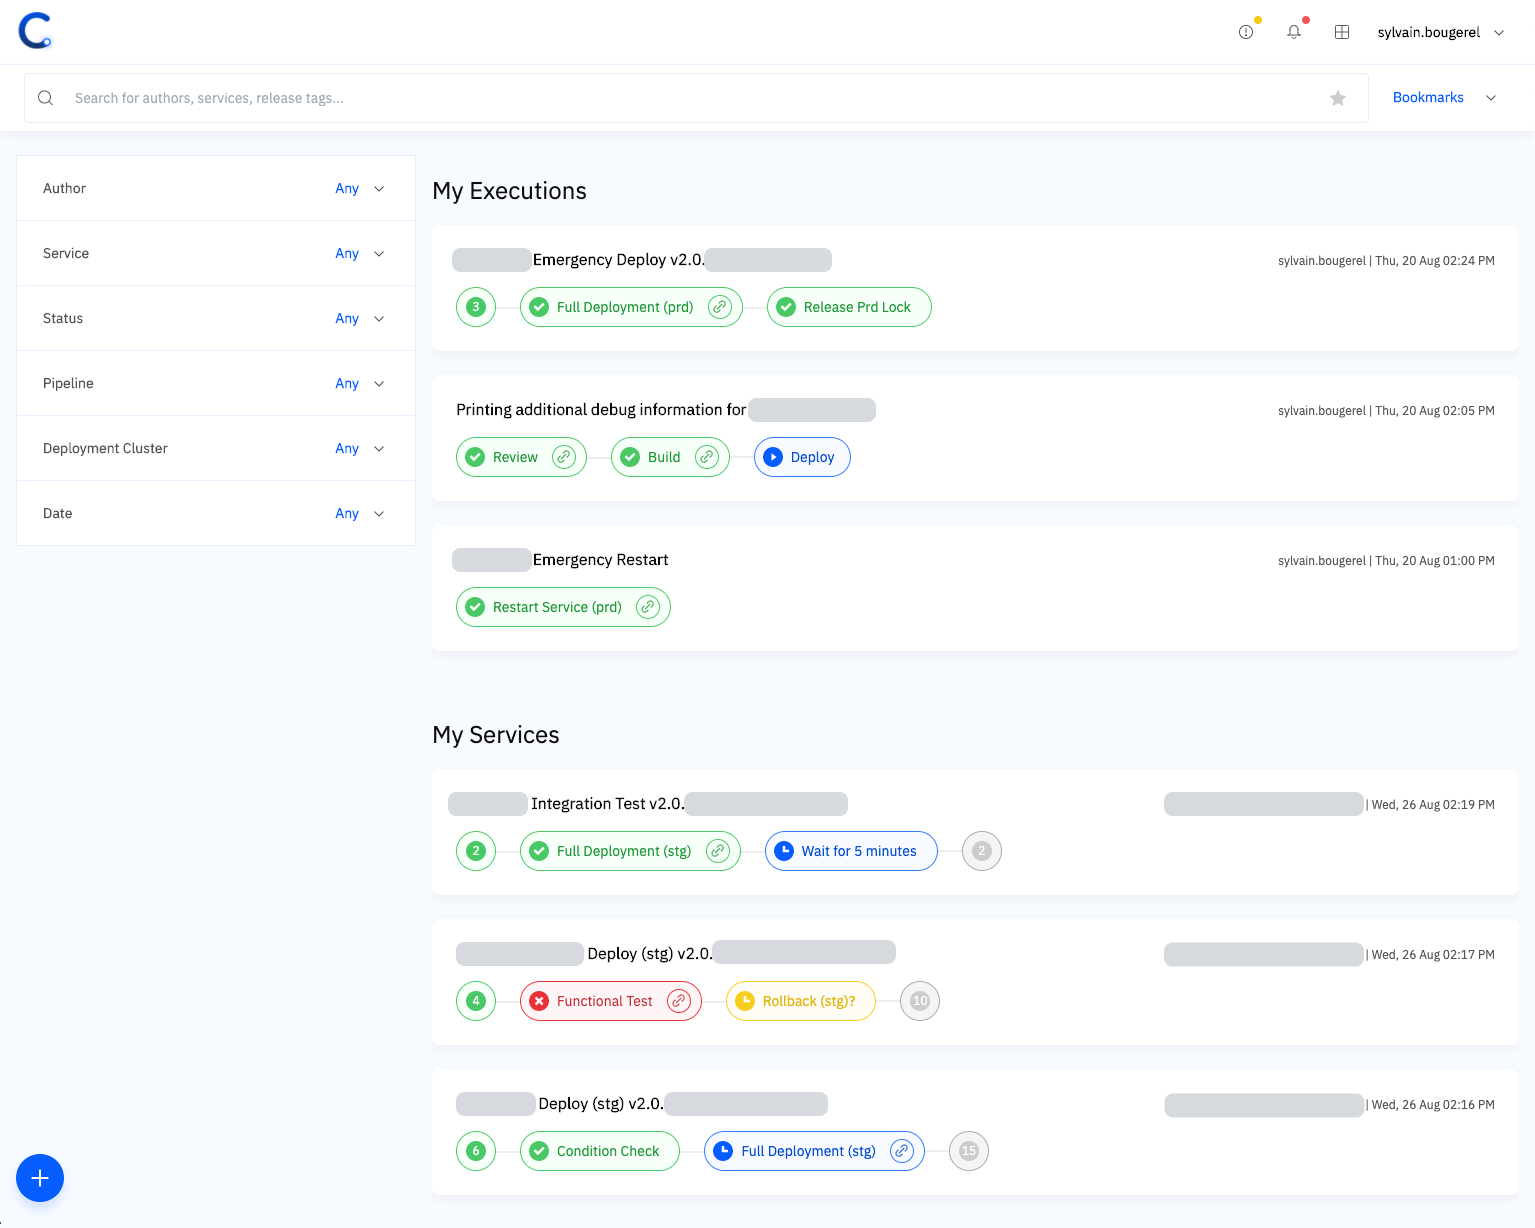
To reduce our barrier to adoption, we decided early on to create a simple interface for our users. In this interface, deployment pipelines take the center stage of our application. Pipelines are objects managed by Spinnaker, they model the different steps in the workflow of each deployment. Each pipeline is made up of stages that can be assembled like lego-bricks to form the final pipeline. An instance of a pipeline is called an execution.

Conveyor dashboard. Sensitive information like authors and service names are redacted.
Conveyor Dashboard

With this interface, each engineer can focus on what matters to them immediately: the pipeline they have started, or those started by other teammates working on the same services as they are. Conveyor also provides a search bar (on the top) and filters (on the left) that work in concert to explore all pipelines executed at Grab.

We adopted a consistent set of colours to model all information in our interface:

  • blue: represent stages that are currently running;
  • red: stages that have failed or important information;
  • yellow: stages that require human interaction;
  • and finally, in green: stages that were successfully completed.

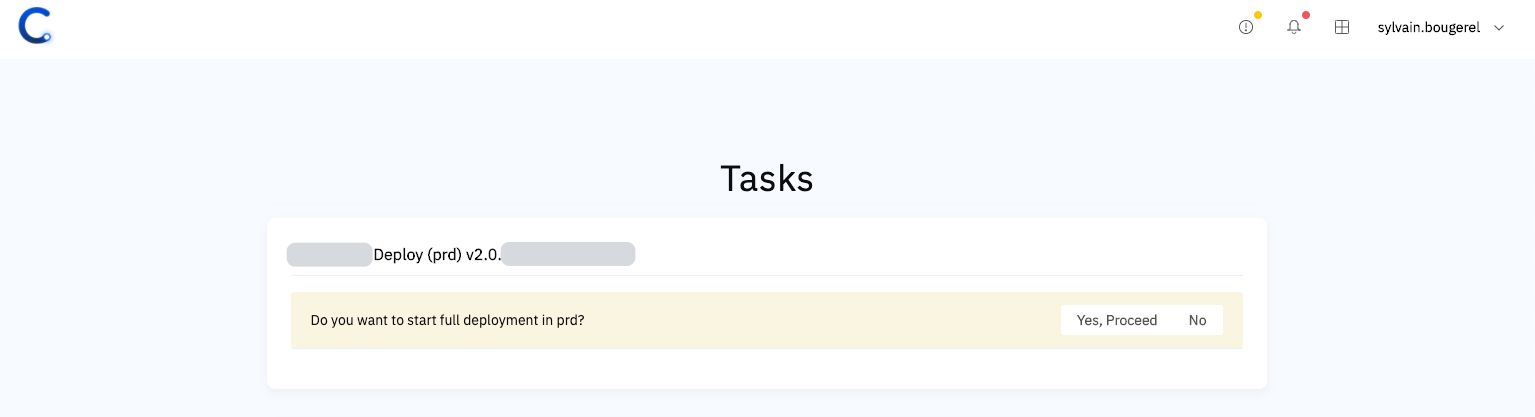
Conveyor also provides a task and notifications area, where all stages requiring human intervention are listed in one location. Manual interactions are often no more than just YES or NO questions:

Conveyor tasks. Sensitive information like author/service names is redacted.
Conveyor Tasks

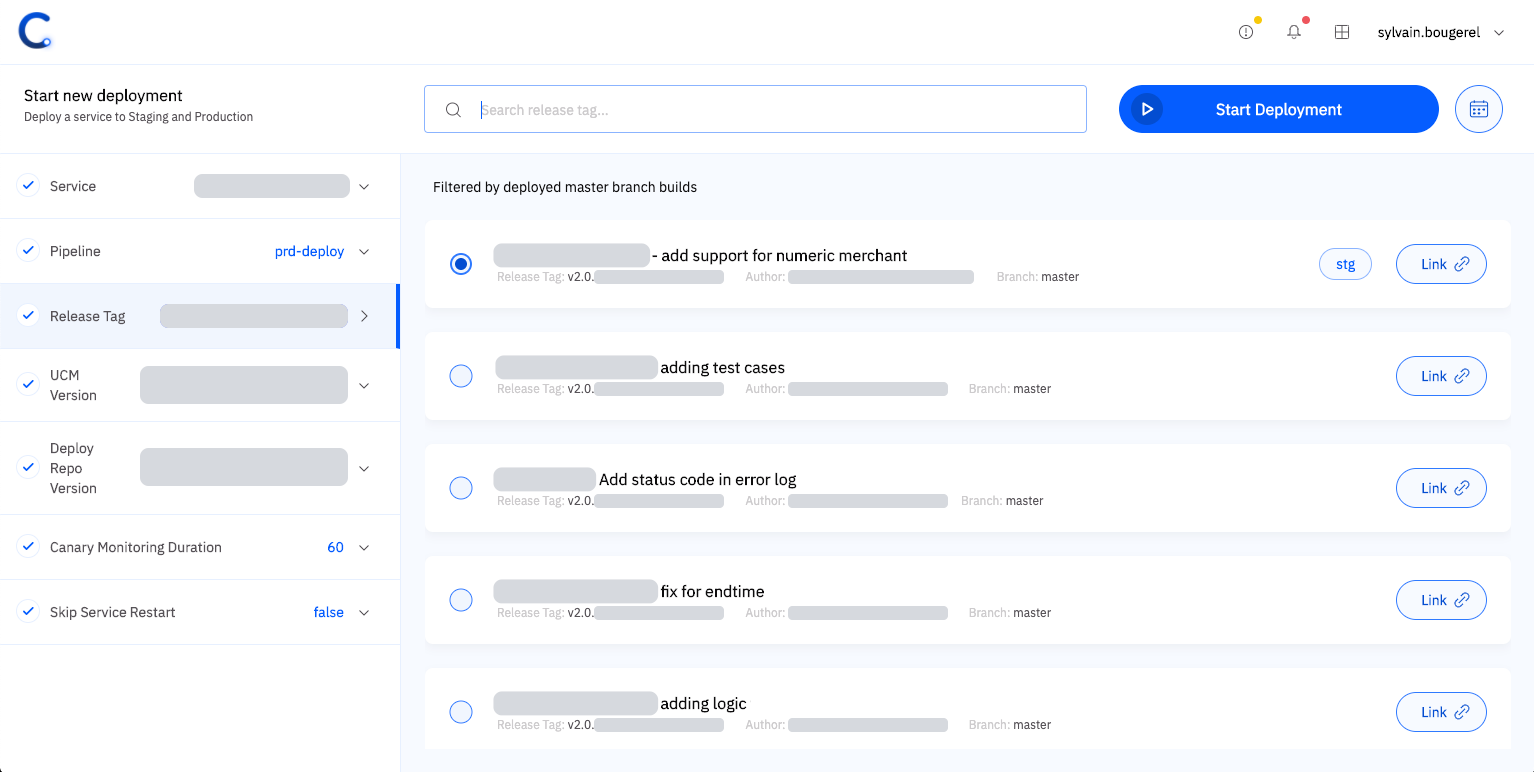
Finally, in addition to supporting automated deployments, we greatly simplified the start of manual deployments. Instead of being required to copy/paste information, each parameter can be selected on the interface from a set of predefined items, sorted chronologically, and presented with contextual information to help engineers in their decision.

Several parameters are required for our deployments and their values are selected from the UI to ensure correctness.

Simplified manual deployments
Simplified Manual Deployments

Ease Of Adoption With Our Pipeline-As-Code DSL

Ease of adoption for the team is not simply about the learning curve of the new tools. We needed to make it easy for teams to configure their services to deploy with Conveyor. Since we focused on automating tasks that were already performed manually, we needed only to configure the layer that would enable the integration.

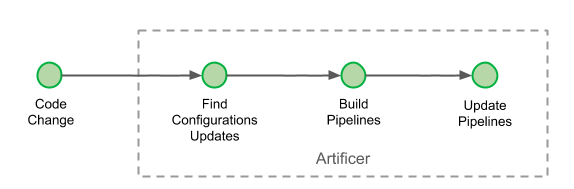
We set on creating a pipeline-as-code implementation when none were widely being developed in the Spinnaker community. It’s interesting to see that two years on, this idea has grown in parallel in the community, with the birth of other pipeline-as-code implementations. Our pipeline-as-code is referred to as the Pipeline DSL, and its configuration is located inside each team’s repository. Artificer is the name of our Pipeline DSL interpreter and it runs with every change inside our monorepository:

Artificer: Our Pipeline DSL

Pipelines are being updated at every commit if necessary.

Creating a conveyor.jsonnet file inside with the service’s directory of our monorepository with the few lines below is all that’s required for Artificer to do its work and get the benefits of automation provided by Conveyor’s pipeline:

local default = import 'default.libsonnet';
[
 {
 name: "service-name",
 group: [
 "group-name",
 ]
 }
]

Sample minimal conveyor.jsonnet configuration to onboard services.

In this file, engineers simply specify the name of their service and the group that a user should belong to, to have deployment rights for the service.

Once the build is completed, teams can log in to Conveyor and start manual deployments of their services with our pipelines. Three pipelines are provided by default: the integration pipeline used for tests and developments, the staging pipeline used for pre-production tests, and the production pipeline for production deployment.

Thanks to the simplicity of this minimal configuration file, we were able to generate these configuration files for all existing services of our monorepository. This resulted in the automatic onboarding of a large number of teams and was a major contributing factor to the adoption of Conveyor throughout our organisation.

Our Journey To Engineering Efficiency (for backend services)

The sections below relate some of the improvements in engineering efficiency we’ve delivered since Conveyor’s inception. They were not made precisely in this order but for readability, they have been mapped to each step of the software development lifecycle.

Automate Deployments at Build Time

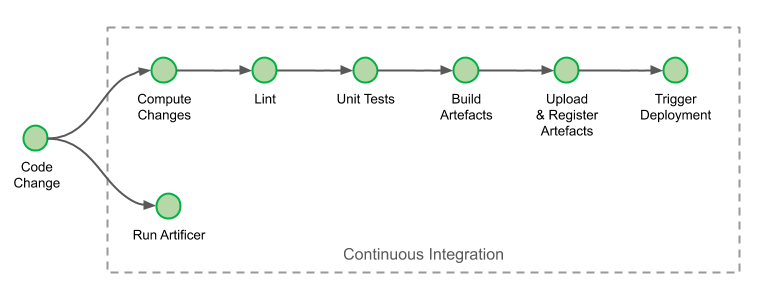
Continuous Integration Job

Continuous delivery begins with a pushed code commit in our trunk-based development flow. Whenever a developer pushes changes onto their development branch or onto the trunk, a continuous integration job is triggered on Jenkins. The products of this job (binaries, docker images, etc) are all uploaded into our artefact repositories. We’ve made two additions to our continuous integration process.

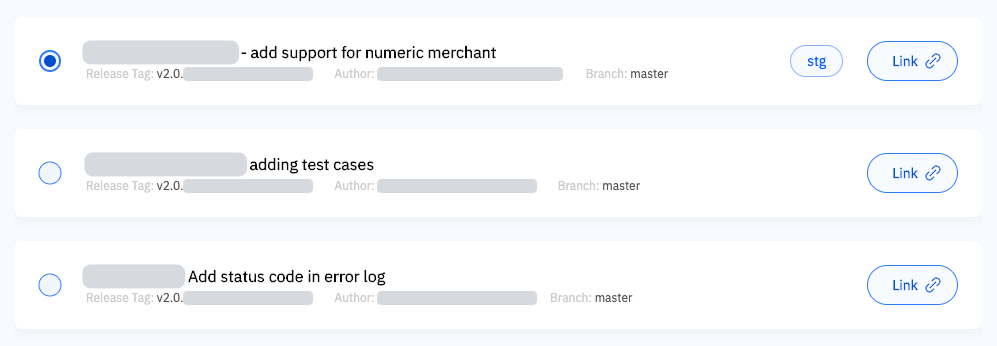
The first modification happens at the step “Upload & Register artefacts”. At this step, each artefact created is now registered in Conveyor with its associated metadata. When and if an engineer needs to trigger a deployment manually, Conveyor can display the list of versions to choose from, eliminating the need for error-prone manual inputs:

 Staging
Staging

Each selectable version shows contextual information: title, author, version and link to the code change where it originated. During registration, the commit time is also recorded and used to order entries chronologically in the interface. To ensure this integration is not a single point of failure for deployments, manual input is still available optionally.

The second modification implements one of the essential feature continuous delivery: your deployments should happen often, automatically. Engineers are now given the possibility to start automatic deployments once continuous integration has successfully completed, by simply modifying their project’s continuous integration settings:

 "AfterBuild": [
  {
      "AutoDeploy": {
      "OnDiff": false,
      "OnLand": true
    }
    "TYPE": "conveyor"
  }
 ],

Sample settings needed to trigger auto-deployments. ‘Diff’ refers to code review submissions, and ‘Land’ refers to merged code changes.

Staging Pipeline

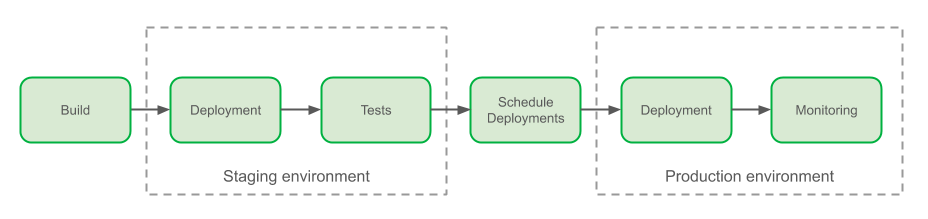
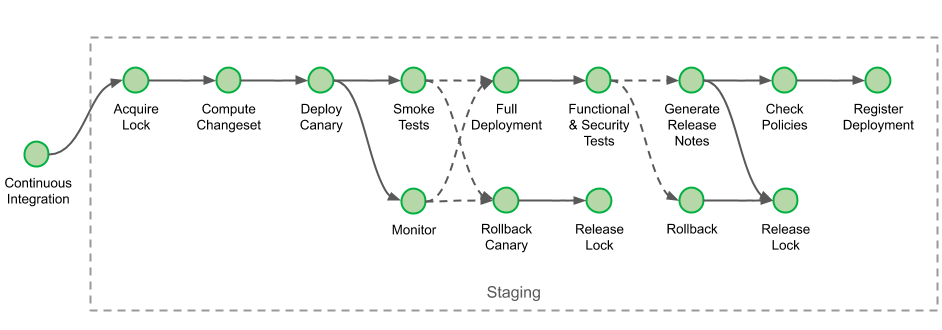
Before deploying a new artefact to a service in production, changes are validated on the staging environment. During the staging deployment, we verify that canary (one-box) deployments and full deployments with automated smoke and functional tests suites.

Staging Pipeline
Staging Pipeline

We start by acquiring a deployment lock for this service and this environment. This prevents another deployment of the same service on the same environment to happen concurrently, other deployments will be waiting in a FIFO queue until the lock is released.

The stage “Compute Changeset” ensures that the deployment is not a rollback. It verifies that the new version deployed does not correspond to a rollback by comparing the ancestry of the commits provided during the artefact registration at build time: since we automate deployments after the build process has completed, cases of rollback may occur when two changes are created in quick succession and the latest build completes earlier than the older one.

After the stage “Deploy Canary” has completed, smoke test run. There are three kinds of tests executed at different stages of the pipeline: smoke, functional and security tests. Smoke tests directly reach the canary instance’s endpoint, by-passing load-balancers. If the smoke tests fail,  the canary is immediately rolled back and this deployment is terminated.

All tests are generated from the same builds as the artefact being tested and their versions must match during testing. To ensure that the right version of the test run and distinguish between the different kind of tests to perform, we provide additional metadata that will be passed by Conveyor to the tests system, known internally as Gandalf:

local default = import 'default.libsonnet';
[
  {
    name: "service-name",
    group: [
    "group-name",
    ],
    gandalf_smoke_tests: [
    {
        path: "repo.internal/path/to/my/smoke/tests"
      }
      ],
      gandalf_functional_tests: [
      {
        path: "repo.internal/path/to/my/functional/tests"
      }
      gandalf_security_tests: [
      {
        path: "repo.internal/path/to/my/security/tests"
      }
      ]
    }
]

Sample conveyor.jsonnet configuration with integration tests added.

Additionally, in parallel to the execution of the smoke tests, the canary is also being monitored from the moment its deployment has completed and for a predetermined duration. We leverage our integration with Datadog to allow engineers to select the alerts to monitor. If an alert is triggered during the monitoring period, and while the tests are executed, the canary is again rolled back, and the pipeline is terminated. Engineers can specify the alerts by adding them to the conveyor.jsonnet configuration file together with the monitoring duration:

local default = import 'default.libsonnet';
[
 {
   name: "service-name",
   group: [
   "group-name",
   ],
    gandalf_smoke_tests: [
    {
      path: "repo.internal/path/to/my/smoke/tests"
   }
   ],
   gandalf_functional_tests: [
   {
   path: "repo.internal/path/to/my/functional/tests"
  }
     gandalf_security_tests: [
     {
     path: "repo.internal/path/to/my/security/tests"
     }
     ],
     monitor: {
     stg: {
     duration_seconds: 300,
     alarms: [
     {
   type: "datadog",
   alert_id: 12345678
   },
   {
   type: "datadog",
   alert_id: 23456789
      }
      ]
      }
    }
  }
]

Sample conveyor.jsonnet configuration with alerts in staging added.

When the smoke tests and monitor pass and the deployment of new artefacts is completed, the pipeline execution triggers functional and security tests. Unlike smoke tests, functional & security tests run only after that step, as they communicate with the cluster through load-balancers, impersonating other services.

Before releasing the lock, release notes are generated to inform engineers of the delta of changes between the version they just released and the one currently running in production. Once the lock is released, the stage “Check Policies” verifies that the parameters and variable of the deployment obeys a specific set of criteria, for example: if its service metadata is up-to-date in our service inventory, or if the base image used during deployment is sufficiently recent.

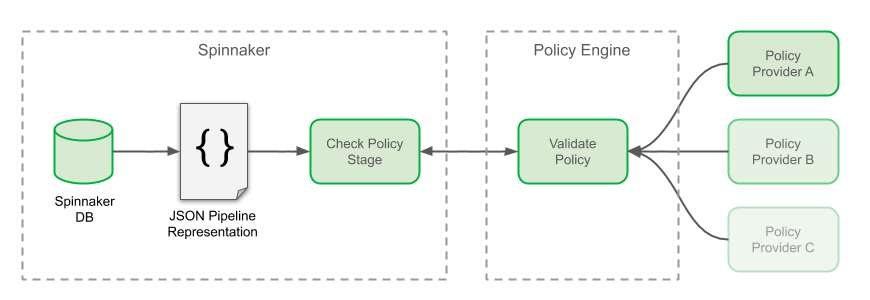
Here’s how the policy stage, the engine, and the providers interact with each other:

Check Policy Stage
Check Policy Stage

In Spinnaker, each event of a pipeline’s execution updates the pipeline’s state in the database. The current state of the pipeline can be fetched by its API as a single JSON document, describing all information related to its execution: including its parameters, the contextual information related to each stage or even the response from the various interfacing components. The role of our “Policy Check” stage is to query this JSON representation of the pipeline, to extract and transform the variables which are forwarded to our policy engine for validation. Our policy engine gathers judgements passed by different policy providers. If the validation by the policy engine fails, the deployment is not rolled back this time; however, promotion to production is not possible and the pipeline is immediately terminated.

The journey through staging deployment finally ends with the stage “Register Deployment”. This stage registers that a successful deployment was made in our staging environment as an artefact. Similarly to the policy check above, certain parameters of the deployment are picked up and consolidated into this document. We use this kind of artefact as proof for upcoming production deployment.

Continuing Our Journey to Engineering Efficiency

With the advancements made in continuous integration and deployment to staging, Conveyor has reduced the efforts needed by our engineers to just three clicks in its interface, when automated deployment is used. Even when the deployment is triggered manually, Conveyor gives the assurance that the parameters selected are valid and it does away with copy/pasting and human interactions across heterogeneous tools.

In the sequel to this blog post, we’ll dive into the improvements that we’ve made to our production deployments and introduce a crucial concept that led to the creation of our proof for successful staging deployment. Finally, we’ll cover the impact that Conveyor had on the continuous delivery of our backend services, by comparing our deployment velocity when we started two years ago versus where we are today.


All these improvements in efficiency for our engineers would never have been possible without the hard work of all team members involved in the project, past and present: Evan Sebastian, Tanun Chalermsinsuwan, Aufar Gilbran, Deepak Ramakrishnaiah, Repon Kumar Roy (Kowshik), Su Han, Voislav Dimitrijevikj, Qijia Wang, Oscar Ng, Jacob Sunny, Subhodip Mandal, and many others who have contributed and collaborated with them.


Join us

Grab is more than just the leading ride-hailing and mobile payments platform in Southeast Asia. We use data and technology to improve everything from transportation to payments and financial services across a region of more than 620 million people. We aspire to unlock the true potential of Southeast Asia and look for like-minded individuals to join us on this ride.

If you share our vision of driving South East Asia forward, apply to join our team today.
Uncovering the truth behind Lua and Redis data consistency

Post Syndicated from Grab Tech original https://engineering.grab.com/uncovering-the-truth-behind-lua-and-redis-data-consistency

Uncovering the truth behind Lua and Redis data consistency

Our team at Grab uses Redis as one of our message queues. The Redis server is deployed in a master/replica setup. Quite recently, we have been noticing a spike in the CPU usage of the Redis replicas every time we deploy our service, even when the replicas are not in use and when there’s no read traffic to it. However, the issue is resolved once we reboot the replica.

Because a reboot of the replica fixes the issue every time, we thought that it might be due to some Elasticache replication issues and didn’t pursue further. However, a recent Redis failover brought this to our attention again. After the failover, the problematic replica becomes the new master and its CPU immediately goes to 100% with the read traffic, which essentially means the cluster is not functional after the failover. And this time we investigated the issue with new vigour. What we found in our investigation led us to deep dive into the details of Redis replication and its implementation of Hash.

Did you know that Redis master/replica can become inconsistent in certain scenarios?

Did you know the encoding of Hash objects on the master and the replica are different even if the writing operations are exactly the same and in the same order? Read on to find out why.

The problem

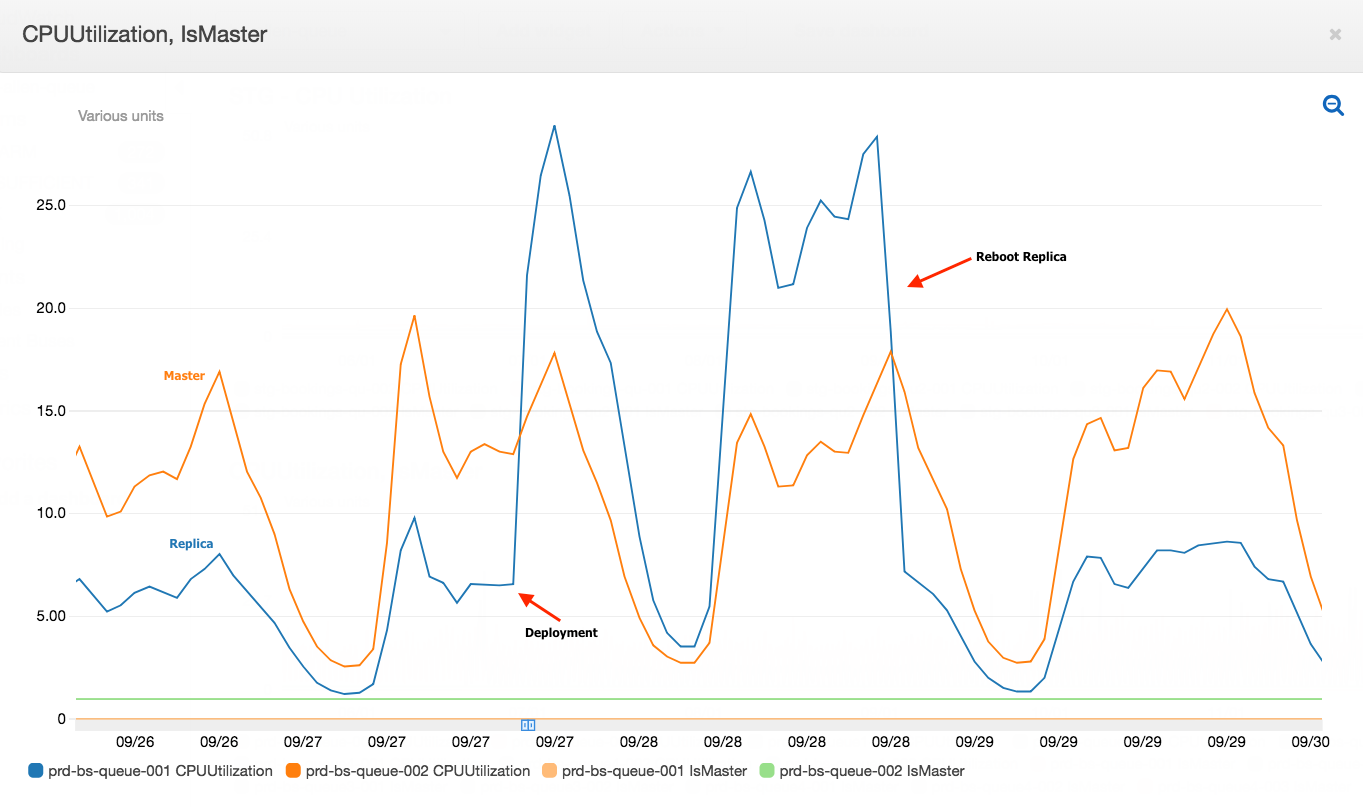
The following graph shows the CPU utilization of the master vs. the replica immediately after our service is deployed.

Architecture diagram
CPU Utilization

From the graph, you can see the following CPU usage trends. Replica’s CPU usage:

  • Increases immediately after our service is deployed.
  • Spikes higher than the master after a certain time.
  • Get’s back to normal after a reboot.

Cursory investigation

Because the spike occurs only when we deploy our service, we scrutinised all the scripts that were triggered immediately after the deployment. Lua monitor script was identified as a possible suspect. The script redistributes inactive service instances’ messages in the queue to active service instances so that messages can be processed by other healthy instances.

We ran a few experiments related to the Lua monitor script using the Redis monitor command to compare the script’s behaviour on master and the replica. A side note, because this command causes performance degradation, use it with discretion. Coming back to the script, we were surprised to note that the monitor script behaves differently between the master and the replica:

  • Redis executes the script separately on the master and the replica. We expected the script to execute only on master and the resulting changes to be replicated to the secondary.
  • The Redis command HGETALL used in the script returns the hash keys in a different order on master compared to the replica.

Due to the above reasons, the script causes data inconsistencies between the master and its replica. From that point on, the data between the master and the replica keeps diverging till they become completely distinct. Due to the inconsistency, the data on the secondary does not get deleted correctly thereby growing into an extremely large dataset. Any further operations on the large dataset requires a higher CPU usage, which explains why the replica’s CPU usage is higher than the master.

During replica reboots, the data gets synced and consistent again, which is why the CPU usage gets to normal values after rebooting.

Diving deeper on HGETALL

We knew that the keys of a hash are not ordered and we should not rely on the order. But it still puzzled us that the order is different even when the writing sequence is the same between the master and the replica. Plus the fact that the orders are always the same in our local environment with a similar setup made us even more curious.

So to better understand the underlying magic of Redis and to avoid similar bugs in the future, we decided to hammer on and read the Redis source code to get more details.

HGETALL command handling code

The HGETALL command is handled by the function genericHgetallCommand and it further calls hashTypeNext to iterate through the Hash object. A snippet of the code is shown as follows:

/* Move to the next entry in the hash. Return C_OK when the next entry
 * could be found and C_ERR when the iterator reaches the end. */
int hashTypeNext(hashTypeIterator *hi) {
    if (hi->encoding == OBJ_ENCODING_ZIPLIST) {
        // call zipListNext
    } else if (hi->encoding == OBJ_ENCODING_HT) {
        // call dictNext
    } else {
        serverPanic("Unknown hash encoding");
    }
    return C_OK;
}

From the code snippet, you can see that the Redis Hash object actually has two underlying representations:

  • ZIPLIST
  • HASHTABLE (dict)

A bit of research online helped us understand that, to save memory, Redis chooses between the two hash representations based on the following limits:

  • By default, Redis stores the Hash object as a zipped list when the hash has less than 512 entries and when each element’s size is smaller than 64 bytes.
  • If either limit is exceeded, Redis converts the list to a hashtable, and this is irreversible. That is, Redis won’t convert the hashtable back to a list again, even if the entries/size falls below the limit.

Eureka moment

Based on this understanding, we checked the encoding of the problematic hash in staging.

stg-bookings-qu-002.pcxebj.0001.apse1.cache.amazonaws.com:6379> object encoding queue_stats
"hashtable"

stg-bookings-qu-001.pcxebj.0001.apse1.cache.amazonaws.com:6379> object encoding queue_stats
"ziplist"

To our surprise, the encodings of the Hash object on the master and its replica were different. Which means if we add or delete elements in the hash, the sequence of the keys won’t be the same due to hashtable operation vs. list operation!

Now that we have identified the root cause, we were still curious about the difference in encoding between the master and the replica.

How could the underlying representations be different?

We reasoned, “If the master and its replica’s writing operations are exactly the same and in the same order, why are the underlying representations still different?

To answer this, we further looked through the Redis source to find all the possible places that a Hash object’s representation could be changed and soon found the following code snippet:

/* Load a Redis object of the specified type from the specified file.
 * On success a newly allocated object is returned, otherwise NULL. */
robj *rdbLoadObject(int rdbtype, rio *rdb) {
  //...
  if (rdbtype == RDB_TYPE_HASH) {
    //...
    o = createHashObject();  // ziplist

    /* Too many entries? Use a hash table. */
    if (len > server.hash_max_ziplist_entries)
        hashTypeConvert(o, OBJ_ENCODING_HT);

    //...
  }
}

Reading through the code we understand the following behaviour:

  • When restoring from an RDB file, Redis creates a ziplist first for Hash objects.
  • Only when the size of the Hash object is greater than the hash_max_ziplist_entries, the ziplist is converted to a hashtable.

So, if you have a Redis Hash object encoded as a hashtable with its length less than hash_max_ziplist_entries (512) in the master, when you set up a replica, it is encoded as a ziplist.

We were able to verify this behaviour in our local setup as well.

How did we fix it?

We could use the following two approaches to address this issue:

  • Enable script effect replication mode. This tells Redis to replicate the commands generated by the script instead of running the whole script on the replica. One disadvantage to using this approach is that it adds network traffic between the master and the replica.
  • Ensure the behaviour of the Lua monitor script is deterministic. In our case, we can do this by sorting the outputs of HKEYS/HGETALL.

We chose the latter approach because:

  • The Hash object is pretty small ( < 30 elements) so the sorting overhead is low, less than 1ms for 100 elements based on our tests.
  • Replicating our script effect would end up replicating thousands of Redis writing commands on the secondary causing a much higher overhead compared to replicating just the script.

After the fix, the CPU usage of the replica remained in range after each deployment. This also prevented the Redis cluster from being destroyed in the event of a master failover.

Key takeaways

In addition to writing clear and maintainable code, it’s equally important to understand the underlying storage layer that you are dealing with to produce efficient and bug-free code.

The following are some of the key learnings on Redis:

  • Redis does not guarantee the consistency between master and its replica nodes when Lua scripts are used. You have to ensure that the behaviour of the scripts are deterministic to avoid data inconsistency.
  • Redis replicates the whole Lua script instead of the resulting commands to the replica. However, this is the default behaviour and you can disable it.
  • To save memory, Redis uses different representations for Hash. Your Hash object could be stored as a list in memory or a hashtable. This is not guaranteed to be the same across the master and its replicas.

Join us

Grab is more than just the leading ride-hailing and mobile payments platform in Southeast Asia. We use data and technology to improve everything from transportation to payments and financial services across a region of more than 620 million people. We aspire to unlock the true potential of Southeast Asia and look for like-minded individuals to join us on this ride.

If you share our vision of driving South East Asia forward, apply to join our team today.
Securing and managing multi-cloud Presto Clusters with Grab’s DataGateway

Post Syndicated from Grab Tech original https://engineering.grab.com/data-gateway

Introduction

Data is the lifeblood of Grab and the insights we gain from it drive all the most critical business decisions made by Grabbers and our leaders every day.

Grab’s Data Engineering (DE) team is responsible for maintaining the data platform, which consists of data pipelines, job schedulers, and the query/computation engines that are the key components for generating insights from data. SQL is the core language for analytics at Grab and as of early 2020, our Presto platform serves about 200 user groups that add up to 500 users who run 350,000 queries every day. These queries span across 10,000 tables that process up to 1PB of data daily.

In 2016, we started the DataGateway project to enable us to manage data access for the hundreds of Grabbers who needed access to Presto for their work. Since then, DataGateway has grown to become much more than just an access control mechanism for Presto. In this blog, we want to share what we’ve achieved since the initial launch of the project.

The problems we wanted to solve

As we were reviewing the key challenges around data access in Grab and assessing possible solutions, we came up with this prioritized list of user requirements we wanted to work on:

  • Use a single endpoint to serve everyone.
  • Manage user access to clusters, schemas, tables, and fields.
  • Provide seamless user experience when presto clusters are scaled up/down, in/out, or provisioned/decommissioned.
  • Capture audit trail of user activities.

To provide Grabbers with the critical need of interactive querying, as well as performing extract, transform, load (ETL) jobs, we evaluated several technologies. Presto was among the ones we evaluated, and was what we eventually chose although it didn’t meet all of our requirements out of the box. In order to address these gaps, we came up with the idea of a security gateway for the Presto compute engine that could also act as a load balancer/proxy, this is how we ended up creating the DataGateway.

DataGateway is a service that sits between clients and Presto clusters. It is essentially a smart HTTP proxy server that is an abstraction layer on top of the Presto clusters that handles the following actions:

  1. Parse incoming SQL statements to get requested schemas, tables, and fields.
  2. Manage user Access Control List (ACL) to limit users’ data access by checking against the SQL parsing results.
  3. Manage users’ cluster access.
  4. Redirect users’ traffic to the authorized clusters.
  5. Show meaningful error messages to users whenever the query is rejected or exceptions from clusters are encountered.

Anatomy of DataGateway

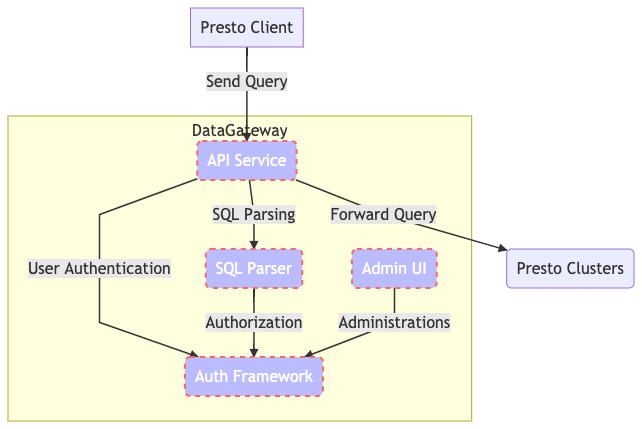
The DataGateway’s key components are as follows:

  • API Service
  • SQL Parser
  • Auth framework
  • Administration UI

We leveraged Kubernetes to run all these components as microservices.

Figure 1. DataGateway Key Components

API Service

This is the component that manages all users and cluster-facing processes. We integrated this service with the Presto API, which means it appears to be the same as a Presto cluster to a client. It accepts query requests from clients, gets the parsing result and runs authorization from the SQL Parser and the Auth Framework.

If everything is good to go, the API Service forwards queries to the assigned clusters and continues the entire query process.

Auth Framework

This handles both authentication and authorization requests. It stores the ACL of users and communicates with the API Service and the SQL Parser to run the entire authentication process. But why is it a microservice instead of a module in API Service, you ask? It’s because we keep evolving the security checks at Grab to ensure that everything is compliant with our security requirements, especially when dealing with data.

We wanted to make it flexible to fulfill ad-hoc requests from the security team without affecting the API Service. Furthermore, there are different authentication methods out there that we might need to deal with (OAuth2, SSO, you name it). The API Service supports multiple authentication frameworks that enable different authentication methods for different users.

SQL Parser

This is a SQL parsing engine to get schema, tables, and fields by reading SQL statements. Since Presto SQL parsing works differently in each version, we would compile multiple SQL Parsers that are identical to the Presto clusters we run. The SQL Parser becomes the single source of truth.

Admin UI

This is a UI for Presto administrators to manage clusters and user access, as well as to select an authentication framework, making it easier for the administrators to deal with the entire ecosystem.

How we deployed DataGateway using Kubernetes

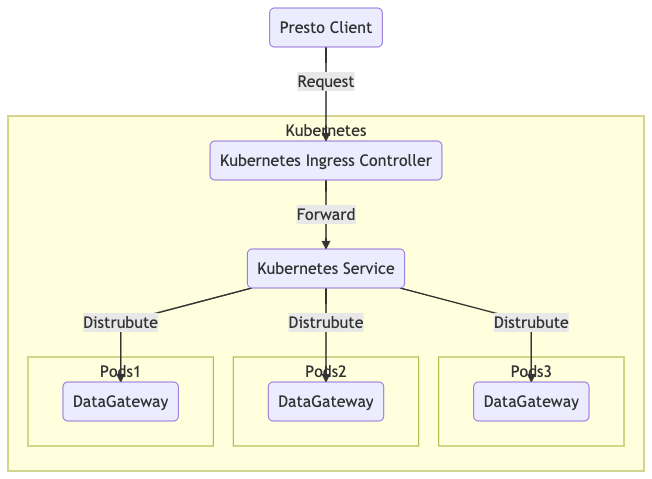
In the past couple of years, we’ve had significant growth in workloads from analysts and data scientists. As we were very enthusiastic about Kubernetes, DataGateway was chosen as one of the earliest services for deployment in Kubernetes. DataGateway in Kubernetes is known to be highly available and fully scalable to handle traffic from users and systems.

We also tested the HPA feature of Kubernetes, which is a dynamic scaling feature to scale in or out the number of pods based on actual traffic and resource consumption.

Figure 2. DataGateway deployment using Kubernetes

Functionality of DataGateway

This section highlights some of the ways we use DataGateway to manage our Presto ecosystem efficiently.

Restrict users based on Schema/Table level access

In a setup where a Presto cluster is deployed on AWS Amazon Elastic MapReduce (EMR) or Elastic Kubernetes Service (EKS), we configure an IAM role and attach it to the EMR or EKS nodes. The IAM role is set to limit the access to S3 storage. However, the IAM only provides bucket-level and file-level control; it doesn’t meet our requirements to have schema, table, and column-level ACLs. That’s how DataGateway is found useful in such scenarios.

One of the DataGateway services is an SQL Parser. As previously covered, this is a service that parses and digs out schemas and tables involved in a query. The API service receives the parsing result and checks against the ACL of users, and decides whether to allow or reject the query. This is a remarkable improvement in our security control since we now have another layer to restrict access, on top of the S3 storage. We’ve implemented an SQL-based access control down to table level.

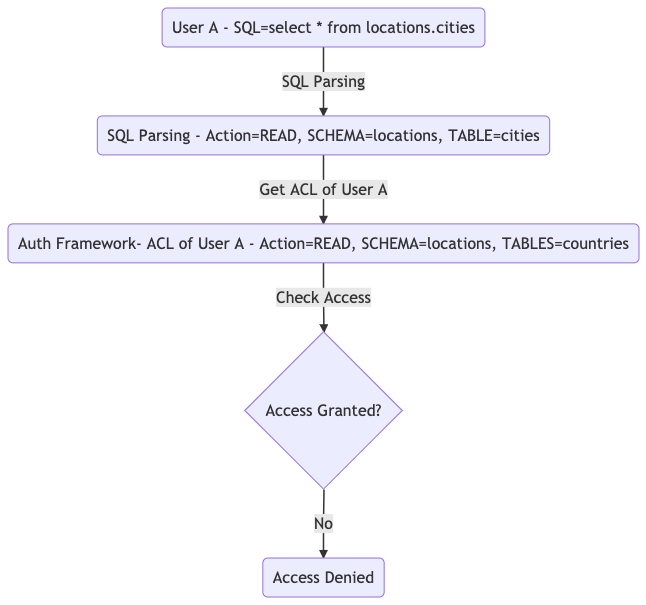
As shown in the Figure 3, user A is trying run a SQL statement select * from locations.cities. The SQL Parser reads the statement and tells the API service that user A is trying to read data from the table cities in the schema locations. Then, the API service checks against the ACL of user A. The service finds that user A has only read access to table countries in schema locations. Eventually, the API service denies this attempt because user A doesn’t have read access to table cities in the schema locations.

Figure 3. An example of how to check user access to run SQL statements

The above flow shows an access denied result because the user doesn’t have the appropriate permissions.

Seamless User Experience during the EMR migration

We use AWS EMR to deploy Presto as an SQL query engine since deployment is really easy. However, without DataGateway, any EMR operations such as terminations, new cluster deployment, config changes, and version upgrades, would require quite a bit of user involvement. We would sometimes need users to make changes on their side. For example, request users to change the endpoints to connect to suitable clusters.

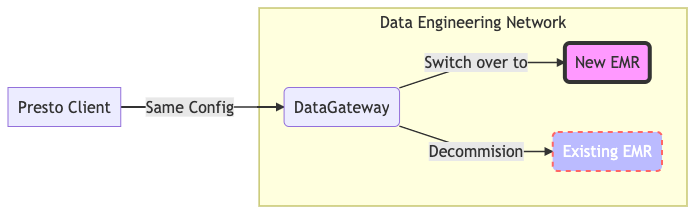
With DataGateway, ACLs exist for each of the user accounts. The ACL includes the list of EMR clusters that users are allowed to access. As a Presto access management platform, here the DataGateway redirects user traffics to an appropriate cluster based on the ACL, like a proxy. Users always connect to the same endpoint we offer, which is the DataGateway. To switch over from one cluster to another, we just need to edit the cluster ACL and everything is handled seamlessly.

Figure 4. Cluster switching using DataGateway

Figure 4 highlights the case when we’re switching EMR from one cluster to another. No changes are required from users.

We executed the migration of our entire Presto platform from an AWS EMR instance to another AWS EMR instance using the same methodology. The migrations were executed with little to no disruption for our users. We were able to move 40 clusters with hundreds of users. They were able to issue millions of queries daily in a few phases over a couple of months.

In most cases, users didn’t have to make any changes on their end, they just continued using Presto as usual while we made the changes in the background.

Multi-Cloud Data Lake/Presto Cluster maintenance

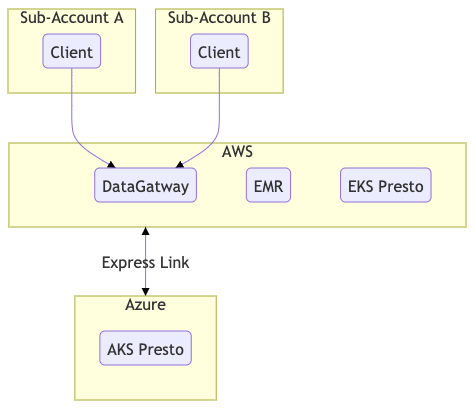
Recently, we started to build and maintain data lakes not just in one cloud, but two – in AWS and Azure. Since most end-users are AWS-based, and each team has their own AWS sub-account to run their services and workloads, it would be a nightmare to bridge all the connections and access routes between these two clouds from end-to-end, sub-account by sub-account.

Here, the DataGateway plays the role of the multi-cloud gateway. Since all end-users’ AWS sub-accounts have peered to DataGateway’s network, everything becomes much easier to handle.

For end-users, they retain the same Presto connection profile. The DE team then handles the connection setup from DataGateway to Azure, and also the deployment of Presto clusters in Azure.

When all is set, end-users use the same endpoint to DataGateway. We offer a feature called Cluster Switch that allows users to switch between AWS Presto cluster and Azure Presto Cluster on the fly by filling in parameters on the connection string. This feature allows users to switch to their target Presto cluster without any endpoint changes. The switch works instantly whenever they do the change. That means users can run different queries in different clusters based on their requirements.

This feature has helped the DE team to maintain Presto Cluster easily. We can spin up different Presto clusters for different teams, so that each team has their own query engine to run their queries with dedicated resources.

Figure 5. Sub-account connections and Queries

Figure 5 shows an example of how sub-accounts connect to DataGateway and run queries on resources in different clouds and clusters.

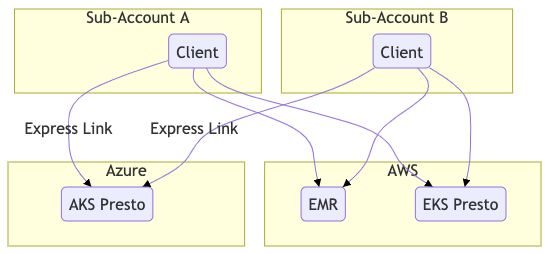
Figure 6. Sample scenario without DataGateway

Figure 6 shows a scenario of what would happen if DataGatway doesn’t exist. Each of the accounts would have to maintain its own connections, Virtual Private Cloud (VPC) peering, and express link to connect to our Presto resources.

Summary

DataGateway is playing a key role in Grab’s entire Presto ecosystem. It helps us manage user access and cluster selections on a single endpoint, ensuring that everyone is running their Presto queries on the same place. It also helps distribute workload to different types and versions of Presto clusters.

When we started to deploy the DataGateway on Kubernetes, our vision for the Presto ecosystem underwent an epic change as it further motivated us to continuously improve. Since then, we’ve had new ideas on deployment method/pipeline, microservice implementations, scaling strategy, resource control, we even made use of Kubernetes and designed an on-demand, container-based Presto cluster provisioning engine. We’ll share this in another engineering blog, so do stay tuned!.

We also made crucial enhancements on data access control as we extended Presto’s access controls down to the schema/table-level.

In day-to-day operations, especially when we started to implement data lake in multiple clouds, DataGateway solved a lot of implementation issues. DataGateway made it simpler to switch a user’s Presto cluster from one cloud to another or allow a user to use a different Presto cluster using parameters. DataGateway allowed us to provide a seamless experience to our users.

Looking forward, we’ve more and more ideas for our Presto ecosystem, such Spark DataGateway or AWS Athena integrations, to keep our data safe at any time and to provide our users with a smoother experience when dealing with data used for analysis or research.


Authored by Vinnson Lee on behalf of the Presto Development Team at Grab – Edwin Law, Qui Hieu Nguyen, Rahul Penti, Wenli Wan, Wang Hui and the Data Engineering Team.


Join us

Grab is more than just the leading ride-hailing and mobile payments platform in Southeast Asia. We use data and technology to improve everything from transportation to payments and financial services across a region of more than 620 million people. We aspire to unlock the true potential of Southeast Asia and look for like-minded individuals to join us on this ride.

If you share our vision of driving South East Asia forward, apply to join our team today.