Post Syndicated from Matt Granger original https://www.youtube.com/watch?v=MK9PGngxNeo
Photographers UNITE 📸
Post Syndicated from Matt Granger original https://www.youtube.com/watch?v=E8eainZhuAM
The Intelligent Listing: Cybersecurity Job Descriptions That Deliver
Post Syndicated from Jake Godgart original https://blog.rapid7.com/2022/10/13/the-intelligent-listing-cybersecurity-job-descriptions-that-deliver/

Modern job descriptions have quite the reputation for causing reactionary eye-rolling. Why? Because what used to be a couple of paragraphs – about requirements and experience for performing a cybersecurity analyst job – is actually now filled with a laundry list of criteria that make candidates think twice before hitting the “Apply Now” button.
Before you know it, the potential applicant has read a couple thousand words of simple job requirements, plus an “alphabet soup” of certifications. It’s all a bit ridiculous, considering if applicants spent all of their time studying for these tests, they wouldn’t have any real-world experience (or a life!) to back it up. In fact, the candidate may even be overqualified for the job, and the person who wrote the listing is the one who should probably feel ridiculous…and inefficient.
Description or unrealistic wishlist?
Even the term “wishlist” isn’t accurate, because many job descriptions veer off of what the job function will actually be and start listing “nice-to-haves” as requirements. Thus, even a function not likely to be under an analyst’s day-to-day purview becomes something the candidate reads in the description and makes them decide not to pursue the position. Or worse, it requires the applicant to use a technology stack they’ve never accessed. And maybe with wording that conveys the availability of a little guidance and/or teaching with regard to that new tech, they might end up applying. The takeaway: Be transparent about what the job will actually require because the applicant might be an amazing fit.
This is a more pervasive problem throughout the cybersecurity industry than many think. For example, an entry-level security analyst job description might list a few certifications as hard requirements. But one of those certifications requires a minimum of five years paid work experience. So the requirements in the job description end up being contradictory, and the hiring manager might need to have a think about what kind of position they’re actually trying to fill.
Even if that magical security unicorn that matched all the requirements did exist, they’ll still need to learn something on days 1 to 100. Namely, the ins and outs of the company, the office space, meeting cadence, team dynamics…and maybe some coworkers’ first names. There’s always something new at the beginning that becomes part of the onboarding process, and learning a new tool (or two) shouldn’t be grounds to give a prospective applicant pause.
A DIY description should start with DEI
Embracing diversity, equity, and inclusion (DEI) isn’t just a corporate slogan – it’s simply the right thing to do. And knowing how to weave that sentiment and practice into a job description can be tricky. But with the right mix of welcoming language and realistic requirements, you’ll start to attract great candidates. Here are a few questions to ask yourself when writing with DEI in mind (again, so you can attract the absolute best candidate pool):
- Are you simply listing the requirements and calling it a day, or are you weaving thoughtful language in and around those requirements that also keeps in mind things like gender bias and overly corporate language?
- Are you creating an inviting description for potential candidates with non-typical backgrounds, such as those who might have Associate’s Degrees (but maybe also a ton of experience and/or natural aptitude) or those who may be recent grads but could turn into absolute rockstars sooner than you think?
- Your company may have worked hard to integrate DEI into its culture and its very DNA. Is that reflected in the descriptions for your open positions currently published across all the job sites?
- Are you including language that can help prep candidates for the actual interview process?
Stay tuned in
It’s not rocket science, as the old saying goes. But if you’re having trouble attracting expert talent that will stay loyal (at least for a few years), it can be worthwhile to poke around jobs sections of social sites, cybersecurity talent forums, and a ton of listings from the competition to see what kind of language they’re using and if it’s actually attracting talent (how long has that listing been up?). You’ll notice the best job descriptions are not all about the job itself; postings should say what the company is looking for AND what it can do for the candidate – beyond salary and benefits.
It’s true that a positive work environment can do wonders for productivity, camaraderie, and Glassdoor reviews from employees that reflect favorably on their time in your security operations center (SOC). It’s also good to keep in mind that if it all goes well and you end up with several employees who all stay five years or more, their experience begins with that job description. They’ll always remember reading it; how it made them feel and what prompted them to click “Apply Now,” so make that listing a good one.
You can also read our new eBook, 13 Tips for Overcoming the Cybersecurity Talent Shortage, for a deeper dive into the current cybersecurity skills gap and more steps you can take to address it within your own organization.
Upgrade to Athena engine version 3 to increase query performance and access more analytics features
Post Syndicated from Blayze Stefaniak original https://aws.amazon.com/blogs/big-data/upgrade-to-athena-engine-version-3-to-increase-query-performance-and-access-more-analytics-features/
Customers tell us they want to have stronger performance and lower costs for their data analytics applications and workloads. Customers also want to use AWS as a platform that hosts managed versions of their favorite open-source projects, which will frequently adopt the latest features from the open-source communities. With Amazon Athena engine version 3, we continue to increase performance, provide new features and now deliver better currency with the Trino and Presto projects.
Athena is an interactive query service that makes it easy to analyze data in Amazon Simple Storage Service (Amazon S3) using standard SQL. Athena is serverless, so there is no infrastructure to manage, and you pay only for the queries that you run. Customers such as Orca Security, the Agentless Cloud Security Platform, are already realizing the benefits of using Athena engine version 3 with the Apache Iceberg.
“At Orca Security, we are excited about the launch of Athena engine version 3,” says Arie Teter, VP R&D at Orca Security. “With Athena engine version 3, we will be able to query our massive petabyte-scale data lake more efficiently and at a lower cost. We are especially excited about being able to leverage all the latest Trino features with Athena’s new engine in order to deliver our customers the best-of-breed, ML-driven anomaly detection solution.”
In this post, we discuss benefits of Athena engine version 3, performance benchmark results for different table formats and information about upgrading to engine version 3.
New features, more often
One of the most exciting aspects of engine version 3 is its new continuous integration approach to open source software management that will improve currency with the Trino and PrestoDB projects. This approach enables Athena to deliver increased performance and new features at an even faster pace.
At AWS, we are committed to bringing the value of open source to our customers and providing contributions to open source communities. The Athena development team is actively contributing bug fixes and security, scalability, performance, and feature enhancements back to these open-source code bases, so anyone using Trino, PrestoDB and Apache Iceberg can benefit from the team’s contributions. For more information on AWS’s commitment to the open-source community, refer to Open source at AWS.
Athena engine version 3 incorporates over 50 new SQL functions, and 30 new features from the open-source Trino project. For example, Athena engine version 3 supports T-Digest functions that can be used to approximate rank-based statistics with high accuracy, new Geospatial functions to run optimized Geospatial queries, and new query syntaxes such as MATCH_RECOGNIZE for identifying data patterns in applications such as fraud detection and sensor data analysis.
Athena engine version 3 also gives you more AWS-specific features. For example, we have worked closely with the AWS Glue data catalog team to improve Athena’s metadata retrieval time, which we explain in the section “Faster query planning with AWS Glue Data Catalog” below.
For more information about what’s new in Athena engine version 3, refer to the Athena engine version 3 Improvements and new features.
Faster runtime, lower cost
Last year, we shared benchmark testing on Athena engine version 2 using TPC-DS benchmark queries at 3 TB scale and observed that query performance improved by three times and cost decreased by 70% as a result of reduced scanned data. These improvements have been a combination of enhancements developed by Athena and AWS engineering teams as well as contributions from the PrestoDB and Trino open-source communities.
The new engine version 3 will allow Athena to continue delivering performance improvements at a rapid pace. We performed benchmark testing on engine version 3 using TPC-DS benchmark queries at 3 TB scale, and observed 20% query performance improvement when compared to the latest release of engine version 2. Athena engine version 3 includes performance improvement across operators, clauses, and decoders: such as performance improvement of joins involving comparisons with the <,<=, >,>= operators, queries that contains JOIN, UNION, UNNEST, GROUP BY clauses, queries using IN predicate with a short list of constant. Athena engine version 3 also provides query execution improvements that reduce the amount of data scanned which gives you additional performance gains. With Athena, you are charged based on the amount of data scanned by each query, so this also translates to lower costs. For more information, refer to Amazon Athena pricing.
Faster query planning with AWS Glue Data Catalog
Athena engine version 3 provides better integration with AWS Glue Data Catalog to improve query planning performance by up to ten times. Query planning is the process of listing instructions the query engine will follow in order to run a query. During query planning, Athena uses AWS Glue API to retrieve various information such as table and partition metadata, and column statistics. As the number of tables increases, the number of calls to the Glue API for metadata also increase which results in additional query latency. In engine version 3, we reduced this Glue API overhead thus brought down the overall query planning time. For smaller datasets and datasets with large number of tables, you can see the total runtime has been reduced significantly because the query planning time is a higher percentage of the total run time.
Figure 1 below charts the top 10 queries from the TPC-DS benchmark with the most performance improvement from engine version 2 to engine version 3 based on the Amazon CloudWatch metric for total runtime. Each query involves joining multiple tables with complex predicates.

Faster query runtime with Apache Iceberg integration
Athena engine version 3 provides better integration with the Apache Iceberg table format. Features such as Iceberg’s hidden partitioning now augment Athena optimizations such as partition pruning and dynamic filtering to reduce data scanned and improve query performance in Athena engine v3. You do not need to maintain partition columns or even understand the physical table layout to load data to table and achieve good query performance.
We performed TPC-DS benchmark testing by loading data into the Apache Iceberg table format, with hidden partitions configured, and compared the performance between Athena engine version 2 and 3. Figure 2 below is a chart of the top 10 query improvements, which all include complex predicates. The top query, query 52, has five WHERE predicates and two GROUP BY operations. Compared to engine version 2, the query runs thirteen times faster with sixteen times less data scanned on engine version 3.

Upgrading to Athena engine version 3
To use Athena engine version 3, you can create a new workgroup, or configure an existing workgroup, and select the recommended Athena engine version 3. Any Athena workgroup can upgrade from engine version 2 to engine version 3 without interruption in your ability to submit queries. For more information and instructions for changing your Athena engine version, refer to Changing Athena engine versions.
Athena engine version 3 has feature parity with all major features from Athena engine version 2. There are no changes required by you to use features like dynamic partition pruning, Apache Iceberg and Apache Hudi table formats, AWS Lake Formation governed tables integration, and Athena Federated Query in engine version 3.For more information on Athena features, refer to Amazon Athena features, and the Amazon Athena User Guide.
Athena engine version 3 includes additional improvements to support ANSI SQL compliance. This results in some changes to syntax, data processing, and timestamps that may cause errors when running the same queries in the new engine version. For information about error messages, causes, and suggested solutions, refer to Athena engine version 3 Limitations, Breaking changes, Data processing changes, and Timestamp changes.
To make sure that your Athena engine version upgrade goes smoothly, we recommend the following practices to facilitate your upgrade process. After you have confirmed your query behavior works as you expect, you can safely upgrade your existing Athena workgroups.
- Review the Athena engine version 3 Limitations and Breaking changes and update any affected queries.
- Test in pre-production to validate and qualify your queries against Athena engine version 3 by creating a test workgroup or upgrading an existing pre-production environment. For example, you can create a new test workgroup running engine version 3 to run integration tests from your pre-production or staging environment, and monitor for failures or performance regressions. For information about CloudWatch metrics and dimensions published by Athena, refer to Monitoring Athena queries with CloudWatch metrics.
- Upgrade each query based on metrics to test your queries against an Athena engine version 3 workgroup. For example, you can create a new workgroup with engine version 3 alongside your existing engine version 2 workgroup. You can send a small percentage of queries to the engine version 3 workgroup, monitor for failures or performance regressions, then increase the number of queries if they’re successful and performant. Repeat until all your queries have been migrated to Athena engine version 3.
With our simplified automatic engine upgrade process, you can configure existing workgroups to be automatically upgraded to engine version 3 without requiring manual review or intervention. The upgrade behavior is as follows:
- If Query engine version is set to Automatic, your workgroup will remain on engine version 2 pending the automatic upgrade, and Athena will choose when to upgrade the workgroup to engine version 3. Before upgrading a workgroup, we perform a set of validation tests to confirm that its queries perform correctly and efficiently on engine version 3. Because our validation is performed on a best effort basis, we recommend you perform your own validation testing to ensure all queries run as expected.
- If Query engine version is set to Manual, you will have the ability to select your version. The default choice is set to engine version 3, with the ability to toggle to engine version 2.
Conclusion
This post discussed Athena engine version 3 benefits, performance benchmark results, and how you can start using engine version 3 today with minimal work required. You can get started with Athena engine version 3 by using the Athena Console, the AWS CLI, or the AWS SDK. To learn more about Athena, refer to the Amazon Athena User Guide.
Thanks for reading this post! If you have questions on Athena engine version 3, don’t hesitate to leave a comment in the comments section.
About the authors
 Blayze Stefaniak is a Senior Solutions Architect for the Technical Strategist Program supporting Executive Customer Programs in AWS Marketing. He has experience working across industries including healthcare, automotive, and public sector. He is passionate about breaking down complex situations into something practical and actionable. In his spare time, you can find Blayze listening to Star Wars audiobooks, trying to make his dogs laugh, and probably talking on mute.
 Daniel Chen is a Senior Product Manager at Amazon Web Services (AWS) Athena. He has experience in Banking and Capital Market of financial service industry and works closely with enterprise customers building data lakes and analytical applications on the AWS platform. In his spare time, he loves playing tennis and ping pong.
 Theo Tolv is a Senior Big Data Architect in the Athena team. He’s worked with small and big data for most of his career and often hangs out on Stack Overflow answering questions about Athena.
 Jack Ye is a software engineer of the Athena Data Lake and Storage team. He is an Apache Iceberg Committer and PMC member.
How to Download and Back Up Dropbox Data
Post Syndicated from Lora Maslenitsyna original https://www.backblaze.com/blog/how-to-download-and-back-up-dropbox-data/

If you’ve ever told an IT professional that you’re using Dropbox to back up files and were greeted with a side eye and a stifled “well, actually…” it’s because Dropbox isn’t actually a backup. It’s for syncing data. The distinction is subtle, but critical.
If you’re reading this post, you probably already know that data is always at risk of loss to accidental deletion, system updates, or even if you forget your password and get locked out of your account. The difference between backing up and syncing is that syncing your data will not protect it from these risks.
It’s easy to accidentally lose access to a sync service where you might be keeping files or images that no longer live on your computer. Many colleges and universities now even offer file hosting service subscriptions to students for free—until they graduate. After students earn their diplomas and leave the dorms, these services graduate, too, and students either get locked out of their accounts or have to choose between switching to a free tier and compromising on storage space or paying the fees to keep their existing subscription tier.
To make sure your data stays safe and secure, you’ll want to make sure you have a copy of it on your local device as well as a copy backed up to the cloud. A 3-2-1 backup strategy is always your best bet for securely storing your data. In this post, we’ll walk you through downloading your data from Dropbox and some strategies for backing up your downloaded files.
Back Up Everything But the Kitchen Sync
As we mentioned earlier, saving your data to a sync service is not the same as backing it up. Sync and backup services are complimentary, but only a backup will save a copy of your data and keep it safe against accidental deletion, updates, a ransomware attack, and more.
To help you save your synced computer data, we’re developing a series of guides to downloading and backing up your data across different sync services, like OneDrive. Comment below to let us know what other sync services you’d like to see us cover.
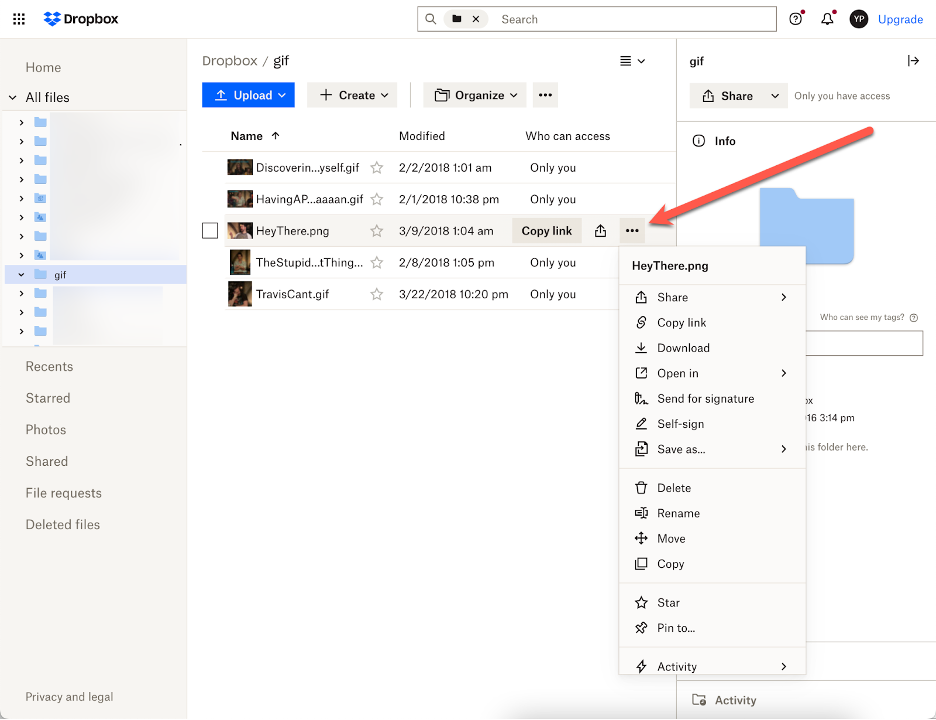
How to Download Files From Dropbox
Note: If you are using the Dropbox client to sync the files that are on your computer, the option to download your files may be replaced by an option to open them, instead. Clicking on “Open” will open up the files directly from the file on your computer where they are saved.
To download a file or folder from Dropbox, follow these steps:
-
- Sign in to your Dropbox account. (We know, this is pretty self-evident. We’re just trying to be thorough here).
- Find the file or folder you’d like to download and hover your cursor over it.
- Click on the three dots.
- Select Download. Your files will appear in the Downloads folder on your computer, and folders will be downloaded as .zip files.

It’s also important to note that Dropbox only supports downloads of folders that are less than 20GB and contain fewer than 10,000 total files.
How to Back Up Your Dropbox Data
Now that you have all of your Dropbox files downloaded to your computer, you’ll want to follow through with the next steps of the 3-2-1 backup strategy. By saving a copy of your data on an external or secondary device (like a hard drive), and a third copy in an off-site location (like the cloud) your data will be protected from any number of possible risks. Backblaze Personal Backup automatically and continuously backs up a copy of all of the data on your computer to the cloud, making it that much easier to fulfill the 3-2-1 backup strategy.
Bonus: How to Export a File From Dropbox to an App on Your Phone or Mobile Device
If you want to send a portion of your files elsewhere for safekeeping, or to share with another app, you can follow the set of instructions below. Just remember that downloading your files to your phone or emailing them to yourself isn’t the same as keeping a full copy of your data on an external device—your data is still susceptible to damage or loss.
First, you’ll need to download the Dropbox mobile app to access your synced files on your mobile device.
- Open the app and select the three dots next to the file or folder you’d like to export. On an iPhone or iPad, the dots will appear horizontal, and on an Android device they’ll be vertical.
- Select Share.
- Select Export file, which will show a list of apps that can open the file. Choose the app you’d like to open the file. Note: once you export the file, if you make any changes to that file in the other app, those changes may not be saved back to your Dropbox account unless the app integrates with Dropbox.
Back Up Your Dropbox Before It’s Too Late
Have a lot of Dropbox data you don’t want to take up space on your computer? Upload and store your data in Backblaze B2 Cloud Storage as a part of your 3-2-1 approach. Also, let us know in the comments if you’d like to see more guides to downloading and backing up the data saved to other sync services.
The post How to Download and Back Up Dropbox Data appeared first on Backblaze Blog | Cloud Storage & Cloud Backup.
We’re Challenging Convention. Rapid7 Recognized in the 2022 Gartner® Magic Quadrant™ for SIEM.
Post Syndicated from Meaghan Donlon original https://blog.rapid7.com/2022/10/13/rapid7-recognized-in-the-2022-gartner-magic-quadrant-for-siem/

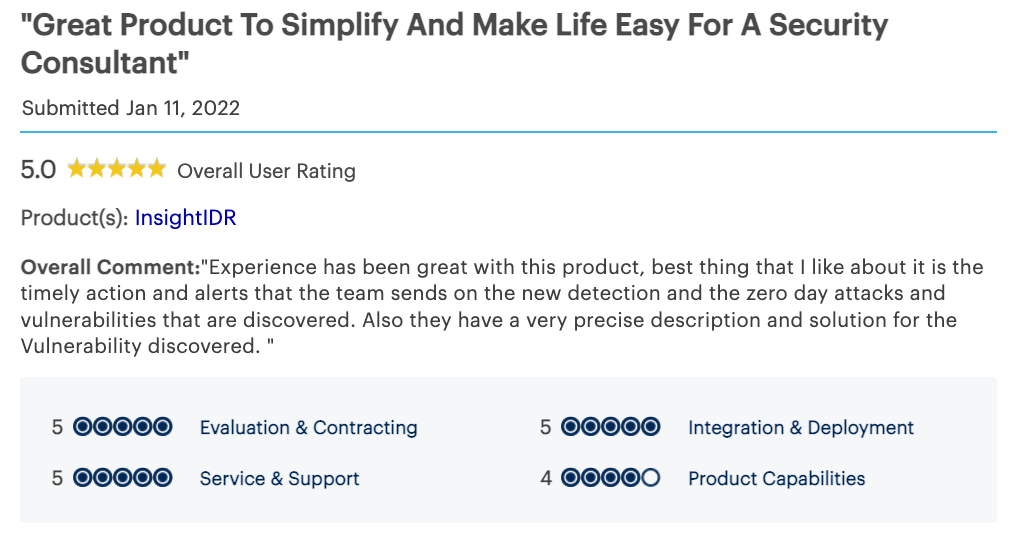
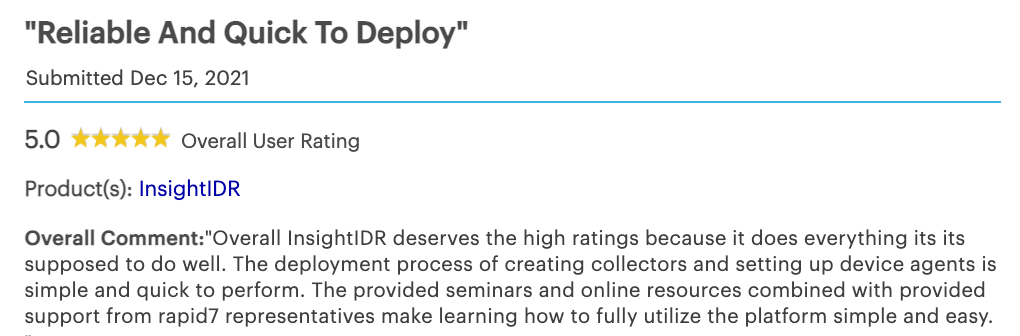
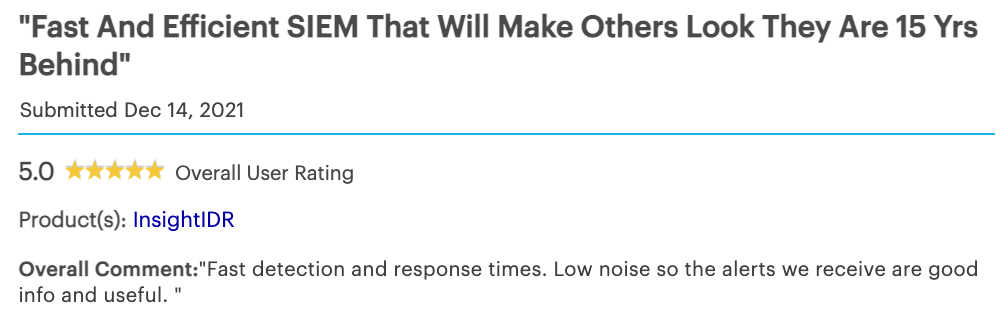
As the attack surface sprawls, under-resourced security teams have inherent disadvantages. Rapid7 InsightIDR enables resource constrained security teams to achieve sophisticated detection and response, with greater efficiency and efficacy. As a Challenger in the 2022 Gartner Magic Quadrant for SIEM, we’re proud to represent the huge number of security teams out there today that don’t have time to do it all, but are asked to do it anyway. Our goal is to keep your organization safe by finding and eliminating threats faster and more reliably.
Rapid7 maximizes your most precious resource: time
We are grateful to have a diverse collective of customers and partners around the world, of varying size and industry focus. These smart, agile, maturing teams want to advance their detection and response programs, but their organizations and the threats they face are moving faster than their capacity is growing. The constant that unites all of these teams: they never have enough time. Yet, we feel that despite a well-documented, industry-crushing skills gap, far too many traditional SIEMs and detection products continue to introduce additional noise and complexity for these teams. The result is long days, weekend work, far too many missed dinners / concerts / games, and (scariest of all) missed threats.
The best way to achieve successful detection and response is through a pragmatic and efficient approach. Threats are still a threat—whether or not you’ve had time to set up your complex traditional SIEM or the myriad of point detection solutions around it. Attackers don’t care if you’re ready. In fact, they’re counting on you not to be. Security teams need time and access to expertise to close this gap.
That’s where we believe Rapid7 can help.
Time-to-value and efficiency at every step
From inception, the guiding principle of InsightIDR has been to deliver sophisticated detection and response, in a more efficient and effective way, and here’s how:
- A cloud-native foundation, SaaS delivery, and software-based collectors means it is faster to deploy, removes hardware burdens that bog teams down, and accelerates the time to actually get insights.
- Intuitive interfaces, pre-built dashboards and reports, and a robust detections library means that teams are able to activate even the most junior analysts to deliver advanced analysis and threat detections right away.
- And highly correlated investigation timelines, response recommendations (vetted by Rapid7’s MDR team), and pre-built automation workflows help you with one of the hardest parts of your job: responding to threats before significant damage occurs.
In short, we offer a SIEM that maturing teams can get real value from. Over the last seven years, we’ve struck a balance of adding a multitude of capabilities while never compromising our core tenet and commitment to providing you with productivity efficiency and delivering a better detection and response experience.
High-fidelity, expertly vetted detections
Leveraging a diverse mix of threat intelligence—including unique intel from Rapid7’s renowned open-source projects—the Rapid7 Threat Intelligence and Detections Engineering (TIDE) team curates emergent threat content from all corners of the threat landscape. Our TIDE team is constantly manicuring a library of both known and unknown threats to capture even the most evasive attacks. With this always-up-to-date library and native UEBA, EDR, NDR, deception technology, and cloud TDIR, InsightIDR customers can be confident that the entirety of their attack surface is covered. And because our global MDR team is leveraging the same threat library, you can be certain that alerts will be low noise, highly reliable, and primed for analysts to take action.
The future of detection & response
We believe that as the threat and attack landscape change at a rapid pace, the approaches to unifying data, detecting, and responding need to too. Reducing the noise and accelerating response outcomes is critical for security success – regardless of your security maturity. We also believe that for this reason, Gartner has named us a Challenger in the Magic Quadrant for SIEM – and we will continue to challenge the traditional as we focus on building the right outcomes for our customers. Find a complimentary copy of the 2022 Gartner Magic Quadrant for SIEM here.
Just a few of those outcomes we are driving toward in the future:
- More frictionless access to expertise to ensure analysts always know how to respond and can execute more quickly
- Deepening our breadth of detections and endpoint coverage for modern, dynamic environments, so customers can continue to leverage InsightIDR as their single source of truth for detection and response
- Making sure our MSSP partners and their customers are optimized to succeed by providing a more turnkey experience that enables these partners to tap into the scale and efficiency of InsightIDR
We are excited to share more on these initiatives soon. Thank you to our customers and partners for continuing to share your insights, ideas, pains, and future plans. You continue to fuel our innovation and validate that we are on the right track in addressing the needs of maturing security teams.
Get the full report
GARTNER and Magic Quadrant are registered trademarks and service marks, and PEER INSIGHTS is a trademark and service mark, of Gartner, Inc. and/or its affiliates in the U.S. and internationally and are used herein with permission. All rights reserved.
Gartner does not endorse any vendor, product or service depicted in its research publications, and does not advise technology users to select only those vendors with the highest ratings or other designation. Gartner research publications consist of the opinions of Gartner’s research organization and should not be construed as statements of fact. Gartner disclaims all warranties, expressed or implied, with respect to this research, including any warranties of merchantability or fitness for a particular purpose.
Gartner Peer Insights content consists of the opinions of individual end users based on their own experiences, and should not be construed as statements of fact, nor do they represent the views of Gartner or its affiliates. Gartner does not endorse any vendor, product or service depicted in this content nor makes any warranties, expressed or implied, with respect to this content, about its accuracy or completeness, including any warranties of merchantability or fitness for a particular purpose.
The Story of Scalar
Post Syndicated from Derrick Stolee original https://github.blog/2022-10-13-the-story-of-scalar/
When you install Git v2.38, you’ll find a new executable tool available called scalar. At its core, Scalar enables the latest and greatest Git features for working with large repositories. By simply switching from git clone to scalar clone, you will have all of Git’s most impactful performance features, such as partial clone, sparse-checkout, background maintenance, and advanced config options neatly configured for your repository. Have you already cloned your repository? Run scalar register in it to get the same features.
Although Scalar is only now making its formal Git debut, this release represents the culmination of a multi-year journey. Today, we will share the story of how Scalar got to this point. We’ll start from what inspired its creation, how it evolved from a prototype carved out of the VFS for Git codebase, and finally how it landed in upstream Git. Each step of the way was guided by a set of development principles that helped us with each challenge and opportunity.
Special thanks to @chrisd8088, @dscho, @jeffhostetler, @jrbriggs, @kyle-rader, @mjcheetham, @ldennington, @prplr, @wilbaker, and all of the other contributors who helped make this happen!
Our development principles
Before we get into specifics about how Scalar was built and eventually rewritten and contributed upstream, we need to first establish some context. We entered the project with certain values that we used to guide our decisions. Here are a few that are particularly important to this story.
Rapid prototyping
Code speaks volumes. We could design an architecture all we want on paper, but when solving problems at scale, we need to have actual code running before we can make a final decision.
Before committing to a decision, we would quickly build a prototype and measure its performance. During this prototyping phase, we would take shortcuts to get to that point of measurement. Then, we’d throw everything we could at the prototype to make sure it was correct and fast.
Based on the prototype, we would commit to doing the careful engineering of building the feature again but with a test strategy, thoughtful architecture, and a plan for delivering it to users.
Incremental changes over complete rewrites
Looking at where we started to where we ended, it might seem like we are proponents of rewriting things from scratch. We intend to demonstrate exactly the opposite: Scalar moved with small incremental changes that solved an immediate need. While making those changes, we also optimized for reducing our technical debt and creating a better architecture, and that resulted in code moving from .NET to C and then from our fork to upstream Git, but each individual movement was relatively small compared to the entire system.
The biggest reason we focused on incremental changes was because of our next value.
Tests are an asset
Making any kind of software change adds risk to a project. That risk is mitigated when we have a large set of battle-hardened tests. With a robust test suite available, we were able to make significant changes to our architecture with confidence.
Work in the open
Other than the earliest prototypes, all changes were reviewed and merged completely in public, either in the microsoft/scalar repository or the microsoft/git repository. Scalar was an open source project from day one, and was never intended to be a project only for internal use. By contrast, VFS for Git was built as a tool for Microsoft’s internal use first, and open sourcing it was a bonus after it reached enough adoption. Not only did we value that transparency during Scalar’s development, but now we have a history of public code changes to talk about here.
Now that we’ve established these values, let’s begin the story of Scalar.
A catalyst forces a pivot
The Virtual FileSystem for Git project (VFS for Git for short—previously “GVFS”) was built specifically to transition the Microsoft Windows OS monorepo to Git. VFS for Git utilizes a virtual filesystem to lazily load files only when a filesystem read occurs. This greatly reduced the amount of work Git needed to do, but required installing the microsoft/git fork as well as the .NET VFS for Git software and use Azure Repos to host the repository.
Initially, the Microsoft Office monorepo was going to onboard to Git using VFS for Git, but they needed cross-platform support, specifically for macOS development. After getting pretty far in a macOS port, Apple deprecated the kernel features that provided the filesystem virtualization that was required for that flow.
We were in luck, however, because we had come to understand something a key quality of the Office monorepo: Office has a rigorous dependency system that clearly identifies which files are necessary for a local build. This means that a developer could specify the files they need to Git’s sparse-checkout feature instead of dynamically populating the worktree using a virtual filesystem. This also significantly simplifies the software needed to manage their monorepo!
However, there was a problem. The sparse-checkout feature had previously been abandoned as a direction for VFS for Git due to its performance. Git would use a list of patterns to match which paths should be in the worktree and which should be ignored. This pattern matching had an ordering strategy that required iterating through the entire pattern list for every possible path, requiring quadratic time! For one of the larger sparse-checkout definition examples we had, Git would take 40 minutes to evaluate the sparse-checkout patterns.
Sparse-checkout definitions are extremely generic. They include matching on file prefix, but also file suffix, or path substring, and any combination. For our target monorepo, we only needed directory matches. With that limited type of pattern in mind, we added a new mode to Git’s sparse-checkout feature: “cone mode” sparse-checkout. A quick prototype of cone mode sparse-checkout demonstrated that Git could reach similar performance as VFS for Git, especially when paired with the filesystem monitor hook. Our critical performance measurement was the git status command, and we were seeing performance within three or four seconds, which was close to the typical case in VFS for Git.
This was promising enough to move forward with a full prototype. We decided to make this a separate project from VFS for Git, so it needed its own name: Scalar.
Throw the first one away
Once we had a handle on Git command performance using Git’s sparse-checkout feature, we needed to adapt all of the code that allowed fast clones and fetches to work within that environment. For most Git hosting services, Git’s partial clone feature is the best way to solve for fast clones and fetches. However, Azure Repos has an earlier version that was built for VFS for Git called the GVFS protocol. We needed a way to speak the GVFS protocol to bootstrap clones and to dynamically fetch missing objects during Git commands.
This was our first point of asking, “Should we rewrite, or refactor?” The VFS for Git codebase already had all of the client-side code for speaking the GVFS protocol. Not only that, it also had a large set of end-to-end tests that constructed a complete clone from Azure Repos and then ran thousands of Git commands in that environment to make sure they operated exactly the same as a normal Git clone. Since those tests were a significant asset, we set out to construct the first version of this new project starting with the VFS for Git code.
In this initial prototype, we just wanted to get things working for the end-to-end tests to pass. This process included disabling the virtual filesystem code, but leaving all of the hooks that enabled the GVFS Protocol. We also needed to set up sparse-checkout at clone time before initializing the HEAD reference. This prototype was so rough it still didn’t have the Scalar name: it still operated as if it was the gvfs command-line interface.
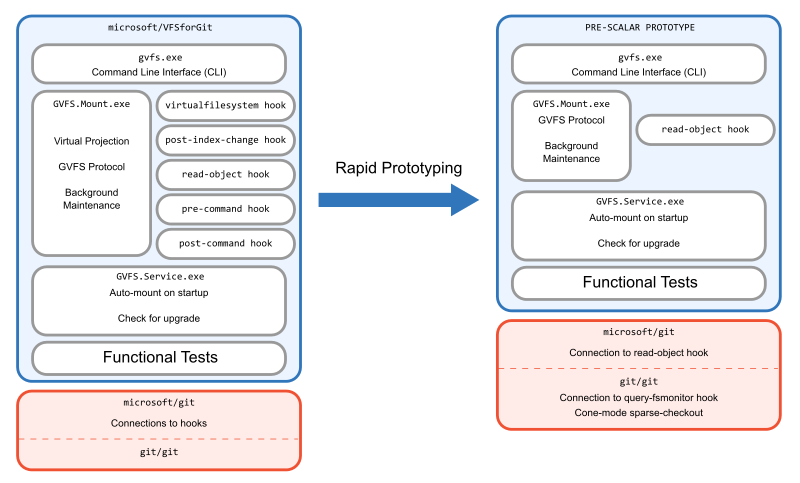
The end result wasn’t pretty. We couldn’t hope to ship it since it would break compatibility with previous VFS for Git versions. The tests were cobbled together to make things work, but we had disabled sparse-checkout in the tests since the previous tests assumed that every path could be populated dynamically with the virtual filesystem. However, we got to a point where we could reliably create this new repository setup and measure its success. Since the clones were doing the exact same thing as in VFS for Git, the performance matched exactly. Now, we needed to rebuild it, and do it the right way.
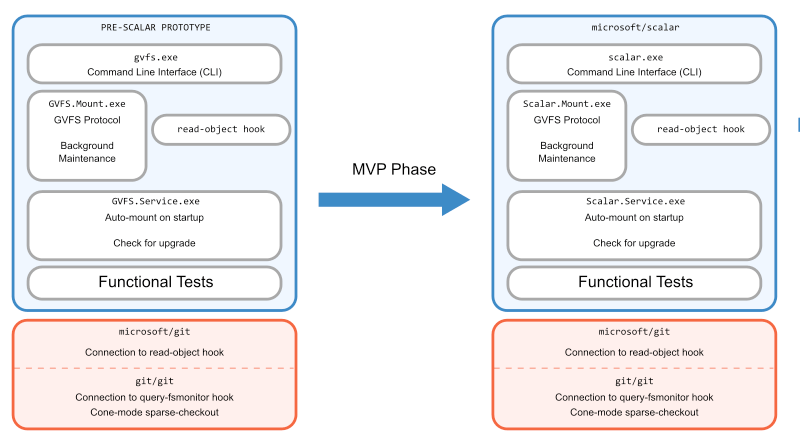
Get to Minimum Viable Product (MVP)
From the success of our initial prototype, we moved on to creating an MVP that we could demo to internal users. Here is where we created the Scalar name, the microsoft/scalar repository, and started doing thorough reviews of all changes.
As a team, we decided it would be best to create a new repository rather than to build the project within the VFS for Git codebase. We did not want to be locked into the architecture of VFS for Git as we moved forward, and we also wanted to take advantage of the commit history for the code in the repository. The first task in creating the new project was renaming all references to the old project.
Updating tests
The next step we had to do was to make sure that we were sufficiently testing the sparse-checkout environment. Recall that we used the full worktree to get tests passing in the prototype, but now we needed to actually be sure that our sparse-checkout environment would work properly.
For this, we found a minimal set of patterns that would include all of the concrete paths used by the test suite.
Then, we made sure that there were interesting changes happening outside of those patterns that would exercise Git features like git merge or git cherry-pick in interesting ways outside of the sparse-checkout definition.
Finally, we added specific tests that involved changing the sparse-checkout definition to make sure that Git would properly fill in the missing files. In this way, we were able to keep all of the existing tests while also adding new tests that were specific to our environment.
Evaluating the MVP
After completing the product changes and test updates, it was time to evaluate the solution. We ran performance numbers to ensure they matched what we saw in our prototype phase. We created local clones to use in daily work to try and catch any lingering bugs.
But it all came down to evaluating the solution with internal users. We demoed Scalar directly with the Office engineering system team and asked pointed questions about whether this would work for them.
In particular, we were worried about the performance of git checkout. In VFS for Git, git checkout is extremely fast because it doesn’t actually do much work. It clears the filesystem of concrete files and replaces them with virtualized files. The cost of populating the filesystem comes later when those files are read by an IDE or a build process. With Scalar, the filesystem is populated within the git checkout process, so that work is now upfront and clear to the user.
By working directly with the engineering system team, we learned that this git checkout performance was not an issue. Since git checkout changes source files, it invalidates the local build. Build times can take hours in this monorepo after taking new changes, so users typically do not use git checkout until the end of the day when they are ready to trigger a long build overnight. For this reason, git checkout was not a critical path for their developers. In fact, there was great interest in being able to know that they could disconnect from the network and still poke around the code without risk of finding a virtual file.
We were good to go with our plan for Scalar. However, the monorepo team needed to build something of their own. They needed a connection between their build system and sparse-checkout. While they built that, we had time to polish Scalar and make it easier to install and use.
Update architecture under stable conditions
With the benefit of a stable test suite and a few months of runway, we were able to take our MVP and rethink the architecture. In particular, we shed some architectural decisions that were critical to how VFS for Git works, but were no longer needed in Scalar.
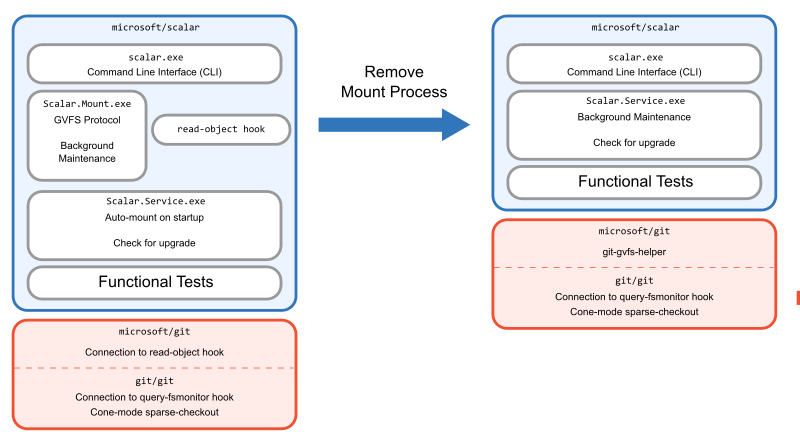
VFS for Git requires a process running that can handle requests from the filesystem to populate virtualized content on-demand. The existence of this process creates the concept of a “mounted” repository, and even included the commands gvfs mount and gvfs unmount to toggle this state.
Because this process needed to exist, a lot of other things were placed in that process that could be relocated elsewhere in Scalar. We set out to remove the need for this process.
Since we had already removed the virtual filesystem code, there were two remaining pieces that were in the mount process: performing background maintenance and downloading objects via the GVFS protocol.
For background maintenance, we took the fastest approach and moved the scheduled tasks out of the mount process and into the Scalar.Service global singleton process. We had versions of this service for Windows and macOS to handle things like startup operations. Moving the maintenance tasks to this service was quick and easy.
For the object downloads, it was a bigger job. The existing architecture included a read-object hook custom to microsoft/git that was installed by the scalar clone command, and that hook communicated to the mount process which actually communicated with the server and placed the objects in the repository.
For this, we created a tool within microsoft/git to do these missing object queries via the GVFS protocol directly within the Git codebase. This tool lives underneath the code that fills in objects for Git’s partial clone feature. By connecting this tool to partial clone, we could work to improve partial clone while also helping Scalar users at the same time. One major benefit to working within the partial clone framework is that some missing object requests can be batched together into a single request, while the old read-object hook could only ask for one missing object at a time.
Finally, there was nothing important remaining in the mount process, so we deleted it. In addition, we were able to delete the old Git hook.
At this point, we had simplified the architecture to have fewer moving parts and were ready to ship internally.
Upon success, look for low-hanging fruit
Shortly after announcing Scalar to the world, we realized that Scalar could have a larger benefit to the Git ecosystem than just very large monorepos using Azure Repos.
We extended scalar clone to use Git’s partial clone if the remote did not speak the GVFS protocol. In this way, scalar clone became something a user could run against any Git remote.
This was an inflection point in our lifecycle: we had accomplished what we set out to do, but wanted to put these tools in front of more people and find a wider audience. We started to shift our focus from making updates in the .NET project and instead contributing features to the upstream Git project.
Rethink architecture as conditions change
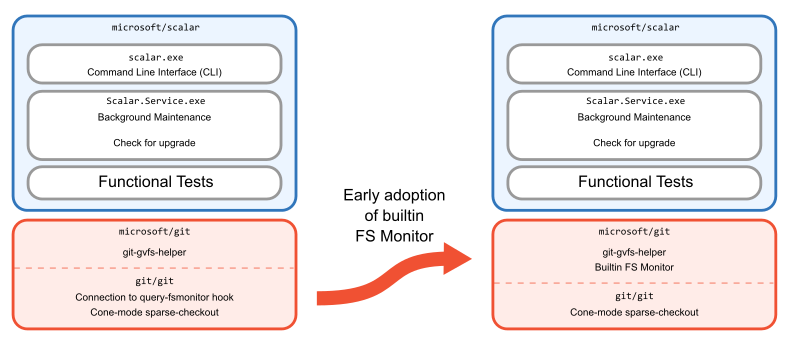
Up until this point, we were using the existing hook approach that speaks to a third-party filesystem monitor. This meant that we needed to install that third-party tool next to Scalar, but also scalar clone would install the hook in addition to all of its other operations. We realized that we could solve our installation complexities, reduce the complexity of scalar clone, and get faster performance if the filesystem monitor was built into Git. With that context, we began building Git’s builtin filesystem monitor. We took early versions into microsoft/git while it was reviewed carefully by the Git community.
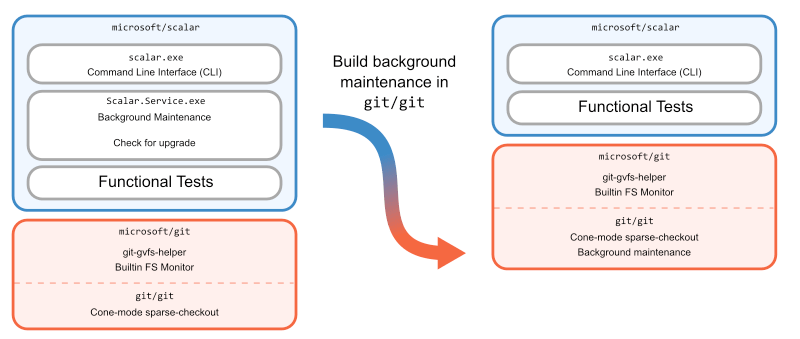
An important Scalar feature was background maintenance, which was accomplished by a service running in the background and launching Git commands at certain intervals to keep data fresh and well-organized. This service existed from the VFS for Git days, so it was easy to keep using it on Windows and macOS. However, when the Office team told us that they needed Linux clients to support some of their web developers, we focused on porting Scalar to Linux. This service was one platform-specific part that would be difficult to implement in .NET.
We decided that instead of creating a new service in Scalar, it would be better to implement background maintenance in Git. Once Git had its own cross-platform way of doing maintenance, Scalar could stop using its custom logic and instead rely on git maintenance run.
We then removed the service from Scalar.
After making this change, we took another look at our architecture and realized something. Suddenly, Scalar was only a command-line interface on top of Git. Why have it be in C#, separate from the Git source code?
The overhead of dealing with Scalar as a .NET tool was colliding with our maintenance costs of creating releases and shipping it to users. If Office developers require the microsoft/git fork of Git and another tool then things get tricky when we want to release a new version.
We had replaced so many features in the Scalar codebase with Git functionality that starting from a clean slate could allow us to build a more manageable architecture than that of the existing code. Also, by inserting the Scalar CLI into the Git codebase, we could take advantage of internal functions such as using Git config APIs instead of running git config processes to set recommended config values.
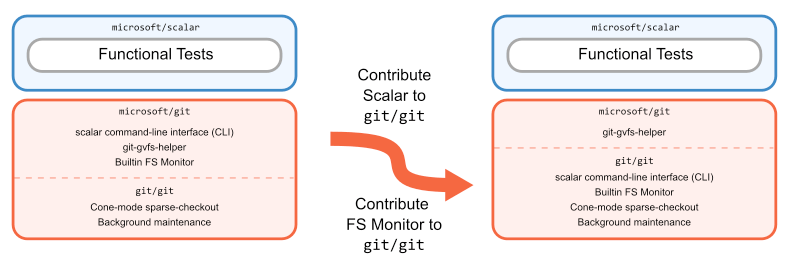
With these goals in mind, we ported the Scalar CLI to C in microsoft/git using less than 3,000 lines of code!
This endeavor to recreate the Scalar CLI in the microsoft/git codebase can best be appreciated by seeing that we deleted over 10 times the amount of code from microsoft/scalar than we added to microsoft/git when we removed all product code. We kept the microsoft/scalar repository around as a collection of tests, allowing us to be confident in the new code.
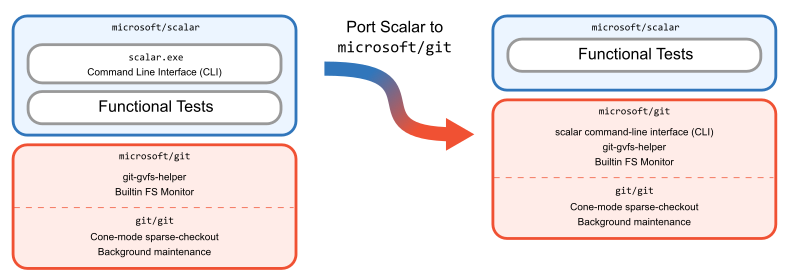
This was our biggest step in the journey because it involved the largest rewrite of Scalar code. However, the requirements of the Scalar CLI at this point were well-defined and greatly simplified from earlier. We were able to immediately celebrate by no longer shipping the .NET Scalar application to our internal customers and instead rely on just shipping the microsoft/git fork.
There was one downside to this change, though. Before, you could install the .NET Scalar solution on top of any Git version and still get all the benefits of scalar clone. Now, users needed to replace their Git client with microsoft/git in order to get the latest Scalar version. We wanted to make Scalar useful to everyone, not just those that were willing to install our fork.
The journey into core Git
Porting Scalar to C not only enabled hosting the tool in microsoft/git, it opened up the possibility of making Scalar part of the upstream Git project. Although it wouldn’t be the first feature originating in microsoft/git that was contributed upstream, there was no clear precedent for something like Scalar: a standalone executable whose name didn’t start with git in the Git project. That might sound like nothing more than an implementation detail, but it represented a philosophical departure from the existing tools in Git. This divergence would drive us to define what Scalar meant for Git.
contrib/-uting to Git
From the outset, we knew there was a contingent of Git users that would benefit from Scalar beyond microsoft/git‘s typical user base. Features like the filesystem monitor, background maintenance, cone mode sparse-checkout, etc. had all become popular among developers in large repositories. Scalar exposed those and a multitude of other features more readily to users. Still, it wasn’t clear that Scalar as a standalone executable was the best—or Git-friendliest—way to present those features.
To gradually introduce the tool to the Git community, Scalar’s journey upstream began in Git’s contrib/ directory. From the contrib/ README:
Although these pieces are available as part of the official git
source tree, they are in somewhat different status.  The
intention is to keep interesting tools around git here, maybe
even experimental ones, to give users an easier access to them,
and to give tools wider exposure, so that they can be improved
faster.
Despite the loose requirements of contrib/, the submitted version of Scalar still required some changes from what was in microsoft/git. First was removing the GVFS protocol-supported clones. As we mentioned earlier, blobless clones were introduced into Scalar as a fallback for clones using the GVFS protocol, so the upstream version defaulted to using blobless partial clones instead. Additionally, to preserve the separation between contrib/ and the main Git repository, the GitHub Actions workflow was also stripped of references to Scalar, including execution of the microsoft/scalar test suite.
However, being in contrib/ did have some drawbacks. In order to build and install Scalar, a user needed to not only build Git from source, but know to navigate into contrib/scalar/ and build that as well. The separate build and test process also left it prone to changes in the rest of Git unintentionally breaking it. Even with these challenges, this arrangement was exactly what Scalar needed while its features were built out and long-term plan was developed. As we drew closer to finishing those features, we needed to finally answer the question: what should we do with Scalar?
Home sweet home
As soon as the possibility of upstreaming Scalar materialized, there were lots of ideas about what its final form would look like. One popular idea—which can be found in the original RFC—was to dissolve Scalar into a collection of new git commands and options to existing commands. Another was to have scalar reside in the Git tree in a dedicated subdirectory, like gitk. Another was to reimagine it as a Git built-in command: something like git scalar. Along with these implementation decisions came overarching questions of maintenance and relevance to Git.
As the tool was nearing feature completion upstream and the downsides of contrib/ isolation were weighing on the project, we took a step back and revisited the questions of Scalar’s identity. The result was a proposal to update Scalar’s documentation and outline a three-part approach to making the tool generally available in Git:
- Add any remaining large repo performance features to Scalar.
- Extract the parts of Scalar that are generally applicable to all Git users into built-in commands and/or options.
- Move Scalar into the root tree of Git, built and installed as a standalone executable alongside
git.
The crux of this approach was a new framing of Scalar within the Git project. Scalar began, like VFS for Git before it, as a tool with its own features and opinions: how to configure a repository, what workflows to use, etc. As it evolved, those features and opinions were folded into Git or adjusted to align better with the upstream project, leaving Scalar with only the parts that fit the very specific role of configuring large repositories. In essence, Git had a user experience niche left by its myriad of large repo-focused performance features. Scalar filled that niche.
The roadmap to Scalar’s completion emerged from this philosophy. First, a few more particularly impactful features would be added to it (namely, the built-in FSMonitor). Then, because Scalar’s purpose is to configure features for large repositories that aren’t set up by default in Git, the parts that serve all Git users (such as repository diagnostics in scalar diagnose) would be extracted into new or existing Git commands. Finally, Scalar would be moved out of contrib/ and into the main build of the repository, intended to continue existing as a dedicated tool for managing large Git repositories.
The best laid plans often go awry but, fortunately, this one didn’t. Over the course of three upstream patch series, Scalar was streamlined inside of contrib/, then moved into its new home as part of core Git. And just in time for the v2.38.0 release!
The past, present, and future of Scalar
We’ve shared the story of Scalar not only to publicize a new and exciting feature in Git (seriously, go try it!), but also to illustrate one of the many paths an open source project can take to reach its users. Planning and re-planning, designing and redesigning, and no shortage of engineering lessons were all necessary steps to make Scalar the powerful tool it is today.
It is now a fully-integrated part of Git, but Scalar’s journey is far from over. Scalability and performance in Git is a hot topic—our own engineering blog is a testament to that—and consistent improvement in that area will undoubtedly be part of Scalar’s future. Today, though, Scalar’s eventful history is what has shaped it into the best way to unlock Git’s full potential on your largest repositories.
Some remotely exploitable kernel WiFi vulnerabilities
Post Syndicated from original https://lwn.net/Articles/911062/
It would appear that there is a set of
memory-related vulnerabilities in the kernel’s WiFi stack that can be
exploited over the air via malicious packets; five CVE numbers have been
assigned to the set. Fixes are headed toward the
mainline and should show up in stable updates before too long; anybody who
uses WiFi on untrusted networks should probably keep an eye out for the
relevant updates.
[$] A first look at Rust in the 6.1 kernel
Post Syndicated from original https://lwn.net/Articles/910762/
There have been a lot of significant changes merged into the mainline for
the 6.1 release, but one of the changes that has received the most
attention will also have the least short-term effect for users of the
kernel: the introduction of support for the Rust programming language. No
system with a production 6.1 kernel will be running any Rust code, but this
change does give kernel developers a chance to play with the language in
the kernel context and get a sense for how Rust development feels. Perhaps
the most likely conclusion for most developers, though, will be that there
isn’t yet enough Rust in the kernel to do much of anything interesting.
PostgreSQL 15 released
Post Syndicated from original https://lwn.net/Articles/911044/
Version 15 of the PostgreSQL database management system is out.
PostgreSQL 15 builds on the performance improvements of recent releases with
noticeable gains for managing workloads in both local and distributed
deployments, including improved sorting. This release improves the developer
experience with the addition of the popular
MERGE
command, and adds
more capabilities for observing the state of the database.
There are a lot of changes in this release; click below for the details,
and see the
release notes for more.
Security updates for Thursday
Post Syndicated from original https://lwn.net/Articles/911042/
Security updates have been issued by Debian (libreoffice, rexical, ruby-nokogiri, and squid), Fedora (wavpack), Red Hat (expat), SUSE (gdcm, orthanc, orthanc-gdcm, orthanc-webviewer and rubygem-puma), and Ubuntu (GMP and unzip).
Digital License Plates
Post Syndicated from Bruce Schneier original https://www.schneier.com/blog/archives/2022/10/digital-license-plates.html
California just legalized digital license plates, which seems like a solution without a problem.
The Rplate can reportedly function in extreme temperatures, has some customization features, and is managed via Bluetooth using a smartphone app. Rplates are also equipped with an LTE antenna, which can be used to push updates, change the plate if the vehicle is reported stolen or lost, and notify vehicle owners if their car may have been stolen.
Perhaps most importantly to the average car owner, Reviver said Rplate owners can renew their registration online through the Reviver mobile app.
That’s it?
Right now, an Rplate for a personal vehicle (the battery version) runs to $19.95 a month for 48 months, which will total $975.60 if kept for the full term. If opting to pay a year at a time, the price is $215.40 a year for the same four-year period, totaling $861.60. Wired plates for commercial vehicles run $24.95 for 48 months, and $275.40 if paid yearly.
That’s a lot to pay for the luxury of not having to find an envelope and stamp.
Plus, the privacy risks:
Privacy risks are an obvious concern when thinking about strapping an always-connected digital device to a car, but the California law has taken steps that may address some of those concerns.
“The bill would generally prohibit an alternative device [i.e. digital plate] from being equipped with GPS or other vehicle location tracking capability,” California’s legislative digest said of the new law. Commercial fleets are exempt from the rule, unsurprisingly.
More important are the security risks. Do we think for a minute that your digital license plate is secure from denial-of-service attacks, or number swapping attacks, or whatever new attacks will be dreamt up? Seems like a piece of stamped metal is the most secure option.
A taxonomy of Computing content for education
Post Syndicated from James Robinson original https://www.raspberrypi.org/blog/taxonomy-computing-content-computer-science-education/
Supporting educators to provide high-quality computing education has always been integral to our mission. In 2018, we began creating more learning resources for formal education settings. The UK government had recently announced future investment in supporting computing educators. Schools in England were offering the national Computing curriculum established in 2014. (In the USA, a more common term for prescribed education content is ‘standards’.)


England’s Computing curriculum requires that all learners be taught the subject between ages 5 and 16, and it consists of only 25 statements outlining expectations for learners. To accompany this curriculum, we started developing a framework to help us describe the subject of Computing, and in particular the common threads running through it.


A 2012 report by the Royal Society presented the breadth of computing by dividing it into three areas: information technology, computer science, and digital literacy. Although this goes some way to describe computing as a discipline, in our view this model creates artificial divides between aspects of the subject according to whether they are seen as more or less technical. Our more holistic view of computing recognises that concepts and skills within the subject are far more interconnected.
Principles for our taxonomy
When we set out to develop our framework, the goal was to provide a way to look at and describe the subject of Computing as a set of interconnected topics; the framework doesn’t define standards or curricula. There are, of course, many ways of organising the subject matter, implemented through exam specifications, textbooks, schemes of learning, and various progression guides. For our framework, we reviewed examples of each of these, from England and beyond, and decided on some organisational principles:
- Our framework should describe the whole of Computing, incorporating computer science, information technology, and digital literacy
- The framework should be applicable across primary and secondary education, meaning it should be useful for categorising the knowledge encountered by all learners, from five-year-olds to our oldest secondary school students
- While inspired by England’s national curriculum, the framework should be independent of any particular exam specification and capable of adaptation to new curricula
- The framework should represent Computing as a discipline that combines a broad mixture of concepts and skills
Developing the taxonomy
Following these principles, we identified ten content themes, or strands, that thread through a learner’s journey in Computing education. We call this framework representing the knowledge and skills that make up the subject our Computing taxonomy. As the Foundation is part of the consortium that established the National Centre for Computing Education in England, our taxonomy became a cornerstone of the work of the Centre, providing a common language to describe Computing in English schools.
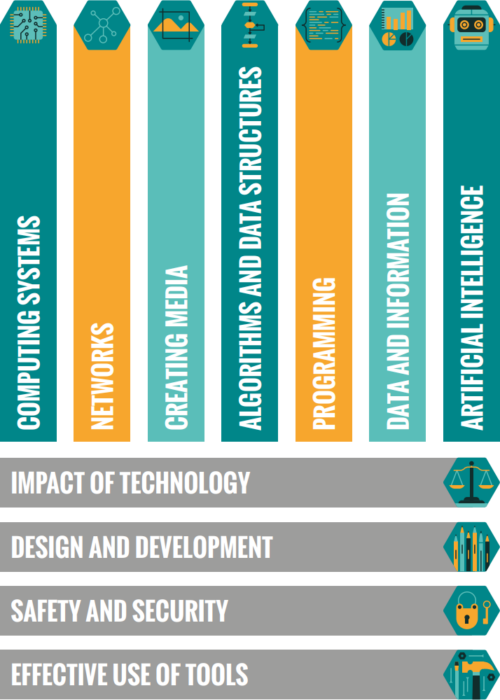
Computing is, of course, a constantly evolving field and as such, our taxonomy evolves with it. Since 2018 we’ve iterated our taxonomy to incorporate new things we’ve learned, for example relating to the rapid developments of artificial intelligence (AI) technology in recent years. AI now is a significant area of study and represented as its own strand in our current taxonomy, bringing the number of strands up to eleven:
- Effective use of tools
- Safety and security
- Design and development
- Impact of technology
- Computing systems
- Networks
- Creating media
- Algorithms and data structures
- Programming
- Data and information
- Artificial intelligence
Given the interconnected nature of Computing, we embrace a best-fit approach to content categorisation, choosing the most appropriate strand(s) for each idea. In developing our Computing taxonomy, we determined that four of the strands (the horizontal strands in the diagram) were best taught interwoven with the others, in context rather than as discrete topics. A good example of this is the strand ‘Safety and security’, which focuses on supporting learners to realise the benefits of digital technology without putting themselves and others at risk. While it would be possible to teach this strand as one discrete set of lessons, revisiting it throughout a learner’s journey provides regular reinforcement as well as grounding in the context of other strands.


Within the strands, we have also identified progressive learning outcomes for each stage of learning. These learning outcomes are illustrative of the kinds of knowledge and understanding that learners could develop in each area of Computing. They are not prescriptive and instead aim to illustrate the wide applications of the discipline.
Coming soon: The Big Book of Computing Content
On 24 October, we will publish The Big Book of Computing Content. Framed by our taxonomy, The Big Book of Computing Content presents our work so far in describing the diverse range of concepts and skills that comprise Computing. It also includes the illustrative learning outcomes we’ve identified.

This will be the second special edition of Hello World, our free magazine for computing educators. The new Big Book complements our first special edition, The Big Book of Computing Pedagogy, in which we lay out 12 key principles for teaching the subject.
The Big Book of Computing Content will be available in print and as a free PDF download; if you subscribe now, you’ll receive the PDF in your inbox on publication day.
Share your thoughts on our taxonomy
We hope our taxonomy and the new Big Book enable you to reflect on the breadth of Computing and resonate with your teaching. Please share your reflections, in the comments below or by tagging us on social media, if you’d like to help us develop the taxonomy further.
The post A taxonomy of Computing content for education appeared first on Raspberry Pi.
Бнаките вдигат лихвата, кога и с колко ще нарастнат вноските по кредитите?
Post Syndicated from VassilKendov original http://kendov.com/interest_rates_going_high/
 Банките Вдигат Лихвата, Кога и с Колко ще Нарастнат Вноските по Кредитите?
След като отчетоха рекордна печалба на полугодието от 1 млрд. лева (ръст от 55%), банките започнаха да вдигат и лихвите по кредитите. За да разберем кога това е мотивирано, ще трябва да обърнем внимание на начина на формиране на лихвата и причините за нейното повишение.
ФИРМЕНИ КРЕДИТИ – те са първите, които вече усещат промяната
Фирмите нямат тази законова защита от едностранно вдигане на лихвата, която имат физическите лица. Имаме „Закон за потребителския кредит” и „Закон за кредитите за недвижими имоти на потребители”, но нямаме Закон за фирмените кредити. В този ред на мисли, банките имат правото да определят лихвата и методиката за промяната й както преценят. Въпреки това тяхната лихва се определя по някаква методика, която ще разгледаме след малко.

Как се стигна до вдигане на лихвите?
Това което трябва да знаете е, че ВИСОКА ИНФЛАЦИЯ = ВИСОКИ ЛИХВИ
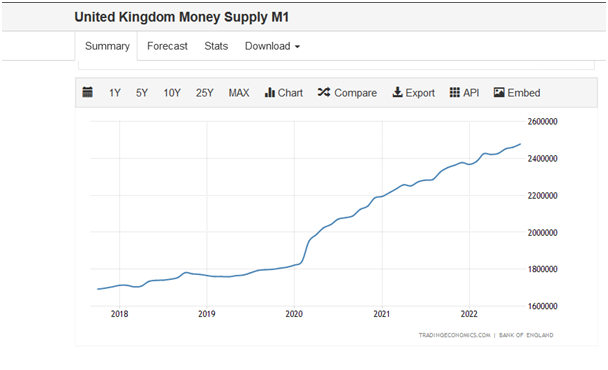
Високите лихви са в основата на борбата с инфлацията. На практика от 2008г. централните банки по света правят така наречените „Количествени облекчения”. Няма да се спирам на механизма на тези Количествени облекчения, но в крайна сметка те водят до увеличение на паричната маса в обращение (някои го наричат жаргонно печатане на пари, макар да има разлика), оттам и инфлация.
А паричната маса в обращение нарастна в пъти, особено след COVID мерките.

Подобна е графиката за всяка голяма централна банка в света – ECB, Bank of England, Bank of Japan…
При нивото на кредитна задлъжнялост в САЩ и ЕС, вдигането на лихвите директно се отразява в спад на печалбите, потреблението, нарастване на вноските по жилищни и потребителски кредити и в крайна сметка в рецесия.
Другият начин за избягване на рецесията е участието във война, но това е отделна тема, която дискутирам на Фейсбук профила си. Сега говорим за лихвите.
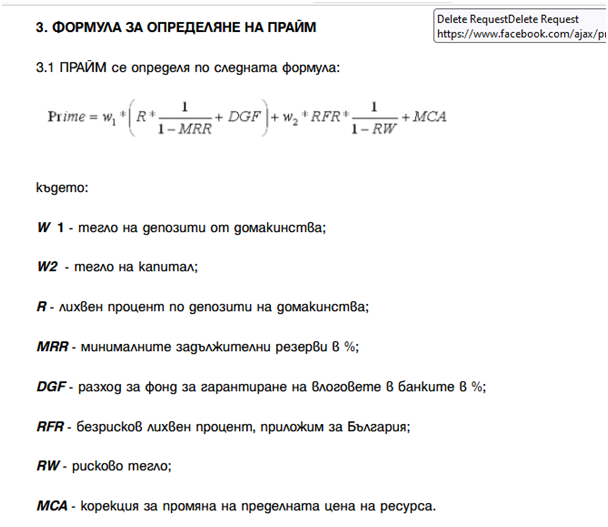
Начинът по който се образува лихвата, предопределя и нейното покачване
1. Съществуващи пазарни индекси + Надбавка
Има най-различни пазарни индекси. У нас най-често се изпозлва EURIBOR. Той се обявява от Европейската банка и когато сте теглили кредит в Евро банките, които го изполват образуват лихвата по следния начин:
EURIBOR + фискирана надбавка = ЛИХВА
EURIBOR-ът може да бъде месечен, годишен, тримесечен и щестмесечен. В зависимост от това, промяната му в лихвата се отразява веднага или след няколко месеца.
Ето как се е движил едномесечния EURIBOR във времето

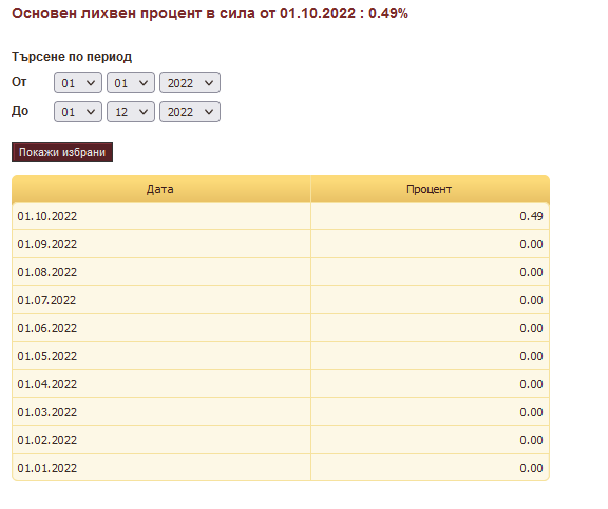
Друг пазарен индекс е познат като Основен лихвен % на БНБ. Предполагам повечето хора са чували за него. Той се изчислява на основата на друг индекс, наречен LEONIA +, отново изчисляван и публикуван от БНБ.
В банковите договори съм срещал и двата индекса при формирането на лихвата.
За срещи и консултации по банкови кредити и неволи, моля използвайте посочената форма.
[contact-form-7]
2. „Измислени” пазарни индекси. – Нашето законодателство не е конкретизирало пазарните индекси, които да участват във формирането на лихвата. Дадена е възможност да се избира или съставя такъв индекс. И банките се възползвта от тази възможност и, въпреки че в закона е записано как „Условията и методиката за промяна на лихвата по кредита, трябва да бъдат написани на прост и разбираем за кредитоискателя език”, някой банки са склонни буквално към извращения. Ето примерно пазарния индекс „Пайм” на Пощенска банка.
Ако не можете да се ориентирате, не се притеснявайте. Аз също не мога, а това ми е работата.
Просто клиентите с такъв начин на образуване на лихвата, не могат да се ориентират с колко и кога би трябвало да се повиши лихвата им, респективно вноската. Те са се оставили на милостта на банката и БНБ, която пък твърди, че контрола над тези индекси не е в нейния ресор.
Повишаване на вноските по кредитите
Какъвто и индекс да се използва при формирането на лихвата по кредита, ВНОСКАТА ЩЕ СЕ ПОВИШИ ако пазарните индекси се повишат. Обратното естествено не винаги е вярно, но това е въпрос на допълнителни клаузи в договорите за кредит.
Забелязвате, че последните месеци пазарните индекси са се повишили (EUIBOR, LIBOR, ОЛП на БНБ) като следствие на инфлацията. Колкото е по-голяма тя, толкова повече ще се повишат и лихвите по кредитите (респективно вноските). А тенденцията тепърва започва.
Какво да очакваме?
Към днешна дата на финансовите пазари в UК е тотален хаос. Няколко големи европейски банки също се клатят и очакват държавна помощ. Помните какво стана при предходната криза с Lehman Brothers? Само Deutsche Bank е 3 пъти по-голяма от Lehman, а се налага за 3-ти път да я спасяват в рамките на 7 години. Като се казва „спасяваме”, разбирайте да измислим механизъм с който да „налеем” пари в нея. Както казахме, всяко наливане на пари в условията на инфлация, води до още по-голяма инфлация, репективно лихви. В UК миналата седмица „наляха” пари в пенсионната си система за да не фалира.
Към днешна дата лихвите по ипотечни кредити в UK и USA са 7%. В България са 2.5-3%.
Мислите ли че нашият имотен пазар е по-стабилен и по-доходоносен от Американския или Английския, че лихвите да бъдат по-ниски? Къде е по-добре да давате имот под наем, в Лондон или в София?
У нас просто тенденцията идва със забава от 6-10 месеца.
Лихвите се качват и ще продължат да се качват. Моето лично мнение е, че в рамките на година ще недхвърлят 10%. Първи ще го усетят фирмите, поради липсата на законодателство, което да ги защитава. В тази връзка е добре да се приготвят и да не чакат последния момент. Правим такива консултации, а скоро възнамерявам да направя и курс по фирмени и лични финанси във време на криза.
Вземете мерки – време е!
За отбрана информация касаеща кредитирането и лихвите, моля последвайте ме в Телеграм канала Kendov.com
За срещи и консултации по банкови кредити и неволи, моля използвайте посочената форма.
[contact-form-7]
The post Бнаките вдигат лихвата, кога и с колко ще нарастнат вноските по кредитите? appeared first on Kendov.com.
[$] LWN.net Weekly Edition for October 13, 2022
Post Syndicated from original https://lwn.net/Articles/910503/
The LWN.net Weekly Edition for October 13, 2022 is available.
How Product Teams Can Build Empathy Through Experimentation
Post Syndicated from Netflix Technology Blog original https://netflixtechblog.com/how-product-teams-can-build-empathy-through-experimentation-6253603880a6
A conversation between Travis Brooks, Netflix Product Manager for Experimentation Platform, and George Khachatryan, OfferFit CEO
Note: I’ve known George for a little while now, and as we’ve talked a lot about the philosophy of experimentation, he kindly invited me to their office (virtually) for their virtual speaker series. We had a fun conversation with his team, and we realized that some parts of it might make a good blog post as well. So we jointly edited a bit for length and clarity, and are posting here as well as on OfferFit’s blog. Hope you enjoy the result. — Travis B.
George Khachatryan: Travis, could you tell us a bit about your background and how you came to your current role?
Travis Brooks: I’m the product manager (PM) for the experimentation platform. So my job is to make sure that all the tooling and infrastructure we have at Netflix for experimentation does what it needs to do, and to set the road map for the next year or more for what we’re building.
I started out in physics, but ended up not doing that. Instead, I started leading an information resource for particle physics literature. One of the things we ran up against was we didn’t really have enough users to run experiments. We were all experimental physicists at heart and we wanted to make decisions on some sort of principled basis, but we didn’t actually have enough users to get statistical significance.
At the same time, I had an opportunity to go join Yelp as the first product manager there for search, where there were many more users. And so I did that and spent some time building out search algorithms and recommendation engines at Yelp.
I came to Netflix about three years ago, and first led a team of data scientists responsible for front end experimentation — basically everything you see on the Netflix platform. And then in the last year, I’ve been the PM for all of our experimentation infrastructure and platform.
George Khachatryan: So over the last decade, a lot of tech companies have been increasingly embracing user centric design — it’s kind of become the accepted wisdom. And a lot of non-tech companies also are increasingly trying to be customer centric in their thinking. How would you define user centric design and what role do you think experimentation plays in it?
Travis Brooks: Let me say first that I’m talking here about my own experiences. I’m not speaking for Netflix.
But what I can say is that broadly, I think user centric design is really about empathy. And as a person who’s been both a user facing PM and a tools PM, having empathy for your user is one of the core traits that defines good product management. So when we say “user centric”, we’re just saying, “Hey, really lean into empathy.”
When you’re building things, whether you’re a visual designer, or a designer of an API, or a PM, or anybody who’s building something, lean into trying to put yourself in the shoes of the user. And if you can do that, not just at the beginning when you write down the specs, but all the way through the process, you make a better product in the end.
In the act of building we tend to get really entranced by the technical problem and solving that problem. And in fact, it’s probably necessary to lose sight of what the end user is going to experience in order to build the best technical solution. So to build products that are effective for the user we need that user perspective brought back into focus pretty regularly — “Oh, wait, here’s what the end user is going to experience” Or, “Oh yeah, actually we don’t even need to solve that really challenging, interesting technical problem over there, because the end user is only going to experience this part over here.” To me, that’s what user centric design means.
How do we make sure that in all aspects, whether it’s an API, or the front-end visual design, we’re centering the user? How are they going to experience this product? What are their pain points? Is what we’re doing actually connected to that end user?
George Khachatryan: And what role does experimentation play, if any, in building empathy?
Travis Brooks: This is really a PM’s role — to ensure that the team that’s building something is maintaining that level of user empathy. But then you have to ask, “How does the PM know what users want?” Right? They’re not magic. A good PM doesn’t spring fully formed from the head of Zeus with all the knowledge of what users want. How do they get that knowledge? I think there are four ways.
1. One way is if you’re PM-ing a product that you yourself use. It’s the cheapest and maybe the lowest fidelity way of building empathy. “Okay, well, I’m a user so I know what users feel because I use the product”. It’s low fidelity because it’s an N of 1, and you’re certainly not a typical user. You’re a PM. You have a way different way of interacting with products than most people.
2. Typically the next thing people do is they start talking to users. And if they’re smart, they start talking to people who are not like them. “Hey, how do you use this product? What do you value? What do you find painful about it? How often do you use it? Why don’t you use it more? When was the last time you used it? What were you trying to do? Did you achieve that?” — all those typical user research questions that PMs ask. Really good user researchers get into this sort of qualitative research, and that’s a great way to build broader empathy, at a higher fidelity level, than just, “I use my product.”
3. Then you get to a scale where you have a lot of users, and talking to them becomes an art of “How do I get a representative sample from this broad population?” And you start to worry that maybe their memory isn’t quite perfect. Users are self-reporting how they use things, but that’s not actually how they use things. We know people have a lot of cognitive biases in that way. So then you start getting into observational data, and you say, “well, okay, people report that they use the product once a week. If I go look at data, I can see people use the product three times a week, so I can tell that what they report isn’t quite what happened.” Adding this observational data layer makes user research much higher fidelity. Of course, it’s higher cost and may take some time and some effort and investment.
4. But even that observational data layer doesn’t really help you understand how people use the product at the level of a deep causal connection. The end game of trying to understand the user is, “if I do X, users respond this way”. And the only way to establish that causal connection — maybe not the only way, but the most reliable way, the highest fidelity way — is to show a random sample of your users X and see how they differ from the rest of your users who didn’t see X. That’s the core of experimentation: a high cost, high fidelity, arguably lower speed, way to build empathy. It’s probably not the first place you’re going to turn to build empathy, but you’re going to get there and you’ll eventually need to have it in your arsenal.
George Khachatryan: Yeah. So you talk about the importance of building an experimentation culture. Can you explain what the main elements of such a culture would be, in your view?
Travis Brooks: I think having a sense of humility is super important. If you read our blog posts, or posts from anybody who does massive scale testing such as Microsoft, you see that they test, and most of their treatments fail. And those are treatments from expert designers and PMs and engineers who have the best context, the best user research. Especially as your product matures, it is hard to improve upon. Even a less mature product is hard to improve upon, because it turns out our intuition is pretty good. We understand what users need. It’s just not a very reliable mechanism. So most treatments that we come up with fail, which means you have to have a lot of humility.
You can’t get married to your ideas and say, “I’m going to do an experiment; this is going to blow the world away.” And you end up wasting a lot of time and effort trying to show that your treatment is good, even if it’s not. You miss the bigger picture, which is, “Hey, you tried something. It didn’t work. What can you learn from that experience to inform the next treatment?”
The cultures where people can be really successful in experimentation involve a lot of humility, which encourages that sort of iterative approach. “I’m guessing this is not going to work because I can see from history most of these things don’t work. What I’m going to do is put it out there and I’m going to learn from it. Maybe I’ll get lucky and it’ll work right off the bat, but maybe I won’t. I’ll learn from the next two tests, and I’ll get to someplace where I can actually solve this problem.”
The other thing I think is important is having a culture of open debate, where decisions are made out in the open. The more open your decision-making, the louder a voice data has. When decision-making gets closed, into one person’s office or one person’s head, it’s hard. Often when people debate and they can’t agree, they turn to data, because it’s a lot harder to disagree with that. And so if you want an experimentation culture, if you want data, have open debate. Have open decision making. Then people more clearly see that they need data, that they need to experiment.
So yes, I think that humility and open decision-making are really important.
![]()
How Product Teams Can Build Empathy Through Experimentation was originally published in Netflix TechBlog on Medium, where people are continuing the conversation by highlighting and responding to this story.
Let’s automate YOUR ideas for electricity
Post Syndicated from BeardedTinker original https://www.youtube.com/watch?v=FYDK3atxV3U
[$] (Re)moving outdated Python tools and scripts
Post Syndicated from original https://lwn.net/Articles/910898/
At the end of September, Victor Stinner reported
on a security bug
fix he had been working on for a script from the CPython
Tools/scripts directory. As part of that work, he realized
that there were 74 scripts in that directory that were potentially
outdated, unused, unmaintained, trivial, buggy, or some combination of all
of those. It
is not uncommon for projects to have code that accretes in overlooked
corners of the source tree, but it makes sense to periodically take a look
to see if changes are needed. Stinner seems to have kicked that off for Python
with his message.
Split your monolithic Apache Kafka clusters using Amazon MSK Serverless
Post Syndicated from Ali Alemi original https://aws.amazon.com/blogs/big-data/split-your-monolithic-apache-kafka-clusters-using-amazon-msk-serverless/
Today, many companies are building real-time applications to improve their customer experience and get immediate insights from their data before it loses its value. As the result, companies have been facing increasing demand to provide data streaming services such as Apache Kafka for developers. To meet this demand, companies typically start with a small- or medium-sized, centralized Apache Kafka cluster to build a global streaming service. Over time, they scale the capacity of the cluster to match the demand for streaming. They choose to keep a monolithic cluster to simplify staffing and training by bringing all technical expertise in a single place. This approach also has cost benefits because it reduces the technical debt, overall operational costs, and complexity. In a monolithic cluster, the extra capacity is shared among all applications, therefore it usually reduces the overall streaming infrastructure cost.
In this post, I explain a few challenges with a centralized approach, and introduce two strategies for implementing a decentralized approach, using Amazon MSK Serverless. A decentralized strategy enables you to provision multiple Apache Kafka clusters instead of a monolithic one. I discuss how this strategy helps you optimize clusters per your application’s security, storage, and performance needs. I also discuss the benefits of a decentralized model and how to migrate from a monolithic cluster to a multi-cluster deployment model.
MSK Serverless can reduce the overhead and cost of managing Apache Kafka clusters. It automatically provisions and scales compute and storage resources for Apache Kafka clusters and automatically manages cluster capacity. It monitors how the partitions are distributed across the backend nodes and reassigns the partitions automatically when necessary. It integrates with other AWS services such as Amazon CloudWatch, where you can monitor the health of the cluster. The choice of MSK Serverless in this post is deliberate, even though the concepts can be applied to the Amazon MSK provisioned offering as well.
Overview of solution
Apache Kafka is an open-source, high-performance, fault-tolerant, and scalable platform for building real-time streaming data pipelines and applications. Apache Kafka simplifies producing and consuming streaming data by decoupling producers from the consumers. Producers simply interact with a single data store (Apache Kafka) to send their data. Consumers read the continuously flowing data, independent from the architecture or the programming language of the producers.
Apache Kafka is a popular choice for many use cases, such as:
- Real-time web and log analytics
- Transaction and event sourcing
- Messaging
- Decoupling microservices
- Streaming ETL (extract, transform, and load)
- Metrics and log aggregation
Challenges with a monolithic Apache Kafka cluster
Monolithic Apache Kafka saves companies from having to install and maintain multiple clusters in their data centers. However, this approach comes with common disadvantages:
- The entire streaming capacity is consolidated in one place, making capacity planning difficult and complicated. You typically need more time to plan and reconfigure the cluster. For example, when preparing for sales or large campaign events, it’s hard to predict and calculate an aggregation of needed capacity across all applications. This can also inhibit the growth of your company because reconfiguring a large cluster for a new workload often takes longer than a small cluster.
- Organizational conflicts may occur regarding the ownership and maintenance of the Apache Kafka cluster, because a monolithic cluster is a shared resource.
- The Apache Kafka cluster becomes a single point of failure. Any downtime means the outage of all related applications.
- If you choose to increase Apache Kafka’s resiliency with a multi-datacenter deployment, then you typically must have a cluster with the same size (as large) in the other data center, which is expensive.
- Maintenance and operation activities, such as version upgrades or installing OS patches, take significantly longer for larger clusters due to the distributed nature of Apache Kafka architecture.
- A faulty application can impact the reliability of the whole cluster and other applications.
- Version upgrades have to wait until all applications are tested with the new Apache Kafka version. This limits any application from experimenting with Apache Kafka features quickly.
- This model makes it difficult to attribute the cost of running the cluster to the applications for chargeback purposes.
The following diagram shows a monolithic Apache Kafka architecture.

Decentralized model
A decentralized Apache Kafka deployment model involves provisioning, configuring, and maintaining multiple clusters. This strategy generally isn’t preferred because managing multiple clusters requires heavy investments in operational excellence, advanced monitoring, infrastructure as code, security, and hardware procurement in on-premises environments.
However, provisioning decentralized Apache Kafka clusters using MSK Serverless doesn’t require those investments. It can scale the capacity and storage up and down instantly based on the application requirement, adding new workloads or scaling operations without the need for complex capacity planning. It also provides a throughput-based pricing model, and you pay for the storage and throughput that your applications use. Moreover, with MSK Serverless, you no longer need to perform standard maintenance tasks such as Apache Kafka version upgrade, partition reassignments, or OS patching.
With MSK Serverless, you benefit from a decentralized deployment without the operational burden that usually comes with a self-managed Apache Kafka deployment. In this strategy, the DevOps managers don’t have to spend time provisioning, configuring, monitoring, and operating multiple clusters. Instead, they invest more in building more operational tools to onboard more real-time applications.
In the remainder of this post, I discuss different strategies for implementing a decentralized model. Furthermore, I highlight the benefits and challenges of each strategy so you can decide what works best for your organization.
Write clusters and read clusters
In this strategy, write clusters are responsible for ingesting data from the producers. You can add new workloads by creating new topics or creating new MSK Serverless clusters. If you need to scale the size of current workloads, you simply increase the number of partitions of your topics if the ordering isn’t important. MSK Serverless manages the capacity instantly as per the new configuration.
Each MSK Serverless cluster provides up to 200 MBps of write throughput and 400 MBps of read throughput. It also allocates up to 5 MBps of write throughput and 10 MBps of read throughput per partition.
Data consumers within any organization can usually be divided to two main categories:
- Time-sensitive workloads, which need data with very low latency (such as millisecond or subsecond) and can only tolerate a very short Recovery Time Objective (RTO)
- Time-insensitive workloads, which can tolerate higher latency (sub-10 seconds to minute-level latency) and longer RTO
Each of these categories also can be further divided into subcategories based on certain conditions, such as data classification, regulatory compliance, or service level agreements (SLAs). Read clusters can be set up according to your business or technical requirements, or even organizational boundaries, which can be used by the specific group of consumers. Finally, the consumers are configured to run against the associated read cluster.
To connect the write clusters to read clusters, a data replication pipeline is necessary. You can build a data replication pipeline many ways. Because MSK Serverless supports the standard Apache Kafka APIs, you can use the standard Apache Kafka tools such as MirrorMaker 2 to set up replications between Apache Kafka clusters.
The following diagram shows the architecture for this strategy.
This approach has the following benefits:
- Producers are isolated from the consumers; therefore, your write throughput can scale independently from your read throughput. For example, if you have reached your max read throughput with existing clusters and need to add a new consumer group, you can simply provision a new MSK Serverless cluster and set up replication between the write cluster and the new read cluster.
- It helps enforce security and regulatory compliance. You can build streaming jobs that can mask or remove the sensitive fields of data events, such as personally identifiable information (PII), while replicating the data.
- Different clusters can be configured differently in terms of retention. For example, read clusters can be configured with different maximum retention periods, to save on storage cost depending on their requirements.
- You can prioritize your response time for outages for certain clusters over the others.
- For implementing increased resiliency, you can have fewer clusters in the backup Region by only replicating the data from the write clusters. Other clusters such as read clusters can be provisioned when the workload failover is invoked. In this model, with the MSK Serverless pricing model, you pay additionally for what you use (lighter replica) in the backup Region.
There are a few important notes to keep in mind when choosing this strategy:
- It requires setting up multiple replications between clusters, which comes with additional operational and maintenance complexity.
- Replication tools such as MirrorMaker 2 only support at-least-once processing semantics. This means that during failures and restarts, data events can be duplicated. If you have consumers that can’t tolerate data duplication, I suggest building data pipelines that support the exactly-once processing semantic for replicating the data, such as Apache Flink, instead of using MirrorMaker 2.
- Because consumers don’t consume data directly from the write clusters, the latency is increased between the writers and the readers.
- In this strategy, even though there are multiple Apache Kafka clusters, ownership and control still reside with one team, and the resources are in a single AWS account.
Segregating clusters
For some companies, providing access to Apache Kafka through a central data platform can create scaling, ownership, and accountability challenges. Infrastructure teams may not understand the specific business needs of an application, such as data freshness or latency requirements, security, data schemas, or a specific method needed for data ingestion.
You can often reduce these challenges by giving ownership and autonomy to the team who owns the application. You allow them to build and manage their application and needed infrastructure, rather than only being able to use a common central platform. For instance, development teams are responsible for provisioning, configuring, maintaining, and operating their own Apache Kafka clusters. They’re the domain experts of their application requirements, and they can manage their cluster according to their application needs. This reduces overall friction and puts application teams accountable to their advertised SLAs.
As mentioned before, MSK Serverless minimizes the operation and maintenance work associated with Apache Kafka clusters. This enables the autonomous application teams to manage their clusters according to industry best practices, without needing to be an expert in running highly available Apache Kafka clusters on AWS. If the MSK Serverless cluster is provisioned within their AWS account, they also own all the costs associated with operating their applications and the data streaming services.
The following diagram shows the architecture for this strategy.
This approach has the following benefits:
- MSK Serverless clusters are managed by different teams; therefore, the overall management work is minimized.
- Applications are isolated from each other. A faulty application or downtime of a cluster doesn’t impact other applications.
- Consumers read data directly with low latency from the same cluster where the data is written.
- Each MSK Serverless cluster scales differently per its write and read throughput.
- Simple cost attribution means that application teams own their infrastructure and its cost.
- Total ownership of the streaming infrastructure allows developers to adopt streaming faster and deliver more functionalities. It may also help shorten their response time to failures and outages.
Compared to the previous strategy, this approach has the following disadvantages:
- It’s difficult to enforce a unified security or regulatory compliance across many teams.
- Duplicate copies of the same data may be ingested in multiple clusters. This increases the overall cost.
- To increase resiliency, each team individually needs to set up replications between MSK Serverless clusters.
Moving from a centralized to decentralized strategy
MSK Serverless provides AWS Command Line Interface (AWS CLI) tools and support for AWS CloudFormation templates for provisioning clusters in minutes. You can implement any of the strategies that I mentioned earlier via the methods AWS provides, and migrate your producers and consumers when the new clusters are ready.
The following steps provide further guidance on implementation of these strategies:
- Begin by focusing on the current issues with the monolithic Apache Kafka. Next, compare the challenges with the benefits and disadvantages, as listed under each strategy. This helps you decide which strategy serves your company the best.
- Identify and document each application’s performance, resiliency, SLA, and ownership requirements separately.
- Attempt grouping applications that have similar requirements. For example, you may find a few applications that run batch analytics; therefore, they’re not sensitive to data freshness and also don’t need access to sensitive (or PII) data. If you decide segregating clusters is the right strategy for your company, you may choose to group applications by the team who owns them.
- Compare each group of applications’ storage and streaming throughput requirements against the MSK Serverless quotas. This helps you determine whether one MSK Serverless cluster can provide the needed aggregated streaming capacity. Otherwise, further divide larger groups to smaller ones.
- Create MSK Serverless clusters per each group you identified earlier via the AWS Management Console, AWS CLI, or CloudFormation templates.
- Identify the topics that correspond to each new MSK Serverless cluster.
- Choose the best migration pattern to Amazon MSK according to the replication requirements. For example, when you don’t need data transformation, and duplicate data events can be tolerated by applications, you can use Apache Kafka migration tools such as MirrorMaker 2.0.
- After you have verified the data is replicating correctly to the new clusters, first restart the consumers against the new cluster. This ensures no data will be lost as the result of the migration.
- After the consumers resume processing data, restart the producers against the new cluster, and shut down the replication pipeline you created earlier.
As of this writing, MSK Serverless only supports AWS Identity and Access Management (IAM) for authentication and access control. For more information, refer to Securing Apache Kafka is easy and familiar with IAM Access Control for Amazon MSK. If your applications use other methods supported by Apache Kafka, you need to modify your application code to use IAM Access Control instead or use the Amazon MSK provisioned offering.
Summary
MSK Serverless eliminates operational overhead, including the provisioning, configuration, and maintenance of highly available Apache Kafka. In this post, I showed how splitting Apache Kafka clusters helps improve the security, performance, scalability, and reliability of your overall data streaming services and applications. I also described two main strategies for splitting a monolithic Apache Kafka cluster using MSK Serverless. If you’re using Amazon MSK provisioned offering, these strategies are still relevant when considering moving from a centralized to a decentralized model. You can decide the right strategy depending on your company’s specific needs.
For further reading on Amazon MSK, visit the official product page.
About the Author
 Ali Alemi is a Streaming Specialist Solutions Architect at AWS. Ali advises AWS customers with architectural best practices and helps them design real-time analytics data systems that are reliable, secure, efficient, and cost-effective. He works backward from customers’ use cases and designs data solutions to solve their business problems. Prior to joining AWS, Ali supported several public sector customers and AWS consulting partners in their application modernization journey and migration to the cloud.
[Security Nation] James Kettle of PortSwigger on Advancing Web-Attack Research
Post Syndicated from Rapid7 original https://blog.rapid7.com/2022/10/12/security-nation-james-kettle-of-portswigger-on-advancing-web-attack-research/
![]()
In this episode of Security Nation, Jen and Tod talk to James Kettle of PortSwigger. Their discussion includes research for new web-attack techniques and how those get field tested (hint: bug bounties). The research is kept fresh from donations gleaned from the bug bounty field tests. PortSwigger validates their research in the real world, and those advances in web-attack techniques are published and disseminated in and effort to fix bugs and misconfigurations.
Stick around for the Rapid Rundown, where Tod and Jen talk about the recent Fortinet advisory concerning the “silent patching” of bugs without disclosure of any real details – only to have attackers go and reverse it all anyway.
James Kettle
![[Security Nation] James Kettle of PortSwigger on Advancing Web-Attack Research](https://blog.rapid7.com/content/images/2022/10/Screen-Shot-2022-10-11-at-3.49.09-PM-2.png)
James ‘albinowax’ Kettle is Director of Research at PortSwigger. His latest work includes browser-powered desync attacks and web-cache poisoning. James has extensive experience cultivating novel attack techniques, including RCE via Server-Side Template Injection and abusing the HTTP Host header to poison password reset emails and server-side caches. James is also the author of various popular open-source tools including Param Miner, Turbo Intruder, and HTTP Request Smuggler. He is a frequent speaker at numerous prestigious venues, including both Black Hat USA and EU, OWASP AppSec USA and EU, and DEFCON.
Show notes
Interview links
- Prior Security Nation episode in which loads of Portswigger references were dropped:
- https://www.rapid7.com/blog/post/2021/08/18/security-nation-daniel-crowley/
- New research from James about browser-powered desync attacks:
- https://portswigger.net/research/browser-powered-desync-attacks
Rapid Rundown links
- Semi-secret Fortinet advisory: https://twitter.com/Gi7w0rm/status/1578398457227878407
- CVE Details as they come: https://www.rapid7.com/blog/post/2022/10/07/cve-2022-40684-remote-authentication-bypass-vulnerability-in-fortinet-firewalls-web-proxies/
- Existence of Fortinet CVE-2022-40684 PoC posted, but not the PoC itself: https://twitter.com/Horizon3Attack/status/1579285863108087810
- The Hidden Harms of Silent Patches: https://www.rapid7.com/blog/post/2022/06/06/the-hidden-harm-of-silent-patches/
Like the show? Want to keep Jen and Tod in the podcasting business? Feel free to rate and review with your favorite podcast purveyor, like Apple Podcasts.