The Python packaging picture is generally a bit murky; there are lots of
different stakeholders, with disparate wishes and needs, which all adds up
to a fairly large set of multi-faceted problems. Back in the first three
months of the year, we looked at various
discussions around packaging, some of which are still ongoing.
A packaging
summit was held at PyCon 2023 to bring some of the
participants of those discussions together in one room. One of its sessions
was on adding
a namespaces feature to the Python Package
Index (PyPI). It provides a look into some of the
difficulties that
can arise, especially when trying to accommodate a long legacy of existing
practices, which is often a millstone around the neck of those trying to
make packaging improvements.
Protecting production while supporting growing cloud initiatives
The manufacturing industry is in limbo as organizations shift to cloud services. Many organizations are transitioning services to the cloud, but the vast majority maintain hybrid network environments that lean heavily on on-prem elements. During the pandemic, some companies were forced to expand their cloud services quickly to keep up with an influx of end users accessing network services remotely. However, few manufacturers are really pursuing a cloud-first approach.
This leaves most manufacturing organizations struggling to address issues of visibility in their hybrid cloud environments. There’s also a growing concern about compliance in the industry, with manufacturers setting internal standards to provide crucial oversight for themselves and their third-party partners. All of this is occurring during an industry-wide push to implement smart factory initiatives and a persistent IT/OT skills gap in manufacturing organizations.
An effective cloud security strategy is key for manufacturing companies. As they transition their services, implementing cloud security will ensure they’re able to monitor their growing attack surfaces, establish the necessary auditing processes and assessments for compliance, and support smart factory initiatives.
Major challenges of cloud security in manufacturing
Ensuring consistent production is paramount for manufacturing organizations. Cloud security strategy for this industry enables hybrid networks to function without disruption, while still supporting developing compliance regulations and smart factory initiatives. Without an effective cloud security strategy, manufacturers jeopardize their entire hybrid network as well as the operational elements and software integral to their manufacturing processes. Let’s look at a few of the obstacles keeping manufacturers from implementing an effective cloud security strategy.
Lack of visibility into the cloud
The manufacturing industry is unique in that organizations are not only monitoring an environment populated with their own cloud and on-prem elements, but they’re also tasked with tracking the elements of the third-party vendors that they partner with. These additional endpoints increase the overall attack surface and can be tricky to secure.
Lack of visibility into the cloud applications and elements in a manufacturing company’s network impacts root-cause analysis, anomaly detection, and the other processes that affect availability, performance, and security across the entire network.
Network disruptions often translate to supply chain issues that can affect production and availability. This ultimately translates to lost revenue and negatively impacts a manufacturer’s brand reputation. In fact, in a Supply Chain Resilience Report, 16.7% of business owners reported a “severe loss of income” due to a supply chain disruption. The report also revealed that the average cost of a disruption was around $610,000 dollars. Cloud security strategy, then, should include visibility across the entire infrastructure as well as third-party dependencies and the necessary context to bring clarity to third-party risk.
Failure to achieve and maintain cloud compliance
Unlike other highly regulated industries like healthcare and financial services, manufacturing organizations don’t have much external guidance when it comes to cloud compliance. In the absence of government regulation, manufacturing companies need a way to validate network configurations and changes in their cloud applications and infrastructure.
The lack of compliance standards for cloud applications prevents many manufacturers from properly deploying cloud-controlled elements, as well as detecting and remediating issues. This leads to system-wide vulnerabilities and greater exposure in the threat landscape. For example, without proper compliance standards in place, an organization may fail to update their service-level agreements (SLAs) or security patches in their cloud environments, which can be exploited by malicious threat actors.
Manufacturing organizations require a cloud security strategy that includes automated detection and remediation assistance, as well as support in adopting and implementing the few regulatory recommendations available, such as those set forth by the National Institute of Standards and Technology (NIST).
Inability to bridge the IT/OT knowledge gap
According to a Gartner survey, 64% of IT executives view talent shortages as the most significant barrier to adoption of emerging technologies. In the manufacturing industry, this translates specifically to a lack of IT/OT specialist knowledge on network teams.
IT/OT refers to the integration of information technology (IT) systems with operational technology (OT) systems. This particular combination of systems is used by manufacturing organizations to balance cloud network infrastructure that controls information and data with industrial equipment, assets, and processes.
Without specialist knowledge of these systems and how they interact, manufacturers struggle with IT and OT silos that lead to system disruption, downtime, and increased vulnerability. Manufacturers often misunderstand that OT systems are critical to their production process, but not necessarily the source of risk in their infrastructure. IT systems, however, may represent a smaller point of entry to their system, but pose a much larger risk as they connect to the larger OT systems. To combat this, manufacturers need a toolkit that will fill this skill gap on their teams, automate processes for increased efficiency, and consolidate data to break down silos between teams.
Where to start with a cloud security strategy in manufacturing
When looking to build a strong cloud security strategy, manufacturers should focus their efforts in the following areas:
Visibility
Compliance
Managed Services
Prioritize cloud visibility
Though the transition to cloud services is slower in the manufacturing industry, it is still an inevitability. Consequently, the best way for manufacturing organizations to adequately protect their cloud infrastructure, and by extension their overall environment, is to focus on visibility.
Visibility reduces risk and allows companies to effectively monitor their attack surfaces. This begins with manufacturers collecting monitoring data from across their cloud infrastructure. Drawing connections between the data, end-user experiences, and supply chain interaction can help manufacturers find weak or vulnerable points in their cloud infrastructure.
The right cloud security tools will help teams continuously monitor both public cloud and container environments. Manufacturers also need real-time visibility and context to find and fix issues quickly. InsightCloudSec offers all of these features and more to manufacturing companies—effectively eliminating network blind spots and giving teams the confidence they need to move forward with their cloud initiatives.
Consider cloud compliance solutions
Many manufacturers struggle with finding and adopting regulatory best practices in their cloud environments. While NIST offers guidance on network security, and the Center for Internet Security (CIS) offers frameworks and CIS Benchmarks, many manufacturers are unsure of which guidelines make the most sense for their organization’s needs. Moreover, manufacturers need guidance on how to implement compliance monitoring, which ensures that their cloud elements are operating securely.
Without compliance, manufacturers are essentially managing their cloud environments in the dark, with little governance on how to deploy applications, configure their cloud environments, and update their elements. This can lead to lapsed security updates and serious vulnerabilities that increase risk across the entire infrastructure.
Enter cloud compliance solutions. These tools can enable manufacturing organizations to automate compliance monitoring and management. For example, InsightCloudSec checks an organization’s multi-cloud environments against dozens of industry and regulatory best practices. Moreover, cloud compliance solutions enable manufacturers to customize external compliance checks to sync with internal compliance regulations. This eliminates frustration and false alarms.
Teams can also take advantage of InsightCloudSec’s embedded automation, which automatically detects compliance drift and returns cloud environments to a secure state within 60 seconds.
Outsource with managed services
Manufacturing teams struggling to hire and retain skilled IT workers often find themselves with a gap in IT/OT oversight. This gap can result in greater silos between IT and OT teams, which can disrupt smart factory initiatives and the adoption of cloud services, and lead to increased unchecked system vulnerabilities.
After all, it’s hard to contextualize risk without a complete understanding of IT/OT cloud elements and how risk in one arena affects the other. Instead of an organization redoubling their hiring efforts or overwhelming their existing team members, managed services allow manufacturers to effectively outsource this role and add a virtual IT/OT specialist to their team.
Rapid7’s managed services team offers regular assessments, handles the operational requirements of incident detection and response, and performs vulnerability scanning. This frees up crucial time for IT/OT teams and streamlines the scanning and reporting process, which encourages greater collaboration. Contextualization, or the process of analyzing threats and gathering relevant supplemental information, is simple with Rapid7’s InsightVM. InsightVM works in partnership with SCADAfence to assess vulnerabilities and leverage insight into OT networks to accurately prioritize risk.
The bottom line
Establishing cloud security strategies in manufacturing organizations often seems like an insurmountable task. Common struggles of visibility, compliance, and IT/OT knowledge gaps plague manufacturing companies who are transitioning to cloud services. This can lead to network blind spots, slowdowns, and increased risk.
Building a toolkit of cloud security solutions can help manufacturers reduce their overall risk in the cloud and optimize their performance by improving internal compliance. Making the most of this toolkit requires specialized knowledge, but leveraging managed services enables manufacturing organizations to streamline reporting and assessments without hiring additional in-house staff.
Manufacturing organizations are evolving to keep up with production demands, changing technology, and an ever-broadening threat landscape. By strengthening cloud security, manufacturing companies can focus on providing a superb product, assured that their cloud environment is secure. Get in touch with us to learn more about how Rapid7 is helping manufacturing companies navigate security during every phase of the cloud transition process.
Today, we’re pleased to introduce the Amazon EMR CLI, a new command line tool to package and deploy PySpark projects across different Amazon EMR environments. With the introduction of the EMR CLI, you now have a simple way to not only deploy a wide range of PySpark projects to remote EMR environments, but also integrate with your CI/CD solution of choice.
In this post, we show how you can use the EMR CLI to create a new PySpark project from scratch and deploy it to Amazon EMR Serverless in one command.
Overview of solution
The EMR CLI is an open-source tool to help improve the developer experience of developing and deploying jobs on Amazon EMR. When you’re just getting started with Apache Spark, there are a variety of options with respect to how to package, deploy, and run jobs that can be overwhelming or require deep domain expertise. The EMR CLI provides simple commands for these actions that remove the guesswork from deploying Spark jobs. You can use it to create new projects or alongside existing PySpark projects.
In this post, we walk through creating a new PySpark project that analyzes weather data from the NOAA Global Surface Summary of Day open dataset. We’ll use the EMR CLI to do the following:
If you don’t already have an existing EMR Serverless application, you can use the following AWS CloudFormation template or use the emr bootstrap command after you’ve installed the CLI.
Install the EMR CLI
You can find the source for the EMR CLI in the GitHub repo, but it’s also distributed via PyPI. It requires Python version >= 3.7 to run and is tested on macOS, Linux, and Windows. To install the latest version, use the following command:
pip3 install emr-cli
You should now be able to run the emr --help command and see the different subcommands you can use:
❯ emr --help
Usage: emr [OPTIONS] COMMAND [ARGS]...

  Package, deploy, and run PySpark projects on EMR.

Options:
  --help  Show this message and exit.

Commands:
  bootstrap  Bootstrap an EMR Serverless environment.
  deploy     Copy a local project to S3.
  init       Initialize a local PySpark project.
  package    Package a project and dependencies into dist/
  run        Run a project on EMR, optionally build and deploy
  status
If you didn’t already create an EMR Serverless application, the bootstrap command can create a sample environment for you and a configuration file with the relevant settings. Assuming you used the provided CloudFormation stack, set the following environment variables using the information on the Outputs tab of your stack. Set the Region in the terminal to us-east-1 and set a few other environment variables we’ll need along the way:
We use us-east-1 because that’s where the NOAA GSOD data bucket is. EMR Serverless can access S3 buckets and other AWS resources in the same Region by default. To access other services, configure EMR Serverless with VPC access.
Initialize a project
Next, we use the emr init command to initialize a default PySpark project for us in the provided directory. The default templates create a standard Python project that uses pyproject.toml to define its dependencies. In this case, we use Pandas and PyArrow in our script, so those are already pre-populated.
After the project is initialized, you can run cd my-project or open the my-project directory in your code editor of choice. You should see the following set of files:
Note that we also have a Dockerfile here. This is used by the package command to ensure that our project dependencies are built on the right architecture and operating system for Amazon EMR.
If you use Poetry to manage your Python dependencies, you can also add a --project-type poetry flag to the emr init command to create a Poetry project.
If you already have an existing PySpark project, you can use emr init --dockerfile to create the Dockerfile necessary to package things up.
Run the project
Now that we’ve got our sample project created, we need to package our dependencies, deploy the code to Amazon S3, and start a job on EMR Serverless. With the EMR CLI, you can do all of that in one command. Make sure to run the command from the my-project directory:
Auto-detects the type of Spark project in the current directory.
Initiates a build for your project to package up dependencies.
Copies your entry point and resulting build files to Amazon S3.
Starts an EMR Serverless job.
Waits for the job to finish, exiting with an error status if it fails.
You should now see the following output in your terminal as the job begins running in EMR Serverless:
[emr-cli]: Job submitted to EMR Serverless (Job Run ID: 00f8uf1gpdb12r0l)
[emr-cli]: Waiting for job to complete...
[emr-cli]: Job state is now: SCHEDULED
[emr-cli]: Job state is now: RUNNING
[emr-cli]: Job state is now: SUCCESS
[emr-cli]: Job completed successfully!
And that’s it! If you want to run the same code on Amazon EMR on Amazon Elastic Compute Cloud (Amazon EC2), you can replace --application-id with --cluster-id j-11111111. The CLI will take care of sending the right spark-submit commands to your EMR cluster.
Now let’s walk through some of the other commands.
emr package
PySpark projects can be packaged in numerous ways, from a single .py file to a complex Poetry project with various dependencies. The EMR CLI can help consistently package your projects without having to worry about the details.
For example, if you have a single .py file in your project directory, the package command doesn’t need to do anything. If, however, you have multiple .py files in a typical Python project style, the emr package command will zip these files up as a package that can later be uploaded to Amazon S3 and provided to your PySpark job using the --py-files option. If you have third party dependencies defined in pyproject.toml, emr package will create a virtual environment archive and start your EMR job with the spark.archive option.
The EMR CLI also supports Poetry for dependency management and packaging. If you have a Poetry project with a corresponding poetry.lock file, there’s nothing else you need to do. The emr package command will detect your poetry.lock file and automatically build the project using the Poetry Bundle plugin. You can use a Poetry project in two ways:
Create a project using the emr init command. The commands take a --project-type poetry option that create a Poetry project for you:
❯ emr init --project-type poetry emr-poetry
[emr-cli]: Initializing project in emr-poetry
[emr-cli]: Project initialized.
❯ cd emr-poetry
❯ poetry install
If you have a pre-existing project, you can use the emr init --dockerfile option, which creates a Dockerfile that is automatically used when you run emr package.
Finally, as noted earlier, the EMR CLI provides you a default Dockerfile based on Amazon Linux 2 that you can use to reliably build package artifacts that are compatible with different EMR environments.
emr deploy
The emr deploy command takes care of copying the necessary artifacts for your project to Amazon S3, so you don’t have to worry about it. Regardless of how the project is packaged, emr deploy will copy the resulting files to your Amazon S3 location of choice.
One use case for this is with CI/CD pipelines. Sometimes you want to deploy a specific version of code to Amazon S3 to be used in your data pipelines. With emr deploy, this is as simple as changing the --s3-code-uri parameter.
For example, let’s assume you’ve already packaged your project using the emr package command. Most CI/CD pipelines allow you to access the git tag. You can use that as part of the emr deploy command to deploy a new version of your artifacts. In GitHub actions, this is github.ref_name, and you can use this in an action to deploy a versioned artifact to Amazon S3. See the following code:
In your downstream jobs, you could then update the location of your entry point files to point to this new location when you’re ready, or you can use the emr run command discussed in the next section.
emr run
Let’s take a quick look at the emr run command. We’ve used it before to package, deploy, and run in one command, but you can also use it to run on already-deployed artifacts. Let’s look at the specific options:
❯ emr run --help
Usage: emr run [OPTIONS]

  Run a project on EMR, optionally build and deploy

Options:
  --application-id TEXT     EMR Serverless Application ID
  --cluster-id TEXT         EMR on EC2 Cluster ID
  --entry-point FILE        Python or Jar file for the main entrypoint
  --job-role TEXT           IAM Role ARN to use for the job execution
  --wait                    Wait for job to finish
  --s3-code-uri TEXT        Where to copy/run code artifacts to/from
  --job-name TEXT           The name of the job
  --job-args TEXT           Comma-delimited string of arguments to be passed
                            to Spark job

  --spark-submit-opts TEXT  String of spark-submit options
  --build                   Package and deploy job artifacts
  --show-stdout             Show the stdout of the job after it's finished
  --help                    Show this message and exit.
If you want to run your code on EMR Serverless, the emr run command takes an --application-id and --job-role parameters. If you want to run on EMR on EC2, you only need the --cluster-id option.
Required for both options are --entry-point and --s3-code-uri. --entry-point is the main script that will be called by Amazon EMR. If you have any dependencies, --s3-code-uri is where they get uploaded to using the emr deploy command, and the EMR CLI will build the relevant spark-submit properties pointing to these artifacts.
There are a few different ways to customize the job:
–job-name – Allows you to specify the job or step name
–job-args – Allows you to provide command line arguments to your script
–spark-submit-opts – Allows you to add additional spark-submit options like --conf spark.jars or others
–show-stdout – Currently only works with single-file .py jobs on EMR on EC2, but will display stdout in your terminal after the job is complete
As we’ve seen before, --build invokes both the package and deploy commands. This makes it easier to iterate on local development when your code still needs to run remotely. You can simply use the same emr run command over and over again to build, deploy, and run your code in your environment of choice.
Future updates
The EMR CLI is under active development. Updates are currently in progress to support Amazon EMR on EKS and allow for the creation of local development environments to make local iteration of Spark jobs even easier. Feel free to contribute to the project in the GitHub repository.
Clean up
To avoid incurring future charges, stop or delete your EMR Serverless application. If you used the CloudFormation template, be sure to delete your stack.
Conclusion
With the release of the EMR CLI, we’ve made it easier for you to deploy and run Spark jobs on EMR Serverless. The utility is available as open source on GitHub. We’re planning a host of new functionalities; if there are specific requests you have, feel free to file an issue or open a pull request!
About the author
Damon is a Principal Developer Advocate on the EMR team at AWS. He’s worked with data and analytics pipelines for over 10 years and splits his team between splitting service logs and stacking firewood.
Today we are launching AWS User Notifications, a single place in the AWS console to set up and view AWS notifications across multiple AWS accounts, Regions, and services.
You can centrally set up and view notifications from over 100 AWS services, such as Amazon Simple Storage Service (Amazon S3) objects events, Amazon Elastic Compute Cloud (Amazon EC2) instance state changes, AWS Health Dashboard events, Amazon CloudWatch alarms, or AWS Support case updates in a consistent, human-friendly format. You can also configure delivery channels—email, chat, and push notifications to the AWS console mobile app, where you can receive these notifications.
Alternatively, you can view notifications in the AWS Management Console by clicking the bell icon!
Choose See all notifications to find all your configured notifications in the Notification Center. You can filter notifications in your accounts by services, display a detailed notification view with human-readable messages, and access deep links to the relevant console resource pages.
Configure Notifications the Way You Want To receive your notifications, set up notification configurations. If this is your first time using the service, you will be prompted to first set up at least one notification hub.
Notification hubs are the Regions your notifications are stored and processed in or replicated to. You are required to select at least one notification hub before you can create notification configurations. You can also edit notification hubs from Notification hubs in the navigation pane.
Currently, you can select up to three Regions.
Next, choose Notification configurations and Create notification configuration to specify what event will generate a notification. You can select the services, create event rules that you want to be notified about, and set up how often you are notified in your communication channels.
Next, enter a name and description for your configuration. Here is an example to get all notifications for Amazon EC2 instance state changes.
In the Event rules section, use the Pattern builder to create one or more event rules to specify which events generate notifications. Choose your AWS service name as the event source, the type of events as the source of the matching pattern, and the Regions the events will be sourced from.
You can select any Amazon EventBridge events, like CloudWatch alarm state change, and configure them to generate notifications. Currently, more than 100 AWS services emit events to Amazon EventBridge.
Optionally, use the Advanced filter to further customize the event rules using a JSON format with EventBridge event patterns. For example, you can create a rule to only generate notifications for EC2 instances with the production tag.
{
    "detail": {
    "tag": ["production"]
     }
}
You can also define the cadence of when you want to receive the notifications. Choose either Receive fewer notifications only to receive a few daily notifications or Reduce notification delivery time to get high-priority notifications.
Configure delivery channels where you want the notifications to be sent, such as specific email addresses or AWS Chatbot. You can get notifications in chat clients like Slack and Amazon Chime via AWS Chatbot. Also, you can enable push notifications in the AWS Console Mobile Application as one of the delivery channels.
Choose Create notification configuration after reviewing your configuration and confirming the details.
If you would like to receive notifications from multiple accounts, see the instructions for Sending and receiving Amazon EventBridge events between AWS accounts in the Amazon EventBridge User Guide. Once you’ve completed setting up a receiver account, create a notification configuration that reacts to events.
Now Available AWS User Notifications are now available in US East (Ohio), US East (N. Virginia), US West (N. California), US West (Oregon), Asia Pacific (Mumbai), Asia Pacific (Osaka), Asia Pacific (Seoul), Asia Pacific (Singapore), Asia Pacific (Sydney), Asia Pacific (Tokyo), Canada (Central), Europe (Frankfurt), Europe (Ireland), Europe (London), Europe (Paris), Europe (Stockholm), and South America (São Paulo) Regions, and you can start using it today.
To use User Notifications in Regions added after March 2019, such as Africa (Cape Town), Asia Pacific (Hong Kong), Asia Pacific (Hyderabad), Asia Pacific (Jakarta), Asia Pacific (Melbourne), Europe (Milan), Europe (Spain), Europe (Zurich), Middle East (Bahrain), and Middle East (UAE), enable them in your account. To learn more, see Managing AWS Regions in the AWS Reference guide.
Amazon Inspector is a vulnerability management and application security service that helps improve the security of your workloads. It automatically scans applications for vulnerabilities and provides you with a detailed list of security findings, prioritized by their severity level, as well as remediation instructions. In this blog post, we’ll introduce new features from Amazon Inspector that can help you improve the security posture of your AWS Lambda functions.
At re:Invent 2022, Amazon Inspector announced the ability to perform automated security scans of the application package dependencies and associated layers in your Lambda functions. This adds to the existing ability to scan Amazon Elastic Compute Cloud (Amazon EC2) instances and container images in the Amazon Elastic Container Registry (Amazon ECR). The list of operating systems and programming languages that are supported for scanning is available in the Amazon Inspector documentation. On February 28, 2023, Amazon Inspector also announced a new feature, in public preview, to scan your application code in Lambda functions for vulnerabilities. This new feature uses the Detector Library from Amazon CodeGuru to scan your Lambda code. For more details on how the service scans your code, see the Amazon Inspector documentation.
Security is the top priority at AWS. For Lambda, our serverless compute offering, we released a whitepaper that goes into more detail about the security underpinnings of the service. It is important to highlight some differences in the model between infrastructure services such as Amazon EC2 and serverless options such as Lambda. Given the serverless nature of Lambda, besides the infrastructure, AWS also manages the Firecracker microVM software patches, the execution environment, and runtimes. Meanwhile, customers are responsible for using AWS Identity and Access Management (IAM) to create roles and permissions for their Lambda functions and for securing their code that is used with Lambda.
Activate Amazon Inspector
Let’s go over the steps for activating Amazon Inspector.
First, if you’re an existing Amazon Inspector customer, you can enable the new Lambda features from the Amazon Inspector console.
To enable Lambda scanning from the Amazon Inspector console
In the left navigation pane, expand the Settings section, and choose Account Management.
On the Accounts tab, choose Activate, and then select one of two options:
Lambda standard scanning — With this option enabled, Amazon Inspector only scans for package dependencies in your Lambda functions and associated layers.
Lambda standard scanning and Lambda code scanning — With this option enabled, Amazon Inspector scans for package dependencies and also scans your proprietary application code in Lambda for code vulnerabilities. The code scanning feature is only available in certain AWS Regions.
If you’re a new Amazon Inspector customer, we encourage you to try the service by enabling the 15-day free trial, which includes both Lambda function standard scanning and, if available in your Region, code scanning. Figure 1 shows how the Account Management section of the Amazon Inspector console will look, after you enable both features for Lambda. You also have the ability to exclude Lambda functions from being scanned by using AWS tags, as explained in the Amazon Inspector documentation.
Note: The Export CSV button in Figure 1 will be displayed only when you are logged in as the designated Inspector delegated administrator in the Region.
Figure 1: Amazon Inspector account management area
Let’s see these features in action.
To view security findings in the console
In the Amazon Inspector console, on the Findings menu, choose By Lambda function to display the security scan results that were performed on Lambda functions.
You won’t see Lambda functions in the findings if there are no potential vulnerabilities detected by Amazon Inspector. Amazon Inspector discovers eligible Lambda functions in near real time when it is deployed to Lambda and automatically scans the function code and dependencies. For more details on how Lambda functions are scanned, see the Amazon Inspector documentation.
Package vulnerability findings examples
As an example, we will walk through a simple Node.js 12 application. Figure 2 shows a sample Lambda function for which Amazon Inspector generated findings.
Figure 2: Lambda function finding summary
Amazon Inspector found three findings marked with a severity rating of High or Medium, shown in Figure 3. Amazon Inspector detects software vulnerabilities in Lambda functions and categorizes them as type Package Vulnerability (a vulnerable package in Lambda functions or associated layers) or Code Vulnerability (code vulnerabilities in custom code written by a developer – this does not include third-party dependencies, because these are covered under package vulnerabilities). The three findings in Figure 3 are of type Package Vulnerability, and when you choose the Common Vulnerabilities and Exposures (CVE) title, you can find more details about the vulnerability and its status
Figure 3: Amazon Inspector findings for a sample Lambda function
Each Lambda function can have up to five layers (at the time of this writing). A layer is a .zip file archive that can contain additional code or data. Amazon Inspector will also scan the functions’ available layers, and the findings from these scans will be available on the Layers tab, as shown in Figure 4.
Figure 4: Amazon Inspector findings for Lambda Layers
Amazon Inspector sources the data for its vulnerability intelligence database from more than 50 data feeds to generate its CVE findings. Let’s dive deeper into one finding from the sample application—for instance, the CVE-2021-43138-async package shown in Figure 5. The description of the CVE gives a high-level overview of the vulnerability, along with a CVE score to determine the severity.
Figure 5: CVE-2021-43138 finding details
The Amazon Inspector score assigned to the vulnerability will be affected by details such as whether an exploit is available. Amazon Inspector also uses the network reachability of the function as one of its score parameters. This helps you triage your findings appropriately to focus on the functions that could be most vulnerable.
Amazon Inspector will also provide you with remediation instructions for the vulnerable package, if available. In Figure 6, the recommendation to address this particular finding is to upgrade the async package to 3.2.2 to mitigate the vulnerability.
Figure 6: Remediation instructions for the sample application finding
Code vulnerability findings examples
Now let’s look at the new code scanning feature of Amazon Inspector. With this release, Amazon Inspector reviews the security and quality of the code written in your Lambda functions. To do this, the service uses the Amazon CodeGuru Detector Library, which has trained data across millions of code reviews, to generate findings. Amazon Inspector scans the Lambda function code to detect security flaws like cross-site scripting, injection flaws, data leaks, log injection, OS command injections, and other risk categories in the OWASP Top 10 and CWE Top 25. When you enable code scanning, you can focus on building your application while also following current security recommendations. At the time of this writing, Amazon Inspector supports scanning Java, Node.js, Python, and Go Lambda runtimes. For a full list of supported programming language runtimes, see the Amazon Inspector documentation.
As a demonstration of the Amazon Inspector code scanning feature, let’s take the simple Python Lambda function shown following, which accidentally overrides the Lambda reserved environment variables and also has an open-to-all socket connection.
Overriding reserved environment variables might lead to unexpected behavior or failure of the Lambda function. You can learn more about this vulnerability by reviewing the Detector Library documentation. Similarly, a socket connection without an IP address opens the connection to all entities, allowing the function code to potentially access public IPv4 addresses from within the code. There can be external dependencies in your code, which might reuse the insecure socket connection. To learn more about insecure socket binds, see the Detector Library documentation.
As shown in Figure 7, Amazon Inspector automatically detects these vulnerabilities and tags them as Code Vulnerability, which indicates that the vulnerability is in the code of the function, and not in one of the code-dependent libraries. You can see more details for these new finding types under the By Lambda function section of the Amazon Inspector console. You can filter the results based on the function name to see the active vulnerabilities. For this particular function, Amazon Inspector found two vulnerabilities.
Figure 7: Code Vulnerability sample findings
Similar to other finding types, Amazon Inspector tagged the vulnerability based on its severity level, which can help you to triage findings. Let’s focus on the High severity vulnerability in Figure 8 to learn how you can remediate the issue. Selecting the finding reveals additional details, like the name of the detector, the vulnerability location, and remediation details.
Figure 8: Code Vulnerability finding details
Now let’s see how you can remediate these vulnerabilities according to the suggested remediation. The code is attempting to change the function handler. AWS recommends that you don’t try to override reserved Lambda environment variables, because this can lead to unexpected results. For this case, we recommend that you delete line 8 from the sample code shown here and instead update the Lambda function handler name by using the runtime settings configuration in the Lambda console, as shown in Figure 9.
To change the Lambda function handler
In the Lambda console, search for and then select your Lambda function.
Scroll down to the Runtime settings area and choose Edit.
Under Edit runtime settings, update the handler name, and then choose Save.
Figure 9: Lambda function runtime settings
To address the second finding, we also updated the function by passing an IP address when binding to a socket, according to the recommendations that were included in the finding. Amazon Inspector will automatically detect the changes that are made to fix the issues, and change the status of the finding to closed, as shown in Figure 10. By changing the findings filter to Show all, you can see active and closed findings.
Figure 10: Findings summary after remediation
You can create more complex workflows by using the Amazon Inspector integration with Amazon EventBridge to manually or automatically respond to findings by creating various playbooks to respond to unique events. These findings will also be routed to AWS Security Hub for a centralized view of your Amazon Inspector findings in your AWS accounts and Regions.
Pricing
Pricing for Lambda standard scanning is available on the Amazon Inspector pricing page. During the public preview, the code scanning feature will be available at no additional cost.
Conclusion
In this blog post, we introduced two new Amazon Inspector features that scan your Lambda function application package dependencies, as well as your application code, for security vulnerabilities. With these new features, you can strengthen your security posture by scanning for code security vulnerabilities such as injection flaws, data leaks, and unsanitized input, according to current AWS security recommendations. We encourage you to test Lambda function scanning in your own environment by enabling the free trial for Amazon Inspector and following the steps in the Amazon Inspector documentation.
In today’s data-driven business environment, organizations face the challenge of efficiently preparing and transforming large amounts of data for analytics and data science purposes. Businesses need to build data warehouses and data lakes based on operational data. This is driven by the need to centralize and integrate data coming from disparate sources.
At the same time, operational data often originates from applications backed by legacy data stores. Modernizing applications requires a microservice architecture, which in turn necessitates the consolidation of data from multiple sources to construct an operational data store. Without modernization, legacy applications may incur increasing maintenance costs. Modernizing applications involves changing the underlying database engine to a modern document-based database like MongoDB.
These two tasks (building data lakes or data warehouses and application modernization) involve data movement, which uses an extract, transform, and load (ETL) process. The ETL job is a key functionality to having a well-structured process in order to succeed.
AWS Glue is a serverless data integration service that makes it straightforward to discover, prepare, move, and integrate data from multiple sources for analytics, machine learning (ML), and application development. MongoDB Atlas is an integrated suite of cloud database and data services that combines transactional processing, relevance-based search, real-time analytics, and mobile-to-cloud data synchronization in an elegant and integrated architecture.
By using AWS Glue with MongoDB Atlas, organizations can streamline their ETL processes. With its fully managed, scalable, and secure database solution, MongoDB Atlas provides a flexible and reliable environment for storing and managing operational data. Together, AWS Glue ETL and MongoDB Atlas are a powerful solution for organizations looking to optimize how they build data lakes and data warehouses, and to modernize their applications, in order to improve business performance, reduce costs, and drive growth and success.
In this post, we demonstrate how to migrate data from Amazon Simple Storage Service (Amazon S3) buckets to MongoDB Atlas using AWS Glue ETL, and how to extract data from MongoDB Atlas into an Amazon S3-based data lake.
Solution overview
In this post, we explore the following use cases:
Extracting data from MongoDB – MongoDB is a popular database used by thousands of customers to store application data at scale. Enterprise customers can centralize and integrate data coming from multiple data stores by building data lakes and data warehouses. This process involves extracting data from the operational data stores. When the data is in one place, customers can quickly use it for business intelligence needs or for ML.
Ingesting data into MongoDB – MongoDB also serves as a no-SQL database to store application data and build operational data stores. Modernizing applications often involves migration of the operational store to MongoDB. Customers would need to extract existing data from relational databases or from flat files. Mobile and web apps often require data engineers to build data pipelines to create a single view of data in Atlas while ingesting data from multiple siloed sources. During this migration, they would need to join different databases to create documents. This complex join operation would need significant, one-time compute power. Developers would also need to build this quickly to migrate the data.
AWS Glue comes handy in these cases with the pay-as-you-go model and its ability to run complex transformations across huge datasets. Developers can use AWS Glue Studio to efficiently create such data pipelines.
The following diagram shows the data extraction workflow from MongoDB Atlas into an S3 bucket using the AWS Glue Studio.
In order to implement this architecture, you will need a MongoDB Atlas cluster, an S3 bucket, and an AWS Identity and Access Management (IAM) role for AWS Glue. To configure these resources, refer to the prerequisite steps in the following GitHub repo.
The following figure shows the data load workflow from an S3 bucket into MongoDB Atlas using AWS Glue.
The same prerequisites are needed here: an S3 bucket, IAM role, and a MongoDB Atlas cluster.
Load data from Amazon S3 to MongoDB Atlas using AWS Glue
The following steps describe how to load data from the S3 bucket into MongoDB Atlas using an AWS Glue job. The extraction process from MongoDB Atlas to Amazon S3 is very similar, with the exception of the script being used. We call out the differences between the two processes.
Create a new AWS Glue Studio job with the Spark script editor option.
Depending on whether you want to load or extract data from the MongoDB Atlas cluster, enter the load script or extract script in the AWS Glue Studio script editor.
The following screenshot shows a code snippet for loading data into the MongoDB Atlas cluster.
The code uses AWS Secrets Manager to retrieve the MongoDB Atlas cluster name, user name, and password. Then, it creates a DynamicFrame for the S3 bucket and file name passed to the script as parameters. The code retrieves the database and collection names from the job parameters configuration. Finally, the code writes the DynamicFrame to the MongoDB Atlas cluster using the retrieved parameters.
Create an IAM role with the permissions as shown in the following screenshot.
Give the job a name and supply the IAM role created in the previous step on the Job details tab.
You can leave the rest of the parameters as default, as shown in the following screenshots.
Next, define the job parameters that the script uses and supply the default values.
Save the job and run it.
To confirm a successful run, observe the contents of the MongoDB Atlas database collection if loading the data, or the S3 bucket if you were performing an extract.
The following screenshot shows the results of a successful data load from an Amazon S3 bucket into the MongoDB Atlas cluster. The data is now available for queries in the MongoDB Atlas UI.
To troubleshoot your runs, review the Amazon CloudWatch logs using the link on the job’s Run tab.
The following screenshot shows that the job ran successfully, with additional details such as links to the CloudWatch logs.
Conclusion
In this post, we described how to extract and ingest data to MongoDB Atlas using AWS Glue.
With AWS Glue ETL jobs, we can now transfer the data from MongoDB Atlas to AWS Glue-compatible sources, and vice versa. You can also extend the solution to build analytics using AWS AI and ML services.
To learn more, refer to the GitHub repository for step-by-step instructions and sample code. You can procure MongoDB Atlas on AWS Marketplace.
About the Authors
Igor Alekseev is a Senior Partner Solution Architect at AWS in Data and Analytics domain. In his role Igor is working with strategic partners helping them build complex, AWS-optimized architectures. Prior joining AWS, as a Data/Solution Architect he implemented many projects in Big Data domain, including several data lakes in Hadoop ecosystem. As a Data Engineer he was involved in applying AI/ML to fraud detection and office automation.
Babu Srinivasan is a Senior Partner Solutions Architect at MongoDB. In his current role, he is working with AWS to build the technical integrations and reference architectures for the AWS and MongoDB solutions. He has more than two decades of experience in Database and Cloud technologies . He is passionate about providing technical solutions to customers working with multiple Global System Integrators(GSIs) across multiple geographies.
This is a guest blog post co-written with SangSu Park and JaeHong Ahn from SOCAR.
As companies continue to expand their digital footprint, the importance of real-time data processing and analysis cannot be overstated. The ability to quickly measure and draw insights from data is critical in today’s business landscape, where rapid decision-making is key. With this capability, businesses can stay ahead of the curve and develop new initiatives that drive success.
SOCAR is the leading Korean mobility company with strong competitiveness in car-sharing. SOCAR wanted to design and build a solution for a new Fleet Management System (FMS). This system involves the collection, processing, storage, and analysis of Internet of Things (IoT) streaming data from various vehicle devices, as well as historical operational data such as location, speed, fuel level, and component status.
This post demonstrates a solution for SOCAR’s production application that allows them to load streaming data from Amazon MSK into ElastiCache for Redis, optimizing the speed and efficiency of their data processing pipeline. We also discuss the key features, considerations, and design of the solution.
Background
SOCAR operates about 20,000 cars and is planning to include other large vehicle types such as commercial vehicles and courier trucks. SOCAR has deployed in-car devices that capture data using AWS IoT Core. This data was then stored in Amazon Relational Database Service (Amazon RDS). The challenge with this approach included inefficient performance and high resource usage. Therefore, SOCAR looked for purpose-built databases tailored to the needs of their application and usage patterns while meeting the future requirements of SOCAR’s business and technical requirements. The key requirements for SOCAR included achieving maximum performance for real-time data analytics, which required storing data in an in-memory data store.
After careful consideration, ElastiCache for Redis was selected as the optimal solution due to its ability to handle complex data aggregation rules with ease. One of the challenges faced was loading data from Amazon MSK into the database, because there was no built-in Kafka connector and consumer available for this task. This post focuses on the development of a Kafka consumer application that was designed to tackle this challenge by enabling performant data loading from Amazon MSK to Redis.
Solution overview
Extracting valuable insights from streaming data can be a challenge for businesses with diverse use cases and workloads. That’s why SOCAR built a solution to seamlessly bring data from Amazon MSK into multiple purpose-built databases, while also empowering users to transform data as needed. With fully managed Apache Kafka, Amazon MSK provides a reliable and efficient platform for ingesting and processing real-time data.
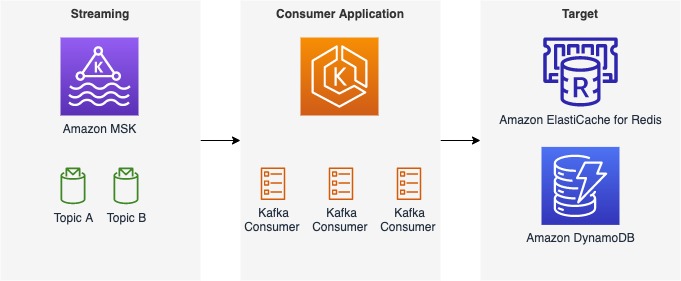
The following figure shows an example of the data flow at SOCAR.
This architecture consists of three components:
Streaming data – Amazon MSK serves as a scalable and reliable platform for streaming data, capable of receiving and storing messages from a variety of sources, including AWS IoT Core, with messages organized into multiple topics and partitions
Consumer application – With a consumer application, users can seamlessly bring data from Amazon MSK into a target database or data storage while also defining data transformation rules as needed
Target databases – With the consumer application, the SOCAR team was able to load data from Amazon MSK into two separate databases, each serving a specific workload
Although this post focuses on a specific use case with ElastiCache for Redis as the target database and a single topic called gps, the consumer application we describe can handle additional topics and messages, as well as different streaming sources and target databases such as Amazon DynamoDB. Our post covers the most important aspects of the consumer application, including its features and components, design considerations, and a detailed guide to the code implementation.
Components of the consumer application
The consumer application comprises three main parts that work together to consume, transform, and load messages from Amazon MSK into a target database. The following diagram shows an example of data transformations in the handler component.
The details of each component are as follows:
Consumer – This consumes messages from Amazon MSK and then forwards the messages to a downstream handler.
Loader – This is where users specify a target database. For example, SOCAR’s target databases include ElastiCache for Redis and DynamoDB.
Handler – This is where users can apply data transformation rules to the incoming messages before loading them into a target database.
Features of the consumer application
This connection has three features:
Scalability – This solution is designed to be scalable, ensuring that the consumer application can handle an increasing volume of data and accommodate additional applications in the future. For instance, SOCAR sought to develop a solution capable of handling not only the current data from approximately 20,000 vehicles but also a larger volume of messages as the business and data continue to grow rapidly.
Performance – With this consumer application, users can achieve consistent performance, even as the volume of source messages and target databases increases. The application supports multithreading, allowing for concurrent data processing, and can handle unexpected spikes in data volume by easily increasing compute resources.
Flexibility – This consumer application can be reused for any new topics without having to build the entire consumer application again. The consumer application can be used to ingest new messages with different configuration values in the handler. SOCAR deployed multiple handlers to ingest many different messages. Also, this consumer application allows users to add additional target locations. For example, SOCAR initially developed a solution for ElastiCache for Redis and then replicated the consumer application for DynamoDB.
Design considerations of the consumer application
Note the following design considerations for the consumer application:
Scale out – A key design principle of this solution is scalability. To achieve this, the consumer application runs with Amazon Elastic Kubernetes Service (Amazon EKS) because it can allow users to increase and replicate consumer applications easily.
Consumption patterns – To receive, store, and consume data efficiently, it’s important to design Kafka topics depending on messages and consumption patterns. Depending on messages consumed at the end, messages can be received into multiple topics of different schemas. For example, SOCAR has many different topics that are consumed by different workloads.
Purpose-built database – The consumer application supports loading data into multiple target options based on the specific use case. For example, SOCAR stored real-time IoT data in ElastiCache for Redis to power real-time dashboard and web applications, while storing recent trip information in DynamoDB that didn’t require real-time processing.
Walkthrough overview
The producer of this solution is AWS IoT Core, which sends out messages into a topic called gps. The target database of this solution is ElastiCache for Redis. ElastiCache for Redis a fast in-memory data store that provides sub-millisecond latency to power internet-scale, real-time applications. Built on open-source Redis and compatible with the Redis APIs, ElastiCache for Redis combines the speed, simplicity, and versatility of open-source Redis with the manageability, security, and scalability from Amazon to power the most demanding real-time applications.
The target location can be either another database or storage depending on the use case and workload. SOCAR uses Amazon EKS to operate the containerized solution to achieve scalability, performance, and flexibility. Amazon EKS is a managed Kubernetes service to run Kubernetes in the AWS Cloud. Amazon EKS automatically manages the availability and scalability of the Kubernetes control plane nodes responsible for scheduling containers, managing application availability, storing cluster data, and other key tasks.
For the programming language, the SOCAR team decided to use the Go Programming language, utilizing both the AWS SDK for Go and a Goroutine, a lightweight logical or virtual thread managed by the Go runtime, which makes it easy to manage multiple threads. The AWS SDK for Go simplifies the use of AWS services by providing a set of libraries that are consistent and familiar for Go developers.
In the following sections, we walk through the steps to implement the solution:
Create a consumer.
Create a loader.
Create a handler.
Build a consumer application with the consumer, loader, and handler.
Deploy the consumer application.
Prerequisites
For this walkthrough, you should have the following:
In this example, we use a topic called gps, and the consumer includes a Kafka client that receives messages from the topic. SOCAR created a struct and built a consumer (called NewConsumer in the code) to make it extendable. With this approach, any additional parameters and rules can be added easily.
To authenticate with Amazon MSK, SOCAR uses IAM. Because SOCAR already uses IAM to authenticate other resources, such as Amazon EKS, it uses the same IAM role (aws_msk_iam_v2) to authenticate clients for both Amazon MSK and Apache Kafka actions.
The loader function, represented by the Loader struct, is responsible for loading messages to the target location, which in this case is ElastiCache for Redis. The NewLoader function initializes a new instance of the Loader struct with a logger and a Redis cluster client, which is used to communicate with the ElastiCache cluster. The redis.NewClusterClient object is initialized using the NewRedisClient function, which uses IAM to authenticate the client for Redis actions. This ensures secure and authorized access to the ElastiCache cluster. The Loader struct also contains the Close method to close the Kafka reader and free up resources.
A handler is used to include business rules and data transformation logic that prepares data before loading it into the target location. It acts as a bridge between a consumer and a loader. In this example, the topic name is cars.gps.json, and the message includes two keys, lng and lat, with data type Float64. The business logic can be defined in a function like handlerFuncGpsToRedis and then applied as follows:
type (
	handlerFunc    func(ctx context.Context, loader *Loader, key, value []byte) error
	handlerFuncMap map[string]handlerFunc
)

var HandlerRedis = handlerFuncMap{
	"cars.gps.json":   handlerFuncGpsToRedis
}

func GetHandlerFunc(funcMap handlerFuncMap, topic string) (handlerFunc, error) {
	handlerFunc, exist := funcMap[topic]
	if !exist {
		return nil, fmt.Errorf("failed to find handler func for '%s'", topic)
	}
	return handlerFunc, nil
}

func handlerFuncGpsToRedis(ctx context.Context, loader *Loader, key, value []byte) error {
	// unmarshal raw data to map
	data := map[string]interface{}{}
	err := json.Unmarshal(value, &data)
	if err != nil {
		return err
	}

	// prepare things to load on redis as geolocation
	name := string(key)
	lng, err := getFloat64ValueFromMap(data, "lng")
	if err != nil {
		return err
	}
	lat, err := getFloat64ValueFromMap(data, "lat")
	if err != nil {
		return err
	}

	// add geolocation to redis
	return loader.RedisGeoAdd(ctx, "cars#gps", name, lng, lat)
}
Build a consumer application with the consumer, loader, and handler
Now you have created the consumer, loader, and handler. The next step is to build a consumer application using them. In a consumer application, you read messages from your stream with a consumer, transform them using a handler, and then load transformed messages into a target location with a loader. These three components are parameterized in a consumer application function such as the one shown in the following code:
To achieve maximum parallelism, SOCAR containerizes the consumer application and deploys it into multiple pods on Amazon EKS. Each consumer application contains a unique consumer, loader, and handler. For example, if you need to receive messages from a single topic with five partitions, you can deploy five identical consumer applications, each running in its own pod. Similarly, if you have two topics with three partitions each, you should deploy two consumer applications, resulting in a total of six pods. It’s a best practice to run one consumer application per topic, and the number of pods should match the number of partitions to enable concurrent message processing. The pod number can be specified in the Kubernetes deployment configuration
There are two stages in the Dockerfile. The first stage is the builder, which installs build tools and dependencies, and builds the application. The second stage is the runner, which uses a smaller base image (Alpine) and copies only the necessary files from the builder stage. It also sets the appropriate user permissions and runs the application. It’s also worth noting that the builder stage uses a specific version of the Golang image, while the runner stage uses a specific version of the Alpine image, both of which are considered to be lightweight and secure images.
The following code is an example of the Dockerfile:
# builder
FROM golang:1.18.2-alpine3.16 AS builder
RUN apk add build-base
WORKDIR /usr/src/app
COPY go.mod go.sum ./
RUN go mod download
COPY . .
RUN go build -o connector .

# runner
FROM alpine:3.16.0 AS runner
WORKDIR /usr/bin/app
RUN apk add --no-cache tzdata
RUN addgroup --system app && adduser --system --shell /bin/false --ingroup app app
COPY --from=builder /usr/src/app/connector .
RUN chown -R app:app /usr/bin/app
USER app
ENTRYPOINT ["/usr/bin/app/connector"]
Conclusion
In this post, we discussed SOCAR’s approach to building a consumer application that enables IoT real-time streaming from Amazon MSK to target locations such as ElastiCache for Redis. We hope you found this post informative and useful. Thank you for reading!
About the Authors
SangSu Park is the Head of Operation Group at SOCAR. His passion is to keep learning, embrace challenges, and strive for mutual growth through communication. He loves to travel in search of new cities and places.
JaeHong Ahn is a DevOps Engineer in SOCAR’s cloud infrastructure team. He is dedicated to promoting collaboration between developers and operators. He enjoys creating DevOps tools and is committed to using his coding abilities to help build a better world. He loves to cook delicious meals as a private chef for his wife.
Younggu Yun works at AWS Data Lab in Korea. His role involves helping customers across the APAC region meet their business objectives and overcome technical challenges by providing prescriptive architectural guidance, sharing best practices, and building innovative solutions together.
This blog is written by Thomas Moore, Senior Solutions Architect and Josh Hart, Senior Solutions Architect.
Applications often require a way for users to upload files. The traditional approach is to use an SFTP service (such as the AWS Transfer Family), but this requires specific clients and management of SSH credentials. Modern applications instead need a way to upload to Amazon S3 via HTTPS. Typical file upload use cases include:
Sharing datasets between businesses as a direct replacement for traditional FTP workflows.
Uploading telemetry and logs from IoT devices and mobile applications.
Often you must provide end users direct access to upload files via an endpoint. You could build a bespoke service for this purpose, but this results in more code to build, maintain, and secure.
This post explores three different approaches to securely upload content to an Amazon S3 bucket via HTTPS without the need to build a dedicated API or client application.
Using Amazon API Gateway as a direct proxy
The simplest option is to use API Gateway to proxy an S3 bucket. This allows you to expose S3 objects as REST APIs without additional infrastructure. By configuring an S3 integration in API Gateway, this allows you to manage authentication, authorization, caching, and rate limiting more easily.
This pattern allows you to implement an authorizer at the API Gateway level and requires no changes to the client application or caller. The limitation with this approach is that API Gateway has a maximum request payload size of 10 MB. For step-by-step instructions to implement this pattern, see this knowledge center article.
The second pattern uses S3 presigned URLs, which allow you to grant access to S3 objects for a specific period, after which the URL expires. This time-bound access helps prevent unauthorized access to S3 objects and provides an additional layer of security.
They can be used to control access to specific versions or ranges of bytes within an object. This granularity allows you to fine-tune access permissions for different users or applications, and ensures that only authorized parties have access to the required data.
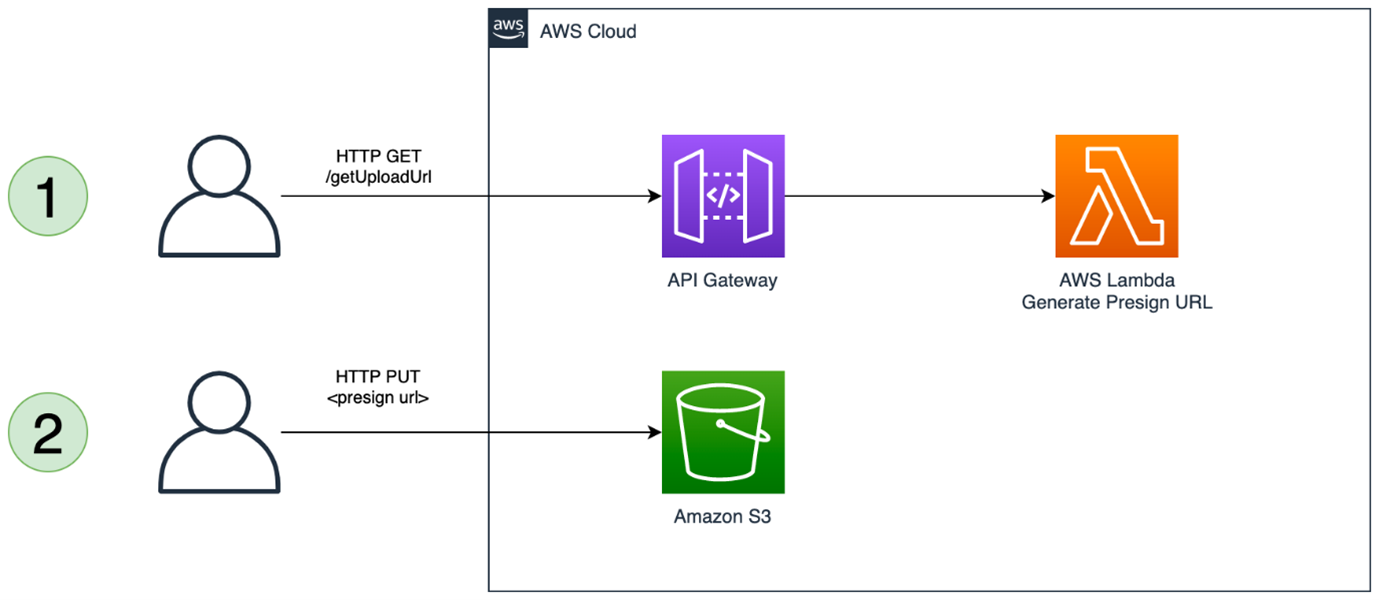
This avoids the 10 MB limit of API Gateway as the API is only used to generate the presigned URL, which is then used by the caller to upload directly to S3. Presigned URLs are straightforward to generate and use programmatically, but it does require the client to make two separate requests: one to generate the URL and one to upload the object. To learn more, read Uploading to Amazon S3 directly from a web or mobile application.
This pattern is limited by the 5GB maximum request size of the S3 Put Object API call. One way to work around this limit with this pattern is to leverage S3 multipart uploads. This requires that the client split the payload into multiple segments and send a separate request for each part.
The final pattern leverages Amazon CloudFront instead of API Gateway. CloudFront is primarily a content delivery network (CDN) that caches and delivers content from an S3 bucket or other origin. However, CloudFront can also be used to upload data to an S3 bucket. Without any additional configuration, this would essentially make the S3 bucket publicly writable. To secure the solution so that only authenticated users can upload objects, you can use a Lambda@Edge function to verify the users’ permissions.
The maximum size of the object that you can upload with this pattern is 5GB. If you need to upload files larger than 5GB, then you must use multipart uploads. To implement this, deploy the example Serverless Land pattern:
This pattern uses an origin access identity (OAI) to limit access to the S3 bucket to only come from CloudFront. The default OAI has s3:GetObject permission, which is changed to s3:PutObject to allow uploads explicitly and prevent and read operations:
As CloudFront is not used to cache content, the managed cache policy is set to CachingDisabled.
There are multiple options for implementing the authorization in the Lambda@Edge function. The sample repository uses an Amazon Cognito authorizer that validates a JSON Web Token (JWT) sent as an HTTP authorization header.
Using a JWT is secure as it implies this token is dynamically vended by an Identity Provider, such as Amazon Cognito. This does mean that the caller needs a mechanism to obtain this JWT token. You are in control of this authorizer function, and the exact implementation depends on your use-case. You could instead use an API Key or integrate with an alternate identity provider such as Auth0 or Okta.
Lambda@Edge functions do not currently support environment variables. This means that the configuration parameters are dynamically resolved at runtime. In the example code, AWS Systems Manager Parameter Store is used to store the Amazon Cognito user pool ID and app client ID that is required for the token verification. For more details on how to choose where to store your configuration parameters, see Choosing the right solution for AWS Lambda external parameters.
To verify the JWT token, the example code uses the aws-jwt-verify package. This supports JWTs issued by Amazon Cognito and third-party identity providers.
The Serverless Land pattern uses an Amazon Cognito identity provider to do authentication in the Lambda@Edge function. This code snippet shows an example using a pre-shared key for basic authorization:
import json

def lambda_handler(event, context):

    print(event)

    response = event["Records"][0]["cf"]["request"]
    headers = response["headers"]

    if 'authorization' not in headers or headers['authorization'] == None:
        return unauthorized()

    if headers['authorization'] == 'my-secret-key':
        return request

    return response

def unauthorized():
    response = {
            'status': "401",
            'statusDescription': 'Unauthorized',
            'body': 'Unauthorized'
        }
    return response
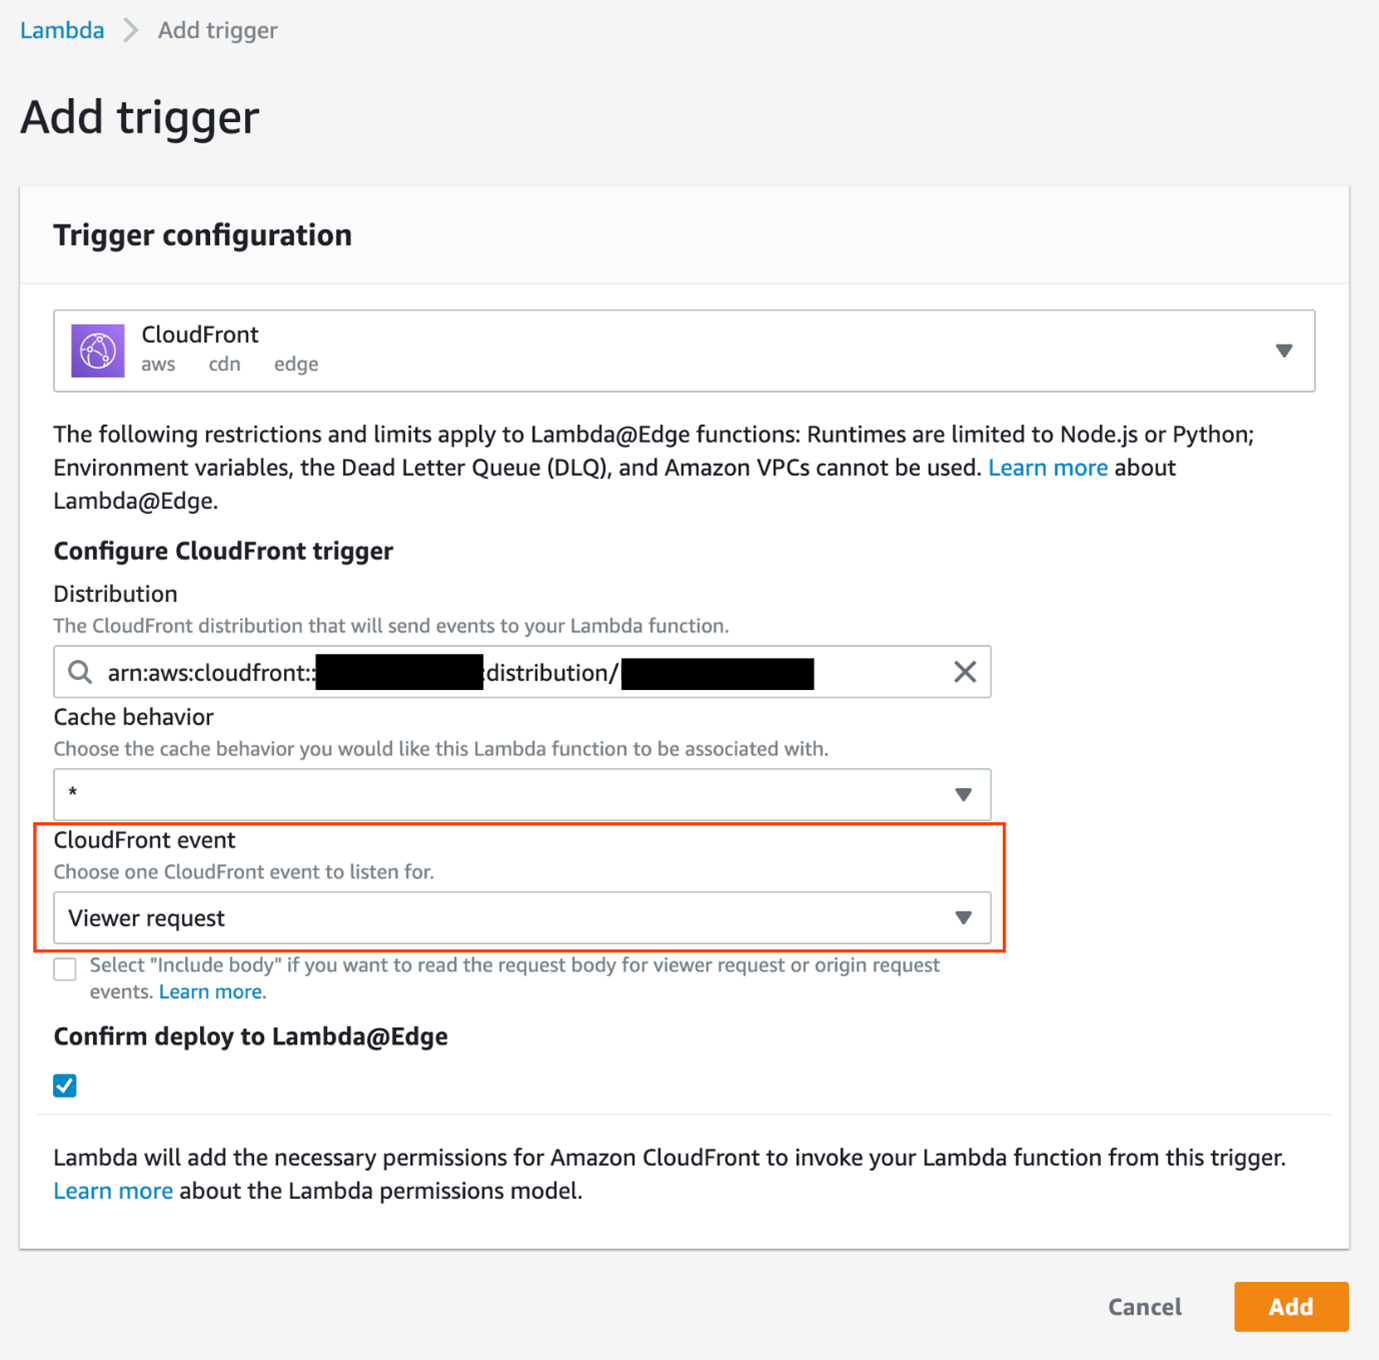
The Lambda function is associated with the CloudFront distribution by creating a Lambda trigger. The CloudFront event is set Viewer request to meaning the function is invoked in reaction to PUT events from the client.
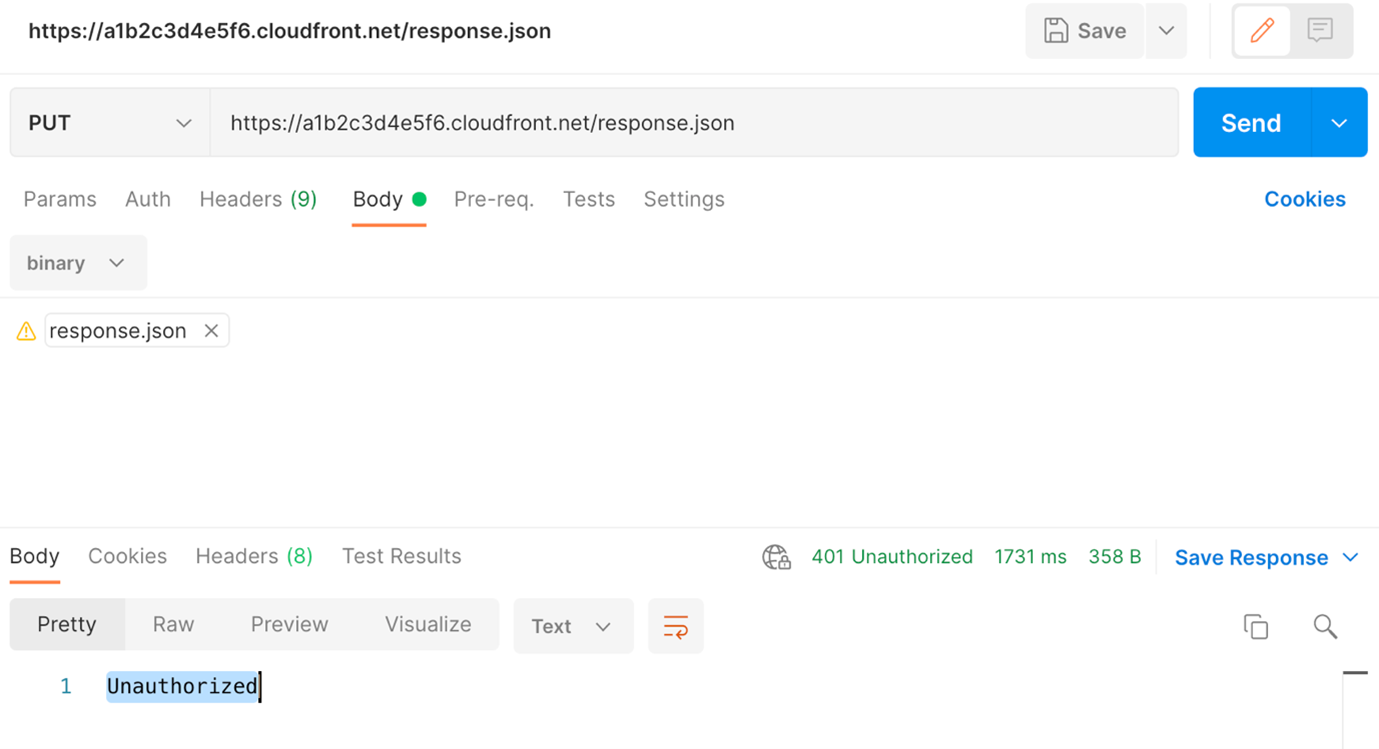
The solution can be tested with an API testing client, such as Postman. In Postman, issue a PUT request to https://<your-cloudfront-domain>/<object-name> with a binary payload as the body. You receive a 401 Unauthorized response.
Next, add the Authorization header with a valid token and submit the request again. For more details on how to obtain a JWT from Amazon Cognito, see the README in the repository. Now the request works and you receive a 200 OK message.
To troubleshoot, the Lambda function logs to Amazon CloudWatch Logs. For Lambda@Edge functions, look for the logs in the Region closest to the request, and not the same Region as the function.
The Lambda@Edge function in this example performs basic authorization. It validates the user has access to the requested resource. You can perform any custom authorization action here. For example, in a multi-tenant environment, you could restrict the prefix so that specific tenants only have permission to write to their own prefix, and validate the requested object name in the function.
Additionally, you could implement controls traditionally performed by the API Gateway such as throttling by tenant or user. Another use for the function is to validate the file type. If users can only upload images, you could validate the content-length to ensure the images are a certain size and the file extension is correct.
Conclusion
Which option you choose depends on your use case. This table summarizes the patterns discussed in this blog post:
API Gateway as a proxy
Presigned URLs with API Gateway
CloudFront with Lambda@Edge
Max Object Size
10 MB
5 GB (5 TB with multipart upload)
5 GB
Client Complexity
Single HTTP Request
Multiple HTTP Requests
Single HTTP Request
Authorization Options
Amazon Cognito, IAM, Lambda Authorizer
Amazon Cognito, IAM, Lambda Authorizer
Lambda@Edge
Throttling
API Key throttling
API Key throttling
Custom throttling
Each of the available methods has its strengths and weaknesses and the choice of which one to use depends on your specific needs. The maximum object size supported by S3 is 5 TB, regardless of which method you use to upload objects. Additionally, some methods have more complex configuration that requires more technical expertise. Considering these factors with your specific use-case can help you make an informed decision on the best API option for uploading to S3.
For more serverless learning resources, visit Serverless Land.
По-малко от две седмици преди президентските избори в Турция – най-оспорваните за последното десетилетие, очакванията кой от двамата водещи кандидати – Реджеп Тайип Ердоган или Кемал Кълъчдароглу, ще надделее, са в полето на предположенията, базирани на социологическите проучвания. Към момента дали ще се стигне до втори тур, зависи изцяло от разликата между Ердоган и Кълъчдароглу и дали ще успее да мине 8%. При положение че в надпреварата участват още двама кандидати – Мухаррем Индже и Синан Оан, сценарият, при който водещите кандидати печелят още на първия тур, е спорен.
От това кой ще спечели изборите, зависи в немалка степен пътят, по който ще се развива Турция в следващите няколко години. Това е важно както за България и нейните съседи на Балканския полуостров, така и за източните съседи на Анкара. Турция продължава да води активна политика в Близкия изток, намесвайки се активно във войната в Сирия, увеличавайки своето присъствие в Северен Ирак и за първи път след разпада на Османската империя, разполагайки свои войски в Персийския залив – в Катар. Турция е ключов фактор в Кавказ и Централна Азия, а традиционно страната е определяща и за разположението на силите в Черноморския басейн.
Анкара интензивно се намеси в ролята на посредник във войната на Русия срещу Украйна и макар и тук, както и в случая със Сирия и Либия, резултатите от нейните усилия да са по-скоро скромни, за момента като че ли няма друг по-видим играч на полето на дипломацията. На полето на израелско-палестинския дългогодишен конфликт Турция е на път да промени подхода си. След години на намалена интензивност в контактите с Израел, в момента Анкара търси възможност да върне нивото на сътрудничеството от времето преди инцидента с кораба „Мави Мармара“ (2010 г.). В знак на добра воля Турция се съгласи да ограничи дейността на най-голямото палестинско военно движение – „Хамас“, като неговите висши представители са или поканени да напуснат Истанбул, или дейността им е значително намалена.
Подходът на Турция във външнополитически план кореспондира с намерението на страната да продължи да гарантира източниците на енергийни ресурси. Анкара е особено активна в Източното Средиземноморие, където пряко се среща с Гърция и Кипър. След споразумението за демаркация на морската граница между Израел и Ливан под егидата на САЩ, Турция отбелязва допълнително активизиране на взаимодействието между ключовите държави в региона, към които принадлежи и Египет и с който Турция също търси път към дипломатически компромис. В тези плетеница от интереси България следва да се ориентира съгласно собствения си интерес, който да личи в провежданата от страната ни политика.
Водена от принципа кое е в унисон с турските интереси, Анкара възобнови и отношенията си с ОАЕ и Саудитска Арабия. Докато през 2016 г. турските медии обвиняваха Аби Даби в съпричастност с опита за държавен преврат, то днес шейх Мухаммад бин Зайед е почетен гост на президента Ердоган. Въпреки жестокото убийство на журналиста Хашогджи в Саудитското консулство през 2018 г., към днешна дата Турция и кралството възстановяват активния си диалог на политическо и икономическо ниво.
Значението за България? За страната ни резултатите от президентските избори в Турция ще са индикатор какво поведение бихме могли да очакваме от нашия съсед. През последните десетилетия, въпреки някои затруднения, отношенията между София и Анкара запазват по-скоро прагматичен характер. Макар понякога вероятно да остава впечатление за отстъпчивост пред исканията на Турция, България успява да балансира. Тази отстъпчивост обаче следва да бъде заменена от поведение, от което да личи кои са приоритетите и интересите на София, за които тя е готова да отстоява позициите си. Спирането на емигрантските потоци и гаранциите, които търсим от страна на Турция в тази насока, не могат да бъдат основна точка в двустранните отношения, както внушават медийните публикации. Не могат и да са причина да не представяме интересите си по-ясно.
За пътя на Турция в следващите години говорим с експерта по международни отношение Емре Калискан.
Емре Калискан е докторант по международни отношения от колежа „Сейнт Антъни“ на Университета в Оксфорд. В дисертацията си изследва ролята на турските ислямистки недържавни актьори във външната политика на страната в Субсахарска Африка. Другите му интереси включват транснационалния ислям и исляма в Африка. Има магистратура по близкоизточни и средиземноморски науки от Кралския колеж в Лондон и е съавтор заедно със Саймън Уолдман на „Новата Турция и нейните недоволства“ (2017), която анализира социалната, религиозната и политическата поляризация при управлението на Партията на справедливостта и развитието (ПСР) и възможните варианти за еволюция на Турция.
Като независим анализатор и журналист Калискан е работил за турската секция на BBC, Cumhuriyet, NewsweekТурция и турската обществена телевизия TRT в качеството си на чуждестранен кореспондент в Анкара, Дамаск, Пекин и Лондон. Интервюта с него са публикувани в редица международни издания, сред които Financial Times, Economist, BBC, AP и Voice of America. Калискан работи и като политически и бизнес консултант по въпроси, свързани с Турция.
Дни преди изборите в Турция мнозина се питат дали управляващата ПСР и настоящият президент Реджеп Тайип Ердоган са в състояние да защитят политическото си наследство. Вие какво мислите?
В момента президентските избори в Турция са доста оспорвани. По всяка вероятност Ердоган ще ги спечели с малко или ще оспори резултатите. Влошаващото се състояние на икономиката на страната и скорошното земетресение оказват влияние върху електората на Ердоган. Но турските избиратели са доста поляризирани, така че подкрепата за Ердоган не е чак толкова намаляла въпреки влошаващата се ситуация.
Дори и да спечели президентските избори, е малко вероятно ПСР да получи парламентарно мнозинство. И това ще бъде нова политическа картина за Турция. За първи път ще възникне подобна ситуация, откакто Турция е президентска република. За Ердоган ще е много по-трудно да управлява страната без парламентарно мнозинство. Ще бъде изправен пред политическа нестабилност и конституционни кризи. Без парламентарно мнозинство няма да може да прави популистки стъпки, особено по икономически въпроси.
Последните местни избори създадоха впечатление за възможен пробив, след като Истанбул беше спечелен от основния противник на ПСР. Възможен ли е такъв сценарий и на настоящите избори?
Както беше и по време на истанбулските избори, ако Ердоган изгуби, ще иска отмяна на изборите заради изборни нарушения. Но за турските избиратели вотът е свещен. Подобни действия обикновено имат последствия. Бихме могли да предположим, че ако Ердоган все пак изгуби изборите, ще сдаде президентската институция без бой.
Но както и в Израел, продължителността на управлението на опозицията ще зависи единствено от способността ѝ да остане обединена. Сега основен приоритет на опозицията е да се противопоставя на Ердоган. В една постердоганска ера в турската политика обаче може и да е трудно за обединената опозиция да има общи политики в области като икономиката, външната политика и по Кюрдския въпрос. Подобна политическа нестабилност би върнала Ердоган на власт.
В книгата „Новата Турция и нейните недоволства“ говорите за привлекателността на ПСР. След всички години управление нито ПСР, нито полагащата усилия опозиция изглеждат толкова привлекателни. Ще се съгласите ли, че няма очевиден победител?
Цялата политическа система е разделен на про- и антиердогански групи. По време на управлението на Ердоган независимите институции бяха отслабени, ако не и напълно заличени или политизирани. Президентската република зависи изцяло от Ердоган и неговата харизма. Парламентът няма почти никакво значение. Партията на Ердоган или висшите членове на партиите нямат никаква власт в турската политическа система.
В ерата след Ердоган ще трябва да се построи нова Турция с независими институции, особено по отношение на бюрокрацията и на съдебната власт. Все още не знаем как опозицията на Ердоган, която е доста разнородна, ще се справи с такава сложна задача. Възможно е след приключването на управлението на Ердоган да се влезе в период на политическа нестабилност. Така се случи след силно авторитарни политици като Мендерес и Йозал.
Наскоро Турция беше сполетяна от сериозно бедствие – опустошително земетресение. Смятате ли, че то би могло да повлияе на изборните резултати?
Да, земетресението би могло да повлияе на изхода от изборите. Има две възможности: вотът за Ердоган ще спадне след земетресението или избирателят ще реши, че Ердоган е най-доброто лекарство за ужаса от природното бедствие. В градовете в Централен Анадол, където Ердоган има сериозна подкрепа, е трудно да очакваме спад във вота за него. Но земетресението може да повлияе на колебаещите се и на избиратели, които все още не са направили своя избор.
Какви според Вас са основните проблеми, които посочват политическите кандидати в предизборните си платформи в опит да спечелят вота? Кои нерешени въпроси вълнуват турското общество?
Основният е състоянието на икономиката. Както и в останалата част от света, така и в Турция има сериозни икономически проблеми заради повишаването на цените на храните и горивата. Нетрадиционната икономическа политика на Ердоган прави ситуацията още по-трудна.
Към дневния ред на гласоподавателите се прибавят проблемите със сирийските бежанци и със сигурността, в това число и Кюрдският въпрос. Кандидатът на опозицията Кемал Кълъчдароглу обяви за първи път в Twitter, че е с алевитски произход, което се приближава до шиитския ислям. Това може да повлияе негативно на консервативните избиратели, гласуващи за опозицията.
Да се опитаме да видим как стои Турция регионално и глобално от Ваша гледна точка. Минаха повече от 10 години, откакто Анкара се намеси в Сирия. Продължи да разширява присъствието си в Кавказ и отвъд, установявайки присъствие и в Залива, като към момента разполага с 4000 души военен контингент, разположен в Доха от 2017 г. насам. Войната в Украйна отвори нова възможност за Анкара да влезе в ролята на медиатор. Ще се съгласите ли, че усилията на турската дипломация засега не са особено успешни? Ако да – защо? Какъв интерес има Турция от конфликта в Украйна?
Дипломатическата роля на Турция като медиатор се изпълнява на високо държавно ниво от президента Ердоган. Затова станахме свидетели на много срещи на високо равнище – като тази в Астана, – организирани в опит да се потуши политическото напрежение. Въпреки това турската дипломация не се справя успешно в намирането на устойчиви решения на дългосрочни политически кризи. В повечето случаи политиката ѝ е да менажира конфликта, но не и да намира решение.
По време на войната в Украйна Турция поддържа връзките си и с Русия, и със Запада, като е една от малкото държави в западния блок, които имат директна връзка с руския режим. В конфликти като тези в Сирия, Либия и Кавказ, в които Турция има балансираща роля, тя не се конфронтира с Русия. И това реално е същността на нейната дипломация.
Продължителността на кризата може и да има негативен ефект върху Турция, но въпреки това именно продължаването на конфликта я прави важен политически актьор в международната система. Ето защо вместо да гледаме на Турция като на страна, която намира решения на кризите, е по-добре да я погледнем като страна, която изпъква по време на кризи.
Виждате ли възможност за промяна в турската вътрешна и външна политика след изборите?
Ако Ердоган запази властта си, не очаквам промяна. Но ако опозицията спечели президентските избори, ще има известни промени във външната политика. Например отношенията на Турция с ЕС, САЩ и НАТО ще се подобрят. Но посоката по сложни теми като Сирия и Кюрдския въпрос ще остане същата. Турция ще продължи да търси баланса в отношенията си с Русия и Украйна.
Какво е Вашето мнение за стратегията на Турция на Балканите? България традиционно е доста чувствителна и предпазлива, когато става въпрос за Анкара. Нашите добросъседски отношения са внимателно премерени и преценявани. Какво вижда Анкара, когато обърне поглед на запад?
За България има по-големи рискове във връзка с турската политика след Ердоган. Например в началото на войната на Русия в Украйна Ердоган взе много бързо решение да пренасочи турски газ към България, като по този начин намали зависимостта на София от Москва. Много ще е трудно за различните партии да се обединяват и да вземат бързи решения по такива въпроси. Проблемът със сирийските бежанци в Турция е сериозна тема за опозицията и след изборите тя може да се опита да договори нова сделка с ЕС. За да има по-силен коз, Турция може да разхлаби контрола по границите, което може да доведе до нова бежанска вълна в Европа и конкретно в България.
Today we wanted to focus on LATAM and show how our network performed against Zscaler and Netskope in Argentina, Brazil, Chile, Colombia, Costa Rica, Ecuador, Mexico, Peru, Uruguay and Venezuela.
With 47 data centers across Latin America and Caribbean, Cloudflare has the largest number of SASE Points of Presence across all vendors, meaning we can offer our Zero Trust services closer to the end user and reduce unwanted latency.
We’ve run a series of tests comparing our Zero Trust Network Access product against Zscaler and Netskope’s comparable products.
For each of these tests, we used 95th percentile Time to First Byte and Response tests, which measure the time it takes for a user to make a request, and get the start of the response (Time to First Byte), and the end of the response (Response). These tests were designed with the goal of trying to measure performance from an end-user perspective.
In this blog we’re going to talk about why performance matters and do a deep dive on what we’re measuring to show that we’re faster.
Why does performance matter?
Performance matters because it impacts your employees' experience and their ability to get their job done. For example, if Anna is connecting to a hosted, protected application like Salesforce to complete some work, she doesn’t want to be waiting constantly for pages to load or to authenticate her requests. In an access-controlled application, the first thing you do when you connect is you log in. If that login takes a long time, you may get distracted with a random message from a coworker and even when you get authenticated, you still want your normal application experience to be snappy and smooth: users should never notice Zero Trust when it’s at its best.
If these products or experiences are slow, then something worse might happen than your users complaining: they may find ways to turn off the products or bypass them, which puts your company at risk. A Zero Trust product suite is completely ineffective if no one is using it because it’s slow.
Ensuring Zero Trust is fast is critical to the effectiveness of a Zero Trust solution: employees won’t want to turn it off and put themselves at risk if they barely know it’s there at all. Services like Zscaler or Netskope may outperform many older, antiquated solutions, but their network still fails to measure up to a highly performant, optimized network like Cloudflare’s.
Cloudflare Access: the fastest Zero Trust proxy
Access control needs to be seamless and transparent to the user: the best compliment for a Zero Trust solution is employees barely notice it’s there. Services like Cloudflare Access and Zscaler Private Access (ZPA) allow users to cache authentication information on the provider network, ensuring applications can be accessed securely and quickly to give users that seamless experience they want. So having a network that minimizes the number of logins required while also reducing the latency of your application requests by delivering the service closer to the user will help keep your Internet experience snappy and reactive.
For these tests, Cloudflare contracted Miercom, a third party who performed a set of tests that was intended to replicate an end-user connecting to a resource protected by Cloudflare, Zscaler and Netskope. Miercom set up application instances in 14 locations around the world, and devised a test that would log into the application through various Zero Trust providers to access certain content. The test methodology is described as follows, but you can look at the full report from Miercom detailing their test methodology here:
User connects to the application from a browser mimicked by a Catchpoint instance – new session
User authenticates against their identity provider
User accesses resource
User refreshes the browser page and tries to access the same resource but with credentials already present – existing session
In this test we evaluated Cloudflare against Zscaler and Netskope accessing applications hosted in two specific regions (Brazil and the US south-west). We tested the response time for an existing session, when a user has already been authenticated and that authentication information can be cached.
Here’s how this data looks for each of the 10 countries we tested across LATAM:
Argentina
Zero Trust Access – Time to First Byte (App in Brazil)
95th Percentile (ms)
Cloudflare
1,203
Netskope
8,319
Zscaler
5,961
When we drill into the data, we see that Cloudflare is faster when connecting from Argentina to an app hosted in Brazil. Cloudflare’s 95th percentile time to first byte times are 75% faster than Zscaler and 85% faster than Netskope.
Cloudflare is also faster when connecting from Argentina to an app hosted in the United States (South West Region). Cloudflare’s 95th percentile time to first byte times are 70% faster than Zscaler and 68% faster than Netskope:
Zero Trust Access – Time to First Byte (App in US West)
95th Percentile (ms)
Cloudflare
1,587
Netskope
5,082
Zscaler
5,299
Brazil
Zero Trust Access – Time to First Byte (App in Brazil)
95th Percentile (ms)
Cloudflare
1,525
Netskope
3,799
Zscaler
3,916
When we drill into the data, we see that Cloudflare is faster when connecting from Brazil to an app hosted in Brazil. Cloudflare’s 95th percentile time to first byte times are 61% faster than Zscaler and 59% faster than Netskope.
Cloudflare is also faster when connecting from Brazil to an app hosted in the United States (South West Region). Cloudflare’s 95th percentile time to first byte times are 58% faster than Zscaler and 59% faster than Netskope:
Zero Trust Access – Time to First Byte (App in US West)
95th Percentile (ms)
Cloudflare
1,603
Netskope
3,989
Zscaler
3,894
Chile
Zero Trust Access – Time to First Byte (App in Brazil)
95th Percentile (ms)
Cloudflare
714
Netskope
3,000
Zscaler
3,157
When we drill into the data, we see that Cloudflare is faster when connecting from Chile to an app hosted in Brazil. Cloudflare’s 95th percentile time to first byte times are 77% faster than Zscaler and 76% faster than Netskope.
Cloudflare is also faster when connecting from Chile to an app hosted in the United States (South West Region). Cloudflare’s 95th percentile time to first byte times are 80% faster than Zscaler and 79% faster than Netskope:
Zero Trust Access – Time to First Byte (App in US West)
95th Percentile (ms)
Cloudflare
648
Netskope
3,113
Zscaler
3,290
Colombia
Zero Trust Access – Time to First Byte (App in Brazil)
95th Percentile (ms)
Cloudflare
1,628
Netskope
2,699
Zscaler
4,763
When we drill into the data, we see that Cloudflare is faster when connecting from Colombia to an app hosted in Brazil. Cloudflare’s 95th percentile time to first byte times are 65% faster than Zscaler and 39% faster than Netskope.
Cloudflare is also faster when connecting from Colombia to an app hosted in the United States (South West Region). Cloudflare’s 95th percentile time to first byte times are 59% faster than Zscaler and 56% faster than Netskope:
Zero Trust Access – Time to First Byte (App in US West)
95th Percentile (ms)
Cloudflare
1,466
Netskope
3,351
Zscaler
3,623
Costa Rica
Zero Trust Access – Time to First Byte (App in Brazil)
95th Percentile (ms)
Cloudflare
1,432
Netskope
2,036
Zscaler
2,110
When we drill into the data, we see that Cloudflare is faster when connecting from Costa Rica to an app hosted in Brazil. Cloudflare’s 95th percentile time to first byte times are 32% faster than Zscaler and 29% faster than Netskope.
Cloudflare is also faster when connecting from Costa Rica to an app hosted in the United States (South West Region). Cloudflare’s 95th percentile time to first byte times are 36% faster than Zscaler and 32% faster than Netskope:
Zero Trust Access – Time to First Byte (App in US West)
95th Percentile (ms)
Cloudflare
1,387
Netskope
2,044
Zscaler
2,191
Ecuador
Zero Trust Access – Time to First Byte (App in Brazil)
95th Percentile (ms)
Cloudflare
1,134
Netskope
2,002
Zscaler
2,206
When we drill into the data, we see that Cloudflare is faster when connecting from Ecuador to an app hosted in Brazil. Cloudflare’s 95th percentile time to first byte times are 48% faster than Zscaler and 43% faster than Netskope.
Cloudflare is also faster when connecting from Ecuador to an app hosted in the United States (South West Region). Cloudflare’s 95th percentile time to first byte times are 46% faster than Zscaler and 40% faster than Netskope:
Zero Trust Access – Time to First Byte (App in US West)
95th Percentile (ms)
Cloudflare
1,179
Netskope
1,976
Zscaler
2,210
Mexico
Zero Trust Access – Time to First Byte (App in Brazil)
95th Percentile (ms)
Cloudflare
2,334
Netskope
2,882
Zscaler
3,537
When we drill into the data, we see that Cloudflare is faster when connecting from Mexico to an app hosted in Brazil. Cloudflare’s 95th percentile time to first byte times are 34% faster than Zscaler and 19% faster than Netskope.
Cloudflare is also faster when connecting from Mexico to an app hosted in the United States (South West Region). Cloudflare’s 95th percentile time to first byte times are 56% faster than Zscaler and 53% faster than Netskope:
Zero Trust Access – Time to First Byte (App in US West)
95th Percentile (ms)
Cloudflare
1,249
Netskope
2,679
Zscaler
2,880
Peru
Zero Trust Access – Time to First Byte (App in Brazil)
95th Percentile (ms)
Cloudflare
609
Netskope
2,425
Zscaler
2,992
When we drill into the data, we see that Cloudflare is faster when connecting from Peru to an app hosted in Brazil. Cloudflare’s 95th percentile time to first byte times are 79% faster than Zscaler and 74% faster than Netskope.
Cloudflare is also faster when connecting from Peru to an app hosted in the United States (South West Region). Cloudflare’s 95th percentile time to first byte times are 80% faster than Zscaler and 73% faster than Netskope:
Zero Trust Access – Time to First Byte (App in US West)
95th Percentile (ms)
Cloudflare
827
Netskope
3,108
Zscaler
4,189
Uruguay
Zero Trust Access – Time to First Byte (App in Brazil)
95th Percentile (ms)
Cloudflare
1,242
Netskope
3,556
Zscaler
4,467
When we drill into the data, we see that Cloudflare is faster when connecting from Uruguay to an app hosted in Brazil. Cloudflare’s 95th percentile time to first byte times are 72% faster than Zscaler and 65% faster than Netskope.
Cloudflare is also faster when connecting from Uruguay to an app hosted in the United States (South West Region). Cloudflare’s 95th percentile time to first byte times are 60% faster than Zscaler and 48% faster than Netskope:
Zero Trust Access – Time to First Byte (App in US West)
95th Percentile (ms)
Cloudflare
1078
Netskope
2,101
Zscaler
2,726
Venezuela
Zero Trust Access – Time to First Byte (App in Brazil)
95th Percentile (ms)
Cloudflare
1,272
Netskope
3,451
Zscaler
3,800
When we drill into the data, we see that Cloudflare is faster when connecting from Venezuela to an app hosted in Brazil. Cloudflare’s 95th percentile time to first byte times are 66% faster than Zscaler and 63% faster than Netskope.
Cloudflare is also faster when connecting from Venezuela to an app hosted in the United States (South West Region). Cloudflare’s 95th percentile time to first byte times are 85% faster than Zscaler and 77% faster than Netskope:
Zero Trust Access – Time to First Byte (App in US West)
New reporting from Wired reveals that the Department of Justice detected the SolarWinds attack six months before Mandiant detected it in December 2020, but didn’t realize what it detected—and so ignored it.
WIRED can now confirm that the operation was actually discovered by the DOJ six months earlier, in late May 2020—but the scale and significance of the breach wasn’t immediately apparent. Suspicions were triggered when the department detected unusual traffic emanating from one of its servers that was running a trial version of the Orion software suite made by SolarWinds, according to sources familiar with the incident. The software, used by system administrators to manage and configure networks, was communicating externally with an unfamiliar system on the internet. The DOJ asked the security firm Mandiant to help determine whether the server had been hacked. It also engaged Microsoft, though it’s not clear why the software maker was also brought onto the investigation.
[…]
Investigators suspected the hackers had breached the DOJ server directly, possibly by exploiting a vulnerability in the Orion software. They reached out to SolarWinds to assist with the inquiry, but the company’s engineers were unable to find a vulnerability in their code. In July 2020, with the mystery still unresolved, communication between investigators and SolarWinds stopped. A month later, the DOJ purchased the Orion system, suggesting that the department was satisfied that there was no further threat posed by the Orion suite, the sources say.
EDITED TO ADD (5/4): More details about the SolarWinds attack from Wired.com.
To provide the best experiences, we use technologies like cookies to store and/or access device information. Consenting to these technologies will allow us to process data such as browsing behavior or unique IDs on this site. Not consenting or withdrawing consent, may adversely affect certain features and functions.
Functional
Always active
The technical storage or access is strictly necessary for the legitimate purpose of enabling the use of a specific service explicitly requested by the subscriber or user, or for the sole purpose of carrying out the transmission of a communication over an electronic communications network.
Preferences
The technical storage or access is necessary for the legitimate purpose of storing preferences that are not requested by the subscriber or user.
Statistics
The technical storage or access that is used exclusively for statistical purposes.The technical storage or access that is used exclusively for anonymous statistical purposes. Without a subpoena, voluntary compliance on the part of your Internet Service Provider, or additional records from a third party, information stored or retrieved for this purpose alone cannot usually be used to identify you.
Marketing
The technical storage or access is required to create user profiles to send advertising, or to track the user on a website or across several websites for similar marketing purposes.


 Damon is a Principal Developer Advocate on the EMR team at AWS. He’s worked with data and analytics pipelines for over 10 years and splits his team between splitting service logs and stacking firewood.


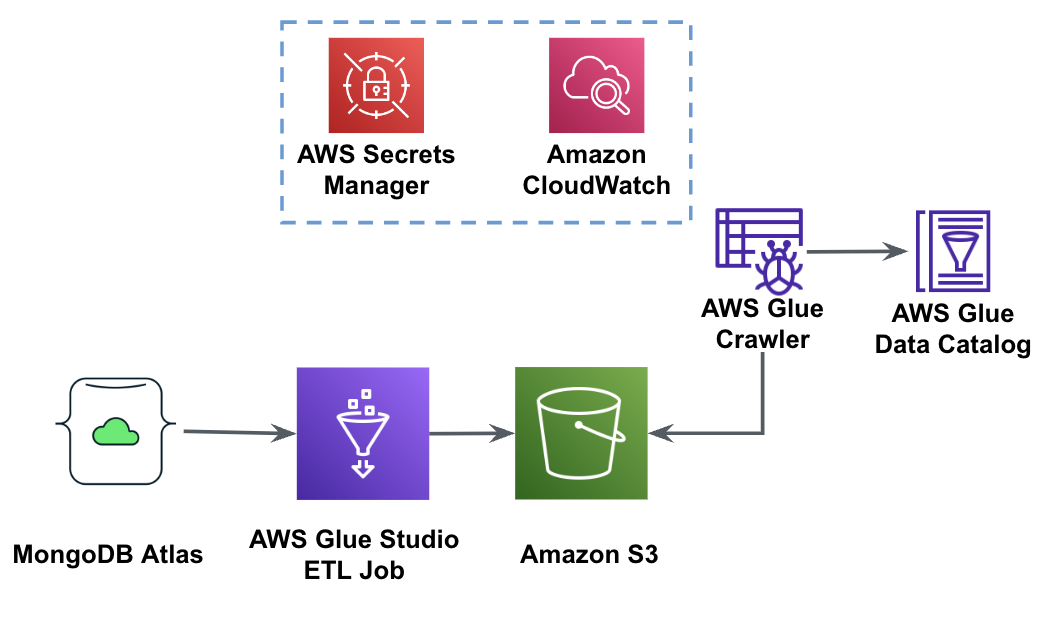


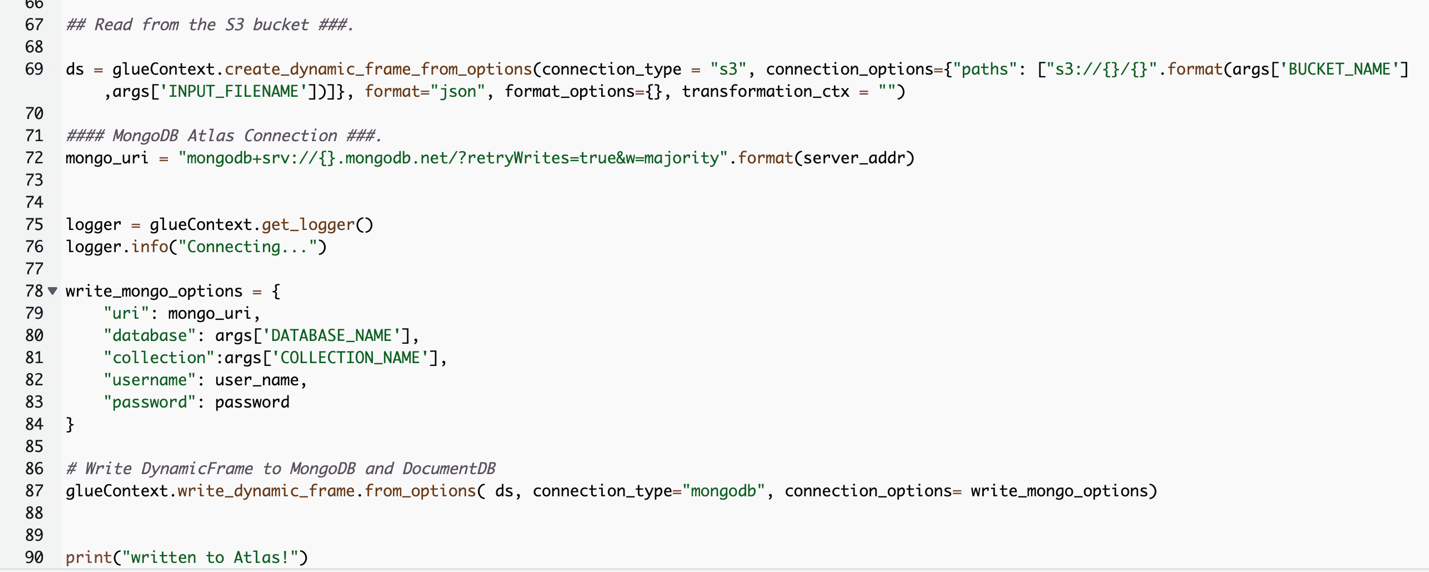
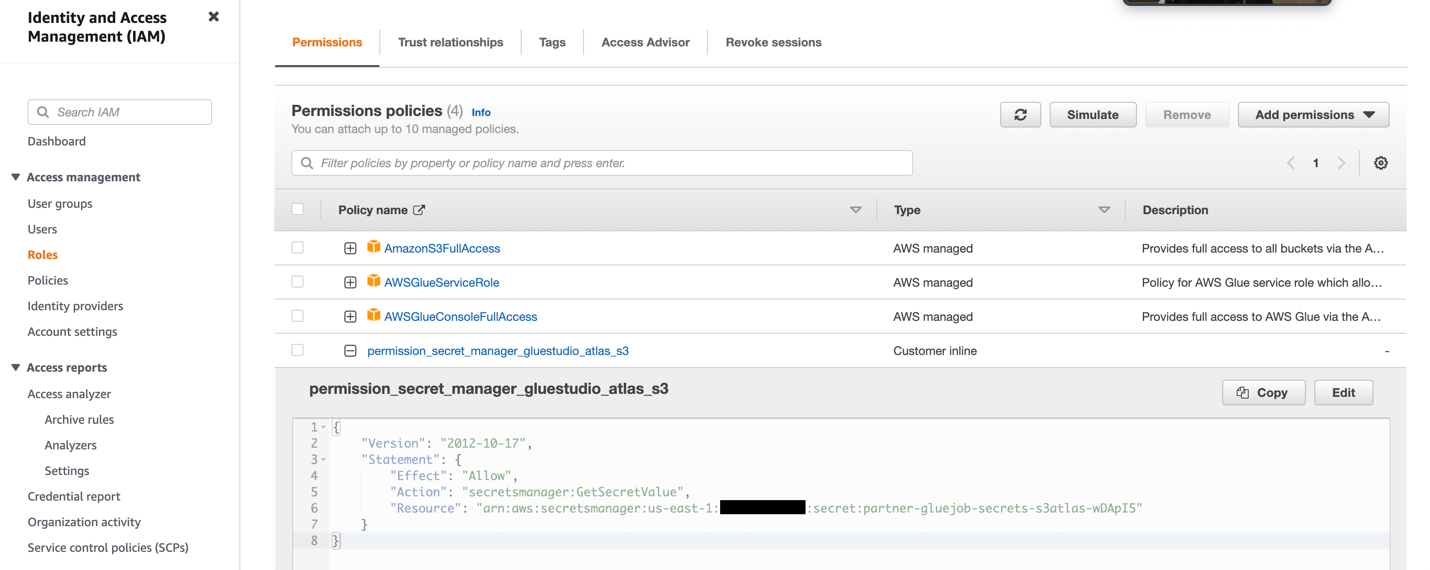


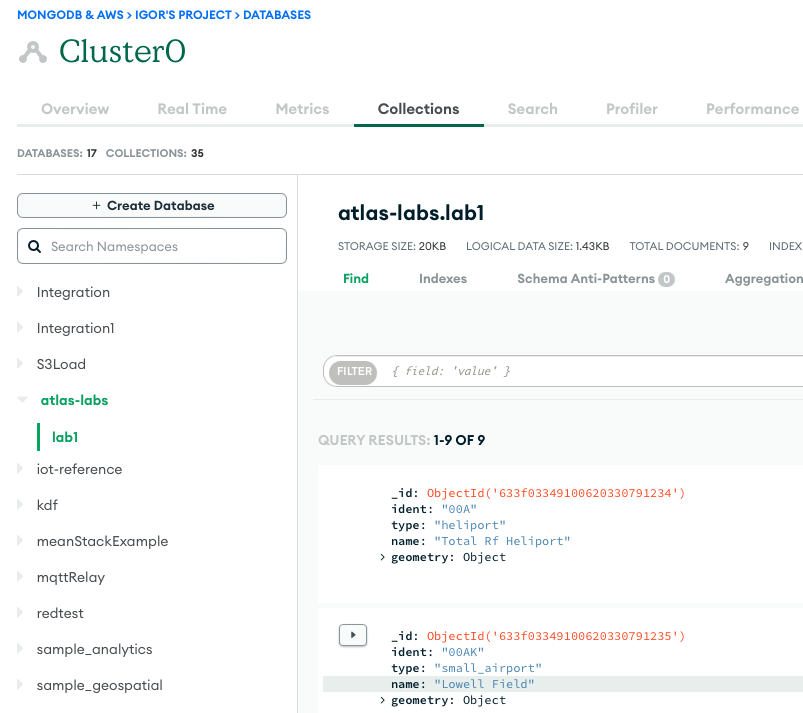


 Babu Srinivasan is a Senior Partner Solutions Architect at MongoDB. In his current role, he is working with AWS to build the technical integrations and reference architectures for the AWS and MongoDB solutions. He has more than two decades of experience in Database and Cloud technologies . He is passionate about providing technical solutions to customers working with multiple Global System Integrators(GSIs) across multiple geographies.