Build efficient, cross-Regional, I/O-intensive workloads with Dask on AWS

Post Syndicated from Patrick O'Connor original https://aws.amazon.com/blogs/big-data/build-efficient-cross-regional-i-o-intensive-workloads-with-dask-on-aws/

Welcome to the era of data. The sheer volume of data captured daily continues to grow, calling for platforms and solutions to evolve. Services such as Amazon Simple Storage Service (Amazon S3) offer a scalable solution that adapts yet remains cost-effective for growing datasets. The Amazon Sustainability Data Initiative (ASDI) uses the capabilities of Amazon S3 to provide a no-cost solution for you to store and share climate science workloads across the globe. Amazon’s Open Data Sponsorship Program allows organizations to host free of charge on AWS.

Over the last decade, we’ve seen a surge in data science frameworks coming to fruition, along with mass adoption by the data science community. One such framework is Dask, which is powerful for its ability to provision an orchestration of worker compute nodes, thereby accelerating complex analysis on large datasets.

In this post, we show you how to deploy a custom AWS Cloud Development Kit (AWS CDK) solution that extends Dask’s functionality to work inter-Regionally across Amazon’s global network. The AWS CDK solution deploys a network of Dask workers across two AWS Regions, connecting into a client Region. For more information, refer to Guidance for Distributed Computing with Cross Regional Dask on AWS and the GitHub repo for open-source code.

After deployment, the user will have access to a Jupyter notebook, where they can interact with two datasets from ASDI on AWS: Coupled Model Intercomparison Project 6 (CMIP6) and ECMWF ERA5 Reanalysis. CMIP6 focuses on the sixth phase of global coupled ocean-atmosphere general circulation model ensemble; ERA5 is the fifth generation of ECMWF atmospheric reanalyses of the global climate, and the first reanalysis produced as an operational service.

This solution was inspired by work with a key AWS customer, the UK Met Office. The Met Office was founded in 1854 and is the national meteorological service for the UK. They provide weather and climate predictions to help you make better decisions to stay safe and thrive. A collaboration between the Met Office and EUMETSAT, detailed in Data Proximate Computation on a Dask Cluster Distributed Between Data Centres, highlights the growing need to develop a sustainable, efficient, and scalable data science solution. This solution achieves this by bringing compute closer to the data, rather than forcing the data to come closer to compute resources, which adds cost, latency, and energy.

Solution overview

Each day, the UK Met Office produces up to 300 TB of weather and climate data, a portion of which is published to ASDI. These datasets are distributed across the world and hosted for public use. The Met Office would like to enable consumers to make the more of their data to help inform critical decisions on addressing issues such as better preparation for climate change-induced wildfires and floods, and reducing food insecurity through better crop yield analysis.

Traditional solutions in use today, particularly with climate data, are time consuming and unsustainable, replicating datasets cross Regions. Unnecessary data transfer on the petabyte scale is costly, slow, and consumes energy.

We estimated that if this practice were adopted by the Met Office users, the equivalent of 40 homes’ daily power consumption could be saved every day, and they could also reduce the transfer of data between regions.

The following diagram illustrates the solution architecture.

The solution can be broken into three major segments: client, workers, and network. Let’s dive into each and see how they come together.

Client

The client represents the source Region where data scientists connect. This Region (Region A in the diagram) contains an Amazon SageMaker notebook, an Amazon OpenSearch Service domain, and a Dask scheduler as key components. System administrators have access to the built-in Dask dashboard exposed via an Elastic Load Balancer.

Data scientists have access to the Jupyter notebook hosted on SageMaker. The notebook is able to connect and run workloads on the Dask scheduler. The OpenSearch Service domain stores metadata on the datasets connected at the Regions. Notebook users can query this service to retrieve details such as the correct Region of Dask workers without needing to know the data’s Regional location beforehand.

Worker

Each of the worker Regions (Regions B and C in the diagram) is comprised of an Amazon Elastic Container Service (Amazon ECS) cluster of Dask workers, an Amazon FSx for Lustre file system, and a standalone Amazon Elastic Compute Cloud (Amazon EC2) instance. FSx for Lustre allows Dask workers to access and process Amazon S3 data from a high-performance file system by linking your file systems to S3 buckets. It provides sub-millisecond latencies, up to hundreds of GBs/s of throughput, and millions of IOPS. A key feature of Lustre is that only the file system’s metadata is synced. Lustre manages the balance of files to be loaded in and kept warm, based on demand.

Worker clusters scale based on CPU usage, provision additional workers in extended periods of demand, and scale down as resources become idle.

Each night at 0:00 UTC, a data sync job prompts the Lustre file system to resync with the attached S3 bucket, and pulls an up-to-date metadata catalog of the bucket. Subsequently, the standalone EC2 instance pushes these updates into OpenSearch Service respective to that Region’s index. OpenSearch Service provides the necessary information to the client as to which pool of workers should be called upon for a particular dataset.

Network

Networking forms the crux of this solution, utilizing Amazon’s internal backbone network. By using AWS Transit Gateway, we’re able to connect each of the Regions to each other without needing to traverse the public internet. Each of the workers are able to connect dynamically into the Dask scheduler, allowing data scientists to run inter-regional queries through Dask.

Prerequisites

The AWS CDK package uses the TypeScript programming language. Follow the steps in Getting Started for AWS CDK to set up your local environment and bootstrap your development account (you’ll need to bootstrap all Regions specified in the GitHub repo).

For a successful deployment, you’ll need Docker installed and running on your local machine.

Deploy the AWS CDK package

Deploying an AWS CDK package is straightforward. After you install the prerequisites and bootstrap your account, you can proceed with downloading the code base.

  1. Download the GitHub repository:
    # Command to clone the repository
    git clone https://github.com/aws-solutions-library-samples/distributed-compute-on-aws-with-cross-regional-dask.git
    cd distributed-compute-on-aws-with-cross-regional-dask

  2. Install node modules:
    npm install

  3. Deploy the AWS CDK:
    npx cdk deploy --all

The stack can take over an hour and a half to deploy.

Code walkthrough

In this section, we inspect some of the key features of the code base. If you’d like to inspect the full code base, refer to the GitHub repository.

Configure and customize your stack

In the file bin/variables.ts, you’ll find two variable declarations: one for the client and one for workers. The client declaration is a dictionary with a reference to a Region and CIDR range. Customizing these variables will change both the Region and CIDR range of where client resources will deploy.

The worker variable copies this same functionality; however, it’s a list of dictionaries to accommodate adding or subtracting datasets the user wishes to include. Additionally, each dictionary contains the added fields of dataset and lustreFileSystemPath. Dataset is used to specify the connecting S3 URI for Lustre to connect to. The lustreFileSystemPath variable is used as a mapping for how the user wants that dataset to map locally on the worker file system. See the following code:

export const client: IClient = { region: "eu-west-2", cidr: "10.0.0.0/16" };

export const workers: IWorker[] = [
  {
    region: "us-east-1",
    cidr: "10.1.0.0/16",
    // The public s3 dataset on https://registry.opendata.aws/ you wish to connect to
    dataset: "s3://era5-pds",
    lustreFileSystemPath: "era5-pds",
  },
...]

Dynamically publish the scheduler IP

A challenge inherent to the cross-Regional nature of this project was maintaining a dynamic connection between the Dask workers and the scheduler. How could we publish an IP address, which is capable of changing, across AWS Regions? We were able to accomplish this through the use of AWS Cloud Map and associate-vpc-with-hosted-zone. The service abstracts allowing AWS to manage this DNS namespace privately. See the following code:

    /**
     * Below we initialise a private namespace which will keep track of the changing schedulers IP
     * The workers will need this IP to connect to, so instead of tracking it statically, they can
     * Simply reference the DNS which will resolve to the IP every time
     */
    const PrivateNP = new PrivateDnsNamespace(this, "local-dask", {
      name: "local-dask",
      vpc: this.vpc,
    });
    // Other regions will have to associate-vpc-with-hosted-zone to access this namespace
    new StringParameter(this, "PrivateNP Param", {
      parameterName: `privatenp-hostedid-param-${this.region}`,
      stringValue: PrivateNP.namespaceHostedZoneId,
    });
    this.schedulerDisovery = new Service(this, "Scheduler Discovery", {
      name: "Dask-Scheduler",
      namespace: PrivateNP,
    });

Jupyter notebook UI

The Jupyter notebook hosted on SageMaker provides scientists with a ready-made environment for deployment to easily connect and experiment on the loaded datasets. We used a lifecycle configuration script to provision the notebook with a preconfigured developer environment and example code base. See the following code:

  // The Sagemaker Notebook
  new CfnNotebookInstance(this, "Dask Notebook", {
    notebookInstanceName: "Dask-Notebook",
    rootAccess: "Disabled",
    directInternetAccess: "Disabled",
    defaultCodeRepository: repo.repositoryCloneUrlHttp,
    instanceType: "ml.t3.2xlarge",
    roleArn: role.roleArn,
    subnetId: this.vpc.privateSubnets[0].subnetId,
    securityGroupIds: [SagemakerSec.securityGroupId],
    lifecycleConfigName: lifecycle.notebookInstanceLifecycleConfigName,
    kmsKeyId: nbKey.keyId,
    platformIdentifier: "notebook-al2-v1",
    volumeSizeInGb: 50,
  });

Dask worker nodes

When it comes to the Dask workers, greater customizability is provided, more specifically on instance type, threads per container, and scaling alarms. By default, the workers provision on instance type m5d.4xlarge, mount to the Lustre file system on launch, and subdivide its workers and threads dynamically to ports. All this is optionally customizable. See the following code:

capacity: {
  instanceType: new InstanceType("m5d.4xlarge"),
  minCapacity: 0,
  maxCapacity: 12,
  vpcSubnets: {
    subnetType: SubnetType.PRIVATE_WITH_EGRESS,
  },
},

command: [
  "bin/sh",
  "-c",
  `pip3 install --upgrade xarray[complete] intake_esm s3fs eccodes git+https://github.com/gjoseph92/dask-worker-pools.git@main && dask worker Dask-Scheduler.local-dask:8786 --worker-port 9000:${
    9000 + NWORKERS - 1
  } --nanny-port ${9000 + NWORKERS}:${
    9000 + NWORKERS * 2 - 1
  } --resources pool-${
    this.region
  }=1 --nworkers ${NWORKERS} --nthreads ${THREADS} --no-dashboard`,
],

Performance

To assess performance, we use a sample computation and plotting of air temperature at 2 meters based on the difference between CMIP6 prediction for a month and ERA5 mean air temperature for 10 years. We set a benchmark of two workers in each Region and assess the difference in time reduction as additional workers were added. In theory, as the solution scales, there should be a productive material difference in reducing overall time.

The following table summarizes our dataset details.

Dataset Variables Disk Size Xarray Dataset Size Region
ERA5 2011–2020 (120 netcdf files) 53.5GB 364.1 GB us-east-1
CMIP6
variable_ids = ['tas'] # tas is air temperature at 2m above surface
table_id = 'Amon' # Monthly data from Atmosphere 
grid = 'gn' 
experiment_id = 'ssp245' 
activity_ids = ['ScenarioMIP', 'CMIP'] 
institution_id = 'MOHC'

1.13GB 0.11 GB us-west-2

The following table shows the results collected, showcasing the time (in seconds) for each computation and prediction in three stages in computing CMIP6 prediction, ERA5, and difference.

. . Number of Workers
Compute Region 2(CMIP) + 2(ERA) 2(CMIP) + 4(ERA) 2(CMIP) + 8(ERA)

2(CMIP)

+ 12(ERA)

CMIP6 (predicted_tas_regridded) us-west-2 11.8 11.5 11.2 11.6
ERA5 (historic_temp_regridded) us-east-1 1512 711 427 202
Difference (propogated pool) us-west-2 and us-east-1 1527 906 469 251

The following graph visualizes the performance and scale.
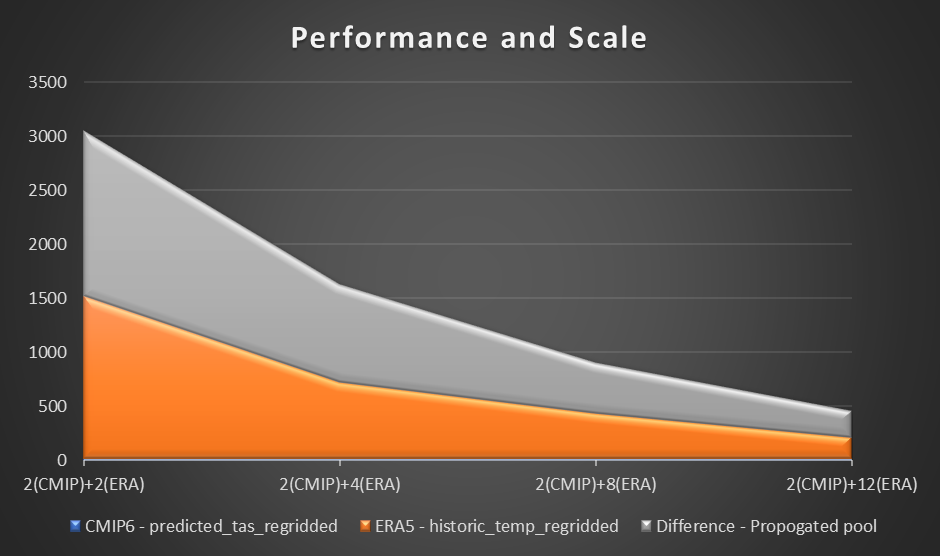
From our experiment, we observed a linear improvement on computation for the ERA5 dataset as the number of workers increased. As the numbers of workers increased, computation times were at times halved.

Jupyter notebook

As part of the solution launch, we deploy a preconfigured Jupyter notebook to help test the cross-Regional Dask solution. The notebook demonstrates the removed worry of needing to know the Regional location of datasets, instead querying a catalog through a series of Jupyter notebooks running in the background.

To get started, follow the instructions in this section.

The code for the notebooks can be found in lib/SagemakerCode with the primary notebook being ux_notebook.ipynb. This notebook calls upon other notebooks, triggering helper scripts. ux_notebook is designed to be the entry point for scientists, without the need for going elsewhere.

To get started, open this notebook in SageMaker after you have deployed the AWS CDK. The AWS CDK creates a notebook instance with all of the files in the repository loaded and backed up to an AWS CodeCommit repository.

To run the application, open and run the first cell of ux_notebook. This cell runs the get_variables notebook in the background, which prompts you for an input for the data you would like to select. We include an example; however, note that questions will only appear after the previous option has been selected. This is intentional in limiting the drop-down choices and is optionally configurable by editing the get_variables notebook.
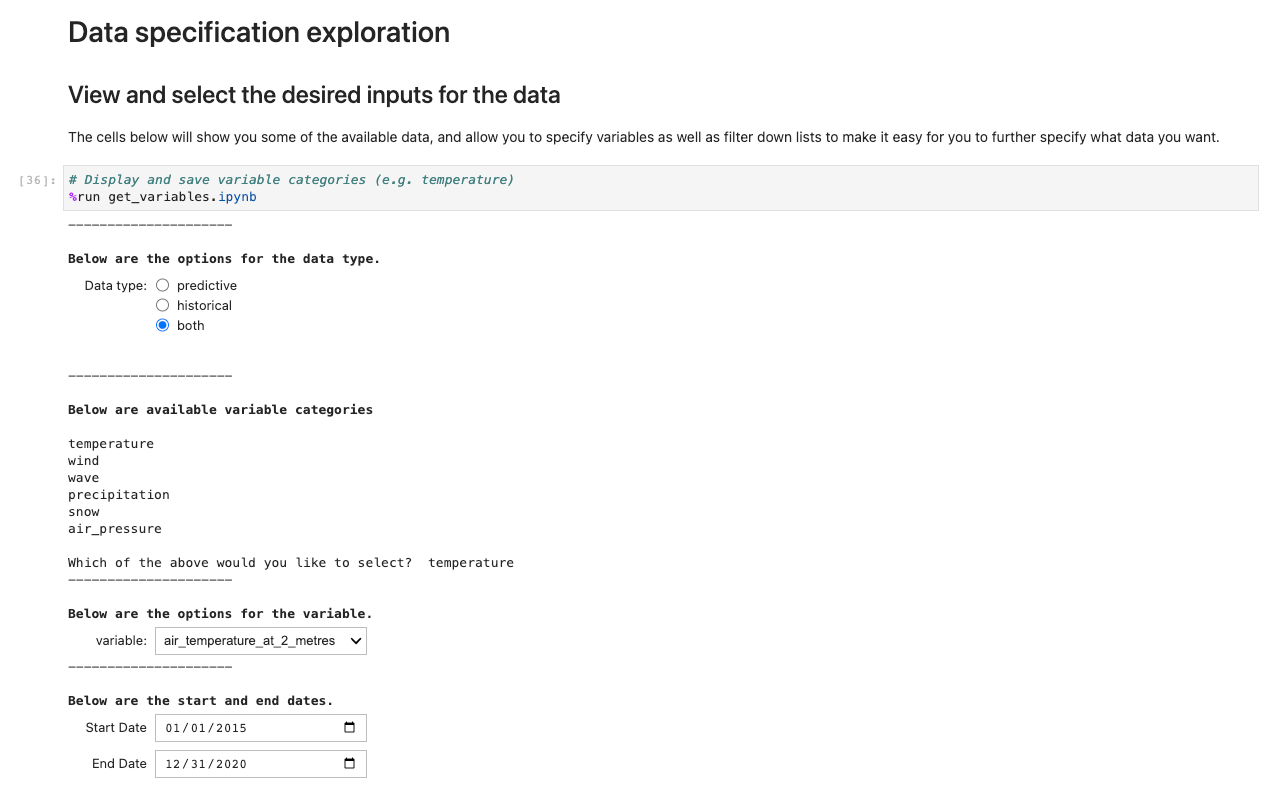
The preceding code stores variables globally so that other notebooks can retrieve and load your selection of choices. For demonstration, the next cell should output the save variables from before.
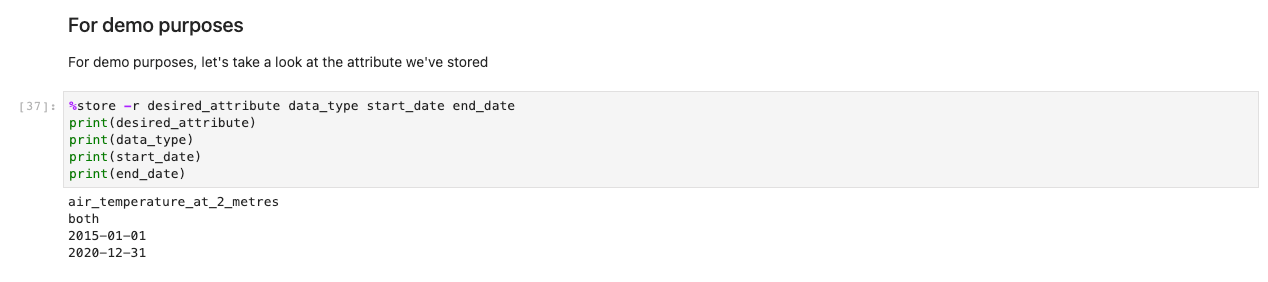
Next, a prompt for further data specifications appears. This cell refines the data you’re after by presenting the IDs of tables in human-readable format. Users select as if it were a form, but the titles map to tables in the background that help the system retrieve the appropriate datasets.
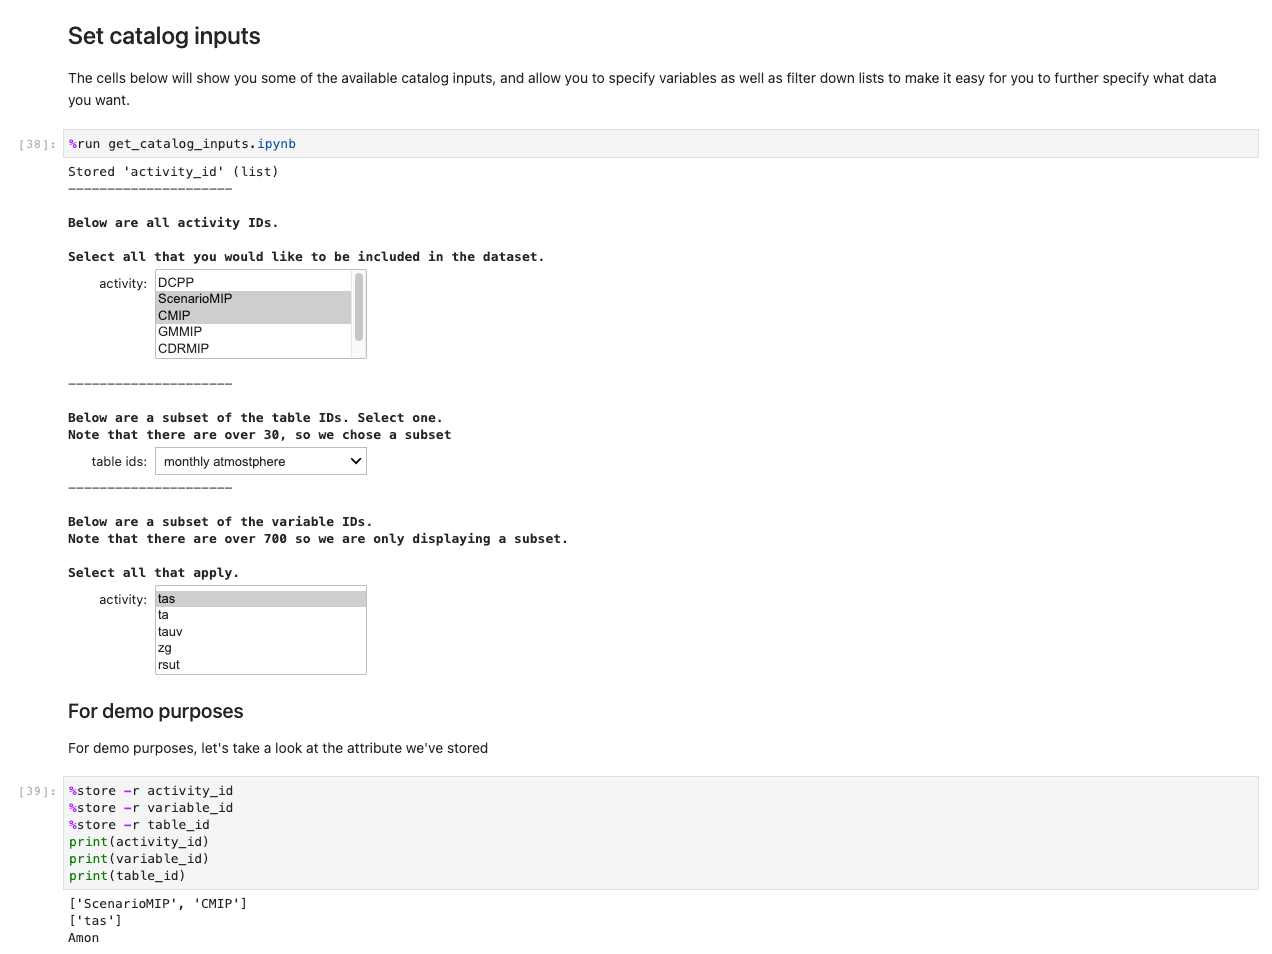
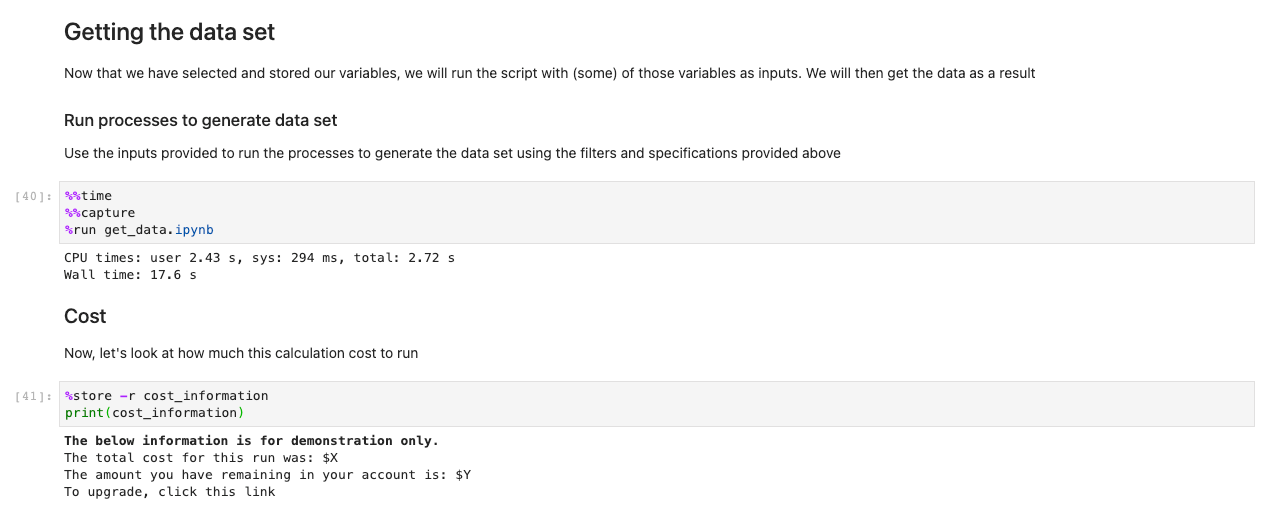
After you have stored all your choices and selection cells, load the data into the Regions by running the cell in the Getting the data set section. The %%capture command will suppress unnecessary outputs from the get_data notebook. Note you may remove this to inspect outputs from the other notebooks. Data is then retrieved in the backend.

While other notebooks are being run in the background, the only touchpoint for the user is the ux_notebook. This is to abstract the tedious process of importing data into a format any user is able to follow with ease.
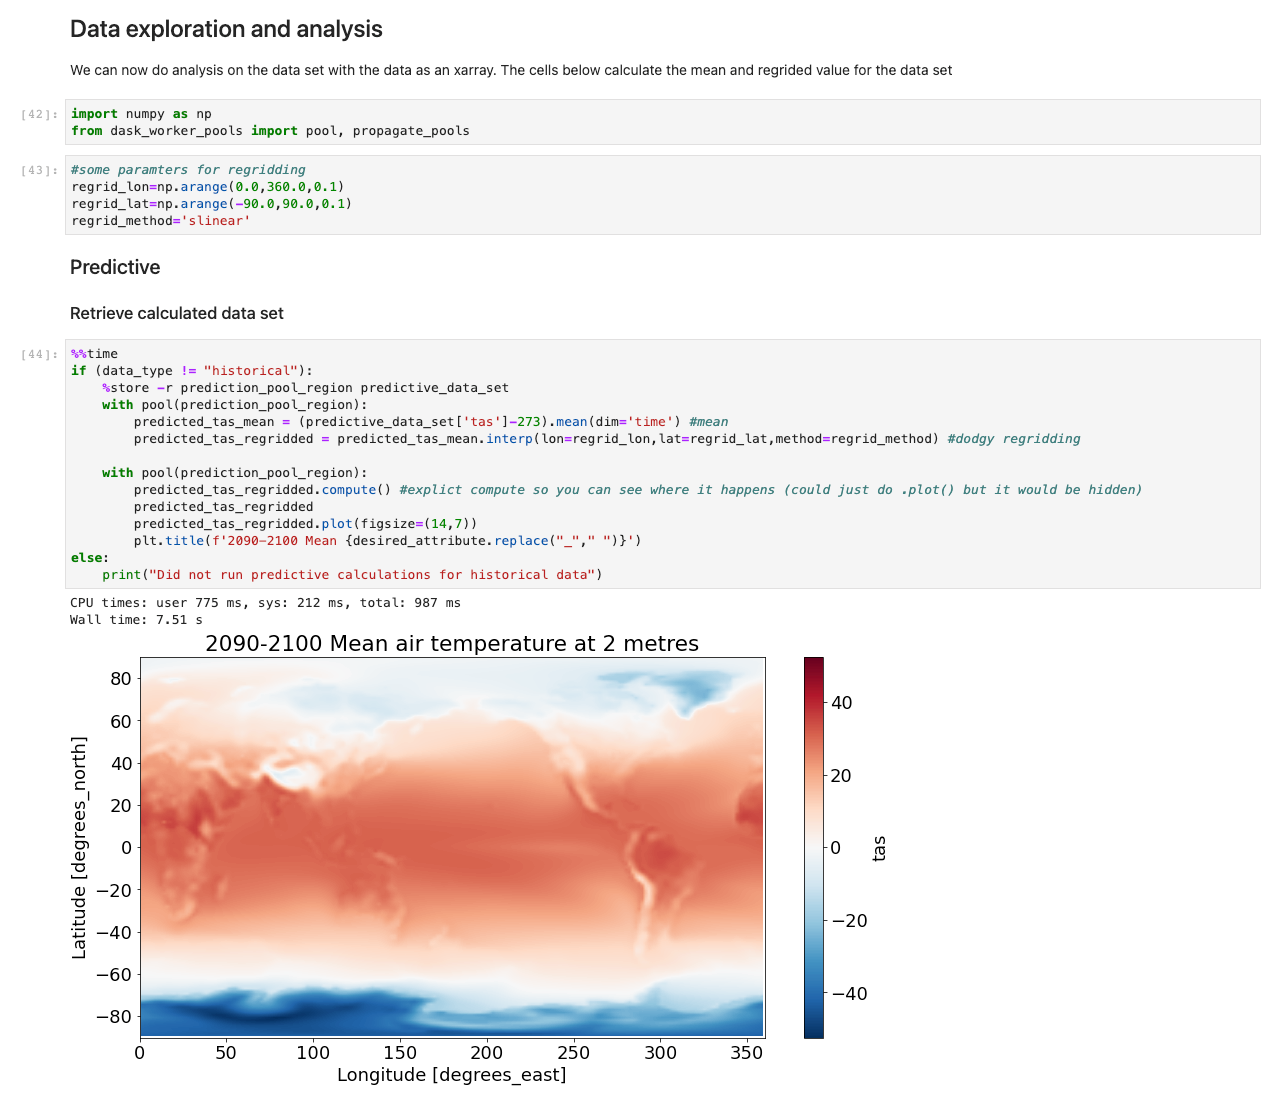
With the data now loaded, we can start interacting with it. The following cells are examples of calculations you may run on weather data. Using xarrays, we import, calculate, and then plot those datasets.

Our sample illustrates a plot of predictive data retrieving data, running the computation, and plotting the results in under 7.5 seconds—orders of magnitude faster than a typical approach.
Under the hood

The notebooks get_catalog_input and get_variables use the library ipywidgets to display widgets such as drop-downs and multi-box selections. These options are saved globally using the %%store command so that they can be accessed from the ux_notebook. One of the options prompts you on whether you want historical data, predictive data, or both. This variable is passed to the get_data notebook to determine which subsequent notebooks to run.

The get_data notebook first retrieves the shared OpenSearch Service domain saved to AWS Systems Manager Parameter Store. This domain allows our notebook to run a query on collecting information that will indicate where the selected datasets are stored Regionally. With those datasets located Regionally, the notebook will make a connection attempt to the Dask scheduler, passing the information collected from OpenSearch Service. The Dask scheduler in turn will be able to call on workers in the correct Regions.

How to customize and continue development

These notebooks are meant to be an example of how you can create a way for users to interface and interact with the data. The notebook in this post serves as an illustration for what’s possible, and we invite you to continue building upon the solution to further improve user engagement. The core part of this solution is the backend technology, but without some mechanism to interact with that backend, users won’t realize the full potential of the solution.

Clean up

To avoid incurring future charges, delete the resources. Let’s destroy our deployed solution with the following command:

npx cdk destroy –all

Conclusion

This post showcases the extension of Dask inter-Regionally on AWS, and a possible integration with public datasets on AWS. The solution was built as a generic pattern, and further datasets can be loaded in to accelerate high I/O analyses on complex data.

Data is transforming every field and every business. However, with data growing faster than most companies can keep track of, collecting data and getting value out of that data is challenging. A modern data strategy can help you create better business outcomes with data. AWS provides the most complete set of services for the end-to-end data journey to help you unlock value from your data and turn it into insight.

To learn more about the various ways to use your data on the cloud, visit the AWS Big Data Blog. We further invite you to comment with your thoughts on this post, and whether this is a solution you plan on trying out.


About the Authors

 Patrick O’Connor is a WWSO Prototyping Engineer based in London. He is a creative problem-solver, adaptable across a wide range of technologies, such as IoT, serverless tech, 3D spatial tech, and ML/AI, along with a relentless curiosity on how technology can continue to evolve everyday approaches.

Chakra Nagarajan is a Principal Machine Learning Prototyping SA with 21 years of experience in machine learning, big data, and high-performance computing. In his current role, he helps customers solve real-world complex business problems by building prototypes with end-to-end AI/ML solutions in cloud and edge devices. His ML specialization includes computer vision, natural language processing, time series forecasting, and personalization.

Val Cohen is a senior WWSO Prototyping Engineer based in London. A problem solver by nature, Val enjoys writing code to automate processes, build customer obsessed tools, and create infrastructure for various applications for her global customer base. Val has experience across a wide variety of technologies, such as front-end web development, backend work, and AI/ML.

Niall Robinson is Head of product futures at the UK Met Office. He and his team explore new ways the Met Office can provide value through product innovation and strategic partnerships. He’s had a varied career, leading a multidisciplinary informatics R&D team, academic research in data science, and field scientist along with climate modeler expertise.
Improve reliability and reduce costs of your Apache Spark workloads with vertical autoscaling on Amazon EMR on EKS

Post Syndicated from Rajkishan Gunasekaran original https://aws.amazon.com/blogs/big-data/improve-reliability-and-reduce-costs-of-your-apache-spark-workloads-with-vertical-autoscaling-on-amazon-emr-on-eks/

Amazon EMR on Amazon EKS is a deployment option offered by Amazon EMR that enables you to run Apache Spark applications on Amazon Elastic Kubernetes Service (Amazon EKS) in a cost-effective manner. It uses the EMR runtime for Apache Spark to increase performance so that your jobs run faster and cost less.

Apache Spark allows you to configure the amount of Memory and vCPU cores that a job will utilize. However, tuning these values is a manual process that can be complex and ripe with pitfalls. For example, allocating too little memory can result in out-of-memory exceptions and poor job reliability. On the other hand, too much can result in over-spending on idle resources, poor cluster utilization and high costs. Moreover, it’s hard to right-size these settings for some use cases such as interactive analytics due to lack of visibility into future requirements. In the case of recurring jobs, keeping these settings up to date taking into account changing load patterns (due to external seasonal factors for instance) remains a challenge.

To address this, Amazon EMR on EKS has recently announced support for vertical autoscaling, a feature that uses the Kubernetes Vertical Pod Autoscaler (VPA) to automatically tune the memory and CPU resources of EMR Spark applications to adapt to the needs of the provided workload, simplifying the process of tuning resources and optimizing costs for these applications. You can use vertical autoscaling’s ability to tune resources based on historic data to keep memory and CPU settings up to date even when the profile of the workload varies over time. Additionally, you can use its ability to react to real-time signals to enable applications recover from out-of-memory (OOM) exceptions, helping improve job reliability.

Vertical autoscaling vs existing autoscaling solutions

Vertical autoscaling complements existing Spark autoscaling solutions such as Dynamic Resource Allocation (DRA) and Kubernetes autoscaling solutions such as Karpenter.

Features such as DRA typically work on the horizontal axis, where an increase in load results in an increase in the number of Kubernetes pods that will process the load. In the case of Spark, this results in data being processed across additional executors. When DRA is enabled, Spark starts with an initial number of executors and scales this up if it observes that there are tasks sitting and waiting for executors to run on. DRA works at the pod level and would need an underlying cluster-level auto-scaler such as Karpenter to bring in additional nodes or scale down unused nodes in response to these pods getting created and deleted.

However, for a given data profile and a query plan, sometimes the parallelism and the number of executors can’t be easily changed. As an example, if you’re attempting to join two tables that store data already sorted and bucketed by the join keys, Spark can efficiently join the data by using a fixed number of executors that equals the number of buckets in the source data. Since the number of executors cannot be changed, vertical autoscaling can help here by offering additional resources or scaling down unused resources at the executor level. This has a few advantages:

  • If a pod is optimally sized, the Kubernetes scheduler can efficiently pack in more pods in a single node, leading to better utilization of the underlying cluster.
  • The Amazon EMR on EKS uplift is charged based on the vCPU and memory resources consumed by a Kubernetes pod.This means an optimally sized pod is cheaper.

How vertical autoscaling works

Vertical autoscaling is a feature that you can opt into at the time of submitting an EMR on EKS job. When enabled, it uses VPA to track the resource utilization of your EMR Spark jobs and derive recommendations for resource assignments for Spark executor pods based on this data. The data, fetched from the Kubernetes Metric Server, feeds into statistical models that VPA constructs in order to build recommendations. When new executor pods spin up belonging to a job that has vertical autoscaling enabled, they’re autoscaled based on this recommendation, ignoring the usual sizing done via Spark’s executor memory configuration (controlled by the spark.executor.memory Spark setting).

Vertical autoscaling does not impact pods that are running, since in-place resizing of pods remains unsupported as of Kubernetes version 1.26, the latest supported version of Kubernetes on Amazon EKS as of this writing. However, it’s useful in the case of a recurring job where we can perform autoscaling based on historic data as well as scenarios when some pods go out-of-memory and get re-started by Spark, where vertical autoscaling can be used to selectively scale up the re-started pods and facilitate automatic recovery.

Data tracking and recommendations

To recap, vertical autoscaling uses VPA to track resource utilization for EMR jobs. For a deep-dive into the functionality, refer to the VPA Github repo. In short, vertical autoscaling sets up VPA to track the container_memory_working_set_bytes metric for the Spark executor pods that have vertical autoscaling enabled.

Real-time metric data is fetched from the Kubernetes Metric Server. By default, vertical autoscaling tracks the peak memory working set size for each pod and makes recommendations based on the p90 of the peak with a 40% safety margin added in. It also listens to pod events such as OOM events and reacts to these events. In the case of OOM events, VPA automatically bumps up the recommended resource assignment by 20%.

The statistical models, which also represent historic resource utilization data are stored as custom resource objects on your EKS cluster. This means that deleting these objects also purges old recommendations.

Customized recommendations through job signature

One of the major use-cases of vertical autoscaling is to aggregate usage data across different runs of EMR Spark jobs to derive resource recommendations. To do so, you need to provide a job signature. This can be a unique name or identifier that you configure at the time of submitting your job. If your job recurs at a fixed schedule (such as daily or weekly), it’s important that your job signature doesn’t change for each new instance of the job in order for VPA to aggregate and compute recommendations across different runs of the job.

A job signature can be the same even across different jobs if you believe they’ll have similar resource profiles. You can therefore use the signature to combine tracking and resource modeling across different jobs that you expect to behave similarly. Conversely, if a job’s behavior is changing at some point in time, such as due to a change in the upstream data or the query pattern, you can easily purge the old recommendations by either changing your signature or deleting the VPA custom resource for this signature (as explained later in this post).

Monitoring mode

You can use vertical autoscaling in a monitoring mode where no autoscaling is actually performed. Recommendations are reported to Prometheus if you have that setup on your cluster and you can monitor the recommendations through Grafana dashboards and use that to debug and make manual changes to the resource assignments. Monitoring mode is the default but you can override and use one of the supported autoscaling modes as well at the time of submitting a job. Refer to documentation for usage and a walkthrough on how to get started.

Monitoring vertical autoscaling through kubectl

You can use the Kubernetes command-line tool kubectl to list active recommendations on your cluster, view all the job signatures that are being tracked as well as purge resources associated with signatures that aren’t relevant anymore. In this section, we provide some example code to demonstrate listing, querying, and deleting recommendations.

List all vertical autoscaling recommendations on a cluster

You can use kubectl to get the verticalpodautoscaler resource in order to view the current status and recommendations. The following sample query lists all resources currently active on your EKS cluster:

kubectl get verticalpodautoscalers \
-o custom-columns='NAME:.metadata.name,'\
'SIGNATURE:.metadata.labels.emr-containers\.amazonaws\.com/dynamic\.sizing\.signature,'\
'MODE:.spec.updatePolicy.updateMode,'\
'MEM:.status.recommendation.containerRecommendations[0].target.memory' \
--all-namespaces

This produces output similar to the following

NAME               SIGNATURE           MODE      MEM
ds-<some-id>-vpa   <some-signature>    Off       930143865
ds-<some-id>-vpa   <some-signature>    Initial   14291063673

Query and delete a recommendation

You can also use kubectl to purge recommendation for a job based on the signature. Alternately, you can use the --all flag and skip specifying the signature to purge all the resources on your cluster. Note that in this case you’ll actually be deleting the EMR vertical autoscaling job-run resource. This is a custom resource managed by EMR, deleting it automatically deletes the associated VPA object that tracks and stores recommendations. See the following code:

kubectl delete jobrun -n emr \
-l='emr-containers.amazonaws.com/dynamic.sizing.signature=<some-signature>'
jobrun.dynamicsizing.emr.services.k8s.aws "ds-<some-id>" deleted

You can use the --all and --all-namespaces to delete all vertical autoscaling related resources

kubectl delete jobruns --all --all-namespaces
jobrun.dynamicsizing.emr.services.k8s.aws "ds-<some-id>" deleted

Monitor vertical autoscaling through Prometheus and Grafana

You can use Prometheus and Grafana to monitor the vertical autoscaling functionality on your EKS cluster. This includes viewing recommendations that evolve over time for different job signatures, monitoring the autoscaling functionality etc. For this setup, we assume Prometheus and Grafana are already installed on your EKS cluster using the official Helm charts. If not, refer to the Setting up Prometheus and Grafana for monitoring the cluster section of the Running batch workloads on Amazon EKS workshop to get them up and running on your cluster.

Modify Prometheus to collect vertical autoscaling metrics

Prometheus doesn’t track vertical autoscaling metrics by default. To enable this, you’ll need to start gathering metrics from the VPA custom resource objects on your cluster. This can be easily done by patching your Helm chart with the following configuration:

helm upgrade -f prometheus-helm-values.yaml prometheus prometheus-community/prometheus -n prometheus

Here, prometheus-helm-values.yaml is the vertical autoscaling specific customization that tells Prometheus to gather vertical autoscaling related recommendations from the VPA resource objects, along with the minimal required metadata such as the job’s signature.

You can verify if this setup is working by running the following Prometheus queries for the newly created custom metrics:

  • kube_customresource_vpa_spark_rec_memory_target
  • kube_customresource_vpa_spark_rec_memory_lower
  • kube_customresource_vpa_spark_rec_memory_upper

These represent the lower bound, upper bound and target memory for EMR Spark jobs that have vertical autoscaling enabled. The query can be grouped or filtered using the signature label similar to the following Prometheus query:

kube_customresource_vpa_spark_rec_memory_target{signature=”<some-signature>”}

Use Grafana to visualize recommendations and autoscaling functionality

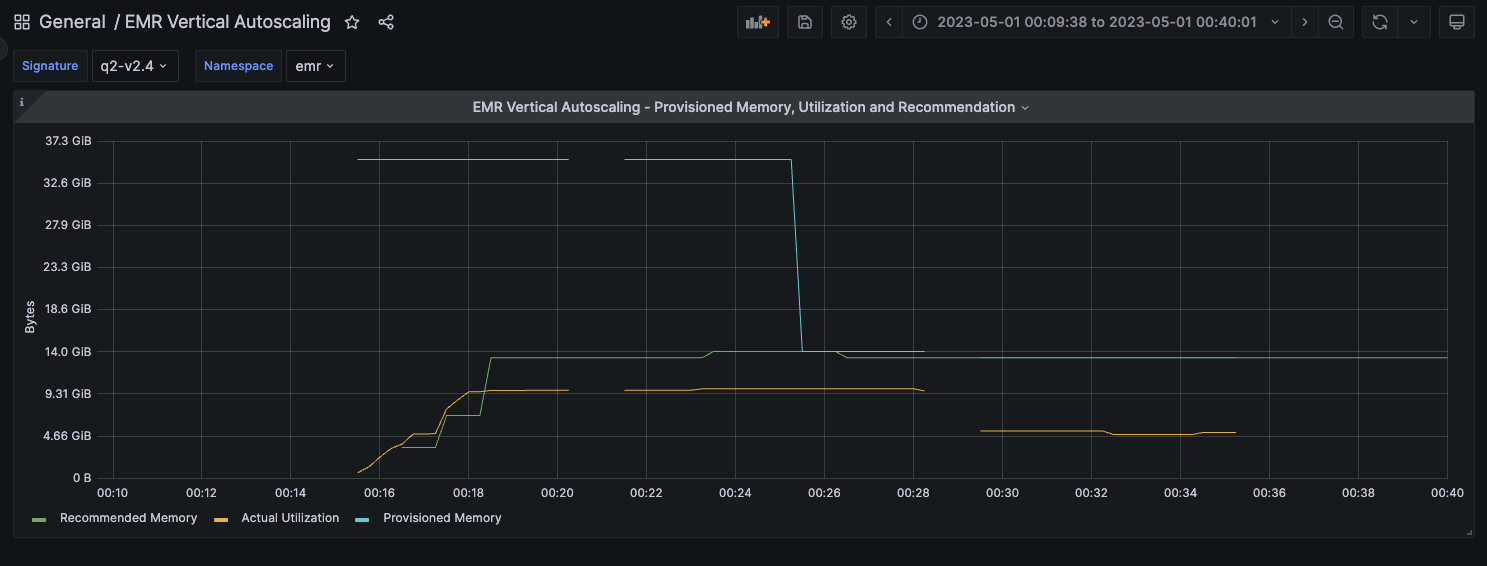
You can use our sample Grafana dashboard by importing the EMR vertical autoscaling JSON model into your Grafana deployment. The dashboard visualizes vertical autoscaling recommendations alongside the memory provisioned and actually utilized by EMR Spark applications as shown in the following screenshot.

Grafana Dashboard

Results are presented categorized by your Kubernetes namespace and job signature. When you choose a certain namespace and signature combination, you’re presented with a pane. The pane represents a comparison of the vertical autoscaling recommendations for jobs belonging to the chosen signature, compared to the actual resource utilization of that job and the amount of Spark executor memory provisioned to the job. If autoscaling is enabled, the expectation is that the Spark executor memory would track the recommendation. If you’re in monitoring mode however, the two won’t match but you can still view the recommendations from this dashboard or use them to better understand the actual utilization and resource profile of your job.

Illustration of provisioned memory, utilization and recommendations

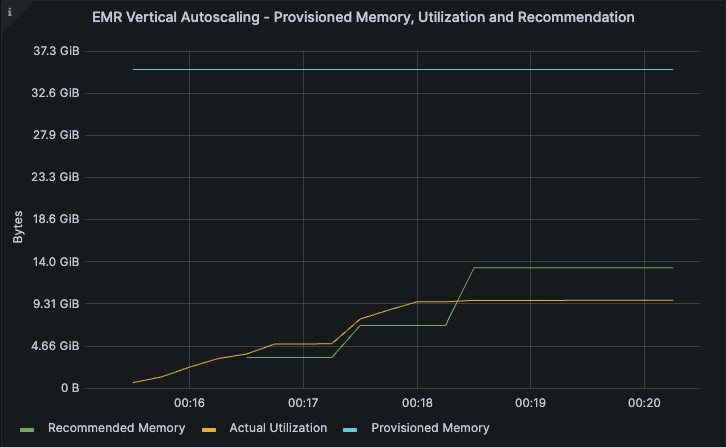
To better illustrate vertical autoscaling behavior and usage for different workloads, we executed query 2 of the TPC-DS benchmark for 5 iterations — The first two iterations in monitoring mode and the last 3 in autoscaling mode and visualized the results in the Grafana dashboard shared in the previous section.

Monitoring mode

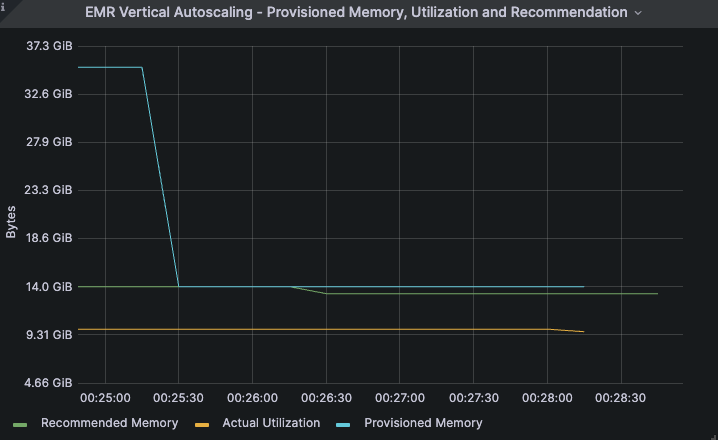
This particular job was provisioned to run with 32GB of executor memory (the blue line in the image) but the actual utilization hovered at around the 10 GB mark (amber line). Vertical autoscaling computes a recommendation of approximately 14 GB based on this run (the green line). This recommendation is based on the actual utilization with a safety margin added in.

Cost optimization example 1

The second iteration of the job was also run in the monitoring mode and the utilization and the recommendations remained unchanged.

cost optimization example 2

Autoscaling mode

Iterations 3 through 5 were run in autoscaling mode. In this case, the provisioned memory drops from 32GB to match the recommended value of 14GB (the blue line).

cost optimization example 3

The utilization and recommendations remained unchanged for subsequent iterations in the case of this example. Furthermore, we observed that all the iterations of the job completed in around 5 minutes, both with and without autoscaling. This example illustrates the successful scaling down of the job’s executor memory allocation by about 56% (a drop from 32GB to approximately 14 GB) which also translates to an equivalent reduction in the EMR memory uplift costs of the job, with no impact to the job’s performance.

Automatic OOM recovery

In the earlier example, we didn’t observe any OOM events as a result of autoscaling. In the rare occasion where autoscaling results in OOM events, jobs should usually be scaled back up automatically. On the other hand, if a job that has autoscaling enabled is under-provisioned and as a result experiences OOM events, vertical autoscaling can scale up resources to facilitate automatic recovery.

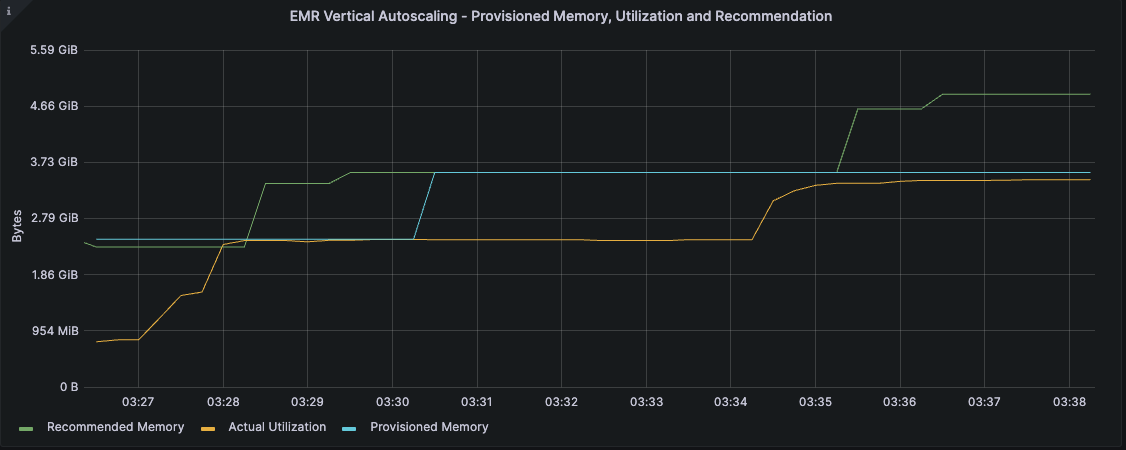
In the following example, a job was provisioned with 2.5 GB of executor memory and experienced OOM exceptions during its execution. Vertical autoscaling responded to the OOM events by automatically scaling up failed executors when they were re-started. As seen in the following image, when the amber line representing memory utilization started approaching the blue line representing the provisioned memory, vertical autoscaling kicked in to increase the amount of provisioned memory for the re-started executors, allowing the automatic recovery and successful completion of the job without any intervention. The recommended memory converged to approximately 5 GB before the job completed.

OOM recovery example

All subsequent runs of jobs with the same signature will now start-up with the recommended settings computed earlier, preventing OOM events right from the start.

Cleanup

Refer to documentation for information on cleaning up vertical autoscaling related resources from your cluster. To cleanup your EMR on EKS cluster after trying out the vertical autoscaling feature, refer to the clean-up section of the EMR on EKS workshop.

Conclusion

You can use vertical autoscaling to easily monitor resource utilization for one or more EMR on EKS jobs without any impact to your production workloads. You can use standard Kubernetes tooling including Prometheus, Grafana and kubectl to interact with and monitor vertical autoscaling on your cluster. You can also autoscale your EMR Spark jobs using recommendations that are derived based on the needs of your job, allowing you to realize cost savings and optimize cluster utilization as well as build resiliency to out-of-memory errors. Additionally, you can use it in conjunction with existing autoscaling mechanisms such as Dynamic Resource Allocation and Karpenter to effortlessly achieve optimal vertical resource assignment. Looking ahead, when Kubernetes fully supports in-place resizing of pods, vertical autoscaling will be able to take advantage of it to seamlessly scale your EMR jobs up or down, further facilitating optimal costs and cluster utilization.

To learn more about EMR on EKS vertical autoscaling and getting started with it, refer to documentation. You can also use the EMR on EKS Workshop to try out the EMR on EKS deployment option for Amazon EMR.


About the author

Rajkishan Gunasekaran is a Principal Engineer for Amazon EMR on EKS at Amazon Web Services.

Process price transparency data using AWS Glue

Post Syndicated from Hari Thatavarthy original https://aws.amazon.com/blogs/big-data/process-price-transparency-data-using-aws-glue/

The Transparency in Coverage rule is a federal regulation in the United States that was finalized by the Center for Medicare and Medicaid Services (CMS) in October 2020. The rule requires health insurers to provide clear and concise information to consumers about their health plan benefits, including costs and coverage details. Under the rule, health insurers must make available to their members a list of negotiated rates for in-network providers, as well as an estimate of the member’s out-of-pocket costs for specific health care services. This information must be made available to members through an online tool that is accessible and easy to use. The Transparency in Coverage rule also requires insurers to make available data files that contain detailed information on the prices they negotiate with health care providers. This information can be used by employers, researchers, and others to compare prices across different insurers and health care providers. Phase 1 implementation of this regulation, which went into effect on July 1, 2022, requires that payors publish machine-readable files publicly for each plan that they offer. CMS (Center for Medicare and Medicaid Services) has published a technical implementation guide with file formats, file structure, and standards on producing these machine-readable files.

This post walks you through the preprocessing and processing steps required to prepare data published by health insurers in light of this federal regulation using AWS Glue. We also show how to query and derive insights using Amazon Athena.

AWS Glue is a serverless data integration service that makes it straightforward to discover, prepare, move, and integrate data from multiple sources for analytics, machine learning (ML), and application development. Athena is a serverless, interactive analytics service built on open-source frameworks, supporting open-table and file formats. Athena provides a simplified, flexible way to analyze petabytes of data.

Challenges processing these machine-readable files

The machine-readable files published by these payors vary in size. A single file can range from a few megabytes to hundreds of gigabytes. These files contain large JSON objects that are deeply nested. Unlike NDJSON and JSONL formats, where each line in the file is a JSON object, these files contain a single large JSON object that can span across multiple lines. The following figure represents the schema of an in_network rate file published by a major health insurer on their website for public access. This file, when uncompressed, is about 20 GB in size, contains a single JSON object, and is deeply nested. The following figure represents the schema of this JSON object when printed using the Spark printSchema() function. Each highlighted box in red is a nested array structure.

JSON Schema

Loading a 20 GB deeply nested JSON object requires a machine with a large memory footprint. Data when loaded into memory is 4–10 times its size on disk. A 20 GB JSON object may need a machine with up to 200 GB memory. To process workloads larger than 20 GB, these machines need to be scaled vertically, thereby significantly increasing hardware costs. Vertical scaling has its limits, and it’s not possible to scale beyond a certain point. Analyzing this data requires unnesting and flattening of deeply nested array structures. These transformations explode the data at an exponential rate, thereby adding to the need for more memory and disk space.

You can use an in-memory distributed processing framework such as Apache Spark to process and analyze such large volumes of data. However, to load this single large JSON object as a Spark DataFrame and perform an action on it, a worker node needs enough memory to load this object in full. When a worker node tries to load this large deeply nested JSON object and there isn’t enough memory to load it in full, the processing job will fail with out-of-memory issues. This calls for splitting the large JSON object into smaller chunks using some form of preprocessing logic. Once preprocessed, these smaller files can then be further processed in parallel by worker nodes without running into out-of-memory issues.

Solution overview

The solution involves a two-step approach. The first is a preprocessing step, which takes the large JSON object as input and splits it to multiple manageable chunks. This is required to address the challenges we mentioned earlier. The second is a processing step, which prepares and publishes data for analysis.

The preprocessing step uses an AWS Glue Python shell job to split the large JSON object into smaller JSON files. The processing step unnests and flattens the array items from these smaller JSON files in parallel. It then partitions and writes the output as Parquet on Amazon Simple Storage Service (Amazon S3). The partitioned data is cataloged and analyzed using Athena. The following diagram illustrates this workflow.

Solution Overview

Prerequisites

To implement the solution in your own AWS account, you need to create or configure the following AWS resources in advance:

  • An S3 bucket to persist the source and processed data. Download the input file and upload it to the path s3://yourbucket/ptd/2023-03-01_United-HealthCare-Services—Inc-_Third-Party-Administrator_PS1-50_C2_in-network-rates.json.gz.
  • An AWS Identity and Access Management (IAM) role for your AWS Glue extract, transform, and load (ETL) job. For instructions, refer to Setting up IAM permissions for AWS Glue. Adjust the permissions to ensure AWS Glue has read/write access to Amazon S3 locations.
  • An IAM role for Athena with AWS Glue Data Catalog permissions to create and query tables.

Create an AWS Glue preprocessing job

The preprocessing step uses ijson, an open-source iterative JSON parser to extract items in the outermost array of top-level attributes. By streaming and iteratively parsing the large JSON file, the preprocessing step loads only a portion of the file into memory, thereby avoiding out-of-memory issues. It also uses s3pathlib, an open-source Python interface to Amazon S3. This makes it easy to work with S3 file systems.

To create and run the AWS Glue job for preprocessing, complete the following steps:

  1. On the AWS Glue console, choose Jobs under Glue Studio in the navigation pane.
  2. Create a new job.
  3. Select Python shell script editor.
  4. Select Create a new script with boilerplate code.
    Python Shell Script Editor
  5. Enter the following code into the editor (adjust the S3 bucket names and paths to point to the input and output locations in Amazon S3):
import ijson
import json
import decimal
from s3pathlib import S3Path
from s3pathlib import context
import boto3
from io import StringIO

class JSONEncoder(json.JSONEncoder):
    def default(self, obj):
        if isinstance(obj, decimal.Decimal):
            return float(obj)
        return json.JSONEncoder.default(self, obj)
        
def upload_to_s3(data, upload_path):
    data = bytes(StringIO(json.dumps(data,cls=JSONEncoder)).getvalue(),encoding='utf-8')
    s3_client.put_object(Body=data, Bucket=bucket, Key=upload_path)
        
s3_client = boto3.client('s3')

#Replace with your bucket and path to JSON object on your bucket
bucket = 'yourbucket'
largefile_key = 'ptd/2023-03-01_United-HealthCare-Services--Inc-_Third-Party-Administrator_PS1-50_C2_in-network-rates.json.gz'
p = S3Path(bucket, largefile_key)


#Replace the paths to suit your needs
upload_path_base = 'ptd/preprocessed/base/base.json'
upload_path_in_network = 'ptd/preprocessed/in_network/'
upload_path_provider_references = 'ptd/preprocessed/provider_references/'

#Extract top the values of the following top level attributes and persist them on your S3 bucket
# -- reporting_entity_name
# -- reporting_entity_type
# -- last_updated_on
# -- version

base ={
    'reporting_entity_name' : '',
    'reporting_entity_type' : '',
    'last_updated_on' :'',
    'version' : ''
}

with p.open("r") as f:
    obj = ijson.items(f, 'reporting_entity_name')
    for evt in obj:
        base['reporting_entity_name'] = evt
        break
    
with p.open("r") as f:
    obj = ijson.items(f, 'reporting_entity_type')
    for evt in obj:
        base['reporting_entity_type'] = evt
        break
    
with p.open("r") as f:
    obj = ijson.items(f, 'last_updated_on')
    for evt in obj:
        base['last_updated_on'] = evt
        break
    
with p.open("r") as f:
    obj = ijson.items(f,'version')
    for evt in obj:
        base['version'] = evt
        break
        
upload_to_s3(base,upload_path_base)

#Seek the position of JSON key provider_references 
#Iterate through items in provider_references array, and for every 1000 items create a JSON file on S3 bucket
with p.open("r") as f:
    provider_references = ijson.items(f, 'provider_references.item')
    fk = 0
    lst = []
    for rowcnt,row in enumerate(provider_references):
        if rowcnt % 1000 == 0:
            if fk > 0:
                dest = upload_path_provider_references + path
                upload_to_s3(lst,dest)
            lst = []
            path = 'provider_references_{0}.json'.format(fk)
            fk = fk + 1

        lst.append(row)

    path = 'provider_references_{0}.json'.format(fk)
    dest = upload_path_provider_references + path
    upload_to_s3(lst,dest)
    
#Seek the position of JSON key in_network
#Iterate through items in in_network array, and for every 25 items create a JSON file on S3 bucket
with p.open("r") as f:
    in_network = ijson.items(f, 'in_network.item')
    fk = 0
    lst = []
    for rowcnt,row in enumerate(in_network):
        if rowcnt % 25 == 0:
            if fk > 0:
                dest = upload_path_in_network + path
                upload_to_s3(lst,dest)
            lst = []
            path = 'in_network_{0}.json'.format(fk)
            fk = fk + 1

        lst.append(row)


    path = 'in_network_{0}.json'.format(fk)
    dest = upload_path_in_network + path
    upload_to_s3(lst,dest)
  1. Update the properties of your job on the Job details tab:
    1. For Type, choose Python Shell.
    2. For Python version, choose Python 3.9.
    3. For Data processing units, choose 1 DPU.

For Python shell jobs, you can allocate either 0.0625 or 1 DPU. The default is 0.0625 DPU. A DPU is a relative measure of processing power that consists of 4 vCPUs of compute capacity and 16 GB of memory.

python shell job config

The Python libraries ijson and s3pathlib are available in pip and can be installed using the AWS Glue job parameter --additional-python-modules. You can also choose to package these libraries, upload them to Amazon S3, and refer to them from your AWS Glue job. For instructions on packaging your library, refer to Providing your own Python library.

  1. To install the Python libraries, set the following job parameters:
    • Key – --additional-python-modules
    • Value – ijson,s3pathlibinstall python modules
  2. Run the job.

The preprocessing step creates three folders in the S3 bucket: base, in_network and provider_references.

s3_folder_1

Files in in_network and provider_references folders contains array of JSON objects. Each of these JSON objects represents an element in the outermost array of the original large JSON object.

s3_folder_2

Create an AWS Glue processing job

The processing job uses the output of the preprocessing step to create a denormalized view of data by extracting and flattening elements and attributes from nested arrays. The extent of unnesting depends on the attributes we need for analysis. For example, attributes such as negotiated_rate, npi, and billing_code are essential for analysis and extracting values associated with these attributes requires multiple levels of unnesting. The denormalized data is then partitioned by the billing_code column, persisted as Parquet on Amazon S3, and registered as a table on the AWS Glue Data Catalog for querying.

The following code sample guides you through the implementation using PySpark. The columns used to partition the data depends on query patterns used to analyze the data. Arriving at a partitioning strategy that is in line with the query patterns will improve overall query performance during analysis. This post assumes that the queries used for analyzing data will always use the column billing_code to filter and fetch data of interest. Data in each partition is bucketed by npi to improve query performance.

To create your AWS Glue job, complete the following steps:

  1. On the AWS Glue console, choose Jobs under Glue Studio in the navigation pane.
  2. Create a new job.
  3. Select Spark script editor.
  4. Select Create a new script with boilerplate code.
  5. Enter the following code into the editor (adjust the S3 bucket names and paths to point to the input and output locations in Amazon S3):
import sys
from pyspark.context import SparkContext
from pyspark.sql import SparkSession
sc = SparkContext.getOrCreate()
spark = SparkSession(sc)
from pyspark.sql.functions import explode

#create a dataframe of base objects - reporting_entity_name, reporting_entity_type, version, last_updated_on
#using the output of preprocessing step

base_df = spark.read.json('s3://yourbucket/ptd/preprocessed/base/')

#create a dataframe over provider_references objects using the output of preprocessing step
prvd_df = spark.read.json('s3://yourbucket/ptd/preprocessed/provider_references/')

#cross join dataframe of base objects with dataframe of provider_references 
prvd_df = prvd_df.crossJoin(base_df)

#create a dataframe over in_network objects using the output of preprocessing step
in_ntwrk_df = spark.read.json('s3://yourbucket/ptd/preprocessed/in_network/')

#unnest and flatten negotiated_rates and provider_references from in_network objects
in_ntwrk_df2 = in_ntwrk_df.select(
 in_ntwrk_df.billing_code, in_ntwrk_df.billing_code_type, in_ntwrk_df.billing_code_type_version,
 in_ntwrk_df.covered_services, in_ntwrk_df.description, in_ntwrk_df.name,
 explode(in_ntwrk_df.negotiated_rates).alias('exploded_negotiated_rates'),
 in_ntwrk_df.negotiation_arrangement)


in_ntwrk_df3 = in_ntwrk_df2.select(
 in_ntwrk_df2.billing_code, in_ntwrk_df2.billing_code_type, in_ntwrk_df2.billing_code_type_version,
 in_ntwrk_df2.covered_services, in_ntwrk_df2.description, in_ntwrk_df2.name,
 in_ntwrk_df2.exploded_negotiated_rates.negotiated_prices.alias(
 'exploded_negotiated_rates_negotiated_prices'),
 explode(in_ntwrk_df2.exploded_negotiated_rates.provider_references).alias(
 'exploded_negotiated_rates_provider_references'),
 in_ntwrk_df2.negotiation_arrangement)

#join the exploded in_network dataframe with provider_references dataframe
jdf = prvd_df.join(
 in_ntwrk_df3,
 prvd_df.provider_group_id == in_ntwrk_df3.exploded_negotiated_rates_provider_references,"fullouter")

#un-nest and flatten attributes from rest of the nested arrays.
jdf2 = jdf.select(
 jdf.reporting_entity_name,jdf.reporting_entity_type,jdf.last_updated_on,jdf.version,
 jdf.provider_group_id, jdf.provider_groups, jdf.billing_code,
 jdf.billing_code_type, jdf.billing_code_type_version, jdf.covered_services,
 jdf.description, jdf.name,
 explode(jdf.exploded_negotiated_rates_negotiated_prices).alias(
 'exploded_negotiated_rates_negotiated_prices'),
 jdf.exploded_negotiated_rates_provider_references,
 jdf.negotiation_arrangement)

jdf3 = jdf2.select(
 jdf2.reporting_entity_name,jdf2.reporting_entity_type,jdf2.last_updated_on,jdf2.version,
 jdf2.provider_group_id,
 explode(jdf2.provider_groups).alias('exploded_provider_groups'),
 jdf2.billing_code, jdf2.billing_code_type, jdf2.billing_code_type_version,
 jdf2.covered_services, jdf2.description, jdf2.name,
 jdf2.exploded_negotiated_rates_negotiated_prices.additional_information.
 alias('additional_information'),
 jdf2.exploded_negotiated_rates_negotiated_prices.billing_class.alias(
 'billing_class'),
 jdf2.exploded_negotiated_rates_negotiated_prices.billing_code_modifier.
 alias('billing_code_modifier'),
 jdf2.exploded_negotiated_rates_negotiated_prices.expiration_date.alias(
 'expiration_date'),
 jdf2.exploded_negotiated_rates_negotiated_prices.negotiated_rate.alias(
 'negotiated_rate'),
 jdf2.exploded_negotiated_rates_negotiated_prices.negotiated_type.alias(
 'negotiated_type'),
 jdf2.exploded_negotiated_rates_negotiated_prices.service_code.alias(
 'service_code'), jdf2.exploded_negotiated_rates_provider_references,
 jdf2.negotiation_arrangement)

jdf4 = jdf3.select(jdf3.reporting_entity_name,jdf3.reporting_entity_type,jdf3.last_updated_on,jdf3.version,
 jdf3.provider_group_id,
 explode(jdf3.exploded_provider_groups.npi).alias('npi'),
 jdf3.exploded_provider_groups.tin.type.alias('tin_type'),
 jdf3.exploded_provider_groups.tin.value.alias('tin'),
 jdf3.billing_code, jdf3.billing_code_type,
 jdf3.billing_code_type_version, jdf3.covered_services,
 jdf3.description, jdf3.name, jdf3.additional_information,
 jdf3.billing_class, jdf3.billing_code_modifier,
 jdf3.expiration_date, jdf3.negotiated_rate,
 jdf3.negotiated_type, jdf3.service_code,
 jdf3.negotiation_arrangement)

#repartition by billing_code. 
#Repartition changes the distribution of data on spark cluster. 
#By repartition data we will avoid writing too many small files.
jdf5=jdf4.repartition("billing_code")
 
datasink_path = "s3://yourbucket/ptd/processed/billing_code_npi/parquet/"

#persist dataframe as parquet on S3 and catalog it
#Partition the data by billing_code. This enables analytical queries to skip data and improve performance of queries
#Data is also bucketed and sorted npi to improve query performance during analysis

jdf5.write.format('parquet').mode("overwrite").partitionBy('billing_code').bucketBy(2, 'npi').sortBy('npi').saveAsTable('ptdtable', path = datasink_path)
  1. Update the properties of your job on the Job details tab:
    1. For Type, choose Spark.
    2. For Glue version, choose Glue 4.0.
    3. For Language, choose Python 3.
    4. For Worker type, choose G 2X.
    5. For Requested number of workers, enter 20.

Arriving at the number of workers and worker type to use for your processing job depends on factors such as the amount of data being processed, the speed at which it needs to be processed, and the partitioning strategy used. Repartitioning of data can result in out-of-memory issues, especially when data is heavily skewed on the column used to repartition. It’s possible to reach Amazon S3 service limits if too many workers are assigned to the job. This is because tasks running on these worker nodes may try to read/write from the same S3 prefix, causing Amazon S3 to throttle the incoming requests. For more details, refer to Best practices design patterns: optimizing Amazon S3 performance.

processing job config

Exploding array elements creates new rows and columns, thereby exponentially increasing the amount of data that needs to be processed. Apache Spark splits this data into multiple Spark partitions on different worker nodes so that it can process large amounts of data in parallel. In Apache Spark, shuffling happens when data needs to be redistributed across the cluster. Shuffle operations are commonly triggered by wide transformations such as join, reduceByKey, groupByKey, and repartition. In case of exceptions due to local storage limitations, it helps to supplement or replace local disk storage capacity with Amazon S3 for large shuffle operations. This is possible with the AWS Glue Spark shuffle plugin with Amazon S3. With the cloud shuffle storage plugin for Apache Spark, you can avoid disk space-related failures.

  1. To use the Spark shuffle plugin, set the following job parameters:
    • Key – --write-shuffle-files-to-s3
    • Value – true
      spark shuffle plugin

Query the data

You can query the cataloged data using Athena. For instructions on setting up Athena, refer to Setting up.

On the Athena console, choose Query editor in the navigation pane to run your query, and specify your data source and database.

sql query

To find the minimum, maximum, and average negotiated rates for procedure codes, run the following query:

SELECT
billing_code,
round(min(negotiated_rate),2) as min_price,
round(avg(negotiated_rate),2) as avg_price,
round(max(negotiated_rate),2) as max_price,
description
FROM "default"."ptdtable"
group by billing_code, description
limit 10;

The following screenshot shows the query results.

sql query results

Clean up

To avoid incurring future charges, delete the AWS resources you created:

  1. Delete the S3 objects and bucket.
  2. Delete the IAM policies and roles.
  3. Delete the AWS Glue jobs for preprocessing and processing.

Conclusion

This post guided you through the necessary preprocessing and processing steps to query and analyze price transparency-related machine-readable files. Although it’s possible to use other AWS services to process such data, this post focused on preparing and publishing data using AWS Glue.

To learn more about the Transparency in Coverage rule, refer to Transparency in Coverage. For best practices for scaling Apache Spark jobs and partitioning data with AWS Glue, refer to Best practices to scale Apache Spark jobs and partition data with AWS Glue. To learn how to monitor AWS Glue jobs, refer to Monitoring AWS Glue Spark jobs.

We look forward to hearing any feedback or questions.


About the Authors

hari thatavarthyHari Thatavarthy is a Senior Solutions Architect on the AWS Data Lab team. He helps customers design and build solutions in the data and analytics space. He believes in data democratization and loves to solve complex data processing-related problems. In his spare time, he loves to play table tennis.

Krishna MaddiletiKrishna Maddileti is a Senior Solutions Architect on the AWS Data Lab team. He partners with customers on their AWS journey and helps them with data engineering, data lakes, and analytics. In his spare time, he enjoys spending time with his family and playing video games with his 7-year-old.

yadukishore tatavartiYadukishore Tatavarthi is a Senior Partner Solutions Architect at AWS. He works closely with global system integrator partners to enable and support customers moving their workloads to AWS.

Manish KolaManish Kola is a Solutions Architect on the AWS Data Lab team. He partners with customers on their AWS journey.

Noritaki SakayamiNoritaka Sekiyama is a Principal Big Data Architect on the AWS Glue team. He is responsible for building software artifacts to help customers. In his spare time, he enjoys cycling with his new road bike.

Google “We Have No Moat, And Neither Does OpenAI” (SemiAnalysis)

Post Syndicated from original https://lwn.net/Articles/930939/

The SemiAnalysis site has what is said to be a
leaked Google document
on the state of open-source AI development.
Open source, it concludes, is winning.

At the beginning of March the open source community got their hands
on their first really capable foundation model, as Meta’s LLaMA was
leaked to the public. It had no instruction or conversation tuning,
and no RLHF. Nonetheless, the community immediately understood the
significance of what they had been given.

A tremendous outpouring of innovation followed, with just days
between major developments (see The Timeline for the full
breakdown). Here we are, barely a month later, and there are
variants with instruction tuning, quantization, quality
improvements, human evals, multimodality, RLHF, etc. etc. many of
which build on each other.

(Thanks to Dave Täht).

The history and future roadmap of the AWS CloudFormation Registry

Post Syndicated from Eric Z. Beard original https://aws.amazon.com/blogs/devops/cloudformation-coverage/

AWS CloudFormation is an Infrastructure as Code (IaC) service that allows you to model your cloud resources in template files that can be authored or generated in a variety of languages. You can manage stacks that deploy those resources via the AWS Management Console, the AWS Command Line Interface (AWS CLI), or the API. CloudFormation helps customers to quickly and consistently deploy and manage cloud resources, but like all IaC tools, it faced challenges keeping up with the rapid pace of innovation of AWS services. In this post, we will review the history of the CloudFormation registry, which is the result of a strategy we developed to address scaling and standardization, as well as integration with other leading IaC tools and partner products. We will also give an update on the current state of CloudFormation resource coverage and review the future state, which has a goal of keeping CloudFormation and other IaC tools up to date with the latest AWS services and features.

History

The CloudFormation service was first announced in February of 2011, with sample templates that showed how to deploy common applications like blogs and wikis. At launch, CloudFormation supported 13 out of 15 available AWS services with 48 total resource types. At first, resource coverage was tightly coupled to the core CloudFormation engine, and all development on those resources was done by the CloudFormation team itself. Over the past decade, AWS has grown at a rapid pace, and there are currently 200+ services in total. A challenge over the years has been the coverage gap between what was possible for a customer to achieve using AWS services, and what was possible to define in a CloudFormation template.

It became obvious that we needed a change in strategy to scale resource development in a way that could keep up with the rapid pace of innovation set by hundreds of service teams delivering new features on a daily basis. Over the last decade, our pace of innovation has increased nearly 40-fold, with 80 significant new features launched in 2011 versus more than 3,000 in 2021. Since CloudFormation was a key adoption driver (or blocker) for new AWS services, those teams needed a way to create and manage their own resources. The goal was to enable day one support of new services at the time of launch with complete CloudFormation resource coverage.

In 2016, we launched an internal self-service platform that allowed service teams to control their own resources. This began to solve the scaling problems inherent in the prior model where the core CloudFormation team had to do all the work themselves. The benefits went beyond simply distributing developer effort, as the service teams have deep domain knowledge on their products, which allowed them to create more effective IaC components. However, as we developed resources on this model, we realized that additional design features were needed, such as standardization that could enable automatic support for features like drift detection and resource imports.

We embarked on a new project to address these concerns, with the goal of improving the internal developer experience as well as providing a public registry where customers could use the same programming model to define their own resource types. We realized that it wasn’t enough to simply make the new model available—we had to evangelize it with a training campaign, conduct engineering boot-camps, build better tooling like dashboards and deployment pipeline templates, and produce comprehensive on-boarding documentation. Most importantly, we made CloudFormation support a required item on the feature launch checklist for new services, a requirement that goes beyond documentation and is built into internal release tooling (exceptions to this requirement are rare as training and awareness around the registry have improved over time). This was a prime example of one of the maxims we repeat often at Amazon: good mechanisms are better than good intentions.

In 2019, we made this new functionality available to customers when we announced the CloudFormation registry, a capability that allowed developers to create and manage private resource types. We followed up in 2021 with the public registry where third parties, such as partners in the AWS Partner Network (APN), can publish extensions. The open source resource model that customers and partners use to publish third-party registry extensions is the same model used by AWS service teams to provide CloudFormation support for their features.

Once a service team on-boards their resources to the new resource model and builds the expected Create, Read, Update, Delete, and List (CRUDL) handlers, managed experiences like drift detection and resource import are all supported with no additional development effort. One recent example of day-1 CloudFormation support for a popular new feature was Lambda Function URLs, which offered a built-in HTTPS endpoint for single-function micro-services. We also migrated the Amazon Relational Database Service (Amazon RDS) Database Instance resource (AWS::RDS::DBInstance) to the new resource model in September 2022, and within a month, Amazon RDS delivered support for Amazon Aurora Serverless v2 in CloudFormation. This accelerated delivery is possible because teams can now publish independently by taking advantage of the de-centralized Registry ownership model.

Current State

We are building out future innovations for the CloudFormation service on top of this new standardized resource model so that customers can benefit from a consistent implementation of event handlers. We built AWS Cloud Control API on top of this new resource model. Cloud Control API takes the Create-Read-Update-Delete-List (CRUDL) handlers written for the new resource model and makes them available as a consistent API for provisioning resources. APN partner products such as HashiCorp Terraform, Pulumi, and Red Hat Ansible use Cloud Control API to stay in sync with AWS service launches without recurring development effort.

Figure 1. Cloud Control API Resource Handler Diagram

Figure 1. Cloud Control API Resource Handler Diagram

Besides 3rd party application support, the public registry can also be used by the developer community to create useful extensions on top of AWS services. A common solution to extending the capabilities of CloudFormation resources is to write a custom resource, which generally involves inline AWS Lambda function code that runs in response to CREATE, UPDATE, and DELETE signals during stack operations. Some of those use cases can now be solved by writing a registry extension resource type instead. For more information on custom resources and resource types, and the differences between the two, see Managing resources using AWS CloudFormation Resource Types.

CloudFormation Registry modules, which are building blocks authored in JSON or YAML, give customers a way to replace fragile copy-paste template reuse with template snippets that are published in the registry and consumed as if they were resource types. Best practices can be encapsulated and shared across an organization, which allows infrastructure developers to easily adhere to those best practices using modular components that abstract away the intricate details of resource configuration.

CloudFormation Registry hooks give security and compliance teams a vital tool to validate stack deployments before any resources are created, modified, or deleted. An infrastructure team can activate hooks in an account to ensure that stack deployments cannot avoid or suppress preventative controls implemented in hook handlers. Provisioning tools that are strictly client-side do not have this level of enforcement.

A useful by-product of publishing a resource type to the public registry is that you get automatic support for the AWS Cloud Development Kit (CDK) via an experimental open source repository on GitHub called cdk-cloudformation. In large organizations it is typical to see a mix of CloudFormation deployments using declarative templates and deployments that make use of the CDK in languages like TypeScript and Python. By publishing re-usable resource types to the registry, all of your developers can benefit from higher level abstractions, regardless of the tool they choose to create and deploy their applications. (Note that this project is still considered a developer preview and is subject to change)

If you want to see if a given CloudFormation resource is on the new registry model or not, check if the provisioning type is either Fully Mutable or Immutable by invoking the DescribeType API and inspecting the ProvisioningType response element.

Here is a sample CLI command that gets a description for the AWS::Lambda::Function resource, which is on the new registry model.

$ aws cloudformation describe-type --type RESOURCE \
    --type-name AWS::Lambda::Function | grep ProvisioningType

   "ProvisioningType": "FULLY_MUTABLE",

The difference between FULLY_MUTABLE and IMMUTABLE is the presence of the Update handler. FULLY_MUTABLE types includes an update handler to process updates to the type during stack update operations. Whereas, IMMUTABLE types do not include an update handler, so the type can’t be updated and must instead be replaced during stack update operations. Legacy resource types will be NON_PROVISIONABLE.

Opportunities for improvement

As we continue to strive towards our ultimate goal of achieving full feature coverage and a complete migration away from the legacy resource model, we are constantly identifying opportunities for improvement. We are currently addressing feature gaps in supported resources, such as tagging support for EC2 VPC Endpoints and boosting coverage for resource types to support drift detection, resource import, and Cloud Control API. We have fully migrated more than 130 resources, and acknowledge that there are many left to go, and the migration has taken longer than we initially anticipated. Our top priority is to maintain the stability of existing stacks—we simply cannot break backwards compatibility in the interest of meeting a deadline, so we are being careful and deliberate. One of the big benefits of a server-side provisioning engine like CloudFormation is operational stability—no matter how long ago you deployed a stack, any future modifications to it will work without needing to worry about upgrading client libraries. We remain committed to streamlining the migration process for service teams and making it as easy and efficient as possible.

The developer experience for creating registry extensions has some rough edges, particularly for languages other than Java, which is the language of choice on AWS service teams for their resource types. It needs to be easier to author schemas, write handler functions, and test the code to make sure it performs as expected. We are devoting more resources to the maintenance of the CLI and plugins for Python, Typescript, and Go. Our response times to issues and pull requests in these and other repositories in the aws-cloudformation GitHub organization have not been as fast as they should be, and we are making improvements. One example is the cloudformation-cli repository, where we have merged more than 30 pull requests since October of 2022.

To keep up with progress on resource coverage, check out the CloudFormation Coverage Roadmap, a GitHub project where we catalog all of the open issues to be resolved. You can submit bug reports and feature requests related to resource coverage in this repository and keep tabs on the status of open requests. One of the steps we took recently to improve responses to feature requests and bugs reported on GitHub is to create a system that converts GitHub issues into tickets in our internal issue tracker. These tickets go directly to the responsible service teams—an example is the Amazon RDS resource provider, which has hundreds of merged pull requests.

We have recently announced a new GitHub repository called community-registry-extensions where we are managing a namespace for public registry extensions. You can submit and discuss new ideas for extensions and contribute to any of the related projects. We handle the testing, validation, and deployment of all resources under the AwsCommunity:: namespace, which can be activated in any AWS account for use in your own templates.

To get started with the CloudFormation registry, visit the user guide, and then dive in to the detailed developer guide for information on how to use the CloudFormation Command Line Interface (CFN-CLI) to write your own resource types, modules, and hooks.

We recently created a new Discord server dedicated to CloudFormation. Please join us to ask questions, discuss best practices, provide feedback, or just hang out! We look forward to seeing you there.

Conclusion

In this post, we hope you gained some insights into the history of the CloudFormation registry, and the design decisions that were made during our evolution towards a standardized, scalable model for resource development that can be shared by AWS service teams, customers, and APN partners. Some of the lessons that we learned along the way might be applicable to complex design initiatives at your own company. We hope to see you on Discord and GitHub as we build out a rich set of registry resources together!

About the authors:

Eric Beard

Eric is a Solutions Architect at Amazon Web Services in Seattle, Washington, where he leads the field specialist group for Infrastructure as Code. His technology career spans two decades, preceded by service in the United States Marine Corps as a Russian interpreter and arms control inspector.

Rahul Sharma

Rahul is a Senior Product Manager-Technical at Amazon Web Services with over two years of product management spanning AWS CloudFormation and AWS Cloud Control API.

Beelink SER6 Pro 7735HS Edition Review A Better Alternative

Post Syndicated from Patrick Kennedy original https://www.servethehome.com/beelink-ser6-pro-7735hs-edition-review-amd-ryzen-intel-arc-usb4-egpu/

We review the Beelink SER6 Pro and see how this AMD Ryzen 7 7735HS unit performs and how it can be expanded, even with an Intel Arc A770 eGPU

The post Beelink SER6 Pro 7735HS Edition Review A Better Alternative appeared first on ServeTheHome.

Delivering on the AWS Digital Sovereignty Pledge: Control without compromise

Post Syndicated from Matt Garman original https://aws.amazon.com/blogs/security/delivering-on-the-aws-digital-sovereignty-pledge-control-without-compromise/

At AWS, earning and maintaining customer trust is the foundation of our business. We understand that protecting customer data is key to achieving this. We also know that trust must continue to be earned through transparency and assurances.

In November 2022, we announced the new AWS Digital Sovereignty Pledge, our commitment to offering all AWS customers the most advanced set of sovereignty controls and features available in the cloud. Two pillars of this are verifiable control over data access, and the ability to encrypt everything everywhere. We already offer a range of data protection features, accreditations, and contractual commitments that give customers control over where they locate their data, who can access it, and how it is used. Today, I’d like to update you on how we are continuing to earn your trust with verifiable control over customer data access and external control of your encryption keys.

AWS Nitro System achieves independent third-party validation

We are committed to helping our customers meet evolving sovereignty requirements and providing greater transparency and assurances to how AWS services are designed and operated. With the AWS Nitro System, which is the foundation of AWS computing service Amazon EC2, we designed and delivered first-of-a-kind innovation by eliminating any mechanism AWS personnel have to access customer data on Nitro. Our removal of an operator access mechanism was unique in 2017 when we first launched the Nitro System.

As we continue to deliver on our digital sovereignty pledge of customer control over data access, I’m excited to share with you an independent report on the security design of the AWS Nitro System. We engaged NCC Group, a global cybersecurity consulting firm, to conduct an architecture review of our security claims of the Nitro System and produce a public report. This report confirms that the AWS Nitro System, by design, has no mechanism for anyone at AWS to access your data on Nitro hosts. The report evaluates the architecture of the Nitro System and our claims about operator access. It concludes that “As a matter of design, NCC Group found no gaps in the Nitro System that would compromise these security claims.” It also goes on to state, “NCC Group finds…there is no indication that a cloud service provider employee can obtain such access…to any host.” Our computing infrastructure, the Nitro System, has no operator access mechanism, and now is supported by a third-party analysis of those data controls. Read more in the NCC Group report.

New AWS Service Term

At AWS, security is our top priority. The NCC report shows the Nitro System is an exceptional computing backbone for AWS, with security at its core. The Nitro controls that prevent operator access are so fundamental to the Nitro System that we’ve added them in our AWS Service Terms, which are applicable to anyone who uses AWS.

Our AWS Service Terms now include the following on the Nitro System:

AWS personnel do not have access to Your Content on AWS Nitro System EC2 instances. There are no technical means or APIs available to AWS personnel to read, copy, extract, modify, or otherwise access Your Content on an AWS Nitro System EC2 instance or encrypted-EBS volume attached to an AWS Nitro System EC2 instance. Access to AWS Nitro System EC2 instance APIs – which enable AWS personnel to operate the system without access to Your Content – is always logged, and always requires authentication and authorization.

External control of your encryption keys with AWS KMS External Key Store

As part of our promise to continue to make the AWS Cloud sovereign-by-design, we pledged to continue to invest in an ambitious roadmap of capabilities, which includes our encryption capabilities. At re:Invent 2022, we took further steps to deliver on this roadmap of encrypt everything everywhere with encryption keys managed inside or outside the AWS Cloud by announcing the availability of AWS Key Management Service (AWS KMS) External Key Store (XKS). This innovation supports our customers who have a regulatory need to store and use their encryption keys outside the AWS Cloud. The open source XKS specification offers customers the flexibility to adapt to different HSM deployment use cases. While AWS KMS also prevents AWS personnel from accessing customer keys, this new capability may help some customers demonstrate compliance with specific regulations or industry expectations requiring storage and use of encryption keys outside of an AWS data center for certain workloads.

In order to accelerate our customers’ ability to adopt XKS for regulatory purposes, we collaborated with external HSM, key management, and integration service providers that our customers trust. To date, Thales, Entrust, Fortanix, DuoKey, and HashiCorp have launched XKS implementations, and Salesforce, Atos, and T-Systems have announced that they are building integrated service offerings around XKS. In addition, many SaaS solutions offer integration with AWS KMS for key management of their encryption offerings. Customers using these solutions, such as the offerings from Databricks, MongoDB, Reltio, Slack, Snowflake, and Zoom, can now utilize keys in external key managers via XKS to secure data. This allows customers to simplify their key management strategies across AWS as well as certain SaaS solutions by providing a centralized place to manage access policies and audit key usage.

We remain committed to helping our customers meet security, privacy, and digital sovereignty requirements. We will continue to innovate sovereignty features, controls, and assurances within the global AWS Cloud and deliver them without compromise to the full power of AWS.

 
If you have feedback about this post, submit comments in the Comments section below. If you have questions about this post, contact AWS Support.

Want more AWS Security news? Follow us on Twitter.

Matt Garman

Matt Garman

Matt is currently the Senior Vice President of AWS Sales, Marketing and Global Services at AWS, and also sits on Amazon’s executive leadership S-Team. Matt joined Amazon in 2006, and has held several leadership positions in AWS over that time. Matt previously served as Vice President of the Amazon EC2 and Compute Services businesses for AWS for over 10 years. Matt was responsible for P&L, product management, and engineering and operations for all compute and storage services in AWS. He started at Amazon when AWS first launched in 2006 and served as one of the first product managers, helping to launch the initial set of AWS services. Prior to Amazon, he spent time in product management roles at early stage Internet startups. Matt earned a BS and MS in Industrial Engineering from Stanford University, and an MBA from the Kellogg School of Management at Northwestern University.

[$] The ongoing trouble with get_user_pages()

Post Syndicated from original https://lwn.net/Articles/930667/

The 2018 Linux Storage, Filesystem, and Memory-Management (LSFMM)
conference included a session on
get_user_pages()
, an internal kernel interface that can, in
some situations, be used in ways that will lead to data corruption or
kernel crashes. As the 2023 LSFMM+BPF event
approaches, this problem remains unsolved and is still the topic of ongoing
discussion. This patch
series
from Lorenzo Stoakes, which is another attempt at a partial
solution, is the latest focus point.

New C features in GCC 13 (Red Hat Developer)

Post Syndicated from original https://lwn.net/Articles/930899/

The Red Hat Developer site has an
overview
of some of the new C-language features supported by the
GCC 13 release.

The nullptr constant first appeared in C++11, described in
proposal N2431 from 2007. Its purpose was to alleviate the problems
with the definition of NULL, which can be defined in a
variety of ways: (void *)0 (a pointer constant),
0 (an integer), and so on. This posed problems for
overload resolution, generic programming, etc. While C doesn’t have
function overloading, the protean definition of NULL still
causes headaches.

Backblaze Drive Stats for Q1 2023

Post Syndicated from original https://www.backblaze.com/blog/backblaze-drive-stats-for-q1-2023/

A long time ago in a galaxy far, far away, we started collecting and storing Drive Stats data. More precisely it was 10 years ago, and the galaxy was just Northern California, although it has expanded since then (as galaxies are known to do). During the last 10 years, a lot has happened with the where, when, and how of our Drive Stats data, but regardless, the Q1 2023 drive stats data is ready, so let’s get started.

As of the end of Q1 2023, Backblaze was monitoring 241,678 hard drives (HDDs) and solid state drives (SSDs) in our data centers around the world. Of that number, 4,400 are boot drives, with 3,038 SSDs and 1,362 HDDs. The failure rates for the SSDs are analyzed in the SSD Edition: 2022 Drive Stats review.

Today, we’ll focus on the 237,278 data drives under management as we review their quarterly and lifetime failure rates as of the end of Q1 2023. We also dig into the topic of average age of failed hard drives by drive size, model, and more. Along the way, we’ll share our observations and insights on the data presented and, as always, we look forward to you doing the same in the comments section at the end of the post.

Q1 2023 Hard Drive Failure Rates

Let’s start with reviewing our data for the Q1 2023 period. In that quarter, we tracked 237,278 hard drives used to store customer data. For our evaluation, we removed 385 drives from consideration as they were used for testing purposes or were drive models which did not have at least 60 drives. This leaves us with 236,893 hard drives grouped into 30 different models to analyze.

Notes and Observations on the Q1 2023 Drive Stats

  • Upward AFR: The annualized failure rate (AFR) for Q1 2023 was 1.54%, that’s up from Q4 2022 at 1.21% and from one year ago, Q1 2022, at 1.22%. Quarterly AFR numbers can be volatile, but can be useful in identifying a trend which needs further investigation. For example, three drives in Q1 2023 (listed below) more than doubled their individual AFR from Q4 2022 to Q1 2023. As a consequence, further review (or in some cases continued review) of these drives is warranted.
  • Zeroes and ones: The table below shows those drive models with either zero or one drive failure in Q1 2023.

When reviewing the table, any drive model with less than 50,000 drive days for the quarter does not have enough data to be statistically relevant for that period. That said, for two of the drive models listed, posting zero failures is not new. The 16TB Seagate (model: ST16000NM002J) had zero failures last quarter as well, and the 8TB Seagate (model: ST8000NM000A) has had zero failures since it was first installed in Q3 2022, a lifetime AFR of 0%.

  • A new, but not so new drive model: There is one new drive model in Q1 2023, the 8TB Toshiba (model: HDWF180). Actually, it is not new, it’s just that we now have 60 drives in production this quarter, so it makes the charts. This model has actually been in production since Q1 2022, starting with 18 drives and adding more drives over time. Why? This drive model is replacing some of the 187 failed 8TB drives this quarter. We have stockpiles of various sized drives we keep on hand for just this reason.

Q1 2023 Annualized Failures Rates by Drive Size and Manufacturer

The charts below summarize the Q1 2023 data first by Drive Size and then by manufacturer.

While we included all of the drive sizes we currently use, both the 6TB and 10TB drive sizes consist of one model for each and each has a limited number of drive days in the quarter: 79,651 for the 6TB drives and 105,443 for the 10TB drives. Each of the remaining drive sizes has at least 2.2 million drive days, making their quarterly annualized failure rates more reliable.

This chart combines all of the manufacturer’s drive models regardless of their age. In our case, many of the older drive models are from Seagate and that helps drive up their overall AFR. For example, 60% of the 4TB drives are from Seagate and are, on average, 89 months old, and over 95% of the 8TB drives in production are from Seagate and they are, on average, over 70 months old. As we’ve seen when we examined hard drive life expectancy using the Bathtub Curve, older drives have a tendency to fail more often.

That said, there are outliers out there like our intrepid fleet of 6TB Seagate drives which have an average age of 95.4 months and have a Q1 2023 AFR of 0.92% and a lifetime AFR of 0.89% as we’ll see later in this report.

The Average Age of Drive Failure

Recently the folks at Blocks & Files published an article outlining the average age of a hard drive when it failed. The article was based on the work of Timothy Burlee at Secure Data Recovery. To summarize, the article found that for the 2,007 failed hard drives analyzed, the average age at which they failed was 1,051 days, or two years and 10 months. We thought this was an interesting way to look at drive failure, and we wanted to know what we would find if we asked the same question of our Drive Stats data. They also determined the current pending sector count for each failed drive, but today we’ll focus on the average age of drive failure.

Getting Started

The article didn’t specify how they collected the amount of time a drive was operational before it failed but we’ll assume they used the SMART 9 raw value for power-on hours. Given that, our first task was to round up all of the failed drives in our dataset and record the power-on hours for each drive. That query produced a list of 18,605 drives which failed between April 10, 2013 and March 30, 2023, inclusive. 

For each failed drive we recorded the date, serial_number, model, drive_capacity, failure, and SMART 9 raw value. A sample is below.

To start the data cleanup process, we first removed 1,355 failed boot drives from the dataset, leaving us with 17,250 data drives.

We then removed 95 drives for one of the following reasons:

  • The failed drive had no data recorded or a zero in the SMART 9 raw attribute.
  • The failed drive had out of bounds data in one or more fields. For example, the capacity_bytes field was negative or the model was corrupt, that is unknown or unintelligible.

In both of these cases, the drives in question were not in a good state when the data was collected and as such any other data collected could be unreliable.

We are left with 17,155 failed drives to analyze. When we compute the average age at which this cohort of drives failed we get 22,360 hours, which is 932 days, or just over two years and six months. This is reasonably close to the two years and 10 months from the Blocks & Files article, but before we confirm their numbers let’s dig into our results a bit more.

Average Age of Drive Failure by Model and Size

Our Drive Stats dataset contains drive failures for 72 drive models, and that number does not include boot drives. To make our table a bit more manageable we’ve limited the list to those drive models which have recorded 50 or more failures. The resulting list contains 30 models which we’ve sorted by average failure age:

As one would expect, there are drive models above and below our overall failure average age of two years and six months. One observation is that the average failure age of many of the smaller sized drive models (1TB, 1.5TB, 2TB, etc.) is higher than our overall average of two years and six months. Conversely, for many larger sized drive models (12TB, 14TB, etc.) the average failure age was below the average. Before we reach any conclusions, let’s see what happens if we review the average failure age by drive size as shown below.

This chart seems to confirm the general trend that the average failure age of smaller drive models is higher than larger drive models. 

At this point you might start pondering whether technologies in larger drives such as the additional platters, increased areal density, or even the use of helium would impact the average failure age of these drives. But as the unflappable Admiral Ackbar would say:

“It’s a Trap”

The trap is that the dataset for the smaller sized drive models is, in our case, complete—there are no more 1TB, 1.5TB, 2TB, 3TB, or even 5TB drives in operation in our dataset. On the contrary, most of the larger sized drive models are still in operation and therefore they “haven’t finished failing yet.” In other words, as these larger drives continue to fail over the coming months and years, they could increase or decrease the average failure age of that drive model.

A New Hope

One way to move forward at this point is to limit our computations to only those drive models which are no longer in operation in our data centers. When we do this, we find we have 35 drive models consisting of 3,379 drives that have a failed average age of two years and seven months.

Trap or not, our results are consistent with the Blocks & Files article as their failed average age of two years and 10 months for their dataset.  It will be interesting to see how this comparison holds up over time as more drive models in our dataset finish their Backblaze operational life.

The second way to look at drive failure is to view the problem from the life expectancy point of view instead. This approach takes a page from bioscience and utilizes Kaplan-Meier techniques to produce life expectancy (aka survival) curves for different cohorts, in our case hard drive models. We used such curves previously in our Hard Drive Life Expectancy and Bathtub Curve blog posts. This approach allows us to see the failure rate over time and helps answer questions such as, “If I bought a drive today, what are the chances it will survive x years?”

Let’s Recap

We have three different, but similar, values for average failure age of hard drives, and they are as follows:

SourceFailed Drive CountAverage Failed Age
Secure Data Recovery2,007 failed drives2 years, 10 months
Backblaze17,155 failed drives (all models)2 years, 6 months
Backblaze3,379 failed drives (only drive models no longer in production)2 years, 7 months

When we first saw the Secure Data Recovery average failed age we thought that two years and 10 months was too low. We were surprised by what our data told us, but a little math never hurt anyone. Given we are always adding additional failed drives to our dataset, and retiring drive models along the way, we will continue to track the average failed age of our drive models and report back if we find anything interesting.

Lifetime Hard Drive Failure Rates

As of March 31, 2023, we were tracking 237,278 hard drives. For our lifetime analysis, we removed 385 drives that were only used for testing purposes or did not have at least 60 drives. This leaves us with 236,893 hard drives grouped into 30 different models to analyze for the lifetime table below.


Notes and Observations About the Lifetime Stats

The lifetime AFR for all the drives listed above is 1.40%. That is a slight increase from the previous quarter of 1.39%. The lifetime AFR number for all of our hard drives seems to have settled around 1.40%, although each drive model has its own unique AFR value.

For the past 10 years we’ve been capturing and storing the Drive Stats data which is the source of the lifetime AFRs listed in the table above. But, why keep track of the data at all? Well, besides creating this report each quarter, we use the data internally to help run our business. While there are many other factors which go into the decisions we make, the Drive Stats data helps to surface potential issues sooner, allows us to take better informed drive related actions, and overall adds a layer of confidence in the drive-based decisions we make.
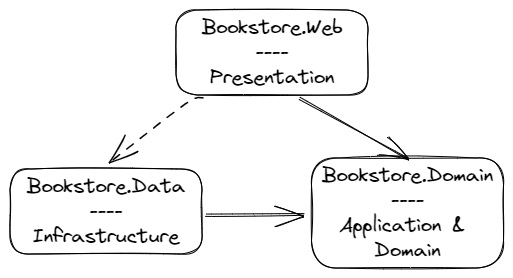
The Hard Drive Stats Data

The complete dataset used to create the information used in this review is available on our Hard Drive Test Data page. You can download and use this data for free for your own purpose. All we ask are three things: 1) you cite Backblaze as the source if you use the data, 2) you accept that you are solely responsible for how you use the data, and 3) you do not sell this data to anyone; it is free.
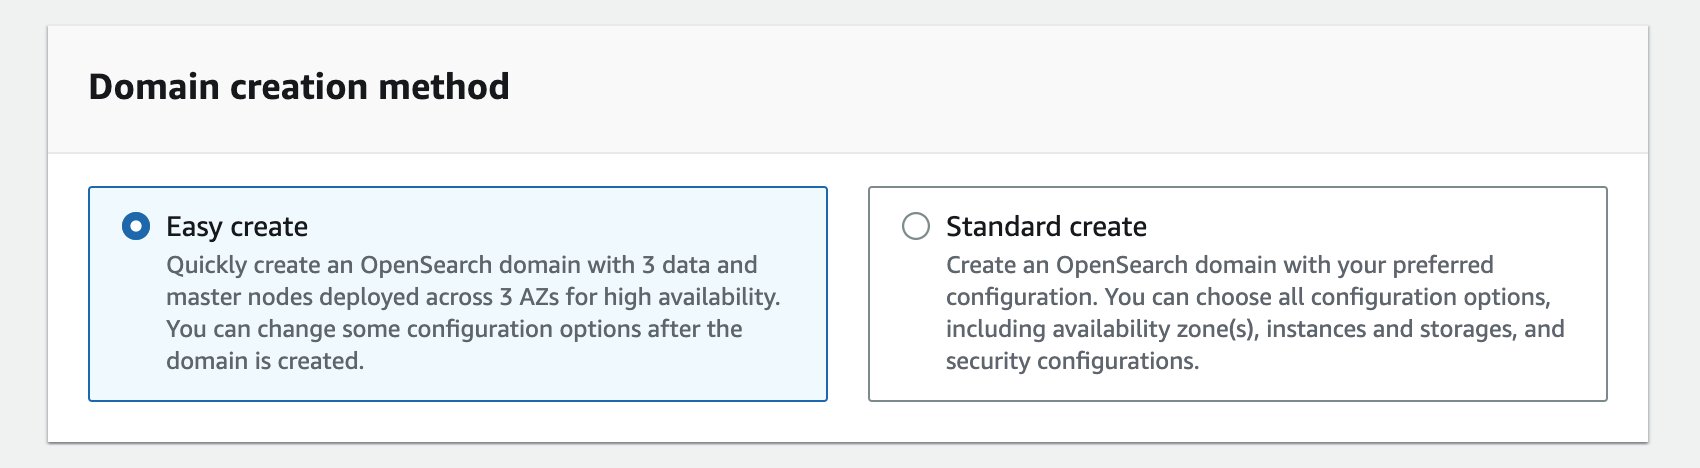
If you want the tables and charts used in this report, you can download the .zip file from Backblaze B2 Cloud Storage which contains an Excel file with a tab for each table or chart.

Good luck and let us know if you find anything interesting.

The post Backblaze Drive Stats for Q1 2023 appeared first on Backblaze Blog | Cloud Storage & Cloud Backup.

Large Language Models and Elections

Post Syndicated from Bruce Schneier original https://www.schneier.com/blog/archives/2023/05/large-language-models-and-elections.html

Earlier this week, the Republican National Committee released a video that it claims was “built entirely with AI imagery.” The content of the ad isn’t especially novel—a dystopian vision of America under a second term with President Joe Biden—but the deliberate emphasis on the technology used to create it stands out: It’s a “Daisy” moment for the 2020s.

We should expect more of this kind of thing. The applications of AI to political advertising have not escaped campaigners, who are already “pressure testing” possible uses for the technology. In the 2024 presidential election campaign, you can bank on the appearance of AI-generated personalized fundraising emails, text messages from chatbots urging you to vote, and maybe even some deepfaked campaign avatars. Future candidates could use chatbots trained on data representing their views and personalities to approximate the act of directly connecting with people. Think of it like a whistle-stop tour with an appearance in every living room. Previous technological revolutions—railroad, radio, television, and the World Wide Web—transformed how candidates connect to their constituents, and we should expect the same from generative AI. This isn’t science fiction: The era of AI chatbots standing in as avatars for real, individual people has already begun, as the journalist Casey Newton made clear in a 2016 feature about a woman who used thousands of text messages to create a chatbot replica of her best friend after he died.

The key is interaction. A candidate could use tools enabled by large language models, or LLMs—the technology behind apps such as ChatGPT and the art-making DALL-E—to do micro-polling or message testing, and to solicit perspectives and testimonies from their political audience individually and at scale. The candidates could potentially reach any voter who possesses a smartphone or computer, not just the ones with the disposable income and free time to attend a campaign rally. At its best, AI could be a tool to increase the accessibility of political engagement and ease polarization. At its worst, it could propagate misinformation and increase the risk of voter manipulation. Whatever the case, we know political operatives are using these tools. To reckon with their potential now isn’t buying into the hype—it’s preparing for whatever may come next.

On the positive end, and most profoundly, LLMs could help people think through, refine, or discover their own political ideologies. Research has shown that many voters come to their policy positions reflexively, out of a sense of partisan affiliation. The very act of reflecting on these views through discourse can change, and even depolarize, those views. It can be hard to have reflective policy conversations with an informed, even-keeled human discussion partner when we all live within a highly charged political environment; this is a role almost custom-designed for LLM. In US politics, it is a truism that the most valuable resource in a campaign is time. People are busy and distracted. Campaigns have a limited window to convince and activate voters. Money allows a candidate to purchase time: TV commercials, labor from staffers, and fundraising events to raise even more money. LLMs could provide campaigns with what is essentially a printing press for time.

If you were a political operative, which would you rather do: play a short video on a voter’s TV while they are folding laundry in the next room, or exchange essay-length thoughts with a voter on your candidate’s key issues? A staffer knocking on doors might need to canvass 50 homes over two hours to find one voter willing to have a conversation. OpenAI charges pennies to process about 800 words with its latest GPT-4 model, and that cost could fall dramatically as competitive AIs become available. People seem to enjoy interacting with chatbots; Open’s product reportedly has the fastest-growing user base in the history of consumer apps.

Optimistically, one possible result might be that we’ll get less annoyed with the deluge of political ads if their messaging is more usefully tailored to our interests by AI tools. Though the evidence for microtargeting’s effectiveness is mixed at best, some studies show that targeting the right issues to the right people can persuade voters. Expecting more sophisticated, AI-assisted approaches to be more consistently effective is reasonable. And anything that can prevent us from seeing the same 30-second campaign spot 20 times a day seems like a win.

AI can also help humans effectuate their political interests. In the 2016 US presidential election, primitive chatbots had a role in donor engagement and voter-registration drives: simple messaging tasks such as helping users pre-fill a voter-registration form or reminding them where their polling place is. If it works, the current generation of much more capable chatbots could supercharge small-dollar solicitations and get-out-the-vote campaigns.

And the interactive capability of chatbots could help voters better understand their choices. An AI chatbot could answer questions from the perspective of a candidate about the details of their policy positions most salient to an individual user, or respond to questions about how a candidate’s stance on a national issue translates to a user’s locale. Political organizations could similarly use them to explain complex policy issues, such as those relating to the climate or health care or…anything, really.

Of course, this could also go badly. In the time-honored tradition of demagogues worldwide, the LLM could inconsistently represent the candidate’s views to appeal to the individual proclivities of each voter.

In fact, the fundamentally obsequious nature of the current generation of large language models results in them acting like demagogues. Current LLMs are known to hallucinate—or go entirely off-script—and produce answers that have no basis in reality. These models do not experience emotion in any way, but some research suggests they have a sophisticated ability to assess the emotion and tone of their human users. Although they weren’t trained for this purpose, ChatGPT and its successor, GPT-4, may already be pretty good at assessing some of their users’ traits—say, the likelihood that the author of a text prompt is depressed. Combined with their persuasive capabilities, that means that they could learn to skillfully manipulate the emotions of their human users.

This is not entirely theoretical. A growing body of evidence demonstrates that interacting with AI has a persuasive effect on human users. A study published in February prompted participants to co-write a statement about the benefits of social-media platforms for society with an AI chatbot configured to have varying views on the subject. When researchers surveyed participants after the co-writing experience, those who interacted with a chatbot that expressed that social media is good or bad were far more likely to express the same view than a control group that didn’t interact with an “opinionated language model.”

For the time being, most Americans say they are resistant to trusting AI in sensitive matters such as health care. The same is probably true of politics. If a neighbor volunteering with a campaign persuades you to vote a particular way on a local ballot initiative, you might feel good about that interaction. If a chatbot does the same thing, would you feel the same way? To help voters chart their own course in a world of persuasive AI, we should demand transparency from our candidates. Campaigns should have to clearly disclose when a text agent interacting with a potential voter—through traditional robotexting or the use of the latest AI chatbots—is human or automated.

Though companies such as Meta (Facebook’s parent company) and Alphabet (Google’s) publish libraries of traditional, static political advertising, they do so poorly. These systems would need to be improved and expanded to accommodate user-level differentiation in ad copy to offer serviceable protection against misuse.

A public, anonymized log of chatbot conversations could help hold candidates’ AI representatives accountable for shifting statements and digital pandering. Candidates who use chatbots to engage voters may not want to make all transcripts of those conversations public, but their users could easily choose to share them. So far, there is no shortage of people eager to share their chat transcripts, and in fact, an online database exists of nearly 200,000 of them. In the recent past, Mozilla has galvanized users to opt into sharing their web data to study online misinformation.

We also need stronger nationwide protections on data privacy, as well as the ability to opt out of targeted advertising, to protect us from the potential excesses of this kind of marketing. No one should be forcibly subjected to political advertising, LLM-generated or not, on the basis of their Internet searches regarding private matters such as medical issues. In February, the European Parliament voted to limit political-ad targeting to only basic information, such as language and general location, within two months of an election. This stands in stark contrast to the US, which has for years failed to enact federal data-privacy regulations. Though the 2018 revelation of the Cambridge Analytica scandal led to billions of dollars in fines and settlements against Facebook, it has so far resulted in no substantial legislative action.

Transparency requirements like these are a first step toward oversight of future AI-assisted campaigns. Although we should aspire to more robust legal controls on campaign uses of AI, it seems implausible that these will be adopted in advance of the fast-approaching 2024 general presidential election.

Credit the RNC, at least, with disclosing that their recent ad was AI-generated—a transparent attempt at publicity still counts as transparency. But what will we do if the next viral AI-generated ad tries to pass as something more conventional?

As we are all being exposed to these rapidly evolving technologies for the first time and trying to understand their potential uses and effects, let’s push for the kind of basic transparency protection that will allow us to know what we’re dealing with.

This essay was written with Nathan Sanders, and previously appeared on the Atlantic.

EDITED TO ADD (5/12): Better article on the “daisy” ad.

Extending a serverless, event-driven architecture to existing container workloads

Post Syndicated from James Beswick original https://aws.amazon.com/blogs/compute/extending-a-serverless-event-driven-architecture-to-existing-container-workloads/

This post is written by Dhiraj Mahapatro, Principal Specialist SA, and Sascha Moellering, Principal Specialist SA, and Emily Shea, WW Lead, Integration Services.

Many serverless services are a natural fit for event-driven architectures (EDA), as events invoke them and only run when there is an event to process. When building in the cloud, many services emit events by default and have built-in features for managing events. This combination allows customers to build event-driven architectures easier and faster than ever before.

The insurance claims processing sample application in this blog series uses event-driven architecture principles and serverless services like AWS Lambda, AWS Step Functions, Amazon API Gateway, Amazon EventBridge, and Amazon SQS.

When building an event-driven architecture, it’s likely that you have existing services to integrate with the new architecture, ideally without needing to make significant refactoring changes to those services. As services communicate via events, extending applications to new and existing microservices is a key benefit of building with EDA. You can write those microservices in different programming languages or running on different compute options.

This blog post walks through a scenario of integrating an existing, containerized service (a settlement service) to the serverless, event-driven insurance claims processing application described in this blog post.

Overview of sample event-driven architecture

The sample application uses a front-end to sign up a new user and allow the user to upload images of their car and driver’s license. Once signed up, they can file a claim and upload images of their damaged car. Previously, it did not yet integrate with a settlement service for completing the claims and settlement process.

In this scenario, the settlement service is a brownfield application that runs Spring Boot 3 on Amazon ECS with AWS Fargate. AWS Fargate is a serverless, pay-as-you-go compute engine that lets you focus on building container applications without managing servers.

The Spring Boot application exposes a REST endpoint, which accepts a POST request. It applies settlement business logic and creates a settlement record in the database for a car insurance claim. Your goal is to make settlement work with the new EDA application that is designed for claims processing without re-architecting or rewriting. Customer, claims, fraud, document, and notification are the other domains that are shown as blue-colored boxes in the following diagram:

Reference architecture

Project structure

The application uses AWS Cloud Development Kit (CDK) to build the stack. With CDK, you get the flexibility to create modular and reusable constructs imperatively using your language of choice. The sample application uses TypeScript for CDK.

The following project structure enables you to build different bounded contexts. Event-driven architecture relies on the choreography of events between domains. The object oriented programming (OOP) concept of CDK helps provision the infrastructure to separate the domain concerns while loosely coupling them via events.

You break the higher level CDK constructs down to these corresponding domains:

Comparing domains

Application and infrastructure code are present in each domain. This project structure creates a seamless way to add new domains like settlement with its application and infrastructure code without affecting other areas of the business.

With the preceding structure, you can use the settlement-service.ts CDK construct inside claims-processing-stack.ts:

const settlementService = new SettlementService(this, "SettlementService", {
  bus,
});

The only information the SettlementService construct needs to work is the EventBridge custom event bus resource that is created in the claims-processing-stack.ts.

To run the sample application, follow the setup steps in the sample application’s README file.

Existing container workload

The settlement domain provides a REST service to the rest of the organization. A Docker containerized Spring Boot application runs on Amazon ECS with AWS Fargate. The following sequence diagram shows the synchronous request-response flow from an external REST client to the service:

Settlement service

  1. External REST client makes POST /settlement call via an HTTP API present in front of an internal Application Load Balancer (ALB).
  2. SettlementController.java delegates to SettlementService.java.
  3. SettlementService applies business logic and calls SettlementRepository for data persistence.
  4. SettlementRepository persists the item in the Settlement DynamoDB table.

A request to the HTTP API endpoint looks like:

curl --location <settlement-api-endpoint-from-cloudformation-output> \
--header 'Content-Type: application/json' \
--data '{
  "customerId": "06987bc1-1234-1234-1234-2637edab1e57",
  "claimId": "60ccfe05-1234-1234-1234-a4c1ee6fcc29",
  "color": "green",
  "damage": "bumper_dent"
}'

The response from the API call is:

API response

You can learn more here about optimizing Spring Boot applications on AWS Fargate.

Extending container workload for events

To integrate the settlement service, you must update the service to receive and emit events asynchronously. The core logic of the settlement service remains the same. When you file a claim, upload damaged car images, and the application detects no document fraud, the settlement domain subscribes to Fraud.Not.Detected event and applies its business logic. The settlement service emits an event back upon applying the business logic.

The following sequence diagram shows a new interface in settlement to work with EDA. The settlement service subscribes to events that a producer emits. Here, the event producer is the fraud service that puts an event in an EventBridge custom event bus.

Sequence diagram

  1. Producer emits Fraud.Not.Detected event to EventBridge custom event bus.
  2. EventBridge evaluates the rules provided by the settlement domain and sends the event payload to the target SQS queue.
  3. SubscriberService.java polls for new messages in the SQS queue.
  4. On message, it transforms the message body to an input object that is accepted by SettlementService.
  5. It then delegates the call to SettlementService, similar to how SettlementController works in the REST implementation.
  6. SettlementService applies business logic. The flow is like the REST use case from 7 to 10.
  7. On receiving the response from the SettlementService, the SubscriberService transforms the response to publish an event back to the event bus with the event type as Settlement.Finalized.

The rest of the architecture consumes this Settlement.Finalized event.

Using EventBridge schema registry and discovery

Schema enforces a contract between a producer and a consumer. A consumer expects the exact structure of the event payload every time an event arrives. EventBridge provides schema registry and discovery to maintain this contract. The consumer (the settlement service) can download the code bindings and use them in the source code.

Enable schema discovery in EventBridge before downloading the code bindings and using them in your repository. The code bindings provide a marshaller that unmarshals the incoming event from SQS queue to a plain old Java object (POJO) FraudNotDetected.java. You download the code bindings using the choice of your IDE. AWS Toolkit for IntelliJ makes it convenient to download and use them.

Download code bindings

The final architecture for the settlement service with REST and event-driven architecture looks like:

Final architecture

Transition to become fully event-driven

With the new capability to handle events, the Spring Boot application now supports both the REST endpoint and the event-driven architecture by running the same business logic through different interfaces. In this example scenario, as the event-driven architecture matures and the rest of the organization adopts it, the need for the POST endpoint to save a settlement may diminish. In the future, you can deprecate the endpoint and fully rely on polling messages from the SQS queue.

You start with using an ALB and Fargate service CDK ECS pattern:

const loadBalancedFargateService = new ecs_patterns.ApplicationLoadBalancedFargateService(
  this,
  "settlement-service",
  {
    cluster: cluster,
    taskImageOptions: {
      image: ecs.ContainerImage.fromDockerImageAsset(asset),
      environment: {
        "DYNAMODB_TABLE_NAME": this.table.tableName
      },
      containerPort: 8080,
      logDriver: new ecs.AwsLogDriver({
        streamPrefix: "settlement-service",
        mode: ecs.AwsLogDriverMode.NON_BLOCKING,
        logRetention: RetentionDays.FIVE_DAYS,
      })
    },
    memoryLimitMiB: 2048,
    cpu: 1024,
    publicLoadBalancer: true,
    desiredCount: 2,
    listenerPort: 8080
  });

To adapt to EDA, you update the resources to retrofit the SQS queue to receive messages and EventBridge to put events. Add new environment variables to the ApplicationLoadBalancerFargateService resource:

environment: {
  "SQS_ENDPOINT_URL": queue.queueUrl,
  "EVENTBUS_NAME": props.bus.eventBusName,
  "DYNAMODB_TABLE_NAME": this.table.tableName
}

Grant the Fargate task permission to put events in the custom event bus and consume messages from the SQS queue:

props.bus.grantPutEventsTo(loadBalancedFargateService.taskDefinition.taskRole);
queue.grantConsumeMessages(loadBalancedFargateService.taskDefinition.taskRole);

When you transition the settlement service to become fully event-driven, you do not need the HTTP API endpoint and ALB anymore, as SQS is the source of events.

A better alternative is to use QueueProcessingFargateService ECS pattern for the Fargate service. The pattern provides auto scaling based on the number of visible messages in the SQS queue, besides CPU utilization. In the following example, you can also add two capacity provider strategies while setting up the Fargate service: FARGATE_SPOT and FARGATE. This means, for every one task that is run using FARGATE, there are two tasks that use FARGATE_SPOT. This can help optimize cost.

const queueProcessingFargateService = new ecs_patterns.QueueProcessingFargateService(this, 'Service', {
  cluster,
  memoryLimitMiB: 1024,
  cpu: 512,
  queue: queue,
  image: ecs.ContainerImage.fromDockerImageAsset(asset),
  desiredTaskCount: 2,
  minScalingCapacity: 1,
  maxScalingCapacity: 5,
  maxHealthyPercent: 200,
  minHealthyPercent: 66,
  environment: {
    "SQS_ENDPOINT_URL": queueUrl,
    "EVENTBUS_NAME": props?.bus.eventBusName,
    "DYNAMODB_TABLE_NAME": tableName
  },
  capacityProviderStrategies: [
    {
      capacityProvider: 'FARGATE_SPOT',
      weight: 2,
    },
    {
      capacityProvider: 'FARGATE',
      weight: 1,
    },
  ],
});

This pattern abstracts the automatic scaling behavior of the Fargate service based on the queue depth.

Running the application

To test the application, follow How to use the Application after the initial setup. Once complete, you see that the browser receives a Settlement.Finalized event:

{
  "version": "0",
  "id": "e2a9c866-cb5b-728c-ce18-3b17477fa5ff",
  "detail-type": "Settlement.Finalized",
  "source": "settlement.service",
  "account": "123456789",
  "time": "2023-04-09T23:20:44Z",
  "region": "us-east-2",
  "resources": [],
  "detail": {
    "settlementId": "377d788b-9922-402a-a56c-c8460e34e36d",
    "customerId": "67cac76c-40b1-4d63-a8b5-ad20f6e2e6b9",
    "claimId": "b1192ba0-de7e-450f-ac13-991613c48041",
    "settlementMessage": "Based on our analysis on the damage of your car per claim id b1192ba0-de7e-450f-ac13-991613c48041, your out-of-pocket expense will be $100.00."
  }
}

Cleaning up

The stack creates a custom VPC and other related resources. Be sure to clean up resources after usage to avoid the ongoing cost of running these services. To clean up the infrastructure, follow the clean-up steps shown in the sample application.

Conclusion

The blog explains a way to integrate existing container workload running on AWS Fargate with a new event-driven architecture. You use EventBridge to decouple different services from each other that are built using different compute technologies, languages, and frameworks. Using AWS CDK, you gain the modularity of building services decoupled from each other.

This blog shows an evolutionary architecture that allows you to modernize existing container workloads with minimal changes that still give you the additional benefits of building with serverless and EDA on AWS.

The major difference between the event-driven approach and the REST approach is that you unblock the producer once it emits an event. The event producer from the settlement domain that subscribes to that event is loosely coupled. The business functionality remains intact, and no significant refactoring or re-architecting effort is required. With these agility gains, you may get to the market faster

The sample application shows the implementation details and steps to set up, run, and clean up the application. The app uses ECS Fargate for a domain service, but you do not limit it to just Fargate. You can also bring container-based applications running on Amazon EKS similarly to event-driven architecture.

Learn more about event-driven architecture on Serverless Land.

Integrating DevOps Guru Insights with CloudWatch Dashboard

Post Syndicated from Suresh Babu original https://aws.amazon.com/blogs/devops/integrating-devops-guru-insights-with-cloudwatch-dashboard/

Many customers use Amazon CloudWatch dashboards to monitor applications and often ask how they can integrate Amazon DevOps Guru Insights in order to have a unified dashboard for monitoring.  This blog post showcases integrating DevOps Guru proactive and reactive insights to a CloudWatch dashboard by using Custom Widgets. It can help you to correlate trends over time and spot issues more efficiently by displaying related data from different sources side by side and to have a single pane of glass visualization in the CloudWatch dashboard.

Amazon DevOps Guru is a machine learning (ML) powered service that helps developers and operators automatically detect anomalies and improve application availability. DevOps Guru’s anomaly detectors can proactively detect anomalous behavior even before it occurs, helping you address issues before they happen; detailed insights provide recommendations to mitigate that behavior.

Amazon CloudWatch dashboard is a customizable home page in the CloudWatch console that monitors multiple resources in a single view. You can use CloudWatch dashboards to create customized views of the metrics and alarms for your AWS resources.

Solution overview

This post will help you to create a Custom Widget for Amazon CloudWatch dashboard that displays DevOps Guru Insights. A custom widget is part of your CloudWatch dashboard that calls an AWS Lambda function containing your custom code. The Lambda function accepts custom parameters, generates your dataset or visualization, and then returns HTML to the CloudWatch dashboard. The CloudWatch dashboard will display this HTML as a widget. In this post, we are providing sample code for the Lambda function that will call DevOps Guru APIs to retrieve the insights information and displays as a widget in the CloudWatch dashboard. The architecture diagram of the solution is below.

Solution Architecture

Figure 1: Reference architecture diagram

Prerequisites and Assumptions

  • An AWS account. To sign up:
  • DevOps Guru should be enabled in the account. For enabling DevOps guru, see DevOps Guru Setup
  • Follow this Workshop to deploy a sample application in your AWS Account which can help generate some DevOps Guru insights.

Solution Deployment

We are providing two options to deploy the solution – using the AWS console and AWS CloudFormation. The first section has instructions to deploy using the AWS console followed by instructions for using CloudFormation. The key difference is that we will create one Widget while using the Console, but three Widgets are created when we use AWS CloudFormation.

Using the AWS Console:

We will first create a Lambda function that will retrieve the DevOps Guru insights. We will then modify the default IAM role associated with the Lambda function to add DevOps Guru permissions. Finally we will create a CloudWatch dashboard and add a custom widget to display the DevOps Guru insights.

  1. Navigate to the Lambda Console after logging to your AWS Account and click on Create function.

    Figure 2a: Create Lambda Function

    Figure 2a: Create Lambda Function

  2. Choose Author from Scratch and use the runtime Node.js 16.x. Leave the rest of the settings at default and create the function.

    Figure 2b: Create Lambda Function

    Figure 2b: Create Lambda Function

  3. After a few seconds, the Lambda function will be created and you will see a code source box. Copy the code from the text box below and replace the code present in code source as shown in screen print below.
    // SPDX-License-Identifier: MIT-0
    // CloudWatch Custom Widget sample: displays count of Amazon DevOps Guru Insights
    const aws = require('aws-sdk');
    
    const DOCS = `## DevOps Guru Insights Count
    Displays the total counts of Proactive and Reactive Insights in DevOps Guru.
    `;
    
    async function getProactiveInsightsCount(DevOpsGuru, StartTime, EndTime) {
        let NextToken = null;
        let proactivecount=0;
    
        do {
            const args = { StatusFilter: { Any : { StartTimeRange: { FromTime: StartTime, ToTime: EndTime }, Type: 'PROACTIVE'  }}}
            const result = await DevOpsGuru.listInsights(args).promise();
            console.log(result)
            NextToken = result.NextToken;
            result.ProactiveInsights.forEach(res =&gt; {
            console.log(result.ProactiveInsights[0].Status)
            proactivecount++;
            });
            } while (NextToken);
        return proactivecount;
    }
    
    async function getReactiveInsightsCount(DevOpsGuru, StartTime, EndTime) {
        let NextToken = null;
        let reactivecount=0;
    
        do {
            const args = { StatusFilter: { Any : { StartTimeRange: { FromTime: StartTime, ToTime: EndTime }, Type: 'REACTIVE'  }}}
            const result = await DevOpsGuru.listInsights(args).promise();
            NextToken = result.NextToken;
            result.ReactiveInsights.forEach(res =&gt; {
            reactivecount++;
            });
            } while (NextToken);
        return reactivecount;
    }
    
    function getHtmlOutput(proactivecount, reactivecount, region, event, context) {
    
        return `DevOps Guru Proactive Insights&lt;br&gt;&lt;font size="+10" color="#FF9900"&gt;${proactivecount}&lt;/font&gt;
        &lt;p&gt;DevOps Guru Reactive Insights&lt;/p&gt;&lt;font size="+10" color="#FF9900"&gt;${reactivecount}`;
    }
    
    exports.handler = async (event, context) =&gt; {
        if (event.describe) {
            return DOCS;
        }
        const widgetContext = event.widgetContext;
        const timeRange = widgetContext.timeRange.zoom || widgetContext.timeRange;
        const StartTime = new Date(timeRange.start);
        const EndTime = new Date(timeRange.end);
        const region = event.region || process.env.AWS_REGION;
        const DevOpsGuru = new aws.DevOpsGuru({ region });
    
        const proactivecount = await getProactiveInsightsCount(DevOpsGuru, StartTime, EndTime);
        const reactivecount = await getReactiveInsightsCount(DevOpsGuru, StartTime, EndTime);
    
        return getHtmlOutput(proactivecount, reactivecount, region, event, context);
        
    };

    Figure 3: Lambda Function Source Code

    Figure 3: Lambda Function Source Code

  4. Click on Deploy to save the function code
  5. Since we used the default settings while creating the function, a default Execution role is created and associated with the function. We will need to modify the IAM role to grant DevOps Guru permissions to retrieve Proactive and Reactive insights.
  6. Click on the Configuration tab and select Permissions from the left side option list. You can see the IAM execution role associated with the function as shown in figure 4.

    Figure 4: Lambda function execution role

    Figure 4: Lambda function execution role

  7. Click on the IAM role name to open the role in the IAM console. Click on Add Permissions and select Attach policies.

    Figure 5: IAM Role Update

    Figure 5: IAM Role Update

  8. Search for DevOps and select the AmazonDevOpsGuruReadOnlyAccess. Click on Add permissions to update the IAM role.

    Figure 6: IAM Role Policy Update

    Figure 6: IAM Role Policy Update

  9. Now that we have created the Lambda function for our custom widget and assigned appropriate permissions, we can navigate to CloudWatch to create a Dashboard.
  10. Navigate to CloudWatch and click on dashboards from the left side list. You can choose to create a new dashboard or add the widget in an existing dashboard.
  11. We will choose to create a new dashboard

    Figure 7: Create New CloudWatch dashboard

    Figure 7: Create New CloudWatch dashboard

  12. Choose Custom Widget in the Add widget page

    Figure 8: Add widget

    Figure 8: Add widget

  13. Click Next in the custom widge page without choosing a sample

    Figure 9: Custom Widget Selection

    Figure 9: Custom Widget Selection

  14. Choose the region where devops guru is enabled. Select the Lambda function that we created earlier. In the preview pane, click on preview to view DevOps Guru metrics. Once the preview is successful, create the Widget.

    Figure 10: Create Custom Widget

    Figure 10: Create Custom Widget

  15. Congratulations, you have now successfully created a CloudWatch dashboard with a custom widget to get insights from DevOps Guru. The sample code that we provided can be customized to suit your needs.

Using AWS CloudFormation

You may skip this step and move to future scope section if you have already created the resources using AWS Console.

In this step we will show you how to  deploy the solution using AWS CloudFormation. AWS CloudFormation lets you model, provision, and manage AWS and third-party resources by treating infrastructure as code. Customers define an initial template and then revise it as their requirements change. For more information on CloudFormation stack creation refer to  this blog post.

The following resources are created.

  • Three Lambda functions that will support CloudWatch Dashboard custom widgets
  • An AWS Identity and Access Management (IAM) role to that allows the Lambda function to access DevOps Guru Insights and to publish logs to CloudWatch
  • Three Log Groups under CloudWatch
  • A CloudWatch dashboard with widgets to pull data from the Lambda Functions

To deploy the solution by using the CloudFormation template

  1. You can use this downloadable template  to set up the resources. To launch directly through the console, choose Launch Stack button, which creates the stack in the us-east-1 AWS Region.
  2. Choose Next to go to the Specify stack details page.
  3. (Optional) On the Configure Stack Options page, enter any tags, and then choose Next.
  4. On the Review page, select I acknowledge that AWS CloudFormation might create IAM resources.
  5. Choose Create stack.

It takes approximately 2-3 minutes for the provisioning to complete. After the status is “Complete”, proceed to validate the resources as listed below.

Validate the resources

Now that the stack creation has completed successfully, you should validate the resources that were created.

  • On AWS Console, head to CloudWatch, under Dashboards – there will be a dashboard created with name <StackName-Region>.
  • On AWS Console, head to CloudWatch, under LogGroups there will be 3 new log-groups created with the name as:
    • lambdaProactiveLogGroup
    • lambdaReactiveLogGroup
    • lambdaSummaryLogGroup
  • On AWS Console, head to Lambda, there will be lambda function(s) under the name:
    • lambdaFunctionDGProactive
    • lambdaFunctionDGReactive
    • lambdaFunctionDGSummary
  • On AWS Console, head to IAM, under Roles there will be a new role created with name “lambdaIAMRole”

To View Results/Outcome

With the appropriate time-range setup on CloudWatch Dashboard, you will be able to navigate through the insights that have been generated from DevOps Guru on the CloudWatch Dashboard.

Figure 11: DevOpsGuru Insights in Cloudwatch Dashboard

Figure 11: DevOpsGuru Insights in Cloudwatch Dashboard

Cleanup

For cost optimization, after you complete and test this solution, clean up the resources. You can delete them manually if you used the AWS Console or by deleting the AWS CloudFormation stack called devopsguru-cloudwatch-dashboard if you used AWS CloudFormation.

For more information on deleting the stacks, see Deleting a stack on the AWS CloudFormation console.

Conclusion

This blog post outlined how you can integrate DevOps Guru insights into a CloudWatch Dashboard. As a customer, you can start leveraging CloudWatch Custom Widgets to include DevOps Guru Insights in an existing Operational dashboard.

AWS Customers are now using Amazon DevOps Guru to monitor and improve application performance. You can start monitoring your applications by following the instructions in the product documentation. Head over to the Amazon DevOps Guru console to get started today.

To learn more about AIOps for Serverless using Amazon DevOps Guru check out this video.

Suresh Babu

Suresh Babu is a DevOps Consultant at Amazon Web Services (AWS) with 21 years of experience in designing and implementing software solutions from various industries. He helps customers in Application Modernization and DevOps adoption. Suresh is a passionate public speaker and often speaks about DevOps and Artificial Intelligence (AI)

Venkat Devarajan

Venkat Devarajan is a Senior Solutions Architect at Amazon Webservices (AWS) supporting enterprise automotive customers. He has over 18 years of industry experience in helping customers design, build, implement and operate enterprise applications.

Ashwin Bhargava

Ashwin is a DevOps Consultant at AWS working in Professional Services Canada. He is a DevOps expert and a security enthusiast with more than 15 years of development and consulting experience.

Murty Chappidi

Murty is an APJ Partner Solutions Architecture Lead at Amazon Web Services with a focus on helping customers with accelerated and seamless journey to AWS by providing solutions through our GSI partners. He has more than 25 years’ experience in software and technology and has worked in multiple industry verticals. He is the APJ SME for AI for DevOps Focus Area. In his free time, he enjoys gardening and cooking.

GitHub Availability Report: April 2023

Post Syndicated from Jakub Oleksy original https://github.blog/2023-05-03-github-availability-report-april-2023/

In April, we experienced four incidents that resulted in degraded performance across GitHub services. This report also sheds light into three March incidents that resulted in degraded performance across GitHub services.

March 27 12:25 UTC (lasting 1 hour and 33 minutes)

On March 27 at 12:14 UTC, users began to see degraded experience with Git Operations, GitHub Issues, pull requests, GitHub Actions, GitHub API requests, GitHub Codespaces, and GitHub Pages. We publicly statused Git Operations 11 minutes later, initially to yellow, followed by red for other impacted services. Full functionality was restored at 13:17 UTC.

The cause was traced to a change in a frequently-used database query. The query alteration was part of a larger infrastructure change that had been rolled out gradually, starting in October 2022, then more quickly beginning February 2023, completing on March 20, 2023. The change increased the chance of lock contention, leading to increased query times and eventual resource exhaustion during brief load spikes, which caused the database to crash. An initial automatic failover solved this seamlessly, but the slow query continued to cause lock contention and resource exhaustion, leading to a second failover that did not complete. Mitigation took longer than usual because manual intervention was required to fully recover.

The query causing lock tension was disabled via feature flag, and then refactored. We have added additional monitoring of relevant database resources so as not to reach resource exhaustion, and detect similar issues earlier in our staged rollout process. Additionally, we have enhanced our query evaluation procedures related to database lock contention, along with improved documentation and training material.

March 29 14:21 UTC (lasting 4 hour and 57 minutes)

On March 29 at 14:10 UTC, users began to see a degraded experience with GitHub Actions with their workflows not progressing. Engineers initially statused GitHub Actions nine minutes later. GitHub Actions started recovering between 14:57 UTC and 16:47 UTC before degrading again. GitHub Actions fully recovered the queue of backlogged workflows at 19:03 UTC.

We determined the cause of the impact to be a degraded database cluster. Contributing factors included a new load source from a background job querying that database cluster, maxed out database transaction pools, and underprovisioning of vtgate proxy instances that are responsible for query routing, load balancing, and sharding. The incident was mitigated through throttling of job processing and adding capacity, including overprovisioning to speed processing of the backlogged jobs.

After the incident, we identified that the pool, found_rows_pool managed by the vtgate layer, was overwhelmed and unresponsive. This pool became flooded and stuck due to contention between inserting data into and reading data from the tables in the database. This contention led to us being unable to progress any new queries across our database cluster.

The health of our database clusters is a top priority for us and we have taken steps to reduce contentious queries on our cluster over the last few weeks. We also have taken multiple actions from what we learned in this incident to improve our telemetry and alerting to allow us to identify and act on blocking queries faster. We are carefully monitoring the cluster health and are taking a close look into each component to identify any additional repair items or adjustments we can make to improve long-term stability.

March 31 01:07 UTC (lasting 2 hours)

On March 31 at 00:06 UTC, a small percentage of users started to receive consistent 500 error responses on pull request files pages. At 01:07 UTC, the support team escalated reports from customers to engineering who identified the cause and statused yellow nine minutes later. The fix was deployed to all production hosts by 02:07 UTC.

We determined the source of the bug to be a notification to promote a new feature. Only repository admins who had not enabled the new feature or dismissed the notification were impacted. An expiry date in the configuration of this notification was set incorrectly, which caused a constant that was still referenced in code to no longer be available.

We have taken steps to avoid similar issues in the future by auditing the expiry dates of existing notices, preventing future invalid configurations, and improving test coverage.

April 18 09:28 UTC (lasting 11 minutes)

On April 18 at 09:22 UTC, users accessing any issues or pull request related entities experienced consistent 5xx responses. Engineers publicly statused pull requests to red and issues six minutes later. At 09:33 UTC, the root cause self-healed and traffic recovered. The impact resulted in an 11 minute outage of access to issues and pull request related artifacts. After fully validating traffic recovery, we statused green for issues at 09:42 UTC.

The root cause of this incident was a planned change in our database infrastructure to minimize the impact of unsuccessful deployments. As part of the progressive rollout of this change, we deleted nodes that were taking live traffic. When these nodes were deleted, there was an 11 minute window where requests to this database cluster failed. The incident was resolved when traffic automatically switched back to the existing nodes.

This planned rollout was a rare event. In order to avoid similar incidents, we have taken steps to review and improve our change management process. We are updating our monitoring and observability guidelines to check for traffic patterns prior to disruptive actions. Furthermore, we’re adding additional review steps for disruptive actions. We have also implemented a new checklist for change management for these types of infrequent administrative changes that will prompt the primary operator to document the change and associated risks along with mitigation strategies.

April 26 23:26 UTC (lasting 1 hour and 04 minutes)

On April 26 at 23:26 UTC, we were notified of an outage with GitHub Copilot. We resolved the incident at 00:29 UTC.

Due to the recency of this incident, we are still investigating the contributing factors and will provide a more detailed update in next month’s report.

April 27 08:59 UTC (lasting 57 minutes)

On April 26 at 08:59 UTC, we were notified of an outage with GitHub Packages. We resolved the incident at 09:56 UTC.

Due to the recency of this incident, we are still investigating the contributing factors and will provide a more detailed update in next month’s report.

April 28 12:26 UTC (lasting 19 minutes)

On April 28 at 12:26 UTC, we were notified of degraded availability for GitHub Codespaces. We resolved the incident at 12:45 UTC.

Due to the recency of this incident, we are still investigating the contributing factors and will provide a more detailed update in next month’s report.


Please follow our status page for real-time updates on status changes. To learn more about what we’re working on, check out the GitHub Engineering Blog.

Introducing Bob’s Used Books—a New, Real-World, .NET Sample Application

Post Syndicated from Steve Roberts original https://aws.amazon.com/blogs/aws/introducing-bobs-used-books-a-new-real-world-net-sample-application/

Today, I’m happy to announce that a new open-source sample application, a fictitious used books eCommerce store we call Bob’s Used Books, is available for .NET developers working with AWS. The .NET advocacy and development teams at AWS talk to customers regularly and, during those conversations, often receive requests for more in-depth samples. Customers tell us that, while small code snippets serve well to illustrate the mechanics of an API, their development teams also need and want to make use of fuller, more real-world samples to understand better how to construct modern applications for the cloud. Today’s sample application release is in response to those requests.

Bob’s Used Books is a sample eCommerce application built using ASP.NET Core version 6 and represents an initial modernization of a typical on-premises custom application. Representing a first stage of modernization, the application uses modern cross-platform .NET, enabling it to run on both Windows and Linux systems in the cloud. It’s typical of what many .NET developers are just now going through, porting their own applications from .NET Framework to .NET using freely available tools from AWS such as the Toolkit for .NET Refactoring and the Porting Assistant for .NET.

Bob's Used Books sample application homepage

Sample application features
Customers of our fictional bookstore can browse and search on the store for used books and view details on selected books such as price, condition, genre, and more:

Bob's Used Books sample application search results page, which shows 8 books and their prices.


Bob's Used Books sample application book details page

Just like a real e-commerce store, customers can add books to a shopping cart, pending subsequent checkout, or to a personal wish list. When the time comes to purchase, the customer can start the checkout process, which will encourage them to sign in if they are an existing customer or sign up during the process.

Bob's Used Books sample application checkout page

In this sample application, the bookstore’s staff uses the same web application to manage inventory and customer orders. Role-based authentication is used to determine whether it’s a staff member signing in, in which case they can view an administrative portal, or a regular store customer. For staff, having accessed the admin portal, they start with a dashboard view that summarizes pending, in-process, or completed orders and the state of the store’s inventory:

Bob's Used Books sample application staff dashboard page

Staff can edit inventory to add new books, complete with cover images, or adjust stock levels. From the same dashboard, staff can also view and process pending orders.

Bob's Used Books sample application staff order processing page

Not shown here, but something I think is pretty cool, is a simulated workflow where customers can re-sell their books through the store. This involves the customer submitting an application, the store admin evaluating and deciding whether to purchase from the customer, the customer “posting” the book to the store if accepted, and finally the admin adding the book into inventory and reimbursing the customer. Remember, this is all fictional, however—no actual financial transactions take place!

Application architecture
The bookstore sample didn’t start as a .NET Framework-based application that needed porting to .NET, but it does use a monolithic MVC (model-view-controller) application design, typical of the .NET Framework development era (and still in use today). It also uses a single Microsoft SQL Server database to contain inventory, shopping cart, user data, and more.

Bob's Used Books sample application outline architecture

When fully deployed to AWS, the application makes use of several services. These provide resources to host the application, provide configuration to the running application, and also provide useful functionality to the running code, such as image verification:

  • Amazon Cognito – used for customer and bookstore staff authentication. The application uses Cognito‘s Hosted UI to provide sign-in and sign-up functionality.
  • Amazon Relational Database Service (RDS) – manages a single Microsoft SQL Server Express instance containing inventory, customer, and other typical data for an e-commerce application.
  • Amazon Simple Storage Service (Amazon S3) – an S3 bucket is used to store cover images for books.
  • AWS Systems Manager Parameter Store – contains runtime configuration data, including the name of the S3 bucket for cover images, and Cognito user pool details.
  • AWS Secrets Manager – holds the user and password details for the underlying SQL Server database in RDS.
  • Amazon CloudFront – provides a domain for accessing the cover images in the S3 bucket, which means the bucket does not need to be publicly available.
  • Amazon Rekognition – used to verify that cover images uploaded for a book do not contain objectionable content.

The application is a starting point to showcase further modernization opportunities in the future, such as adopting purpose-built databases instead of using a single relational database, decomposing the monolith to use microservices (for the latter, AWS provides the Microservice Extractor for .NET), and more. The .NET development, advocacy, and solution architect teams here at AWS are quite excited at the opportunities for new content, using this sample, to illustrate those modernization opportunities in the upcoming months. And, as the sample is open-source, we’re also interested to see where the .NET development community takes it regarding modernization.

Running the application
My colleague Brad Webber, a Solutions Architect at AWS, has written the first in a series of technical blog posts we’ll be publishing about the sample. You’ll find these on the new .NET on AWS blog channel. In his first post, you’ll learn more about how to run or debug the application on your own machine as well as deploy it completely to the AWS cloud.

The application uses SQL Server Express localdb instance for its database needs when running outside the cloud, which means you do currently need to be using a Windows machine to run or debug. Launch profiles, accessible from Visual Studio, Visual Studio Code, or JetBrains Rider (all on Windows), are used to select how the application runs (for example, with no or some cloud resources):

  • Local – When you select this launch profile, the application runs completely on your machine, using no cloud resources, and doesn’t need an AWS account. This enables you to investigate and experiment with the code incurring no charges for cloud resources.
  • Integrated – When you use this profile, the application still runs locally on your Windows machine and continues to use the localdb database instance, but now also uses some AWS resources, such as an S3 bucket, Rekognition, Cognito, and others. This profile enables you to learn how you can use AWS services within your application code, using the AWS SDK for .NET and various extension libraries that we distribute on NuGet (for a full list of all available libraries you can use when developing your applications, see the .NET on AWS repository on GitHub). To enable you to set up the cloud resources needed by the application when using this profile, an AWS Cloud Development Kit (AWS CDK) project is provided in the sample repository, making it easy to set up and tear down those resources on demand.

Deploying the Sample to AWS
You can also deploy the entire application to the AWS Cloud, in this case, to virtual machines in Amazon Elastic Compute Cloud (Amazon EC2) with a SQL Server Express database instance in Amazon Relational Database Service (RDS). The deployment uses resources compatible with the AWS Free Tier but do note, however, that you may still incur charges if you exceed the Free Tier limits. Unlike running the application on your own machine, which requires Windows because of the localdb dependency, you can deploy the application to AWS from any machine, including those running macOS and Linux. Once again, a CDK project is included in the repository to get you started, and Brad’s blog post goes into more detail on these steps so I won’t repeat them here.

Using virtual machines in the cloud is often a first step in modernizing on-premises applications because of similarity with an on-premises server setup, hence the reason for supporting Amazon EC2 deployments out-of-the-box. In the future, we’ll be adding content showing how to deploy the application to container services on AWS, such as AWS App Runner, Amazon Elastic Container Service (Amazon ECS), and Amazon Elastic Kubernetes Service (EKS).

Next steps
The Bob’s Used Books sample application is available now on GitHub. We encourage you, if you’re a .NET developer working on AWS and looking for a deeper, more real-world sample, to clone the repository and take the application for a spin. We’re also curious about what modernization journeys you would decide to take with the application, which will help us create future content for the sample. Let us know in the issues section of the repository. And if you want to contribute to the sample, we welcome contributions!

Amazon OpenSearch Service now supports 99.99% availability using Multi-AZ with Standby

Post Syndicated from Prashant Agrawal original https://aws.amazon.com/blogs/big-data/amazon-opensearch-service-now-supports-99-99-availability-using-multi-az-with-standby/

Customers use Amazon OpenSearch Service for mission-critical applications and monitoring. But what happens when OpenSearch Service itself is unavailable? If your ecommerce search is down, for example, you’re losing revenue. If you’re monitoring your application with OpenSearch Service, and it becomes unavailable, your ability to detect, diagnose, and repair issues with your application is diminished. In these cases, you may suffer lost revenue, customer dissatisfaction, reduced productivity, or even damage to your organization’s reputation.

OpenSearch Service offers an SLA of three 9s (99.9%) availability when following best practices. However, following those practices is complicated, and can require knowledge of and experience with OpenSearch’s data deployment and management, along with an understanding of how OpenSearch Service interacts with AWS Availability Zones and networking, distributed systems, OpenSearch’s self-healing capabilities, and its recovery methods. Furthermore, when an issue arises, such as a node becoming unresponsive, OpenSearch Service recovers by recreating the missing shards (data), causing a potentially large movement of data in the domain. This data movement increases resource usage on the cluster, which can impact performance. If the cluster is not sized properly, it can experience degraded availability, which defeats the purpose of provisioning the cluster across three Availability Zones.

Today, AWS is announcing the new deployment option Multi-AZ with Standby for OpenSearch Service, which helps you offload some of that heavy lifting in terms of high frequency monitoring, fast failure detection, and quick recovery from failure, and keeps your domains available and performant even in the event of an infrastructure failure. With Multi-AZ with Standby, you get 99.99% availability with consistent performance for a domain.

In this post, we discuss the benefits of this new option and how to configure your OpenSearch cluster with Multi-AZ with Standby.

Solution overview

The OpenSearch Service team has incorporated years of experience running tens of thousands of domains for our customers into the Multi-AZ with Standby feature. When you adopt Multi-AZ with Standby, OpenSearch Service creates a cluster across three Availability Zones, with each Availability Zone containing a complete copy of data in the cluster. OpenSearch Service then puts one Availability Zone into standby mode, routing all queries to the other two Availability Zones. When it detects a hardware-related failure, OpenSearch Service promotes nodes from the standby pool to become active in less than a minute. When you use Multi-AZ with Standby, OpenSearch Service doesn’t need to redistribute or recreate data from missing nodes. As a result, cluster performance is unaffected, removing the risk of degraded availability.

Prerequisites

Multi-AZ with Standby requires the following prerequisites:

  • The domain needs to run on OpenSearch 1.3 or above
  • The domain is deployed across three Availability Zones
  • The domain has three (or a multiple of three) data notes
  • You must use three dedicated cluster manager (master) nodes

Refer to Sizing Amazon OpenSearch Service domains for guidance on sizing your domain and dedicated cluster manager nodes.

Configure your OpenSearch cluster using Multi-AZ with Standby

You can use Multi-AZ with Standby when you create a new domain, or you can add it to an existing domain. If you’re creating a new domain using the AWS Management Console, you can create it with Multi-AZ with Standby by either selecting the new Easy create option or the traditional Standard create option. You can update existing domains to use Multi-AZ with Standby by editing their domain configuration.

The Easy create option, as the name suggests, makes creating a domain easier by defaulting to best practice choices for most of the configuration (the majority of which can be altered later). The domain will be set up for high availability from the start and deployed as Multi-AZ with Standby.

While choosing the data nodes, you should choose three (or a multiple of three) data nodes so that they are equally distributed across each of the Availability Zones. The Data nodes table on the OpenSearch Service console provides a visual representation of the data notes, showing that one of the Availability Zones will be put on standby.

Similarly, while selecting the cluster manager (master) node, consider the number of data nodes, indexes, and shards that you plan to have before deciding the instance size.

After the domain is created, you can check its deployment type on the OpenSearch Service console under Cluster configuration, as shown in the following screenshot.

While creating an index, make sure that the number of copies (primary and replica) are multiples of three. If you don’t specify the number of replicas, the service will default to two. This is important so that there is at least one copy of the data in each Availability Zone. We recommend using an index template or similar for logs workloads.

OpenSearch Service distributes the nodes and data copies equally across the three Availability Zones. During normal operations, the standby nodes don’t receive any search requests. The two active Availability Zones respond to all the search requests. However, data is replicated to these standby nodes to ensure you have a full copy of the data in each Availability Zone at all times.

Response to infrastructure failure events

OpenSearch Service continuously monitors the domain for events like node failure, disk failure, or Availability Zone failure. In the event of an infrastructure failure like an Availability Zone failure, OpenSearch Services promotes the standby nodes to active while the impacted Availability Zone recovers. Impact (if any) is limited to the in-flight requests as traffic is weighed away from the impacted Availability Zone in less a minute.

You can check the status of the domain, data node metrics for both active and standby, and Availability Zone rotation metrics on the Cluster health tab. The following screenshots show the cluster health and metrics for data nodes such as CPU utilization, JVM memory pressure, and storage.

The following screenshot of the AZ Rotation Metrics section (you can find this under Cluster health tab) shows the read and write status of the Availability Zones. OpenSearch Service rotates the standby Availability Zone every 30 minutes to ensure the system is running and ready to respond to events. Availability Zones responding to traffic have a read value of 1, and the standby Availability Zone has a value of 0.

Considerations

Several improvements and guardrails have been made for this feature that offer higher availability and maintain performance. Some static limits have been applied that are specifically related to the number of shards per node, number of shards for a domain, and the size of a shard. OpenSearch Service also enables Auto-Tune by default. Multi-AZ with Standby restricts the storage to GP3- or SSD-backed instances for the most cost-effective and performant storage options. Additionally, we’re introducing an advanced traffic shaping mechanism that will detect rogue queries, which further enhances the reliability of the domain.

We recommend evaluating your domain infrastructure needs based on your workload to achieve high availability and performance.

Conclusion

Multi-AZ with Standby is now available on OpenSearch Service in all AWS Regions globally where OpenSearch service is available, except US West (N. California), and AWS GovCloud (US-Gov-East, US-Gov-West). Try it out and send your feedback to AWS re:Post for Amazon OpenSearch Service or through your usual AWS support contacts.


About the authors

Prashant Agrawal is a Sr. Search Specialist Solutions Architect with Amazon OpenSearch Service. He works closely with customers to help them migrate their workloads to the cloud and helps existing customers fine-tune their clusters to achieve better performance and save on cost. Before joining AWS, he helped various customers use OpenSearch and Elasticsearch for their search and log analytics use cases. When not working, you can find him traveling and exploring new places. In short, he likes doing Eat → Travel → Repeat.

Rohin Bhargava is a Sr. Product Manager with the Amazon OpenSearch Service team. His passion at AWS is to help customers find the correct mix of AWS services to achieve success for their business goals.

The collective thoughts of the interwebz