Post Syndicated from xkcd.com original https://xkcd.com/3126/

Post Syndicated from xkcd.com original https://xkcd.com/3126/
Post Syndicated from Aakash Bhattacharya original https://aws.amazon.com/blogs/compute/understanding-and-remediating-cold-starts-an-aws-lambda-perspective/
Cold starts are an important consideration when building applications on serverless platforms. In AWS Lambda, they refer to the initialization steps that occur when a function is invoked after a period of inactivity or during rapid scale-up. While typically brief and infrequent, cold starts can introduce additional latency, making it essential to understand them, especially when optimizing performance in responsive and latency-sensitive workloads.
In this article, you’ll gain a deeper understanding of what cold starts are, how they may affect your application’s performance, and how you can design your workloads to reduce or eliminate their impact. With the right strategies and tools provided by AWS, you can efficiently manage cold starts and deliver consistent, low-latency experience for your users.
Cold starts occur because serverless platforms like AWS Lambda are designed for cost-efficiency – you don’t pay for compute resources when your code isn’t running. As a result, Lambda only provisions resources when needed. A cold start happens when there isn’t an existing execution environment available and a new one must be created. This can happen, for example, when a function is invoked for the first time after a period of inactivity or during a burst in traffic that triggers scale-up.
When this occurs, Lambda rapidly provisions and initializes a new execution environment for running your function code. This initialization adds a small amount of latency to the request, but it only occurs once for the lifecycle of that execution environment.
Cold starts consist of several steps that make up the Initialization Phase, which occurs before the function begins running. These steps take place when the Lambda service creates a new execution environment, contributing to the latency commonly referred to as the INIT duration of the function, as illustrated in a following diagram:
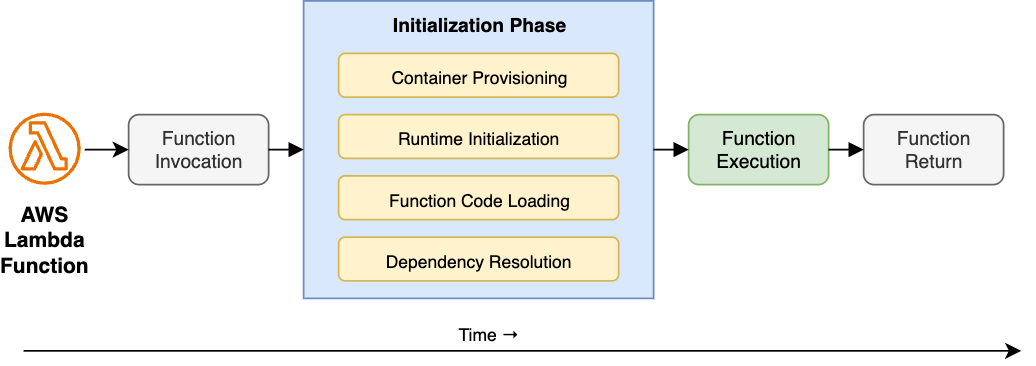
Figure 1: Lambda Function Execution Lifecycle: Cold Start Components
While cold starts typically affect less than 1% of requests, they can introduce performance variability in workloads where Lambda needs to create new execution environments more frequently, such as after periods of inactivity or during rapid scaling. This variability can impact perceived response times, especially in latency-sensitive applications such as user-facing APIs.
Cold starts are a natural aspect of the serverless computing model due to its core design principles:
The following sections explore factors contributing to cold starts, and optimization techniques to initialize your functions faster.
Lambda supports multiple programming languages through runtimes, including the ability to create custom runtimes. A runtime handles core responsibilities such as relaying invocation events, context, and responses between the Lambda service and your function code. The time it takes to initialize a runtime can vary depending on the language. Interpreted languages, such as Python and Node.js, typically initialize faster, while compiled languages like Java or .NET may take longer due to additional startup steps such as loading classes. Custom, or OS-only runtimes commonly provide fastest cold start performance as they typically run compiled binaries on the underlying Linux environment.
Runtimes are regularly maintained and updated by AWS, with newer versions typically offering improvements in performance, security, and startup latency. To take advantage of these enhancements, AWS recommends keeping your functions up to date with the latest supported runtimes.
AWS Lambda supports two packaging options for deploying your function code – ZIP archives and container images. Each approach offers unique advantages and may influence cold start latency depending on how it’s used.
For ZIP-based deployments, you can upload your function code directly (up to 50MB) or via Amazon Simple Storage Service (Amazon S3) (up to 250MB unzipped). To promote reusability, Lambda also supports Lambda layers, allowing you to share common code, libraries, or runtime dependencies across multiple functions. However, larger packages can impact cold start latency due to factors such as increased S3 download time, ZIP extraction overhead, layer mounting and initialization. The size and number of dependencies directly affects initialization time – each added dependency increases the deployment artifact size, which Lambda must download, unpack, and initialize during the INIT phase.
To optimize cold start performance, keep your deployment ZIP packages small, remove unused dependencies with techniques like tree shaking, prioritize lightweight libraries, exclude unnecessary files like tests or docs, and structure your layers efficiently.
When using container-based deployments, you push your function image to Amazon Elastic Container Registry (Amazon ECR) first. This option provides greater flexibility and control over the runtime environment, especially useful when your function code exceeds 250MB or when you require specific language version or system libraries not included in the AWS-managed runtimes. While container images allow for highly customized deployments, pulling large images from ECR might contribute to cold start latency. Similar to ZIP-based approach, make sure to keep your image sizes minimal by removing unnecessary artifacts.
Memory allocation plays a key role in both the performance and cost of your Lambda functions. When you assign more memory to a function, Lambda also allocates more CPU power, which can help reduce the time it takes to initialize and run your code – often improving cold start performance.
Use the AWS Lambda Power Tuning tool to balance performance benefits with added cost of allocating more memory. This tool runs your function with different memory settings and analyzes the trade-offs between speed and cost. This makes it easier to find the most cost-effective configuration for your workload.
By default, your Lambda functions are connected to the public internet, however you can attach them to your own Amazon Virtual Private Cloud (Amazon VPC) instead, for example when your functions need to access VPC-hosted resources such as databases. When this happens, the Lambda service creates an Elastic Network Interface (ENI) to attach your functions to. This process involves multiple steps, such as creation of network interfaces, subnets, security groups, route table and so on. While Lambda service tries to minimize added latency, applying this configuration might introduce additional latency, therefore you should only use it when access to VPC resources is necessary.
Optimizing your function initialization code can help to reduce cold start latencies. Streamline your function code to load and prepare quickly, alongside its runtime environment and dependencies. Employ lightweight libraries and implement lazy loading for resources to further cut initialization time. Minimize code size by eliminating unnecessary dependencies. Consider your architecture carefully: break down large functions into smaller, more focused units based on invocation patterns. This approach allows for quicker initialization of individual components. These smaller, task-specific functions offer the added benefits of improved modularity, easier testing, and simpler maintenance. However, always strike a balance between function size and functionality to maintain overall system efficiency. By implementing these optimization strategies, you can substantially mitigate cold start impacts while preserving your application’s core functionality and performance.
Provisioned Concurrency addresses cold starts by pre-initializing function environments and keeping them “warm”, always ready to respond to incoming function invocations. By maintaining pre-initialized execution environments, Provisioned Concurrency delivers consistent performance for frequently invoked functions while eliminating throttling during peak loads. Provisioned Concurrency results in predictable performance for a function by providing consistent latency at some cost for reserved instances. Provisioned Concurrency is beneficial for high-traffic applications that requires consistent performance during heavy traffic and latency sensitive applications that requires fast responses for an interactive application, thereby reducing cold starts benefitting overall performance. The customer success story from Smartsheet demonstrates significant improvement in user experience with reduced latencies and better cost efficiency.
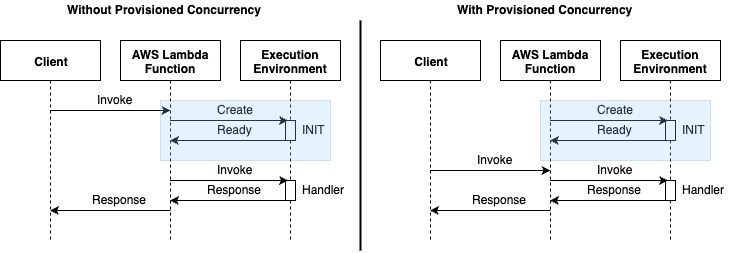
Figure 2: AWS Lambda execution flow comparison: standard vs. Provisioned Concurrency
Lambda SnapStart improves cold invoke latency by reducing the time it takes for a function to initialize and become ready to handle incoming requests. When SnapStart is enabled for a function, Lambda creates an encrypted snapshot of the initialized execution environment when you publish a new function version. This triggers an optimized INIT phase of the function where an immutable, encrypted snapshot of the memory and disk is taken. This snapshot is cached for reuse later. When a SnapStart-enabled function is invoked again, Lambda restores the execution environment from the cached snapshot instead of creating a new environment, thus moderating a cold invoke. SnapStart minimizes the invocation latency of a function, since creating a new execution environment no longer requires a dedicated INIT phase.
SnapStart is an efficient cold start solution, currently available for Java, Python, and .NET functions. It is particularly useful for functions with long initialization times. Inactive snapshots are automatically removed after 14 days without invocation. For detailed pricing information, check out our pricing page.
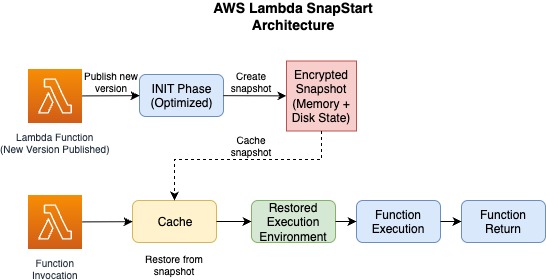
Figure 3: Lambda SnapStart architecture: optimizing cold starts through snapshot-based initialization
Use out-of-the-box observability facilities provided by AWS Lambda to investigate whether your functions or user experience are affected by cold starts and identify most impactful optimization areas. Monitoring Lambda cold start performance using built-in metrics such as INIT duration, invocation duration, and error rates is crucial for identifying bottlenecks and refining the function for optimal performance and cost-effectiveness. Use the following metrics:
In this post you’ve learned a detailed breakdown and insights about various aspects of Lambda cold starts, offering a comprehensive understanding of the challenges and solutions in this space. While cold starts commonly affect less than 1% of requests, understanding their nature and implementing appropriate remediation strategies early can help to minimizing their impact in the most latency-sensitive applications.
Post Syndicated from Patrick Kennedy original https://www.servethehome.com/cwwk-x86-p6-nas-review-an-intel-n355-m-2-ssd-mini-nas/
The CWWK X86-P6 NAS is a tiny, low-power, quiet, M.2 SSD NAS powered by the new Intel N150 or N355 processors
The post CWWK X86-P6 NAS Review an Intel N355 M.2 SSD Mini NAS appeared first on ServeTheHome.
Post Syndicated from Kari Rivas original https://www.backblaze.com/blog/the-essential-guide-to-disaster-recovery-building-resilience-for-your-enterprise/
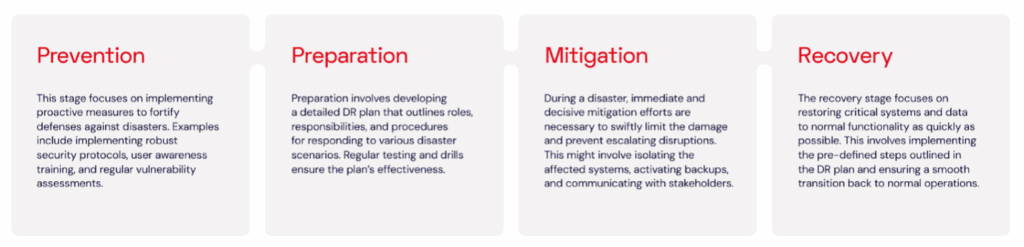
Disaster recovery (DR) is a top-line priority for enterprise organizations facing increasingly complex threats—sophisticated ransomware attacks, widespread cloud outages, and regulatory risks. The ability to recover quickly and maintain business continuity isn’t just a technical necessity—it’s a competitive imperative.
Today, I’m breaking down foundational strategies for enterprise DR readiness. You’ll find practical guidance on infrastructure design, site strategy, backup best practices, and more to help you take immediate action.
Our “Essential Guide to Disaster Recovery Planning” offers a comprehensive framework for designing a DR plan that protects your business across multiple threat vectors.

Many enterprises still rely on legacy storage technologies like tape, which create delays in restoration and introduce hardware failure risks. Shifting to cloud-first infrastructure reduces these vulnerabilities while unlocking scalability and location diversity. It also supports immutability features—critical for ransomware resilience—and simplifies compliance with evolving regulations.
Cloud platforms also unlock new options for data governance and sovereignty. Enterprises operating across regions or industries governed by strict data residency laws can configure cloud storage to maintain compliance while reducing operational overhead.
As enterprise backup and archive needs grow, it becomes vital to distinguish between long-term cold storage and actively accessible data. With clear infrastructure planning, organizations can streamline operations and ensure faster recovery without overspending on high-performance systems for archival workloads.
Object Lock is the feature in cloud platforms that enables immutability. With immutability, your data cannot be changed, deleted, or encrypted. This is the ultimate protection against ransomware.
Depending on your recovery time objective (RTO), different types of recovery sites offer different benefits:

Enterprises evaluating DR readiness should consider whether their current configuration meets their recovery time goals—and whether they’re optimizing for the right workloads. Comparing hot, warm, and cold site models can help strike the right balance between performance and budget.
Selecting a DR site is fundamental to your strategy. There are four main approaches to establishing a DR site: building your own, buying services from a co-location provider, buying public cloud storage, or leveraging a disaster recovery as a service (DRaaS) solution. Each approach offers distinct advantages and drawbacks.
Pros: It provides complete control over the DR environment, offering greater customization and security.
Cons: Significant upfront investment in hardware, software, and facility infrastructure and management. Requires ongoing maintenance and staffing costs. Limited scalability to accommodate future growth.
Pros: It offers a cost-effective alternative to building your own site. Co-location providers manage aspects of the physical infrastructure, reducing your IT team’s workload.
Cons: Less control over the environment compared to an on-premises solution. May require additional investment for network connectivity and configuration. Potential vendor lock-in with specific co-location providers.
Pros: Highly scalable and cost-effective. CSPs manage the physical infrastructure, reducing your IT team’s workload. Features like Object Lock help address security concerns versus on-premises storage.
Cons: Retrieving large volumes of data may be slow due to bandwidth constraints.
Pros: Highly scalable and cost-effective solution. Eliminates the need for upfront infrastructure investment. DRaaS providers manage the entire DR environment and provide technical support, freeing up your IT staff.
Cons: Reliance on a third-party provider for critical data and infrastructure. Potential concerns over network latency and vendor lock-in. Security considerations require a careful evaluation of the cloud provider’s practices.

Replication copies data in real-time, but that also means it can copy infected or corrupted data. Backups, on the other hand, offer point-in-time recoveries so you can restore data even after a ransomware attack.
This distinction between backups and replication is critical: If you only rely on replication, you could end up replicating the attack itself.
The optimal approach to DR depends on your specific needs.
Although built for high availability, SaaS apps don’t guarantee protection against data loss. Tools like Microsoft 365 and Google Workspace are built for uptime, not recovery. Misconfigurations, insider threats, and accidental deletions remain common risks. Enterprises should take control of their own retention policies with dedicated SaaS backup strategies, including regular point-in-time snapshots and recovery testing.
Additionally, planning for SaaS outages should include identifying local alternatives for core business functions. Can teams temporarily revert to offline workflows? Are key contacts available outside of email or Slack? Defining fallback protocols ensures that productivity doesn’t grind to a halt even if your primary tools go dark.
The incident response team (IRT) is the backbone of your DR response and is responsible for leading the recovery efforts during a disaster. Here’s a breakdown of possible key IRT roles:
A robust DR strategy starts with clearly defined objectives and priorities. These guide your approach and decision-making during a disaster recovery event. Your strategy should prioritize rapid recovery of critical systems and applications to minimize operational downtime and resume normal functions swiftly.
Prioritizing your critical business applications depends on a deep understanding of your business. Collaborate with internal partners to identify critical business applications that are essential for ongoing operations. Not all applications require immediate restoration. Prioritize systems based on their impact on core business functions.
A popular mantra for DR specialists is “Test the plan; don’t plan the test.” Your DR plans must be clearly documented as working recipes for application and data recovery, including dependencies and prerequisites. Document the recovery procedures for each critical application, outlining the steps required to bring them back online. This ensures your IT team can efficiently restore essential services during a disaster.
Compliance regulations might influence your DR priorities. Understand any industry-specific regulations or data privacy laws that might dictate specific data protection and recovery timeframes.
Working with internal partners to set RTOs and RPOs ensures alignment across the organization.
Stakeholders need to understand the realistic trade-offs involved in setting RTOs and RPOs, balancing the need for quick recovery with resource and cost limitations. Achieving extremely short RTOs, such as recovery within minutes, might require substantial investments in advanced infrastructure, redundant systems, and skilled personnel. Setting achievable RTOs and RPOs that effectively balance the need for swift recovery with the financial limitations of the organization requires open communication and collaboration.
It’s important to distinguish between data restoration and system recovery. Data restoration specifically involves retrieving data from backups. On the other hand, system recovery encompasses the comprehensive restoration of data, applications, configurations, and user accounts to fully restore system functionality.
Your RTOs should focus on the time it takes to bring an application to a usable state, not just the time to recover the data.
Employees might have unrealistic expectations regarding recovery times during a disaster. Educate the organization on the DR process and the inherent complexities involved.
Tracking your progress Key performance indicators (KPIs) are your guiding metric for measuring the effectiveness of your DR strategy. Here are some key DR-related KPIs to consider:
These KPIs provide valuable insights into your DR preparedness and help identify areas for improvement.
Recovery time objectives (RTOs) and recovery point objectives (RPOs) are the backbone of any DR plan. Yet many organizations set unrealistic targets without fully accounting for infrastructure, bandwidth, or cost constraints.
Establishing tiers of RTO and RPO based on data type or application criticality helps organizations avoid overengineering. Not every workload needs sub-hour recovery—archived legal files or marketing collateral may tolerate 24+ hour RTOs. Grouping systems into priority tiers ensures efficient use of budget and infrastructure while keeping SLAs aligned to business risk.
Improving these metrics often comes down to using the right storage architecture. By offloading backup workloads to cost-effective cloud storage with integrated immutability and replication, enterprises can improve RTO and RPO without the overhead of traditional DR environments.
A DR plan isn’t a one-time project—it’s a living process that should evolve with the business. Every test, every incident, and every infrastructure change is an opportunity to improve.
Strong DR programs rely on frequent validation, leadership alignment, role clarity, and avoiding common missteps. As IT leaders face new threats and shifting architectures, resiliency comes from readiness—not just recovery.
Even the most comprehensive DR plans can falter if they aren’t regularly validated. Testing ensures that backup data is restorable, that systems behave as expected under stress, and that team roles are clearly understood.
Testing also gives stakeholders across departments a shared language for discussing DR. Finance understands the cost implications of downtime, Legal sees the impact of non-compliance, and Security can stress-test assumptions about containment and escalation. When testing is multidisciplinary, recovery isn’t just possible—it’s predictable.
Organizations that incorporate routine DR drills and testing into their operations tend to recover faster and more confidently. Effective exercises can include walk-throughs, tabletop simulations, and full-scale failover tests. The goal isn’t just compliance—it’s ensuring the organization can execute when it matters most.
Budget uncertainty often limits the scope and effectiveness of DR plans. Legacy vendors may impose hidden fees for egress, API operations, or early deletion, making it difficult to forecast the total cost of a recovery event. Cloud-native solutions with transparent pricing models allow IT and finance teams to plan confidently.
Establishing a clear TCO framework—including hardware, licensing, testing, and human resources—can help justify DR investments and avoid budget shortfalls when they matter most. DR isn’t just insurance—it’s a measurable part of digital operational excellence.
Disaster recovery isn’t optional—it’s essential. With threats ranging from cyberattacks to cloud outages, every organization needs a plan that’s tested, documented, and designed for rapid recovery.
Backblaze B2 helps you implement affordable, scalable, and secure DR strategies with:
Download the full ebook, “The Essential Guide to Disaster Recovery Planning,” to get started on your journey to resilience.
The post The Essential Guide to Disaster Recovery: Building Resilience for Your Enterprise appeared first on Backblaze Blog | Cloud Storage & Cloud Backup
Post Syndicated from Crosstalk Solutions original https://www.youtube.com/watch?v=UsJ0MtV99XY
Post Syndicated from BeardedTinker original https://www.youtube.com/shorts/vqQhVyYOzKM
Post Syndicated from corbet original https://lwn.net/Articles/1032612/
By some appearances, at least, the kernel community has been relatively
insulated from the onslaught of AI-driven software-development tools.
There has not been a flood of vibe-coded memory-management patches — yet.
But kernel development is, in the end, software development, and these
tools threaten to change many aspects of how software development is done.
In a world where companies are actively pushing their developers to use
these tools, it is not surprising that the topic is increasingly prominent
in kernel circles as well. There are currently a number of ongoing
discussions about how tools based on large language models (LLMs) fit into
the kernel-development community.
Post Syndicated from daroc original https://lwn.net/Articles/1032808/
The release of Rust 1.89 has been
announced. Changes this time include
support for inferring the length of certain arrays, lint messages suggesting how to clarify potentially confusing uses of lifetime elision in function signatures, and improvements to the C ABI. The
full changelog is also available.
Post Syndicated from jake original https://lwn.net/Articles/1032861/
Security updates have been issued by AlmaLinux (glibc, kernel, libxml2, python-requests, and python-setuptools), Debian (chromium), Fedora (chromium, firefox, gdk-pixbuf2, iputils, libsoup3, libssh, perl, perl-Devel-Cover, perl-PAR-Packer, polymake, and poppler), Gentoo (Composer and Spreadsheet-ParseExcel), Oracle (glibc, kernel, libxml2, python-setuptools, sqlite, and virt:rhel and virt-devel:rhel), Red Hat (libxml2), SUSE (grub2, libarchive, libgcrypt, and python311), and Ubuntu (cifs-utils and poppler).
Post Syndicated from digiblur DIY original https://www.youtube.com/shorts/0zIO2sdvoZ0
Post Syndicated from Explosm.net original https://explosm.net/comics/thicker-than-water
New Cyanide and Happiness Comic
Post Syndicated from Cesar Caceres original https://blog.zabbix.com/when-generative-ai-meets-zabbix/30908/
Zabbix has been the backbone of my infrastructure for over ten years, a journey I’ve been on from version 3.2 to 7.4. It’s a robust and reliable tool. However, in the age of intelligent assistants, I posed a question to myself: Why can’t I interact with my monitoring system as naturally as I talk with Maria, my generative AI assistant?
Table of Contents
MCP (Model Context Protocol) is a universal protocol that helps generative AI systems interact with global data securely, reliably, and at scale.
Imagine this: It’s 3 AM, and you receive a critical alert on your phone. Instead of opening multiple dashboards and manually correlating data, you simply type: “What’s happening with the production server?”
You get a response like this:
“The web-prod-01 server is experiencing high memory usage (94%). This started 15 minutes ago, coinciding with a traffic spike. I recommend checking the database connection pool and considering a restart of the Apache service. Would you like me to show you the related logs?”
This is no longer science fiction!
The main objective is to enhance Zabbix without altering its core. The solution is based on an architecture that adheres to the following principles:
Proposed architecture:
We process Zabbix alerts through a webhook that sends the data to our generative AI service.
#!/usr/bin/env python3
# -*- coding: utf-8 -*-
import json
import requests
import sys
from datetime import datetime

def send_to_mcp(args):
""" Sends alerts to MCP server"""
# SETTINGS - EDIT ACCORDING TO YOUR ENVIRONMENT
mcp_endpoint = "http://TU_IP_MCP_SERVER:3001/alerts" # Change to the MCP server IP
mcp_token = "TU_MCP_AUTH_TOKEN" # Exchange for your MCP authentication token
zabbix_server_ip = "TU_IP_ZABBIX_SERVER" # Change to the Zabbix server IP

headers = {
'Content-Type': 'application/json',
'Authorization': f'Bearer {mcp_token}'
}

# Extracting arguments from the Zabbix webhook
eventid = args[0] if len(args) > 0 else "unknown"
severity = args[1] if len(args) > 1 else "0"
message = args[2] if len(args) > 2 else "No message"
host = args[3] if len(args) > 3 else "unknown"
value = args[4] if len(args) > 4 else ""

payload = {
"timestamp": datetime.now().isoformat(),
"source": "zabbix",
"eventid": eventid,
"severity": severity,
"message": message,
"host": host,
"value": value,
"zabbix_server": zabbix_server_ip
}

try:
print(f"Sending alert to MCP: {mcp_endpoint}")
print(f"Payload: {json.dumps(payload, indent=2)}")

response = requests.post(mcp_endpoint, json=payload, headers=headers, timeout=15)
response.raise_for_status()

print(f"Alert sent successfully: HTTP {response.status_code}")
print(f"Response: {response.text}")
return True

except requests.exceptions.Timeout:
print("? Error: Timeout connecting to MCP server", file=sys.stderr)
return False
except requests.exceptions.ConnectionError:
print("? Error: Cannot connect to MCP server", file=sys.stderr)
return False
except requests.exceptions.HTTPError as e:
print(f"? HTTP Error: {e}", file=sys.stderr)
print(f"Response: {response.text}", file=sys.stderr)
return False
except Exception as e:
print(f"? Unexpected error: {e}", file=sys.stderr)
return False

if __name__ == "__main__":
# The arguments come from Zabbix
args = sys.argv[1:]
print(f"Script called with args: {args}")

success = send_to_mcp(args)
sys.exit(0 if success else 1)
Scenario 1: Monday morning
Cesar: Good morning, how is the infrastructure looking?
Gemini CLI: Good morning! Everything is calm. 14 active hosts, 0 critical problems. There was a scheduled reboot on ‘proxmox-desarrollo’ over the weekend which completed successfully. The average CPU usage is at 23%. Do you need details on any specific system?
Scenario 2: Proactive planning
Cesar: What worrying trends are you seeing this week?
Gemini CLI: I’ve noticed three patterns that require attention:
1. storage-01: Growth of 2GB/day in /var/log.
2. mikrotik: Gradually increasing temperature (+3°C over the last 7 days).
3. base-datos-01: Slow queries increasing by 15%.
Server (Rocky Linux 9)
bash
#create the project
mkdir /opt/mcp-zabbix
cd /opt/mcp-zabbix

#Install dependencies
sudo dnf install -y nodejs npm redis nginx
sudo npm install -g pm2

#Set up the project
npm init -y
npm install express axios @google/generative-ai winston helmet cors dotenv
bash
#Environment variables
ZABBIX_URL=http://tu-zabbix-server/zabbix/api_jsonrpc.php
ZABBIX_API_TOKEN=tu_token_de_zabbix_aqui
GEMINI_API_KEY=tu_api_key_de_gemini
MCP_AUTH_TOKEN=genera_un_token_seguro
PORT=3001
1. Alerts → Media Types → Create
2. Script name: mcp_webhook.py
3. Parameters: {EVENT.ID} {EVENT.NSEVERITY} {ALERT.MESSAGE} {HOST.NAME} {ITEM.VALUE}
#Start the MCP server
pm2 start ecosystem.config.js

#Test curl
curl -H "Authorization: Bearer TU_TOKEN" \
-H "Content-Type: application/json" \
-d '{"prompt":"¿How many host fo I have?"}' \
http://localhost:3001/ask-zabbix
Dashboard conversations
Cesar: Show me a dashboard of the critical servers.
Gemini CLI: Creating custom dashboard with:
Generated dashboard: http://zabbix.local/dashboard/generated-123
Basic monitoring: Hosts, items, triggers
The goal is to develop an application that allows natural interaction with an AI assistant called “Maria.” The idea is that based on what’s happening, Maria suggests actions and executes them proactively.
To achieve this, the assistant will integrate with Gemini’s command-line interface (CLI) and establish an additional secure communication channel. The recommended architecture will consist of several servers capable of understanding each other, including a Zabbix Server, the MCP (Model Context Protocol), and the personal assistant.You can follow the development of the base integration in this repository.
Zabbix will continue to be the reliable engine we all know. The difference is that it now becomes more intuitive and conversational. The goal is not to replace human experience, but to empower it. AI will allow us to create solutions that were previously unthinkable.
To fully leverage this potential, it is essential that we, as experts, continue to train and deepen our knowledge of the tool. This way, we will not only depend on what the AI suggests, but we will be able to validate and authorize its actions with our own judgment.
The post When Generative AI Meets Zabbix appeared first on Zabbix Blog.
Post Syndicated from Bruce Schneier original https://www.schneier.com/blog/archives/2025/08/china-accuses-nvidia-of-putting-backdoors-into-their-chips.html
The government of China has accused Nvidia of inserting a backdoor into their H20 chips:
China’s cyber regulator on Thursday said it had held a meeting with Nvidia over what it called “serious security issues” with the company’s artificial intelligence chips. It said US AI experts had “revealed that Nvidia’s computing chips have location tracking and can remotely shut down the technology.”
Post Syndicated from The Atlantic original https://www.youtube.com/watch?v=HeMIjpcStFg
Post Syndicated from corbet original https://lwn.net/Articles/1032016/
Inside this week’s LWN.net Weekly Edition:
Post Syndicated from The History Guy: History Deserves to Be Remembered original https://www.youtube.com/shorts/dVn8K1ahFhg
Post Syndicated from Боян Юруков original https://yurukov.net/blog/2025/jeliazkov-laje/
На 1-ви август публикувах поредния текст от сагата с държавните имоти за разпродажба. В него освен всичко друго описах как списъкът с над 4400 имоти обсъждани и готвени за продажба от кабинета на Желязков е изчезнал от сайта на МРРБ, както и че обявени търгове изчезват от публичния регистър. Списъкът остава единствено наличен в оригиналната статия, с която разкрих него и картата, която го направи истински използваем.
Този текст остана сравнително незабелязан до 4-ти август, когато по покана на радио Хоризонт описах проблемите с хаоса и липсата на прозрачност в този процес. Същия ден Клуб Z са искали коментар от Министерството на регионалното развитие и благоустройството, които им отговарят с прессъобщение. В него потвърждават, че списъкът е свален от сайта, но това било за да се внесат корекции от институциите, както и че местната власт е проявила интерес към имотите и искала да ѝ се предоставят. Повечето от въпросните искания всъщност текат от години без развитие, но все още няма отговор как тези имоти са попаднали в списъка. МРРБ също отричат да има активни търгове за имоти от списъка. За последното Клуб Z цитират пресконференция на Спаси София, които от своя страна изглежда визират отново моята статия и карта свързваща търгове с имоти.
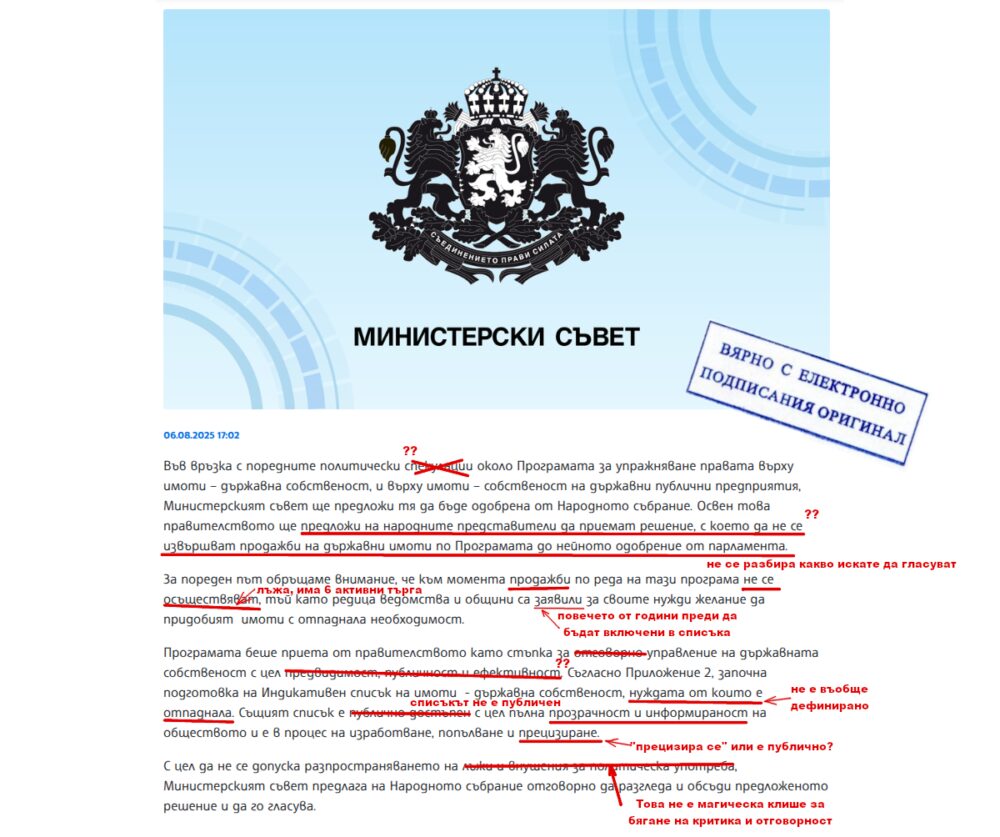
В следващите дни множество медии писаха за казуса и особено се възроди темата за амфитеатъра в София, който дадох като пример разкривайки данните за продажбите в края на юни. Имаше още няколко подписки и множество сигнали към платформата Uchastvai.bg. Вчера към 17 часа Министерски съвет пусна ново прес-съобщение, което хем доразвива, хем си противоречи с казаното от МРРБ.
…Съгласно Приложение 2, започна подготовка на Индикативен списък на имоти – държавна собственост, нуждата от които е отпаднала. Същият списък е публично достъпен с цел пълна прозрачност и информираност на обществото и е в процес на изработване, попълване и прецизиране.
В него Желязков твърди, че по темата има политически спекулации, лъжи и внушения. Доколкото може би си е негова лична интерпретация, това клише не може да е извинение за бягане от критика и отговорност. Противоречи си обаче като твърди, че списъкът е публичен – към момента на пускане на прес-съобщението, както и до края на деня то все още липсва от страницата на МРРБ и не е налично към документите в решенията на МС. Оригиналът е архивиран единствено на статията, с която започнах темата. Паралелно с това повтаря думите на МРРБ, че списъкът се „прецизира“, та не става ясно дали Желязков сам е сигурен дали нещо е публично или не. Разбиранията ни за прозрачност видимо се разминават.
За пореден път обръщаме внимание, че към момента продажби по реда на тази програма не се осъществяват, тъй като редица ведомства и общини са заявили за своите нужди желание да придобият имоти с отпаднала необходимост.
Ако разглеждаме строго семантично горното твърдение, то е формално вярно заради две ключови фрази: „към момента“ и „по реда на тази програма“. Ако вземем твърдението му в цялостта си обаче е очевидна лъжа.
В точния момент на публикуването на съобщението няма активни търгове на страницата на АППК. Но само формално. Търговете обикновено траят няколко часа, в които има „продажба“. Семантично е прав, че в 17:00 на 6-ти август няма активна продажба. Ще има обаче в 11:00 на 7-ми август за апартамент в Обзор (търг 1013). Ще тече вероятно докато четете тази статия. Ще има още един на 8-ми август пак от 11:00 за парцел и сграда в с. Голям Желязна, Ловеч. Последният, впрочем, е именно част от списъка на Желязков с 4400-те – имот номер 4205, търг номер 1017. Т.е. ще има продажба от „списъка“ 42 часа след твърдението на Желязков, но не „към момента“.
Интересен момент е, че доста медии съобщиха, че „кабинетът спира продажбите“. Не това се казва в прес-съобщението. Не прави заявка, че ще спира нещо или че няма да продава, а че иска депутатите да решат дали да го спрат. Дневник го описват добре.
Тук обаче идва втората семантична гимнастика – „по реда на тази програма“. Всъщност, заедно със споменатия горе имот има общо шест от списъка скрит от Желязков, които имат активни търгове: този в с. Голям Желязна, Ловеч; в Тръстеник (търг 1018); в Габрово (търг 1009); два в Стара Загора (1015 и 1016) и в Свиленград (търг 1001). Както писах миналата седмица, има още пет търга, които бяха заличени противно на досегашната практика. Вероятно същата съдба очаква и тези. С горната фраза обаче Желязков може да се оправдае, че тези заедно с останалите 22 активни търга са всъщност „по друг ред“. От тях два са публикувани в деня на прес-съобщението на Желязков, три – предходния ден, 10 в деня преди статията ми обявяваща изтритите търгове, а останалите – след първата ми статия, когато се клеха, че ще продават едва след подробен анализ.
Впрочем, до ден днешен няма отговор какво всъщност значи „отпаднала необходимост“ или публикувани анализи или части от тях за който и да е от 4400-те имота. Знаем обаче, че вече има продадени имоти от митичния индикативен списък. Откривам поне 10 такива случая. Девет от тях са преди приемането на „плана“ в края на май. Един в Трявна е още през 2022-ра. Два – в Стара Загора и Плиска – са през 2024-та. Още шест са продадени с търгове между февруари и 7-ми май 2025-та. Един в Драгоево, Велики Преслав (търг 1010) е проведен успешно на 24-ти юли. По същото време Желязков отговаря на депутати от Да, България, че няма подробни анализи за отпаднала необходимост на имоти и настоява, че не се продават. Явно за този не е била нужна. Останалите продадени преди обявяването на списъка все пак намират място в него, което е поредния белег за хаоса в работата на кабинета и бързането по тази тема.
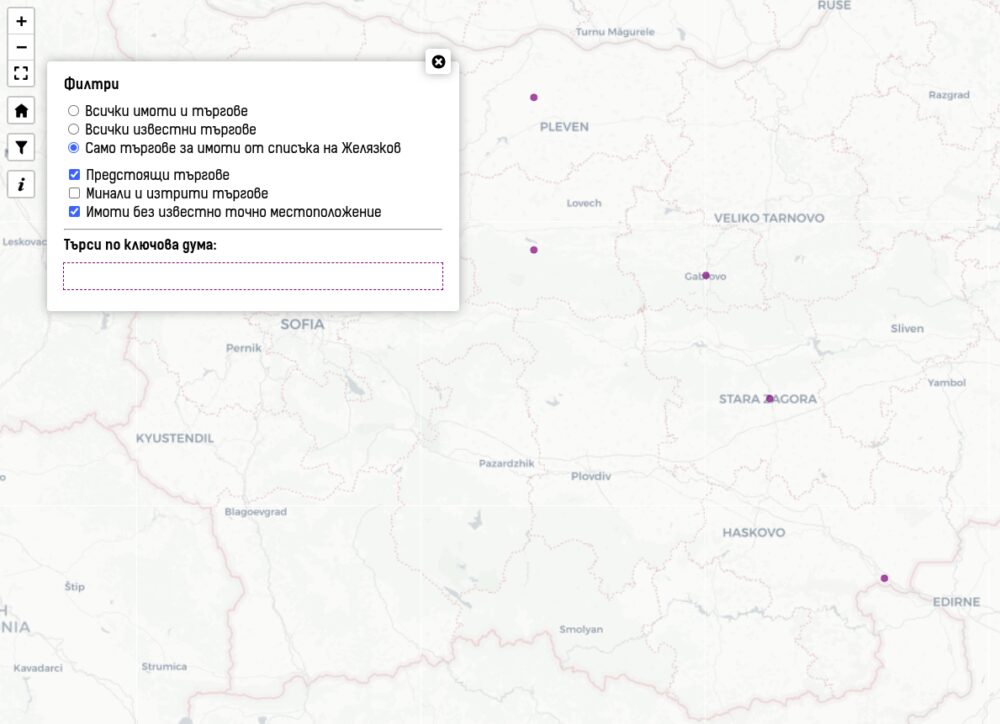
Знам, че в последната статия се зарекох да правя повече промени, а само да се допълват автоматично статуса на търговете. Обаче с последните изяви на Желязков се налага. Добавих два филтъра – предстоящи и „минали и изтрити“ търгове. Активни са само когато се избира опцията за известни или такива от списъка на Желязков. Филтрите не се взимат под внимание когато се търси по текст.

Тук виждате пример за всички предстоящи търгове на АППК. Поради естеството на автоматичното им обработване и хаоса в данните на МРРБ и АППК, на места ще видите, че се засича търг за продажба на апартамент в страда или имот споменат списъка на Желязков. Т.е. е възможно с търг да се продава съседен апартамент или офис сред 4400-те имота или направо там цялата сграда да се продава, а да виждаме търг за отделен апартамент.
Това не става ясно от прес-съобщението му. Докато не видим официалния документ внесен в парламента може само да гадаем. В деня на прес-съобщението му и заседание на кабинета липсва решение в публичното деловодство на кабинета и нямаше такава точка в дневния ред. Първо казва, че ще иска парламента да реши какво да се прави с този списък, но не предоставя оригиналния списък или ревизиран такъв. Ако не са го публикували още, значи още не е готов. Надали следва да предполагаме, че министър председателят би крил умишлено такава информация от публичността. При такава липса обаче депутатите няма да имат друг избор освен да се ориентират по моята карта.
Казва също, че ще иска депутатите да приемат решение, с което да му забранят да продава имотите докато пак депутатите не одобрят списъка. Тази формулировка е повече от странна. В същото време твърди, че не се провеждат такива продажби, което показах, че е лъжа за всеки здравомислещ човек. Едно обяснение би било, че сам не може да контролира собствените си действия или администрацията си и прехвърля несвойствена отговорност на парламента. Това би било логично само за нездравомислещ човек … или такъв добре запознат с нездравите зависимости в кабинета и новото начало в местния и публичен живот на държавата.
В същото време търговете си текат, обявите за продажба на друго имущество и отдаване на наем в АППК надвишават всичко, което администрацията е виждала до сега. Пряко на първоначалната ми похвала към Желязков, че все пак публикува нещо, видимо прозрачността и отчетността го уплаши и продължи както го води инстинкта. Аз пък мога само да ви призова да подавате сигнали, за да научим повече какво се случва по места и да искаме отговори.
Целият шум около тези имоти обаче сякаш помогнаха на доста национални медии да замълчат изцяло или да премълчат ключови детайли и имена по други теми. Например новата „Лафка“ на Пеевски под формата на държавни магазини; как близък кадър на Пеевски е начело на КЗК и как иска да я закрие вливайки я в другата му бухалка ДАНС; как немските медии отразиха завземането на властта от Пеевски; как Таки ще има достъп до целия трафик на България и ще може да следи всички коли, включително НСО и дипломати и множество други скандални решения на кабинета и парламента преди ваканцията им.
Вие забелязахте ли ги?
The post Спирал ли е Желязков продажбите и какво въобще ще гласуват депутатите? first appeared on Блогът на Юруков.
Post Syndicated from Satya S Tripathy original https://aws.amazon.com/blogs/messaging-and-targeting/improve-email-deliverability-with-tenant-management-in-amazon-ses/
Amazon Simple Email Service (Amazon SES) serves diverse industries—from ecommerce services to financial institutions to marketing technology product providers—helping organizations manage their email communication needs. Many businesses face the challenge of sending emails not just for themselves, but on behalf of their downstream customers or across various business divisions. These scenarios, commonly known as multi-tenant email sending practices, require careful architectural consideration. For example, a marketing service might need to send promotional emails for hundreds of retail clients, or an enterprise IT team might manage email communications across multiple business units (BUs). These clients and BUs are also identified as tenants. To successfully implement multi-tenancy in Amazon SES, customers usually develop an architecture pattern within Amazon SES that accomplishes critical objectives to efficiently handle the email sending needs of thousands of downstream tenants while maintaining isolated email sending reputations for each tenant. This isolation is crucial for protecting each customer’s deliverability metrics and to prevent issues with one tenant from impacting others.
Amazon SES customers can achieve multi-tenancy through isolated configuration sets for sending emails, but traditionally, reputation management and enforcement occur at the account level. To address this, Amazon SES now offers tenant management capabilities that enable tenant isolation and reputation management at the individual tenant level. This new feature provides greater control and flexibility for organizations managing multiple tenants within a single Amazon SES account, allowing each tenant to maintain its own sending reputation independently.
In this post, you will learn about the newly released tenant management feature that helps customers manage individual tenant onboardings and manage their reputations in isolation. This feature helps organizations create and manage up to 10,000 isolated tenants within a single AWS account (which can be increased 300,000 on explicit request), each with independent configurations and reputation metrics. You will discover how these capabilities maintain email deliverability through automated tenant-level controls, real-time monitoring, and customizable sending policies.
Whether you’re a service provider sending emails on behalf of multiple customers or an enterprise coordinating various BUs or lines of business (LOBs), this new feature offers sophisticated workflows to identify reputation-based findings and pause individual tenant sending to protect other tenants’ reputations. These enhancements are available globally across AWS Regions where Amazon SES is offered, representing a significant advancement in email deliverability management at scale.
Following use cases can easily achieved though Amazon SES tenant management feature.
Businesses rely on email as a critical communication channel. However, managing email operations for multiple tenants (customers or business units) has historically presented significant challenges such as:
The Amazon SES tenant management feature provides a comprehensive solution for organizations managing email sending at scale on behalf of their customers or LOBs (called tenants). This capability is particularly valuable for software as a service (SaaS) providers, email service providers, and enterprises managing email operations across multiple clients or departments while separating tenants from each other.
Through tenant management, organizations can effectively manage email streams and reputation independently and maintain oversight of their various email operations. This new functionality transforms how organizations use Amazon SES, enabling them to handle complex, multi-faceted email operations with greater control and visibility at the tenant level with the following key capabilities.
These features collectively represent an advancement in email management capabilities, so organizations can offer more sophisticated, scalable, and reliable email services to their clients or internal departments while maintaining strict control over reputation and compliance.
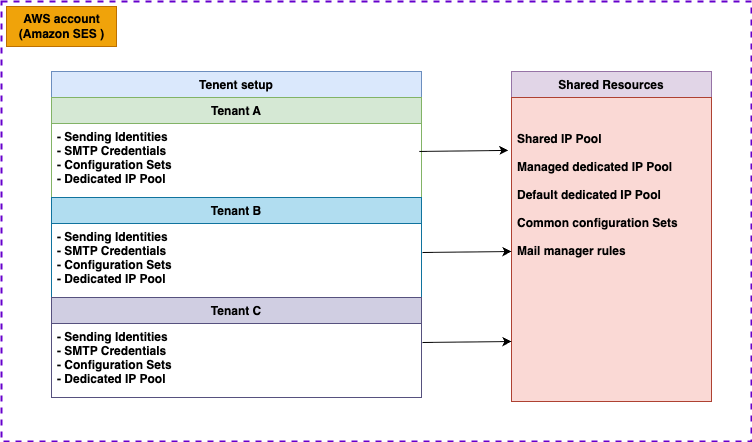
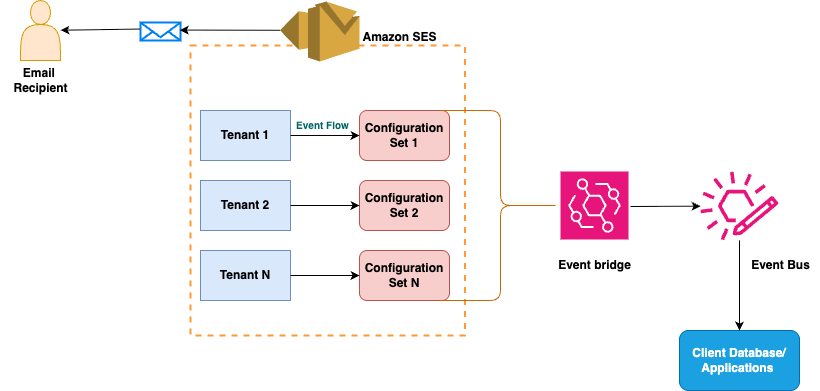
You can use the tenant management feature from Amazon SES to segment your email sending operations effectively. You can use the system to create multiple tenants within a single Amazon SES account, with each tenant having its own dedicated resources. These resources include essential components such as sending identities, SMTP credentials, configuration sets, and dedicated IP pools. What makes this architecture particularly flexible is the ability to share common resources across tenants, such as IP pools and configuration sets, enabling optimal resource utilization while maintaining operational separation. The following diagram illustrates the preceding information in detail.
To get started with tenant management, you need:
Setting up a multi-tenant system in Amazon SES requires careful configuration of three key components: IP pools, domain verification, and configuration sets. By following the set-up procedure, each tenant will have isolated resources, proper tracking, and monitoring capabilities. Using the AWS Management Console for Amazon SES or the Amazon SES APIs, you can create a robust email sending infrastructure that maintains high deliverability while keeping each tenant’s reputation separate.
IP pool configuration is a fundamental step to send email communications using Amazon SES. Begin your multi-tenant setup by establishing dedicated IP pools or managed IP pools for each customer though a configuration set. First, access the Amazon SES console and navigate to the Dedicated IP pools section. Create a new Standard dedicated IP pool, giving it a name that clearly identifies the customer. Through AWS Support, request the specific number of IP addresses needed based on your customer’s sending volume—typically one IP per 50,000 daily emails. After the IPs are provisioned, assign them to the appropriate pool. Then, map the IP pool with the configuration set mapped to the tenant. For IP warm-up, you have two options: enable the automatic warm-up schedule, which gradually increases sending volume over 45 days, or disable it to implement your own custom warm-up plan. Monitor the warm-up progress closely to help ensure optimal delivery rates.
After setting up the IP pool, proceed with domain verification to establish your customer’s sending identity. Navigate to the “verified Identities” (verified identities are the domains or email ids those you have already whitelisted with Amazon SES) section in the Amazon SES console and create a new domain identity using your customer’s domain name. Amazon SES will provide DKIM records that need to be added to the domain’s DNS settings. Work with your customer to implement these records correctly in their DNS configuration. The verification process typically takes 24–72 hours to complete. During this time, regularly check the verification status in the Amazon SES console to make sure the process completes successfully.
In addition to restricting email sending to specific identities and configurations, you can restrict email sending permissions by tenant using AWS Identity and Access Management (IAM) user or role policies. The following policy demonstrates these restrictions by allowing emails only when the tenant Amazon Resource Name (ARN) is arn:aws:ses:us-east-1:111122223333:tenant/testTenant1/tn-e08a68010000a3e4c67bcd990910, the identity is arn:aws:ses:us-east-1:111122223333:identity/example.com and the configuration-set is arn:aws:ses:us-east-1:111122223333:configuration-set/testTenant1.
The final step involves creating and configuring the configuration set, which manages tracking and monitoring. Start by creating a new configuration set under configuration set section in the Amazon SES console, naming it to match your customer’s identification. Configure the custom tracking domain and enable appropriate tracking settings for opens and clicks. Link this configuration to the previously created IP pool. Next, set up event destinations to monitor email performance—this can include Amazon CloudWatch metrics, Amazon Data Firehose, or Amazon Simple Notification Service (Amazon SNS) topics. In CloudWatch, create alarms for critical metrics such as bounce rates (recommended threshold: 5%) and complaint rates (recommended threshold: 0.1%). Set up notification systems to alert your team when these thresholds are breached, so you can quickly respond to any delivery issues.
To start using tenant management, you can use the console, AWS Command Line Interface (AWS CLI), or AWS SDKs. The following are basic examples of creating and configuring a tenant using the AWS CLI:
Following states a life cycle of the tenant management procedure starting from creating a tenant to deleting it in case you want to remove the tenant. Make sure that you are using AWS CLI version to 2.28.0 or later. See AWS CLI install and update instructions if necessary.
Create a new tenant
Assign a sending identity to the tenant (domain or email ID)
Add a configuration set to the tenant
The assumption here is that the selected configuration set already has an IP-Pool associated.
Get tenant information through get-tenants or list-tenants
You can use get-tenant or List-tenants to get information about a specific tenant, including the tenant’s name, ID, ARN, creation timestamp, tags, and sending status or list-tenants to list all tenants associated with your account
List resources of a tenant
Send email using tenant
To change the reputation policy from standard to strict (Standard policy is applied by default)
Disable sending for a tenant (to temporarily disable or pause a tenant)
Delete the tenant (remove the tenant completely from the Amazon SES account)
The X-SES-TENANT header is utilized by AWS to manage emails across multiple tenants. You can specify the tenant name by including it in the X-SES-TENANT field. This approach allows for better organization and routing of emails based on tenant information. To implement this, you can add the X-SES-TENANT header when sending emails using SMTP. The following Python code demonstrates how to include this header in your email sending process::
Receiving email events or using a feedback loop is important to monitor the email sending practices followed by the tenants. Tenant management provides reputation management capabilities for multi-tenant environments, so organizations can maintain granular control over email sending practices across their tenant base. You can automatically monitor and enforce reputation-based policies at the tenant level, so that problematic email sending behavior from one tenant doesn’t impact the deliverability of others. When reputation issues are detected, Amazon SES can automatically pause sending for the affected tenant while allowing other tenants to continue their email operations unimpeded.Organizations can now implement precise enforcement mechanisms through automated reputation findings that provide early detection of potential deliverability issues. Tenant isolation uses machine learning models and signal-based detection to identify problematic patterns in email sending behaviour. When issues are detected, Amazon SES automatically notifies the parent account and can trigger predetermined actions based on customizable thresholds. This granular control helps maintain strong deliverability rates across the entire email sending infrastructure while isolating and addressing issues at the tenant level.
Unlike other communication channels that are governed by a patchwork of national laws, bulk email delivery is subject to requirements dictated by a handful of large inbox providers. Google, Yahoo, Microsoft, and several others set deliverability targets, leaving compliance up to the sender or service providers such as Amazon SES. Amazon SES, in turn, expects its direct customers, including multi-tenant providers, to monitor key signals of enforcement. If any of the tenants send rogue emails, Amazon SES expects the AWS customer to monitor key enforcement signals and take appropriate actions such as pausing or stopping the rogue tenants. Signals for enforcement and trust indicators are essential components of our email reputation management system. These signals are various data points and behaviours we monitor to assess the trustworthiness of email senders. Trust indicators, derived from these signals, provide a measure of a sender’s reputation and adherence to best practices. Amazon SES uses a combination of pre-send signals (such as account vetting and configuration) and post-send signals (including delivery success rates, bounce rates, and recipient engagement) to calculate reputation findings. These findings then inform automated enforcement actions and manual reviews, helping to ensure that our service maintains high deliverability standards while protecting recipients from unwanted or malicious emails. By continuously refining our signal analysis and enforcement processes, we strive to create a reliable and secure email ecosystem for all users.
When managing multiple tenants sending email through your SES account, you’ll want to monitor sending behaviour and reputation. Amazon SES provides a comprehensive monitoring system through reputation findings, which alert you when tenants exhibit concerning sending patterns. These findings appear in your dashboard and are delivered as events through Amazon EventBridge default event bus, letting you know immediately when issues arise.
As an email deferability administrator, your daily monitoring routine needs to include reviewing the tenant management dashboard where you can see all your tenants’ status at a glance. Pay particular attention to any reputation findings, which come in two levels—low and high severity. These findings indicate when tenants exceed acceptable thresholds for metrics like bounce rates or complaint rates. You can configure reputation policies to automatically pause tenant sending when these thresholds are breached, with options for standard enforcement (pausing on high severity findings) or strict enforcement (pausing on low severity findings).
When a tenant is paused, either automatically or manually, you’ll need to investigate the cause. The reputation findings provide detailed information about what triggered the pause, such as elevated bounce rates or complaint rates. After addressing the underlying issues with the tenant, you can reinstate their sending capabilities. During reinstatement, the tenant can continue sending while you monitor their metrics to verify that they return to healthy levels. After their metrics improve, the tenant will automatically transition back to a normal enabled status.
These core reputation metrics are released by Amazon SES and can be routed to EventBridge. The event feedback loop will contain the tenant name and ID to enable tracking of tenant-specific bounce rates
For ongoing management, you have full control over tenant resources and configurations. You can assign or remove sending identities and configuration sets as needed, adjust reputation policies, and manually pause sending if you observe concerning patterns. By using this combination of automated monitoring, clear reputation signals, and flexible management tools, you can maintain control over your tenants while preventing individual tenant issues from affecting your overall account reputation. The key is to stay proactive in monitoring the dashboard and reputation findings, and to act quickly when issues arise.
We’re excited to see how our customers will use the tenant management feature to transform their email operations, boost efficiency, and create better experiences for their users. To get started with tenant isolation simply visit the Amazon SES console or see Tenants in the Amazon SES Developer Guide. You can find details about pricing on the Amazon SES pricing page. We’re committed to improving tenant isolation and management based on your feedback and needs, and we look forward to bringing you even more powerful and flexible email management capabilities in the future. Start exploring multi-tenant management today with Amazon SES.
Post Syndicated from jzb original https://lwn.net/Articles/1032753/
The AlmaLinux project has announced
the availability of packages to enable native NVIDIA driver support,
including CUDA and Secure Boot, for AlmaLinux 9 and 10.
When AlmaLinux started just 5 years ago, this wouldn’t have been
possible. With NVIDIA’s open source version of their graphics drivers
things have changed. This open source version is slowly becoming the
flagship driver, with new products being added exclusively to it. With
the help of some incredible people in the open source ecosystem and
the AlmaLinux community, we were able to do something that has yet to
be done in the EL ecosystem – ship Secure Boot signed, open source,
NVIDIA kernel modules.
Full documentation is available
on the AlmaLinux wiki.
Post Syndicated from Adam Duffield original https://aws.amazon.com/blogs/compute/improving-network-observability-with-new-aws-outposts-racks-network-metrics/
With AWS Outposts racks, you can extend AWS infrastructure, services, APIs, and tools to on-premises locations. Providing performant, stable, and resilient network connections to both the parent AWS Region as well as the local network is essential to maintaining uninterrupted service.
The release of two new Amazon CloudWatch metrics, VifConnectionStatus and VifBgpSessionState, gives you greater visibility into the operational status of the Outpost network connections. In this post, we discuss how to use these metrics to quickly identify network disruptions, using additional data points that can help reduce time to resolution.
When connecting an Outposts rack to your chosen data center location, network connections are made between the Outpost Networking Devices (ONDs) and Customer Network Devices (CNDs). These network connections support both the Service Link connectivity back to the chosen anchor Region and connectivity to the on-premises local network through the Local Gateway. First-generation Outposts racks include a minimum of two network devices to provide resilience, with second-generation Outposts racks including four network devices.
Virtual interfaces (VIFs) are used to establish IP network connectivity between the Outpost and CNDs, using Border Gateway Protocol (BGP) for dynamic routing. You can view the details for these VIFs on the Outposts console by choosing Link aggregation groups (LAGs) in the navigation pane and drilling down to find the specific service link and local gateway VIF information. For each connection between an OND and CND, two BGP sessions are established: one to support service link traffic and the other to support local gateway traffic.
The following diagram shows an example of this connectivity for a first-generation Outposts rack.
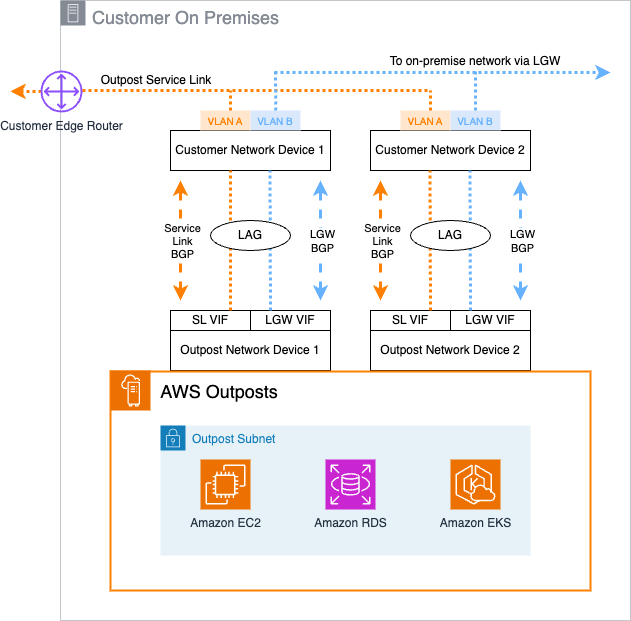
Figure 1: First-Generation Outposts Rack network connections
In this configuration, a total of four VIFs are configured into two link aggregation groups (LAGs): one on each OND for the service link and local gateway VIFs.
Observability into the operational status of Outposts rack, including the status and performance of network connectivity, is important for you to be able to quickly identify and investigate potential issues. With the addition of the VifConnectionStatus and VifBgpSessionState Outposts metrics in CloudWatch, you have greater visibility into the connection status of the Outposts rack to your CNDs. The VifConnectionStatus metric is provided on a per-VIF level, available for both the local gateway and service link VIFs. It provides an indication on the status of the VIF using two possible values:
The VifBgpSessionState metric goes deeper into the BGP connectivity status between each Outposts VIF and CND. A BGP session can be in one of multiple states, each providing insight into where a potential issue might be. To reflect this, the CloudWatch metric value shown relates to the following BGP states:
With these metrics now available in CloudWatch, you can configure Amazon CloudWatch alarms to alert when the metric values indicate potential issues. You can combine existing CloudWatch metrics for Outposts racks with these new metrics to give additional context and visibility into network connectivity status.
In the event of network connectivity issues, it’s important to understand how to use these metrics to assist with investigations and understand potential causes when seeing network impairment. To start with, the Configuration state of the VIFs should be checked. For each VIF, there are four possible states:
To check the state of an individual VIF on the Outposts console, choose Networking followed by Link aggregation groups (LAGS) in the navigation pane. The service link and local gateway VIFs associated with a specific LAG are shown, and when you choose a specific LAG, the configuration state of the associated VIFs are visible.
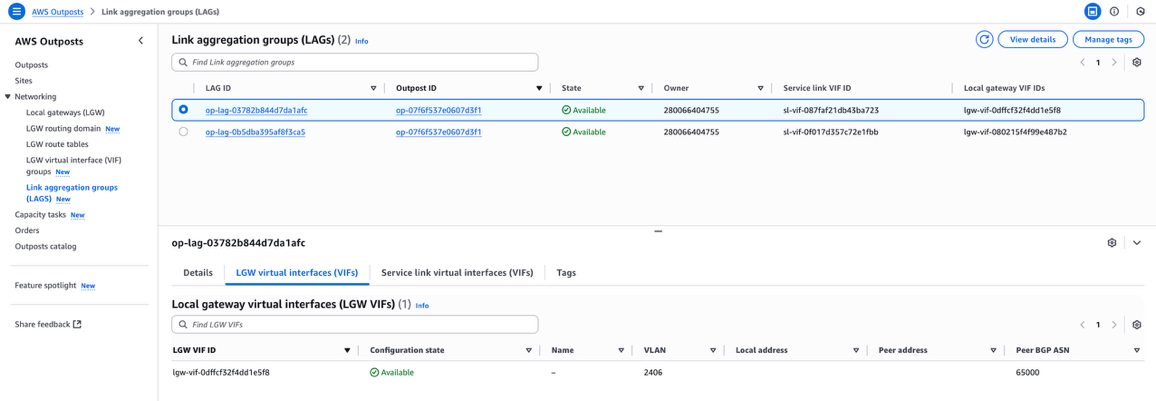
Figure 2: AWS Outposts console showing VIF configuration details
You can also retrieve these details programmatically. For example, use the following AWS Command Line Interface (AWS CLI) command to specifically check the configuration state of a service link VIF with ID sl-vif-087faf21db43ba723:
After confirming the Configuration state, you can use the VifConnectionStatus metric to determine the network connectivity status of individual VIFs. When operating and processing traffic in a healthy state, the value of this metric is 1. If this value changes to 0, it indicates a connectivity problem for that VIF between the Outpost and CNDs.
To further understand the potential cause of the VifConnectionStatus value, you can use the VifBgpSessionState metric. Under normal operational status, this metric value is 6, indicating that the BGP session is established and traffic can be sent and received. However, if this metric value changes to 1–5, then it is indicative of an issue. To start investigating the cause of this, you should review VIF configuration both on the Outposts console and programmatically. This includes the values set on the OND for VLAN, local and peer addresses, and BGP ASN. These values can be validated against the configuration on your on-premises CNDs if required. Furthermore, you can use the VifBgpSessionState metric value to determine the potential cause:
By using a combination of these metrics, you can gain a clearer understanding of the potential network issue without having to engage with AWS or third-party support teams.
You can view and query these metrics on the CloudWatch console. In the navigation pane, choose All metrics, followed by Outposts under the AWS namespaces section. The Outposts namespace can only be viewed by the Outposts owner account, unless CloudWatch cross-account observability is configured. The new VifConnectionStatus and VifBgpSessionState metrics can be found under the OutpostsID, VirtualInterfaceGroupId, VirtualInterfaceId dimension.
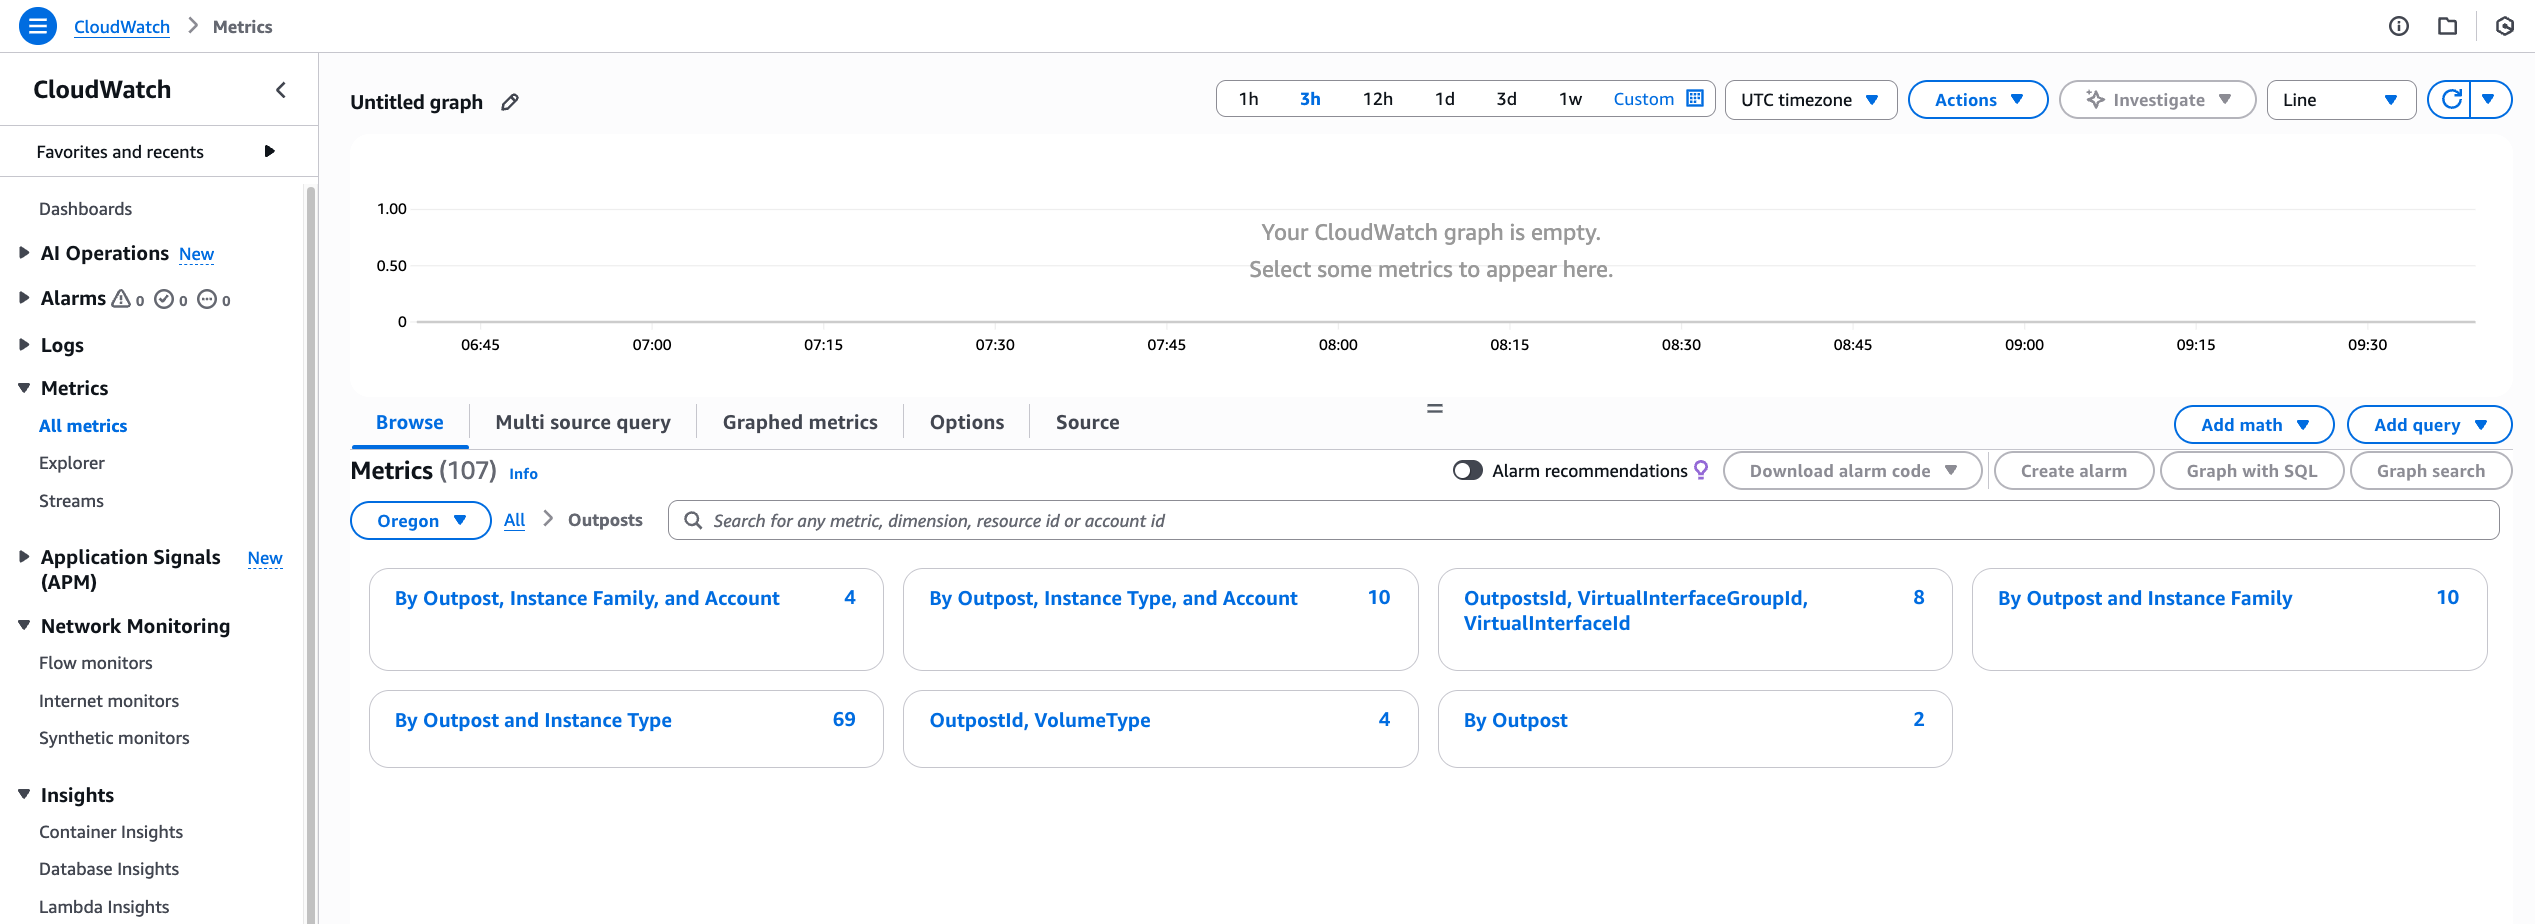
Figure 3: Amazon CloudWatch metrics for AWS Outposts
For more information on working with metrics, see Metrics in Amazon CloudWatch. For creating alerts based upon these new metrics and their values, refer to Using Amazon CloudWatch alarms.
The resilient design of using multiple ONDs for both service link and local gateway traffic allows workloads to continue to run in the event of connectivity issues for single VIFs. For example, a single service link VIF might report as being down, but the remaining service link VIFs might be unaffected and remain available. In this scenario, the service link itself would remain functional and connected, albeit with potentially lower resilience and capacity. This can be validated throught the ConnectedStatus metric which would have a value of 1.
This post provided details on the newly released CloudWatch metrics for Outposts racks, VifConnectionStatus and VifBgpSessionState, and how you can use them to investigate potential connectivity issues. For more information on Outposts rack networking patterns, see the Networking section of the Outposts High Availability Design and Architecture Considerations whitepaper. For more information about additional CloudWatch metrics that are available, check out the CloudWatch metrics for AWS Outposts documentation for second-generation Outposts racks and first-generation Outposts racks.
Reach out to your AWS account team, or fill out this form to learn more about observability for Outposts.