Monitoring Kubernetes with Zabbix

Post Syndicated from Michaela DeForest original https://blog.zabbix.com/monitoring-kubernetes-with-zabbix/25055/

There are many options available for monitoring Kubernetes and cloud-native applications. In this multi-part blog series, we’ll explore how to use Zabbix to monitor a Kubernetes cluster and understand the metrics generated within Zabbix. We’ll also learn how to exploit Prometheus endpoints exposed by applications to monitor application-specific metrics.

Want to see Kubernetes monitoring in action? Watch the step-by-step Zabbix Kubernetes monitoring configuration and deployment guide.

Why Choose Zabbix to Monitor Kubernetes?

Before choosing Zabbix as a Kubernetes monitoring tool, we asked ourselves, “why would we choose to use Zabbix rather than Prometheus, Grafana, and alertmanager?” After all, they have become the standard monitoring tools in the cloud ecosystem. We decided that our minimum criteria for Zabbix would be that it was just as effective as Prometheus for monitoring both Kubernetes and cloud-native applications.

Through our discovery process, we concluded that Zabbix meets (and exceeds) this minimum requirement. Zabbix provides similar metrics and triggers as Prometheus, alert manager, and Grafana for Kubernetes, as they both use the same backend tools to do this. However, Zabbix can do this in one product while still maintaining flexibility and allowing you to monitor pretty much anything you can write code to collect. Regarding application monitoring, Zabbix can transform Prometheus metrics fed to it by Prometheus exporters and endpoints. In addition, because Zabbix can make calls to any HTTP endpoint, it can monitor applications that do not have a dedicated Prometheus endpoint, unlike Prometheus.

The Zabbix Helm Chart

Zabbix monitors Kubernetes by collecting metrics exposed via the Kubernetes API and kube-state-metrics. The components necessary to monitor a cluster are installed within the cluster using this helm chart provided by Zabbix. The helm chart includes the Zabbix agent installed as a daemon set and is used to monitor local resources and applications on each node. A Zabbix proxy is also installed to collect monitoring data and transfer it to the external Zabbix server.

Only the Zabbix proxy needs access to the Zabbix server, while the agents can send data to the proxy installed in the same namespace as each agent. A cluster role allows Zabbix to access resources in the cluster via the Kubernetes API. While the cluster role could be modified to restrict privileges given to Zabbix, this will result in some items becoming unsupported. We recommend keeping this the same if you want to get the most out of Kubernetes monitoring with Zabbix.

The Zabbix helm chart installs the kube-state-metrics project as a dependency. You may already be familiar with this project under the Kubernetes organization, which generates Prometheus format metrics based on the current state of the Kubernetes resources. In addition, if you have experience using Prometheus to monitor a cluster, you may already have this installed. If that is the case, you can point to this deployment rather than installing another one.

In this tutorial, we will install kube-state-metrics via the Zabbix helm chart.

For more information on skipping this step, refer to the values file in the Zabbix Kubernetes helm chart.

Installing the Zabbix Helm Chart

Now that we’ve explained how the Zabbix helm chart works, let’s go ahead and install it. In this example, we will assume that you have a running Zabbix 6.0 (or higher) instance that is reachable from the cluster you wish to monitor. I am running a 6.0 instance in a different cluster than the one we want to monitor. The server is reachable via the DNS name mdeforest.zabbix.atsgroup.io with a non-standard port of 31103.

We will start by installing the latest Zabbix helm chart. I recommend visiting zabbix.com/integrations/kubernetes to get any sources that may be referred to in this tutorial. There you will find a link to the Zabbix helm chart and templates. For the most part, we will follow the steps outlined in the readme.


Using a terminal window, I am going to make sure the active cluster is set to the cluster that I want to monitor:

kubectl config use-context <cluster context name>

I’m then going to add the Zabbix chart repo to my local helm repository:

helm repo add zabbix-chart-6.0 https://cdn.zabbix.com/zabbix/integrations/kubernetes-helm/6.0/

If you’re running Zabbix 6.2 or newer, change the references to 6.0 in this command to 6.2.

Depending on your circumstances, you will need to set a few values for the installation. In most cases, you only need to set a few environment variables for the Zabbix agent and the proxy. The complete list of values and environment variables is available in the helm chart repo, alongside the agent and proxy images on Docker Hub.

In this case, I’m setting the passive server environment variable for the agent to allow any IP to connect. For the proxy, I am setting the server host accessible from the proxy alongside the non-standard port. I’ve also set here some variables related to cache size. These variables may depend on your cluster size, so you may need to play around with them to find the correct values.

Now that I have the values file ready, I’m ready to install the chart. So, we’ll use the following command. Of course, the chart path might vary depending on what version of the chart you’re using.

helm install -f </path/to/values/file> [-n <namespace>] zabbix zabbix-chart-6.0/zabbix-helm-chart

You can also optionally add a namespace. You must wait until everything is running, so I’ll check just that with the following:

watch kubectl get pods

Now that everything is installed, we’re ready to set up hosts in Zabbix that will be associated with the cluster. The last step before we have all the information we need is to obtain the token created via the service account installed with the helm chart. We’ll get this by running the next command, which is the name of the service account that was created:

kubectl get secret -o jsonpath={.data.token} zabbix service-account | base64 -d

This will get the secret created for the service account and grab just the token from that, which is passed to the base64 utility to decode it. Be sure to copy that value somewhere because you’ll need it for later.

You’ll also need the Kubernetes API endpoint. In most cases, you’ll use the proxy installed rather than the server directly or a proxy outside the cluster. If this is the case, you can use the service DNS for the API. We should be able to reach it by pointing to https://kubernetes.default.svc.cluster.local:443/api.

If this is not the case, you can use the output from the command:

kubectl cluster-info

Now, let’s head over to the Zabbix UI. All the templates we need are shipped in Zabbix 6. If for some reason, you can’t find them, they are available for download and import by visiting the integrations page that I pointed out earlier on the Zabbix site.

Adding the Proxy

We will add our proxy by heading to Administration -> Proxies:

  1. Click Create Proxy. Because this is an active proxy by default, we only need to specify the proxy name. If you didn’t make any changes to the helm chart, this should default to zabbix-proxy. If you’d like to name this differently, you can change the environment variable zbx_hostname for the proxy in the helm chart. We’re going to leave it as the default for now. You’re going to enter this name and then click “Add.” After a few minutes, you’ll start to see that it says that the proxy has been seen.
  2. Create a Host Group to put hosts related to Kubernetes. For this example, let’s create one, which we’ll call Kubernetes.
  3. Head to the host page under configuration and click Create Host. The first host will collect metrics related to monitoring Kubernetes nodes, and we’ll discover nodes and create new hosts using Zabbix low-level discovery.
  4. Give this host the name Kubernetes Nodes. We’ll also assign this host to the Kubernetes host group we created and attach the template Kubernetes nodes by HTTP.
  5. Change the line “Monitored by proxy” to the proxy created earlier, called zabbix-proxy.
  6. Click the Macros tab and select “Inherited and host macros.” You should be able to see all the macros that may be set to influence what is monitored in your cluster. In this case, we need to change the first two macros. The first, {KUBE.API.ENDPOINT.URL}, should be set to the Kubernetes API endpoint. In our case, we can set it to what I mentioned earlier: default.svc.cluster.local:443/api. Next, the token should be set to the previously retrieved value from the command line.
  7. lick Add. After a few minutes, you should start seeing data on the latest data page and new hosts on the host page representing each node.

Creating an Additional Host

Now let’s create another host that will represent the metrics available via the Kubernetes API and the kube-state-metrics endpoint.

  1. Click Create Host again, name this host Kubernetes Cluster State, and add it to the Kubernetes group again.
  2. Let’s also attach the Kubernetes Cluster State template by HTTP. Again, we’re going to choose the proxy that we created earlier.
  3. In the Macro section, change the kube.api.url to the same thing we used before, but this time leave off the /api at the end. Simply: default.svc.cluster.local:443. Be sure to set the token as we did before.
  4. Assuming nothing else was changed in the installation of the helm chart, we can now add that host.

After a few minutes, you should receive metrics related to the cluster state, including hosts representing the kubelet on each node.

What’s Next?

Now you’re all set to start monitoring your Kubernetes cluster in Zabbix! Give it a try, and let us know your thoughts in the comments.

In the next blog post, we’ll look at what you can do with your newly monitored cluster and how to get the most out of it.

If you’d like help with any of this, ATS has advanced monitoring, orchestration, and automation skills to make this process a snap. Set up a 15-minute with our team to go through any questions you have.

About the Author

Michaela DeForest is a Platform Engineer for The ATS Group.  She is a Zabbix Certified Specialist on Zabbix 6.0 with additional areas of expertise, including Terraform, Amazon Web Services (AWS), Ansible, and Kubernetes, to name a few.  As ATS’s resident authority in DevOps, Michaela is critical in delivering cutting-edge solutions that help businesses improve efficiency, reduce errors, and achieve a faster ROI.

About ATS Group: The ATS Group provides a fully inclusive set of technology services and tools designed to innovate and transform IT.  Their systems integration, business resiliency, cloud enablement, infrastructure intelligence, and managed services help businesses of all sizes “get IT done.” With over 20 years in business, ATS has become the trusted advisor to nearly 500 customers across multiple industries.  They have built their reputation around honesty, integrity, and technical expertise unrivaled by the competition.

Bulk Surveillance of Money Transfers

Post Syndicated from Bruce Schneier original https://www.schneier.com/blog/archives/2023/01/bulk-surveillance-of-money-transfers.html

Just another obscure warrantless surveillance program.

US law enforcement can access details of money transfers without a warrant through an obscure surveillance program the Arizona attorney general’s office created in 2014. A database stored at a nonprofit, the Transaction Record Analysis Center (TRAC), provides full names and amounts for larger transfers (above $500) sent between the US, Mexico and 22 other regions through services like Western Union, MoneyGram and Viamericas. The program covers data for numerous Caribbean and Latin American countries in addition to Canada, China, France, Malaysia, Spain, Thailand, Ukraine and the US Virgin Islands. Some domestic transfers also enter the data set.

[…]

You need to be a member of law enforcement with an active government email account to use the database, which is available through a publicly visible web portal. Leber told The Journal that there haven’t been any known breaches or instances of law enforcement misuse. However, Wyden noted that the surveillance program included more states and countries than previously mentioned in briefings. There have also been subpoenas for bulk money transfer data from Homeland Security Investigations (which withdrew its request after Wyden’s inquiry), the DEA and the FBI.

How is it that Arizona can be in charge of this?

Wall Street Journal podcast—with transcript—on the program. I think the original reporting was from last March, but I missed it back then.

Introducing AWS Lambda runtime management controls

Post Syndicated from Julian Wood original https://aws.amazon.com/blogs/compute/introducing-aws-lambda-runtime-management-controls/

This blog post is written by Jonathan Tuliani, Principal Product Manager.

Today, AWS Lambda is announcing runtime management controls which provide more visibility and control over when Lambda applies runtime updates to your functions. Lambda is also changing how it rolls out automatic runtime updates to your functions. Together, these changes provide more flexibility in how you take advantage of the latest runtime features, performance improvements, and security updates.

By default, all functions will continue to receive automatic runtime updates. You do not need to change how you use Lambda to continue to benefit from the security and operational simplicity of the managed runtimes Lambda provides. The runtime controls are optional capabilities for advanced customers that require more control over their runtime changes.

This post explains what new runtime management controls are available and how you can take advantage of this new capability.

Overview

For each runtime, Lambda provides a managed execution environment. This includes the underlying Amazon Linux operating system, programming language runtime, and AWS SDKs. Lambda takes on the operational burden of applying patches and security updates to all these components. Customers tell us how much they appreciate being able to deploy a function and leave it, sometimes for years, without having to apply patches. With Lambda, patching ‘just works’, automatically.

Lambda strives to provide updates which are backward compatible with existing functions. However, as with all software patching, there are rare cases where a patch can expose an underlying issue with an existing function that depends on the previous behavior. For example, consider a bug in one of the runtime OS packages. Applying a patch to fix the bug is the right choice for the vast majority of customers and functions. However, in rare cases, a function may depend on the previous (incorrect) behavior. Customers with critical workloads running in Lambda tell us they would like a way to further mitigate even this slight risk of disruption.

With the launch of runtime management controls, Lambda now offers three new capabilities. First, Lambda provides visibility into which patch version of a runtime your function is using and when runtime updates are applied. Second, you can optionally synchronize runtime updates with function deployments. This provides you with control over when Lambda applies runtime updates and enables early detection of rare runtime update incompatibilities. Third, in the rare case where a runtime update incompatibility occurs, you can roll back your function to an earlier runtime version. This keeps your function working and minimizes disruption, providing time to remedy the incompatibility before returning to the latest runtime version.

Runtime identifiers and runtime versions

Lambda runtimes define the components of the execution environment in which your function code runs. This includes the OS, programming language runtime, environment variables, and certificates. For Python, Node.js and Ruby, the runtime also includes the AWS SDK. Each Lambda runtime has a unique runtime identifier, for example, nodejs18.x, or python3.9. Each runtime identifier represents a distinct major release of the programming language.

Runtime management controls introduce the concept of Lambda runtime versions. A runtime version is an immutable version of a particular runtime. Each Lambda runtime, such as Node.js 16, or Python 3.9, starts with an initial runtime version. Every time Lambda updates the runtime, it adds a new runtime version to that runtime. These updates cover all runtime components (OS, language runtime, etc.) and therefore use a Lambda-defined numbering scheme, independent of the version numbers used by the programming language. For each runtime version, Lambda also publishes a corresponding base image for customers who package their functions as container images.

New runtime identifiers represent a major release for the programming language, and sometimes other runtime components, such as the OS or SDK. Lambda cannot guarantee compatibility between runtime identifiers, although most times you can upgrade your functions with little or no modification. You control when you upgrade your functions to a new runtime identifier. In contrast, new runtime versions for the same runtime identifier have a very high level of backward compatibility with existing functions. By default, Lambda automatically applies runtime updates by moving functions from the previous runtime version to a newer runtime version.

Each runtime version has a version number, and an Amazon Resource Name (ARN). You can view the version in a new platform log line, INIT_START. Lambda emits this log line each time it creates a new execution environment during the cold start initialization process.

INIT_START Runtime Version: python:3.9.v14	Runtime Version ARN: arn:aws:lambda:eu-south-1::runtime:7b620fc2e66107a1046b140b9d320295811af3ad5d4c6a011fad1fa65127e9e6I

INIT_START Runtime Version: python:3.9.v14 Runtime Version ARN: arn:aws:lambda:eu-south-1::runtime:7b620fc2e66107a1046b140b9d320295811af3ad5d4c6a011fad1fa65127e9e6I

Runtime versions improve visibility into managed runtime updates. You can use the INIT_START log line to identify when the function transitions from one runtime version to another. This helps you investigate whether a runtime update might have caused any unexpected behavior of your functions. Changes in behavior caused by runtime updates are very rare. If your function isn’t behaving as expected, by far the most likely cause is an error in the function code or configuration.

Runtime management modes

With runtime management controls, you now have more control over when Lambda applies runtime updates to your functions. You can now specify a runtime management configuration for each function. You can set the runtime management configuration independently for $LATEST and each published function version.

You can specify one of three runtime update modes: auto, function update, or manual. The runtime update mode controls when Lambda updates the function version to a new runtime version. By default, all functions receive runtime updates automatically, the alternatives are for advanced users in specific cases.

Automatic

Auto updates are the default, and are the right choice for most customers to ensure that you continue to benefit from runtime version updates. They help minimize your operational overheads by letting Lambda take care of runtime updates.

While Lambda has always provided automatic runtime updates, this release includes a change to how automatic runtime updates are rolled out. Previously, Lambda applied runtime updates to all functions in each region, following a region-by-region deployment sequence. With this release, functions configured to use the auto runtime update mode now receive runtime updates in two phases. Initially, Lambda only applies a new runtime version to newly created or updated functions. After this initial period is complete, Lambda then applies the runtime update to any remaining functions configured to use the auto runtime update mode.

This two-phase rollout synchronizes runtime updates with function updates for customers who are actively developing their functions. This makes it easier to detect and respond to any unexpected changes in behavior. For functions not in active development, auto mode continues to provide the operational benefits of fully automatic runtime updates.

Function update

In function update mode, Lambda updates your function to the latest available runtime version whenever you change your function code or configuration. This is the same as the first phase of auto mode. The difference is that, in auto mode, there is a second phase when Lambda applies runtime updates to functions which have not been changed. In function update mode, if you do not change a function, it continues to use the current runtime version indefinitely. This means that when using function update mode, you must update your functions regularly to keep their runtimes up-to-date. If you do not update a function regularly, you should use the auto runtime update mode.

Synchronizing runtime updates with function deployments gives you control over when Lambda applies runtime updates. For example, you can avoid applying updates during business-critical events, such as a product launch or holiday sales.

When used with CI/CD pipelines, function update mode enables early detection and mitigation in the rare event of a runtime update incompatibility. This is especially effective if you create a new published function version with each deployment. Each published function version captures a static copy of the function code and configuration, so that you can roll back to a previously published function version if required. Using function update mode extends the published function version to also capture the runtime version. This allows you to synchronize rollout and rollback of the entire Lambda execution environment, including function code, configuration, and runtime version.

Manual

Consider the rare event that a runtime update is incompatible with one of your functions. With runtime management controls, you can now roll back to an earlier runtime version. This keeps your function working and minimizes disruption, giving you time to remedy the incompatibility before returning to the latest runtime version.

There are two ways to implement a runtime version rollback. You can use function update mode with a published function version to synchronize the rollback of code, configuration, and runtime version. Or, for functions using the default auto runtime update mode, you can roll back your runtime version by using manual mode.

The manual runtime update mode provides you with full control over which runtime version your function uses. When enabling manual mode, you must specify the ARN of the runtime version to use, which you can find from the INIT_START log line.

Lambda does not impose a time limit on how long you can use any particular runtime version. However, AWS strongly recommends using manual mode only for short-term remediation of code incompatibilities. Revert your function back to auto mode as soon as you resolve the issue. Functions using the same runtime version for an extended period may eventually stop working due to, for example, a certificate expiry.

Using runtime management controls

You can configure runtime management controls via the Lambda AWS Management Console and AWS Command Line Interface (AWS CLI). You can also use infrastructure as code tools such as AWS CloudFormation and the AWS Serverless Application Model (AWS SAM).

Console

From the Lambda console, navigate to a specific function. You can find runtime management controls on the Code tab, in the Runtime settings panel. Expand Runtime management configuration to view the current runtime update mode and runtime version ARN.

Runtime settings

Runtime settings

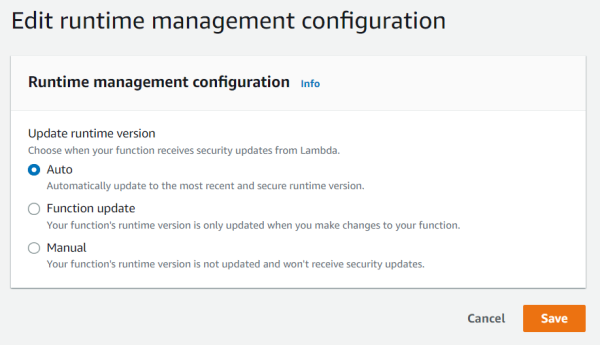
To change runtime update mode, select Edit runtime management configuration. You can choose between automatic, function update, and manual runtime update modes.

Edit runtime management configuration (Auto)

Edit runtime management configuration (Auto)

In manual mode, you must also specify the runtime version ARN.

Edit runtime management configuration (Manual)

Edit runtime management configuration (Manual)

AWS SAM

AWS SAM is an open-source framework for building serverless applications. You can specify runtime management settings using the RuntimeManagementConfig property.

Resources:
  HelloWorldFunction:
    Type: AWS::Serverless::Function
    Properties:
      Handler: lambda_function.handler
      Runtime: python3.9
      RuntimeManagementConfig:
        UpdateOn: Manual
        RuntimeVersionArn: arn:aws:lambda:eu-west-1::runtime:7b620fc2e66107a1046b140b9d320295811af3ad5d4c6a011fad1fa65127e9e6

AWS CLI

You can also manage runtime management settings using the AWS CLI. You configure runtime management controls via a dedicated command aws lambda put-runtime-management-config, rather than aws lambda update-function-configuration.

aws lambda put-runtime-management-config --function-name <function_arn> --update-runtime-on Manual --runtime-version-arn <runtime_version_arn>

To view the existing runtime management configuration, use aws lambda get-runtime-management-config.

aws lambda get-runtime-management-config --function-name <function_arn>

The current runtime version ARN is also returned by aws lambda get-function and aws lambda get-function-configuration.

Conclusion

Runtime management controls provide more visibility and flexibility over when and how Lambda applies runtime updates to your functions. You can specify one of three update modes: auto, function update, or manual. These modes allow you to continue to take advantage of Lambda’s automatic patching, synchronize runtime updates with your deployments, and rollback to an earlier runtime version in the rare event that a runtime update negatively impacts your function.

For more information on runtime management controls, see our documentation page.

For more serverless learning resources, visit Serverless Land.

Now Open — AWS Asia Pacific (Melbourne) Region in Australia

Post Syndicated from Donnie Prakoso original https://aws.amazon.com/blogs/aws/now-open-aws-asia-pacific-melbourne-region-in-australia/

Following up on Jeff’s post on the announcement of the Melbourne Region, today I’m pleased to share the general availability of the AWS Asia Pacific (Melbourne) Region with three Availability Zones and API name ap-southeast-4.

The AWS Asia Pacific (Melbourne) Region is the second infrastructure Region in Australia, in addition to the Asia Pacific (Sydney) Region, and 12th the twelfth Region in Asia Pacific, joining existing Rregions in Singapore, Tokyo, Seoul, Mumbai, Hong Kong, Osaka, Jakarta, Hyderabad, Sydney, and Mainland China Beijing and Ningxia Regions.

Melbourne city historic building: Flinders Street Station built of yellow sandstone

AWS in Australia: Long-Standing History
In November 2012, AWS established a presence in Australia with the AWS Asia Pacific (Sydney) Region. Since then, AWS has provided continuous investments in infrastructure and technology to help drive digital transformations in Australia, to support hundreds of thousands of active customers each month.

Amazon CloudFront — Amazon CloudFront is a content delivery network (CDN) service built for high performance, security, and developer convenience that was first launched in Australia alongside Asia Pacific (Sydney) Region in 2012. To further accelerate the delivery of static and dynamic web content to end users in Australia, AWS announced additional CloudFront locations for Sydney and Melbourne in 2014. In addition, AWS also announced a Regional Edge Cache in 2016 and an additional CloudFront point of presence (PoP) in Perth in 2018. CloudFront points of presence ensure popular content can be served quickly to your viewers. Regional Edge Caches are positioned (network-wise) between the CloudFront locations and the origin and further help to improve content performance. AWS currently has seven edge locations and one Regional Edge Cache location in Australia.

AWS Direct Connect — As with CloudFront, the first AWS Direct Connect location was made available with Asia Pacific (Sydney) Region launch in 2012. To continue helping our customers in Australia improve application performance, secure data, and reduce networking costs, AWS announced the opening of additional Direct Connect locations in Sydney (2014), Melbourne (2016), Canberra (2017), Perth (2017), and an additional location in Sydney (2022), totaling six locations.

AWS Local Zones — To help customers run applications that require single-digit millisecond latency or local data processing, customers can use AWS Local Zones. They bring AWS infrastructure (compute, storage, database, and other select AWS services) closer to end users and business centers. AWS customers can run workloads with low latency requirements on the AWS Local Zones location in Perth while seamlessly connecting to the rest of their workloads running in AWS Regions.

Upskilling Local Developers, Students, and Future IT Leaders
Digital transformation will not happen on its own. AWS runs various programs and has trained more than 200,000 people across Australia with cloud skills since 2017. There is an additional goal to train more than 29 million people globally with free cloud skills by 2025. Here’s a brief description of related programs from AWS:

  • AWS re/Start is a digital skills training program that prepares unemployed, underemployed, and transitioning individuals for careers in cloud computing and connects students to potential employers.
  • AWS Academy provides higher education institutions with a free, ready-to-teach cloud computing curriculum that prepares students to pursue industry-recognized certifications and in-demand cloud jobs.
  • AWS Educate provides students with access to AWS services. AWS is also collaborating with governments, educators, and the industry to help individuals, both tech and nontech workers, build and deepen their digital skills to nurture a workforce that can harness the power of cloud computing and advanced technologies.
  • AWS Industry Quest is a game-based training initiative designed to help professionals and teams learn and build vital cloud skills and solutions. At re:Invent 2022, AWS announced the first iteration of the program for the financial services sector. National Australia Bank (NAB) is AWS Industry Quest: Financial Services’ first beta customer globally. Through AWS Industry Quest, NAB has trained thousands of colleagues in cloud skills since 2018, resulting in more than 4,500 industry-recognized certifications.

In addition to the above programs, AWS is also committed to supporting Victoria’s local tech community through digital upskilling, community initiatives, and partnerships. The Victorian Digital Skills is a new program from the Victorian Government that helps create a new pipeline of talent to meet the digital skills needs of Victorian employers. AWS has taken steps to help solve the retraining challenge by supporting the Victorian Digital Skills Program, which enables mid-career Victorians to reskill on technology and gain access to higher-paying jobs.

The Climate Pledge
Amazon is committed to investing and innovating across its businesses to help create a more sustainable future. With The Climate Pledge, Amazon is committed to reaching net-zero carbon across its business by 2040 and is on a path to powering its operations with 100 percent renewable energy by 2025.

As of May 2022, two projects in Australia are operational. Amazon Solar Farm Australia – Gunnedah and Amazon Solar Farm Australia – Suntop will aim to generate 392,000 MWh of renewable energy each year, equal to the annual electricity consumption of 63,000 Australian homes. Once Amazon Wind Farm Australia – Hawkesdale also becomes operational, it will boost the projects’ combined yearly renewable energy generation to 717,000 MWh, or enough for nearly 115,000 Australian homes.

AWS Customers in Australia
We have customers in Australia that are doing incredible things with AWS, for example:

National Australia Bank Limited (NAB)
NAB is one of Australia’s largest banks and Australia’s largest business bank. “We have been exploring the potential use cases with AWS since the announcement of the AWS Asia Pacific (Melbourne) Region,” said Steve Day, Chief Technology Officer at NAB.

Locating key banking applications and critical workloads geographically close to their compute platform and the bulk of their corporate workforce will provide lower latency benefits. Moreover, it will simplify their disaster recovery plans. With AWS Asia Pacific (Melbourne) Region, it will also accelerate their strategy to move 80 percent of applications to the cloud by 2025.

Littlepay
This Melbourne-based financial technology company works with more than 250 transport and mobility providers to enable contactless payments on local buses, city networks, and national public transport systems.

“Our mission is to create a universal payment experience around the world, which requires world-class global infrastructure that can grow with us,” said Amin Shayan, CEO at Littlepay. “To drive a seamless experience for our customers, we ingest and process over 1 million monthly transactions in real time using AWS, which enables us to generate insights that help us improve our services. We are excited about the launch of a second AWS Region in Australia, as it gives us access to advanced technologies, like machine learning and artificial intelligence, at a lower latency to help make commuting a simpler and more enjoyable experience.”

Royal Melbourne Institute of Technology (RMIT)
RMIT is a global university of technology, design, and enterprise with more than 91,000 students and 11,000 staff around the world.

“Today’s launch of the AWS Region in Melbourne will open up new ways for our researchers to drive computational engineering and maximize the scientific return,” said Professor Calum Drummond, Deputy Vice-Chancellor and Vice-President, Research and Innovation, and Interim DVC, STEM College, at RMIT.

“We recently launched RMIT University’s AWS Cloud Supercomputing facility (RACE) for RMIT researchers, who are now using it to power advances into battery technologies, photonics, and geospatial science. The low latency and high throughput delivered by the new AWS Region in Melbourne, combined with our 400 Gbps-capable private fiber network, will drive new ways of innovation and collaboration yet to be discovered. We fundamentally believe RACE will help truly democratize high-performance computing capabilities for researchers to run their datasets and make faster discoveries.”

Australian Bureau of Statistics (ABS)
ABS holds the Census of Population and Housing every five years. It is the most comprehensive snapshot of Australia, collecting data from around 10 million households and more than 25 million people.

“In this day and age, people expect a fast and simple online experience when using government services,” said Bindi Kindermann, program manager for 2021 Census Field Operations at ABS. “Using AWS, the ABS was able to scale and securely deliver services to people across the country, making it possible for them to quickly and easily participate in this nationwide event.”

With the success of the 2021 Census, the ABS is continuing to expand its use of AWS into broader areas of its business, making use of the security, reliability, and scalability of the cloud.

You can find more inspiring stories from our customers in Australia by visiting Customer Success Stories page.

Things to Know
AWS User Groups in Australia — Australia is also home to 9 AWS Heroes, 43 AWS Community Builders and community members of 17 AWS User Groups in various cities in Australia. Find an AWS User Group near you to meet and collaborate with fellow developers, participate in community activities and share your AWS knowledge.

AWS Global Footprint — With this launch, AWS now spans 99 Availability Zones within 31 geographic Regions around the world. We have also announced plans for 12 more Availability Zones and 4 more AWS Regions in Canada, Israel, New Zealand, and Thailand.

Available Now — The new Asia Pacific (Melbourne) Region is ready to support your business, and you can find a detailed list of the services available in this Region on the AWS Regional Services List.

To learn more, please visit the Global Infrastructure page, and start building on ap-southeast-4!

Happy building!

— Donnie

AWS Lambda: Resilience under-the-hood

Post Syndicated from Marcia Villalba original https://aws.amazon.com/blogs/compute/aws-lambda-resilience-under-the-hood/

This post is written by Adrian Hornsby (Principal System Dev Engineer) and Marcia Villalba (Principal Developer Advocate).

AWS Lambda comprises over 80 services working together to provide the serverless compute service that it offers to customers. Under the hood, many of these services are built on top of Amazon Elastic Compute Cloud (Amazon EC2) instances, provisioned within Availability Zones. However, AWS Lambda is a Regional service. This means that customers use Lambda services from the Region level and its services are designed to be resilient to impairments that the underlying Availability Zones might have.

This blog post discusses how a Regional service such as Lambda takes advantage of Availability Zones and static stability to achieve its high availability target, and shows how Lambda teams verify their service’s static stability using AWS Fault Injection Simulator (AWS FIS). It also provides a solution using AWS services and tools to achieve Lambda’s resiliency strategy, using FIS, Amazon CloudWatch, and Amazon Route 53 Application Recovery Controller (Route 53 ARC).

The role of Availability Zones

Availability Zones are physically isolated sections of an AWS Region, designed to operate but also fail independently. They are separated by a meaningful distance from each other, up to 100 kilometers (60 miles), to prevent correlated failures, but close enough to use synchronous replication with single-digit millisecond latency.

Customers and AWS services have been using Availability Zones for years to build highly available, fault tolerant, and scalable applications. In particular, AWS Regional services such as AWS Lambda, Amazon DynamoDB, Amazon Simple Queue Service (Amazon SQS), and Amazon Simple Storage Service (Amazon S3), have achieved their high availability promises by spreading multiple independent replicas of their services across multiple Availability Zones. It uses the principles of independence and redundancy of Availability Zones to maximize the overall availability of that service.

Each replica is called a zonal replica. The system is designed so that any of the replicas can fail at any time. When a replica fails, it can be temporarily removed from the system until everything works as expected again. When that happens, the load is shared between the remaining zonal replicas.

Designing for failures

One lesson we learned at AWS when building services is when there is an Availability Zone impairment, it is better not to rely on control plane operations to remediate the failure. A control plane operation can, for example, be provisioning more capacity in an Availability Zone that is not affected by the impairment.

This principle is called static stability, and it describes the capability for a system to keep its original steady-state (or behavior) even when subjected to disruptive events without having to make any changes. A statically stable service should have as few dependencies as possible for its recovery process.

For a Regional service like AWS Lambda, this means that the remaining capacity in the healthy Availability Zones can absorb the traffic from a potentially impaired Availability Zone without having to scale up. This implies over-provisioning resources in all Availability Zones. Having that extra capacity pre-provisioned helps Lambda achieve its static stability. It is a tradeoff between the cost of over-provisioning resources and service availability. Since AWS Lambda promises high availability to its customers, with a monthly uptime service commitment of 99.95%, that tradeoff falls towards service availability.

How to prepare for failures

Preparing for an Availability Zone impairment is difficult because the symptoms and size of the impact can vary widely. An Availability Zone may be partially accessible or totally unreachable, and everything in between. Causes for the impairment can range from fiber cuts, power issues, overheating, hardware malfunctions, networking problems, capacity issues, and other unexpected situations. While those happen, they happen rarely. The most common categories of failures are bad deployments and bad configurations.

While some of these failures can be difficult to infer or reproduce, common symptoms include disruption of connectivity, increased latency, increased traffic due to retry storms, increased CPU and memory usage, and slow I/O.

At AWS, we learned to expect the unexpected and plan for failure. This means injecting faults in the system to reproduce some of the common symptoms of Availability Zone impairments, then observe how the system responds, and implement improvements. In addition, injecting faults in the system helps uncover potential monitoring and alarming blind spots, and gives an opportunity for teams to practice and improve their response to events with a focus on reducing time to recovery.

How Lambda tests its response to an Availability Zone impairment

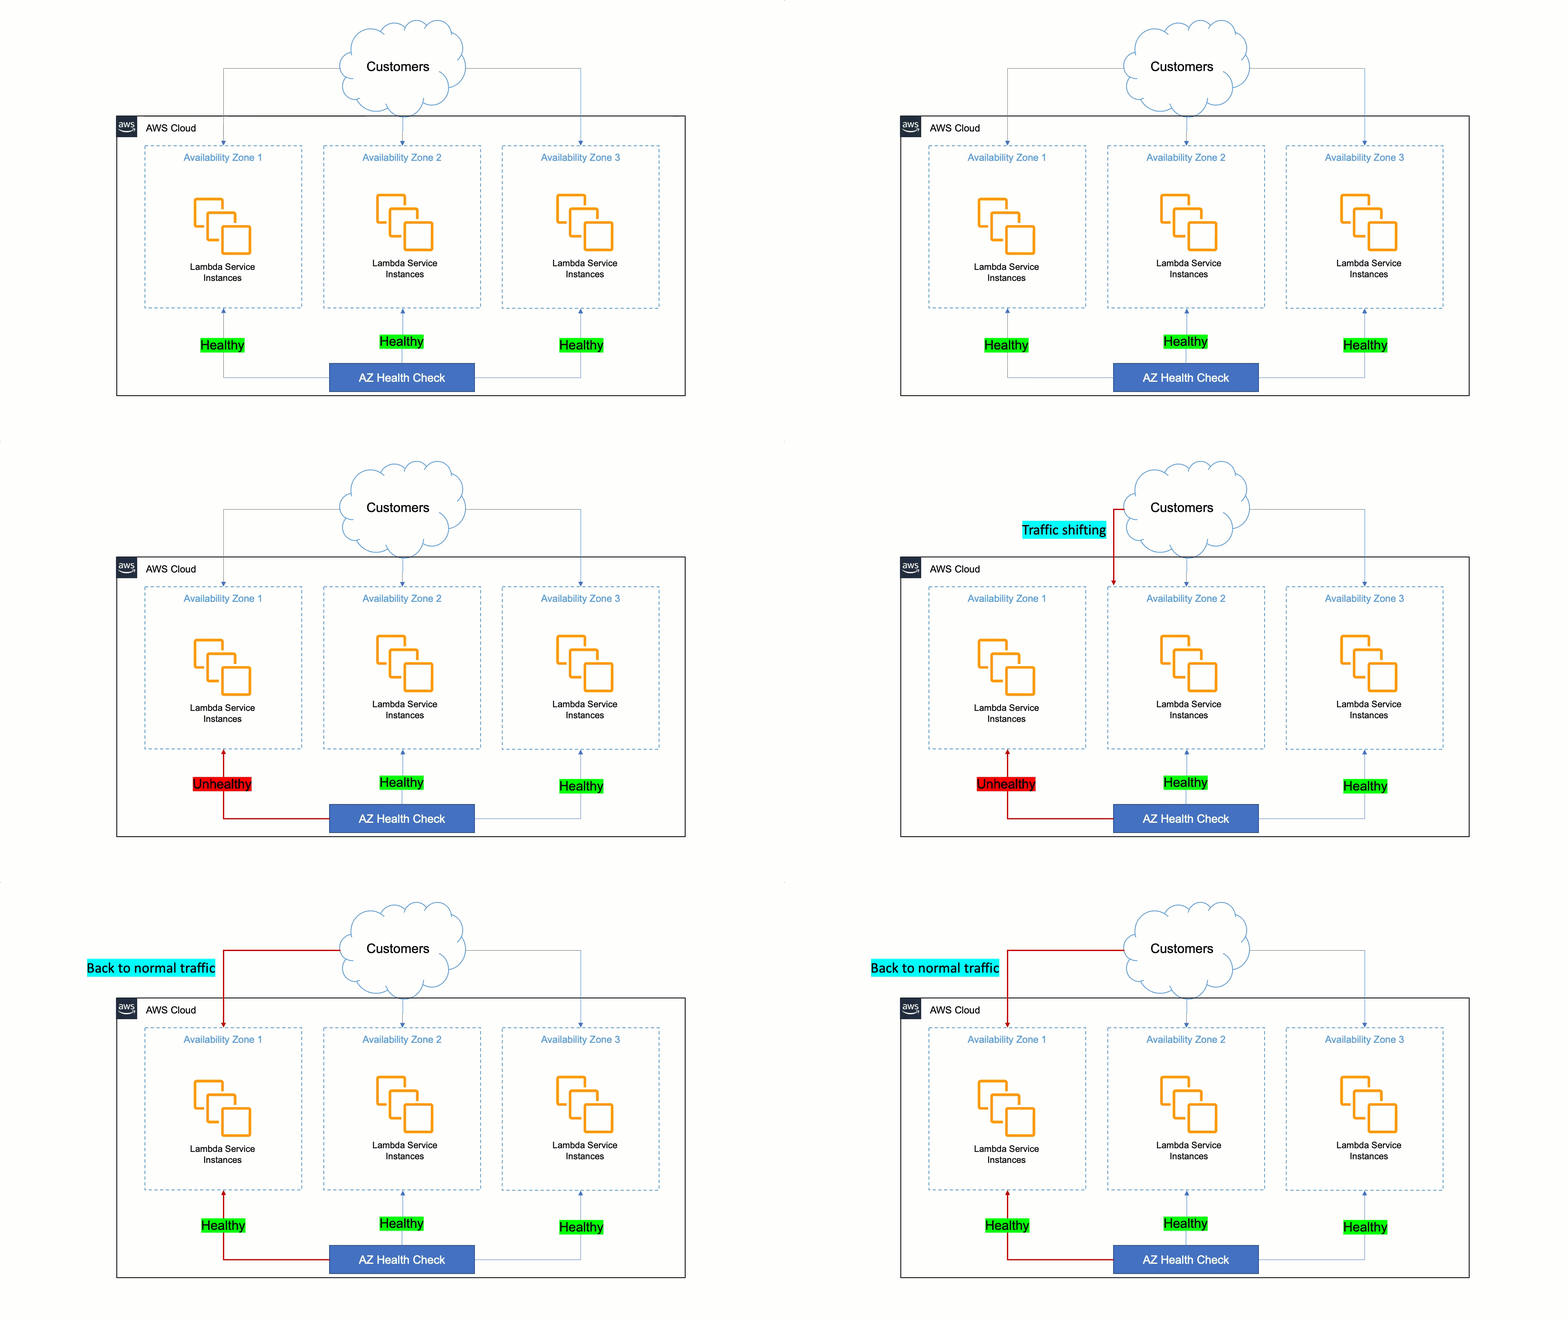
Lambda’s approach to being resilient to Availability Zone impairments is to rely on static stability and automated systems. Humans are slower than machines for detecting issues and mitigating them. Therefore, Lambda must ensure that its services can detect issues within a zonal replica and remediate automatically within minutes and with no operator intervention. This auto-remediation is done by shifting customer traffic away from the affected Availability Zone to healthy ones, and it is called Availability Zone evacuation.

To do this, Lambda built a tool that detects failures and performs the Availability Zone evacuation when needed. This tool does a statistical comparison of metrics between different Availability Zones and EC2 instances in order to identify unhealthy Availability Zones. If an Availability Zone is found to have issues, the tool starts the evacuation out of the unhealthy Availability Zone automatically. This automation cuts the time to the first action from 30 minutes to less than 3 minutes.

How AWS Lambda uses AWS FIS

To verify the automation continuously works as expected, Lambda performs a wide variety of tests, which includes Availability Zone failure testing in their pre-production environment. The main objective of these tests is to verify the services are statically stable in the presence of Availability Zone impairments, and to verify that the Availability Zone evacuation can be successfully initiated. The benefit of having an automated test is that teams can repeat it regularly and don’t need to have special skills. One click is all it takes to launch the test.

For these tests, Lambda uses AWS FIS to inject faults into their large fleet of EC2 instances. They use AWS FIS with support of the AWS System Manager (SSM) agent and resource filters to target their fleet of EC2 instances in a particular Availability Zone. This is a versatile approach that can inject resource faults, such as CPU and memory exhaustion, and networking faults, such as packet latency, loss, or drop.

Injecting packet loss or latency is very important, since these symptoms can have a serious impact on application and network performance. Indeed, latency and loss, even in small quantities, can create inefficiencies and prevent applications from running at their peak performance. For Lambda, being able to detect increased latency or loss before it affects customers is critical.

How to recover your applications rapidly from Availability Zones failures

You can build a similar solution to rapidly recover your applications from a zonal failure. The solution must have a mechanism to evacuate an impaired Availability Zone, a monitoring system that allows you to detect when a zonal replica is impaired, and a way to test the static stability of your system. AWS provides many tools and services that can help you build this solution to achieve Lambda’s resiliency strategy.

For performing Availability Zone evacuation, you can use the new zonal shift capability from Route 53 ARC, which at the time of writing is in preview. Zonal shift lets you evacuate an Availability Zone for applications that are uses Elastic Load Balancing. If you find out that a zonal replica is impaired or unhealthy, you can use zonal shift to evacuate the Availability Zone for a period of time, while the issue gets fixed.

For performing the zonal shift, you must detect when a zonal replica is unhealthy. Your application must provide a signal of its health per Availability Zone. There are two common ways to capture this signal. First, passively, you can check your metrics, like response times, HTTP status codes, and other metrics that can help track fatal errors in your applications. Or actively, using synthetic monitoring, which allows you to create synthetic requests against your production application to provide a more complete view of the customer experience.

Amazon CloudWatch Synthetics provides canaries, which are scripts that run on a schedule and perform synthetic requests in your application endpoints and APIs. Canaries perform the same actions as customers and continuously verify the customer experience. You can create a canary for each zonal replica of your application and monitor the results independently.

With this information, if the user experience diminishes in one of the replicas, you can start an Availability Zone evacuation using zonal shift and minimize the bad experience for the user while you find and fix the sources of the failure.

To ensure that you can successfully recover from a failure, you must test the solution in advance. Without testing, it is just an assumption. To prove or disprove your assumptions about your system’s capability to handle disruptive events such as issues within an Availability Zones, you can use FIS.

With FIS, you can inject faults simultaneously in multiple resources within the same failure domain, such as Availability Zones. FIS currently integrates with several AWS services including EC2, Amazon Elastic Kubernetes Service (Amazon EKS), Amazon Elastic Container Service (Amazon ECS), Amazon Relational Database Service (Amazon RDS), AWS Networking, and CloudWatch.

Typical use cases for testing a workload’s resilience to Availability Zones impairment are, for example, terminating all compute resources and databases within a particular Availability Zone, injecting latency or packet loss, increasing resource consumption (CPU, memory, and I/O) in compute resources in a particular Availability Zone, or impacting network communication within or between Availability Zones.

For more information and a step-by-step example of how to recover rapidly from application failures in a single Availability Zone and testing it with AWS FIS, read this blog post.

Conclusion

­­­This article discusses static stability, a mechanism that is used by AWS services such as Lambda to build resilient Regional services. It also discusses how AWS takes advantage of the same services and infrastructure as customers. It shows how Lambda uses multiple Availability Zones and services like AWS FIS to build highly available services and improve its recovery time from unexpected failures to only a few minutes without human intervention. Finally, it shows a solution that you can implement for your applications to achieve Lambda’s resilience strategy.

To learn more about AWS FIS, there are many tutorials and a workshop you can check out.

For more serverless learning resources, visit Serverless Land.

AWS CloudHSM is now PCI PIN certified

Post Syndicated from Nivetha Chandran original https://aws.amazon.com/blogs/security/aws-cloudhsm-is-now-pci-pin-certified/

Amazon Web Services (AWS) is pleased to announce that AWS CloudHSM is certified for Payment Card Industry Personal Identification Number (PCI PIN) version 3.1.

With CloudHSM, you can manage and access your keys on FIPS 140-2 Level 3 certified hardware, protected with customer-owned, single-tenant hardware security module (HSM) instances that run in your own virtual private cloud (VPC). This PCI PIN attestation gives you the flexibility to deploy your regulated workloads with reduced compliance overhead.

Coalfire, a third-party Qualified Security Assessor (QSA), evaluated CloudHSM. Customers can access the PCI PIN Attestation of Compliance (AOC) report through AWS Artifact.

To learn more about our PCI program and other compliance and security programs, see the AWS Compliance Programs page. As always, we value your feedback and questions; reach out to the AWS Compliance team through the Contact Us page.

 
If you have feedback about this post, submit comments in the Comments section below. If you have questions about this post, contact AWS Support.

Want more AWS Security news? Follow us on Twitter.

Author

Nivetha Chandran

Nivetha is a Security Assurance Manager at Amazon Web Services on the Global Audits team, managing the PCI compliance program. Nivetha holds a Master’s degree in Information Management from the University of Washington.

AWS Week in Review – January 23, 2023

Post Syndicated from Jeff Barr original https://aws.amazon.com/blogs/aws/aws-week-in-review-january-23-2023/

Welcome to my first AWS Week in Review of 2023. As usual, it has been a busy week, so let’s dive right in:

Last Week’s Launches
Here are some launches that caught my eye last week:

Amazon Connect – You can now deliver long lasting, persistent chat experiences for your customers, with the ability to resume previous conversations including context, metadata, and transcripts. Learn more.

Amazon RDS for MariaDB – You can now enforce the use of encrypted (SSL/TLS) connections to your databases instances that are running Amazon RDS for MariaDB. Learn more.

Amazon CloudWatch – You can now use Metric Streams to send metrics across AWS accounts on a continuous, near real-time basis, within a single AWS Region. Learn more.

AWS Serverless Application Model – You can now run CloudFormation Linter from the SAM CLI to validate your SAM templates. The default rules check template size, Fn:GetAtt parameters, Fn:If syntax, and more. Learn more.

EC2 Auto Scaling – You can now see (and take advantage of) recommendations for activating a predictive scaling policy to optimize the capacity of your Auto Scaling groups. Recommendations can make use of up to 8 weeks of past date; learn more.

Service Limit Increases – Service limits for several AWS services were raised, and other services now have additional quotas that can be raised upon request:

X In Y – Existing AWS services became available in additional regions:

Other AWS News
Here are some other news items and blog posts that may be of interest to you:

AWS Open Source News and Updates – My colleague Ricardo Sueiras highlights the latest open source projects, tools, and demos from the open source community around AWS. Read edition #142 here.

AWS Fundamentals – This new book is designed to teach you about AWS in a real-world context. It covers the fundamental AWS services (compute, database, networking, and so forth), and helps you to make use of Infrastructure as Code using AWS CloudFormation, CDK, and Serverless Framework. As an add-on purchase you can also get access to a set of gorgeous, high-resolution infographics.

Upcoming AWS Events
Check your calendars and sign up for these AWS events:

AWS on Air – Every Friday at Noon PT we discuss the latest news and go in-depth on several of the most recent launches. Learn more.

#BuildOnLive – Build On AWS Live events are a series of technical streams on twitch.tv/aws that focus on technology topics related to challenges hands-on practitioners face today:

  • Join the Build On Live Weekly show about the cloud, the community, the code, and everything in between, hosted by AWS Developer Advocates. The show streams every Thursday at 9:00 PT on twitch.tv/aws.
  • Join the new The Big Dev Theory show, co-hosted with AWS partners, discussing various topics such as data and AI, AIOps, integration, and security. The show streams every Tuesday at 8:00 PT on twitch.tv/aws.

Check the AWS Twitch schedule for all shows.

AWS Community Days – AWS Community Day events are community-led conferences that deliver a peer-to-peer learning experience, providing developers with a venue to acquire AWS knowledge in their preferred way: from one another.

AWS Innovate Data and AI/ML edition – AWS Innovate is a free online event to learn the latest from AWS experts and get step-by-step guidance on using AI/ML to drive fast, efficient, and measurable results.

  • AWS Innovate Data and AI/ML edition for Asia Pacific and Japan is taking place on February 22, 2023. Register here.
  • Registrations for AWS Innovate EMEA (March 9, 2023) and the Americas (March 14, 2023) will open soon. Check the AWS Innovate page for updates.

You can browse all upcoming in-person and virtual events.

And that’s all for this week!

— Jeff;

[$] Hiding a process’s executable from itself

Post Syndicated from original https://lwn.net/Articles/920384/

Back in 2019, a high-profile container
vulnerability
led to the adoption of some complex workarounds and a
frenzy of patching. The immediate problem was
fixed, but the incident was severe enough that security-conscious
developers have continued to look for ways to prevent similar
vulnerabilities in the future. This
patch set
from Giuseppe Scrivano takes a rather simpler approach to the
problem.

Zawinski: mozilla.org’s 25th anniversary

Post Syndicated from original https://lwn.net/Articles/920833/

Jamie Zawinski reminds
us
that the 25th anniversary of the Netscape open-source announcement —
a crucial moment in free-software history — has just passed.

On January 20th, 1998, Netscape laid off a lot of people. One of
them would have been me, as my “department”, such as it was, had
been eliminated, but I ended up mometarily moving from “clienteng”
over to the “website” division. For about 48 hours I thought that I
might end up writing a webmail product or something.

That, uh, didn’t happen.

That announcement was the opening topic on the
second-ever LWN.net Weekly Edition
as well.

The return of the Linux Kernel Podcast

Post Syndicated from original https://lwn.net/Articles/920831/

After a brief break of … a dozen years or so … Jon Masters has announced
the return of his kernel podcast:

This time around, I’m not committing to any specific cadence –
let’s call it “periodic” (every few weeks). In each episode, I will
aim to broadly summarize the latest happenings in the “plumbing” of
the Linux kernel, and occasionally related bits of userspace
“plumbing” (glibc, systemd, etc.), as well as impactful toolchain
changes that enable new features or rebaseline requirements.

Managing Dev Environments with Amazon CodeCatalyst

Post Syndicated from Ryan Bachman original https://aws.amazon.com/blogs/devops/managing-dev-environments-with-amazon-codecatalyst/

An Amazon CodeCatalyst Dev Environment is a cloud-based development environment that you can use in CodeCatalyst to quickly work on the code stored in the source repositories of your project. The project tools and application libraries included in your Dev Environment are defined by a devfile in the source repository of your project.

Introduction

In the previous CodeCatalyst post, Team Collaboration with Amazon CodeCatalyst, I focused on CodeCatalyst’s collaboration capabilities and how that related to The Unicorn Project’s main protaganist. At the beginning of Chapter 2, Maxine is struggling to configure her development environment. She is two days into her new job and still cannot build the application code. She has identified over 100 dependencies she is missing. The documentation is out of date and nobody seems to know where the dependencies are stored. I can sympathize with Maxine. In this post, I will focus on managing development environments to show how CodeCatalyst removes the burden of managing workload specific configurations and produces reliable on-demand development environments.

Prerequisites

If you would like to follow along with this walkthrough, you will need to:

Have an AWS Builder ID for signing in to CodeCatalyst.

Belong to a space and have the space administrator role assigned to you in that space. For more information, see Creating a space in CodeCatalyst, Managing members of your space, and Space administrator role.

Have an AWS account associated with your space and have the IAM role in that account. For more information about the role and role policy, see Creating a CodeCatalyst service role.

Walkthrough

As with the previous posts in our CodeCatalyst series, I am going to use the Modern Three-tier Web Application blueprint.  Blueprints provide sample code and CI/CD workflows to help make getting started easier across different combinations of programming languages and architectures. To follow along, you can re-use a project you created previously, or you can refer to a previous post that walks through creating a project using the blueprint.

One of the most difficult aspects of my time spent as a developer was finding ways to quickly contribute to a new project. Whenever I found myself working on a new project, getting to the point where I could meaningfully contribute to a project’s code base was always more difficult than writing the actual code. A major contributor to this inefficiency, was the lack of process managing my local development environment. I will be exploring how CodeCatalyst can help solve this challenge.  For this walkthrough, I want to add a new test that will allow local testing of Amazon DynamoDB. To achieve this, I will use a CodeCatalyst dev environment.

CodeCatalyst Dev Environments are managed cloud-based development environments that you can use to access and modify code stored in a source repository. You can launch a project specific dev environment that will automate check-out of your project’s repo or you can launch an empty environment to use for accessing third-party source providers.  You can learn more about CodeCatalyst Dev Environments in the CodeCatalyst User Guide.

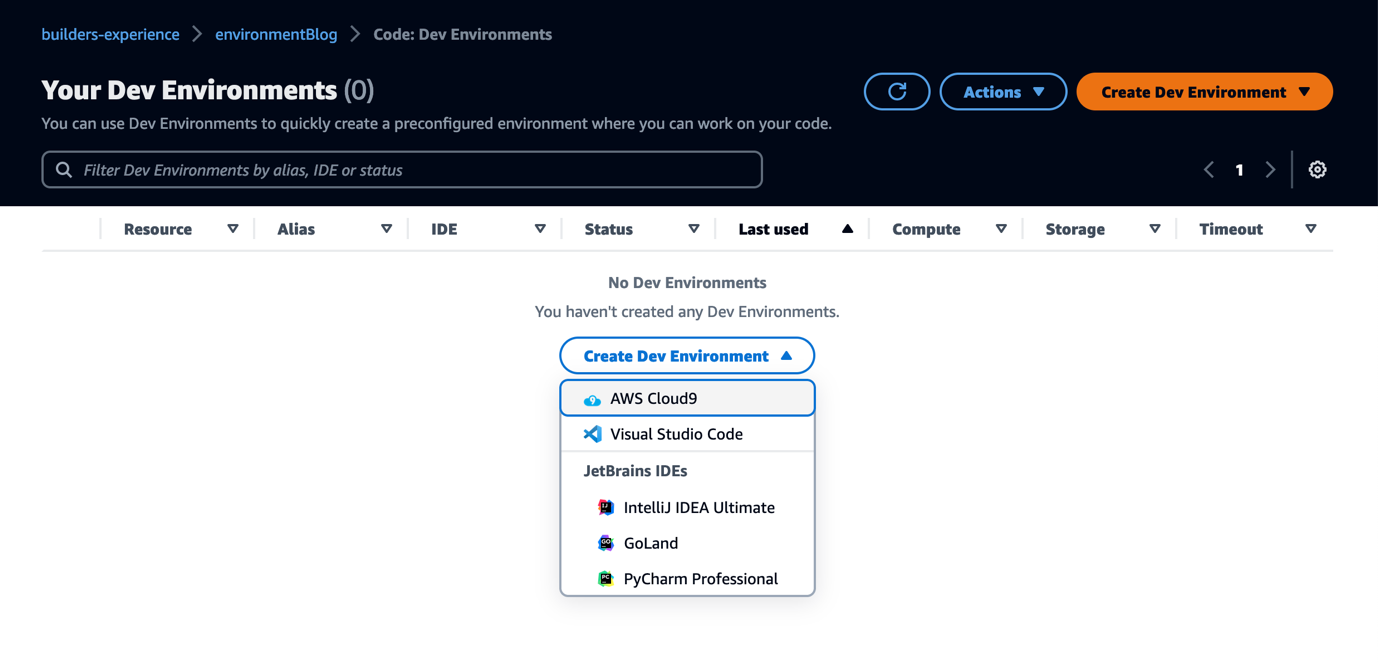
CodeCatalyst user interface showing Create Dev Environment

Figure 1. Creating a new Dev Environment

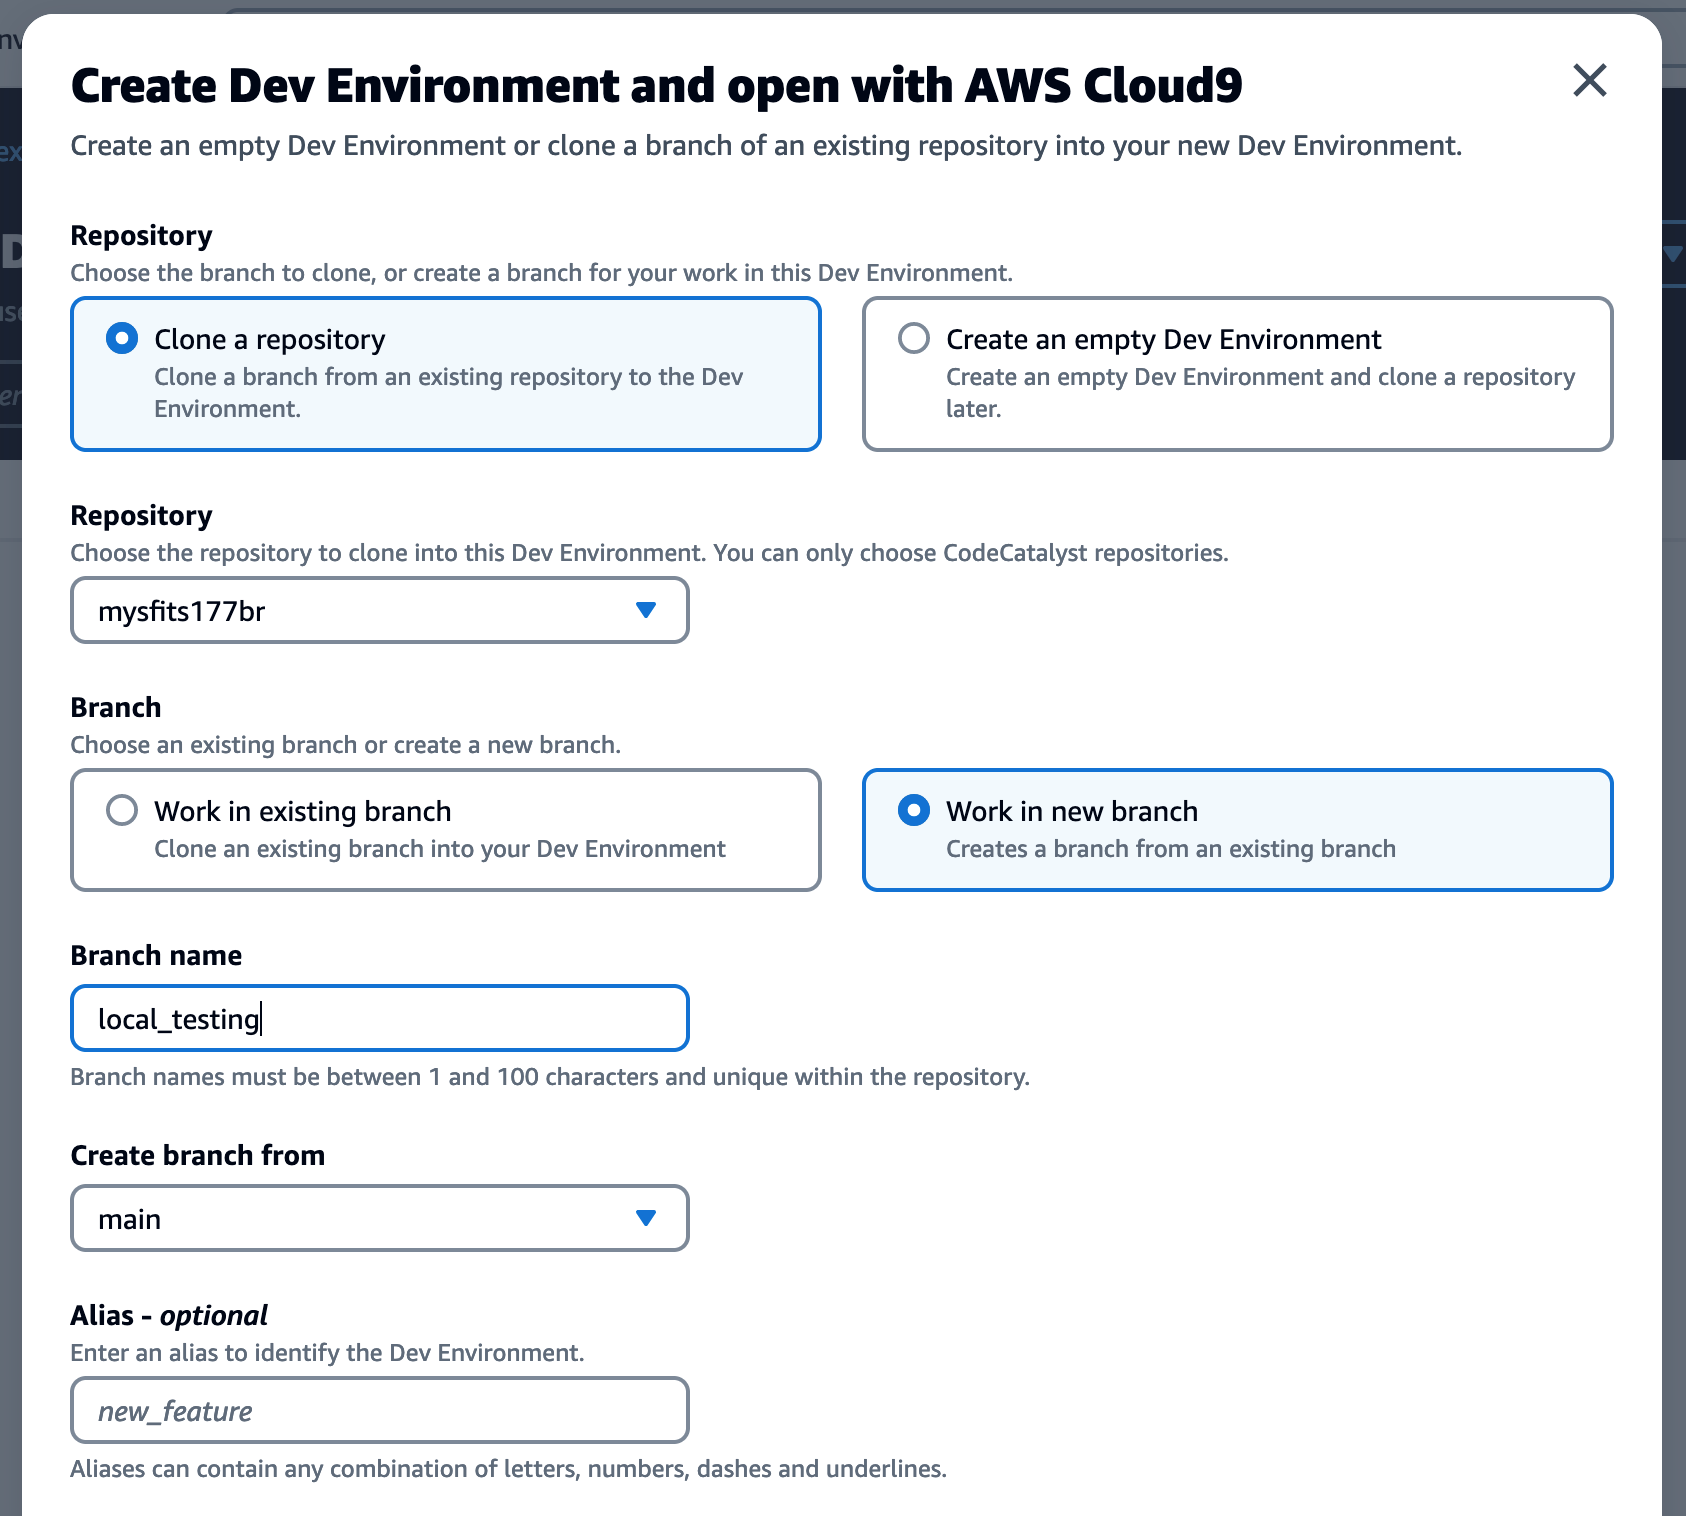
To begin, I navigate to the Dev Environments page under the Code section of the navigaiton menu.  I then use the Create Dev Environment to launch my environment.  For this post, I am using the AWS Cloud9 IDE, but you can follow along with the IDE you are most comfortable using.  In the next screen, I select Work in New Branch and assign local_testing for the new branch name, and I am branching from main.  I leave the remaining default options and Create.

Create Dev Environment user interface with work in a new branch selected

Figure 2. Dev Environment Create Options

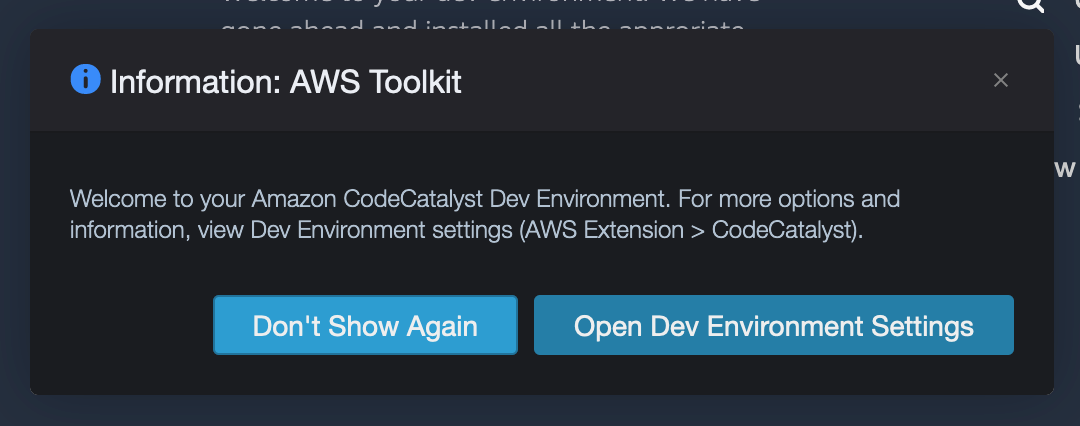
After waiting less than a minute, my IDE is ready in a new tab and I am ready to begin work.  The first thing I see in my dev environment is an information window asking me if I want to navigate to the Dev Environment Settings.  Because I need to enable local testing of Dynamodb, not only for myself, but other developers that will collaborate on this project, I need to update the project’s devfile.  I select to navigate to the settings tab because I know that contains information on the project’s devfile and allows me to access the file to edit.

AWS Toolkit prompting to Open Dev Environment Settings.

Figure 3. Toolkit Welcome Banner

Devfiles allow you to model a Dev Environment’s configuration and dependencies so that you can re-produce consisent Dev Environments and reduce the manual effort in setting up future environments.  The tools and application libraries included in your Dev Environment are defined by the devfile in the source repository of your project.  Since this project was created from a blueprint, there is one provided.  For blank projects, a default CodeCatalyst devfile is created when you first launch an environment.  To learn more about the devfile, see https://devfile.io.

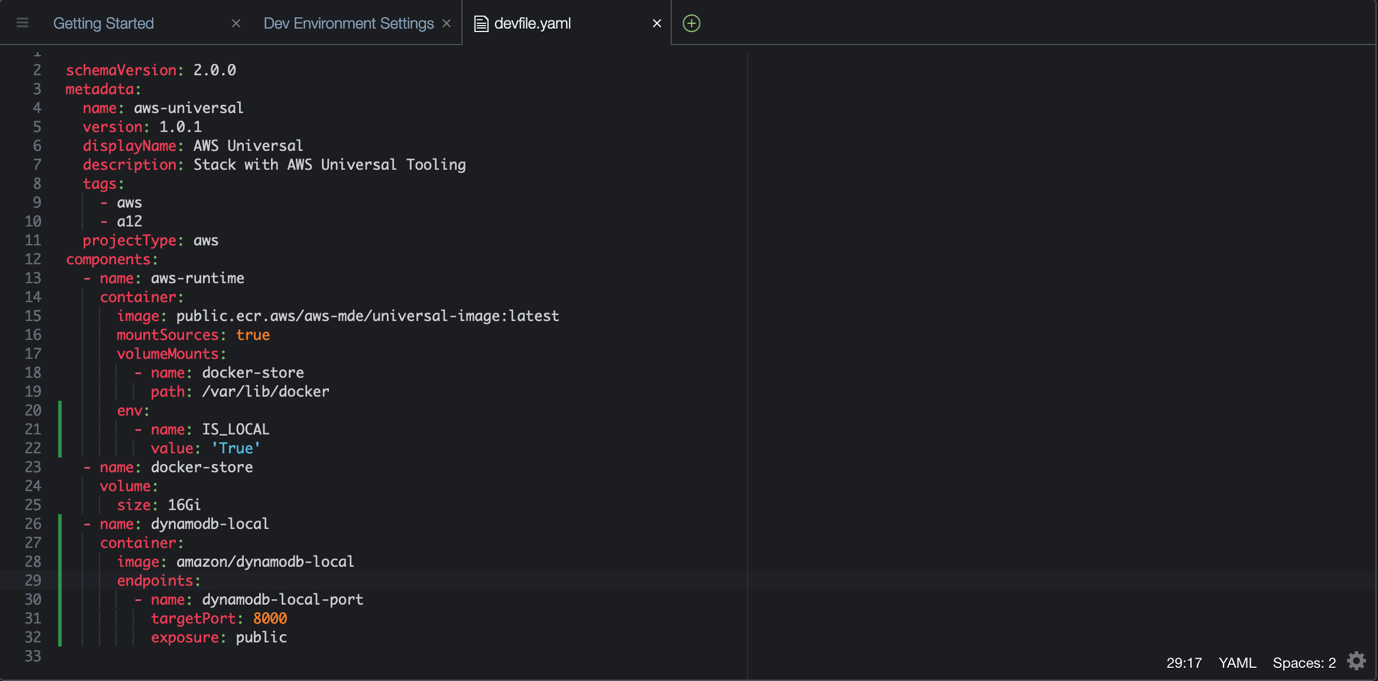
In the settings tab, I find a link to the devfile that is configured.  When I click the edit button, a new file tab launches and I can now make changes.  I first add an env section to the container that hosts our dev environment.  By adding an environment variable and value, anytime a new dev environment is created from this project’s repository, that value will be included.  Next, I add a second container to the dev environment that will run DynamoDB locally.  I can do this by adding a new container component.  I use Amazon’s verified DynamoDB docker image for my environment. Attaching additional images allow you to extend the dev environment and include tools or services that can be made available locally.  My updates are highlighted in the green sections below.

Devfile.yaml with environment variable and DynamoDB container added

Figure 4. Example Devfile

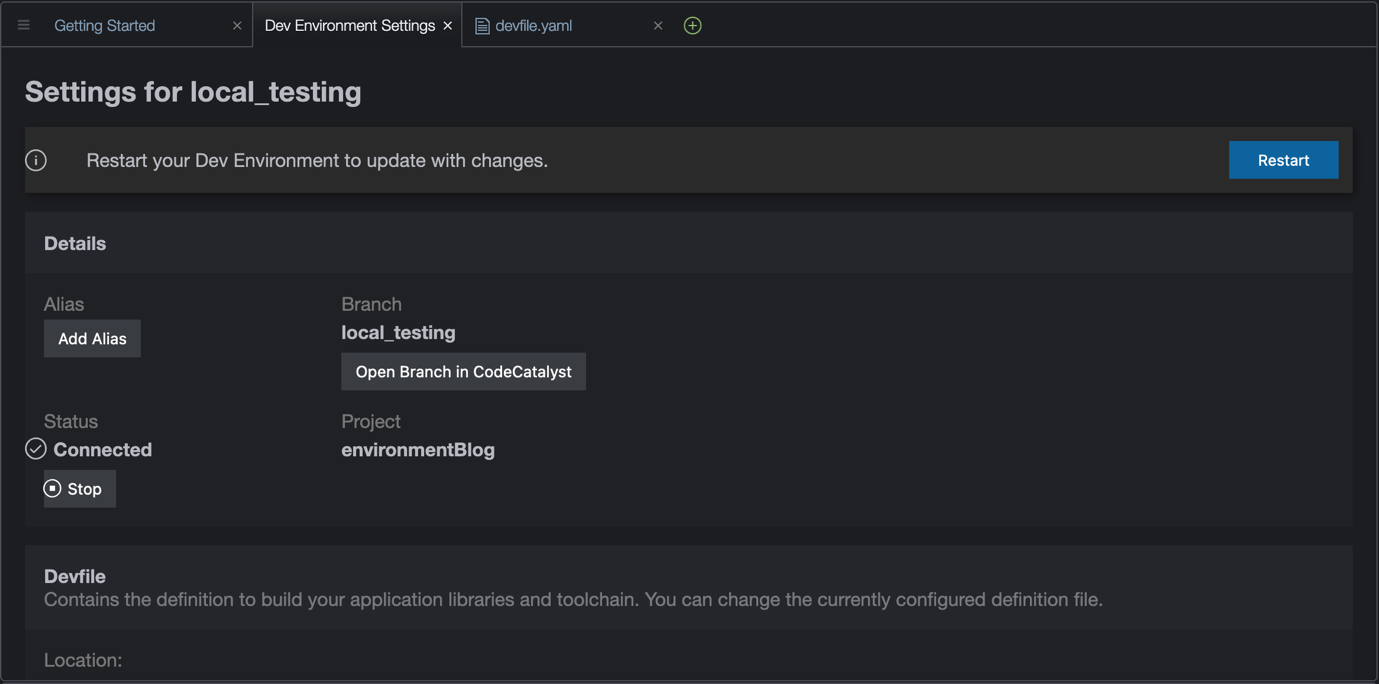
I save my changes and navigate back to the Dev Environment Settings tab. I notice that my changes were automatically detected and I am prompted to restart my development environment for the changes to take effect.  Modifications to the devfile requires a restart. You can restart a dev environment using the toolkit, or from the CodeCatalyst UI.

AWS Toolkit prompt asking to restart the dev environment

Figure 5. Dev Environment Settings

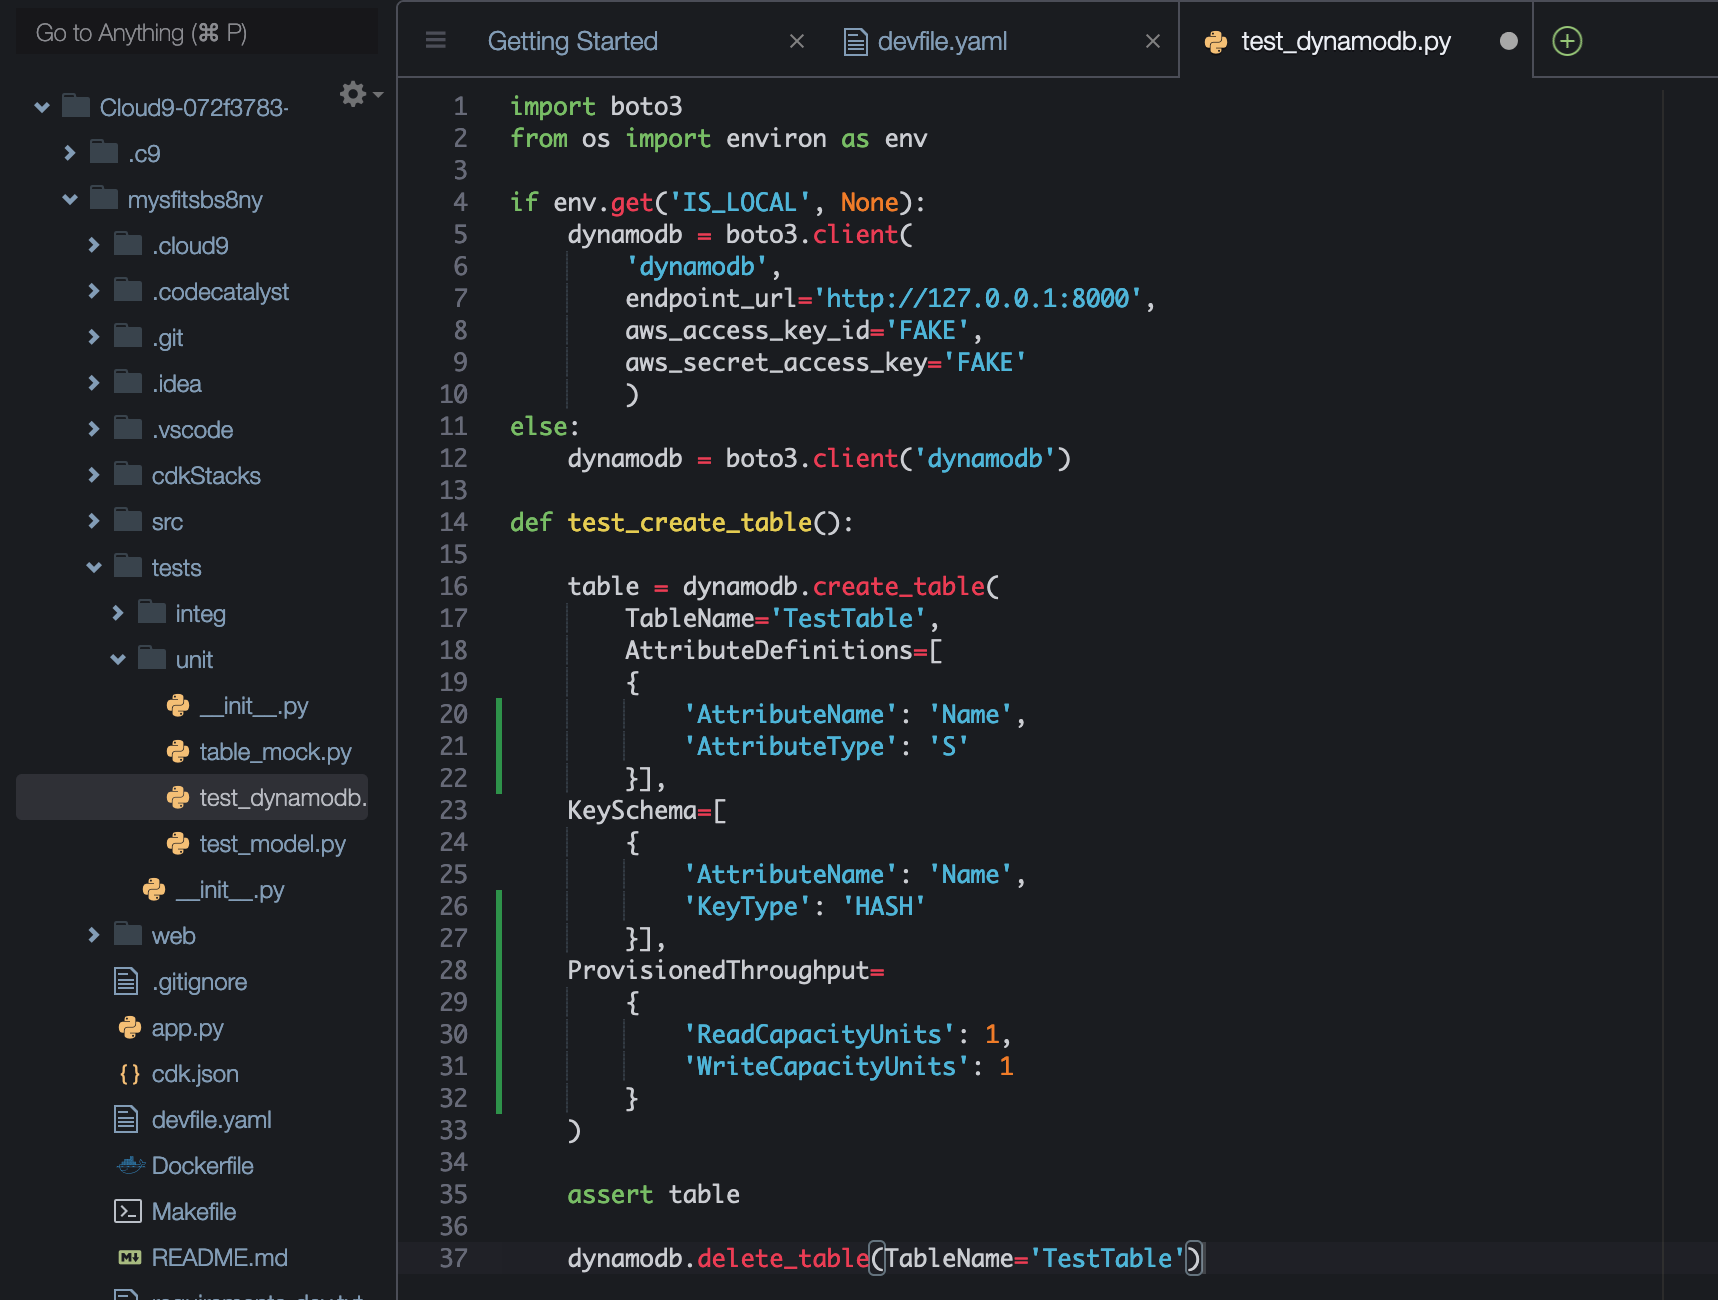
After waiting a few seconds for my dev environment to restart, I am ready to write my test.  I use the IDE’s file explorer, expand the repo’s ./tests/unit folder, and create a new file named test_dynamodb.py.  Using the IS_LOCAL environment variable I configured in the devfile, I can include a conditional in my test that sets the endpoint that Amazon’s python SDK ( Boto3 ) will use to connect to the Dynamodb service.  This way, I can run tests locally before pushing my changes and still have tests complete successfully in my project’s workflow.  My full test file is included below.

Python unit test with local code added

Figure 6. Dynamodb test file

Now that I have completed my changes to the dev environment using the devfile and added a test, I am ready to run my test locally to verify.  I will use pytest to ensure the tests are passing before pushing any changes.  From the repo’s root folder, I run the command pip install -r requirements-dev.txt.  Once my dependencies are installed, I then issue the command pytest -k unit.  All tests pass as I expect.

Result of the pytest shown at the command line

Figure 7. Pytest test results

Rather than manually installing my development dependencies in each environment, I could also use the devfile to include commands and automate the execution of those commands during the dev environment lifecycle events.  You can refer to the links for commands and events for more information.

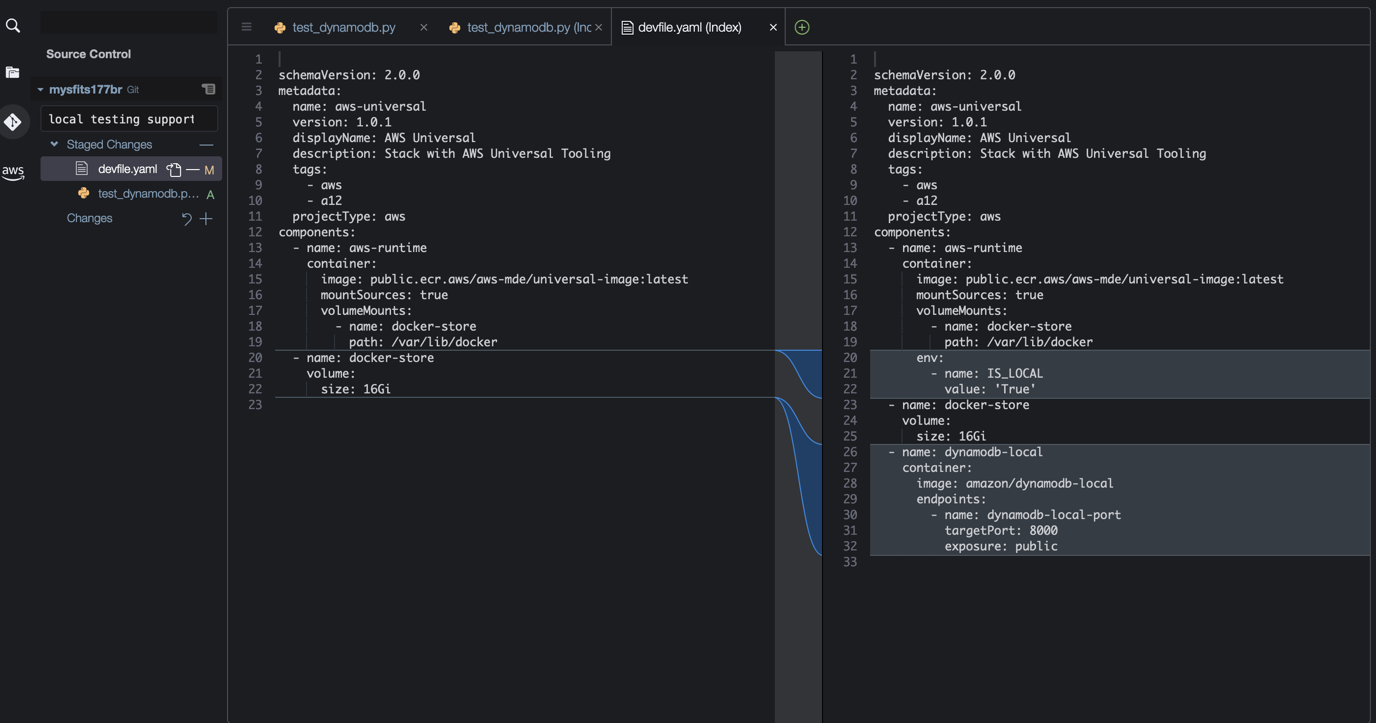
Finally, I am ready to push my changes back to my CodeCatalyst source repository.  I use the git extension of Cloud9 to review my changes.  After reviewing my changes are what I expect, I use the git extension to stage, commit, and push the new test file and the modified devfile so other collaborators can adopt the improvements I made.

Figure 8.  Changes reviewed in CodeCatalyst Cloud9 git extension.

Figure 8.  Changes reviewed in CodeCatalyst Cloud9 git extension.

Cleanup

If you have been following along with this workflow, you  should delete the resources you deployed so you do not continue to incur  charges. First, delete the two stacks that CDK deployed using the AWS CloudFormation console in the AWS account you associated when you launched the blueprint. These stacks will have names like mysfitsXXXXXWebStack and mysfitsXXXXXAppStack. Second, delete the project from CodeCatalyst by navigating to Project settings and choosing Delete project.

Conclusion

In this post, you learned how CodeCatalyst provides configurable on-demand dev environments.  You also learned how devfiles help you define a consistent experience for developing within a CodeCatalyst project.  Please follow our DevOps blog channel as I continue to explore how CodeCatalyst solve Maxine’s and other builders’ challenges.

About the author:

Ryan Bachman

Ryan Bachman is a Sr. Specialist Solutions Architect at AWS, and specializes in working with customers to improve their DevOps practices. Ryan has over 20 years of professional experience as a technologist, and has held roles in many different domains to include development, networking architecture, and technical product management. He is passionate about automation and helping customers increase software development productivity.

Security updates for Monday

Post Syndicated from original https://lwn.net/Articles/920829/

Security updates have been issued by Debian (powerline-gitstatus, tiff, and trafficserver), Fedora (dotnet6.0, firefox, git, kernel, libXpm, rust, sudo, upx, and yarnpkg), Mageia (kernel and kernel-linus), Red Hat (firefox, java-11-openjdk, and sudo), Slackware (mozilla and seamonkey), SUSE (cacti, cacti-spine, samba, and tor), and Ubuntu (firefox, php7.2, php7.4, php8.1, and python-setuptools, setuptools).

No-Fly List Exposed

Post Syndicated from Bruce Schneier original https://www.schneier.com/blog/archives/2023/01/no-fly-list-exposed.html

I can’t remember the last time I thought about the US no-fly list: the list of people so dangerous they should never be allowed to fly on an airplane, yet so innocent that we can’t arrest them. Back when I thought about it a lot, I realized that the TSA’s practice of giving it to every airline meant that it was not well protected, and it certainly ended up in the hands of every major government that wanted it.

The list is back in the news today, having been left exposed on an insecure airline computer. (The airline is CommuteAir, a company so obscure that I’ve never heard of it before.)

This is, of course, the problem with having to give a copy of your secret list to lots of people.

The collective thoughts of the interwebz