What’s Up, Home? – The Relaxing Breeze

Post Syndicated from Janne Pikkarainen original https://blog.zabbix.com/whats-up-home-the-relaxing-breeze/22031/

Can you monitor a home air conditioner with Zabbix? Of course, you can! By day, I am a monitoring tech lead in a global cyber security company. By night, I monitor my home. Welcome to my weekly blog about how I monitor my home with Zabbix & Grafana and do some weird experiments.

At the moment I was writing this blog post, the summer — and thus maybe the heat wave season — was only approaching. For the past two summers, our home has been a hot place to be. Enough is enough, so that day we got an air conditioner. It’s not a very high-end model, but these things currently come with built-in Wi-Fi.

Wouldn’t it be cool to monitor that with Zabbix? Yes.

Wi-Fi, do you read me?

Getting the air conditioner connected to our Wi-Fi was as easy as the manual promised: press the Health button eight times in a row and wait until the air conditioner says “be-be-be-be-be-beep”. Sure enough, that happened, and moments later the AC Freedom app I installed on my iPhone started to show this.

For a normal person, this would be more than enough. For me, this was only the beginning and the next step would be adding the thing to Zabbix.

Encountering headwind

Checking the first things first — no, Zabbix does not seem to support this AC out of the box. No worries, that is not the end of the world, it just slightly slows things down, and also makes things a bit more interesting.

Now that the AC was connected to our Wi-Fi, I first went to check out some data about the AC from the Wi-Fi admin interface. It revealed to me that the device contains network hardware by Broadlink in it. Ah-ha! Search engine, here I come!

Moments later, I found out Broadlink Air Conditioners to Mqtt.

Okay, MQTT it is. That’s a lightweight protocol designed for IoT device communication, and I had absolutely no clue how that worked, as this was the first time I got to use it. It would blow if this step proved to be too cumbersome.

Luckily, thanks to open source and 2022, getting it to run was not that hard.

It’s nearly summer, welcome mosquitos

The aforementioned Broadlink AC to MQTT quickly raised my confidence, as it immediately found my new device. Yes, I can do this!

… that’s nice, but how to use this any further? I could not see any MQTT messages anywhere.

Soon enough I realized I need to install an MQTT message broker to catch the messages and I found Eclipse Mosquitto.

An apt install mosquitto mosquitto-clients and some config file guessing later my jaw dropped, as I saw this:

Wow, that’s a wind-wind situation. It returns sane values! My next step was then to find out if I can somehow access those URL-like paths with Zabbix.

With Zabbix, MQTT is just a breeze

I remembered from some ancient Zabbix Summit that Zabbix 5.x gained Modbus/MQTT support. My Raspberry Pi 4 is running Zabbix 6.0.4, so certainly that part should be covered.

In the end, getting MQTT to run with Zabbix was almost too easy. Zabbix agent 2 has native MQTT support with its mqtt.get active check, so I tried to add an item like this:

And, as this is Zabbix, of course, it works:

Yay! From now on, my home Zabbix can alert me about the AC as well and generate some fancy graphs.

What’s next?

As I’ve got the AC unit recently and this is just the beginning, I still have more things to add later.

  • Add some “Yikes! It’s too hot!” triggers
  • Create a Grafana dashboard
  • Try out if I can adjust the air conditioner settings using Zabbix

Anyway, in the end, this certainly was easier than I expected.

I have been working at Forcepoint since 2014 and monitoring has never been cooler. — Janne Pikkarainen

The post What’s Up, Home? – The Relaxing Breeze appeared first on Zabbix Blog.

Simplifying serverless best practices with AWS Lambda Powertools for TypeScript

Post Syndicated from Julian Wood original https://aws.amazon.com/blogs/compute/simplifying-serverless-best-practices-with-aws-lambda-powertools-for-typescript/

This blog post is written by Sara Gerion, Senior Solutions Architect.

Development teams must have a shared understanding of the workloads they own and their expected behaviors to deliver business value fast and with confidence. The AWS Well-Architected Framework and its Serverless Lens provide architectural best practices for designing and operating reliable, secure, efficient, and cost-effective systems in the AWS Cloud.

Developers should design and configure their workloads to emit information about their internal state and current status. This allows engineering teams to ask arbitrary questions about the health of their systems at any time. For example, emitting metrics, logs, and traces with useful contextual information enables situational awareness and allows developers to filter and select only what they need.

Following such practices reduces the number of bugs, accelerates remediation, and speeds up the application lifecycle into production. They can help mitigate deployment risks, offer more accurate production-readiness assessments and enable more informed decisions to deploy systems and changes.

AWS Lambda Powertools for TypeScript

AWS Lambda Powertools provides a suite of utilities for AWS Lambda functions to ease the adoption of serverless best practices. The AWS Hero Yan Cui’s initial implementation of DAZN Lambda Powertools inspired this idea.

Following the community’s adoption of AWS Lambda Powertools for Python and AWS Lambda Powertools for Java, we are excited to announce the general availability of the AWS Lambda Powertools for TypeScript.

AWS Lambda Powertools for TypeScript provides a suite of utilities for Node.js runtimes, which you can use in both JavaScript and TypeScript code bases. The library follows a modular approach similar to the AWS SDK v3 for JavaScript. Each utility is installed as standalone NPM package.

Today, the library is ready for production use with three observability features: distributed tracing (Tracer), structured logging (Logger), and asynchronous business and application metrics (Metrics).

You can instrument your code with Powertools in three different ways:

  • Manually. It provides the most granular control. It’s the most verbose approach, with the added benefit of no additional dependency and no refactoring to TypeScript Classes.
  • Middy middleware. It is the best choice if your existing code base relies on the Middy middleware engine. Powertools offers compatible Middy middleware to make this integration seamless.
  • Method decorator. Use TypeScript method decorators if you prefer writing your business logic using TypeScript Classes. If you aren’t using Classes, this requires the most significant refactoring.

The examples in this blog post use the Middy approach. To follow the examples, ensure that middy is installed:

npm i @middy/core

Logger

Logger provides an opinionated logger with output structured as JSON. Its key features include:

  • Capturing key fields from the Lambda context, cold starts, and structure logging output as JSON.
  • Logging Lambda invocation events when instructed (disabled by default).
  • Printing all the logs only for a percentage of invocations via log sampling (disabled by default).
  • Appending additional keys to structured logs at any point in time.
  • Providing a custom log formatter (Bring Your Own Formatter) to output logs in a structure compatible with your organization’s Logging RFC.

To install, run:

npm install @aws-lambda-powertools/logger

Usage example:

import { Logger, injectLambdaContext } from '@aws-lambda-powertools/logger';
 import middy from '@middy/core';

 const logger = new Logger({
    logLevel: 'INFO',
    serviceName: 'shopping-cart-api',
});

 const lambdaHandler = async (): Promise<void> => {
     logger.info('This is an INFO log with some context');
 };

 export const handler = middy(lambdaHandler)
     .use(injectLambdaContext(logger));

In Amazon CloudWatch, the structured log emitted by your application looks like:

{
     "cold_start": true,
     "function_arn": "arn:aws:lambda:eu-west-1:123456789012:function:shopping-cart-api-lambda-prod-eu-west-1",
     "function_memory_size": 128,
     "function_request_id": "c6af9ac6-7b61-11e6-9a41-93e812345678",
     "function_name": "shopping-cart-api-lambda-prod-eu-west-1",
     "level": "INFO",
     "message": "This is an INFO log with some context",
     "service": "shopping-cart-api",
     "timestamp": "2021-12-12T21:21:08.921Z",
     "xray_trace_id": "abcdef123456abcdef123456abcdef123456"
 }

Logs generated by Powertools can also be ingested and analyzed by any third-party SaaS vendor that supports JSON.

Tracer

Tracer is an opinionated thin wrapper for AWS X-Ray SDK for Node.js.

Its key features include:

  • Auto-capturing cold start and service name as annotations, and responses or full exceptions as metadata.
  • Automatically tracing HTTP(S) clients and generating segments for each request.
  • Supporting tracing functions via decorators, middleware, and manual instrumentation.
  • Supporting tracing AWS SDK v2 and v3 via AWS X-Ray SDK for Node.js.
  • Auto-disable tracing when not running in the Lambda environment.

To install, run:

npm install @aws-lambda-powertools/tracer

Usage example:

import { Tracer, captureLambdaHandler } from '@aws-lambda-powertools/tracer';
 import middy from '@middy/core'; 

 const tracer = new Tracer({
    serviceName: 'shopping-cart-api'
});

 const lambdaHandler = async (): Promise<void> => {
     /* ... Something happens ... */
 };

 export const handler = middy(lambdaHandler)
     .use(captureLambdaHandler(tracer));
AWS X-Ray segments and subsegments emitted by Powertools

AWS X-Ray segments and subsegments emitted by Powertools

Example service map generated with Powertools

Example service map generated with Powertools

Metrics

Metrics create custom metrics asynchronously by logging metrics to standard output following the Amazon CloudWatch Embedded Metric Format (EMF). These metrics can be visualized through CloudWatch dashboards or used to trigger alerts.

Its key features include:

  • Aggregating up to 100 metrics using a single CloudWatch EMF object (large JSON blob).
  • Validating your metrics against common metric definitions mistakes (for example, metric unit, values, max dimensions, max metrics).
  • Metrics are created asynchronously by the CloudWatch service. You do not need any custom stacks, and there is no impact to Lambda function latency.
  • Creating a one-off metric with different dimensions.

To install, run:

npm install @aws-lambda-powertools/metrics

Usage example:

import { Metrics, MetricUnits, logMetrics } from '@aws-lambda-powertools/metrics';
 import middy from '@middy/core';

 const metrics = new Metrics({
    namespace: 'serverlessAirline', 
    serviceName: 'orders'
});

 const lambdaHandler = async (): Promise<void> => {
     metrics.addMetric('successfulBooking', MetricUnits.Count, 1);
 };

 export const handler = middy(lambdaHandler)
     .use(logMetrics(metrics));

In CloudWatch, the custom metric emitted by your application looks like:

{
     "successfulBooking": 1.0,
     "_aws": {
     "Timestamp": 1592234975665,
     "CloudWatchMetrics": [
         {
         "Namespace": "serverlessAirline",
         "Dimensions": [
             [
             "service"
             ]
         ],
         "Metrics": [
             {
             "Name": "successfulBooking",
             "Unit": "Count"
             }
         ]
     },
     "service": "orders"
 }

Serverless TypeScript demo application

The Serverless TypeScript Demo shows how to use Lambda Powertools for TypeScript. You can find instructions on how to deploy and load test this application in the repository.

Serverless TypeScript Demo architecture

Serverless TypeScript Demo architecture

The code for the Get Products Lambda function shows how to use the utilities. The function is instrumented with Logger, Metrics and Tracer to emit observability data.

// blob/main/src/api/get-products.ts
import { APIGatewayProxyEvent, APIGatewayProxyResult} from "aws-lambda";
import { DynamoDbStore } from "../store/dynamodb/dynamodb-store";
import { ProductStore } from "../store/product-store";
import { logger, tracer, metrics } from "../powertools/utilities"
import middy from "@middy/core";
import { captureLambdaHandler } from '@aws-lambda-powertools/tracer';
import { injectLambdaContext } from '@aws-lambda-powertools/logger';
import { logMetrics, MetricUnits } from '@aws-lambda-powertools/metrics';

const store: ProductStore = new DynamoDbStore();
const lambdaHandler = async (event: APIGatewayProxyEvent): Promise<APIGatewayProxyResult> => {

  logger.appendKeys({
    resource_path: event.requestContext.resourcePath
  });

  try {
    const result = await store.getProducts();

    logger.info('Products retrieved', { details: { products: result } });
    metrics.addMetric('productsRetrieved', MetricUnits.Count, 1);

    return {
      statusCode: 200,
      headers: { "content-type": "application/json" },
      body: `{"products":${JSON.stringify(result)}}`,
    };
  } catch (error) {
      logger.error('Unexpected error occurred while trying to retrieve products', error as Error);

      return {
        statusCode: 500,
        headers: { "content-type": "application/json" },
        body: JSON.stringify(error),
      };
  }
};

const handler = middy(lambdaHandler)
    .use(captureLambdaHandler(tracer))
    .use(logMetrics(metrics, { captureColdStartMetric: true }))
    .use(injectLambdaContext(logger, { clearState: true, logEvent: true }));

export {
  handler
};

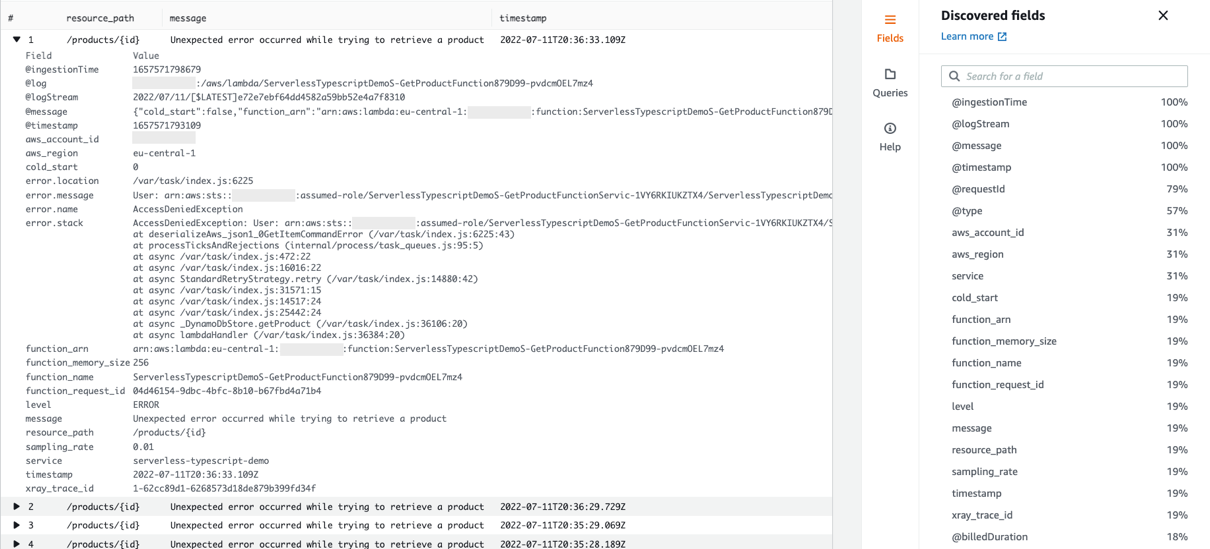
The Logger utility adds useful context to the application logs. Structuring your logs as JSON allows you to search on your structured data using Amazon CloudWatch Logs Insights. This allows you to filter out the information you don’t need.

For example, use the following query to search for any errors for the serverless-typescript-demo service.

fields resource_path, message, timestamp
| filter service = 'serverless-typescript-demo'
| filter level = 'ERROR'
| sort @timestamp desc
| limit 20
CloudWatch Logs Insights showing errors for the serverless-typescript-demo service.

CloudWatch Logs Insights showing errors for the serverless-typescript-demo service.

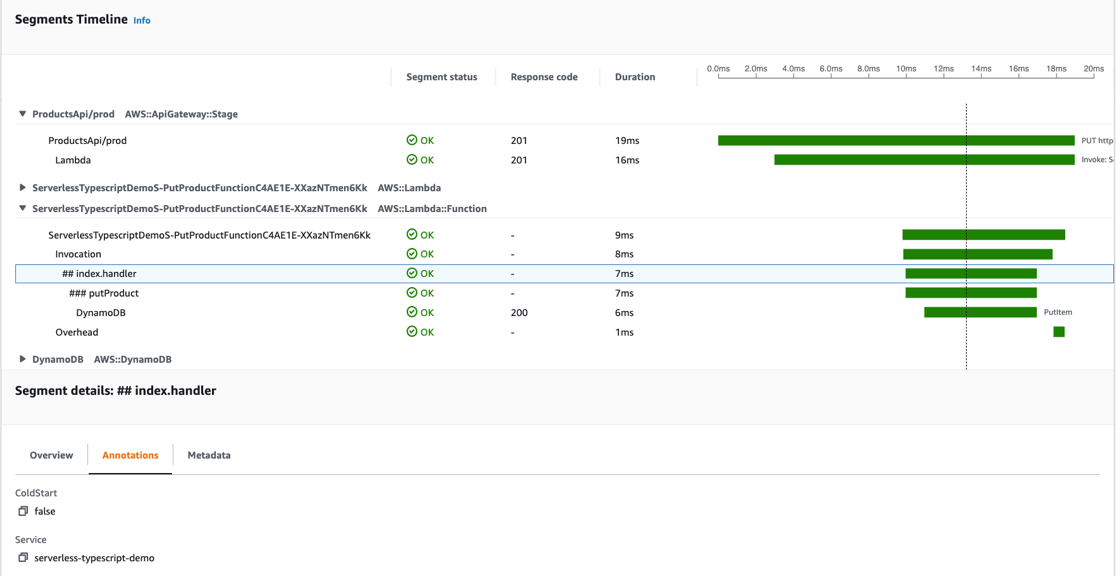
The Tracer utility adds custom annotations and metadata during the function invocation, which it sends to AWS X-Ray. Annotations allow you to search for and filter traces by business or application contextual information such as product ID, or cold start.

You can see the duration of the putProduct method and the ColdStart and Service annotations attached to the Lambda handler function.

putProduct trace view

putProduct trace view

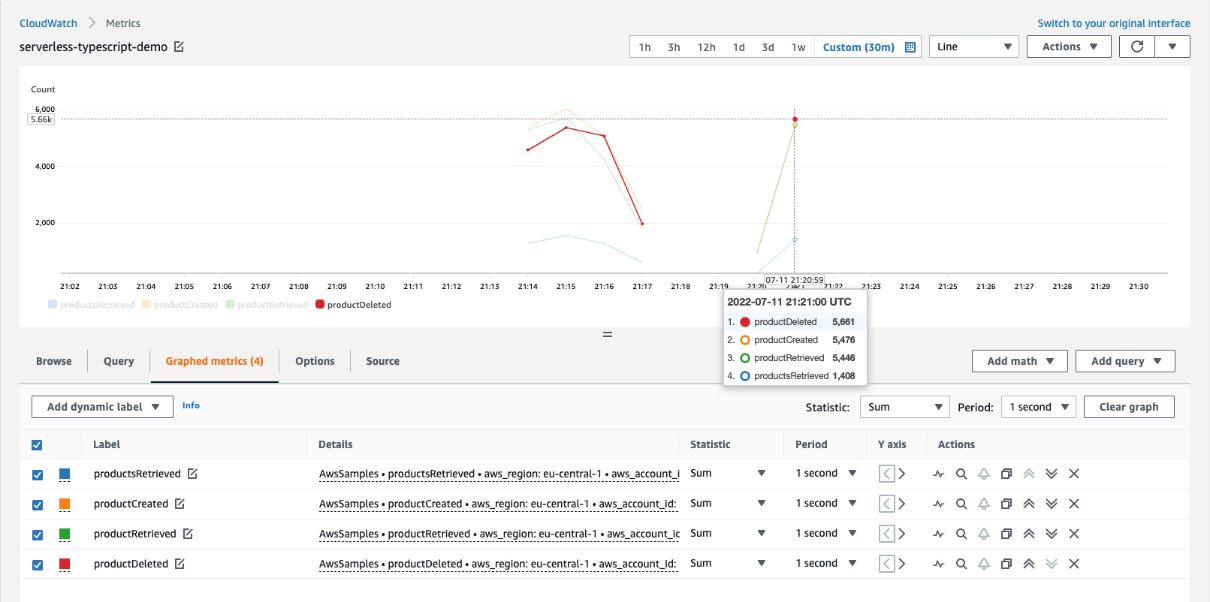
The Metrics utility simplifies the creation of complex high-cardinality application data. Including structured data along with your metrics allows you to search or perform additional analysis when needed.

In this example, you can see how many times per second a product is created, deleted, or queried. You could configure alarms based on the metrics.

Metrics view

Metrics view

Code examples

You can use Powertools with many Infrastructure as Code or deployment tools. The project contains source code and supporting files for serverless applications that you can deploy with the AWS Cloud Development Kit (AWS CDK) or AWS Serverless Application Model (AWS SAM).

The AWS CDK lets you build reliable and scalable applications in the cloud with the expressive power of a programming language, including TypeScript. The AWS SAM CLI is that makes it easier to create and manage serverless applications.

You can use the sample applications provided in the GitHub repository to understand how to use the library quickly and experiment in your own AWS environment.

Conclusion

AWS Lambda Powertools for TypeScript can help simplify, accelerate, and scale the adoption of serverless best practices within your team and across your organization.

The library implements best practices recommended as part of the AWS Well-Architected Framework, without you needing to write much custom code.

Since the library relieves the operational burden needed to implement these functionalities, you can focus on the features that matter the most, shortening the Software Development Life Cycle and reducing the Time To Market.

The library helps both individual developers and engineering teams to standardize their organizational best practices. Utilities are designed to be incrementally adoptable for customers at any stage of their serverless journey, from startup to enterprise.

To get started with AWS Lambda Powertools for TypeScript, see the official documentation. For more serverless learning resources, visit Serverless Land.

Кой държи ключа за второ правителство

Post Syndicated from Емилия Милчева original https://toest.bg/koy-durzhi-klyucha-za-vtoro-pravitelstvo/

Правителство за няколко месеца или избори през октомври? Ключът е в „Продължаваме промяната“, чието ръководство все още не е обявило дали ще склони на кабинет със същите политически сили, в който премиерът да е „техен“, но да не се казва Кирил Петков или Асен Василев. Последното е трудно за преглъщане от самолюбивите съпредседатели на ПП. А и ръководството на формацията се уповава на социологически проучвания и на самочувствието си, че на избори през октомври ще спечели достатъчно, за да наложи когото си иска за министър-председател.

Асен Василев е особено убеден в това и е критичен към партньорите в коалицията (както личи от интервюто му пред „Капитал“), докато Петков показва склонност към диалогичност. „Ние сме тук да заявим цялостната ни готовност да бъдем максимално диалогични и да направим всичко възможно да има България работещ парламент и работещо правителство“, заяви премиерът в оставка консултациите, свикани от президента Румен Радев, преди да връчи третия мандат.

Останалите трима партньори в създадената през декември м.г. коалиция декларираха готовност да седнат и да преговарят за поправителен, за реконструкция, или както и да се нарече повторният опит за управление с лимитирано време и списък със задачи на база приетата наскоро съвместна управленска програма. Само ПП обаче публично постави условие за участието си, даже две.

Един срещу друг

Тази седмица заместник-председателят на парламента Мирослав Иванов заяви, че от ПП са готови да обсъдят как може да се работи заедно занапред, но това би станало при спазване на програмата им и с кандидат-премиер Асен Василев. После – и още нещо. Ако третият, последен мандат, който президентът Румен Радев предстои да връчи, отиде при „Има такъв народ“, „Продължаваме промяната“ ще откаже да преговаря за съставяне на правителство. „Бихме подкрепили разговори с БСП и „Дeмократична България“ около програмата, която съставихме. Ако мандатът отиде при ИТН, ние сме обявили, че не бихме преговаряли с тях, тъй като те развалиха настоящата коалиция“, заяви пред журналисти в парламента председателят на парламентарната група на ПП Андрей Гюров.

Враждата между двете политически сили, избухнала с разкритията за канадското гражданство на Кирил Петков и блокирането на Любомир Каримански, номинацията на ИТН за управител на БНБ и екзалтирала с изтеглянето на ИТН от коалицията, няма да стихне. Опцията за второ правителство на 47-мия парламент е да се превърне в „исторически компромис“.

От партията на Слави Трифонов, на която социолозите отреждат изпадане от следващ парламент, показват склонност към диалогичност, смятат изборите за краен вариант и демонстрират пилигримска вяра в мъдростта на президента. „След като знаехме какво ще се случи с втория мандат, логично е президентът да постъпи мъдро и всички да направим всичко възможно, за да се сформира правителство и българското общество да е удовлетворено“, казва Станислав Балабанов от ИТН. Помирителната им теза е да седнат и да говорят „първо по политики“ – макар че дадоха своя принос както за разтурянето на коалицията, така и за провала на първия мандат, тъй като отказаха да подкрепят кабинет с премиер Асен Василев. Балабанов също така изтъкна прекрасното разбирателство на ИТН с БСП и ДБ, „както и с много колеги от ПП“.

Миротворците

За третия мандат основните конкуренти са БСП и „Демократична България“, тъй като ИТН са… да кажем, етично компрометирани (не само заради провалите на двата си проектокабинета миналото лято). ДПС и „Възраждане“ не влизат в сметката, те също като ГЕРБ обявиха курс към избори. Лидерът на ДПС Мустафа Карадайъ дори коментира пред журналисти, че новият модел е „моделът на задкулисието и олигархията“, който реди кабинет по молове и джипки.

Президентът съобщи, че ще назове победителя след консултациите, на които са поканени всички парламентарно представени партии. Тази политическа хореография е съвсем уместна – от една страна, Румен Радев печели добавена стойност като стожер на стабилността и диалогичността, като извор на сигурност, от друга, дори да е решил, а най-вероятно е така, кому да връчи мандата, консултациите ще придадат тежест на решението.

Според съпредседателя на ДБ Христо Иванов третият мандат е кризисен, но целта е да бъде съставено „работещо реформаторско правителство“ от четиримата досегашни партньори, а ПП да имат водеща роля при договарянето на премиер. Хоризонтът на този проектокабинет е до 1 януари 2024 г., за да бъде гарантирано членството на България в еврозоната и влизането в Шенген. Наред с това предупреди да не се създават твърде високи очаквания.

„Ще направим усилия да говорим с всички, има потенциал“, заяви в предаването „Лице в лице“ по bTV лидерката на БСП Корнелия Нинова. От известно време тя не спира да изтъква колко добър медиатор биха били социалистите, повтори го и в предаването в четвъртък. Няколко часа преди това депутатът от парламентарната група на БСП Борислав Гуцанов заяви в кулоарите на парламента, че бъдещият премиер на бъдещия кабинет трябва да е от най-голямата политическа сила, сиреч от „Продължаваме промяната“.

Независимите депутати – групата, отцепила се от ИТН, за да подкрепи ПП – няма да подпомогнат правителство с третия мандат. Ревнуват от доскорошните си съпартийци. „Ние не считаме, че ИТН са способни да участват и да формират правителство, което е стабилно“, каза депутатът Георги Георгиев по „Нова Нюз“, като отбеляза също колко е важно кои ще са министрите. Изглежда, че след като последваха зова на сърцето и направиха моралния си избор, очакват наградите.

Каквото и да се случи следващата седмица, надеждите за ново правителство не са никак големи. От БСП вече заявиха, че ще настояват за нови преговори за доставки на руски газ. Газовият проблем трябва да намери решение още преди да се знае името на премиера – защото може да се окаже, че изобщо няма да се стигне до номинацията му.

Заглавна снимка: Лидерите на „Продължаваме промяната“ на консултации при Румен Радев на 15 юли 2022 г. Стопкадър от видеоизлъчване на Facebook страницата на президента

Източник

Отново за журналистическия мързел. И за обществения интерес 

Post Syndicated from Светла Енчева original https://toest.bg/otnovo-za-zhurnalisticheskiya-murzel/

Стара лада, преустроена в космически кораб, който ползва ябълкова ракия за гориво. Първоначално корабът отказва да запали, но след побутване от неколцина здравеняци гордо излетява… за да експлодира секунди по-късно, едва в началото на пътя си към Космоса. Двамата пишман астронавти, паднали на родна земя посърнали и оцапани със сажди, но живи и здрави, си споделят един джойнт за утешение.

Автомобил, каращ с висока скорост, минава на червено, блъска друга кола, после се удря в асансьора на метростанция с такава сила, че се разцепва на две. Едната половина (според една от версиите – предната) помита две пешеходки, причинявайки смъртта им. Шофьорът и спътничката му обаче, съвсем невредими, бягат от местопрестъплението. Спътничката осигурява на шофьора стълба, по която той да се изкатери до дома си и да влезе през прозореца.

И в двата случая оцеляването на пътуващите си е цяло чудо.

Ако превозно средство, особено пък летящо, избухне, трудно можем да си представим как хората в него може да оцелеят. Ако автомобил се блъсне с такава сила, че се разцепи на две, не изглежда много вероятно пътниците в него да се отърват невредими, че и водачът след това да е в състояние да се катери по стълба. В първия случай обаче става въпрос за сюжета на клип към песен на босненската група „Дубиоза колектив“, ерго за художествена измислица. А във втория – не за екшън филм, а за реална катастрофа насред София.

Въпреки това медиите не задават въпроси за правдоподобността на изнесената от институциите информация, върху която се градят интерпретациите на катастрофите. Далеч по-интересна се оказва личността на заподозрения Георги Семерджиев. С петдесетина пътни нарушения и повече отнети контролни точки, отколкото има в един талон. От 2005 г. е с отнета книжка и макар да е хващан, не е подведен под отговорност – оказва се, съвсем законно. Но пък не е арестуван и когато е трябвало, включително броени дни преди катастрофата, когато е спрян и тестван с положителен резултат за употреба на наркотични вещества.

Също така е замесен в търговия с наркотици и във футболни агитки, смята се, че е бил и защитен свидетел. Но пък поддържа близки връзки с полицията. А след изказване на вътрешния министър Бойко Рашков възникват интерпретации, че с полицейската служителка Симона Радева, смятана за негова спътничка, отношенията му са от интимно естество. Накратко –

Георги Семерджиев е перфектният пример за сраснатостта на полицията и прокуратурата с престъпния свят.

Доказва ли това обаче, че именно той е причинил катастрофата на бул. „Черни връх“? Този въпрос задава – за срам на журналистическото съсловие, включително на авторката на настоящата статия – не някой разследващ журналист, а рекламистът Мартин Димитров. Той упреква „лесната, удобна и мързелива журналистика“, която ретранслира твърдения на властимащи и прессъобщения на официални институции, вместо сама да търси информация, с помощта на която да установи истината.

Защото, припомня Мартин Димитров, работата на журналистиката не е да възхвалява, да обвинява или да внушава, а да търси истината. Ако го преведем на журналистически език – да информира. А това става, ако подлагаш на съмнение и проверяваш информацията, която дават наготово. Например: прегледани ли са Семерджиев и Радева след катастрофата? Имат ли наранявания и изобщо има ли някакви следи, че са били в колата? Интервюирани ли са автомобилни експерти, които да кажат каква е вероятността при толкова силен удар шофьорът и спътницата му да останат невредими?

И така, какво знаем дотук със сигурност, освен описаното по-горе, и какво – не?

Знаем, че късно вечерта на 5 юли е станала катастрофа на кръстовището на булевардите „Черни връх“ и „Арсеналски“. Починали са две млади жени – Христина Дилева и Хариет Стефанович. От момента на катастрофата има не особено ясно видео, а от огледа на мястото – снимки, които също не казват много. Знаем, че автомобилът с фалшиви германски номера по принцип се е карал от Георги Семерджиев; той е засичан да шофира с бясна скорост няколко пъти в навечерието на катастрофата. Самият Семерджиев, по думите на брат му и по данни от бивши провинения, обича високите скорости. Освен това няма скрупули да шофира под въздействието на наркотици.

Не знаем обаче какво е било състоянието на заподозрения и предполагаемата му спътница след катастрофата. Според разследващите в автомобила са останали ключовете му, както и едната обувка. Има запис на бягащ мъж след катастрофата, за когото се твърди, че е Семерджиев. Твърди се, че съществува и запис как Симона Радева и двама служители от 4-то РПУ носят стълба на бившия футболист, но този запис, за разлика от кадрите с бягащия мъж, засега не е публикуван. Не знаем и какви са били действителните отношения между Семерджиев и Радева.

Не знаем и дали, ако той е шофирал в момента на катастрофата, е бил под въздействието на наркотици. Кръвната му проба е взета две денонощия след това и е трудно да се прецени със сигурност дали ако в нея има следи от наркотици, те са взети преди, или след трагичното събитие. До редакционното приключване на тази статия резултатите от теста все още не са оповестени. Знаем, че и Семерджиев, и Радева отричат да са отговорни. Заподозреният твърди, че към момента на катастрофата е бил отвлечен. Това не звучи особено правдоподобно, но

все пак си струва да се провери дали е възможно да не е шофирал по време на катастрофата.

Вместо това силовите институции предлагат поредната „дъвка“ за отвличане на вниманието на медиите – акция срещу шофьори, каращи под въздействието на алкохол и наркотици. А онези, за които връзката на институциите с престъпния свят е все пак по-важна от показните акции, преобладаващо се ограничават с личността на Семерджиев, сексистки коментари по адрес на Симона Радева и възмущение от полицаите, носещи стълба на заподозрения.

Обвързаността на полицията и прокуратурата с престъпния свят е достатъчно сериозен проблем, в който да се задълбочат разследващите журналисти. Защото осветляването ѝ е от обществен интерес. Така както читавите медии бързо се усетиха, че тази работа с „петорната експертиза“, „доказваща“, че снимките с пачките и кюлчетата от шкафчето на Бойко Борисов са фалшиви, е като в стария виц – не били компютри, а компоти. Осветляването на тази зависимост обаче не следва да става за сметка на проверката на фактите около обвинението. Възможно е действително извършителят на катастрофата да е заподозреният Семерджиев, а за повдигнатите тук въпроси да има логични обяснения.

Презумпцията за невиновност също е от обществен интерес.

Ако всички предпоставяме, че щом някой е обвиняем, значи е виновен (както впрочем обича да прави главният прокурор Иван Гешев), няма да има на какво да се надяваме, ако един ден несправедливо обвинят нас.

Впрочем има още една предпоставка освен типичния за публичната ни среда журналистически мързел. И тя е, че вече три поредни правителства (двете служебни и настоящото, което е в оставка) на практика вършат голяма част от работата на медиите, разкривайки нередности, злоупотреби и престъпления, вършени от публични институции.

Ала всяка власт си има интереси, колкото и потресаващи факти да огласява. Освен това съществува класифицирана информация, така че не можем да очакваме правителството в оставка да ни поднесе на тепсия кои са „четирихилядниците“, нито с какво точно са се занимавали 70-те изгонени служители на Руското посолство. И МВР няма да ни каже подробности около катастрофата на „Черни връх“, които евентуално иска да потули. Осветляването на такива факти е журналистическа задача. Само когато не се оставя на инерцията, журналистиката може да работи в обществен интерес.

Заглавна снимка: Стопкадър от видеообзор на Actualno.com

Източник

Tighten your package security with CodeArtifact Package Origin Control toolkit

Post Syndicated from Davide Semenzin original https://aws.amazon.com/blogs/devops/tighten-your-package-security-with-codeartifact-package-origin-control-toolkit/

Introduction

AWS CodeArtifact is a fully managed artifact repository service that makes it easy for organizations to securely store and share software packages used for application development. On Jul14 2022 we introduced a new feature called Package Origin Controls which allows customers to protect themselves against “dependency substitution“ or “dependency confusion” attacks.

This class of supply chain attacks can be carried out when an attacker with knowledge of an organization’s internally published package names (for example: Sample-Package=1.0.0) is able to publish such name(s) in a public repository. Package managers contain dependency resolution logic that pulls the latest version of a package. The attacker abuses this logic by publishing a high version number of a package with the same name as the organization’s package (for example: Sample-Package=99.0.0). The package manager then would resolve any requests for that package by pulling the attacker’s package version with malicious code instead of the internally published dependency.

In order for this type of attack to be successful, the organization must source their package versions from both internal and remote repositories at the same time. For example, your pip installation could be configured with multiple package indexes, both internal and external; or, as a CodeArtifact user you may have both the repository containing your private packages as well as an external connection to PyPI in the upstream graph of your current repository. In either case, the package manager is able to obtain package versions from more than one source. This causes the package manager to resolve the higher version number from the remote repository, instead of the trusted internal version.

A few strategies can be used to mitigate this kind of mixing: a simple one is to instruct the package manager to only source from an internal repository. While effective, this is often not practical, because it either significantly degrades developer experience or requires a lot of effort in order to set up, maintain, and vet external dependencies. Another mitigation consists in using explicit version pinning, which is also effective, though it might re-introduce the dependency substitution risk upon dependency upgrade without manual vetting. Some package managers also support namespaces or other types of dependency scoping, which are also helpful in preventing this class of attacks, but when available may not always actionable for existing packages due to the large amount of work required to do the renaming.

CodeArtifact is adding another tool to strengthen your software supply chain by introducing per-package per-repository controls which allow you to more precisely configure and control how package versions are sourced. For each package in your repository, you are now able to decide whether to allow or block sourcing versions from both upstream sources and direct publishing. These flags enable you to prevent mixed versions scenarios for all the types of packages supported by CodeArtifact without the need for additional package manager configuration.
While packages retained or published after the launch of this feature come with tighter-by-default origin configurations, in keeping with the principle of least astonishment we decided not to apply any of these policies retroactively. Therefore, your existing packages in CodeArtifact will not have their origin configuration changed and your setup will continue to work continue to work as it did before the feature was released.

Should you want to leverage this feature to tighten the security posture of your existing packages, we are releasing a toolkit to make it easier to bulk-set policy values in your repositories. This blog post describes how to use it.

Solution overview

The purpose of the Package Origin Control toolkit is to provide repository administrators with an easy way to set Origin Control policies in bulk on packages that have not received the default protection because they pre-date feature release. This can be achieved by blocking upstream versions for internal packages. In this blog post we will focus on this use-case, though the toolkit does support blocking publishing package versions to avoid a potentially vulnerable mixed state for external packages as well.

The toolkit is comprised of two scripts: a first one called generate_package_configurations.py for creating a manifest file listing the packages in a domain alongside their proposed origin configuration to apply, and a second one named apply_package_configurations.py, that reads the manifest file and applies the configuration within.

generate_package_configurations.py can operate on a whole repository, or on a subset of packages (specified either via filters, or though a list) and supports two origin control resolution modes:

  • A manual one where you supply the origin configuration you would like to set for all packages in scope. This is a good option if, for instance, you already maintain a list of internal packages, or if they are published in a consistent internal namespace which allows for them to be easily selected.
  • An automated one, which tries to identify what packages should have their upstreams blocked by analyzing the upstream repository graph and external connections, looking for evidence that package versions are only available from the repository at hand- in which case it determines it can disable sourcing of upstream versions can be done without risk of breaking builds. This is a good option if you want a quick way to tighten your security posture without having to manually analyze your whole repository.

With the manifest created, apply_package_configurations.py takes it as an input and effects the changes specified in it by calling the new PutPackageOriginConfiguration API (link). Precisely because it is meant to set these values in bulk, this script supports backup and revert operations by default, as well as dry-run and step-by-step confirmation options. If you identify an issue after applying origin control changes, you will be able to safely revert to the original, working configuration before trying again.

In this blog post we will cover how to use these tools:

  • To block package versions from upstream sources for all recommended packages in a repository
  • To block upstreams for a list of packages you already have
  • To revert to the original state in case of an incorrect configuration push

Prerequisites

The following prerequisites are required before you begin:

  1. Set up the Package Origin Control toolkit as described in the README on GitHub. You will need a working installation of Python 3.6 or later as well as the ability to install dependencies like the Python AWS SDK. The AWS CLI is not required.
  2. Write permissions on the CodeArtifact repository where you want to add package origin controls (see this link for additional info.)

Procedures

To block package versions from upstream sources for all recommended packages in a repository

Introduction

This procedure should be considered if you have a CodeArtifact repository with a variety of package formats and upstreams, and you want to have the toolkit automatically resolve what packages are safe to block upstreams for. It will block acquisition of new versions from upstreams only if two conditions are met:

  • the target repository doesn’t have access to an external connection
  • no versions of the package are available via any of its upstream repositories (either because the target repository itself doesn’t have any upstreams or because none of the upstreams have the package).

Therefore, we assume there isn’t an immediate External Connection attached to the target repository for the package format(s) you are trying to run this script against (because in that case the script would fall back on leaving things as-is for all packages).

Steps

  1. Make sure you have completed the required prerequisites described above
  2. Identify the target repository in your domain you want to automatically apply origin controls for, e.g. myrepo
  3. Identify the query parameters that define the list of packages you want to target. The script supports the same filters as the ListPackagesAPI.
    1. To match all packages in a repo, run :  python generate_package_configurations.py --region us-west-2 --domain mydomain --repository myrepo
      Please note that you always need to specify the AWS region and CodeArtifact domain alongside the repository.
    2. To match only some packages in a repo, for example only Python packages whose name begins with “internal_software_”:  python generate_package_configurations.py --region us-west-2 --domain mydomain --repository myrepo --format pypi --prefix internal_software_*
  4. If necessary, you can review the produced manifest file, which you will be able to find in the same folder under the name origin-configuration_mydomain_myrepo.csv (unless you have specified a different filename and path via the --output-file option)
  5. If the manifest file looks correct, you can apply the changes by calling the second stage: python apply_package_configurations.py --region us-west-2 --domain mydomain --repository myrepo --input origin-configuration_mydomain_myrepo.csv

To block package versions from upstream sources for all packages in a repository matching a list you maintain

Introduction

This procedure should be considered if you have a set of packages within your repository you know you want to apply origin control restrictions to. Rather than relying on a query, you can use such a list as an input to create a manifest.

Steps

Create a file containing a list of package names (and package names only). Multiple namespaces and formats are not supported and you will need to re-run this procedure for each. The expected file format is one package name per line. In this example we will want to block upstreams for three packages of the npm format (format is always mandatory when specifying a list of packages). As an example, a small input file is going to look something like this:

requests
numpy
django

(more information about this option can be found in the README)

Generate the manifest by supplying this file to the first stage, alongside the desired origin control configuration. In this case, we want to block upstreams for all packages in the supplied list (for more information about the origin control configuration string, consult the documentation): python generate_package_configurations.py --region us-west-2 --domain mydomain --repository myrepo --format npm --from-list inputfile.csv --set-restrictions publish=ALLOW,upstream=BLOCK

If necessary, you can review the produced manifest file, which you will be able to find in the same folder under the name origin-configuration_mydomain_myrepo.csv (unless you have specified a different filename and path via the –output-file option)

Run the apply_package_configurations.py script to update the package origin controls in your repository: apply_package_configurations.py --region us-west-2 --domain mydomain --repository myrepo --input origin-configuration_mydomain_myrepo.csv

To revert to the original state in case of an incorrect configuration push

Introduction

Erroneously bulk-changing your origin configuration can lead to broken builds and confusing failure modes for developers. To mitigate this risk, the toolkit backs up the existing configuration before making any changes and lets you easily revert them if need be.

Steps

Identify the manifest containing the configuration you want to revert. The toolkit automatically creates a backup file t for every input manifest you provide. This is the file produced by the first stage, which by default takes a name like origin-configuration_[domain]_[repository], for example origin-configuration_mydomain_myrepo.csv
Run the second stage script in restore mode:  python apply_package_configurations.py --region us-west-2 --domain mydomain --repository myrepo --input origin-configuration_mydomain_myrepo.csv --restore

Conclusion

In this blog post we have explained how to use the Origin Control toolkit to improve package security, focusing on restricting upstream package versions. We have demonstrated both an automated repository-wide application of the toolkit, which tries to minimize the amount of repository administrator work by applying a restriction heuristic, as well as a manual mode where a repository administrator can effect fine-grained origin control changes. Finally, we showed how these changes can be reverted using the built-in backup feature.

Author:

Davide Semenzin

Davide is a Software Development Engineer on the CodeArtifact team at Amazon Web Services (AWS). Previously he has worked at the Internet Archive building the infrastructure to digitize a million books per year. His interests are distributed systems, platform engineering and mission-critical high availability software. In his free time he likes to read books, fly airplanes, fly on airplanes, think about rockets and play with lasers.

Tunney: Porting OpenBSD pledge() to Linux

Post Syndicated from original https://lwn.net/Articles/901264/

Justine Tunney has created an
implementation of the OpenBSD pledge() system call
for Linux.

OpenBSD limits security to a small pond, but makes it easy. Linux
is a big tent, but makes it impossibly hard. SECCOMP BPF might as
well be the Traditional Chinese of programming languages, since
only a small number of people who’ve devoted the oodles of time it
takes to understand code like what you see above have actually been
able to benefit from it.

The US military wants to understand the most important software on Earth (MIT Technology Review)

Post Syndicated from original https://lwn.net/Articles/901254/

The MIT Technology Review has posted an
article
on a program within the US Defense Advanced Research Projects
Agency to identify threats to open-source code.

The ultimate goal is to detect and counteract any malicious
campaigns to submit flawed code, launch influence operations,
sabotage development, or even take control of open-source projects.
To do this, the researchers will use tools such as sentiment
analysis to analyze the social interactions within open-source
communities such as the Linux kernel mailing list, which should
help identify who is being positive or constructive and who is
being negative and destructive.

How the James Webb Telescope’s cosmic pictures impacted the Internet

Post Syndicated from João Tomé original https://blog.cloudflare.com/how-the-james-webb-telescopes-cosmic-pictures-impacted-the-internet/

How the James Webb Telescope's cosmic pictures impacted the Internet
The James Webb Telescope reveals emerging stellar nurseries and individual stars in the Carina Nebula that were previously obscured. Credits: NASA, ESA, CSA, and STScI. Full image here.

“Somewhere, something incredible is waiting to be known.” — Carl Sagan

How the James Webb Telescope's cosmic pictures impacted the Internet

In the past few years, space technology and travel have been trending with increased  attention and endeavors (including private ones). In our 2021 Year in Review we showed how NASA and SpaceX flew higher, at least in terms of interest on the Internet.

This week, NASA in collaboration with the European Space Agency (ESA) and the Canadian Space Agency (CSA), released the first images from the James Webb Telescope (JWST) which conducts infrared astronomy to “reveal the unseen universe”.

How the James Webb Telescope's cosmic pictures impacted the Internet
Webb’s First Deep Field is the first operational image taken by the James Webb Space Telescope, depicting a galaxy cluster with a distance of 5.12 billion light-years from Earth. Revealed to the public on 11 July 2022. Credits: NASA, ESA, CSA, and STScI. Full image here.

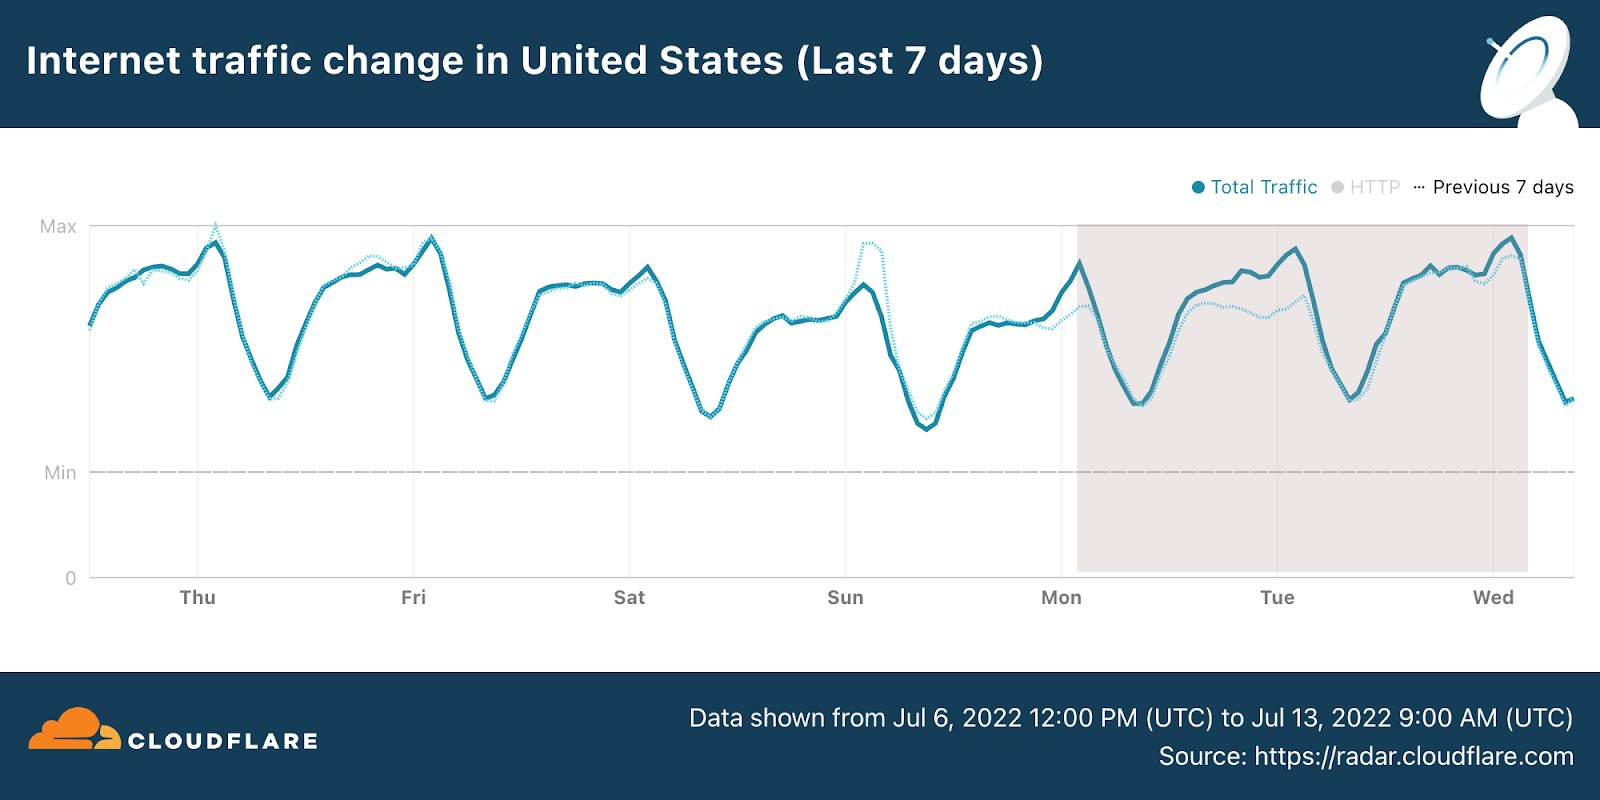
So, let’s dig into something we really like here at Cloudflare, checking how real life and human interest has an impact on the Internet. In terms of general Internet traffic in the US, Radar shows us that there was an increase both on July 11 and July 12, compared to the previous week (bear in mind that July 4, the previous Monday, was the Independence Day holiday in the US).

How the James Webb Telescope's cosmic pictures impacted the Internet

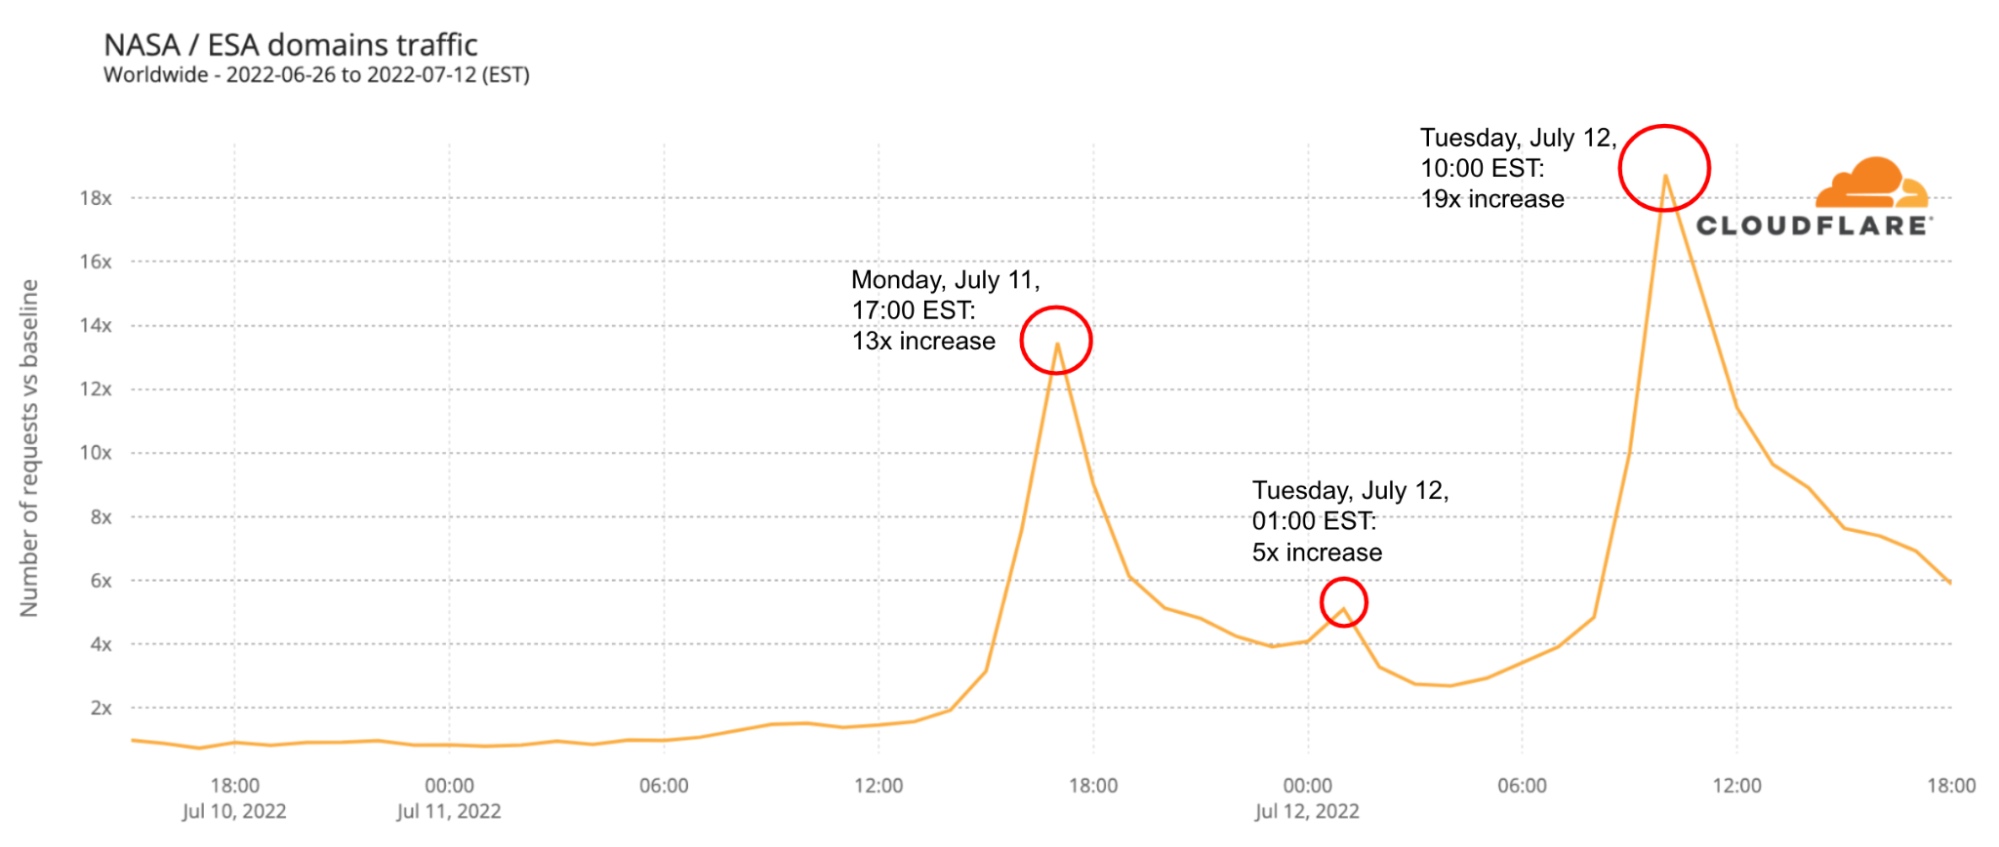
Next, we look at DNS request trends to get a sense of traffic to Internet properties (and using from this point on EST time in all the charts). Let’s start with the cornucopia of NASA, ESA and other websites (there are many, some dedicated just to the James Webb Telescope findings).

There are two clear spikes in the next chart. The first was around the time the first galaxy cluster infrared image was announced by Joe Biden, on Monday, July 11, 2022 (at 17:00), with traffic rising 13x higher than in the previous week. There was also a 5x spike at 01:00 EST that evening. The second spike was higher and longer and happened during Tuesday, July 12, 2022, when more images were revealed. Tuesday’s peak was at 10:00, with traffic being 19x higher than in the previous week — traffic was higher than 10x between 09:00 and 13:00.

How the James Webb Telescope's cosmic pictures impacted the Internet

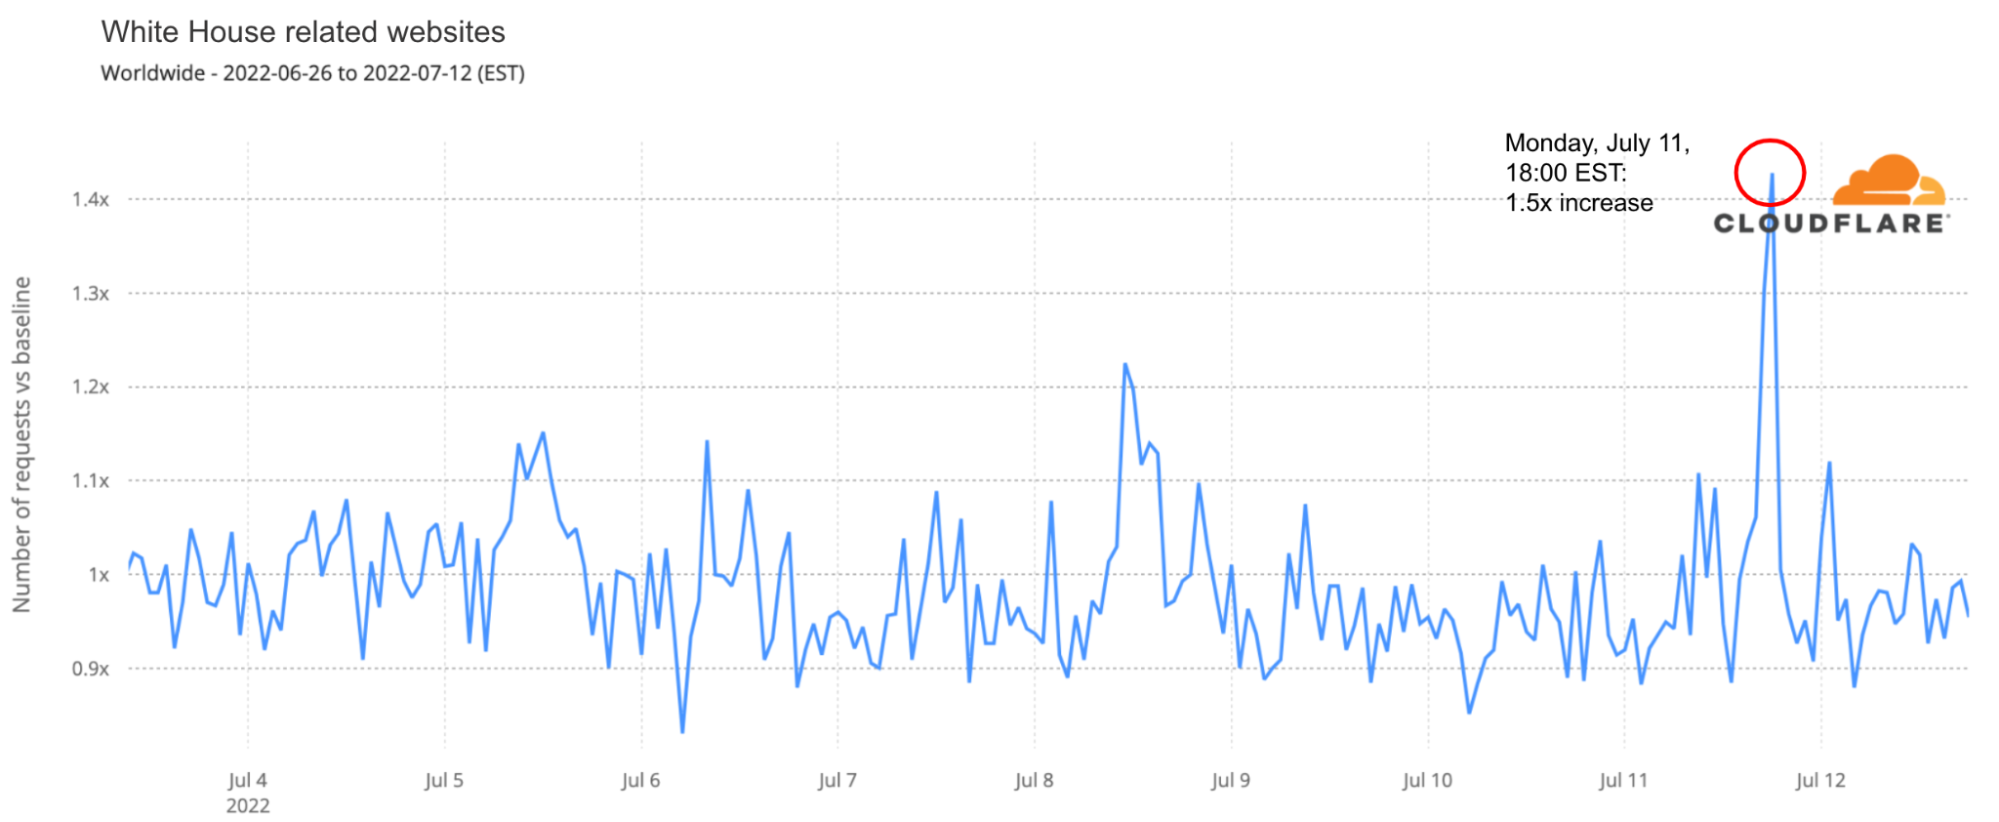
The first image was presented by US president at around 17:00 on July 11. DNS traffic was 1.5x higher to White House-related websites than any time in the preceding month.

How the James Webb Telescope's cosmic pictures impacted the Internet

Conclusion: space, the final frontier

As we saw in 2021, space projects and announcements continue to have a clear impact on the Internet, in this case in our DNS request view of Internet traffic. So far, what the James Webb Telescope images are showing us is a glimpse of a never-before-seen picture of parts of the universe (there’s no lack of excitement in Cloudflare’s internal chat groups).

You can keep an eye on these and other trends using Cloudflare Radar and follow @CloudflareRadar on Twitter — recently we covered extensively Canada’s Internet outage.

Upcoming Speaking Engagements

Post Syndicated from Schneier.com Webmaster original https://www.schneier.com/blog/archives/2022/07/upcoming-speaking-engagements-21.html

This is a current list of where and when I am scheduled to speak:

The list is maintained on this page.

Accelerate resize and encryption of Amazon Redshift clusters with Faster Classic Resize

Post Syndicated from Sumeet Joshi original https://aws.amazon.com/blogs/big-data/accelerate-resize-and-encryption-of-amazon-redshift-clusters-with-faster-classic-resize/

Amazon Redshift has improved the performance of the classic resize feature and increased the flexibility of the cluster snapshot restore operation. You can use the classic resize operation to resize a cluster when you need to change the instance type or transition to a configuration that can’t be supported by elastic resize. This could take the cluster offline for many hours during the resize, but now the cluster can typically be available to process queries in minutes. Clusters can also be resized when restoring from a snapshot and in those cases there could be restrictions.

You can now also restore an encrypted cluster from an unencrypted snapshot or change the encryption key. Amazon Redshift uses AWS Key Management Service (AWS KMS) as an encryption option to provide an additional layer of data protection by securing your data from unauthorized access to the underlying storage. Now you can encrypt an unencrypted cluster with a KMS key faster by simply specifying a KMS key ID when modifying the cluster. You can also restore an AWS KMS-encrypted cluster from an unencrypted snapshot. You can access the feature via the AWS Management Console, SDK, or AWS Command Line Interface (AWS CLI). Please note that these features only apply to the clusters or target clusters with the RA3 node type.

In this post, we show you how the updated classic resize option works and also how it significantly improves the amount of time it takes to resize or encrypt your cluster with this enhancement. We also walk through the steps to resize your Amazon Redshift cluster using Faster Classic Resize.

Existing resize options

We’ve worked closely with our customers to learn how their needs evolve as their data scales or as their security and compliance requirements change. To address and meet your ever-growing demands, you often have to resize your Amazon Redshift cluster and choose an optimal instance type that delivers the best price/performance. As of this writing, there are three ways you can resize your clusters: elastic resize, classic resize, and the snapshot, restore, and resize method.

Among the three options, elastic resize is the fastest available resize mechanism because it works based on slice remapping instead of full data copy. And classic resize is used primarily when cluster resize is outside the allowed slice ranges by elastic resize, or the encryption status should be changed. Let’s briefly discuss these scenarios before describing how the new migration process helps.

Current limitations

The current resize options have a few limitations of note.

  • Configuration changes – Elastic resize supports the following RA3 configuration changes by design. So, when you need to choose a target cluster outsize the ranges mentioned in the following table, you should choose classic resize.
Node Type Growth Limit Reduction Limit
ra3.16xlarge 4x (from 4 to 16 nodes, for example) To one-quarter of the number (from 16 to 4 nodes, for example)
ra3.4xlarge 4x To one-quarter of the number
ra3.xlplus 2x (from 4 to 8 nodes, for example) To one-quarter of the number

Also, elastic resize can’t be performed if the current cluster is a single-node cluster or isn’t running on an EC2-VPC platform. These scenarios also drive customers to choose classic resize.

  • Encryption changes – You may need to encrypt your Amazon Redshift cluster based on security, compliance, and data consumption requirements. Currently, in order to modify encryption on an Amazon Redshift cluster, we use classic resize technology, which internally performs a deep copy operation of the entire dataset and rewrites the dataset with the desired encryption state. To avoid any changes during the deep copy operation, the source cluster is placed in read-only mode during the entire operation, which can take a few hours to days depending on the dataset size. Or, you might be locked out altogether if the data warehouse is down for a resize. As a result, the administrators or application owners can’t support Service Level Agreements (SLAs) that they have set with their business stakeholders.

Switching to the Faster Classic Resize approach can help speed up the migration process when turning on encryption. This has been one of the requirements for cross-account, cross-Region data sharing enabled on unencrypted clusters and integrations with AWS Data Exchange for Amazon Redshift. Additionally, Amazon Redshift Serverless is encrypted by default. So, to create a data share from a provisioned cluster to Redshift Serverless, the provisioned cluster should be encrypted as well. This is one more compelling requirement for Faster Classic Resize.

Faster Classic Resize

Faster Classic Resize works like elastic resize, but performs similar functions like classic resize, thereby offering the best of both approaches. Unlike classic resize, which involves extracting tuples from the source cluster and inserting those tuples on the target cluster, the Faster Classic Resize operation doesn’t involve extraction of tuples. Instead, it starts from the snapshots and the data blocks are copied over to the target cluster.

The new Faster Classic Resize operation involves two stages:

  • Stage 1 (Critical path) – This first stage consists of migrating the data from the source cluster to the target cluster, during which the source cluster is in read-only mode. Typically, this is a very short duration. Then the cluster is made available for read and writes.
  • Stage 2 (Off critical path) – The second stage involves redistributing the data as per the previous data distribution style. This process runs in the background off the critical path of migration from the source to target cluster. The duration of this stage is dependent on the volume to distribute, cluster workload, and so on.

Let’s see how Faster Classic Resize works with configuration changes, encryption changes, and restoring an unencrypted snapshot into an encrypted cluster.

Prerequisites

Complete the following prerequisite steps:

  1. Take a snapshot from the current cluster or use an existing snapshot.
  2. Provide the AWS Identity and Access Management (IAM) role credentials that are required to run the AWS CLI. For more information, refer to Using identity-based policies (IAM policies) for Amazon Redshift.
  3. For encryption changes, create a KMS key if none exists. For instructions, refer to Creating keys.

Configuration changes

As of today, you can initiate Faster Classic Resize through the AWS CLI when the required cluster configuration change is beyond what is allowed by elastic resize. The feature will be added to the console in a future release. As of this writing, you can use it change your cluster configuration from DC2, DS2, and RA3 node types to any RA3 node type. However, changing from RA3 to DC2 or DS2 is not supported yet.

We did a benchmark on Faster Classic Resize with different cluster combinations and volumes. The following table summarizes the results comparing critical paths in classic resize and Faster Classic Resize.

Volume Source Cluster Target Cluster Classic Resize
Duration (min)
Faster Classic Resize
Stage1 Duration (min)
% Faster
10 TB ra3 4xlarge – 6 nodes ra3 16xlarge – 8 nodes 78 11 86%
10 TB ra3 16xlarge – 8 nodes ra3 4xlarge – 2 nodes 738 11 99%
10 TB dc2 8xlarge – 6 nodes ra3 4xLarge – 2 nodes 706 8 99%
3 TB ra3 4xLarge – 2 nodes ra3 16xLarge – 4 nodes 53 11 79%
3 TB ra3 16xLarge – 4 nodes ra3 4xLarge – 2 nodes 244 7 97%
3 TB dc2 8xlarge – 6 nodes ra3 4xLarge – 2 nodes 251 7 97%

The Faster Classic Resize option consistently completed in significantly less time and made the cluster available for read and write operations in a short time. Classic resize took a longer time in all cases and kept the cluster in read-only mode, making it unavailable for writes. Also, the classic resize duration is comparatively longer when the target cluster configuration is smaller than the original cluster configuration.

Perform Faster Classic Resize

As of this writing, the feature isn’t available on the console. You can use either of the following two methods to resize your cluster using Faster Classic Resize via the AWS CLI.

  • Modify cluster method – Resize an existing cluster without changing the endpoint

The following are the steps involved:

    1. Take a snapshot on the current cluster prior to performing the resize operation.
    2. Determine the target cluster configuration and run the following command from the AWS CLI:
      aws redshift modify-cluster --region <CLUSTER REGION>
      --endpoint-url https://redshift.<CLUSTER REGION>.amazonaws.com/
      --cluster-identifier <CLUSTER NAME>
      --cluster-type multi-node
      --node-type <TARGET INSTANCE TYPE>
      --number-of-nodes <TARGET NUMBER OF NODES>

      For example:

      aws redshift modify-cluster --region us-east-1
      --endpoint-url https://redshift.us-east-1.amazonaws.com/
      --cluster-identifier my-cluster-identifier
      --cluster-type multi-node
      --node-type  ra3.16xlarge
      --number-of-nodes 12

  • Snapshot restore method – Restore an existing snapshot to the new cluster with the new cluster endpoint

The following are the steps involved:

    1. Identify the snapshot for restore and a unique name for the new cluster.
    2. Determine the target cluster configuration and run the following command from the AWS CLI:
      aws redshift restore-from-cluster-snapshot --region <CLUSTER REGION>
      --endpoint-url https://redshift.<CLUSTER REGION>.amazonaws.com/
      --snapshot-identifier <SNAPSHOT ID> 
      --cluster-identifier <CLUSTER NAME>
      --node-type <TARGET INSTANCE TYPE>
      --number-of-node <NUMBER>

      For example:

      aws redshift restore-from-cluster-snapshot --region us-east-1
      --endpoint-url https://redshift.us-east-1.amazonaws.com/
      --snapshot-identifier rs:sales-cluster-2022-05-26-16-19-36
      --cluster-identifier my-new-cluster-identifier
      --node-type ra3.16xlarge
      --number-of-node 12

Monitor the resize process

Monitor the progress through the cluster management console. You can also check the events generated by the resize process. The resize completion status is logged in events along with the duration it took for the resize. The following screenshot shows an example.

It’s important to note that you may observe longer query times in the second stage of Faster Classic Resize. During the first stage, the data for tables with dist-key distribution style is transferred as dist-even. Later, a background process converts them back to dist-key (in stage 2). However, background processes are running behind the scenes to get the data redistributed to the original distribution style (the distribution style before the cluster resize). You can monitor the progress of the background processes by querying the stv_xrestore_alter_queue_state table. It’s important to note that tables with ALL, AUTO, or EVEN distribution styles don’t require redistribution post-resize. Therefore, they’re not logged in the stv_xrestore_alter_queue_state table. The counts you observe in these tables are for the tables with distribution style as Key before the resize operation.

See the following example query:

select db_id, status, count(*) from stv_xrestore_alter_queue_state group by 1,2 order by 3 desc

The following table shows that for 60 tables data redistribution is finished, for 323 tables data redistribution is pending, and for 1 table data redistribution is in progress.

We ran tests to assess time to complete the redistribution. For 10 TB of data, it took approximately 5 hours and 30 minutes on an idle cluster. For 3 TB, it took approximately 2 hours and 30 minutes on an idle cluster. The following is a summary of tests performed on larger volumes:

  • A snapshot with 100 TB where 70% of blocks needs redistribution would take 10–40 hours
  • A snapshot with 450 TB where 70% of blocks needs redistribution would take 2–8 days
  • A snapshot with 1600 TB where 70% of blocks needs redistribution would take 7–27 days

The actual time to complete redistribution is largely dependent on data volume, cluster idle cycles, target cluster size, data skewness, and more. Therefore, we recommend performing Faster Classic Resize when there is enough of an idle window (such as weekends) for the cluster to perform redistribution.

Encryption changes

You can encrypt your Amazon Redshift cluster from the console (the modify cluster method) or using the AWS CLI using the snapshot restore method. Amazon Redshift performs the encryption change using Faster Classic Resize. The operation only takes a few minutes to complete and your cluster is available for both read and write. With Faster Classic Resize, you can change an unencrypted cluster to an encrypted cluster or change the encryption key using the snapshot restore method.

For this post, we show how you can change the encryption using the Amazon Redshift console. To test the timings, we created multiple Amazon Redshift clusters using TPC-DS data. The Faster Classic Resize option consistently completed in significantly less time and made clusters available for read and write operations faster. Classic resize took a longer time in all cases and kept the cluster in read-only mode. The following table contains the summary of the results.

Data Volume Cluster Encryption (Classic Resize)
Duration (min)
Encryption (Faster Classic Resize)
Duration (min)
% Faster
10 TB ra3.4xlarge – 2 nodes 580 11 98%
10 TB ra3.xlplus – 2 nodes 680 16 98%
3 TB ra3.4xlarge – 2 nodes 527 9 98%
3 TB ra3.xlplus – 2 nodes 570 10 98%

Now, let’s perform the encryption change from an unencrypted cluster to an encrypted cluster using the console. Complete the following steps:

  1. On the Amazon Redshift console, navigate to your cluster.
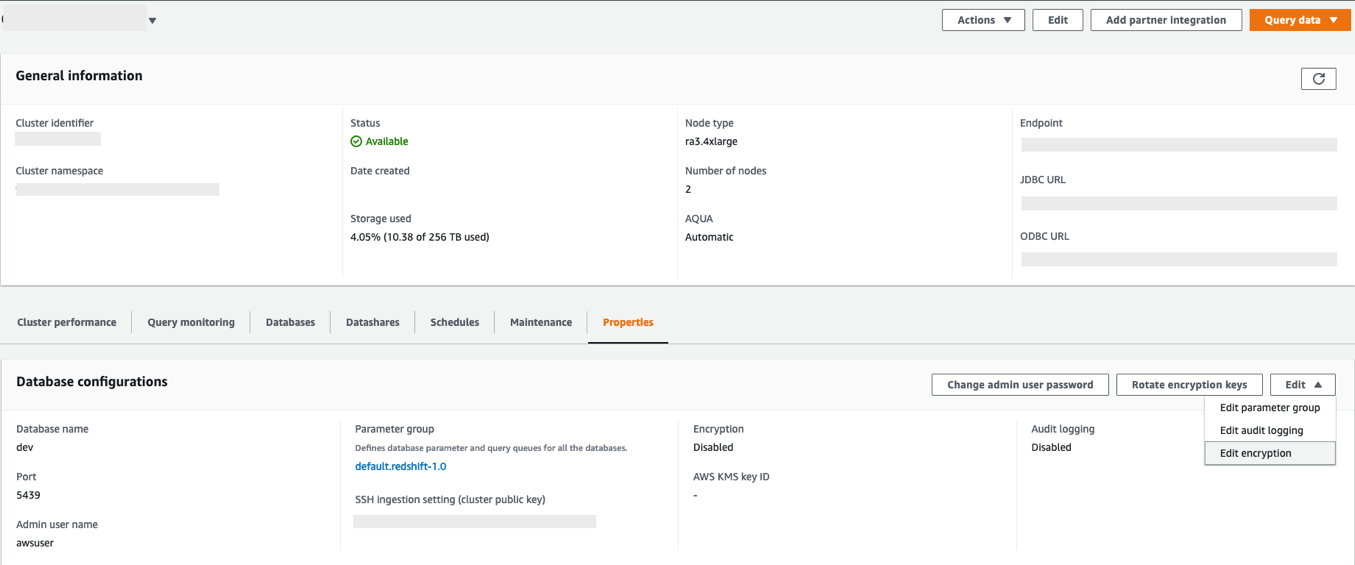
  2. On the Properties tab, on the Edit drop-down menu, choose Edit encryption.
  3. For Encryption, select Use AWS Key Management Service (AWS KMS).
  4. For AWS KMS, select Default Redshift key.
  5. Choose Save changes.

You can monitor the progress of your encryption change on the Events tab. As shown in the following screenshot, the entire process to change the encryption took approximately 11 minutes.

Restore an unencrypted snapshot to an encrypted cluster

As of today, the Faster Classic Resize option to restore an unencrypted snapshot into an encrypted cluster or to change the encryption key is available only through the AWS CLI. When triggered, the restored cluster operates in read/write mode immediately. The encryption state change for restored blocks that are unencrypted operates in the background, and newly ingested blocks continue to be encrypted.

Restore the snapshot using the following command into a new cluster. (Replace the indicated parameter values; --encrypted and --kms-key-id are required).

aws redshift restore-from-cluster-snapshot 
--cluster-identifier <CLUSTER NAME>
--snapshot-identifier <SNAPSHOT ID> 
--region <AWS REGION> 
--encrypted
--kms-key-id <KMS KEY ID>
--cluster-subnet-group-name <SUBNET GROUP>

When to use which resize option

The following flow chart provides guidance on which resize option is recommended when changing your cluster encryption status or resizing to a new cluster configuration.

Summary

In this post, we talked about the improved performance of Amazon Redshift’s classic resize feature and how Faster Classic Resize significantly improves your ability to scale your Amazon Redshift clusters using the classic resize method. We also talked about when to use different resize operations based on your requirements. We demonstrated how it works from the console (for encryption changes) and using the AWS CLI. We also showed the results of our benchmark test and how it significantly improves the migration time for configuration changes and encryption changes for your Amazon Redshift cluster.

To learn more about resizing your clusters, refer to Resizing clusters in Amazon Redshift. If you have any feedback or questions, please leave them in the comments.


About the authors

Sumeet Joshi is an Analytics Specialist Solutions Architect based out of New York. He specializes in building large-scale data warehousing solutions. He has over 17 years of experience in the data warehousing and analytical space.

Satesh Sonti is a Sr. Analytics Specialist Solutions Architect based out of Atlanta, specialized in building enterprise data platforms, data warehousing, and analytics solutions. He has over 16 years of experience in building data assets and leading complex data platform programs for banking and insurance clients across the globe.

Krishna Chaitanya Gudipati is a Senior Software Development Engineer at Amazon Redshift. He has been working on distributed systems for over 14 years and is passionate about building scalable and performant systems. In his spare time, he enjoys reading and exploring new places.

Yanzhu Ji is a Product Manager on the Amazon Redshift team. She worked on the Amazon Redshift team as a Software Engineer before becoming a Product Manager. She has a rich experience of how the customer-facing Amazon Redshift features are built from planning to launching, and always treats customers’ requirements as first priority. In her personal life, Yanzhu likes painting, photography, and playing tennis.

Custom packages and hot reload of dictionary files with Amazon OpenSearch Service

Post Syndicated from Sonam Chaudhary original https://aws.amazon.com/blogs/big-data/custom-packages-and-hot-reload-of-dictionary-files-with-amazon-opensearch-service/

Amazon OpenSearch Service is a fully managed service that you can use to deploy and operate OpenSearch clusters cost-effectively at scale in the AWS Cloud. The service makes it easy for you to perform interactive log analytics, real-time application monitoring, website search, and more by offering the latest versions of OpenSearch, support for 19 versions of Elasticsearch (1.5 to 7.10 versions), and visualization capabilities powered by OpenSearch Dashboards and Kibana (1.5 to 7.10 versions).

There are various use cases such as website search, ecommerce search, and enterprise search where the user wants to get relevant content for specific terms. Search engines match the terms (words) sent through the query API. When there are many different ways of specifying the same concept, you use synonyms to give the search engine more match targets than what the user entered.

Similarly, there are certain use cases where input data has a lot of common or frequently occurring words that don’t add much relevance when used in a search query. These include words like “the,” “this,” and “that.” These can be classified as stopwords.

OpenSearch Service allows you to upload custom dictionary files, which can include synonyms and stopwords to be customized to your use case. This is especially useful for use cases where you want to do the following:

  • Specify words that can be treated as equivalent. For example, you can specify that words such as “bread,” “danish,” and “croissant” be treated as synonymous. This leads to better search results because instead of returning a null result if an exact match isn’t found, an approximately relevant or equivalent result is returned.
  • Ignore certain high frequency terms that are common and lack useful information in terms of contributing to the search’s relevance store. These could include “a,” “the,” “of,” “an,” and so on.

Specifying stems, synonyms, and stopwords can greatly help with query accuracy, and allows you to customize and enhance query relevance. They can also help with stemming (such as in the Japanese (kuromoji) Analysis Plugin). Stemming is reducing a word to its root form. For Example, “cooking” and “cooked” can be stemmed to the same root word “cook.” This way, any variants of a word can be stemmed to one root word to enhance the query results.

In this post, we show how we can add custom packages for synonyms and stopwords to an OpenSearch Service domain. We start by creating custom packages for synonyms and stopwords and creating a custom analyzer for a sample index that uses the standard tokenizer and a synonym token filter, followed by a demonstration of hot reload of dictionary files.

Tokenizers and token filters

Tokenizers break streams of characters into tokens (typically words) based on some set of rules. The simplest example is the whitespace tokenizer, which breaks the preceding characters into a token each time it encounters a whitespace character. A more complex example is the standard tokenizer, which uses a set of grammar-based rules to work across many languages.

Token filters add, modify, or delete tokens. For example, a synonym token filter adds tokens when it finds a word in the synonyms list. The stop token filter removes tokens when finds a word in the stopwords list.

Prerequisites

For this demo, you must have an OpenSearch Service cluster (version 1.2) running. You can use this feature on any version of OpenSearch Service running 7.8+.

Users without administrator access require certain AWS Identity and Access Management (IAM) actions in order to manage packages: es:CreatePackage, es:DeletePackage, es:AssociatePackage, and es:DissociatePackage. The user also needs permissions on the Amazon Simple Storage Service (Amazon S3) bucket path or object where the custom package resides. Grant all permission within IAM, not in the domain access policy. This allows for better management of permissions because any change in permissions can be separate from the domain and allows the user to perform the same action across multiple OpenSearch Service domains (if needed).

Set up the custom packages

To set up the solution, complete the following steps:

  1. On the Amazon S3 console, create a bucket to hold the custom packages.
  2. Upload the files with the stopwords and synonyms to this bucket. For this post, the file contents are as follows:
    1. synonyms.txt:
      pasta, penne, ravioli 
      ice cream, gelato, frozen custard
      danish, croissant, pastry, bread

    2. stopwords.txt:
      the
      a
      an
      of

      The following screenshot shows the uploaded files:

Now we import our packages and associate them with a domain.

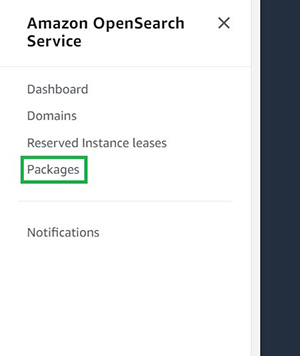
  1. On the OpenSearch Service console, choose Packages in the navigation pane.
  2. Choose Import package.
  3. Enter a name for your package (for the synonym package, we use my-custom-synonym-package) and optional description.
  4. For Package source, enter the S3 location where synonyms.txt is stored.
  5. Choose Submit.
  6. Repeat these steps to create a package with stopwords.txt.
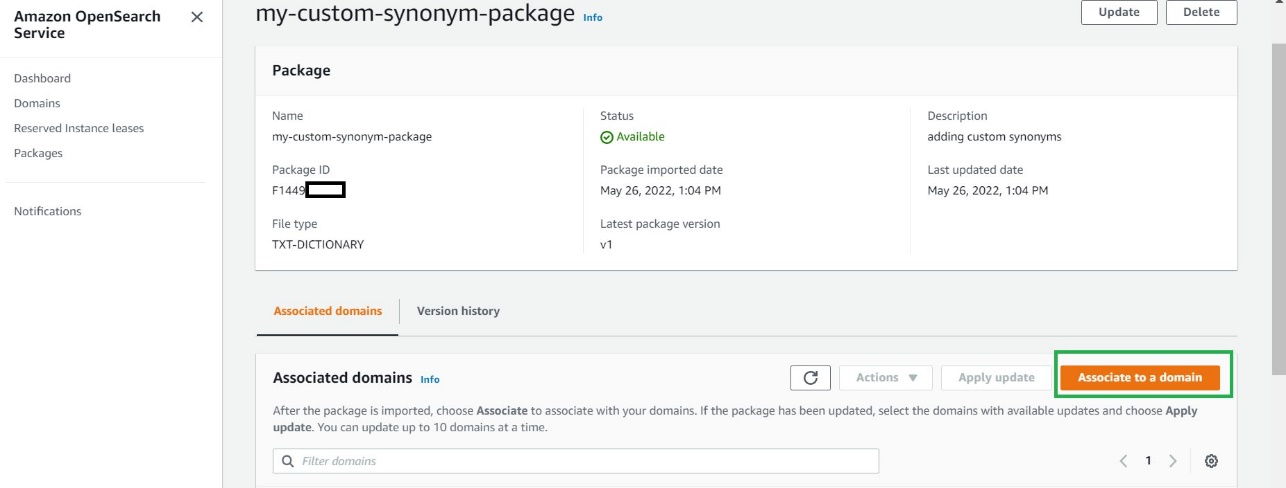
  7. Choose your synonym package when its status shows as Available.
  8. Choose Associate to a domain.
  9. Select your OpenSearch Service domain, then choose Associate.
  10. Repeat these steps to associate your OpenSearch Service domain to the stopwords package.
  11. When the packages are available, note their IDs.

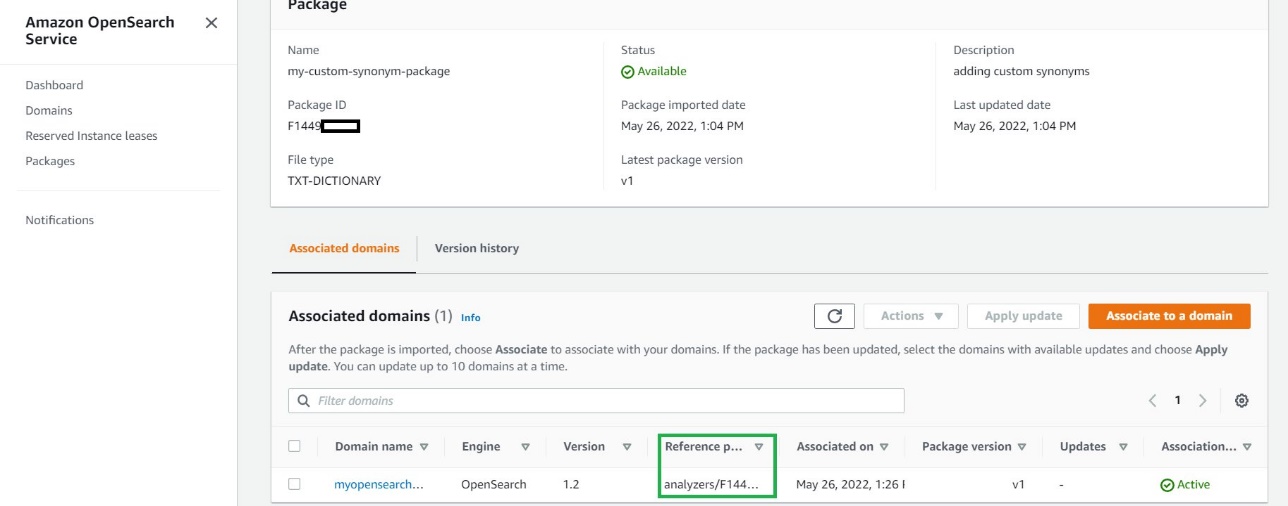
You use analyzers/id as the file path in your requests to OpenSearch.

Use the custom packages with your data

After you associate a file with a domain, you can use it in parameters such as synonyms_path and stopwords_path when you create tokenizers and token filters. For more information, see OpenSearch Service.

You can create a new index (my-index-test) using the following snippet in the OpenSearch Service domain and specify the Analyzers/id values for the synonyms and stopwords packages.

  1. Open OpenSearch Dashboards.
  2. On the Home menu, choose Dev Tools.
  3. Enter the following code in the left pane:
    PUT my-index-test
    {
      "settings": {
        "index": {
          "analysis": {
            "analyzer": {
              "my_analyzer": {
                "type": "custom",
                "tokenizer": "standard",
                "filter": ["my_stop_filter" , "my_synonym_filter"]
              }
            },
            "filter": {
              "my_stop_filter": {
                "type": "stop",
                "stopwords_path": "analyzers/Fxxxxxxxxx",
                "updateable": true
              },
              "my_synonym_filter": {
                "type": "synonym",
                "synonyms_path": "analyzers/Fxxxxxxxxx",
                "updateable": true
              }
                
            }
          }
        }
      },
      "mappings": {
        "properties": {
          "description": {
            "type": "text",
            "analyzer": "standard",
            "search_analyzer": "my_analyzer"
          }
        }
      }
    }

  4. Choose the play sign to send the request to create the index with our custom synonyms and stopwords.

The following screenshot shows our results.

This request creates a custom analyzer for my index that uses the standard tokenizer and a synonym and stop token filter. This request also adds a text field (description) to the mapping and tells OpenSearch to use the new analyzer as its search analyzer. It still uses the standard analyzer as its index analyzer.

Note the line "updateable": true in the token filter. This field only applies to search analyzers, not index analyzers, and is critical if you later want to update the search analyzer automatically.

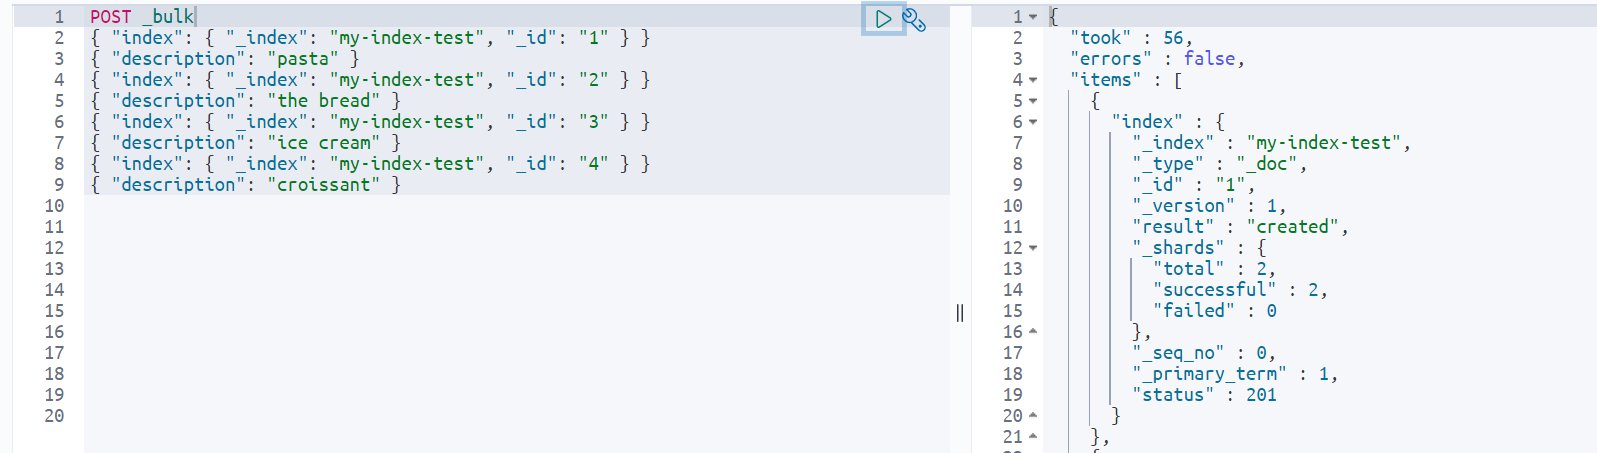
Let’s start by adding some sample data to the index my-index-test:

POST _bulk
{ "index": { "_index": "my-index-test", "_id": "1" } }
{ "description": "pasta" }
{ "index": { "_index": "my-index-test", "_id": "2" } }
{ "description": "the bread" }
{ "index": { "_index": "my-index-test", "_id": "3" } }
{ "description": "ice cream" }
{ "index": { "_index": "my-index-test", "_id": "4" } }
{ "description": "croissant" }

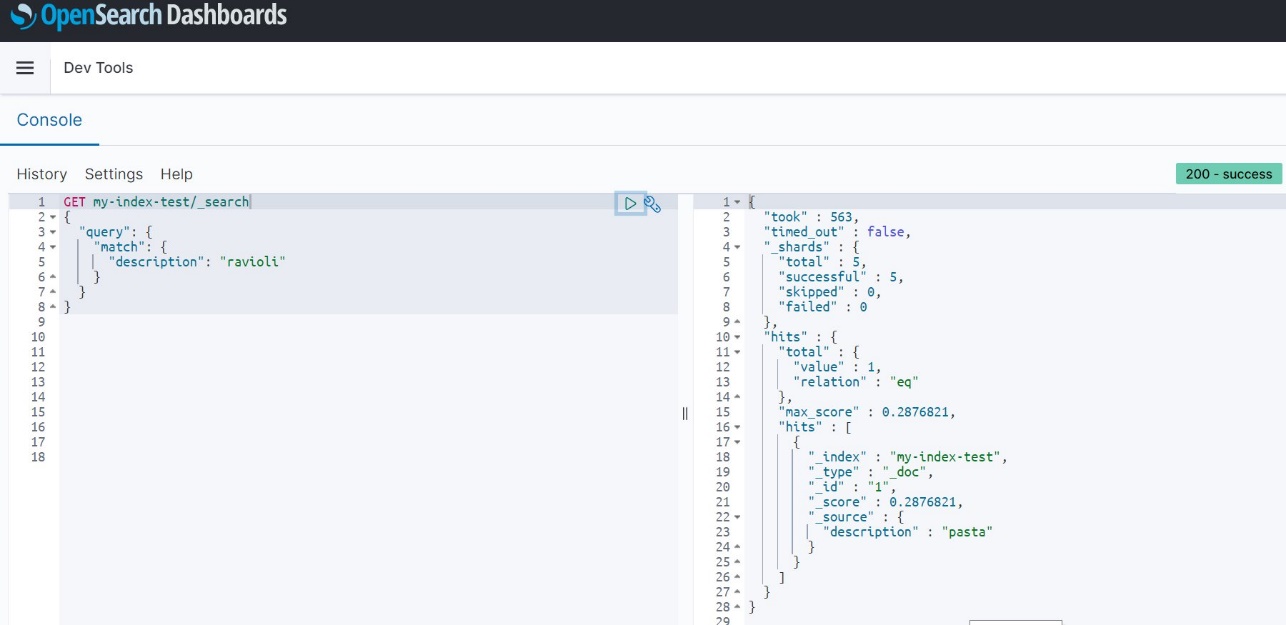
Now If you search for the words you specified in the synonyms.txt file, you get the required results. Note that my test index only has pasta in the indexed data, but because I specified “ravioli” as a synonym for “pasta” in my associated package, I get the results for all documents that have the word “pasta” when I search for “ravioli.”

GET my-index-test/_search
{
  "query": {
    "match": {
      "description": "ravioli"
    }
  }
}


Similarly, you can use the stopwords feature to specify common words that can be filtered out while showing search results and don’t impact the relevance much while returning search query results.

Hot reload

Now let’s say you want to add another synonym (“spaghetti”) for “pasta.”

  1. The first step is to update the synonyms.txt file as follows and upload this updated file to your S3 bucket:
    pasta , penne , ravioli, spaghetti
    ice cream, gelato, frozen custard
    danish, croissant, pastry , bread


    Uploading a new version of a package to Amazon S3 doesn’t automatically update the package on OpenSearch Service. OpenSearch Service stores its own copy of the file, so if you upload a new version to Amazon S3, you must manually update it in OpenSearch Service.

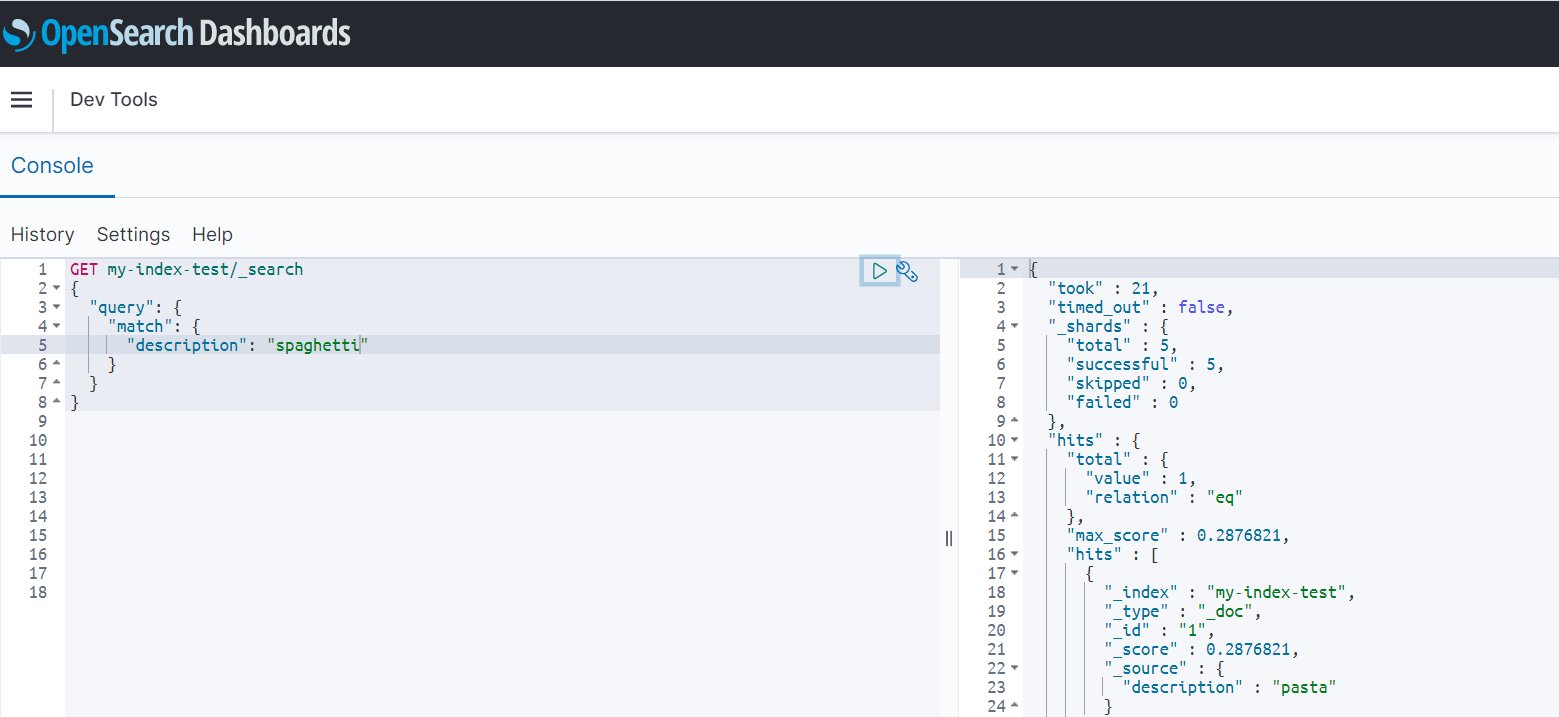
    If you try to run the search query against the index for the term “spaghetti” at this point, you don’t get any results:

    GET my-index-test/_search
    {
      "query": {
        "match": {
          "description": "spaghetti"
        }
      }
    }

    After the file is modified in Amazon S3, update the package in OpenSearch Service, then apply the update. To do this, perform the following steps:

  2. On the OpenSearch Service console, choose Packages.
  3. Choose the package you created for custom synonyms and choose Update.
  4. Provide the S3 path to the file, then choose Update package.
  5. Enter a description and choose Update package.

    You return to the Packages page.
  6. When the package status shows as Available, choose it and wait for the associated domain to show as updated.
  7. Select the domain and choose Apply update.
  8. Choose Apply update again to confirm.

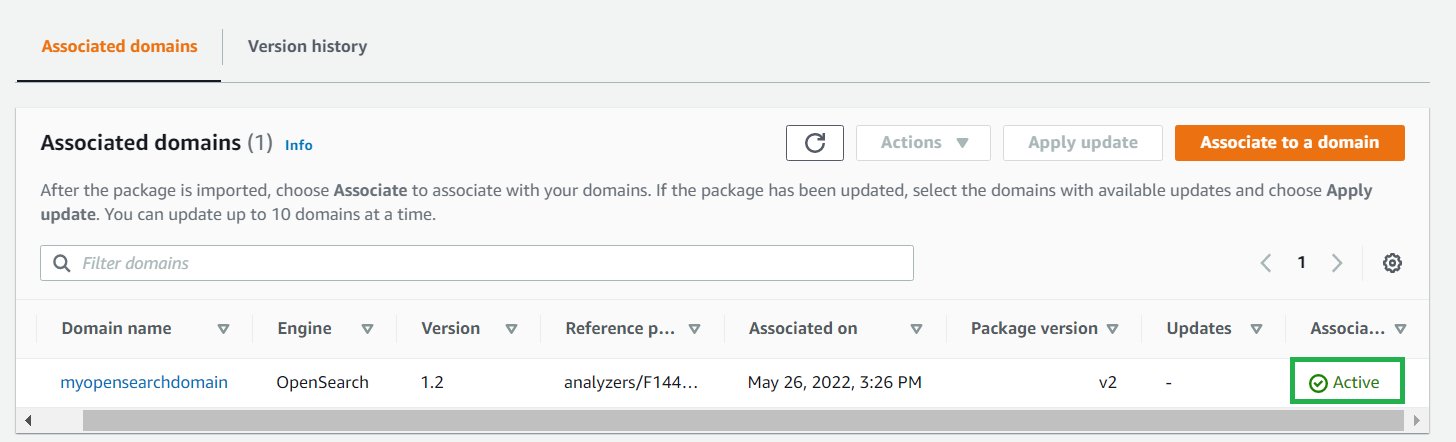
Wait for the association status to change to Active to confirm that the package version is also updated.

If your domain runs Elasticsearch 7.7 or earlier, uses index analyzers, or doesn’t use the updateable field, and if you want to add some additional synonyms at a later time, you have to reindex your data with the new dictionary file. Previously, on Amazon Elasticsearch Service, these analyzers could only process data as it was indexed.

If your domains runs OpenSearch Service or Amazon Elasticsearch Service 7.8 or later and only uses search analyzers with the updateable field set to true, you don’t need to take any further action. OpenSearch Service automatically updates your indexes using the _plugins/_refresh_search_analyzers API. This allows for refresh of search analyzers in real time without you needing to close and reopen the index.

This feature called hot reload provides the ability to reload dictionary files without reindexing your data. With the new hot reload capability, you can call analyzers at search time, and your dictionary files augment the query. This feature also lets you version your dictionary files in OpenSearch Service and update them on your domains, without having to reindex your data.

Because the domain used in this demonstration runs OpenSearch Service 1.2, you can utilize this hot reload feature and without re-indexing of any data. Simply run a search query for the newly added synonym (“spaghetti”) and get all resultant documents that are synonymous to it:

GET my-index-test/_search
{
  "query": {
    "match": {
      "description": "spaghetti"
    }
  }
}

Conclusion

In this post, we showed how easy it is to set up synonyms in OpenSearch Service so you can find the relevant documents that match a synonym for a word, even when the specific word isn’t used as search term. We also demonstrated how to add and update existing synonym dictionaries and load those files to reflect the changes.

If you have feedback about this post, submit your comments in the comments section. You can also start a new thread on the OpenSearch Service forum or contact AWS Support with questions.


About the Authors

Sonam Chaudhary is a Solutions Architect and Big Data and Analytics Specialist at AWS. She works with customers to build scalable, highly available, cost-effective, and secure solutions in the AWS Cloud. In her free time, she likes traveling with her husband, shopping, and watching movies.

Prashant Agrawal is a Search Specialist Solutions Architect with OpenSearch Service. He works closely with customers to help them migrate their workloads to the cloud and helps existing customers fine-tune their clusters to achieve better performance and save on cost. Before joining AWS, he helped various customers use OpenSearch and Elasticsearch for their search and log analytics use cases. When not working, you can find him traveling and exploring new places. In short, he likes doing Eat → Travel → Repeat.

Free Isn’t Always Free: A Guide to Free Cloud Tiers

Post Syndicated from Amrit Singh original https://www.backblaze.com/blog/free-isnt-always-free-a-guide-to-free-cloud-tiers/

Free Isn’t Always Free

They say “the best things in life are free.” But when most cloud storage companies offer a free tier, what they really want is money. While free tiers do offer some early-stage technical founders the opportunity to test out a proof of concept or allow students to experiment without breaking the bank, their ultimate goal is to turn you into a paying customer. This isn’t always nefarious (we offer 10GB for free, so we’re playing the same game!), but some cloud vendors’ free tiers come with hidden surprises that can lead to scary bills with little warning.

The truth is that free isn’t always free. Today, we’re digging into a cautionary tale for developers and technical founders exploring cloud services to support their applications or SaaS products. Naturally, you want to know if a cloud vendor’s free tier will work for you. Understanding what to expect and how to navigate free tiers accordingly can help you avoid huge surprise bills later.

Free Tiers: A Quick Reference

Most large, diversified cloud providers offer a free tier—AWS, Google Cloud Platform, and Azure, to name a few—and each one structures theirs a bit differently:

  • AWS: AWS has 100+ products and services with free options ranging from “always free” to 12 months free, and each has different use limitations. For example, you get 5GB of object storage free with AWS S3 for the first 12 months, then you are billed at the respective rate.
  • Google Cloud Platform: Google offers a $300 credit good for 90 days so you can explore services “for free.” They also offer an “always free tier” for specific services like Cloud Storage, Compute Engine, and several others that are free to a certain limit. For example, you get 5GB of storage for free and 1GB of network egress for their Cloud Storage service.
  • Azure: Azure offers a free trial similar to Google’s but with a shorter time frame (30 days) and lower credit amount ($200). It gives you the option to move up to paid when you’ve used up your credits or your time expires. Azure also offers a range of services that are free for 12 months and have varying limits and thresholds as well as an “always free tier” option.

After even a quick review of the free tier offers from major cloud providers, you can glean some immediate takeaways:

  1. You can’t rely on free tiers or promotional credits as a long-term solution. They work well for testing a proof of concept or a minimum viable product without making a big commitment, but they’re not going to serve you past the time or usage limits.
  2. “Free” has different mileage depending on the platform and service. Keep that in mind before you spin up servers and resources, and read the fine print as it relates to limitations.
  3. The end goal is to move you to paid. Obviously, the cloud providers want to move you from testing a proof of concept to paid, with your full production hosted and running on their platforms.

With Google Cloud Platform and Azure, you’re at least somewhat protected from being billed beyond the credits you receive since they require you to upgrade to the paid tier to continue. Thus, most of the horror stories you’ll see involve AWS. With AWS, once your trial expires or you exceed your allotted limits, you are billed the standard rate. For the purposes of this guide, we’ll look specifically at AWS.

The Problem With the AWS Free Tier

The internet is littered with cautionary tales of AWS bills run amok. A quick search for “AWS free tier bill” on Twitter or Reddit shows that it’s possible and pretty common to run up a bill on AWS’s so-called free tier…
Twitter - Free Tier Guide
Twitter 2 - Free Tier Guide
Reddit - Free Tier Guide

The problem with the AWS free tier is threefold:

  1. There are a number of ways a “free tier” instance can turn into a bill.
  2. Safeguards against surprise bills are mediocre at best.
  3. Surprise bills are scary, and next steps aren’t the most comforting.

Problem 1: It’s Really Easy to Go From Free to Not Free

There are a number of ways an unattended “free tier” instance turns into a bill, sometimes a catastrophically huge bill. Here are just a few:

  1. You spin up Elastic Compute Cloud (EC2) instances for a project and forget about them until they exceed the free tier limits.
  2. You sign up for several AWS accounts, and you can’t figure out which one is running up charges.
  3. Your account gets hacked and used for mining crypto (yes, this definitely happens, and it results in some of the biggest surprise bills of them all).

Problem 2: Safeguards Against Surprise Bills Are Mediocre at Best

Confounding the problem is the fact that AWS keeps safeguards against surprise billing to a minimum. The free tier has limits and defined constraints, and the only way to keep your account in the free zone is to keep usage below those limits (and this is key) for each service you use.

AWS has hundreds of services, and each service comes with its own pricing structure and limits. While one AWS service might be free, it can be paired with another AWS service that’s not free or doesn’t have the same free threshold, for example, egress between services. Thus, managing your usage to keep it within the free tier can be somewhat straightforward or prohibitively complex depending on which services you use.

Wait, Shouldn’t I Get Alerts?

Yes, you can get alerted if you’re approaching the free limit, but that’s not foolproof either. First, billing alarms are not instantaneous. The notification might come after you’ve already exceeded the limit. And second, not every service has alerts or alerts that work in the same way.

You can also configure services so that they automatically shut down when they exceed a certain billing threshold, but this may pose more problems than it solves. First, navigating the AWS UI to set this up is complex. Your average free tier user may not be aware of or even interested in how to set that up. Second, you may not want to shut down services depending on how you’re using AWS.

Problem 3: Knowing What to Do Next

If it’s not your first rodeo, you might not default to panic mode when you get that surprise bill. You tracked your usage. You know you’re in the right. All you have to do is contact AWS support and dispute the charge. But imagine how a college student might react to a bill the size of their yearly tuition. While large five- to six-figure bills might be negotiable and completely waived, there are untold numbers of two- to three-figure bills that just end up getting paid because people weren’t aware of how to dispute the charges.

Even experienced developers can fall victim to unexpected charges in the thousands.

Avoiding Unexpected AWS Bills in the First Place

The first thing to recognize is that free isn’t always free. If you’re new to the platform, there are a few steps you can take to put yourself in a better position to avoid unexpected charges:

  1. Read the fine print before spinning up servers or uploading test data.
  2. Look for sandboxed environments that don’t let you exceed charges beyond a certain amount or that allow you to set limits that shut off services once limits are exceeded.
  3. Proceed with caution and understand how alerts work before spinning up services.
  4. Steer clear of free tiers completely, because the short-term savings aren’t huge and aren’t worth the added risk.

Final Thought: It Ain’t Free If They Have Your CC

AWS requires credit card information before you can do anything on the free tier—all the more reason to be extremely cautious.

Shameless plug here: Backblaze B2 Cloud Storage offers the first 10GB of storage free, and you don’t need to give us a credit card to create an account. You can also set billing alerts and caps easily in your dashboard. So, you’re unlikely to run up a surprise bill.

Ready to get started with Backblaze B2 Cloud Storage? Sign up here today to get started with 10GB and no CC.

The post Free Isn’t Always Free: A Guide to Free Cloud Tiers appeared first on Backblaze Blog | Cloud Storage & Cloud Backup.

Q2 InsightVM Release Update: Let’s Focus on Remediation for Just a Minute

Post Syndicated from Devin Krugly original https://blog.rapid7.com/2022/07/14/q2-insightvm-release-update-lets-focus-on-remediation-for-just-a-minute/

Q2 InsightVM Release Update: Let’s Focus on Remediation for Just a Minute

Think of an endeavor in your life where your success is entirely dependent on the success of others. What’s the first example that comes to mind? It’s common in team sports – a quarterback and a wide receiver, a fullback and their goalie, an equestrian and their horse.

What if you narrow the scope to endeavors or activities at work? A little more difficult, right? A large project is an easy candidate, but those are generally distributed across many people over a long time period, which allows for mitigation and planning.

For those that make a living in cybersecurity, the example that immediately comes to mind is vulnerability management (VM). VM, which really falls under the heading of risk management, requires deft handling of executive communications, sometimes blurred to abstract away the tedious numbers and present a risk statement. At the same time, judicious management of vulnerability instances and non-compliant configurations that exceed organization thresholds – i.e., all the numbers – requires very detailed and often painstaking focus on the minutiae of a VM program. Then, layer in the need for situational awareness to answer context-specific questions like, “Are we vulnerable, and if so, do we need to act immediately?” or “Why did the security patch fail on only 37 of the 2184 target systems?” It becomes glaringly apparent that communication and alignment among all stakeholders – security team, IT operations, and business leadership – are paramount to achieve “dependent” success.

Based on customer feedback and directional input, we’re pleased to release two updates that are aimed at not only improving VM program success but also reducing the effort to get you there.

Remediation Project progress

In what may be the most exciting and warmly received update for some, we are releasing a new method to calculate and display progress for Remediation Projects. Historically, credit for patching and subsequent reporting of “percent complete” toward closing any one Remediation Project was only given when all affected assets for a single solution were remediated. So we’ve updated the calculation to account for “partial” credit. Now, remediation teams will see incremental progress as individual assets for specific solutions (i.e. patches) are applied. This is a much more accurate representation of the work and effort invested. It is also a much more precise indication of what additional effort is needed to close out the last few pesky hosts that have so far resisted your best remediation efforts.

For some, the scope and scale of risk management in the world of VM has outgrown original designs – more assets, more vulns. We’ve acted on the sage wisdom of many who have suggested such an update and made that available in Version 6.6.150

Q2 InsightVM Release Update: Let’s Focus on Remediation for Just a Minute

This update will affect all Remediation Projects, so we encourage teams to leverage this blog post to share the details behind this release as a heads-up and possibly improve relations with your teammates. It’s only by partnering and aligning on the effort involved that this “success dependency” becomes a power-up, rather than a power drain.

Remediator Export

I am particularly excited about this seemingly minor but mighty update, because I can remember having to script around or find automation to stitch together different source documents to produce what we have elected to refer to as a Remediator Export. The number of stakeholders and the diversity of teams involved in modern VM programs necessitate on-demand access to the supporting data and associated context. This export is for – you guessed it – the teams that have the heaviest lift in any VM program: the folks that push patches, update configs, apply mitigating controls, and are usually involved in all the necessary testing – the Remediators. Whether the catalyst for such a detailed export (26 data fields in all) is to troubleshoot a failed install or to simply have more direct access to vulnerability proof data the Remediator Export will offer improvements for nearly every remediation team.

Q2 InsightVM Release Update: Let’s Focus on Remediation for Just a Minute

You can access this upcoming solution based export from any Remediation Project peek panel. The Export to CSV dropdown now has an additional option that includes the data fields cited above and helps meet team’s needs where they are today.

Q2 InsightVM Release Update: Let’s Focus on Remediation for Just a Minute

The Remediator CSV file is accessible to anyone with permission to Remediation Projects, Goals, and SLAs and carries the following naming convention: “Project-Name_Solution-UUID.csv.” We are already thinking about options to provide similar capability at the Remediation Project level.

Additional reading:

NEVER MISS A BLOG

Get the latest stories, expertise, and news about security today.

New Browser De-anonymization Technique

Post Syndicated from Bruce Schneier original https://www.schneier.com/blog/archives/2022/07/new-browser-de-anonymization-technique.html

Researchers have a new way to de-anonymize browser users, by correlating their behavior on one account with their behavior on another:

The findings, which NJIT researchers will present at the Usenix Security Symposium in Boston next month, show how an attacker who tricks someone into loading a malicious website can determine whether that visitor controls a particular public identifier, like an email address or social media account, thus linking the visitor to a piece of potentially personal data.

When you visit a website, the page can capture your IP address, but this doesn’t necessarily give the site owner enough information to individually identify you. Instead, the hack analyzes subtle features of a potential target’s browser activity to determine whether they are logged into an account for an array of services, from YouTube and Dropbox to Twitter, Facebook, TikTok, and more. Plus the attacks work against every major browser, including the anonymity-focused Tor Browser.

[…]

“Let’s say you have a forum for underground extremists or activists, and a law enforcement agency has covertly taken control of it,” Curtmola says. “They want to identify the users of this forum but can’t do this directly because the users use pseudonyms. But let’s say that the agency was able to also gather a list of Facebook accounts who are suspected to be users of this forum. They would now be able to correlate whoever visits the forum with a specific Facebook identity.”

[$] Long-lived kernel pointers in BPF

Post Syndicated from original https://lwn.net/Articles/900749/

The BPF subsystem allows
programmers to write programs that can run safely in kernel space. All
memory accesses and function calls in BPF programs are statically checked
for safety using the in-kernel verifier, which
analyzes programs in their entirety before allowing them to be loaded.
While this allows the kernel to safely run BPF programs, it heavily
restricts what those programs are able to do. Among these
constraints is a rule that programs cannot store pointers into BPF maps for
use (such as dereferencing them or passing them to the kernel in
kfunc and BPF helper invocations) at a
later time. A
patch set by
Kumar Kartikeya Dwivedi
adds this capability to BPF.

Security updates for Thursday

Post Syndicated from original https://lwn.net/Articles/901190/

Security updates have been issued by Debian (request-tracker4), Fedora (kernel and vim), Mageia (gerbv, gnupg2, pgadmin4, and python-coookiecutter), Slackware (xorg), SUSE (cifs-utils, gmp, gnutls, libnettle, kernel, libsolv, libzypp, zypper, logrotate, openssl-1_1, opera, squid, and virglrenderer), and Ubuntu (ca-certificates, git, linux, linux-aws, linux-aws-hwe, linux-azure, linux-azure-4.15, linux-gcp-4.15, linux-hwe, linux-kvm, linux-oracle, linux-raspi2, linux-snapdragon, linux, linux-aws, linux-azure, linux-azure-5.4, linux-azure-fde, linux-gke, linux-gkeop, linux-hwe-5.4, linux-ibm, linux-kvm, linux, linux-aws, linux-azure, linux-gcp, linux-gke, linux-ibm, linux-kvm, linux-lowlatency, linux-oracle, linux-aws, linux-oem-5.14, and vim).

The collective thoughts of the interwebz