Post Syndicated from The History Guy: History Deserves to Be Remembered original https://www.youtube.com/watch?v=LFvUk27Y-P8
UK Government to Launch PR Campaign Undermining End-to-End Encryption
Post Syndicated from Bruce Schneier original https://www.schneier.com/blog/archives/2022/01/uk-government-to-launch-pr-campaign-undermining-end-to-end-encryption.html
Rolling Stone is reporting that the UK government has hired the M&C Saatchi advertising agency to launch an anti-encryption advertising campaign. Presumably they’ll lean heavily on the “think of the children!” rhetoric we’re seeing in this current wave of the crypto wars. The technical eavesdropping mechanisms have shifted to client-side scanning, which won’t actually help — but since that’s not really the point, it’s not argued on its merits.
New Agent 2 features in Zabbix 6.0 LTS by Aigars Kadiķis / Zabbix Summit Online 2021
Post Syndicated from Aigars Kadiķis original https://blog.zabbix.com/new-agent-2-features-in-zabbix-6-0-lts-by-aigars-kadikis-zabbix-summit-online-2021/18929/
Zabbix Agent 2 has been developed to provide additional benefits to our users – From a larger set of supported metrics to metric collection logic improvements and simplified custom monitoring plugin development. Let’s look at what new features Zabbix Agent 2 will receive in Zabbix 6.0 LTS.
The full recording of the speech is available on the official Zabbix Youtube channel.
What is Zabbix agent?
First, let’s talk about the key benefits you gain with Zabbix agent and how it can add an additional layer of flexibility to your monitoring:
- Zabbix Agent is a daemon that collects your metrics
- Available on Windows and Unix-like systems
- Rich capabilities out of the box
- Natively supports the collection of a large set of OS-level metrics such as memory/CPU/storage/file statistics and much more
- Provides native log monitoring capabilities
- Can be extended
- Select the direction of the communication between the Zabbix server and the Zabbix agent
- Push the metrics to the Zabbix server with active checks
- Let the Zabbix server poll the agent with passive checks
- Control over the data collection interval
- Ability to schedule checks and define flexible metric collection intervals
- For example – You can collect metrics at a specific time or only during working hours
Why Zabbix agent 2?
Now that the key benefits of using a Zabbix agent are clear, let’s answer the question – why should I consider using Zabbix agent 2 instead of sticking with the classical agent?
The main goal of Zabbix Agent 2 is the ability to have a simple and flexible to extend the metric collection capabilities of the agent. This is true for both the internal development of new native Zabbix Agent 2 metrics and for custom Zabbix Agent 2 plugin development done by our community. We manage to achieve this goal by developing the Zabbix Agent 2 in GO. Less code, more flexibility, and a much more modular approach – all of this thanks to the GO language.
In addition to the aforementioned metric collection improvements, with Zabbix agent 2, we were also able to solve many ongoing design problems. The Zabbix agent 2 introduces improvements such as:
- Support for check concurrency for active checks (this was not the case with the classical Zabbix Agent – active check metrics were collected one at a time)
- Support for persistent data storage on the Agent side
- Reduced number of TCP connections between the Zabbix agent 2 and Zabbix server
- HTTPS web site checks out of the box on Windows
- Concurrency support provides the ability to read multiple log files in parallel
- Out of the box monitoring for many different applications
Let’s take a look at some of the more popular systems that Zabbix Agent 2 can monitor out of the box
Certificate monitoring
The ability to perform certificate monitoring out of the box has been a long-awaited feature. One of the more common requests was monitoring the certificate expiry date. With Zabbix agent 2, it is possible to perform certificate monitoring with a native Zabbix agent item:
Zabbix agent item key for certificate monitoring:
web.certificate.get[hostname,<port>,<IP>]
This item will return:
- X.509 fields
- Validation result
- Fingerprint field
Example:
web.certificate.get[blog.zabbix.com,443]
This item will collect multiple certificate metrics in bulk. We can then obtain the necessary information by using the Zabbix dependent items. You can take a look and download the latest official template from our git page. The template already contains the necessary master/dependent items – all you have to do is import the template and apply it to your hosts.
IoT monitoring – MQTT
Zabbix Agent 2 is capable of performing IoT monitoring out of the box. Zabbix Agent 2 provides items for both MQTT and Modbus monitoring.
Below you can find an example of how the mqtt.get item can obtain metrics on specific MQTT topics:
mqtt.get["tcp://host:1883","path/to/topic"]
mqtt.get["tcp://host:1883","path/to/#"]
Zabbix Agent 2 is also officially supported on Raspberry Pi devices. This makes things even easier for IoT monitoring since we can simply deploy our Zabbix Agent 2 on a Raspberry Pi device in close proximity to our monitored IoT devices.
Out of the box database monitoring
With the classical agent, we had to resort to using user custom monitoring approaches for database monitoring. This was achieved either by using UserParameters, external scripts, or some other custom approach. With Zabbix agent 2, we provide native database monitoring for a large selection of SQL and NoSQL database engines.
You can find the official Zabbix database monitoring templates on our git page.
Systemd monitoring
Another long-awaited feature is native systemd monitoring. Zabbix Agent 2 provides a flexible set of items and discovery rules with which you can monitor a specific systemd unit property, discover systemd services in an automated fashion and retrieve all of the systemd unit properties in bulk.
Discover a list of systemd units and their details:
systemd.unit.discovery[<type>]
Retrieve all properties of a systemd unit:
systemd.unit.get[unit name,<interface>]
Retrieve information about a specific property of a systemd unit:
systemd.unit.info[unit name,<property>,<interface>]
These items can then be used to define triggers like:
- If service is scheduled at system bootup but not running right now, then generate a problem
- If service is not scheduled at startup but running right now, notify us that we forgot to enable the service
- and much more!
You can find more information about the official systemd template on our git page.
Docker monitoring
As with previous templates, the Zabbix Agent 2 docker monitoring also provides items for individual metrics and discovery rules for automated container discovery:
- Discover all containers or only currently running containers automatically
- Per container monitoring
- CPU
- Memory
- Network
You can find more information about the official Docker template on our git page
Additional applications supported by Zabbix agent 2
And that’s not all! Zabbix Agent 2 provides out of the box monitoring for many other systems, like:
- Ceph – an open-source software storage platform
- Memcached – a general-purpose distributed memory-caching system
- Smart – Self-Monitoring, Analysis, and Reporting Technology
If you’re interested in the full list of the official Zabbix templates, you can find all of them on our git page
Agent 2 plugins
The underlying Zabbix Agent 2 structure is based on GO plugins. This approach is used for both the official Zabbix Agent 2 items and should be used for the development of custom community extensions.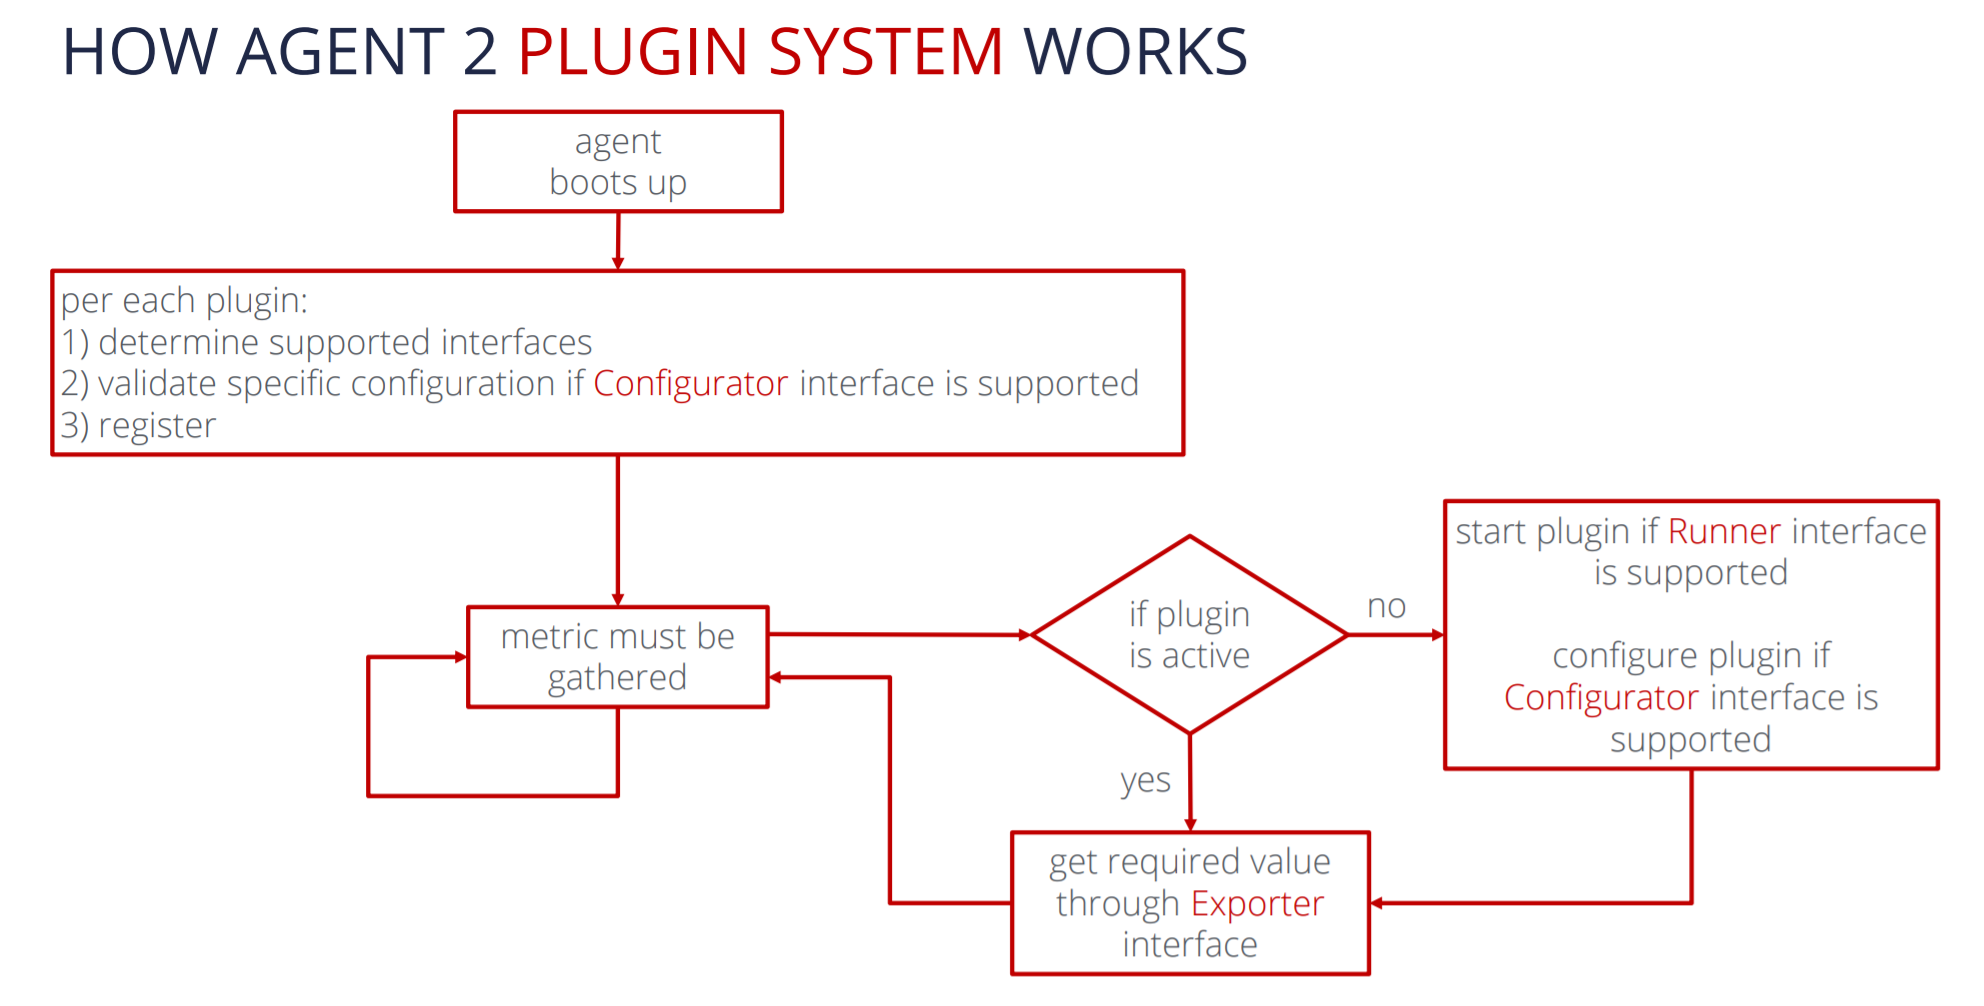
On startup, Zabbix agent 2 scans a specific directory and determines the supported interfaces per each plugin. Next, Zabbix will validate the existing plugin configuration and register each plugin in the aforementioned directory. Now we can begin the monitoring workflow. Once a metric has been requested, Zabbix agent 2 will check if the plugin responsible for collecting the particular metric is currently active. If it’s inactive – Agent 2 will check if the specific plugin supports the Runner interface and attempt to start it. Next, Agent 2 will check if the Configurator interface is available and perform the plugin configuration. Lastly, once the plugin is active, Agent 2 will collect the metric by using the Exporter interface. Next time the metric is requested – the plugin will already be active, and Agent 2 can immediately request the metric from the Exporter interface.
But is there a situation when a plugin can remain inactive – does it get unloaded after some time? The plugin does not stay loaded in memory indefinitely. If a plugin hasn’t received a request for 24 hours, the plugin will be deactivated, and it will get unloaded from the memory.
Loadable plugins
Let’s summarize the Zabbix Agent 2 plugin logic:
- External plugins are loadable on Zabbix agent 2 startup, with no need to recompile Zabbix Agent 2
- Connections bidirectionally to the plugins using Unix sockets on Linux and Named Pipes on Windows
- Backward compatible with older plugins
- The plugin is deactivated if:
- any related passive item key has not been used for 24h
- the active item is not in the active checklist
- Custom plugin architecture remains the same as it was for the internal plugins
- Separate repository for community plugins and integrations
Supported platforms for Agent 2
At this point, you may be wondering – what about compatibility? Can I use Zabbix Agent 2 as a replacement for the classical Zabbix Agent? Can it be used on the same platforms? Let’s take a look at the platforms on which you can deploy Zabbix Agent 2:
- RHEL/CentOS 6,7,8
- SLES 15 SP1+
- Debian 9,10,11, Ubuntu 18.04, 20.04
- Raspberry Pi OS, Ubuntu ARM64
- Windows 7 and later, Windows Server 2008R2 and later
If you wish to deploy Agent 2 on a system that is not officially supported, the main takeaway is – GO environment needs to be supported on the system. This means that for Zabbix Agent 2 to run, you will have to provide a set of dependencies for GO language support. If that’s the case – you should be able to compile Zabbix Agent 2 on your system.
New Agent keys
Finally, let’s cover some new Zabbix agent item keys that are available in Zabbix 6.0 LTS. Since we don’t plan on halting the support for the classical Zabbix Agent, these item keys will be supported by both Zabbix Agent and Zabbix Agent 2.
Agent variant
- agent.hostmetadata – obtains the agent metadata from the Zabbix agent configuration
- agent.variant
- Returns 1 for C agent – Zabbix agent
- Returns 2 for Go agent – Zabbix agent 2
File properties
- vfs.file.permissions – returns 4-digit string containing octal number with Unix permissions
- vfs.file.owner – returns the user ownership of file
- vfs.file.get – returns information about a file. Similar to the stat command result
- vfs.dir.get – get information about directories and files
- vfs.file.cksum – now with md5 and sha256
- vfs.file.size – measure the file size bytes or in lines in the file
vfs.dir.get on Windows
Below is an example of how most .get item keys behave. Here we can see bulk information about the contents of a directory in a JSON array. This can then be used in low-level discovery to automatically monitor the parameters for each entity obtained by the vfs.dir.get item. Below is an example output of the vfs.dir.get key executed on Windows. Note that this is just a partial output – the real JSON file will most likely contain multiple such elements related to each of the files discovered in the directory.
[{
  "basename": "input.json",
  "pathname": "c:\\app1\\temp\\input.json",
  "dirname": "c:\\app1\\temp",
  "type": "file",
  "user": "AKADIKIS-840-G2\\aigars",
  "SID": "S-1-5-21-341453538-698488186-381249278-1001",
  "size": 2506752,
  "time": {
    "access": "2021-11-03T09:19:42.5662347+02:00",
    "modify": "2020-12-21T16:00:46+02:00",
    "change": "2020-12-29T12:20:10.0104822+02:00"
  },
  "timestamp": {
    "access": 1635923982,
    "modify": 1608559246,
    "change": 1609237210
  }
}]
vfs.file.get on Linux
As we can see, the output of vfs.file.get is also very similar to the previous get request. As I’ve mentioned before – the information here is similar to what the stat command provides.
{
  "basename": "passwd",
  "pathname": "/etc/passwd",
  "dirname": "/etc",
  "type": "file",
  "user": "root",
  "group": "root",
  "permissions": "0644",
  "uid": 0,
  "gid": 0,
  "size": 3348,
  "time": {
    "access": "2021-11-03T09:27:21+0200",
    "modify": "2021-10-24T13:18:18+0300",
    "change": "2021-10-24T13:18:18+0300"
},
"timestamp": {
    "access": 1635924441,
    "modify": 1635070698,
    "change": 1635070698
  }
}
More dimensions for discovery keys
The functionality of some of the existing keys has also been improved in Zabbix 6.0 LTS. For example, for vfs.fs.discovery and vfs.fs.get keys Zabbix will now also collect the file system label as the value of the {#FSLABEL} macro.
- vfs.fs.discovery – will now retrieve an additional label value – {#FSLABEL}
- vfs.fs.get – will now retrieve an additional label value – {#FSLABEL}
[{
  "{#FSNAME}": "C:",
  "{#FSTYPE}": "NTFS",
  "{#FSLABEL}": "System",
  "{#FSDRIVETYPE}": "fixed"
}]
Questions
Q: Can we run both of the agents at the same time – Zabbix Agent and Zabbix Agent 2?
A: Yes, both of the agents can be started on the same machine. All we have to do is adjust the listen port for one of the agents since, by default, both of them will try to listen on port 10050. Therefore, we need to switch that port to something else for one of the agents. You can also simply disable the passive checks for one of the agents, so it’s not listening for incoming connections at all – such an approach will also work.
Q: Can I use the Zabbix agent if I don’t have administrative privileges?
A: Yes, most definitely. You can run the agent under any other user both on Windows and Linux. Just make sure that the user has access to the information (logs, files, folders, for example) that the Zabbix agent needs to monitor.
Q: Are there any use cases where the classical C Zabbix agent is better than Zabbix agent 2?
A: First off, the binary size for the classical Zabbix agent is definitely smaller, so that’s one benefit. The Zabbix Agent 2 also has a more complex set of dependencies required to run it, so if for some reason we cannot provide the necessary GO dependencies for Zabbix agent 2, then the classical Zabbix agent is the way to go. In addition, if you’re using some kind of automation or orchestration tools to deploy Zabbix agents – having the same type of agent everywhere will make life easier for you, so that’s something else to take into account when pi
The post New Agent 2 features in Zabbix 6.0 LTS by Aigars Kadiķis / Zabbix Summit Online 2021 appeared first on Zabbix Blog.
Calling all young creators: Get ready for Coolest Projects Global 2022
Post Syndicated from original https://www.raspberrypi.org/blog/coolest-projects-2022-tech-showcase-get-ready/
It’s time to start your countdown! Young people from all over the world will soon be invited to share their digital creations at Coolest Projects Global 2022, our world-leading online technology showcase event for young creators. In mid-February, project registration opens for a new and improved, online-only experience.

Through Coolest Projects Global, young creators can register their digital projects to share them with the world, represent their country, get some free swag, and maybe even win recognition from our special judges. And the best thing: Coolest Projects participants join a global community of awesome young tech creators who celebrate each other’s accomplishments.

Here’s what you should know about Coolest Projects Global
- Coolest Projects Global is free and open to young creators up to 18 years old, working independently or in teams of up to 5 creators.
- Creators of all skill levels are encouraged to participate. Coolest Projects is for young people who are beginners, or advanced, or anything in between.
- Project registration opens on 14 February and stays open until 11 May.

- Projects can be registered in the following categories: Scratch, games, web, mobile apps, hardware, and advanced programming.
- Judges will evaluate projects based on their coolness, complexity, design, usability, and presentation.
- Coolest Projects Global is a completely free event for all participants, and it’s entirely online.
What’s new in 2022?
Coolest Projects is celebrating its TENTH YEAR of shining a light on young creators, so we have an extra special showcase lined up in 2022. All of these enhancements are the result of incredibly helpful feedback that past creators have shared. Here’s a sneak peek at what you can look forward to:
- Creators will receive project feedback from the judges after the celebration event in June. The celebration will be streamed live online in early June. Stay tuned for more details as the event gets closer.
- Creators will be eligible to receive limited-edition digital and physical swag.
- Creators will be able to categorise their project into topics such as health, environment, community, art, and more.
- Creators who have projects selected as favourites by the special judges will receive a commemorative medal.

What do young people say is so cool about Coolest Projects?
We asked past creators what they think makes Coolest Projects so cool, and here’s what they had to say:
- “The freedom we had to create whatever we want!”
- “We can get inspiration from sharing our ideas about real-life situations.”
- “Seeing all the different ideas people had and how they went about doing their projects.”
- “The opportunity to let the creativity flow and participate at a global level.”
Last year, creators showcased all kinds of projects, such as an earthquake early warning device, a fun math game made with Scratch, a squirrel detection system, and a website about cybersecurity. Don’t forget, Coolest Projects is for creators who are beginners, advanced, and everything in between.

Next steps
Project registration opens on 14 February, but creators can start making their projects now. For inspiration, check out last year’s project gallery and then sign up to receive email updates so that you don’t miss a thing about Coolest Projects. We have many more exciting details coming in the next weeks and months, so stay tuned.
Until next time… be cool, creators.
The post Calling all young creators: Get ready for Coolest Projects Global 2022 appeared first on Raspberry Pi.
The Experiment Podcast: Is It Our Right to Use Drugs?
Post Syndicated from The Atlantic original https://www.youtube.com/watch?v=D2X8c5sZAH8
На фона на скандалите около АМ “Хемус” Има Такъв #АПИГейт. Караджов освободи шефката на „Автомагистрали“ след статия на „Биволъ“
Post Syndicated from Николай Марченко original https://bivol.bg/%D0%B8%D0%BC%D0%B0-%D1%82%D0%B0%D0%BA%D1%8A%D0%B2-%D0%B0%D0%BF%D0%B8%D0%B3%D0%B5%D0%B9%D1%82-%D0%BA%D0%B0%D1%80%D0%B0%D0%B4%D0%B6%D0%BE%D0%B2-%D0%BE%D1%81%D0%B2%D0%BE%D0%B1%D0%BE%D0%B4%D0%B8-%D1%88.html
понеделник 17 януари 2022

Новият вицепремиер и министър на регионалното развитие и благоустройството Гроздан Караджов от квтотата на “Има такъв народ” (ИТН) подписа днес заповед за освобождаване на изпълнителния директор на „Автомагистрали“ ЕАД Десислава…
[$] Brian Kernighan on the origins of Unix
Post Syndicated from original https://lwn.net/Articles/881431/rss
Once again, the COVID pandemic has forced linux.conf.au to go virtual, thus
depriving your editor of a couple of 24-hour, economy-class, middle-seat
experiences. This naturally leads to a set of mixed feelings. LCA has
always put a priority on interesting keynote talks, and that has carried
over into the online event; the opening keynote for LCA 2022 was given by
Brian Kernighan. Despite being seen as a founder of our community,
Kernighan is rarely seen at Linux events; he used his LCA keynote to
reminisce for a while on where Unix came from and what its legacy is.
FFmpeg 5.0 released
Post Syndicated from original https://lwn.net/Articles/881551/rss
Version 5.0 of the FFmpeg
audio and video toolkit has been released.
For this long-overdue release, a major effort underwent to remove
the old encode/decode APIs and replace them with an N:M-based API,
the entire libavresample library was removed, libswscale has a new,
easier to use AVframe-based API, the Vulkan code was much improved,
many new filters were added, including libplacebo integration, and
finally, DoVi support was added, including tonemapping and
remuxing. The default AAC encoder settings were also changed to
improve quality.
New stable kernels
Post Syndicated from original https://lwn.net/Articles/881546/rss
Greg Kroah-Hartman has announced the release of the 5.16.1, 5.15.15, 5.10.92, and 5.4.172 stable kernels. They contain a
relatively small set of important fixes; users should upgrade.
Security updates for Monday
Post Syndicated from original https://lwn.net/Articles/881545/rss
Security updates have been issued by Debian (chromium, firefox-esr, ghostscript, libreswan, prosody, sphinxsearch, thunderbird, and uriparser), Fedora (cryptsetup, flatpak, kernel, mingw-uriparser, python-celery, python-kombu, and uriparser), Mageia (htmldoc, mbedtls, openexr, perl-CPAN, systemd, thunderbird, and vim), openSUSE (chromium and prosody), Red Hat (httpd, kernel, and samba), Scientific Linux (kernel), Slackware (expat), SUSE (ghostscript), and Ubuntu (pillow).
Cloudflare customers on Free plans can now also get real-time DDoS alerts
Post Syndicated from Omer Yoachimik original https://blog.cloudflare.com/free-ddos-alerts/


We’re excited to announce that customers using our Free plan can now get real-time alerts about HTTP DDoS attacks that were automatically detected and mitigated by Cloudflare. The real-time DDoS alerts were originally announced over a year ago but were made available to customers on the Pro plan or higher. This announcement extends the DDoS alerts feature to Free plan users. You can read the original announcement blog post here.
What is a DDoS attack?
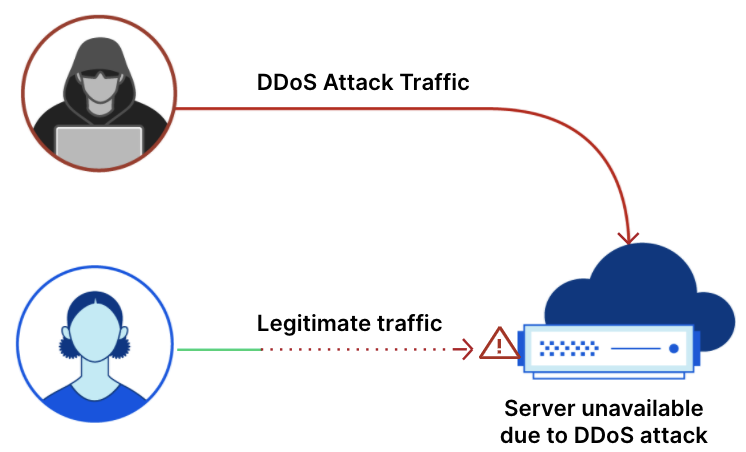
A Distributed Denial of Service (DDoS) attack is a cyber-attack that attempts to disrupt your online business. Whether your business relies on VoIP servers, UDP-based gaming servers, or HTTP servers, DDoS attacks can be used to disrupt any type of Internet property, server, or network.
In this blog post, we’ll focus on DDoS attacks that target HTTP servers. Whether your HTTP server is powering a mobile app, an eCommerce website, an API gateway, or any other HTTP application, if an attacker sends you more requests than it can handle, your server won’t be able to serve your real users. A flood of requests can cause service disruptions or even take your entire server offline. DDoS attacks can have real-world consequences such as a blow to your revenue and reputation.
How Cloudflare detects and mitigates DDoS attacks
Protecting your server against DDoS attacks requires two main capabilities:
- The bandwidth to absorb both your users’ requests and the attack requests
- The ability to differentiate between your users’ requests and the attack requests
Using our home-grown systems, we do just that, regardless of the size, frequency and duration of the attacks. All Cloudflare customers, including those using the Free plan, are protected by our unmetered DDoS mitigation commitment.
To protect against DDoS attacks, first, we route your traffic to our network of data centers. Our network spans more than 250 cities in over 100 countries around the world. Its capacity is over 100 Tbps — fifty times larger than the largest attack we’ve ever seen. Our bandwidth is more than enough to absorb both your users’ traffic and attack traffic.

Cloudflare’s global network
Second, once your traffic reaches our data centers, it goes through state-of-the-art analysis mechanisms that constantly scan for DDoS attacks. Once an attack is detected, a real-time mitigation rule is automatically generated to surgically mitigate the attack requests based on the attack pattern, whilst leaving your users’ requests untouched. Using the HTTP DDoS Managed Ruleset you can customize the settings of the mitigation system to tailor it to your needs and specific traffic patterns.
Not sure what to do? That’s ok. For the most part, you won’t need to do anything and our system will automatically keep your servers protected. You can read more about it in our Get Started guide or in the original blog post. If you’re interested, you can also read more about how our mitigation system works in this technical blog post: A deep-dive into Cloudflare’s autonomous edge DDoS protection
Configuring a DDoS alert
Once our system detects and mitigates a DDoS attack, you’ll receive a real-time alert. To receive an alert, make sure you, first, configure a notification policy by following these steps:
- Log in to the Cloudflare dashboard and select your account.
- In the Home Screen, go to Notifications.
- Click Add and choose the HTTP DDoS Attack Alerter.
- Give your alert a name, an optional description, add the recipients’ email addresses and click Create.
To learn more about DDoS alerts and supported delivery methods, check out our guide Understanding Cloudflare DDoS Alerts.
Free DDoS protection, control, and visibility
Cloudflare’s mission is to help build a better Internet, and it guides everything we do. As part of this mission, we believe that a better Internet is one where enterprise-grade DDoS protection is available for everyone, not just bigger organizations.
Furthermore, we’ve also made our DDoS Managed Ruleset available for everyone to make sure that even non-paying customers can tailor and optimize their DDoS protection settings. Taking a step further, we want all of our users to be able to react as fast as possible when needed. This is why we’re providing real-time alerts for free. Knowledge is power, and notifying our users of attacks in real-time empowers them to ensure their website is safe, available, and performant.
Not using Cloudflare yet? Start now.
Forgotten Battle of Thermopylae: The Celtic Invasion of Greece
Post Syndicated from The History Guy: History Deserves to Be Remembered original https://www.youtube.com/watch?v=t5cizVNSNEI
An Examination of the Bug Bounty Marketplace
Post Syndicated from Bruce Schneier original https://www.schneier.com/blog/archives/2022/01/an-examination-of-the-bug-bounty-marketplace.html
Here’s a fascinating report: “Bounty Everything: Hackers and the Making of the Global Bug Marketplace.” From a summary:
…researchers Ryan Ellis and Yuan Stevens provide a window into the working lives of hackers who participate in “bug bounty” programs — programs that hire hackers to discover and report bugs or other vulnerabilities in their systems. This report illuminates the risks and insecurities for hackers as gig workers, and how bounty programs rely on vulnerable workers to fix their vulnerable systems.
Ellis and Stevens’s research offers a historical overview of bounty programs and an analysis of contemporary bug bounty platforms — the new intermediaries that now structure the vast majority of bounty work. The report draws directly from interviews with hackers, who recount that bounty programs seem willing to integrate a diverse workforce in their practices, but only on terms that deny them the job security and access enjoyed by core security workforces. These inequities go far beyond the difference experienced by temporary and permanent employees at companies such as Google and Apple, contend the authors. The global bug bounty workforce is doing piecework — they are paid for each bug, and the conditions under which a bug is paid vary greatly from one company to the next.
ZABBIX – Open-Source Monitoring Software for Automotive Monitoring
Post Syndicated from Dmitry Lambert original https://blog.zabbix.com/zabbix-open-source-monitoring-software-for-automotive-monitoring/18776/
In this article, I will try to cover the theoretical models on monitoring your vehicle fleet with minimal to no cost at all by using the ELM327 microcontroller, a python library to process the collected data and a Zabbix proxy running on a small Raspberry Pi device to store and sent the collected metrics to the central Zabbix server.
Expanding the scope of our Zabbix instance
The first thing that comes to mind when someone mentions a monitoring system is pretty simple. People think about server monitoring, and with servers, we usually mean Linux and Windows systems and also network monitoring for all kinds of flavors of switches, routers, firewalls, etc. But by putting so much focus on these standard things, we are someway limiting the possibilities of monitoring systems. Zabbix has proven itself as an extremely powerful monitoring tool that can combine and monitor all client infrastructure – no matter if we are talking about the aforementioned servers, network devices, services, applications, or anything else. And most important – Zabbix is truly a 100% open-source product, which allows anyone to use all listed functionalities for free.
Please, keep in mind that no doubt there are systems available that are created exactly for the same purpose I will cover here. Maybe they are more reliable. Perhaps they require less effort to achieve the desired result. But that is the exact reason why the presented model is mostly theoretical, with the primary goal being to show that it is hard to put Zabbix in some functionality boundaries. Usually, the only limitation is our imagination. And it is up to you to treat this information for pure entertainment or try to implement it in a place where you find it suitable.
Monitoring a car fleet
Let’s get straight to the point. You don’t need to own a huge logistics company with a thousand vehicle fleet to understand it. In simple words – if you or any of your relatives own a car, you should be aware that cars tend to break. Just like it usually happens, there could be many types of issues, starting with a flat tire and ending with some ongoing damage in the gearbox or engine. It is important to understand that vehicles themselves are becoming smarter. If in the past it was a purely mechanical device, then nowadays it is a highly complicated electronic system on top of that mechanical device that can diagnose the slightest deviations from accepted norms that are set by the manufacturer and inform about this malfunction either with an indicator light on your dash or simply with a log message that will be accessible only when read with specialized software or tools.

Keep in mind that malfunctions in vehicles are not as simple as boolean ( works or not ). In most cases an issue is noticed before the car is not able to move forward, and the purpose of that is to be informed and fix the issue before it has turned into a defect that actually prevents the vehicle from functioning.
And now think about this from an automotive business perspective. We may be talking about hundreds of vehicles that are always on the move to deliver something or someone in time. It should be straightforward that in such a niche business, each of these vehicles should be able to traverse close to a thousand kilometers per day.

Thankfully, as mentioned previously, the smart diagnostic system will let you know about all the potential problems. On the other hand, the driver of the vehicle usually has nothing to do with its repairs or technical condition. So in a perfect world, we should have a few technical employees that would simply ask returning driver whether everything is fine with the car after his shift – are there any errors, and connect with diagnostic software to read its logs to make sure that everything actually is ok. If it’s not ok, information should be passed to the technical department to move this vehicle to the maintenance.
Why such pressure? Well, remember that most of these notifications serve as a warning that something is not working as it should, but currently, it is not causing harm. However, if it is ignored, there is a high chance that at some point, the vehicle will not be able to continue its way to the destination.

So this is where Zabbix joins the conversation. Imagine if all this data transfer from the vehicle diagnostic system to the responsible employees would happen automatically, with potential error prioritization and escalation to further levels if any vehicle has an ongoing issue that remains active for multiple days. And remember that Zabbix is a completely free and open-source system, which means that we could achieve this result for free. And we are absolutely not limited to DTC ( Diagnostic Trouble Codes ) readings. Combining this ecosystem with the recent Zabbix 6.0 LTS release, we can create a geomap with the current location of any vehicle from our fleet. With a little effort, we can also get speed measurements, long stops, starts, and much more.
This is the part when the tested but still theoretical model comes into action. By now, we are aware that a car is way smarter than it may look, and it gathers and stores a lot of useful information. However, the Zabbix monitoring system as per the most common standard sits somewhere in our headquarters and monitors generic metrics of our IT infrastructure. So how could we potentially get this information from our vehicle to Zabbix?

Since all information is stored in ECU (Electronic Control Unit), there is also a way to read it. And it is achieved through OBD (On-Board Diagnostic) socket through the standardized protocol. Just like anything else, OBD has multiple versions or protocols of communications. Still, if we are talking about seamlessly modern cars, most likely we are talking about OBD-II, which included Electronic signaling and messaging format.
Using ELM327 to gather data
precisely OBD-II will help us to gather all information from the vehicle, to further transfer it to our Zabbix monitoring system. Initially, this may yet sound very unclear because we have some kind of socket to access our ECU, but how can we actually gather some meaningful data? For that, we will need ELM327

ELM327 is a programmed microcontroller produced by ELM Electronics for translating the OBD interface. Even today ELM327 command protocol is one of the most popular PC to OBD interface standards. Typically ELM abstracts the low-level protocol and presents a simple interface that can be called via UART, typically by a hand-held diagnostic tool or a computer program connected by USB, RS-232, Bluetooth, or WiFi. In our case, we don’t need and don’t have any dedicated diagnostic tool, so we will have to use something else to work with OBD-II and translate all incoming data. With the ELM-327, it is straightforward. You can purchase an ELM327 OBD2-Bluetooth adapter on Amazon for a couple of dollars, and it will be enough to provide the required functionality.

Data processing with Python-OBD and Raspberry Pi
As it usually happens, for all things that we need, we can find a Python library published under GPLv2. And as you already noticed from the screenshot, we are not limited to stored DTC values. In addition to that, we are able to read live data from our vehicle, such as speed, fuel pressure, coolant temperature, intake temperature, and much more.

The closer we get to the result, the simpler the task starts to look. At this point, we basically have everything that we need. We have the data, and we have the interface from which to read it. ELM327 allows us to transport this data to our device, and the python library will enable us to translate and process this information, therefore allowing sending clean data to our Zabbix. The only open question is what device should we use in our vehicle, on which we could run our Python script, and which would have GSM access to transfer gathered data to the Zabbix server. In my example choice was as simple as cheap – Raspberry Pi.

And then it’s a matter of choice when you have Raspberry set up on a vehicle, connected via Bluetooth or any other way to your ELM327, that is plugged into an OBD-II connector. With Python script running on Pi device to receive and process data from our ECM, we need to decide what piece of software from Zabbix we want on this device.
Zabbix proxy for data storage
Considering that the car could be driving through different areas where internet coverage could not be the best, but we also don’t want to lose any data simply because there was no connection, I think it is best to install Zabbix proxy on Raspberry Pi.
Zabbix proxy perfectly suits such a small setup and helps us with its main purpose. Proxy has a local database that stores all information that has to be sent to our Zabbix server. If because of some networking trouble this data can’t be passed to our server, it will be kept in the local database for a moment when a network connection is restored and data is sent. Luckily for us, Zabbix has Official Packages for Raspberry Pi OS, so we don’t need to tailor any magic around it.
The functionality of the Zabbix proxy allows us to choose between two modes ( Active and Passive ), which basically allows us to choose the direction of communication. It might not be the cheapest approach to purchase a static IP address for each unit. Therefore we will be using Zabbix Proxy (Active), which simply will connect to our Zabbix server and send all gathered information. Of course, there are security measures for validation to make sure that only designated devices will be able to send data to a server. If an even more secure approach is required, users may choose to use TLS encryption with PSK or Certificates.

Collecting the current latitude and longitude
Previously I mentioned, that with the new Geomap widget, it is possible to achieve a live view of the current location from all your fleet on a single dashboard. To do that, we obviously need live latitude and longitude readings, which ECU and stock Raspberry Pi are not able to provide. But this is the beauty of Raspberry Pi. With minimal investments, we can purchase a GPS unit and combine it with our Pi.

With a very simplified Python script, we can gather all required data, and move it to our Zabbix proxy that is installed on localhost, which then will parse this information to our Zabbix Server that will allow us to see it in the dashboard. As this is not a very native and straightforward approach to monitoring, we won’t be able to use native item types to collect this data. This means that all the collection must be done within the script, and then we need to pass this data using the Zabbix-sender utility. The purpose of this utility is very simple, without any complications, take data that is provided and send it to a specified Hostname.

Since Zabbix has a very powerful preprocessing engine, we don’t have to make our script over-complicated with data transformation to meet guidelines for data visualization within Zabbix. We can send raw data, just like it is, and then use any suitable preprocessing step in the Zabbix frontend to extract the value we need to visualize.

The many uses of the collected data
When the data arrives in the Latest data in our Zabbix frontend, consider the most complicated part of this task is done. And just like before the idea of automotive monitoring with Zabbix, the only limitation is your imagination. You can simply collect this data without any actions. Monitor it on your own, from time to time, just to see if you can do anything meaningful with it.
You are also able to utilize a wide list of trigger functions within Zabbix to define that it is a problem when some particular value is received. For example, when some DTC appeared on a device, or let’s say, the average speed of the vehicle exceeds a threshold. Maybe you want to set some borders for coordinates, and if a particular vehicle gets outside of a specified radius, it could raise a problem in your monitoring system.
It is up to you how to react to these triggers. It could be just a flashing light on your Problems view within the Zabbix frontend. It could also automatically create incidents for your maintenance team with a message that a particular vehicle has worn out brake pads that has to be replaced. But maybe if these brake pads are not replaced for a full week since the first time it was noticed, you want to receive a personalized message on your mobile phone so that you can escalate this issue further.
No secret that there are flaws and downsides. As I mentioned right in beginning, there are software and devices that are developed and adopted exactly for this purpose, however, my approach may not be 100% reliable. Data transfer from ECU is not as live as reading CPU utilization from your computer. All of this is just a reminder that monitoring is not limited to network devices and servers. And Zabbix, which is growing every year, provides more and more features to its users while remaining absolutely free and open-source, is here to support all your ideas and help them come to life.
The post ZABBIX – Open-Source Monitoring Software for Automotive Monitoring appeared first on Zabbix Blog.
Закъде бърза министър-председателят?
Post Syndicated from original https://toest.bg/zakude-burza-ministur-predsedatelyat/
В първите дни на новата година бе съобщено, че новоназначената външнополитическа съветничка на новия премиер Кирил Петков и доскорошна зам.-директорка на ЕСВП Весела Чернева се намира в Скопие, където договаря официалната визита на министър-председателя в Република Северна Македония. Посещението ѝ, което по принцип следваше по-скоро да остане необявено за широката публика, бързо придоби гласност, а по думите на информирани източници, все още заемащият тогава поста на главен преговарящ с България Владо Бучковски дори не успял да прикрие факта, че г-жа Чернева е в Скопие. Както се казва, четата бе издадена.
Отвъд общите заявления за по-скоро протоколния характер на посещението се появиха съмнения, че съветничката е водила допълнителни разговори по теми, които не са достояние на професионалната гилдия в София. Какви са тези разговори и защо г-жа Чернева е заявила намерението си до юни т.г. РСМ да бъде допусната до преговори за членство, остава неясно. Поне никой от онези, които следва да знаят, не са информирани.
Бърза ли се и защо?
Подготовката на посещението на Петков в Скопие се посреща с обоснован негативизъм в София. Многобройни са коментарите на онези, които професионално се занимават с дипломация и национална сигурност, относно ненавременния и твърде противоречив характер на това посещение. Дори се стигна до конспиративното допускане, че карантинирането на Петков след КСНС е всъщност начин да се отложи неговата визита. Като всяка конспирация, и тази излезе ялова.
Друго обаче е очевидно – посещението на Кирил Петков и придружаващата го делегация от хора, които сякаш не са съвсем запознати с методиката и принципите на провежданата политика спрямо РСМ, е действително прибързано и противоречи на правилата за водене на преговори със страна, която не е готова да говори с нас от позицията на взаимния компромис и интерес. Ако беше иначе, то три дни преди визитата – на 15 януари, бъдещият премиер на РСМ Димитър Ковачевски нямаше да заяви, че Скопие няма да води разговори за езика и идентичността си. А на 16 януари в българските медии нямаше да излезе информация, в която се цитира мнението на Клаудия Тени, член на Конгреса на САЩ и представителка на лобито на РСМ във Вашингтон, относно възможността да бъдат приети санкции срещу България заради позицията ни спрямо РСМ.
Това е натиск.
Югозападната ни съседка продължава да изопачава и дори дезинформира, като твърди, че България оспорва идентичността ѝ. Известно е, че това не е така, защото Република България все пак е първата държава, признала независимата Македония преди 30 години, като настояваме единствено Скопие да изпълнява подписания двустранен договор.
Скопие не се готви да преговаря и по ясен начин демонстрира, че поставя условия, които противоречат на духа на водените до момента преговори с България. Скопие на практика и показва кое за РСМ е червена линия – онова, за което заседава смесената комисия. Дали и защо тази комисия стигна до задънена улица, е въпрос на допълнителен анализ, който обаче ще се води в София – и то след като темата РСМ е затворена. Сега не е моментът.
Ако г-н Петков наистина смята, че отивайки с министрите си на транспорта и на външните работи и предлагайки да отвори петте работни групи за двустранните отношения със Скопие, ще реши проблеми, които от повече от десетилетие остават открити, следва да бъде посъветван, че
може да очаква провал.
(Между другото, мнението на МВнР по темата за РСМ и новия подход на Петков остава дълбоко неизвестно, което поставя въпроса дали министър Теодора Генчовска внимава какво се случва в Министерския съвет и разбира динамиката на събитията.)
Много е изговорено за Коридор №8 и двустранната търговия и ако новото правителство има нагласата, че досега нещо не е направено както трябва, нека все пак попита. Тогава ще разбере и защо по тези въпроси няма напредък. Любимата тема на Петков – неговият аргумент sine qua non – за липсата на самолетна линия между Скопие и София звучи наивно. Премиерът Петков твърди, че е бизнесмен, и като такъв следва да си зададе въпроса защо от 1990 г. до днес такава линия няма. Може би няма икономически интерес? И ако е така, той ли ще е човекът, който ще застави националния превозвач „България Ер“ да лети до Скопие? Между другото, компанията е частна.
Да бъде отклонено посещението в Скопие е въпрос на прагматичен интерес. Това би показало, че в София управляват хора, които имат представа и за националния интерес. България не може да бъде притискана и не следва да допуска да бъде поставяна в неизгодно положение от хора, чийто досег с дипломацията и международните отношения довчера са били колонките за международни новини във вестниците, а днес по стечение на обстоятелствата заемат висок държавен пост. За предлагания подход спрямо РСМ няма нито обществен консенсус, нито консенсус в управляващата коалиция; отделно, той противоречи и на декларацията на Народното събрание от 2019 г., и в последна сметка на решението на КСНС от миналата седмица. Този подход, ако бъде пробутан, маскиран под формата на двустранен компромис, ще отвори единствено нови проблеми – комисиите ще работят не по решаването на откритите въпроси, а по тяхното идентифициране.
За шест месеца този процес няма да завърши.
Концепцията на Петков и екипа му ще отвори и несъществуващия въпрос за македонско малцинство в България, дори и министър-председателят да е прав, че той няма да говори за това на срещата на 18 януари. Скопие няма нужда да чака София да се съгласи да говори за това, защото вече поставя темата, а така също и лобито на РСМ във Вашингтон (справка: интервюто с г-жа Клаудия Тени). Въпросът вече звучи в ушите на хора в Брюксел и Вашингтон и по-скоро натам София следва да насочи усилия – да обясни в какво се състои неистината, произнасяна в Скопие.
Самата малцинствена тема създава прецедент, с чиито последствия България ще се сблъсква в бъдеще. И не само по отношение на РСМ. Нека не забравяме, че България не е само в състояние на икономическа, финансова и здравна криза. Страната методично е изправена пред последиците от провала на политиката в областта на отбраната и националната сигурност – двата сектора, призвани да защитят държавата. Преди премиерът Петков да се опитва „на мускули и с добрина“ да бъде проактивен, е добре да се поинтересува в какво състояние са службите за сигурност и с какво да се подпомогне тяхната професионална работа, така щото те да са способни да подпомогнат работата на новия министър-председател. Защото срещу нас и в Скопие, а и в други столици на Балканите, не стоят колективи от научни работници.
На последно място, един въпрос остава без отговор – какво налага Кирил Петков да посети именно сега Скопие? Въпреки всички съвети да не го прави, дадени от хора, заети с темата РСМ и двустранните отношения на Балканите от десетилетия. Закъде бърза министър-председателят?
Заглавна снимка: © Правителството на РСМ / Flickr
Специално ми е, Спецов!
Post Syndicated from original https://bivol.bg/%D1%81%D0%BF%D0%B5%D1%86%D0%B8%D0%B0%D0%BB%D0%BD%D0%BE-%D0%BC%D0%B8-%D0%B5-%D1%81%D0%BF%D0%B5%D1%86%D0%BE%D0%B2.html
понеделник 17 януари 2022

Чакайте сега да видя дали разбирам правилно. НАП е Национална агенция по приходите, нали така? Тоест, нейната основна функция е да прибере във фиска дължимите от всеки български данъкоплатец суми.…
Boot Guard and PSB have user-hostile defaults
Post Syndicated from original https://mjg59.dreamwidth.org/58424.html
Compromising an OS without it being detectable is hard. Modern operating systems support the imposition of a security policy or the launch of some sort of monitoring agent sufficient early in boot that even if you compromise the OS, you’re probably going to have left some sort of detectable trace[1]. You can avoid this by attacking the lower layers – if you compromise the bootloader then it can just hotpatch a backdoor into the kernel before executing it, for instance.
This is avoided via one of two mechanisms. Measured boot (such as TPM-based Trusted Boot) makes a tamper-proof cryptographic record of what the system booted, with each component in turn creating a measurement of the next component in the boot chain. If a component is tampered with, its measurement will be different. This can be used to either prevent the release of a cryptographic secret if the boot chain is modified (for instance, using the TPM to encrypt the disk encryption key), or can be used to attest the boot state to another device which can tell you whether you’re safe or not. The other approach is verified boot (such as UEFI Secure Boot), where each component in the boot chain verifies the next component before executing it. If the verification fails, execution halts.
In both cases, each component in the boot chain measures and/or verifies the next. But something needs to be the first link in this chain, and traditionally this was the system firmware. Which means you could tamper with the system firmware and subvert the entire process – either have the firmware patch the bootloader in RAM after measuring or verifying it, or just load a modified bootloader and lie about the measurements or ignore the verification. Attackers had already been targeting the firmware (Hacking Team had something along these lines, although this was pre-secure boot so just dropped a rootkit into the OS), and given a well-implemented measured and verified boot chain, the firmware becomes an even more attractive target.
Intel’s Boot Guard and AMD’s Platform Secure Boot attempt to solve this problem by moving the validation of the core system firmware to an (approximately) immutable environment. Intel’s solution involves the Management Engine, a separate x86 core integrated into the motherboard chipset. The ME’s boot ROM verifies a signature on its firmware before executing it, and once the ME is up it verifies that the system firmware’s bootblock is signed using a public key that corresponds to a hash blown into one-time programmable fuses in the chipset. What happens next depends on policy – it can either prevent the system from booting, allow the system to boot to recover the firmware but automatically shut it down after a while, or flag the failure but allow the system to boot anyway. Most policies will also involve a measurement of the bootblock being pushed into the TPM.
AMD’s Platform Secure Boot is slightly different. Rather than the root of trust living in the motherboard chipset, it’s in AMD’s Platform Security Processor which is incorporated directly onto the CPU die. Similar to Boot Guard, the PSP has ROM that verifies the PSP’s own firmware, and then that firmware verifies the system firmware signature against a set of blown fuses in the CPU. If that fails, system boot is halted. I’m having trouble finding decent technical documentation about PSB, and what I have found doesn’t mention measuring anything into the TPM – if this is the case, PSB only implements verified boot, not measured boot.
What’s the practical upshot of this? The first is that you can’t replace the system firmware with anything that doesn’t have a valid signature, which effectively means you’re locked into firmware the vendor chooses to sign. This prevents replacing the system firmware with either a replacement implementation (such as Coreboot) or a modified version of the original implementation (such as firmware that disables locking of CPU functionality or removes hardware allowlists). In this respect, enforcing system firmware verification works against the user rather than benefiting them.
Of course, it also prevents an attacker from doing the same thing, but while this is a real threat to some users, I think it’s hard to say that it’s a realistic threat for most users.
The problem is that vendors are shipping with Boot Guard and (increasingly) PSB enabled by default. In the AMD case this causes another problem – because the fuses are in the CPU itself, a CPU that’s had PSB enabled is no longer compatible with any motherboards running firmware that wasn’t signed with the same key. If a user wants to upgrade their system’s CPU, they’re effectively unable to sell the old one. But in both scenarios, the user’s ability to control what their system is running is reduced.
As I said, the threat that these technologies seek to protect against is real. If you’re a large company that handles a lot of sensitive data, you should probably worry about it. If you’re a journalist or an activist dealing with governments that have a track record of targeting people like you, it should probably be part of your threat model. But otherwise, the probability of you being hit by a purely userland attack is so ludicrously high compared to you being targeted this way that it’s just not a big deal.
I think there’s a more reasonable tradeoff than where we’ve ended up. Tying things like disk encryption secrets to TPM state means that if the system firmware is measured into the TPM prior to being executed, we can at least detect that the firmware has been tampered with. In this case nothing prevents the firmware being modified, there’s just a record in your TPM that it’s no longer the same as it was when you encrypted the secret. So, here’s what I’d suggest:
1) The default behaviour of technologies like Boot Guard or PSB should be to measure the firmware signing key and whether the firmware has a valid signature into PCR 7 (the TPM register that is also used to record which UEFI Secure Boot signing key is used to verify the bootloader).
2) If the PCR 7 value changes, the disk encryption key release will be blocked, and the user will be redirected to a key recovery process. This should include remote attestation, allowing the user to be informed that their firmware signing situation has changed.
3) Tooling should be provided to switch the policy from merely measuring to verifying, and users at meaningful risk of firmware-based attacks should be encouraged to make use of this tooling
This would allow users to replace their system firmware at will, at the cost of having to re-seal their disk encryption keys against the new TPM measurements. It would provide enough information that, in the (unlikely for most users) scenario that their firmware has actually been modified without their knowledge, they can identify that. And it would allow users who are at high risk to switch to a higher security state, and for hardware that is explicitly intended to be resilient against attacks to have different defaults.
This is frustratingly close to possible with Boot Guard, but I don’t think it’s quite there. Before you’ve blown the Boot Guard fuses, the Boot Guard policy can be read out of flash. This means that you can drop a Boot Guard configuration into flash telling the ME to measure the firmware but not prevent it from running. But there are two problems remaining:
1) The measurement is made into PCR 0, and PCR 0 changes every time your firmware is updated. That makes it a bad default for sealing encryption keys.
2) It doesn’t look like the policy is measured before being enforced. This means that an attacker can simply reflash modified firmware with a policy that disables measurement and then make a fake measurement that makes it look like the firmware is ok.
Fixing this seems simple enough – the Boot Guard policy should always be measured, and measurements of the policy and the signing key should be made into a PCR other than PCR 0. If an attacker modified the policy, the PCR value would change. If an attacker modified the firmware without modifying the policy, the PCR value would also change. People who are at high risk would run an app that would blow the Boot Guard policy into fuses rather than just relying on the copy in flash, and enable verification as well as measurement. Now if an attacker tampers with the firmware, the system simply refuses to boot and the attacker doesn’t get anything.
Things are harder on the AMD side. I can’t find any indication that PSB supports measuring the firmware at all, which obviously makes this approach impossible. I’m somewhat surprised by that, and so wouldn’t be surprised if it does do a measurement somewhere. If it doesn’t, there’s a rather more significant problem – if a system has a socketed CPU, and someone has sufficient physical access to replace the firmware, they can just swap out the CPU as well with one that doesn’t have PSB enabled. Under normal circumstances the system firmware can detect this and prompt the user, but given that the attacker has just replaced the firmware we can assume that they’d do so with firmware that doesn’t decide to tell the user what just happened. In the absence of better documentation, it’s extremely hard to say that PSB actually provides meaningful security benefits.
So, overall: I think Boot Guard protects against a real-world attack that matters to a small but important set of targets. I think most of its benefits could be provided in a way that still gave users control over their system firmware, while also permitting high-risk targets to opt-in to stronger guarantees. Based on what’s publicly documented about PSB, it’s hard to say that it provides real-world security benefits for anyone at present. In both cases, what’s actually shipping reduces the control people have over their systems, and should be considered user-hostile.
[1] Assuming that someone’s both turning this on and actually looking at the data produced
 comments
Hypothesis Generation
Post Syndicated from original https://xkcd.com/2569/

Избор на разума. Трима съдии за Галина Захарова и удържането на съдийската независимост
Post Syndicated from Венелина Попова original https://toest.bg/izbor-na-razuma-galina-zaharova-vks/
Изборът на председател на Върховния касационен съд мина във видимо спокойна атмосфера. Поне привидно. Но въпреки маските, които членовете на Висшия съдебен съвет носеха, очите им, погледите им, зачервените им лица, когато задаваха въпроси или изказваха мнение, както и някои гримаси издаваха напрежение и колизия между това, което казват, и онова, което мислят и чувстват по време на заседанието в петък, 14 януари. То продължи 7 часа, с две кратки прекъсвания, и премина без обсада на Съдебната палата, без скандирания и дюдюкания, каквито имаше по време на избора на главен прокурор през 2019 г. Само няколко репортери смутиха душевното спокойствие на Иван Гешев на влизане в сградата с въпрос ще подаде ли оставка, както го призова в специална декларацията управляващото мнозинство от трибуната на Народното събрание само час преди началото на заседанието на ВСС. Време достатъчно, за да стигне „новината“ и до кадровиците в съдебната власт.
Единомислието на съдийската колегия при гласуването бе разбираемо след безапелационната подкрепа за съдия Галина Захарова от Общото събрание на ВКС, издигнало нейната кандидатура. В доклада на Комисията по професионална етика тя бе представена почти като икона, казано без грам ирония – като блестящ професионалист с отлична подготовка и управленски умения, като креативен, толерантен и етичен съдия, който правораздава безпристрастно и независимо. И в очите на колегите си магистрати от ВСС, които обявиха мотивите си защо ще гласуват за нея, Захарова изглежда освен безупречен и с чувство за отговорност професионалист, и добър човек, способен на емпатия към проблемите на колегите си, смела и с кураж да отстоява непопулярни позиции и решения.
При представянето на своята концепция Галина Захарова бе лаконична, прецизна, сдържана, но заедно с това – категорична в мнението си, че ВКС съд е конституционно регламентиран орган, който уравнява практиката на съдилищата и осигурява еднаквото проявление на закона. Защото „противоречивата съдебна практика е бич за независимостта на съдебната власт и създава впечатлението, че законът се прилага по един начин спрямо едни и по друг – спрямо други“.
Освен това съдия Захарова открои ясно огромната разликата между ръководител на съд, който е пръв сред равни, и отношенията в структури с йерархична зависимост, които налагат необходимостта да се контактува хоризонтално, включително и с останалите власти. Тя подчерта проблемите, които се създават, когато представители на едната власт вземат отношение към действията на другите власти. Но беше категорична, че ВКС не участва нито видимо, нито прикрито в сфери от изключителната компетентност на другите власти. Тя пое и риска да се обяви против прекалено дългите 7-годишни мандати на „тримата големи“ в съдебната власт – заради опасността от утвърждаване на командно-административни практики и поведение.
В контекста на високата оценка за Галина Захарова някои от въпросите към нея, зададени от членовете на ВСС, не изглеждаха особено важни. Други – дребнави. Трети прозвучаха обидно инфантилно, като въпроса на председателя на Върховния административен съд Георги Чолаков какъв тип ръководител ще бъде Захарова, ако бъде избрана – кабинетен или ще решава и други проблеми? Но затова пък той патетично декларира: „Зад нея стоят всички колеги от ВКС. Кои сме ние да кажем, че няма да изберем техния кандидат?“
Множество въпросителни постави безусловната подкрепа, която главният прокурор и колегите му във ВСС изразиха за Захарова. Иван Гешев зададе въпрос за мястото на прокуратурата в съдебната система и видимо доволен от отговора на Захарова, също реши да засвидетелства с лично изявление правото на самоуправление на съда, което той като прокурор никога не бил поставял под съмнение. А Гергана Мутафова от прокурорската колегия на ВСС поздрави колегите си, че са направили в края на мандата си „голям шлем“, като са успели да изберат главен прокурор, председател на ВАС, а сега – и председател на ВКС. В края на заседанието ВСС гласува да предложи на държавния глава да подпише указ за назначаването на Галина Захарова. Тя ще поеме поста от Лозан Панов след изтичането на мандата му през февруари.
Поканихме трима магистрати и бивши председатели на Съюза на съдиите в България – Мирослава Тодорова, Нели Куцкова и Калин Калпакчиев – да коментират кратко пред „Тоест“ избора на нов председател на ВКС.
Как ви изглежда подкрепата за съдия Захарова от представителите на всички колегии във ВСС и щеше ли резултатът от днешното заседание да е същият при една друга обществено-политическа конюнктура? Ако гласуването за избора на Георги Чолаков за председател на ВАС през 2017 г., по думите на Лозан Панов, е било „избор на тишината“, то как бихте определили гласуването за Галина Захарова?
Н.К. При една толкова силна кандидатура, подкрепена от всички съдии във ВКС, това беше избор на разума. Независимо какви са били мотивите на отделните гласуващи.
К.К. Изборът на съдия Захарова за председател на ВКС е решителен пробив за утвърждаване на съдийското самоуправление. Това е първият случай след 1989 г., в който висш ръководител на съдебната власт не е посочен от политическата власт. Случилото се е резултат от конкретната политическа конюнктура, в която липсва доминиращо политическо мнозинство, но също и на непрестанните усилия на съдийската общност през последните две десетилетия за удържане на съдийската независимост. Изборът на Галина Захарова е шанс за ускоряване на процесите за реформиране на съдебната власт.
М.Т. Разликата между избора на съдия Захарова и изборите на предходните председатели на върховните съдилища и главни прокурори е, че нейният се проведе изцяло там, където е редно да бъде – в общността на върховните съдии, които обмислиха на кого да гласуват доверие. Към номинацията и избора на съдия Захарова нямаха отношение нито изпълнителната власт, нито каквито и да било сочени за кукловоди фигури с корупционно влияние. В този смисъл, независимо от пълното единодушие на пленума на ВСС при гласуването, което винаги е подозрително, процесът на избор беше прозрачен, убедителен като резултат и съобразен с конституционния модел – да няма външни вмешателства.
За мотивите на мнозинството да се съобразят с позицията на съдиите от ВКС могат да се формулират различни обосновани предположения – че е било проява на инстинкт на самосъхранение; че обмислят ходове за неутрализиране на демократичния пробив; че са подценили значението на този избор с оглед на вече постигнатото влияние в съдебната власт с назначенията и повишенията. Така или иначе, успехът не само за правната общност, но за всички български граждани, е безусловен. За председател на ВКС е избран съдия, който е доказал в дългогодишната си практика на всички съдебни инстанции своя висок професионализъм, задълбочена правна култура и човеколюбие. Самият факт, че е избран съдия, който никога не се е „отърквал“ във властта и не е показвал стремеж да бъде забелязан и удостоен от нея, има огромен морален потенциал и се надявам, че силно ще окуражи съдиите.
Случайно съвпадение ли е, че точно преди началото на заседанието на ВСС партиите от управляващата коалиция излязоха с декларация, в която призоваха главния прокурор Иван Гешев да подаде оставка? Както и оповестяването на отнемане на достъпа до класифицирана информация „строго секретно“ на Сотир Цацаров?
Н.К. Не знам, а и не се наемам да гадая дали е съвпадение, или е предварително подготвено. Ще трябва да зададете въпроса си към авторите на тези действия. Но съм сигурна, че съдия Захарова също не е знаела.
К.К. Вероятно съвпадението на описаните събития е случайно, но същественото е, че липсата на силен политически монопол осигури благоприятна обществено-политическа ситуация, в която натискът над Съдебния съвет беше разхлабен. Мнозинството във ВСС, което досега е доказало, че действа в съгласие с интересите на излъчилите го политически партии, нямаше друг ход, освен да подкрепи предложения от върховните съдии кандидат за председател. Не без значение е и фактът, че съдия Захарова беше излъчена със съкрушителното пълно съгласие от всички съдии от ВКС, а също и нейната респектираща професионална компетентност и всепризнат морален авторитет.
М.Т. Не мога да коментирам мотивите на партиите да излязат с декларация в същия ден, както и оповестения отнет допуск до класифицирана информация на Сотир Цацаров, защото нямам право, а би било и спекулативно – не разполагам с информация. Но Вашият въпрос, който не е изолиран от коментарите в медиите и социалните мрежи, показва, че администрирането на съдебната власт досега е създало впечатление, че е силно зависимо от политическата конюнктура. Това означава, че въведената с Конституцията съдебна независимост е била уязвена и не е била убедителна в очите на хората, а това крие допълнителна опасност, наред с основната, свързана с овладяването на съдебната власт. Обаче, както вече казах, историята на поведението на мнозинството на ВСС не позволява да бъде отхвърлено с лека ръка предположението, че и двете събития са част от причините за пълното единодушие при избора на председател на ВКС.
Изказването на Иван Гешев за Галина Захарова прозвуча като предложение за сделка – днес имате моята и на колегите ми подкрепа, утре очакваме от Вас същото за прокурорската колегия. „На луд“ ли се прави Гешев, или наистина очаква от председателката на ВКС и съдийската колегия да го подкрепят при обсъждане на евентуалното му отстраняване от поста на главен прокурор?
Н.К. Аз не тълкувам така изказването на г-н Гешев. На мен ми прозвуча като „ние не се месим на съдиите, вие не се бъркайте на прокурорите“. Но може би Вие сте го разбрали по-правилно.
К.К. Процедурата за избор на председател на ВКС беше действително прозрачна, без втори план и договорки, което на фона на утвърдената традиция е трудно за вярване. Помним как беше избран главният прокурор Цацаров, а и всички главни прокурори и председатели на върховните съдилища преди него – политиците дори не криеха прякото си вмешателство. Мисля, че изказването на главния прокурор е неумел опит да излезе от неловката и безизходна за него ситуация.
М.Т. След публикуването на записа, в който след прослушване без специални средства се разпознаваше гласът на бившия премиер да казва, че г-н Гешев му признал, че „обича да се прави на луд“, но отбелязал в същото време превъзходството на г-н Борисов при използването на споменатото „умение“, за съжаление, никой не би могъл обосновано да Ви възрази, че допускането Ви е несъстоятелно. Обяснението на г-н Борисов в изтеклия запис и досега не е опровергано – нито като автентичност, нито като достоверност на съдържанието. Затова е съвсем понятно, че понякога всичко, което ни се струва неразбираемо в позицията на българските официални власти, го препращаме към този тъжен епитаф за държавността – „правим се на луди“.
При всички положения репликата на г-н Гешев, дори да издава подобно очакване, изобщо не може да е информативна за последиците от избора на председател на ВКС. Никой не е спечелил индулгенция миналия петък. Усилията на съдийската общност ще продължават да бъдат насочени все в същата посока: независимост на съда и ясни механизми за отчетност и отговорност на прокуратурата, респективно на главния прокурор като връх на йерархичната система. На все по-широк кръг от хора става ясно, че не може да се говори за реципрочност между администрирането на съда и управлението на прокуратурата.
Галина Захарова посочи в отговор на зададен към нея въпрос, че промените в Закона за съдебната власт не са произвели никакъв ефект, защото не са били приети във вида, в който са внесени в Народното събрание. Как трябва да се промени ВСС и какви трябва да са правомощията му, за да не се възприема единствено като кадровик в съдебната система, а да гарантира нейната независимост и ефективност?
Н.К. На този въпрос не може да се отговори с две-три изречения. Темата е огромна и сложна. Понеже не съм слушала цялото заседание, не знам по кой точно въпрос съдия Захарова е посочила промените в ЗСВ като неудачни. Със сигурност няма как да е за целия закон, който се състои от стотици разпоредби.
Малко преди Нова година Управителният съвет на Съюза на съдиите проведе една бърза онлайн анкета сред членовете си – по въпросите за структурата и функциите на ВСС, за конкурсите, атестациите и други въпроси, касаещи съдилищата. Колегите са критични към действащата законова уредба на ВСС, но идеите за конкретни промени са различни. Очевидно предстоящите изменения ще трябва да бъдат обсъждани задълбочено, компетентно и далновидно.
К.К. Висшият съдебен съвет трябва окончателно да се раздели на два самостоятелни съвета – един за съдиите и отделен за прокурорите. Правомощията на съдийската колегия трябва да бъдат ограничени за сметка на общите събрания на съдиите и ползващите се с тяхното доверие председатели на съдилища. Реформирането на ВСС, както и цялостната промяна на правилата за избор и повишаване на съдиите, трябва да се мисли като система от мерки, които трябва да се приемат от Народното събрание при отчитане на становището на съдийската общност.
М.Т. Не съм съгласна, че промените в съдоустройствените правила – имам предвид последните изменения на Конституцията с разделянето на ВСС на две колегии и съответните изменения в Закона за съдебната власт с разширяване на съдийското самоуправление – не са произвели никакъв ефект. Вярно е обаче, че не постигнаха в пълнота целите си именно защото предлаганата система от мерки беше частично и избирателно възприета, така че да не бъде засегнат моделът на прокуратурата и да не се ограничи влиянието на главния прокурор върху съда, а по този начин – и върху всички останали сфери на обществения живот.
Конституцията трябва да се промени така, че в състава на прокурорската колегия обществената квота, избирана от НС, да има категорично мнозинство и да се състои от професионалисти, които биографично са доказали своята съпричастност и компетентност по отношение на проблемите на правовата държава и независимостта на съдебната власт. В същото време в съдийската колегия на ВСС обществената (политическата) квота следва да бъде намалена до степента, която позволява удовлетворяване на международния правен стандарт всички въпроси от управлението на съда да се решават от орган, в който съдиите, избирани от съдии, са мнозинство.
Вече стана дума, че е необходимо ясно да бъде проведено разграничението между двете магистратски професии – прокуратурата и съда. Прокуратурата, за разлика от съда, е йерархична система и по дефиниция – за да изпълни своята задача да разкрие престъпленията и да привлече към наказателна отговорност извършителите – се изисква да си взаимодейства успешно с изпълнителната власт (най-вече с МВР). Това означава, че дейността на прокуратурата е сърцевината на наказателната политика на държавата. По конституционен модел (чл. 105, ал. 1) правителството ръководи и осъществява вътрешната политика на страната, а наказателноправната политика е много важна част от нея. Следователно между прокуратурата и правителството не може да има китайска стена. Нищо от това обаче не е валидно за съда. За правовата държава от първостепенна значимост е съдът да е напълно независим от управляващите, за да защити всяко нарушено право, включително от силните на деня.
Втората група от мерки от споменатата система на законодателни изменения е свързана с осигуряване на независимост на органа, който, при достатъчно данни за извършено престъпление от главния прокурор, ще провежда разследване и евентуално ще внесе обвинителния акт срещу него в съда. Съветът на Европа и Европейската комисия изискват този орган да бъде независим и това е постижимо, ако органът не е в структурата на прокуратурата. В рамките на конкретния ни конституционен модел на баланс между властите, без намеса на Велико народно събрание не би било допустимо главният прокурор да бъде разследван от орган, външен на съдебната власт. Това означава, че ако разследващият орган е извън структурата на прокуратурата, но продължава да е част от съдебната власт, то той трябва да бъде съдия.
Заглавна снимка: Apostoloff / Wikimedia

“Биволъ” – с ексклузивни документи #АпиГейт: ГДБОП разследва шефката на „Автомагистрали“ за инхаусите към фирми на ДПС
Post Syndicated from Николай Марченко original https://bivol.bg/%D0%B0%D0%BF%D0%B8%D0%B3%D0%B5%D0%B9%D1%82-%D0%B3%D0%B4%D0%B1%D0%BE%D0%BF-%D1%80%D0%B0%D0%B7%D1%81%D0%BB%D0%B5%D0%B4%D0%B2%D0%B0-%D1%88%D0%B5%D1%84%D0%BA%D0%B0%D1%82%D0%B0-%D0%BD%D0%B0.html
неделя 16 януари 2022

Назначената от служебната министърка на регионалното развитие и благоустройството Виолета Комитова на прочулата се с #АПИГейт изпълнителна директорка на „Автомагистрали“ ЕАД Десислава Христова е била запозната с подписването на т.нар.…