Security updates for Friday

Post Syndicated from original https://lwn.net/Articles/875931/rss

Security updates have been issued by Debian (node-tar, postgresql-11, postgresql-13, and postgresql-9.6), Fedora (autotrace, botan2, chafa, converseen, digikam, dmtx-utils, dvdauthor, eom, kxstitch, pfstools, php-pecl-imagick, psiconv, q, R-magick, radeontop, rss-glx, rubygem-rmagick, synfig, synfigstudio, vdr-scraper2vdr, vdr-skinelchihd, vdr-skinnopacity, vdr-tvguide, and WindowMaker), Mageia (kernel, kernel-linus, and openafs), openSUSE (kernel), Red Hat (freerdp), SUSE (bind and kernel), and Ubuntu (openexr, postgresql-10, postgresql-12, postgresql-13, and samba).

Five Great (free!) Ways to Get Started With Cloudflare

Post Syndicated from John Engates original https://blog.cloudflare.com/five-free-ways-to-get-started-with-cloudflare/

Five Great (free!) Ways to Get Started With Cloudflare

Five Great (free!) Ways to Get Started With Cloudflare

I joined Cloudflare a few weeks ago, and as someone new to the company, there’s a ton of information to absorb. I have always learned best by doing, so I decided to use Cloudflare like a brand-new user. Cloudflare customers range from individuals with a simple website to companies in the Fortune 100. I’m currently exploring Cloudflare from the perspective of the individual, so I signed up for a free account and logged into the dashboard. Just like getting into a new car, I want to turn all the dials and push all the buttons. I looked for things that would be fun and easy to do and would deliver some immediate value. Now I want to share the best ones with you.

Here are my five ways to get started with Cloudflare. These should be easy for anyone, and they’re free. You’ll likely even save some money and improve your privacy and security in the process. Let’s go!

1. Transfer or register a domain with Cloudflare Registrar

If you’re like me, you’ve acquired a few (dozen) Internet domains for things like personalizing your email address, a web page for your nature photography hobby, or maybe a side business. You probably registered them at one or more of the popular domain name registrars, and you pay around $15 per year for each domain. I did an audit and found I was spending a shocking amount each year to maintain my domains, and they were spread across three different registrars.

Cloudflare makes it easy to transfer domains from other registrars and doesn’t charge a markup for domain registrar services. Let me say that again; there is zero price markup for domain registration with Cloudflare Registrar. You’ll pay exactly what Cloudflare pays. For example, a .com domain registered with Cloudflare currently costs half of what I was paying at other registrars.

Not only will you save on the domain registration, but Cloudflare doesn’t nickel-and-dime you like registrars who charge extra for WHOIS privacy and transfer lock and then sneakily bundle their website hosting services. It all adds up.

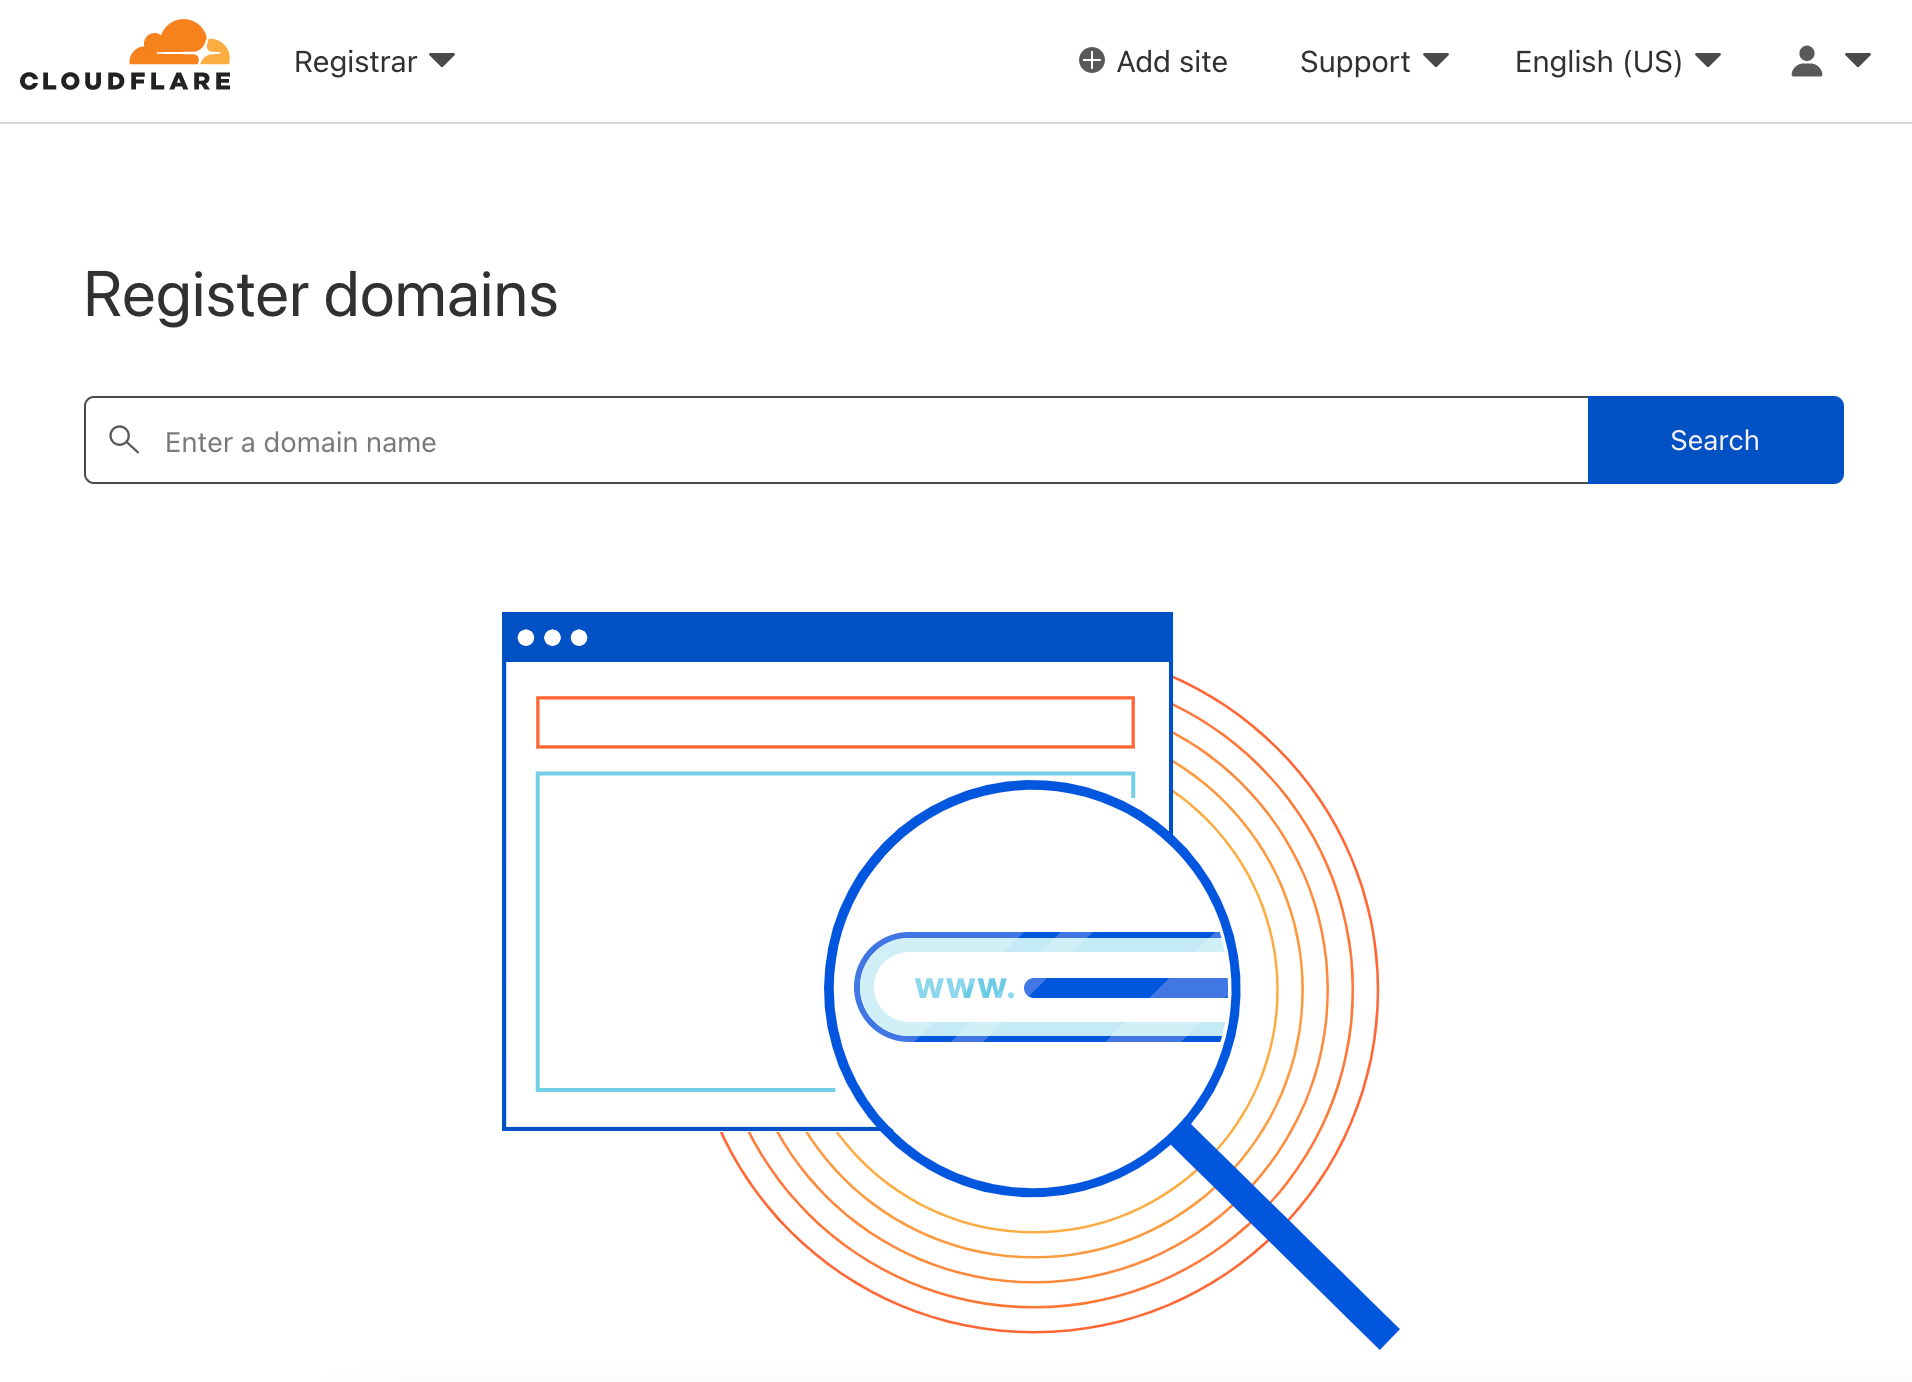
To get started registering or transferring a domain, log into the Cloudflare Dashboard, click “Add a Site,” and bring your domains to Cloudflare.

Five Great (free!) Ways to Get Started With Cloudflare

2. Configure DNS on Cloudflare DNS

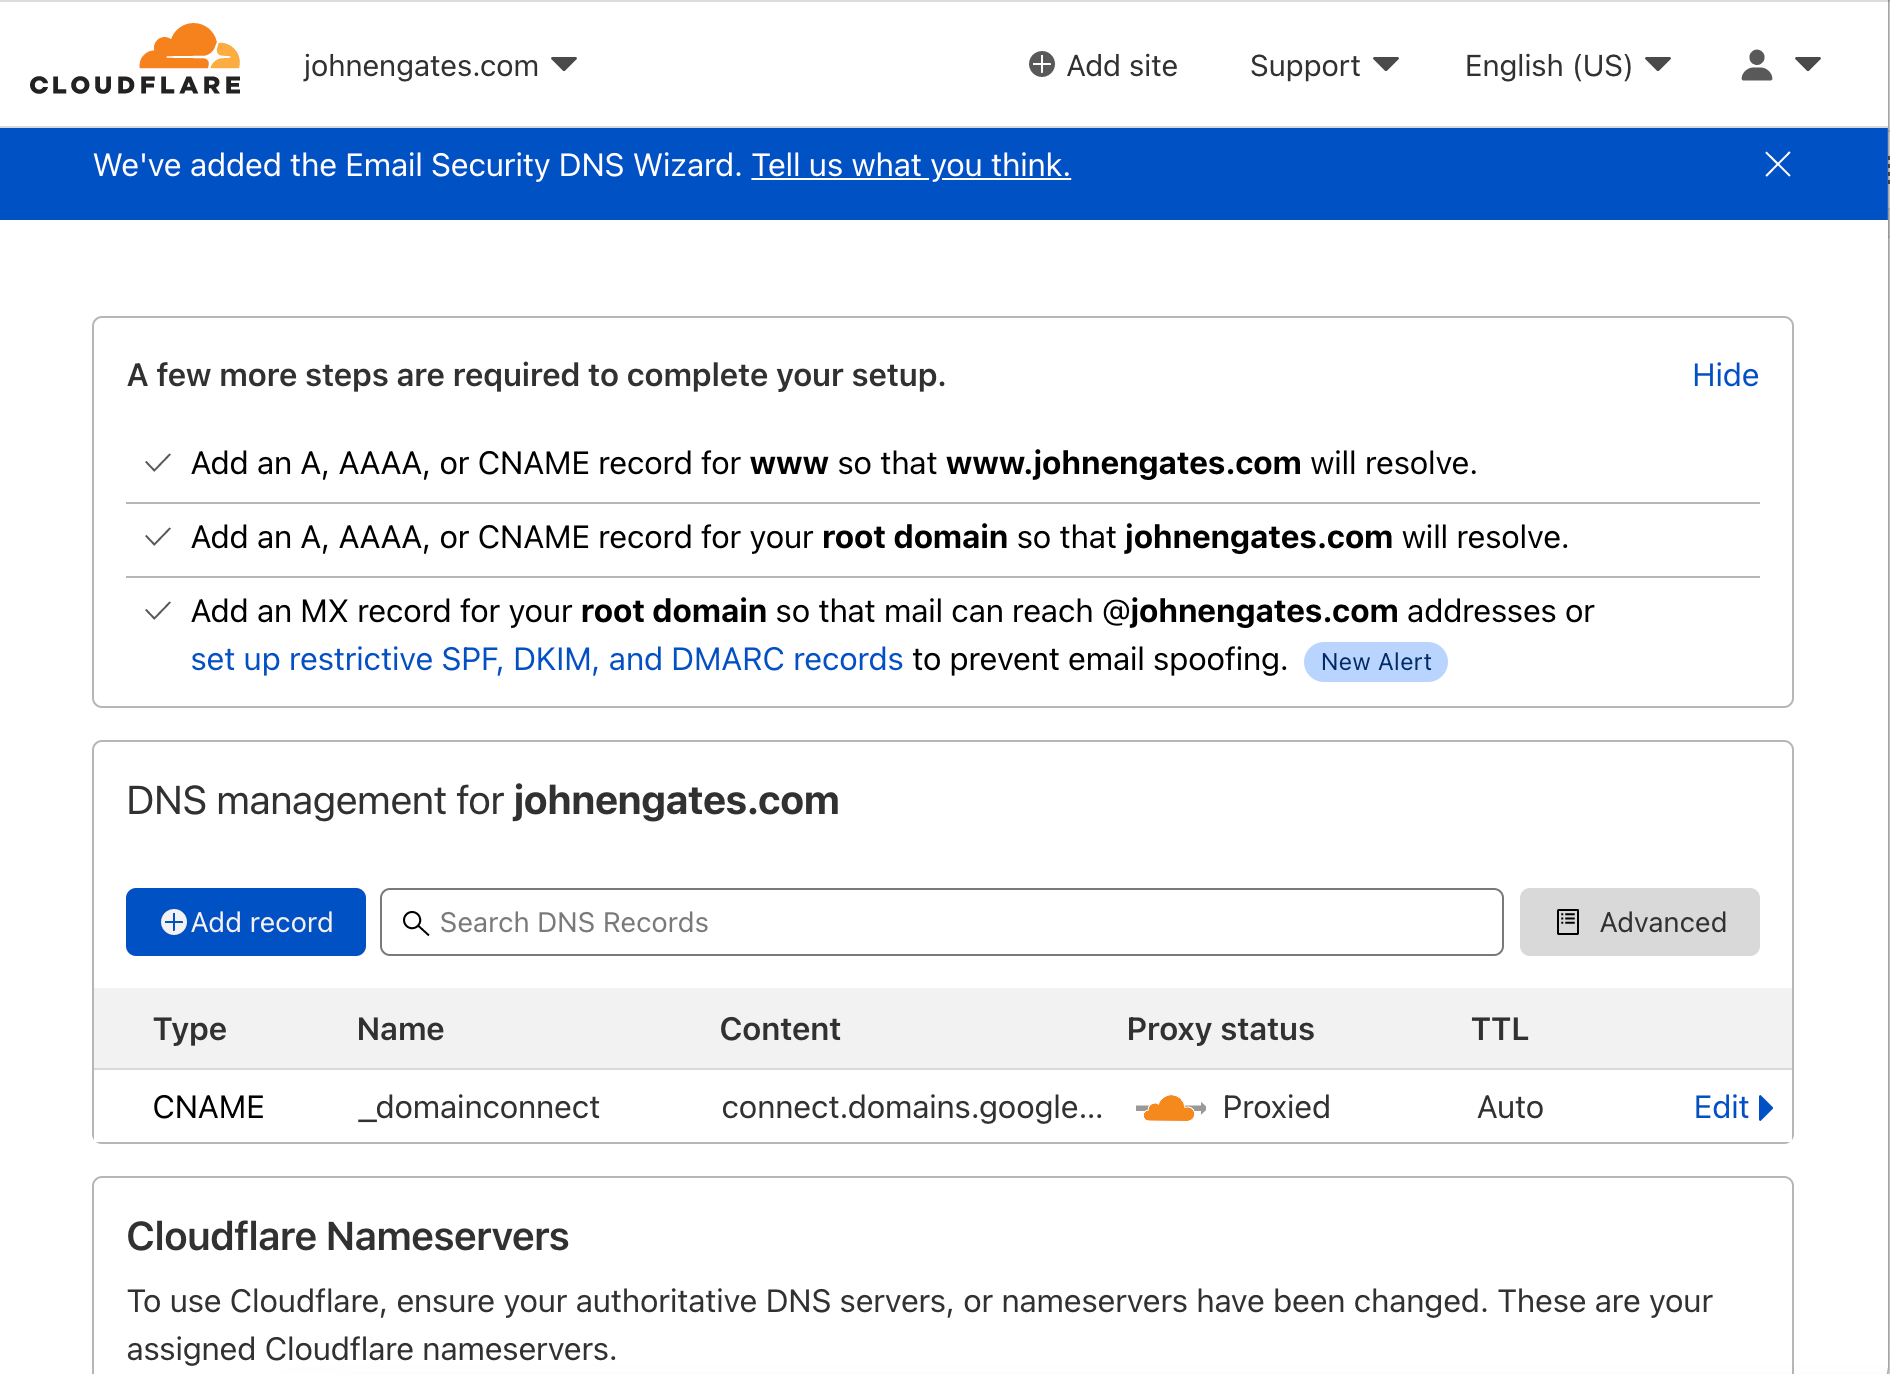
DNS servers do the work of translating hostnames into IP addresses. To put a domain name to use on the Internet, you can create DNS records to point to your website and email provider. Every time someone wants to put a website or Internet application online, this process must happen so the rest of us can find it. Cloudflare’s DNS dashboard makes it simple to configure DNS records. For transfers, Cloudflare will even copy records from your existing DNS service to prevent any disruption.

Five Great (free!) Ways to Get Started With Cloudflare

The Cloudflare DNS dashboard will also improve security on your domains with DNSSEC, protect your domains from email spoofing with DMARC, and enforce other DNS best practices.

I’ve now moved all my domains to Cloudflare DNS, which is a big win for me for security and simplicity. I can see them all in one place, and I’m more confident with the increased level of control and protection I have for my domains.

3. Set up a blog with Cloudflare Pages

Once I moved my domains, I was eager to set up a new website. I have been thinking lately it would be fun to have a place to post my photos where they can stand out and won’t get lost in the stream of social media. It’s been a while since I’ve built a website from scratch, but it’s fun getting back to basics. In the old days, to host a website you’d set up a dedicated web server or use a shared web host to serve your site. Today, many web hosts provide ready-to-go templates for websites and make hosting as easy as one click to set up a new site.

I wanted to learn by doing, so I took the do-it-yourself route. What I discovered in the process is an architecture called Jamstack. It’s a bit different from the traditional way of building and hosting websites. With Jamstack, your site doesn’t live at a traditional hosting provider, nor is it dynamically generated from CGI scripts and a database. Your content is now stored on a code repository like GitHub. The site is pre-generated as a static site and then deployed and delivered directly from Cloudflare’s network.

I used a Jamstack static site generator called Hugo to build my photo blog, pushed it to GitHub, and used Cloudflare Pages to generate the content and host my site. Now that it’s configured, there’s zero work necessary to maintain it. Jamstack, combined with Pages, alleviates the regular updates required to keep up with security patches, and there are no web servers or database services to break. Delivered from Cloudflare’s edge network, the site scales effortlessly, and it’s blazingly fast from a user perspective.

By the way, you don’t need to register a domain to deploy to Pages. Cloudflare will generate a pages.dev site that you can use.

For extra credit, have a look at the Cloudflare Workers serverless platform. Workers will allow you to write and deploy even more advanced custom code and run it across Cloudflare’s globally distributed network.

4. Protect your network with Cloudflare for Teams

At first, it wasn’t evident to me how I was going to use Cloudflare for Teams. I initially thought it was only for larger organizations. After all, I’m sitting here in my home office, and I’m just a team of one. Digging into the product more, it became clear that Teams is about privacy and security for groups of any size.

We’ve discussed the impressive Cloudflare DNS infrastructure, and you can take advantage of the Cloudflare DNS resolver for your devices at home by simply configuring them to point to Cloudflare 1.1.1.1 DNS servers. But for more granular control and detailed logging, you should try the DNS infrastructure built into the Cloudflare for Teams Gateway feature.

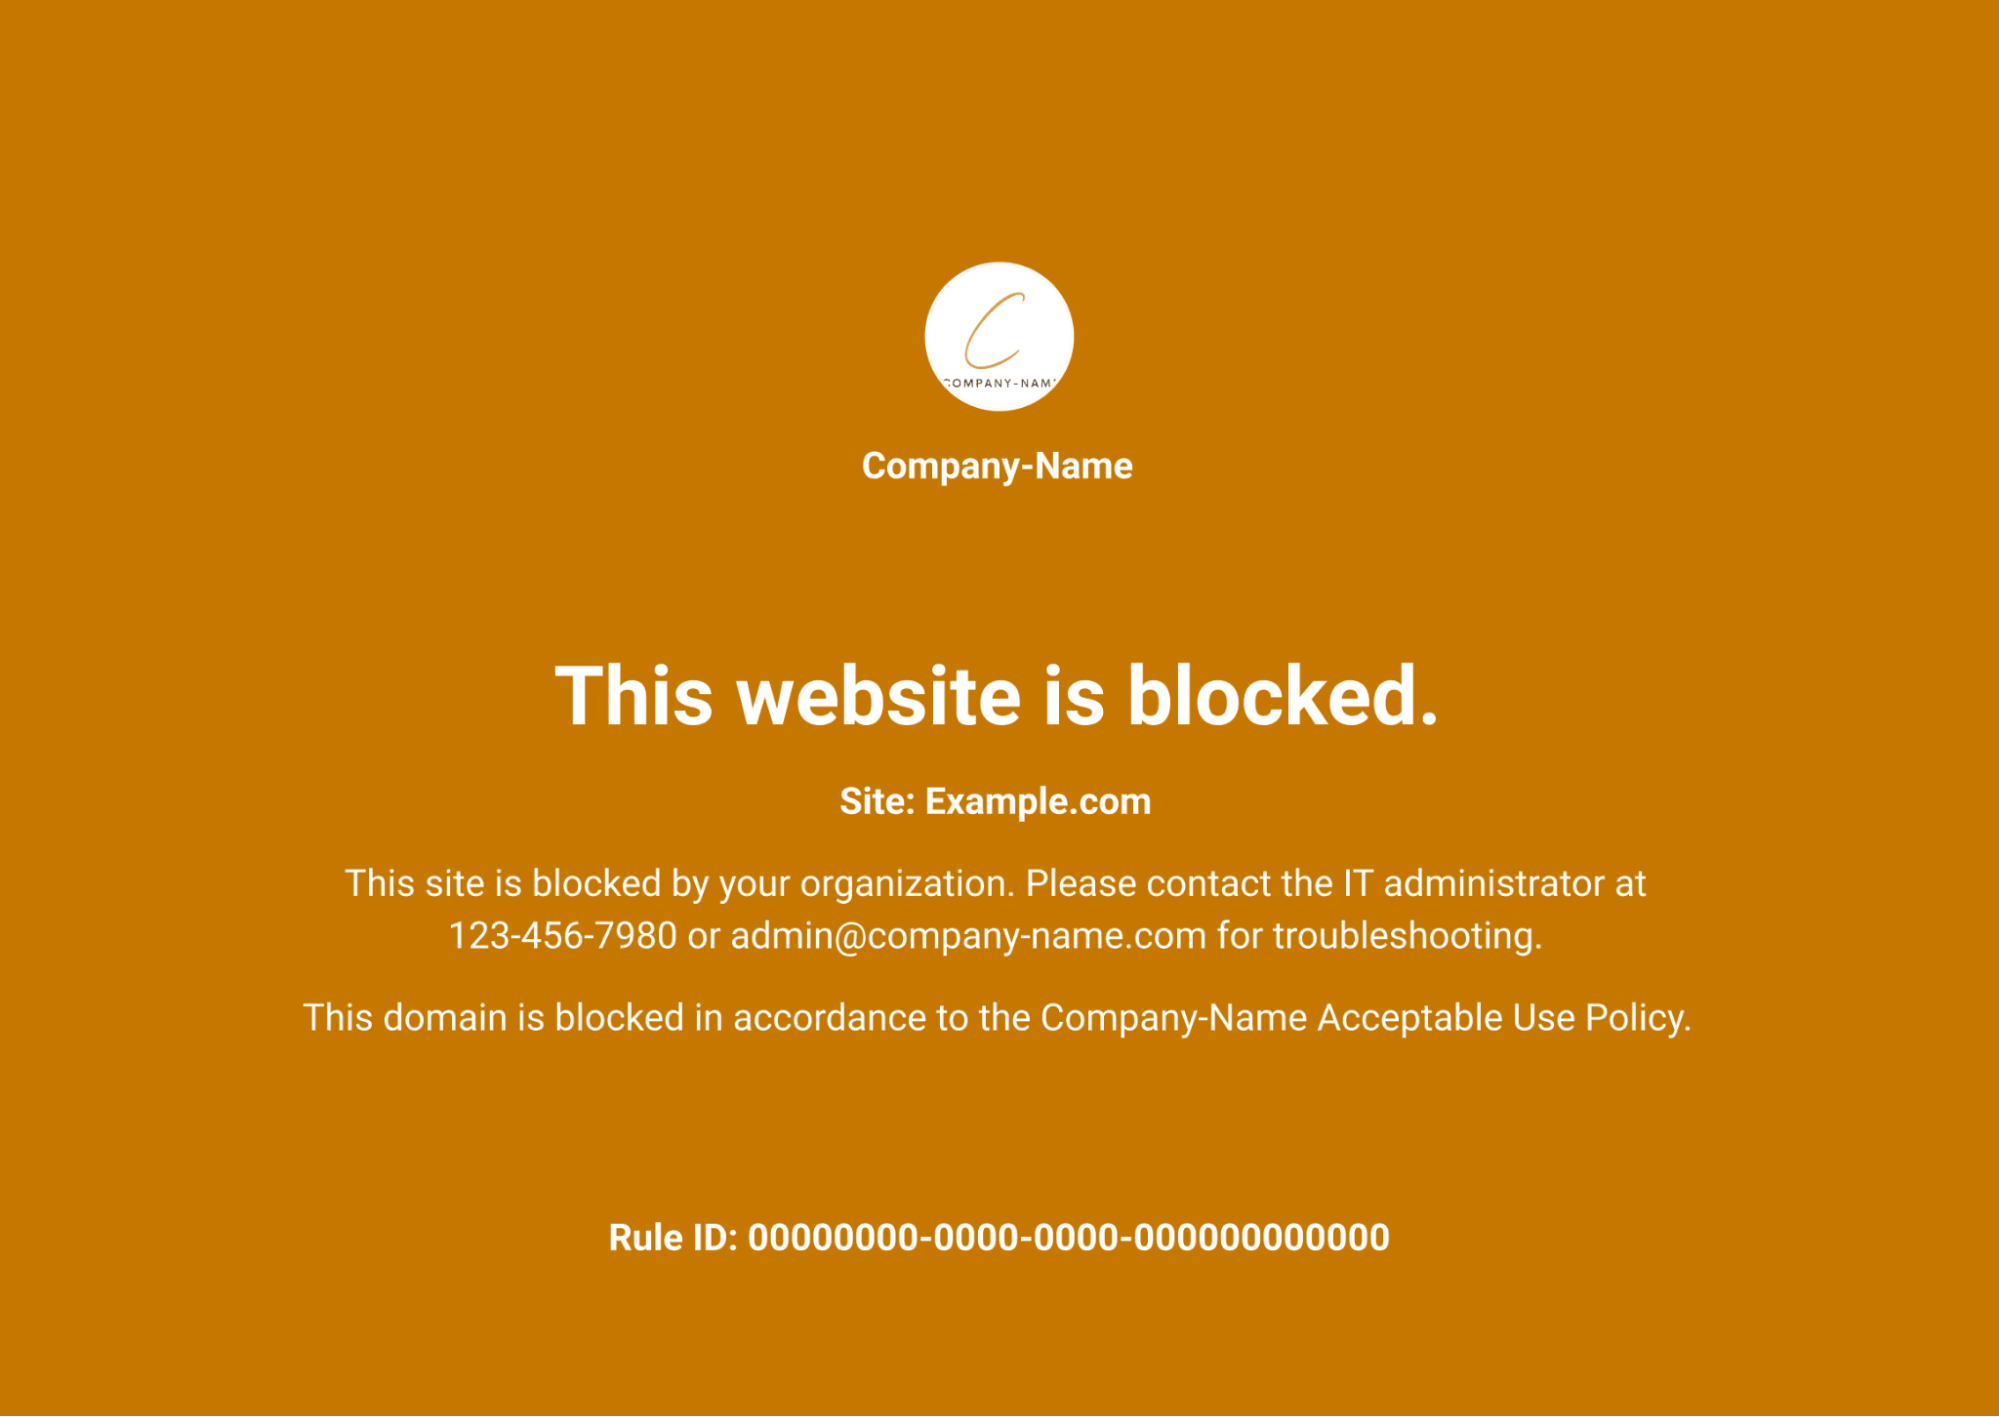
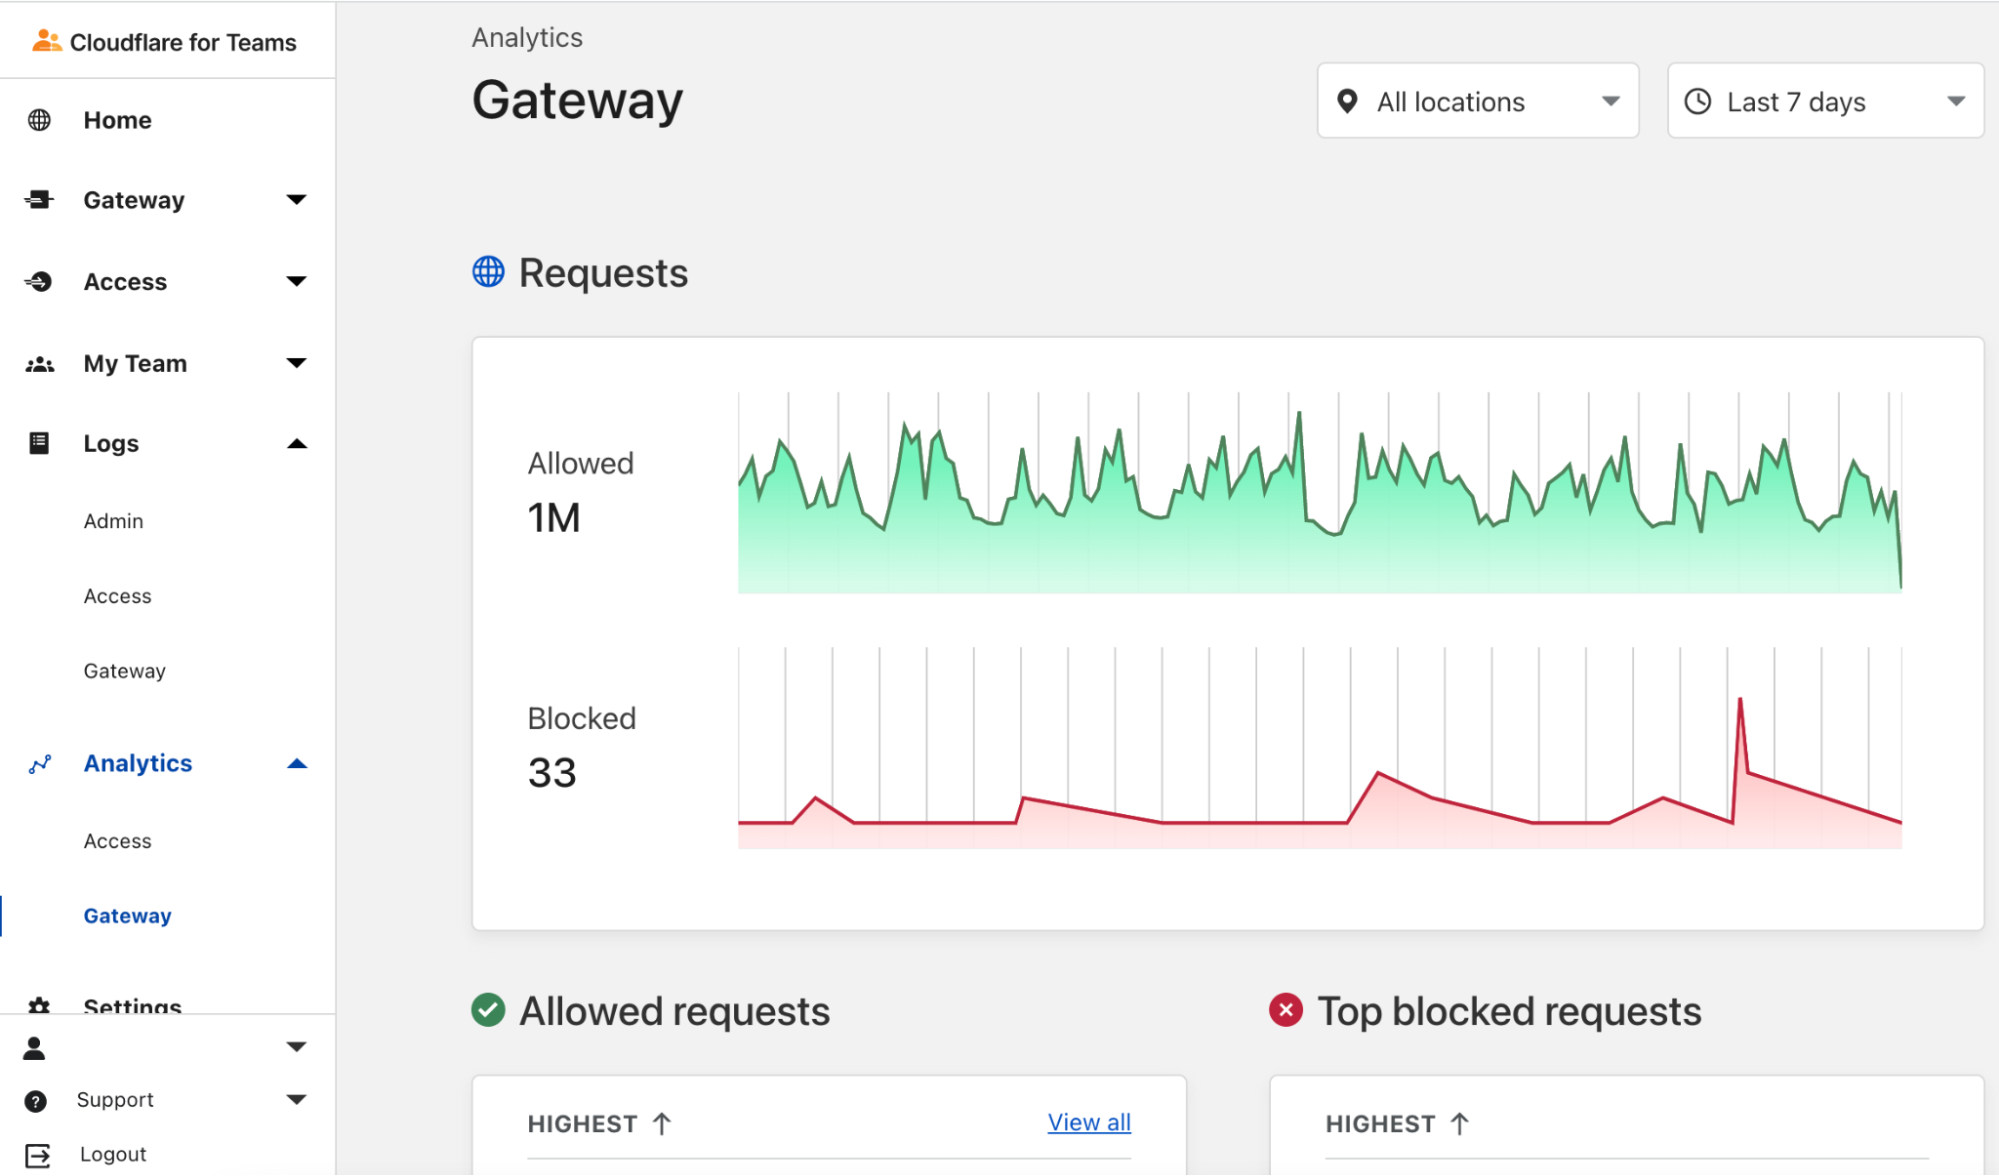
When you point your home network to Cloudflare for Teams DNS servers, your dashboard will populate with logs of all DNS requests coming from your network. You can set up rules to block DNS requests for various categories, including known malware, phishing, adult sites, and other questionable content. You’ll see the logs instantly and can add or remove categories as needed. If you trigger one of the rules, Cloudflare will display a page that shows you’ve hit one of these blocked sites.

Five Great (free!) Ways to Get Started With Cloudflare

Malware can bypass DNS, so filtering DNS is no silver bullet. Think of DNS filtering as another layer of defense that may help you avoid nefarious sites in the first place. For example, known phishing sites sent as URLs via email won’t resolve and will be blocked before they affect you. Additionally, DNS logs should give you visibility into what’s happening on the network and that may lead you to implement even better security in other areas.

Five Great (free!) Ways to Get Started With Cloudflare

There’s so much more to Cloudflare for Teams than DNS filtering, but I wanted to give you just a little taste of what you can do with it quickly and for free.

5. Secure your traffic with the Cloudflare 1.1.1.1 app and WARP

Finally, let’s discuss the challenge of securing Internet communications on your mobile phones, tablets, and devices at home and while traveling. We know that the SSL/TLS encryption on secure websites provides a degree of protection, but the apps you use and sites you visit are still visible to your ISP and upstream network operators. Some providers sell this data or use it to target you with ads.

If you install the 1.1.1.1 app, Cloudflare will create an always-on, encrypted tunnel from your device to the nearest Cloudflare data center and secure your Internet traffic. We call this Cloudflare WARP. WARP not only encrypts your traffic but can even help accelerate it by routing intelligently across the Cloudflare network.

WARP is a compelling VPN replacement without the risks associated with some shady VPN providers who may also want to sell your data. Remember, Cloudflare will never sell your data!

The Cloudflare WARP client combined with Cloudflare for Teams gives you enhanced visibility into DNS queries and unlocks some advanced traffic management and filtering capabilities. And it’s all free for small teams.

Five Great (free!) Ways to Get Started With Cloudflare

Hopefully, my exploration of the Cloudflare product portfolio gives you some ideas of what you can do to make your life a little easier or your team more secure. I’m just scratching the surface, and I’m excited to keep learning what’s possible with Cloudflare. I’ll continue to share what I learn, and I encourage you to experiment with some of these capabilities yourself and let me know how it goes.

New – EC2 Instances (G5) with NVIDIA A10G Tensor Core GPUs

Post Syndicated from Jeff Barr original https://aws.amazon.com/blogs/aws/new-ec2-instances-g5-with-nvidia-a10g-tensor-core-gpus/

Two years ago I told you about the then-new G4 instances, which featured up to eight NVIDIA T4 Tensor Core GPUs. These instances were designed to give you cost-effective GPU power for machine learning inference and graphics-intensive applications.

Today I am happy to tell you about the new G5 instances, which feature up to eight NVIDIA A10G Tensor Core GPUs. Powered by second generation AMD EPYC processors, these instances deliver up to 40% better price-performance for inferencing and graphics-intensive operations in comparison to their predecessors.

On the GPU side, the A10G GPUs deliver to to 3.3x better ML training performance, up to 3x better ML inferencing performance, and up to 3x better graphics performance, in comparison to the T4 GPUs in the G4dn instances. Each A10G GPU has 24 GB of memory, 80 RT (ray tracing) cores, 320 third-generation NVIDIA Tensor Cores, and can deliver up to 250 TOPS (Tera Operations Per Second) of compute power for your AI workloads.

Here are the specs:

Instance Name
NVIDIA A10G
Tensor Core GPUs
vCPUs Memory Local Storage EBS Bandwidth Network Bandwidth
g5.xlarge 1 4 16 GiB 250 GB Up to 3.5 Gbps Up to 10 Gbps
g5.2xlarge 1 8 32 GiB 450 GB Up to 3.5 Gbps Up to 10 Gbps
g5.4xlarge 1 16 64 GiB 600 GB 8 Gbps Up to 25 Gbps
g5.8xlarge 1 32 128 GiB 1900 GB 16 Gbps 25 Gbps
g5.12xlarge 4 48 192 GiB 3800 GB 16 Gbps 40 Gbps
g5.16xlarge 1 64 256 GiB 1900 GB 16 Gbps 25 Gbps
g5.24xlarge 4 96 384 GiB 3800 GB 19 Gbps 50 Gbps
g5.48xlarge 8 192 768 GiB 7600 GB 19 Gbps 100 Gbps

Like their predecessors, these instances are a great fit for many interesting types of workloads. Here are a few examples:

Media and Entertainment – Customers can use G5 instances to support finishing and color grading tasks, generally with the aid of high-end pro-grade tools. These tasks can also support real-time playback, aided by the plentiful amount of EBS bandwidth allocated to each instance. Customers can also use the increased ray-tracing power of G5 instances to support game development tools.

Remote Workstations – Customers in many different industries including Media and Entertainment, Gaming, Education, Architecture, Engineering and Construction want to run high-end graphical workstations in the cloud, and are looking for instances that come in a broad array of sizes.

Machine & Deep Learning – G5 instances deliver high performance and significant value for training and inferencing workloads. They also offer access to NVIDIA CuDNN, NVIDIA TensorRT, NVIDIA Triton Inference Server, and other ML/DL software from the NVIDIA NGC catalog, which have all been optimized for use with NVIDIA GPUs.

Autonomous Vehicles – Several of our customers are designing and simulating autonomous vehicles that include multiple real-time sensors. The customers make use of ray tracing to simulate sensor input in real time, and also gather data from real-world tests using tools that benefit from powerful networking and large amounts of memory.

The instances support Linux and Windows, and are compatible with a very long list of graphical and machine learning libraries including CUDA, CuDNN, CuBLAS, NVENC, TensorRT, OpenCL, DirectX, Vulkan, and OpenGL.

Available Now
The new G5 instances are available now and you can start using them today in the US East (N. Virginia), US West (Oregon), and Europe (Ireland) Regions in On-Demand, Spot, Savings Plan, and Reserved Instance form. You can also launch them in Amazon Elastic Container Service (Amazon ECS) and Amazon Elastic Kubernetes Service (EKS) clusters,

To learn more, check out the G5 Instances page.

— Jeff;

Building Resilient Well-Architected Workloads Using AWS Resilience Hub

Post Syndicated from Seth Eliot original https://aws.amazon.com/blogs/architecture/building-resilient-well-architected-workloads-using-aws-resilience-hub/

AWS Resilience Hub is a new service that helps you understand and improve the resiliency of your workloads using AWS Well-Architected best practices. As the lead for the Reliability Pillar of AWS Well-Architected, I am eager to share with you how you can use Resilience Hub to ensure your workload architecture is as reliable as you need.

In this blog post, I’ll show you how to use Resilience Hub to assess and improve the resiliency of your architecture based on its recommendations. I’ll start with a single Availability Zone (AZ) architecture, and evolve the architecture using the resiliency recommendations.

Single AZ architecture

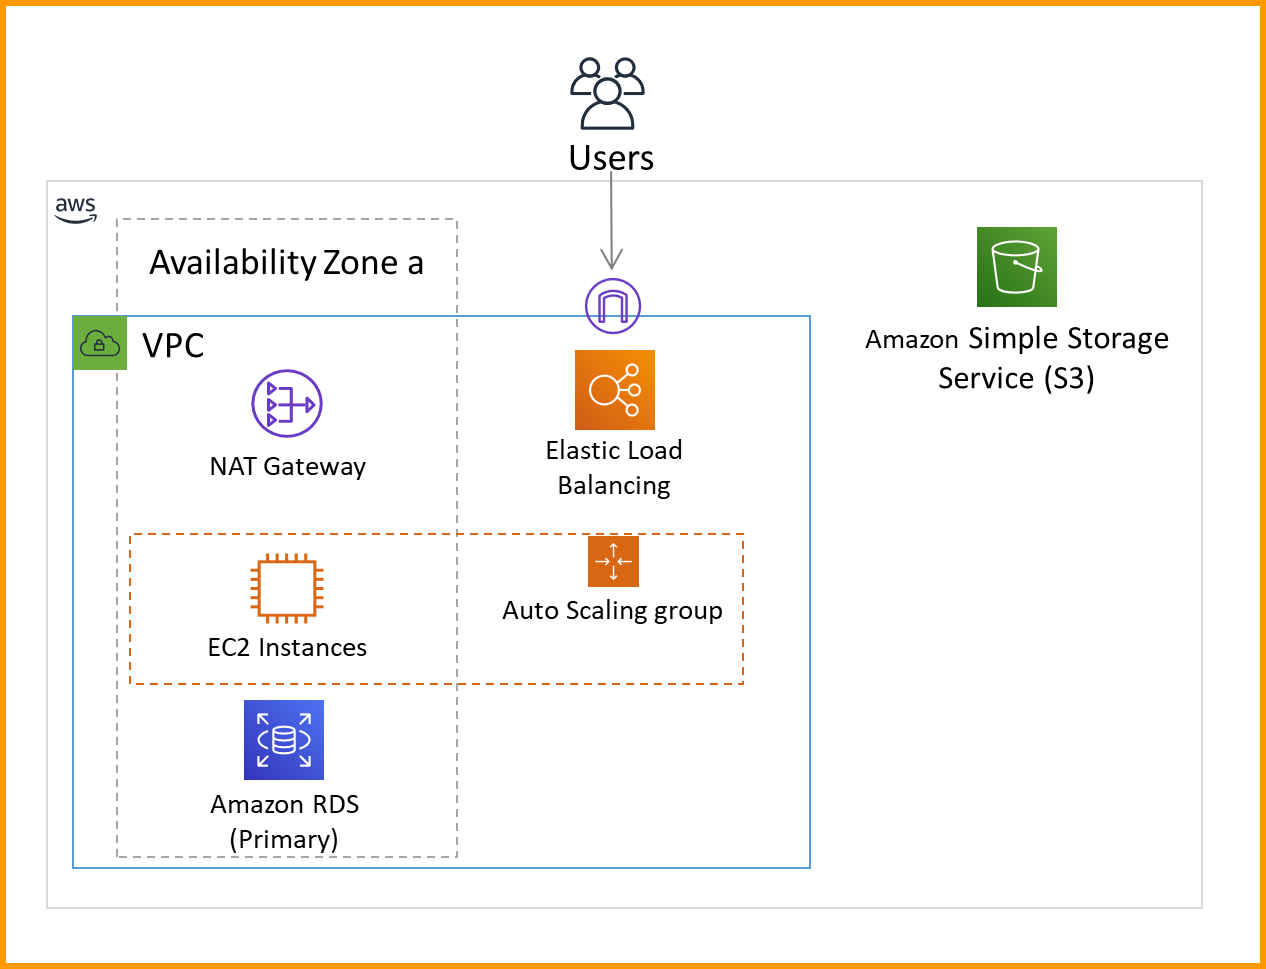
Figure 1 shows the single AZ architecture I’m going to start with and assess using Resilience Hub. This simple web server runs on Amazon Elastic Compute Cloud (Amazon EC2). It serves a static web page stored in an Amazon Simple Storage Service (Amazon S3) bucket, and then records web site statistics in a MySQL Amazon Relational Database Service (Amazon RDS) database. A NAT gateway is also deployed so the EC2 servers can make calls out to the internet. When I add my application to Resilience Hub, it will discover my application structure. Then I can use it to assess my application’s resiliency per the instructions in the Measure and Improve Your Application Resilience with AWS Resilience Hub blog post.

Single AZ architecture

Figure 1. Single AZ architecture

Even with only a single Amazon EC2 instance, it is still useful to include an Elastic Load Balancer. This lets you configure health checks performed against the EC2 instance. It also makes it easier to add more EC2 instances later. The Amazon EC2 Auto Scaling group helps improve resiliency—if the EC2 instance fails its health check, the Amazon EC2 Auto Scaling group will replace it.

Resilience Hub assessment results for the single AZ architecture

Figure 2 shows the results from Resilience Hub; it’s showing a lot of red flags! This architecture does not meet my required RTO (Recovery Time Objective) and RPO (Recovery Point Objective) goals for resiliency, and it is unrecoverable for all failure types. Figure 2 shows that Resilience Hub assesses for several failure types, including failures in the workload application (bad code or data), infrastructure (component failure), or individual AZ availability. AZs within a Region are independent of each other, even if one AZ experiences issues, the other AZs will remain available. The single AZ architecture does not take advantage of that.

Resilience Hub assessment of the single AZ architecture

Figure 2. Resilience Hub assessment of the single AZ architecture

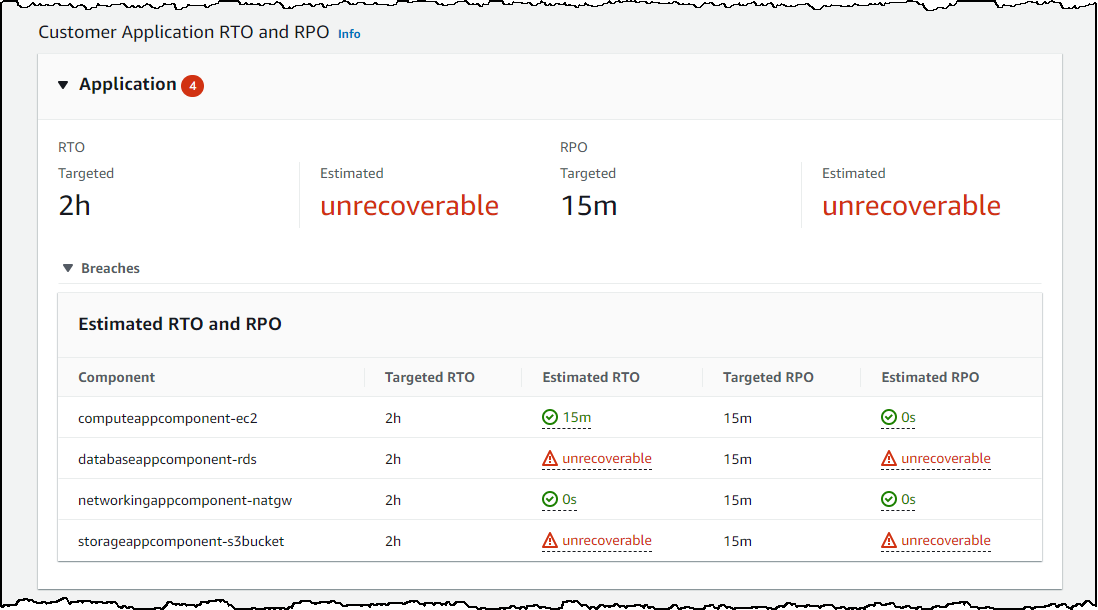
Figure 3 shows the component-level assessment of resiliency where each component corresponds to a part of the single AZ architecture. The results show that the S3 bucket does well. S3 is resilient to AZ failures and stores data across multiple AZs, which results in high data durability.

However, having a single RDS instance means that if the instance fails (infrastructure), or the AZ containing the instance fails (AZ) then it cannot operate (unrecoverable RTO), and the data will be lost (unrecoverable RPO). Similarly, deploying only one NAT gateway leaves the architecture vulnerable if the AZ experiences issues, so it shows as unrecoverable for AZ disruptions. But, because the NAT gateway is a fully managed service, there is no hardware to manage, and therefore it shows as resilient (0s RTO) for infrastructure issues.

Resilience Hub component-level assessment of the single AZ architecture against cloud infrastructure failures

Figure 3. Resilience Hub component-level assessment of the single AZ architecture against cloud infrastructure failures

To improve the single AZ architecture’s resiliency, Resilience Hub recommends enabling multi-AZ for the RDS instance. This will set up a standby database instance in another AZ. For the NAT gateway, it suggests “Add NAT Gateways in multiple AZs. (i.e., every AZ you have resources in).” I’ll implement these suggestions in the next section.

Multi-AZ architecture

Figure 4 shows the multi-AZ architecture that I built based on Resilience Hub’s recommendations, which use the following Well-Architected Reliability best practices:

Well-Architected Best Practice Modification to Architecture
Deploy the workload to multiple locations I set up RDS instances, NAT gateways, and EC2 instances distributed across AZs.
Fail over to healthy resources If one EC2 instance fails, the Elastic Load Balancer will fail over and send traffic to the remaining healthy ones. If the primary RDS instance fails, the standby will be promoted to be the new primary.
Automate healing on all layers The Amazon EC2 Auto Scaling group will replace faulty EC2 instances, and the RDS failover is automatic.
Multi-AZ architecture

Figure 4. Multi-AZ architecture

In the next section, I’ll send this new architecture through Resilience Hub to check how much it has improved.

Resilience Hub assessment results for the multi-AZ architecture

As shown in Figure 5, the architecture still has some problems, but it’s looking much better! Resilience Hub has highlighted application failure as the possible source of resilience issues, so let’s dive into application RTO and RPO.

Resilience Hub assessment of the multi-AZ architecture

Figure 5. Resilience Hub assessment of the multi-AZ architecture

Resilience Hub component-level assessment of the multi-AZ architecture against customer application failures

Figure 6. Resilience Hub component-level assessment of the multi-AZ architecture against customer application failures

By making RDS multi-AZ, data is replicated to a standby instance. If your infrastructure or AZ fails, the system will fail over to the standby instance.

Application failures are different. If the data is corrupted or deleted due to a bug, accident, or unauthorized action, then that deletion or corruption will be replicated to the standby. The standby does not protect you in this case. Similarly, with S3, I need to protect against unwanted deletion or corruption by the application, so let’s see what Resilience Hub recommends.

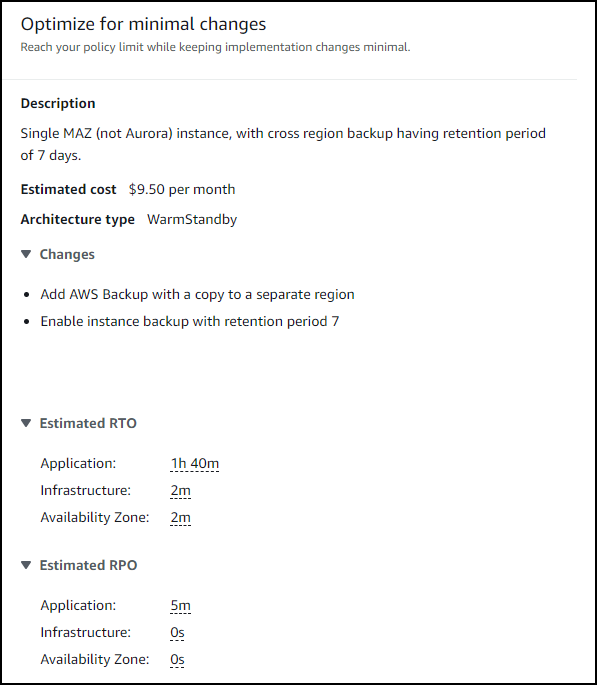
As shown in Figure 7, for RDS, I can enable instance backup, with a suggested retention period of 7 days. By doing this, I can achieve an RPO of 5 minutes because using automatic backup in RDS allows me to restore a DB instance to any specific time during the backup retention period. The latest restorable time for a DB instance is typically within 5 minutes of the current time. The RTO is longer because it takes time to restore a new RDS instance from backup.

Resilience Hub suggestions to improve RDS resiliency in the architecture

Figure 7. Resilience Hub suggestions to improve RDS resiliency in the architecture

As shown in Figure 8, for S3, it recommends I enable versioning. This feature allows me to roll back any change to an object (including deletion) to a last known good state. This means zero data loss and a 0s RPO.

Resilience Hub suggestions to improve S3 resiliency in the architecture

Figure 8. Resilience Hub suggestions to improve S3 resiliency in the architecture

Let’s implement these suggestions!

Multi-AZ architecture with data backup

Figure 9 shows the multi-AZ architecture that incorporates data backup features.

Multi-AZ architecture incorporating data backup features

Figure 9. Multi-AZ architecture incorporating data backup features

Resilience Hub has recommended more revisions to this architecture based on AWS Well-Architected Reliability best practices:

Well-Architected Best Practice Modification to Architecture
Identify and back up all data that needs to be backed up The data in my RDS database and S3 bucket are backed up.
Perform data backup automatically RDS backups are automatic. S3 object versioning is also automatic.

Resilience Hub final assessment results

And…that’s it! You’ll see in Figure 10 that I’ve achieved the goals I set for RTO and RPO and my architecture is more resilient and reliable.

Resilience Hub assessment of the multi-AZ architecture after incorporating data backup features

Figure 10. Resilience Hub assessment of the multi-AZ architecture after incorporating data backup features

Resilience Hub has even more recommendations for things I could improve. For example, if I switch from MySQL RDS to Amazon Aurora I can use backtracking to reduce the 1 hour 40 minute RTO that it takes to restore an RDS database backup. Backtracking “rewinds” the DB cluster to the time you specify, so you can restore a last known good state without needing to recreate the entire database from backup, which saves time and reduces RTO.

Conclusion

To improve the resiliency of your workloads, you need to apply the right best practices. This blog post shows you how Resilience Hub can help you assess and improve a workload with poor resiliency, identify areas for improvement, implement best practices, and evaluate how those practices meet your resiliency goals.

Your guide to all things Amazon QuickSight at AWS re:Invent 2021

Post Syndicated from Mia Heard original https://aws.amazon.com/blogs/big-data/your-guide-to-all-things-amazon-quicksight-at-aws-reinvent-2021/

AWS re:Invent is a learning conference hosted by AWS for the global cloud computing community. This year’s re:Invent will be held in Las Vegas, NV from November 29th to December 3rd. Amazon QuickSight, a scalable, embeddable, ML-powered business intelligence (BI) service for the cloud will be represented at re:Invent within the Business Intelligence track through keynotes, breakout sessions, chalk talks, workshops, and other planned activities.

This post walks you through the details of all QuickSight related sessions and activities to help you plan your conference week accordingly. These sessions should appeal to anyone wanting to learn more about modernizing their BI capabilities and curating a more data driven culture including business decision makers, BI analysts, data scientists, app developers, and others! To access the session catalog and reserve your seat for one of our Business Intelligence sessions, you must be registered for re:Invent. Register now!

Keynotes

Swami Sivasubramanian – Vice President, Amazon Machine Learning – Keynote

Join Swami Sivasubramanian, Vice President, Amazon Machine Learning, on an exploration of what it takes to put data in action with an end to end data strategy including the latest news on databases, analytics, and machine learning.

Rahul Pathak – Vice President, Analytics – Leadership Session: Reinvent your business for the future with AWS Analytics 

The next wave of digital transformation will be data-driven, and organizations will have to reinvent themselves using data to make decisions quickly and gain faster and deeper insights to serve their customers. In this session, Rahul Pathak, VP of AWS Analytics, addresses the current state of analytics on AWS, focusing on the latest service innovations. Learn how you can put your data to work with the best of both data lakes and purpose-built data stores. Also, discover how AWS can help you build new experiences and reimagine old processes with a modern data architecture on AWS.

Breakout sessions 

BSI201 (LVL 200) – Self-service analytics for everyone with ML-powered Amazon QuickSight Q

In our increasingly fast-paced world, it is critical for companies to make data-driven business decisions quickly. In order to move fast, teams need the ability to answer business questions without relying on the time-consuming efforts of business intelligence (BI) teams. Amazon QuickSight Q is a machine learning-powered capability that uses natural language processing to answer business questions instantly in the form of a visual, without requiring authors to create visuals, dashboards, or analyses. In this session, the Amazon QuickSight team provides an overview of Q and guidance on how to get started with this new capability.

BSI202 (LVL 200) – Modernize your BI and reporting with Amazon QuickSight 

Organizations increasingly strive to improve data literacy for all their employees and reduce dependence on IT and data scientists while gaining efficiency by moving to the cloud. Existing business intelligence tools can limit business users’ insight into their data. They can also limit IT departments’ ability to provide self-service analytics in a secure, scalable, and cost-efficient way. Join this session to learn how customers have modernized their advanced analytics, self-service, and reporting needs by migrating to Amazon QuickSight. With QuickSight, you only pay for what you use and are not required to manage any infrastructure.

BSI203 (LVL 200) – Enhance your apps with Amazon QuickSight embedded analytics 

Empower your users by embedding business analytics capabilities directly into your application. Amazon QuickSight embedded analytics seamlessly integrate into your application and enable your users to perform advanced analytics with capabilities such as one-time, or ad hoc, analyses and machine learning-based insights, providing you with new ways of monetizing and differentiating your applications. Join this session to learn about QuickSight’s new capabilities for embedding rich data visualizations within SaaS applications that provide governance and data security. The session also shows how QuickSight can be easily connected to your choice of data services including Amazon RDS, Amazon Athena, Amazon S3, or Amazon Redshift.

Chalk talks 

BSI204 (LVL 200) – Authoring configuration for Amazon QuickSight Q

Amazon QuickSight Q is a machine learning-powered capability that uses natural language processing to instantly answer business questions about data. Q interprets questions to understand their intent and generates an answer instantly in the form of a visual, without requiring authors to create visuals, dashboards, or analyses. In this chalk talk, the Amazon QuickSight Q team provides an overview of Q and the different question types that are currently supported. Following the product demo, learn how to set up datasets to answer natural language questions from users.

BSI301 (LVL 300) – Advanced deployment options at scale with Amazon QuickSight

Amazon QuickSight is a scalable, serverless, embeddable, ML-powered BI service built for the cloud that you can use to deliver easy-to-understand insights to the people that you work with – wherever they are. In this chalk talk, learn about deployment methodologies and best practices around multi-tenancy, cross-account data connectivity, single sign-on, content migration, and automation, to give you confidence deploying into even the most sophisticated environments.

Workshops 

BSI302 (LVL 300) – Build stunning dashboards with Amazon QuickSight 

Want to grow your dashboard-building skills from beginner to advanced? In this workshop, the Amazon QuickSight team guides you through the latest authoring functionality, such as high-fidelity layouts, custom content, and advanced formatting. These features are designed to empower you to build beautiful layouts and robust interactive experiences with other applications, right from within your dashboard.

Additional activities

Demo: “Get answers on your data in seconds with Amazon QuickSight”

Join us in the demo theater on Tuesday November 30 at 3:00PM PST for an Amazon QuickSight Q deep dive demo.

Business Intelligence kiosk in the AWS Village

Visit the Business Intelligence kiosk within the AWS Village to meet with experts to dive deeper into QuickSight capabilities such as ML-powered Q and Embedded Analytics. You will be able to ask our experts questions and experience live demos for our newly launched capabilities.

Grab your QuickSight swag

Make sure to stop by the swag distribution table to grab free QuickSight swag. You must attend one of the breakout sessions, chalk talks, workshops, or visit our kiosk to obtain a swag voucher.

Other QuickSight related sessions 

LFS304 – Accelerate science by unifying data silos across the enterprise

When shifting to data-driven decision-making, customers—especially those in the life sciences—often struggle with the need to access data and free it from organizational silos or find it in other enterprises. In this workshop, learn how to build an effective data mesh platform on AWS to make data discoverable, secure, and interoperable. Free your data from silos and minimize unnecessary data movement. Utilizing AWS Glue, Amazon Athena, AWS Lake Formation, Amazon S3, Amazon QuickSight, and Amazon Neptune, bring together disparate data sources from across the enterprise. Use what you learn to build a scalable data mesh to serve as the foundation for any analytics and data science effort.

DEM066 – S –  Assess, plan & automate the transition from legacy BI to Amazon QuickSight (sponsored by Ironside)

Ironside’s Ascent suite, powered by AWS, enables a rapid, efficient, and successful way to build new analytics, explore AI, and migrate from legacy platforms to the cloud. Join this session to learn how to use Ironside’s AscentIQ offering for Amazon QuickSight to inventory, rationalize, and plan the migration of your existing reporting implementation; build the business case for your migration; refactor and automate generation of legacy report specifications; and accelerate functional validation of legacy content. This presentation is brought to you by Ironside, an AWS Partner.

COP311 –  Build your own customizable cost reporting dashboards

Get actionable insights to track your AWS cost and usage performance, drive cost-efficient consumption behavior in your organization, and make cost-aware architectural decisions. Join this workshop to learn how you can integrate AWS Cost and Usage Reports with Amazon QuickSight and build your own dashboards to visualize specific KPIs and savings opportunities that are meaningful to you and your business.

GPS306 – Data warehouse and business intelligence modernization

Amazon Redshift is a fast, fully managed, petabyte-scale, cloud-native analytics data warehouse. A large number of organizations are migrating their current data warehousing systems into Amazon Redshift to take advantage of better performance and scale, lower costs, the ease of use of a managed service, and data lake integration. Amazon QuickSight is a scalable, serverless, cloud-powered business intelligence (BI) service that makes it easy for you to publish insights through interactive BI dashboards. Join this workshop to learn and practice how to modernize and migrate legacy data warehouse systems to Amazon Redshift and how to migrate your BI dashboards to Amazon QuickSight.

ENT306 –  Outcome-oriented analytics for SAP on AWS

In this workshop, learn how to solve common business problems using native AWS services in conjunction with SAP applications. First in the workshop, build a data extraction layer from SAP. Then, prepare the data with AWS Glue DataBrew and use Amazon QuickSight to visualize, forecast, and use NLP for business process reporting.

AIM208 – S – Port of Vancouver: Improving supply chain visibility (sponsored by Deloitte)

As Canada’s largest port and the third-largest port in North America, the Port of Vancouver needed to overhaul its container examination process because it was a major source of challenges across the network. Join this session to learn how the Port of Vancouver used a blockchain application integrated with AWS Panorama to help identify and track containers, feed real-time data into the blockchain system, enable proper assignment of cost, and identify efficiency improvement opportunities. Discover how other AWS services, such as Amazon SageMaker, Amazon QuickSight, AWS IoT Core, and more, were also used to deliver the data and insights, while meeting privacy, security, and data residency requirements. This presentation is brought to you by Deloitte, an AWS Partner.

FSI203 –  State Farm: Enabling rapid deployment with risk automation

In this session, learn how State Farm streamlined deployment approval from months to minutes by implementing an automated, data-driven risk management process for all use cases leveraging AWS services. Approving deployments for production in financial services can often be a manual, opinion-based, and time-consuming process that frustrates developers, security teams, and executive leadership alike. State Farm’s solution not only notifies account administrators of potential compliance issues but also supports auto-remediation of these issues. It provides continuous, real-time testing and monitoring of controls, which accelerates service adoption for developers, delivers assurance to InfoSec professionals, and enables agile executive decision-making.

AIM317 –  Uncover insights from customer conversations with no ML expertise required

Understanding what your customers are saying is critical to your business, but navigating the technology needed to make sense of these conversations can be daunting. In this workshop, discover how to uncover valuable insights from your data using custom models that are tailored to your business needs—with no ML expertise required. Using a set of customer calls, learn how to boost transcription accuracy with Amazon Transcribe custom language models, extract insights with Amazon Comprehend custom entities, localize content with Amazon Translate Active Custom Translation, and create powerful visualizations with Amazon QuickSight.

Useful resources 

Whether you plan on attending re:Invent in person or virtually this year you can always learn more about QuickSight through these helpful resources:

QuickSight YouTube Channel
Subscribe to stay up to date on the latest QuickSight workshops, getting started tutorials, and demo videos.

QuickSight DemoCentral

Experience QuickSight first hand through interactive dashboards and demos.

QuickSight workshops

 Enhance your BI skills with self-paces QuickSight workshops.


About the Author

Mia Heard is a product marketing manager for Amazon QuickSight, AWS’ cloud-native, fully managed BI service.
Optimizing Apache Flink on Amazon EKS using Amazon EC2 Spot Instances

Post Syndicated from Emma White original https://aws.amazon.com/blogs/compute/optimizing-apache-flink-on-amazon-eks-using-amazon-ec2-spot-instances/

This post is written by Kinnar Sen, Senior EC2 Spot Specialist Solutions Architect

Apache Flink is a distributed data processing engine for stateful computations for both batch and stream data sources. Flink supports event time semantics for out-of-order events, exactly-once semantics, backpressure control, and optimized APIs. Flink has connectors for third-party data sources and AWS Services, such as Apache Kafka, Apache NiFi, Amazon Kinesis, and Amazon MSK. Flink can be used for Event Driven (Fraud Detection), Data Analytics (Ad-Hoc Analysis), and Data Pipeline (Continuous ETL) applications. Amazon Elastic Kubernetes Service (Amazon EKS) is the chosen deployment option for many AWS customers for Big Data frameworks such as Apache Spark and Apache Flink. Flink has native integration with Kubernetes allowing direct deployment and dynamic resource allocation.

In this post, I illustrate the deployment of scalable, highly available (HA), resilient, and cost optimized Flink application using Kubernetes via Amazon EKS and Amazon EC2 Spot Instances (Spot). Learn how to save money on big data streaming workloads by implementing this solution.

Overview

Amazon EC2 Spot Instances

Amazon EC2 Spot Instances let you take advantage of spare EC2 capacity in the AWS Cloud and are available at up to a 90% discount compared to On-Demand Instances. Spot Instances receive a two-minute warning when these instances are about to be reclaimed by Amazon EC2. There are many graceful ways to handle the interruption. Recently EC2 Instance rebalance recommendation has been added to send proactive notifications when a Spot Instance is at elevated risk of interruption. Spot Instances are a great way to scale up and increase throughput of Big Data workloads and has been adopted by many customers.

Apache Flink and Kubernetes

Apache Flink is an adaptable framework and it allows multiple deployment options and one of them being Kubernetes. Flink framework has a couple of key building blocks.

  • Job Client submits the job in form of a JobGraph to the Job Manager.
  • Job Manager plays the role of central work coordinator which distributes the job to the Task Managers.
  • Task Managers are the worker component, which runs the operators for source, transformations and sinks.
  • External components which are optional such as Resource Provider, HA Service Provider, Application Data Source, Sinks etc., and this varies with the deployment mode and options.

Image shows Flink application deployment architecture with Job Manager, Task Manager, Scheduler, Data Flow Graph, and client.

Flink supports different deployment (Resource Provider) modes when running on Kubernetes. In this blog we will use the Standalone Deployment mode, as we just want to showcase the functionality. We recommend first-time users however to deploy Flink on Kubernetes using the Native Kubernetes Deployment.

Flink can be run in different modes such as Session, Application, and Per-Job. The modes differ in cluster lifecycle, resource isolation and execution of the main() method. Flink can run jobs on Kubernetes via Application and Session Modes only.

  • Application Mode: This is a lightweight and scalable way to submit an application on Flink and is the preferred way to launch application as it supports better resource isolation. Resource isolation is achieved by running a cluster per job. Once the application shuts down all the Flink components are cleaned up.
  • Session Mode: This is a long running Kubernetes deployment of Flink. Multiple applications can be launched on a cluster and the applications competes for the resources. There may be multiple jobs running on a TaskManager in parallel. Its main advantage is that it saves time on spinning up a new Flink cluster for new jobs, however if one of the Task Managers fails it may impact all the jobs running on that.

Amazon EKS

Amazon EKS is a fully managed Kubernetes service. EKS supports creating and managing Spot Instances using Amazon EKS managed node groups following Spot best practices. This enables you to take advantage of the steep savings and scale that Spot Instances provide for interruptible workloads. EKS-managed node groups require less operational effort compared to using self-managed nodes. You can learn more in the blog “Amazon EKS now supports provisioning and managing EC2 Spot Instances in managed node groups.”
Apache Flink and Spot

Big Data frameworks like Spark and Flink are distributed to manage and process high volumes of data. Designed for failure, they can run on machines with different configurations, inherently resilient and flexible. Spot Instances can optimize runtimes by increasing throughput, while spending the same (or less). Flink can tolerate interruptions using restart and failover strategies.

Fault Tolerance

Fault tolerance is implemented in Flink with the help of check-pointing the state. Checkpoints allow Flink to recover state and positions in the streams. There are two per-requisites for check-pointing a persistent data source (Apache Kafka, Amazon Kinesis) which has the ability to replay data and a persistent distributed storage to store state (Amazon Simple Storage Service (Amazon S3), HDFS).

Cost Optimization

Job Manager and Task Manager are key building blocks of Flink. The Task Manager is the compute intensive part and Job Manager is the orchestrator. We would be running Task Manager on Spot Instances and Job Manager on On Demand Instances.

Scaling

Flink supports elastic scaling via Reactive Mode, Task Managers can be added/removed based on metrics monitored by an external service monitor like Horizontal Pod Autoscaling (HPA). When scaling up new pods would be added, if the cluster has resources they would be scheduled it not then they will go in pending state. Cluster Autoscaler (CA) detects pods in pending state and new nodes will be added by EC2 Auto Scaling. This is ideal with Spot Instances as it implements elastic scaling with higher throughput in a cost optimized way.

Tutorial: Running Flink applications in a cost optimized way

In this tutorial, I review steps, which help you launch cost optimized and resilient Flink workloads running on EKS via Application mode. The streaming application will read dummy Stock ticker prices send to an Amazon Kinesis Data Stream by Amazon Kinesis Data Generator, try to determine the highest price within a per-defined window, and output will be written onto Amazon S3 files.

Image shows Flink application pipeline with data flowing from Amazon Kinesis Data Generator to Kinesis Data Stream, processed in Apache Flink and output being written in Amazon S3

The configuration files can be found in this github location. To run the workload on Kubernetes, make sure you have eksctl and kubectl command line utilities installed on your computer or on an AWS Cloud9 environment. You can run this by using an AWS IAM user or role that has the Administrator Access policy attached to it, or check the minimum required permissions for using eksctl. The Spot node groups in the Amazon EKS cluster can be launched both in a managed or a self-managed way, in this post I use the EKS Managed node group for Spot Instances.

Steps

When we deploy Flink in Application Mode it runs as a single application. The cluster is exclusive for the job. We will be bundling the user code in the Flink image for that purpose and upload in Amazon Elastic Container Registry (Amazon ECR). Amazon ECR is a fully managed container registry that makes it easy to store, manage, share, and deploy your container images and artifacts anywhere.

1. Build the Amazon ECR Image

  • Login using the following cmd and don’t forget to replace the AWS_REGION and AWS_ACCOUNT_ID with your details.

aws ecr get-login-password --region ${AWS_REGION} | docker login --username AWS —password-stdin ${ACCOUNT_ID}.dkr.ecr.${AWS_REGION}.amazonaws.com

  • Create a repository

aws ecr create-repository --repository-name flink-demo --image-scanning-configuration scanOnPush=true —region ${AWS_REGION}

  • Build the Docker image:

Download the Docker file. I am using multistage docker build here. The sample code is from Github’s Amazon Kinesis Data Analytics Java examples. I modified the code to allow checkpointing and change the sliding window interval. Build and push the docker image using the following instructions.

docker build --tag flink-demo .

  • Tag and Push your image to Amazon ECR

docker tag flink-demo:latest ${ACCOUNT_ID}.dkr.ecr.${AWS_REGION}.amazonaws.com/flink-demo:latest
docker push ${ACCOUNT_ID}.dkr.ecr.${AWS_REGION}.
amazonaws.com/flink-demo:latest

2. Create Amazon S3/Amazon Kinesis Access Policy

First, I must create an access policy to allow the Flink application to read/write from Amazon fFS3 and read Kinesis data streams. Download the Amazon S3 policy file from here and modify the <<output folder>> to an Amazon S3 bucket which you have to create.

  • Run the following to create the policy. Note the ARN.

aws iam create-policy --policy-name flink-demo-policy --policy-document file://flink-demo-policy.json

3. Cluster and node groups deployment

  • Create an EKS cluster using the following command:

eksctl create cluster –name= flink-demo --node-private-networking --without-nodegroup --asg-access –region=<<AWS Region>>

The cluster takes approximately 15 minutes to launch.

  • Create the node group using the nodeGroup config file. I am using multiple nodeGroups of different sizes to adapt Spot best practice of diversification.  Replace the <<Policy ARN>> string using the ARN string from the previous step.

eksctl create nodegroup -f managedNodeGroups.yml

  • Download the Cluster Autoscaler and edit it to add the cluster-name (flink-demo)

curl -LO https://raw.githubusercontent.com/kubernetes/autoscaler/master/cluster-autoscaler/cloudprovider/aws/examples/cluster-autoscaler-autodiscover.yaml

4. Install the Cluster AutoScaler using the following command:

kubectl apply -f cluster-autoscaler-autodiscover.yaml

  • Using EKS Managed node groups requires significantly less operational effort compared to using self-managed node group and enables:
    • Auto enforcement of Spot best practices.
    • Spot Instance lifecycle management.
    • Auto labeling of Pods.
  • eksctl has integrated amazon-ec2-instance-selector to enable auto selection of instances based on the criteria passed. This has multiple benefits
    • ‘instance diversification’ is implemented by enabling multiple instance types selection in the node group which works well with CA
    • Reduces manual effort of selecting the instances.
  • We can create node group manifests using ‘dryrun’ and then create node groups using that.

eksctl create cluster --name flink-demo --instance-selector-vcpus=2 --instance-selector-memory=4 --dry-run

eksctl create node group -f managedNodeGroups.yml

5. Create service accounts for Flink

$ kubectl create serviceaccount flink-service-account
$ kubectl create clusterrolebinding flink-role-binding-flink --clusterrole=edit --serviceaccount=default:flink-service-account

6. Deploy Flink

This install folder here has all the YAML files required to deploy a standalone Flink cluster. Run the install.sh file. This will deploy the cluster with a JobManager, a pool of TaskManagers and a Service exposing JobManager’s ports.

  • This is a High-Availability(HA) deployment of Flink with the use of Kubernetes high availability service.

  • The JobManager runs on OnDemand and TaskManager on Spot. As the cluster is launched in Application Mode, if a node is interrupted only one job will be restarted.
  • Autoscaling is enabled by the use of ‘Reactive Mode’. Horizontal Pod Autoscaler is used to monitor the CPU load and scale accordingly.
  • Check-pointing is enabled which allows Flink to save state and be fault tolerant.

Image shows the Flink dashboard highlighting checkpoints for a job

7. Create Amazon Kinesis data stream and send dummy data      

Log in to AWS Management Console and create a Kinesis data stream name ‘ExampleInputStream’. Kinesis Data Generator is used to send data to the data stream. The template of the dummy data can be found here. Once this sends data the Flink application starts processing.

Image shows Amazon Kinesis Data Generator console sending data to Kinesis Data Strea

Observations

Spot Interruptions

If there is an interruption then the Flick application will be restarted using check-pointed data. The JobManager will restore the job as highlighted in the following log. The node will be replaced automatically by the Managed Node Group.

mage shows logs from a Flink job highlighting job restart using checkpoints.

One will be able to observe the graceful restart in the Flink UI.

Image shows the Flink dashboard highlighting job restart after failure.

AutoScaling

You can observe the elastic scaling using logs. The number of TaskManagers in the Flink UI will also reflect the scaling state.

Image shows kubectl output showing status of HPA during scale-out

Cleanup

If you are trying out the tutorial, run the following steps to make sure that you don’t encounter unwanted costs.

  • Run the delete.sh file.
  • Delete the EKS cluster and the node groups:
    • eksctl delete cluster --name flink-demo
  • Delete the Amazon S3 Access Policy:
    • aws iam delete-policy --policy-arn <<POLICY ARN>>
  • Delete the Amazon S3 Bucket:
    • aws s3 rb --force s3://<<S3_BUCKET>>
  • Delete the CloudFormation stack related to Kinesis Data Generator named ‘Kinesis-Data-Generator-Cognito-User’
  • Delete the Kinesis Data Stream.

Conclusion

In this blog, I demonstrated how you can run Flink workloads on a Kubernetes Cluster using Spot Instances, achieving scalability, resilience, and cost optimization. To cost optimize your Flink based big data workloads you should start thinking about using Amazon EKS and Spot Instances.

Hands-On IoT Hacking: Rapid7 at DefCon 29 IoT Village, Part 4

Post Syndicated from Deral Heiland original https://blog.rapid7.com/2021/11/11/hands-on-iot-hacking-rapid7-at-defcon-29-iot-village-part-4/

Hands-On IoT Hacking: Rapid7 at DefCon 29 IoT Village, Part 4

The first 3 installments of our series on Rapid7’s hands-on exercise from the IoT Village at this year’s DefCon covered how to set up a UART header, how to determine UART status and baud rate, and how to log into single-user mode on the device. In this final post, we’ll discuss how to gain full root access and successfully complete this exercise in IoT hacking.
Mount rootfs_data and configure user accounts

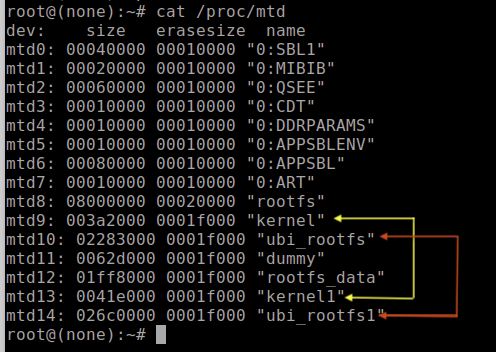
Once you’re logged on in single-user mode (root), I recommend taking a quick look at a few other things that are interesting. For example, look at the partition layout on the flash chips. This can be done by running cat against /proc/mtd. (MTD stands for Memory Technology Devices.) Enter the command “cat /proc/mtd” and hit enter. This should return the list of MTDs (Figure 25), which list their dev number, size, and names.

As you can see, there are a couple of partitions that appear to have similar names, such as “kernel” and “kernel1,” as well as “ubi_rootfs” and “ubi_rootfs1.” The purpose of having duplicate file system partitions is to allow system firmware updates without potentially bricking the device if there were issues during the update process, such as a power failure. During normal operation, one of these partition pairs is online, while the others are offline. So, when a firmware update is done, the offline partitions are updated and then placed online, and the others are taken offline during a system reboot. If there is a failure during the update process, the system can safely roll back to the partition pair that was not corrupted.

Hands-On IoT Hacking: Rapid7 at DefCon 29 IoT Village, Part 4
Figure 25: /proc/mtd

To gain full running root access on the LUMA, we’re interested in the rootfs_data partition file system (Figure 26).

Hands-On IoT Hacking: Rapid7 at DefCon 29 IoT Village, Part 4
Figure 26: rootfs_data Partition

This file system “rootfs_data” is used to hold the dynamically configurable system data and user configuration information, which is typically removed if you do a factory reset on the device. This data partition filesystem is typically on all IoT devices but often has different names.

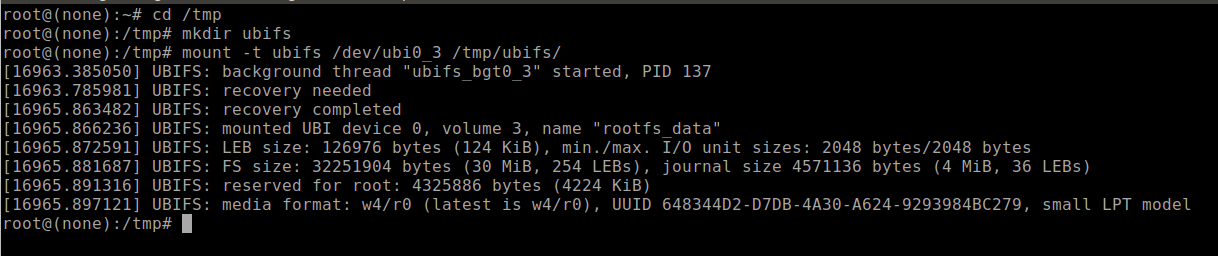
Earlier in this blog series, while reviewing the captured UART console logs, we made note of what UBIFS device number and volume number this partition was mounted on. With that information, our next step will be to mount the rootfs_data partition and create a shadow and passwd file with account information, so when we reboot the system, we’ll be able to gain full root access on a fully operational device. To make this happen, the first step is to create a writable directory that we can mount this file system to. The best place for doing this on an IoT device will always be the /tmp folder, which is a temporary location in RAM and is always read/writable.

To accomplish this, I typically change directory to /tmp and create a folder for a mount point on the device using the following commands:

  • cd /tmp
  • mkdir ubifs

Now, use the correct UBIFS device number and volume number we observed in the boot logs:

device 0, volume 2 = /dev/ubi0_2

device 0, volume 3 = /dev/ubi0_3

Enter the following command corrected to either (/dev/ubi0_2 or /dev/ubi0_3) to mount the partition to the mount point you created at /tmp/ubifs:

  • mount -t ubifs /dev/ubi0_3 /tmp/ubifs/

This command should return results that look similar to Figure 27 without any errors. The only time I have encountered errors was when the rootfs_data volume was corrupted. I was able to correct that by conducting a factory reset on the device and starting over.

Hands-On IoT Hacking: Rapid7 at DefCon 29 IoT Village, Part 4
Figure 27: Mount UBIFS Partition

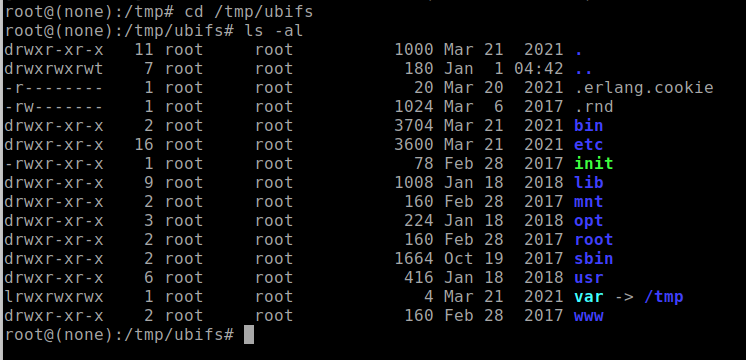
If successful, you should be able to change directory to this mounted volume and list the files and folders using the following commands:

  • cd /tmp/ubifs
  • ls -al

If the partition was properly mounted, you should see folders and files within the mount point that may look similar to the example shown in Figure 28. Also note that if the device has been factory reset, it may show far fewer folders and files. Although, with the LUMA device, it should at least show the /etc folder.

Hands-On IoT Hacking: Rapid7 at DefCon 29 IoT Village, Part 4
Figure 28: Mounted rootfs_data Partition

Once you’ve mounted the rootfs_data volume, the next step is to change the directory to the “/tmp/ubifs/etc” folder and create and/or alter the passwd and shadow file to add an account to allow root access privileges. You can do this by entering the following commands, which will create a root account with the username of defcon with a blank password, which we used for the Defcon IoT Village exercises.

  • cd /tmp/ubifs/etc/
  • echo “defcon:::0:99999:7:::” > /tmp/ubifs/etc/shadow
  • echo “defcon:x:0:0:root:/root:/bin/ash” > /tmp/ubifs/etc/passwd
Hands-On IoT Hacking: Rapid7 at DefCon 29 IoT Village, Part 4
Figure 29: passwd & shadow file creation

The reason why this works is the data volume — in this case, rootfs_data — contains all dynamic configurations and settings for the device, so anything typically added to this volume will take precedence over any setting on the core root filesystem.

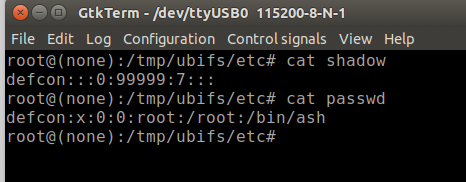
As a quick check to make sure everything was done correctly, run the following commands, and make sure the shadow and passwd file were created and the contents are correct.

  • cat shadow
  • cat passwd

If correct, the output should look like the following example in Figure 30:

Hands-On IoT Hacking: Rapid7 at DefCon 29 IoT Village, Part 4
Figure 30: Content of shadow and passwd Files

Reboot and log in

If everything looks good, you’re ready to reboot the system and gain full root access. To reboot the system, you can just enter “reboot” on the UART console or power cycle the device.

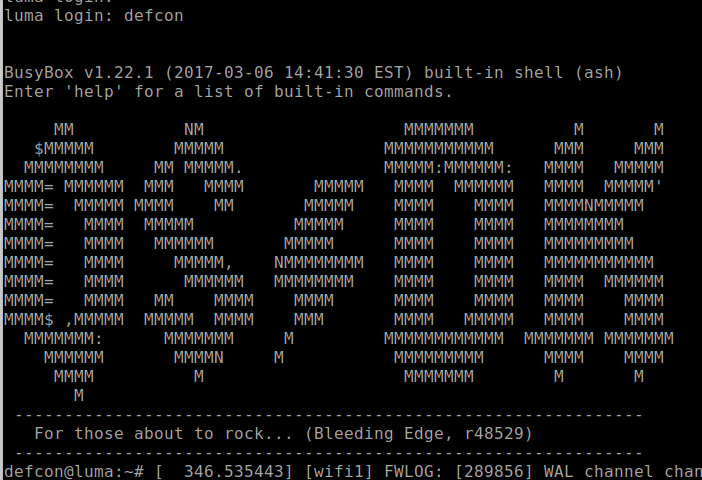
Once the system appears to be close to being booted, a good indication on LUMA is seeing the message “Please press Enter to activate this console” in the console. You can then hit the return key to see a login prompt. There may be a lot of log message noise in the console, but you can still enter the configured username defcon that was created during the creation of the shadow and passwd file, followed by the enter key. If everything was configured correctly, you should login without the need of a password as shown in Figure 31:

Hands-On IoT Hacking: Rapid7 at DefCon 29 IoT Village, Part 4
Figure 31: Login with defcon

If this fails and you’re prompted for a password, the most common cause is that you entered the commands to create the “passwd” and “shadow” files incorrectly. If you logged in, then you’re now fully authenticated as root, and the system should be in the full operational mode. Also, it’s not uncommon to see a lot of output messages to the UART console, which can be a pain and prevent you from easily interacting with the console. To get around this issue, you can temporarily disable most of the messages. Try entering the following command to make it a little quieter:

  • dmesg -n 1

Once you’ve run that command, it should be much easier to see what’s going on. At this point, you can interact with the system as root. For example, by running the commands below, you can see running processes and show current network open ports and connections.

  • ps -ef “ List the processes running on the system”
  • netstat -an “ Shows UDP/TCP ports and connection”

I often get asked during this exercise, “What do we gain from getting this level of root access to an IoT device?” I think the best answer is that this level of access allows us to do more advanced and detailed security testing on a device. This is not as easily done when setting on the outside of the IoT devices or attempting to emulate on some virtual machine, because often, the original hardware contains components and features that are difficult to emulate. With root-level access, we can interact more directly with running services and applications and better monitor the results of any testing we may be conducting.

NEVER MISS A BLOG

Get the latest stories, expertise, and news about security today.

Backblaze Is Now a Public Company

Post Syndicated from original https://www.backblaze.com/blog/backblaze-is-now-a-public-company/

Today is a big day for Backblaze—we became a public company listed on the Nasdaq Stock Exchange under the ticker symbol BLZE!

Before I explain what this means for us and for you, I want to give my thanks. Going public is an important milestone and one we couldn’t have accomplished without your support. Thank you.

Whether you have believed in us from the beginning and have been a customer for over a decade, or joined us yesterday; whether you entrust us to back up a single computer or to run your entire company’s infrastructure on the Backblaze Storage Cloud; whether you’ve partnered with us to bring our services to one individual or thousands of companies, whether you’re a first-time visitor to our site or you’ve been a reader all along: Thank you. We really appreciate you working with us and supporting us.

What Does Becoming a Public Company Mean for Backblaze?

It means we have more resources with IPO proceeds to increase investment in the development of our Storage Cloud platform and the B2 Cloud Storage and Computer Backup services that run on it.

The future is being built on independent cloud platforms, and ours has been 14 years in the making. Today, we take the next big step in being the leading independent cloud for data storage.

Additionally, while we help about 500,000 customers already, we plan to expand our sales and marketing efforts to bring Backblaze to more businesses, developers, and individuals that would benefit from easy and affordable data storage that they can trust.

Finally, we have built Backblaze with not only a focus on the products we provide, but with a deep care for what it is like to work here. With these proceeds, we plan to continue to significantly grow our team, and are looking for many more kind, smart, talented people to join us. (Is that you? We’re hiring!)

And Most Importantly, What Does It Mean for You?

My short answer is: It means more of the good things you’ve come to expect from us at Backblaze.

I want to emphasize that while we’ll be doing “more” for you, today’s events don’t mean that we’re “different” on any fundamental level. We’re still guided by the same principles and the same team. As a reminder, here’s the core of the values that we’ve been committed to since our founding (as written by Brian Wilson, Co-founder and CTO):

“At Backblaze, we want to provide a quality product for a fair price. We want to be honest and up front with our customers as to what we can and cannot do, and we want to be paid only the money honestly owed to us, and never engage in sleazy or misleading business practices where customers are misled in any way or pay for a service they do not receive. We are the ‘good guys,’ and we act like it.”

The only thing that’s changing today is we now have a more robust structure and additional funding to deliver on these values for more customers and partners.

If you’d like to share your thoughts, we’d love to hear from you in the comments section below. In the coming weeks, I’ll share more about where we started, why we decided to go public, how we did it, and more. Stay tuned and for now…

It’s Time to Blaze On!

The post Backblaze Is Now a Public Company appeared first on Backblaze Blog | Cloud Storage & Cloud Backup.

[$] Exposing Trojan Source exploits in Emacs

Post Syndicated from original https://lwn.net/Articles/875229/rss

While the “Trojan Source” vulnerabilities
have, thus far, generated far more publicity than examples of actual
exploits, addressing the problem still seems like a good thing to do.
There are several places where defenses could be put into place; text
editors, being the place where developers look at a lot of code, are one
obvious example. The discussion of how to enhance Emacs in this regard has
made it clear, though, that there are multiple opinions about how an editor
should flag potential attacks.

Twelve Years of Go (The Go blog)

Post Syndicated from original https://lwn.net/Articles/875817/rss

On November 10, the Go programming language community celebrated the 12th anniversary of its release as open-source software. The post covers a number of different topics, including the consolidation of web sites at go.dev, releases and their features over the last year, as well as a look to the future:

In February, the Go 1.18 release will expand the new register-based calling convention to non-x86 architectures, bringing dramatic performance improvements with it. It will include the new Go fuzzing support. And it will be the first release to include support for generics.

Generics will be one of our focuses for 2022. The initial release in Go 1.18 is only the beginning. We need to spend time using generics and learning what works and what doesn’t, so that we can write best practices and decide what should be added to the standard library and other libraries. We expect that Go 1.19 (expected in August 2022) and later releases will further refine the design and implementation of generics as well as integrating them further into the overall Go experience.

Understanding how AWS Lambda scales with Amazon SQS standard queues

Post Syndicated from James Beswick original https://aws.amazon.com/blogs/compute/understanding-how-aws-lambda-scales-when-subscribed-to-amazon-sqs-queues/

This post is written by John Lee, Solutions Architect, and Isael Pelletier, Senior Solutions Architect.

Many architectures use Amazon SQS, a fully managed message queueing service, to decouple producers and consumers. SQS is a fundamental building block for building decoupled architectures. AWS Lambda is also fully managed by AWS and is a common choice as a consumer as it supports native integration with SQS. This combination of services allows you to write and maintain less code and unburden you from the heavy lifting of server management.

This blog post looks into optimizing the scaling behavior of Lambda functions when subscribed to an SQS standard queue. It discusses how Lambda’s scaling works in this configuration and reviews best practices for maximizing message throughput. The post provides insight into building your own scalable workload and guides you in building well-architected workloads.

Scaling Lambda functions

When a Lambda function subscribes to an SQS queue, Lambda polls the queue as it waits for messages to arrive. Lambda consumes messages in batches, starting at five concurrent batches with five functions at a time.

If there are more messages in the queue, Lambda adds up to 60 functions per minute, up to 1,000 functions, to consume those messages. This means that Lambda can scale up to 1,000 concurrent Lambda functions processing messages from the SQS queue.

Lambda poller

Figure 1. The Lambda service polls the SQS queue and batches messages that are processed by automatic scaling Lambda functions. You start with five concurrent Lambda functions.

This scaling behavior is managed by AWS and cannot be modified. To process more messages, you can optimize your Lambda configuration for higher throughput. There are several strategies you can implement to do this.

Increase the allocated memory for your Lambda function

The simplest way to increase throughput is to increase the allocated memory of the Lambda function. While you do not have control over the scaling behavior of the Lambda functions subscribed to an SQS queue, you control the memory configuration.

Faster Lambda functions can process more messages and increase throughput. This works even if a Lambda function’s memory utilization is low. This is because increasing memory also increases vCPUs in proportion to the amount configured. Each function now supports up to 10 GB of memory and you can access up to six vCPUs per function.

You may need to modify code to take advantage of the extra vCPUs. This consists of implementing multithreading or parallel processing to use all the vCPUs. You can find a Python example in this blog post.

To see the average cost and execution speed for each memory configuration before making a decision, Lambda Power Tuning tool helps to visualize the tradeoffs.

Optimize batching behavior

Batching can increase message throughput. By default, Lambda batches up to 10 messages in a queue to process them during a single Lambda execution. You can increase this number up to 10,000 messages, or up to 6 MB of messages in a single batch for standard SQS queues.

If each payload size is 256 KB (the maximum message size for SQS), Lambda can only take 23 messages per batch, regardless of the batch size setting. Similar to increasing memory for a Lambda function, processing more messages per batch can increase throughput.

However, increasing the batch size does not always achieve this. It is important to understand how message batches are processed. All messages in a failed batch return to the queue. This means that if a Lambda function with five messages fails while processing the third message, all five messages are returned to the queue, including the successfully processed messages. The Lambda function code must be able to process the same message multiple times without side effects.

Failed message processing

Figure 2. A Lambda function returning all five messages to the queue after failing to process the third message.

To prevent successfully processed messages from being returned to SQS, you can add code to delete the processed messages from the queue manually. You can also use existing open source libraries, such as Lambda Powertools for Python or Lambda Powertools for Java that provide this functionality.

Catch errors from the Lambda function

The Lambda service scales to process messages from the SQS queue when there are sufficient messages in the queue.

However, there is a case where Lambda scales down the number of functions, even when there are messages remaining in the queue. This is when a Lambda function throws errors. The Lambda function scales down to minimize erroneous invocations. To sustain or increase the number of concurrent Lambda functions, you must catch the errors so the function exits successfully.

To retain the failed messages, use an SQS dead-letter queue (DLQ). There are caveats to this approach. Catching errors without proper error handling and tracking mechanisms can result in errors being ignored instead of raising alerts. This may lead to silent failures while Lambda continues to scale and process messages in the queue.

Relevant Lambda configurations

There are several Lambda configuration settings to consider for optimizing Lambda’s scaling behavior. Paying attention to the following configurations can help prevent throttling and increase throughput of your Lambda function.

Reserved concurrency

If you use reserved concurrency for a Lambda function, set this value greater than five. This value sets the maximum number of concurrent Lambda functions that can run. Lambda allocates five functions to consume five batches at a time. If the reserved concurrency value is lower than five, the function is throttled when it tries to process more than this value concurrently.

Batching Window

For larger batch sizes, set the MaximumBatchingWindowInSeconds parameter to at least 1 second. This is the maximum amount of time that Lambda spends gathering records before invoking the function. If this value is too small, Lambda may invoke the function with a batch smaller than the batch size. If this value is too large, Lambda polls for a longer time before processing the messages in the batch. You can adjust this value to see how it affects your throughput.

Queue visibility timeout

All SQS messages have a visibility timeout that determines how long the message is hidden from the queue after being selected up by a consumer. If the message is not successfully processed or deleted, the message reappears in the queue when the visibility timeout ends.

Give your Lambda function enough time to process the message by setting the visibility timeout based on your function-specific metrics. You should set this value to six times the Lambda function timeout plus the value of MaximumBatchingWindowInSeconds. This prevents other functions from unnecessarily processing the messages while the message is already being processed.

Dead-letter queues (DLQs)

Failed messages are placed back in the queue to be retried by Lambda. To prevent failed messages from getting added to the queue multiple times, designate a DLQ and send failed messages there.

The number of times the messages should be retried is set by the Maximum receives value for the DLQ. Once the message is re-added to the queue more than the Maximum receives value, it is placed in the DLQ. You can then process this message at a later time.

This allows you to avoid situations where many failed messages are continuously placed back into the queue, consuming Lambda resources. Failed messages scale down the Lambda function and add the entire batch to the queue, which can worsen the situation. To ensure smooth scaling of the Lambda function, move repeatedly failing messages to the DLQ.

Conclusion

This post explores Lambda’s scaling behavior when subscribed to SQS standard queues. It walks through several ways to scale faster and maximize Lambda throughput when needed. This includes increasing the memory allocation for the Lambda function, increasing batch size, catching errors, and making configuration changes. Better understanding the levers available for SQS and Lambda interaction can help in meeting your scaling needs.

To learn more about building decoupled architectures, see these videos on Amazon SQS. For more serverless learning resources, visit https://serverlessland.com.

Field Notes: Clear Unused AWS SSO Mappings Automatically During AWS Control Tower Upgrades

Post Syndicated from Gaurav Gupta original https://aws.amazon.com/blogs/architecture/field-notes-clear-unused-aws-sso-mappings-automatically-during-aws-control-tower-upgrades/

Increasingly organizations are using AWS Control Tower to manage their multiple accounts as well as an external third-party identity source for their federation needs. Cloud architects who use these external identity sources, needed an automated way to clear the unused maps created by AWS Control Tower landing zone as part of the launch, or during update and repair operations. Though the AWS SSO mappings are inaccessible once the external identity source is configured, customers prefer to clear any unused mappings in the directory.

You can remove the permissions sets and mappings that AWS Control Tower deployment creates in AWS SSO. However, when the landing zone is updated or repaired, the default permission sets and mappings are recreated in AWS SSO. In this blog post, we show you how to use AWS Control Tower Lifecycle events to automatically remove these permission sets and mappings when AWS Control Tower is upgraded or repaired. An AWS Lambda function runs on every upgrade and automatically removes the permission sets and mappings.

Overview of solution

Using this CloudFormation template, you can deploy the solution that automatically removes the AWS SSO permission sets and mappings when you upgrade your AWS Control Tower environment. We use AWS CloudFormation, AWS Lambda, AWS SSO and Amazon CloudWatch services to implement this solution.

Figure 1 - Architecture showing how AWS services are used to automatically remove the AWS SSO permission sets and mappings when you upgrade your AWS Control Tower environment

Figure 1 – Architecture showing how AWS services are used to automatically remove the AWS SSO permission sets and mappings when you upgrade your AWS Control Tower environment

To clear the AWS SSO entities and leave the service enabled with no active mappings, we recommend the following steps. This is mainly for those who do not want to use the default AWS SSO deployed by AWS Control Tower.

  • Log in to the AWS Control Tower Management Account and make sure you are in the AWS Control Tower Home Region.
  • Launch AWS CloudFormation stack, which creates:
    • An AWS Lambda function that:
      • Checks/Delete(s) the permission sets mappings created by AWS Control Tower, and
      • Deletes the permission sets created by AWS Control Tower.
  • An AWS IAM role that is assigned to the preceding AWS Lambda Function with minimum required permissions.
  • An Amazon CloudWatch Event Rule that is invoked upon UpdateLandingZone API and triggers the ClearMappingsLambda Lambda function

Prerequisites

For this walkthrough, you should have the following prerequisites:

  • Administrator access to AWS Control Tower management account

Walkthrough

  1. Log in to the AWS account where AWS Control Tower is deployed.
  2. Make sure you are in the home Region of AWS Control Tower.
  3. Deploy the provided CloudFormation template.
    • Download the CloudFormation template.
    • Select AWS CloudFormation service in the AWS Console
    • Select Create Stack and select With new resources (standard)
    • Upload the template file downloaded in Step 1
    • Enter the stack name and choose Next
    • Use the default values in the next page and choose Next
    • Choose Create Stack

By default, in your AWS Control Tower Landing Zone you will see the permission sets and mappings in your AWS SSO service page as shown in the following screenshots:

Figure 2 – Permission sets created by AWS Control Tower

Figure 3 – Account to Permission set mapping created by AWS Control Tower

Now, you can update the AWS Control Tower Landing Zone which will invoke the Lambda function deployed using the CloudFormation template.

Steps to update/repair Control Tower:

  1. Log in to the AWS account where AWS Control Tower is deployed.
  2. Select Landing zone settings from the left-hand pane of the Control Tower dashboard
  3. Select the latest version as seen in the screenshot below.
  4. Select Repair or Update, whichever option is available.
  5. Select Update Landing Zone.

Figure 4 – Updating AWS Control Tower Landing zone

Once the update is complete, you can go to AWS SSO service page and check that the permission sets and the mappings have been removed as shown in the following screenshots:

Figure 5 -Permission sets cleared automatically after Landing zone update

Figure 6 -Mappings cleared after Landing zone update

Cleaning up

If you are only testing this solution, make sure to delete the CloudFormation template, which will remove the relevant resources to stop incurring charges.

Conclusion

In this post, we provided a solution to clear AWS SSO Permission Sets and Mappings when you upgrade your AWS Control Tower Landing Zone. Remember, AWS SSO permission sets are added every time you upgrade AWS Control Tower Landing Zone. With this this solution you don’t have to manage any settings since the AWS Lambda function runs on every upgrade and removes the permission sets and mappings.

Give it a try and let us know your thoughts in the comments!

Field Notes provides hands-on technical guidance from AWS Solutions Architects, consultants, and technical account managers, based on their experiences in the field solving real-world business problems for customers.

The collective thoughts of the interwebz