Each service declined to answer questions about how many bases are affected by the outages, referring all questions to the Defense Department. Pentagon officials did not respond to questions.
However, a defense official said the department is aware of a “possible refrigeration disruption at some Defense Commissary Agency commissaries.” The official was not authorized to comment publicly and spoke on the condition of anonymity.
All speculation at this point, but it’s hard to come up with another explanation for the coincidence.
You can now use AWS IAM Identity Center authentication with enhanced VPC routing on Amazon Redshift clusters and Amazon Redshift Serverless workgroups. Your users get single sign-on with their existing corporate credentials, and the authentication traffic originates from within your virtual private cloud (VPC) through a VPC endpoint, staying on the AWS private network.
Many organizations also require that this traffic doesn’t traverse the public internet. Enhanced VPC routing sends everything between your cluster and other AWS services through your VPC, where you can govern it with security groups, network ACLs, and endpoint policies, and observe it in VPC Flow Logs. For teams with data residency, regulatory, or network isolation requirements, it’s often mandatory.
In this post, we show how the new IAM Identity Center VPC endpoints provide a private network path for authentication traffic when enhanced VPC routing is enabled. We walk through the endpoint setup and validate the flow from Query Editor V2 and a SQL client. To use this feature, your Amazon Redshift cluster must be running patch 204 or later, and you must create the VPC endpoints described in the following steps.
Solution overview
When a user signs in with IAM Identity Center from Query Editor V2 or a SQL client, Amazon Redshift doesn’t simply accept the token the client presents. It validates the token with IAM Identity Center and resolves the caller’s identity before the session is established. These calls originate from Amazon Redshift, not from your client, and enhanced VPC routing changes the network path they take.
Authentication flow with enhanced VPC routing
With enhanced VPC routing enabled, the calls Amazon Redshift makes to IAM Identity Center traverse your VPC and follow your networking configuration. The flow is as follows:
The user signs in through Query Editor V2 or a SQL client and authenticates against your identity provider through IAM Identity Center.
IAM Identity Center issues an access token, which the client presents to Amazon Redshift on the database connection.
Amazon Redshift validates the access token against the IAM Identity Center OpenID Connect (OIDC) endpoint, confirming the token’s scopes and the user’s entitlement to the Amazon Redshift application. It doesn’t trust the token the client presented without verification.
Amazon Redshift calls the same OIDC endpoint again to exchange that token for one scoped to Amazon Redshift.
Amazon Redshift calls the IAM Identity Center identity store to resolve the user and their group membership.
Amazon Redshift maps the resolved identity to a database identity, applies role-based access control, and establishes the session.
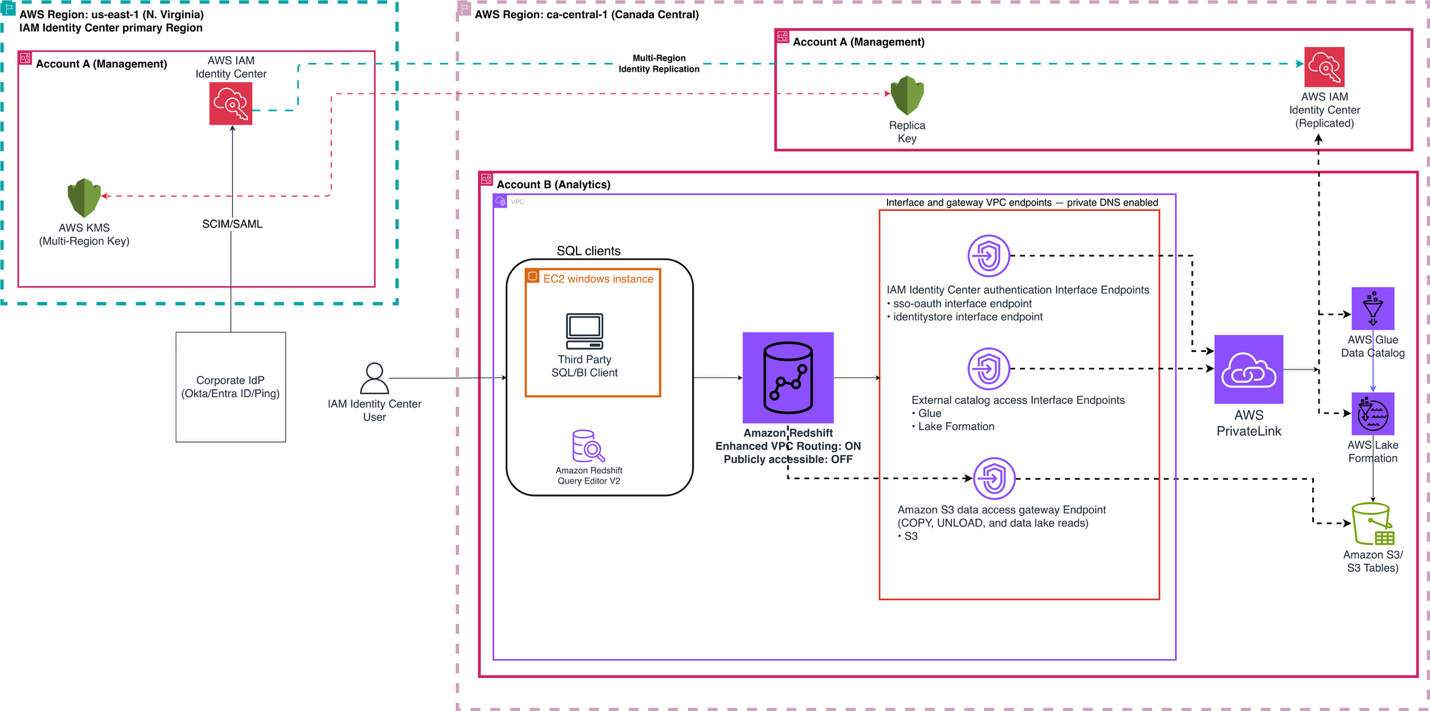
The following diagram illustrates this authentication flow, showing how each call from Amazon Redshift to IAM Identity Center traverses the VPC through interface endpoints.
Figure 1: IAM Identity Center authentication flow with enhanced VPC routing enabled
As shown in the diagram, steps 3–5 represent calls that Amazon Redshift makes through your VPC to the IAM Identity Center OIDC and identity store endpoints.
Because a cluster with no public IP address doesn’t use an internet gateway route, Amazon Redshift has no path to IAM Identity Center by default. You provide one with interface VPC endpoints for the two services it needs, the IAM Identity Center OIDC endpoint and the identity store endpoint, which keep the traffic on the AWS network over AWS PrivateLink.
This solution covers the following steps:
Enable enhanced VPC routing.
Verify the DNS attributes on your VPC.
Create the interface VPC endpoints required for IAM Identity Center authentication.
Create interface VPC endpoints for AWS Glue and AWS Lake Formation (optional, if you query a data lake or lakehouse).
Create an Amazon Simple Storage Service (Amazon S3) gateway endpoint.
Validate that the endpoints are available and using private DNS.
Test single sign-on with Amazon Redshift Query Editor V2.
Test single sign-on with a SQL client using the Amazon Redshift JDBC driver.
Verify the calls on AWS CloudTrail.
Prerequisites
You should have the following prerequisites:
An AWS account with an Amazon Redshift provisioned cluster. Amazon Redshift Serverless also supports enhanced VPC routing, and the same endpoints apply, but you substitute the equivalent workgroup commands and settings.
A cluster running patch 204 or later, which is the minimum maintenance version that supports IAM Identity Center authentication with enhanced VPC routing.
Permissions to create VPC endpoints in the VPC where the cluster runs, specifically ec2:CreateVpcEndpoint and ec2:DescribeVpcEndpoints.
Optionally, an Amazon Elastic Compute Cloud (Amazon EC2) instance inside the same VPC with SQL Workbench/J and the Amazon Redshift JDBC driver, version 2.1.0.30 or later with its dependent libraries, to test the SQL client flow.
Walkthrough
The examples in this post use the Canada (Central) AWS Region (ca-central-1). Replace all placeholder values with your own.
Step 1: Enable enhanced VPC routing and turn off public access
To control network traffic with Amazon Redshift enhanced VPC routing, you enable enhanced VPC routing in Amazon Redshift. The cluster or workgroup must also not be publicly accessible, so that traffic to IAM Identity Center and other services goes through your VPC endpoints rather than an internet gateway. Follow the instructions in Enable enhanced VPC routing to enable it for a new provisioned cluster or serverless workgroup. For an existing cluster or workgroup, follow these steps:
Open the provisioned cluster or serverless workgroup you want to modify:
For an existing provisioned cluster – choose the Properties tab.
For an existing serverless workgroup – choose the Data access tab.
In the Network and security section, choose Edit.
Select Turn on enhanced VPC routing to route network traffic through the VPC.
If Turn on Publicly accessible is enabled, clear it so the cluster or workgroup is not publicly accessible.
Choose Save changes.
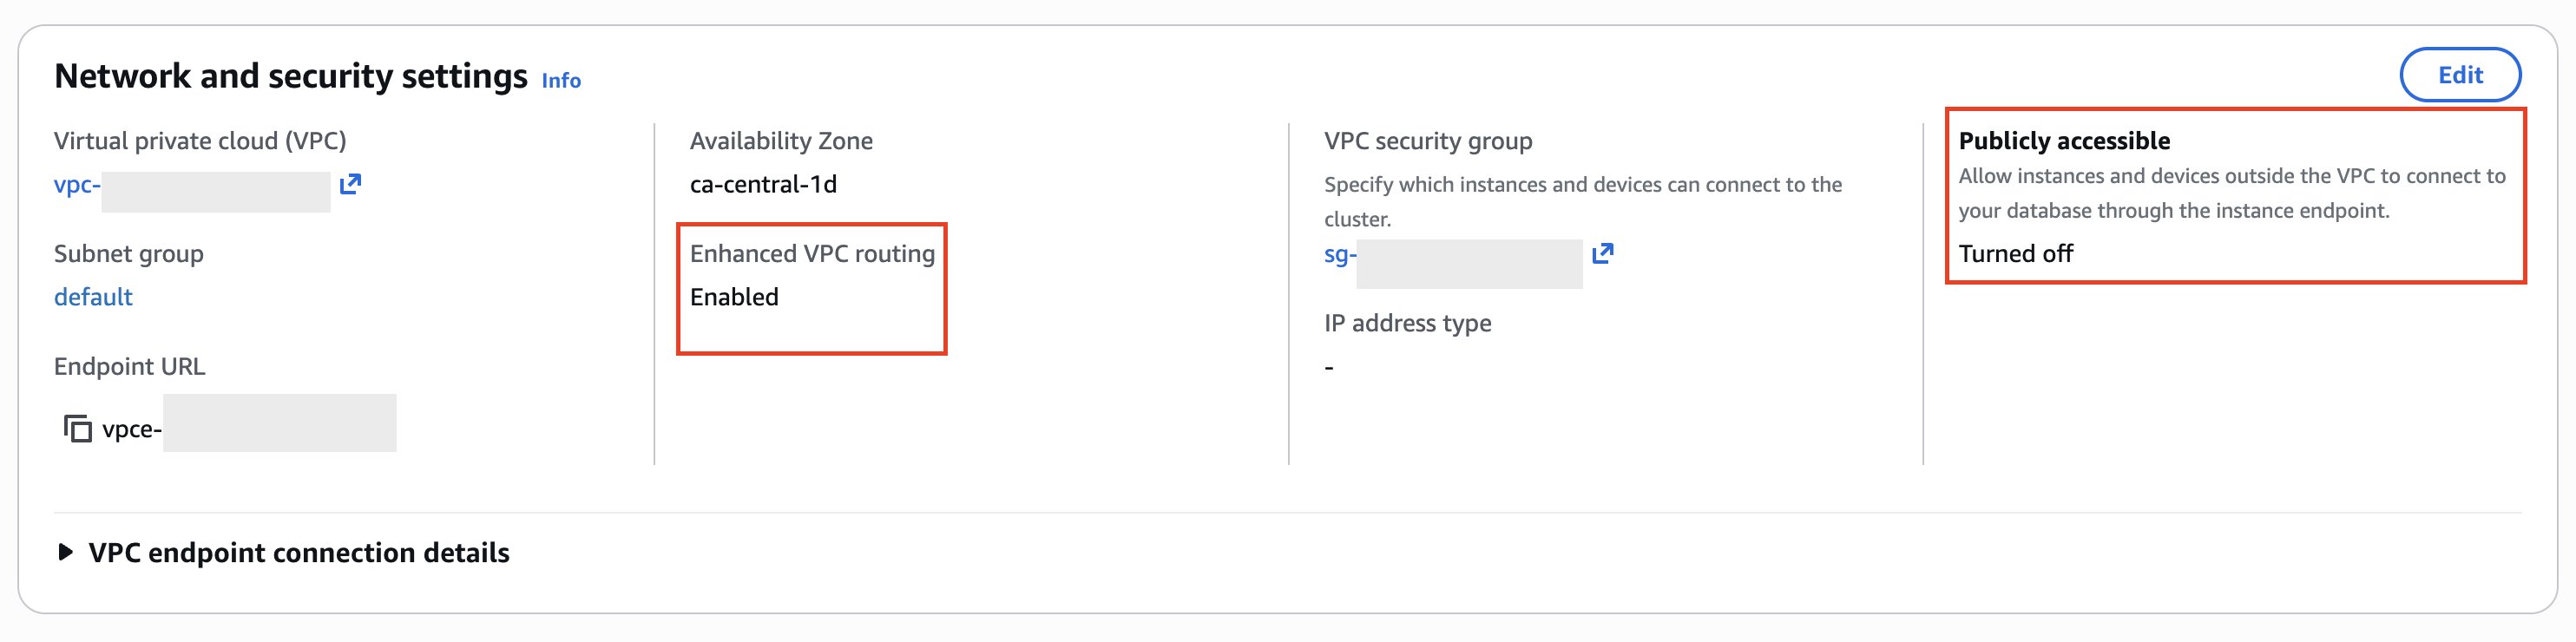
The following screenshot shows the Network and security section with enhanced VPC routing enabled and public accessibility turned off.
Figure 2: Enable enhanced VPC routing in Amazon Redshift
Note: Amazon Redshift restarts the cluster automatically when you change enhanced VPC routing. Make this change during a maintenance window.
Step 2: Verify the DNS attributes on your VPC
Private DNS is what redirects the public AWS service hostnames to your interface endpoints, and it depends on two VPC attributes. Follow these steps:
Navigate to Amazon Redshift and choose the Properties tab for Amazon Redshift provisioned, or the Data access tab for Amazon Redshift Serverless.
Under Network and security setting, choose the associated VPC.
Your VPC details open in a new browser tab.
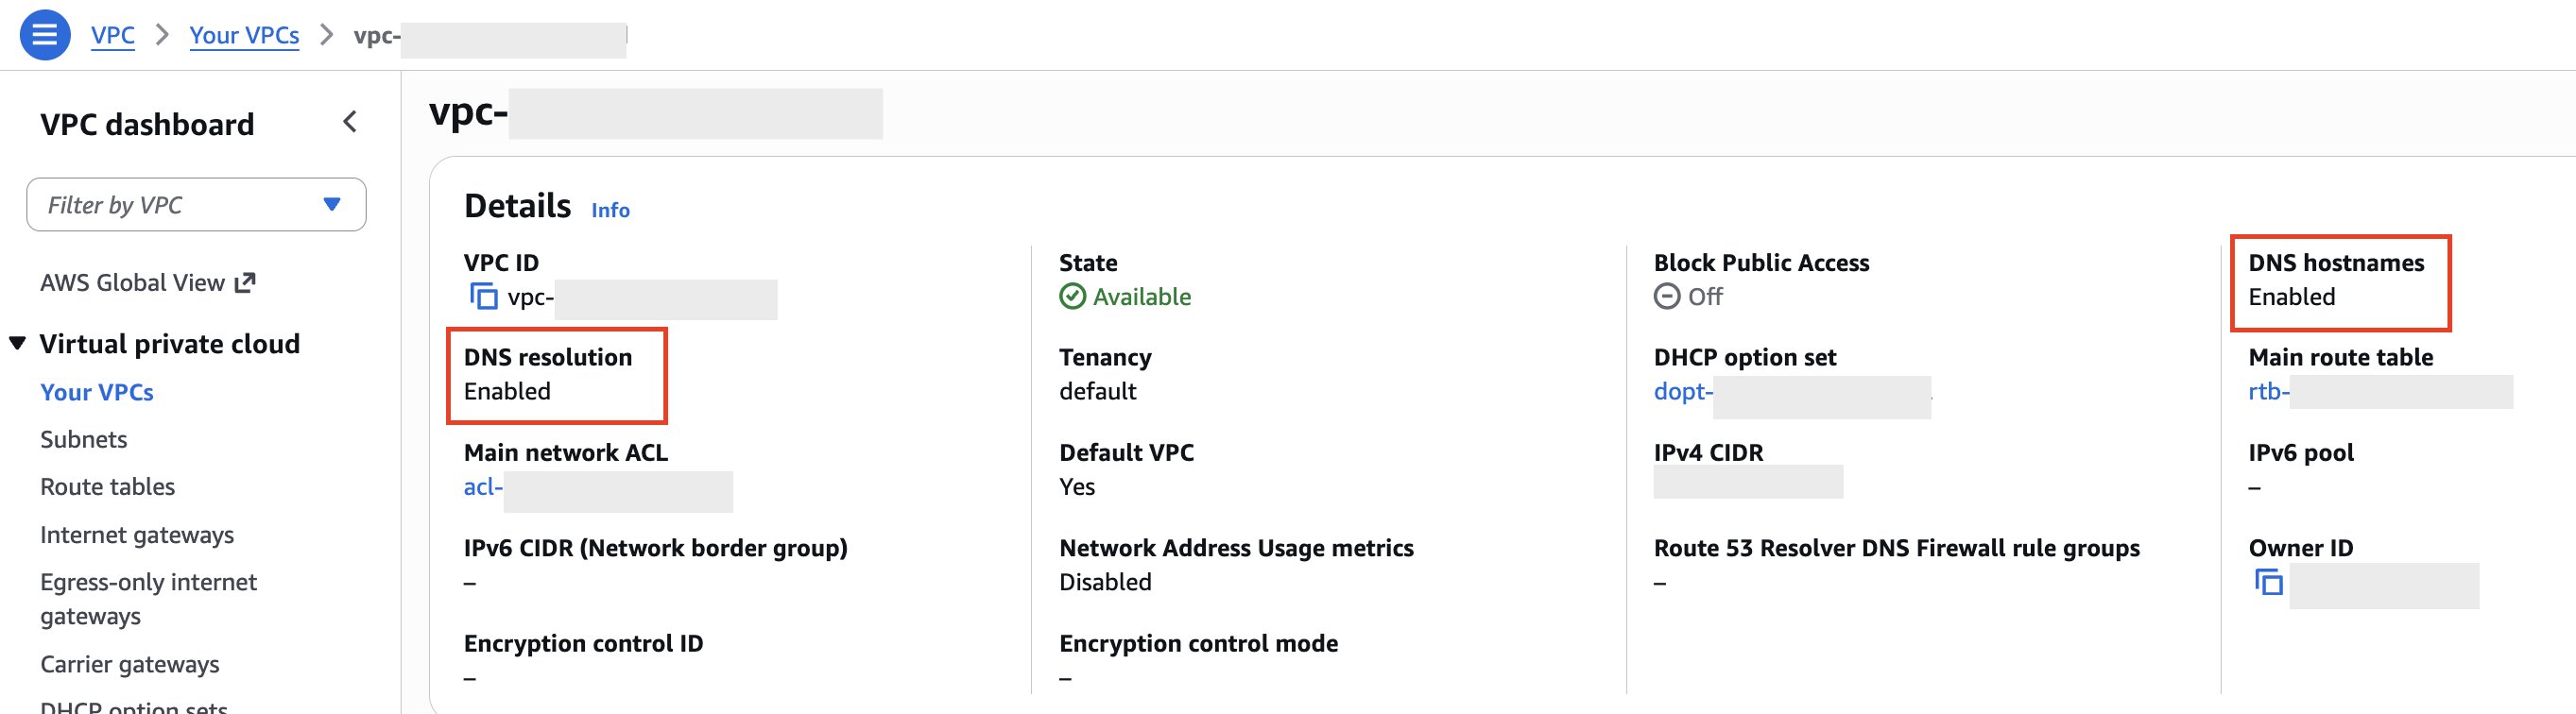
Review the Details section, where the attributes appear as DNS hostnames and DNS resolution. Make sure that both properties are set to Enabled. The following screenshot shows the VPC Details page with both DNS attributes set to Enabled.
Figure 3: DNS hostnames and DNS resolution enabled on the VPC Details page
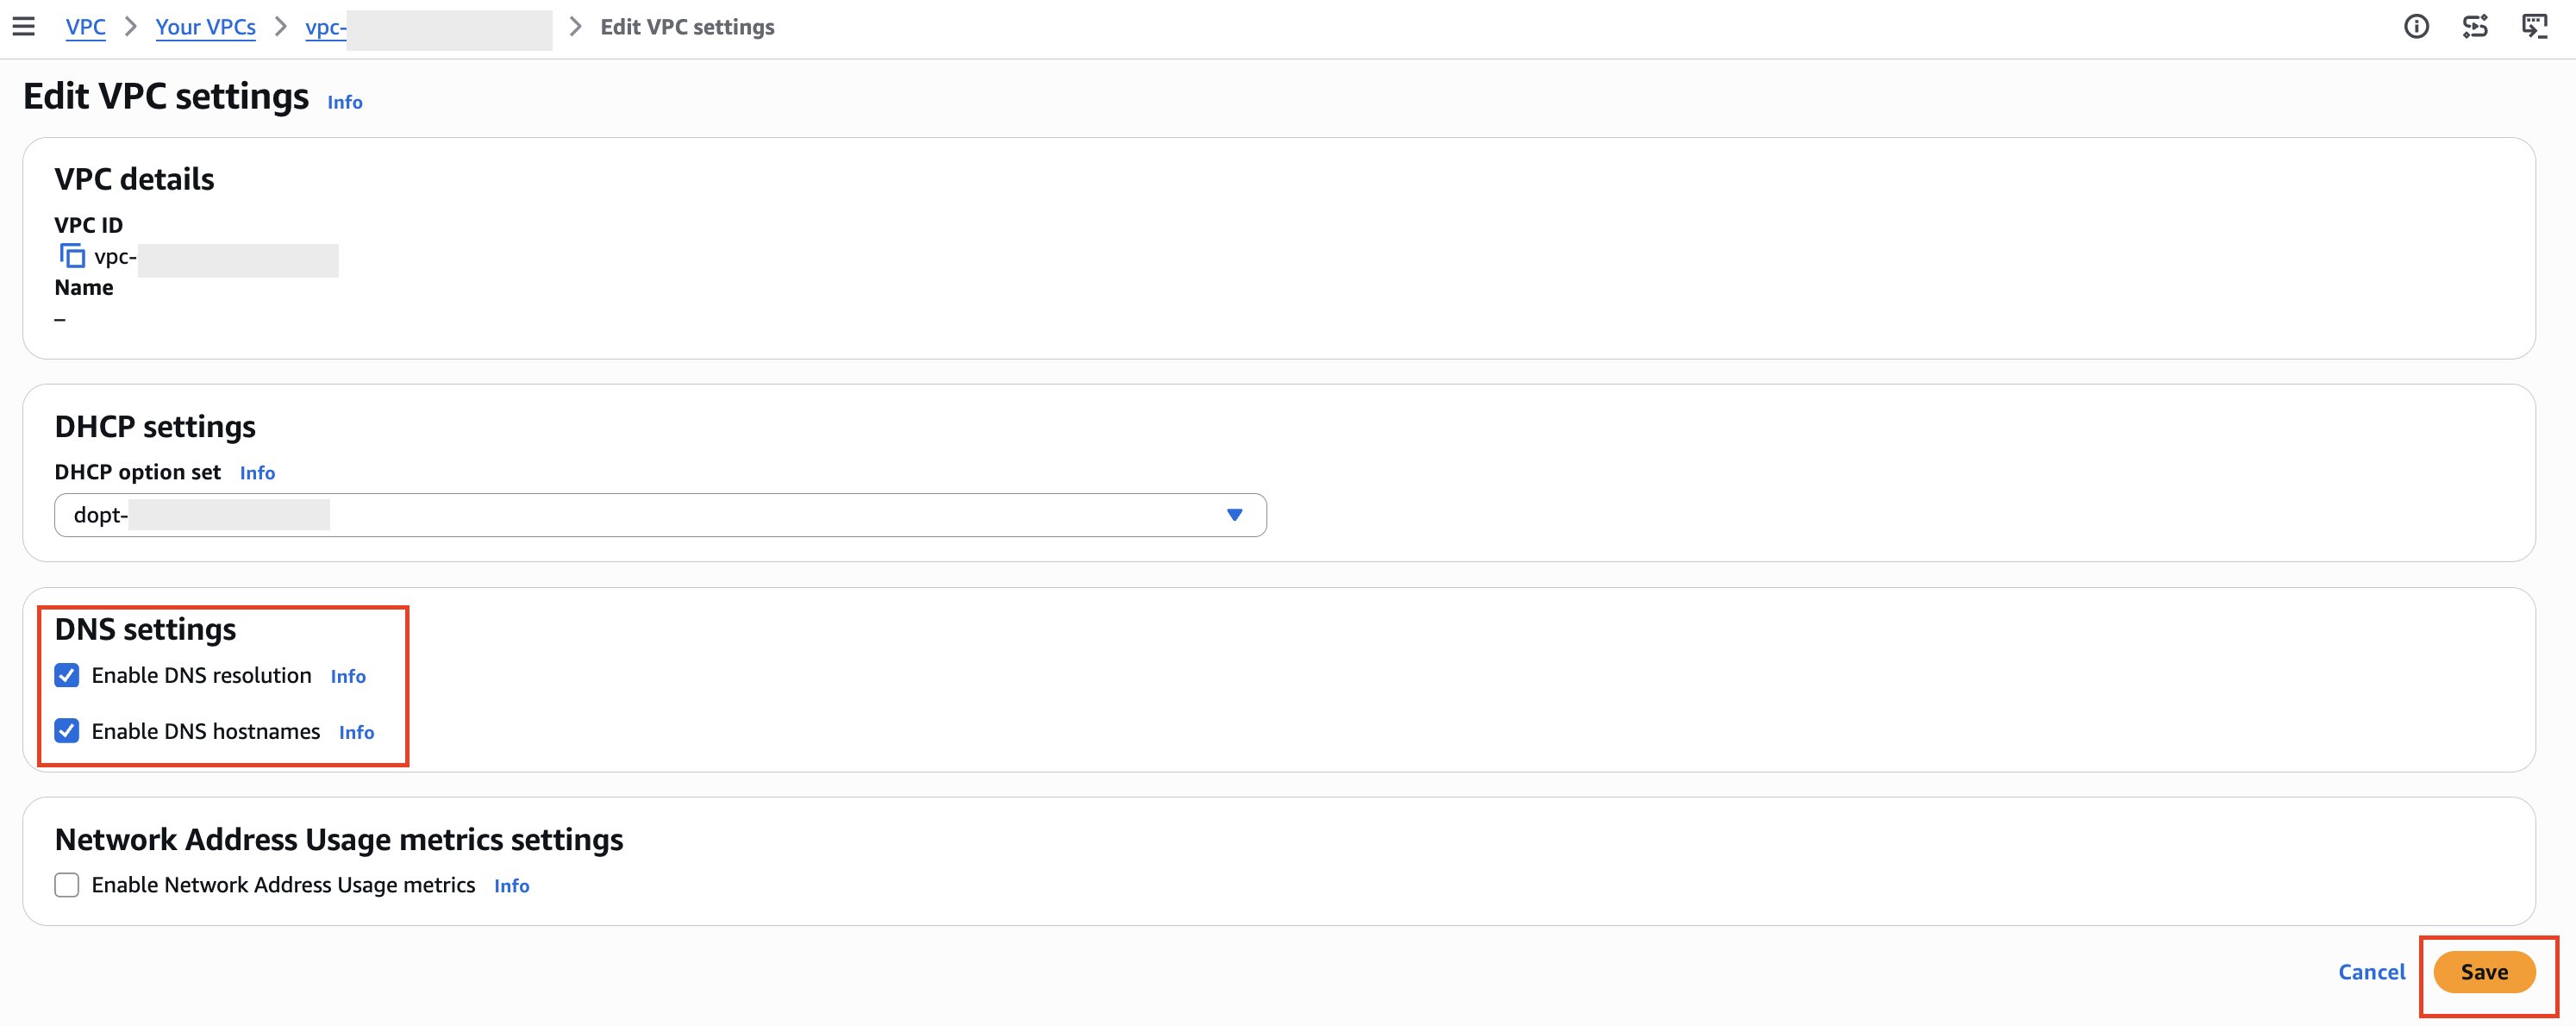
If either of the properties is Disabled, choose Actions, choose Edit VPC settings, select Enable on the attribute you need, and choose Save. The following screenshot shows the Edit VPC settings page where you enable these DNS attributes.
Figure 4: Enable DNS hostnames and DNS resolution
Step 3: Create the interface VPC endpoints for IAM Identity Center authentication
Create the two interface endpoints that the authentication flow needs. Each corresponds to one of the two IAM Identity Center calls in the authentication flow described earlier:
Service endpoint
Used for
com.amazonaws.<region>.sso-oauth
Validating and exchanging the IAM Identity Center access token
com.amazonaws.<region>.identitystore
Resolving the user and their group membership
To create an interface endpoint for an AWS service
IAM Identity Center is a Regional service, so these endpoints must reach the AWS Region where your IAM Identity Center instance is available. If you’re using IAM Identity Center multi-Region replication (your instance is replicated to the Region where your Amazon Redshift cluster runs), leave Enable Cross Region endpoint unchecked.
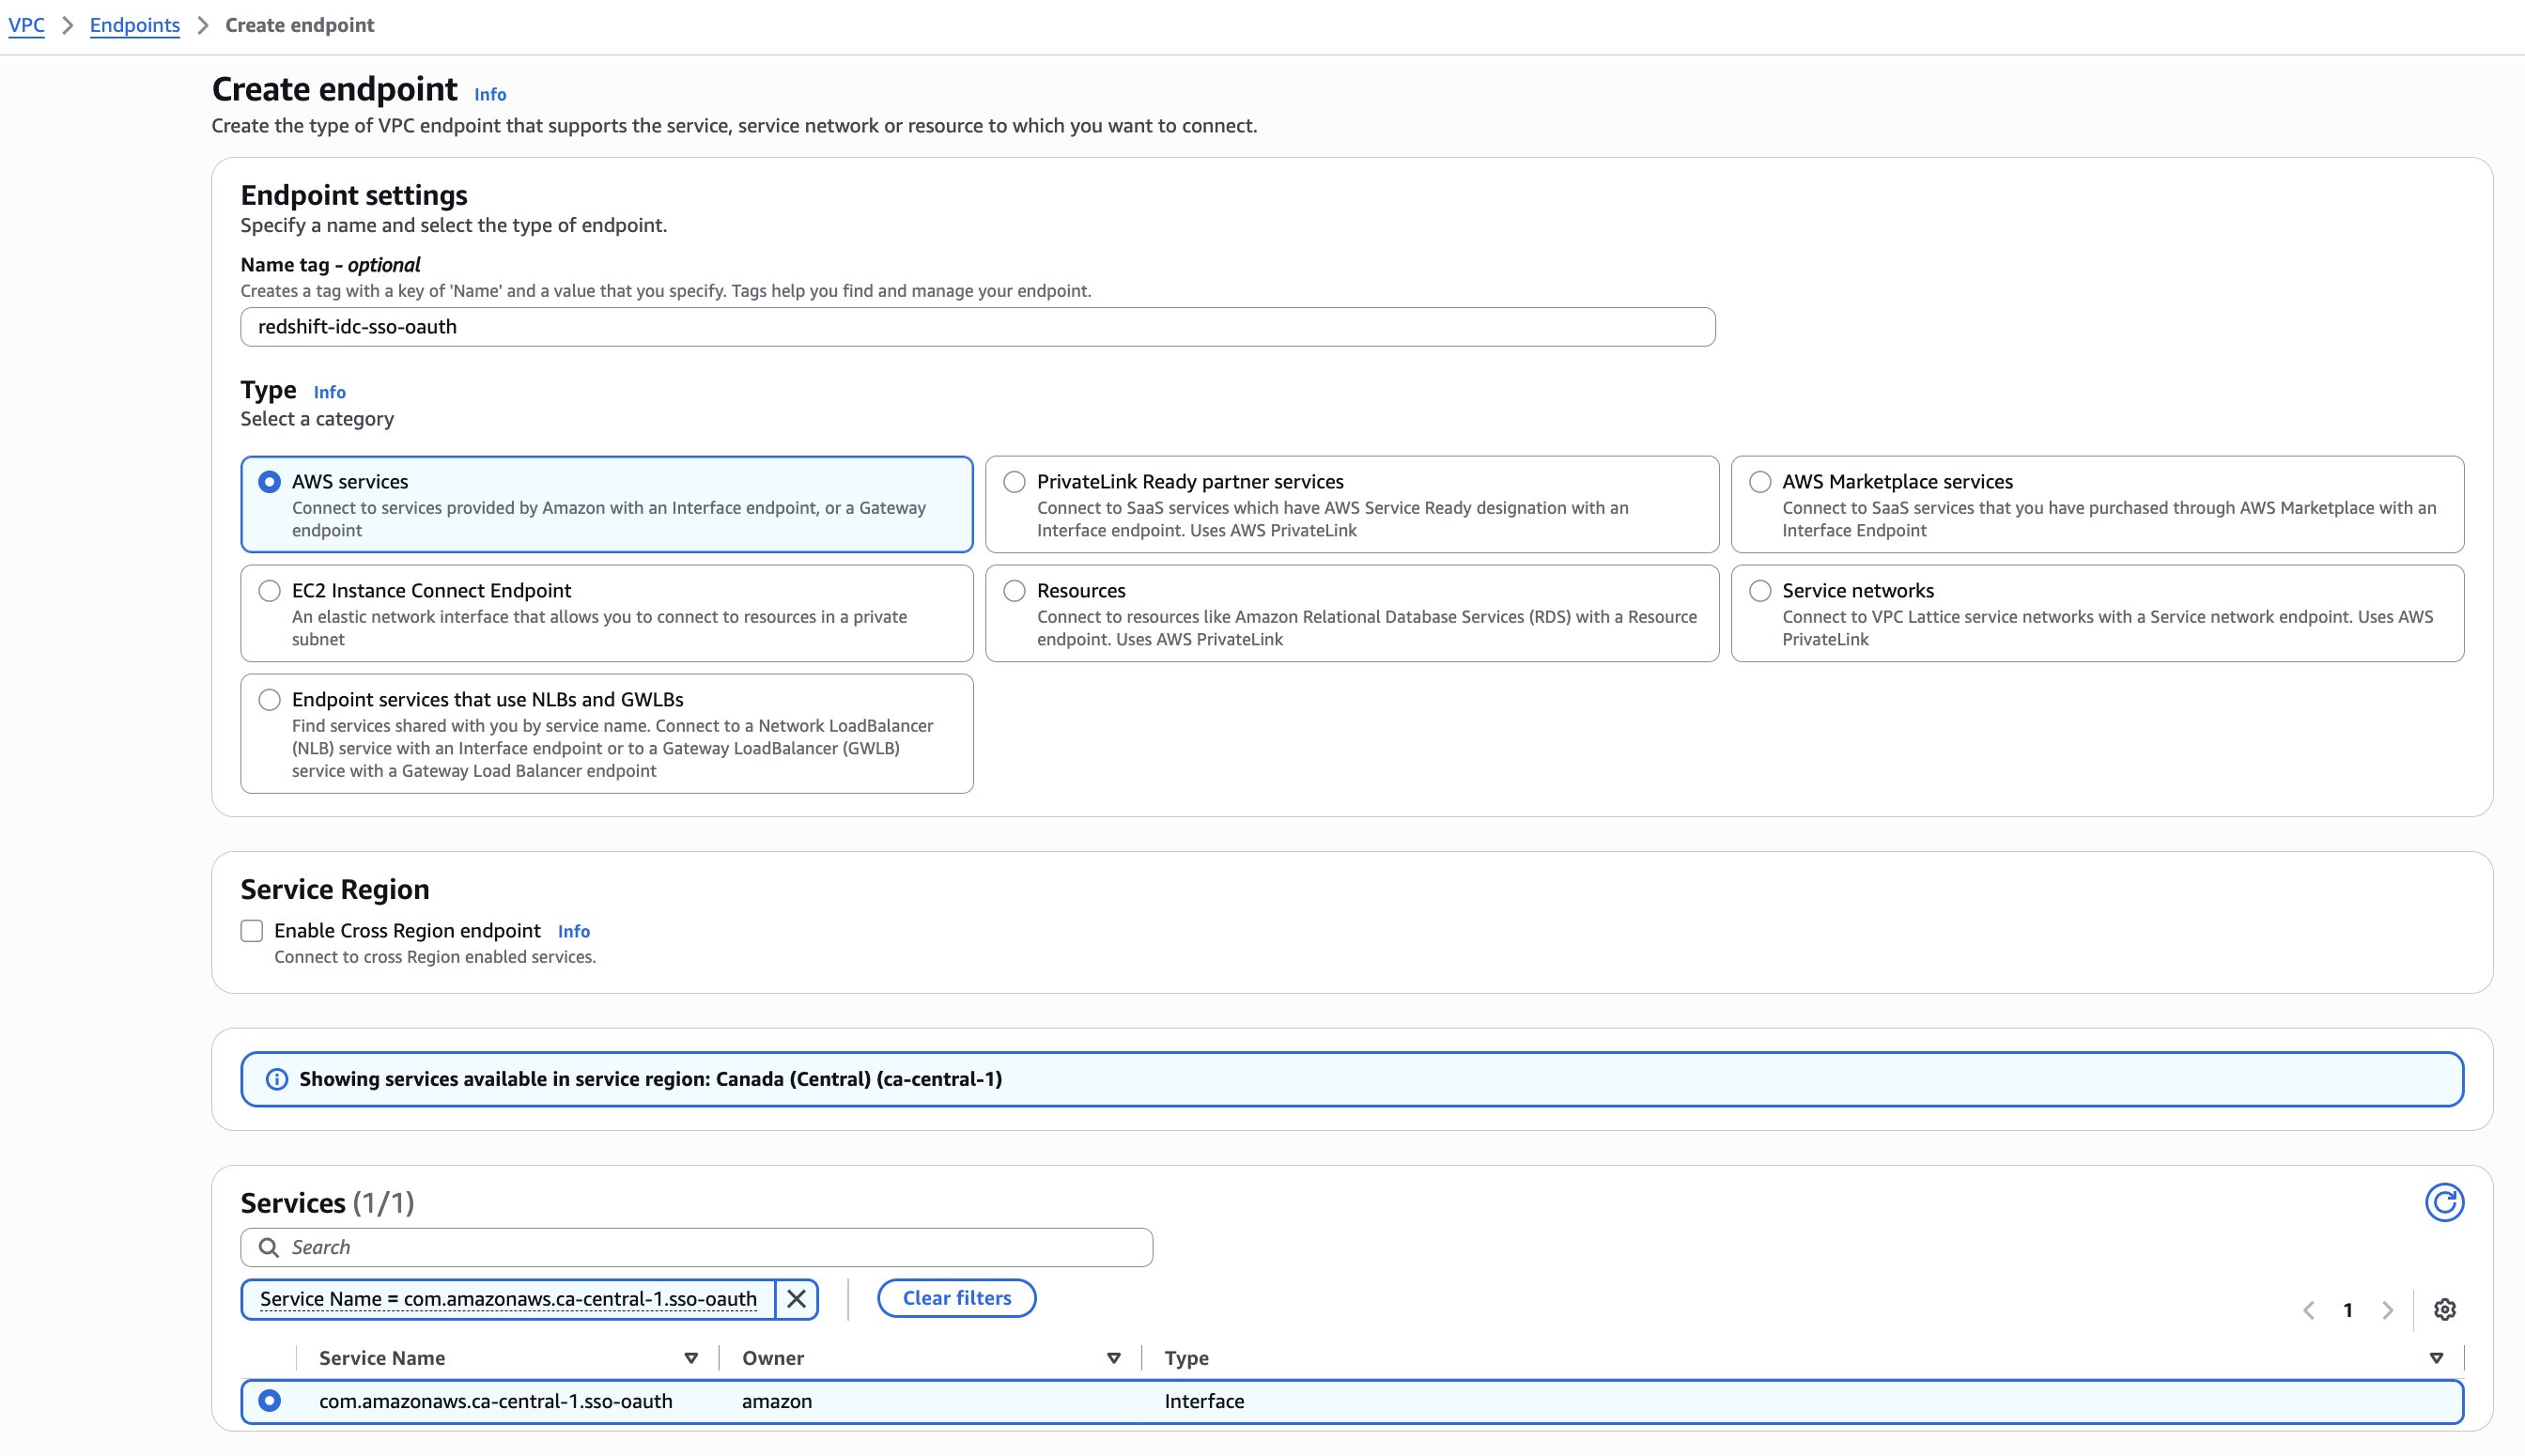
For Service name, search for sso-oauth and select the service for your Region (com.amazonaws.<region>.sso-oauth). The following screenshot shows the top section of the Create endpoint page with the sso-oauth service selected.
Figure 5: Create an interface VPC endpoint, part 1
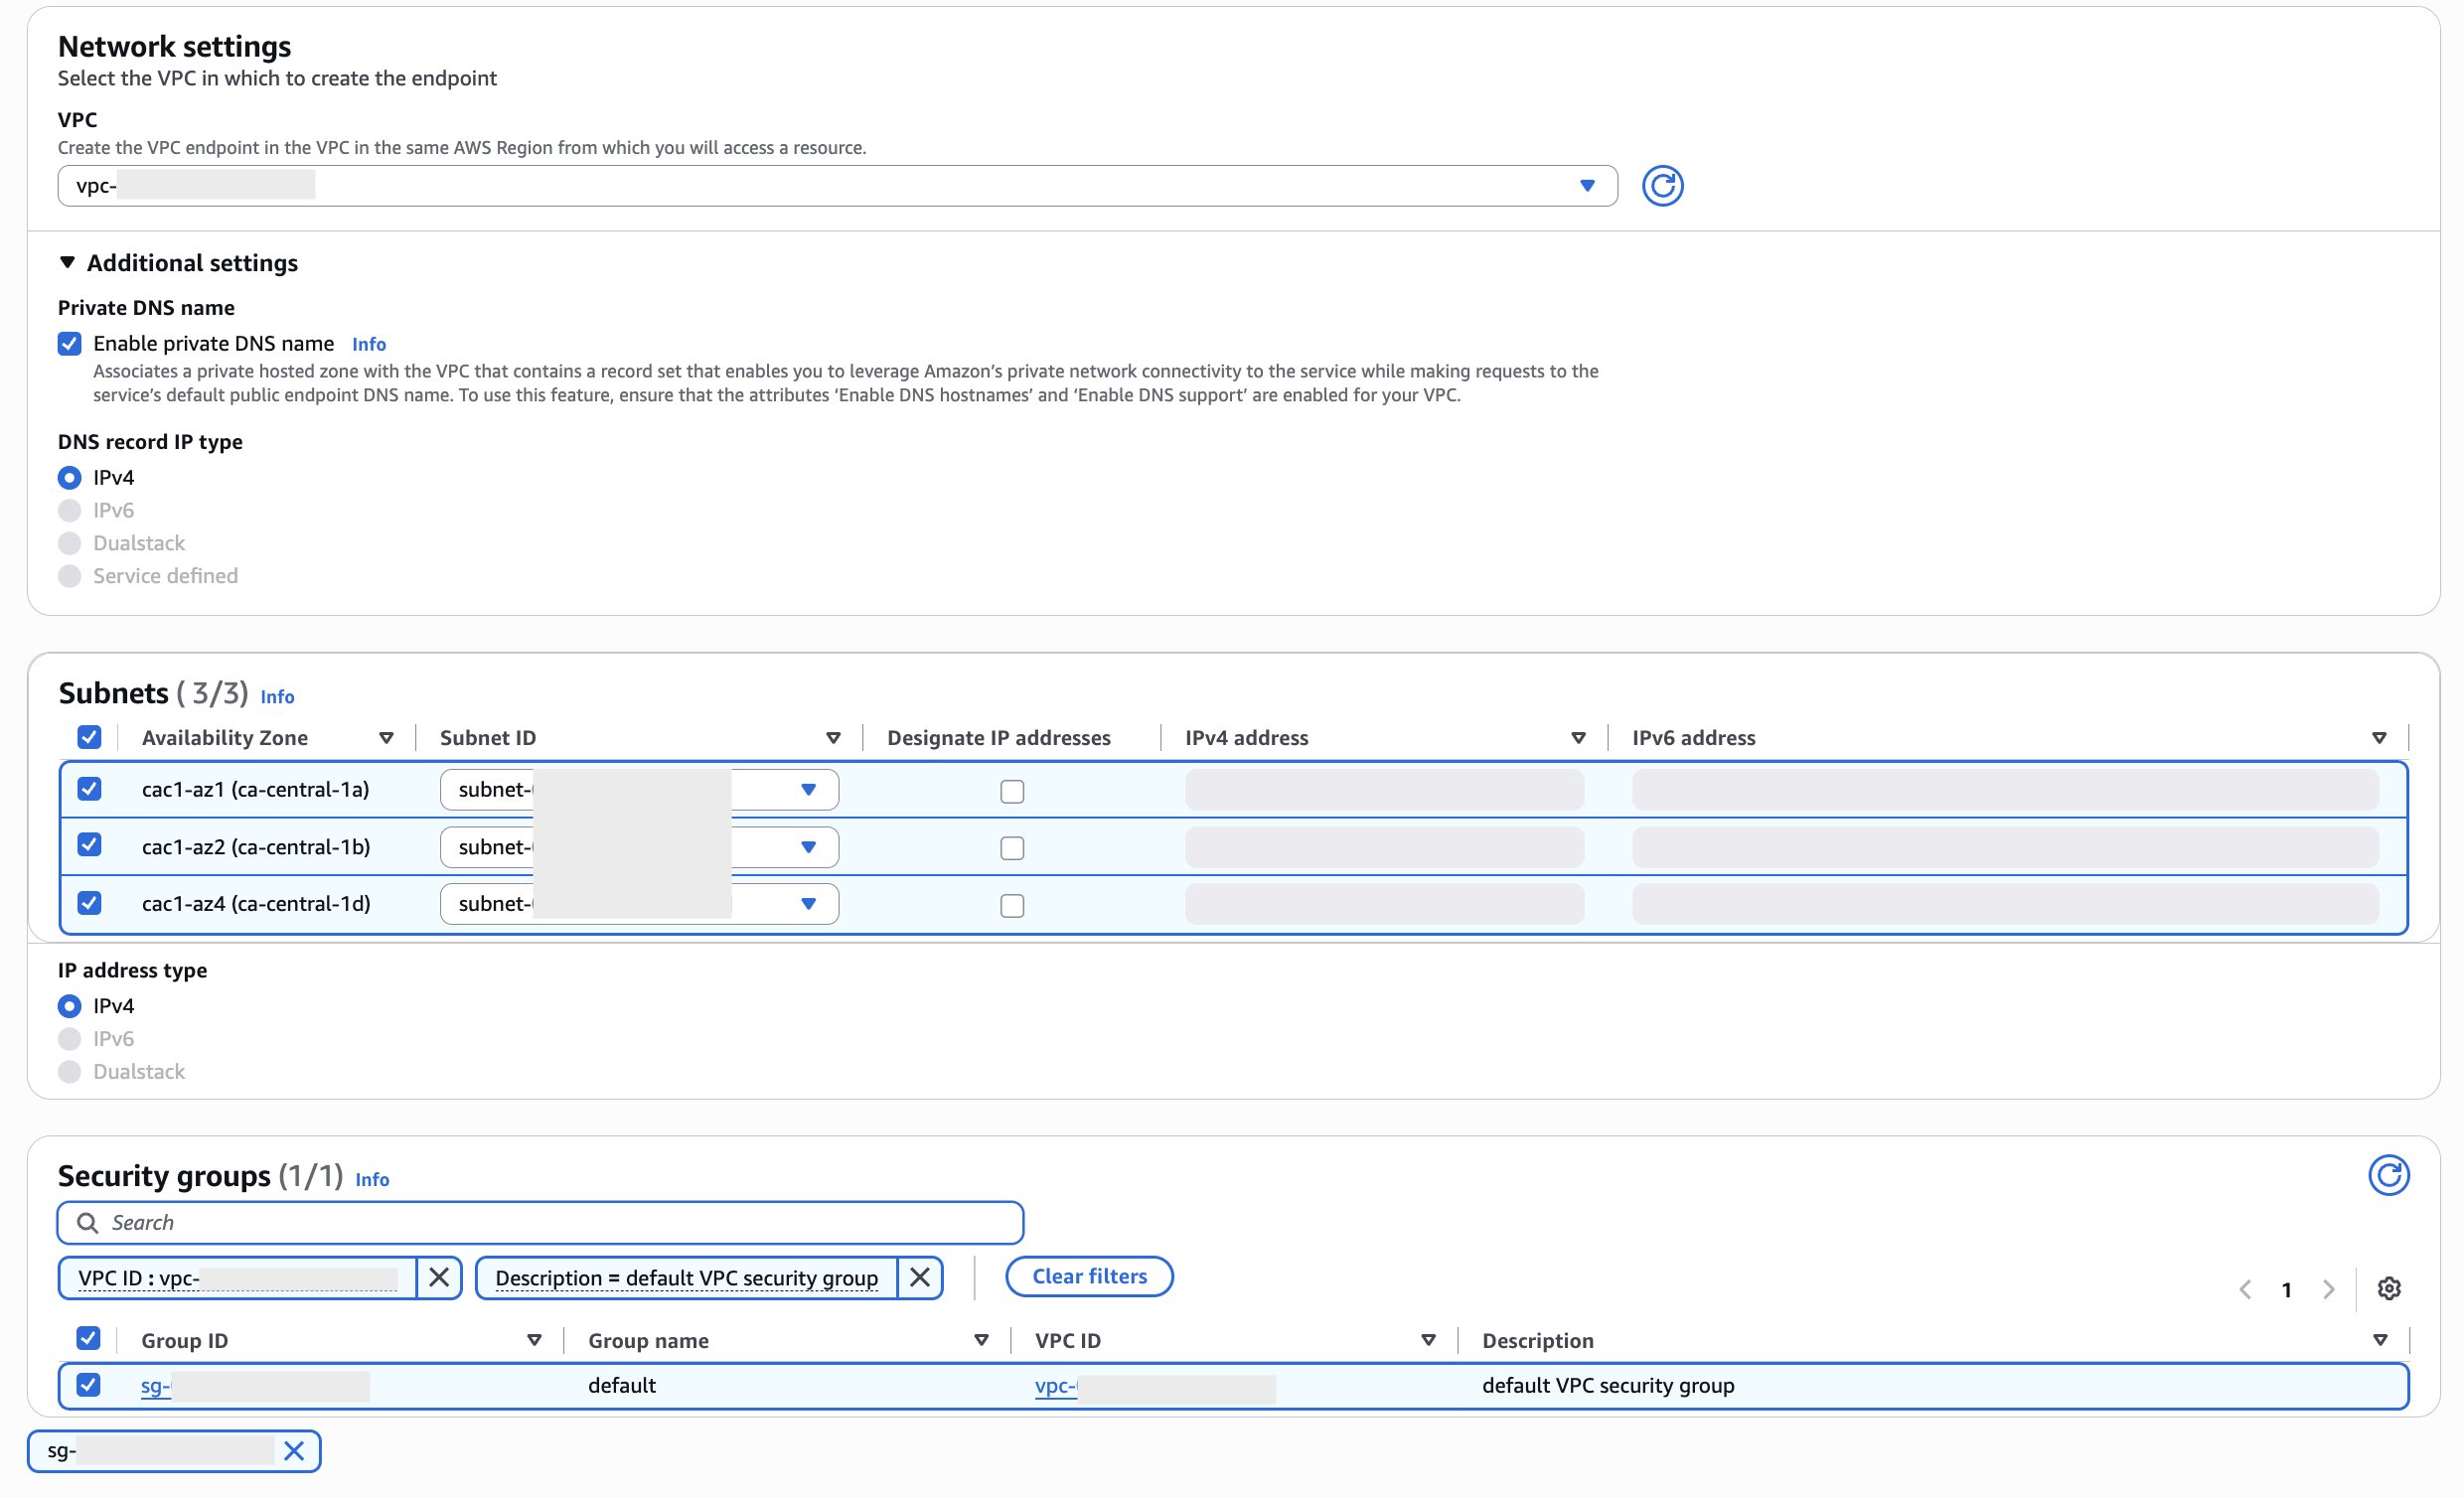
For VPC, select the VPC from which you will access the AWS service. In our use case, we choose the Amazon Redshift VPC.
To enable private DNS support, select Additional settings and choose Enable private DNS name.
For Subnets, select the subnets in which to create endpoint network interfaces. You can select one subnet per Availability Zone. You can’t select multiple subnets from the same Availability Zone. For more information, see Subnets and Availability Zones.
For IP address type, choose IPv4. This assigns IPv4 addresses to the endpoint network interfaces. This option is supported only if all selected subnets have IPv4 address ranges and the service accepts IPv4 requests.
For Security groups, select the security groups to associate with the endpoint network interfaces. For this post, we have selected default security group associated with Redshift. The following screenshot shows the VPC, subnet, and security group selections for the endpoint.
Figure 6: Create an interface VPC endpoint, part 2
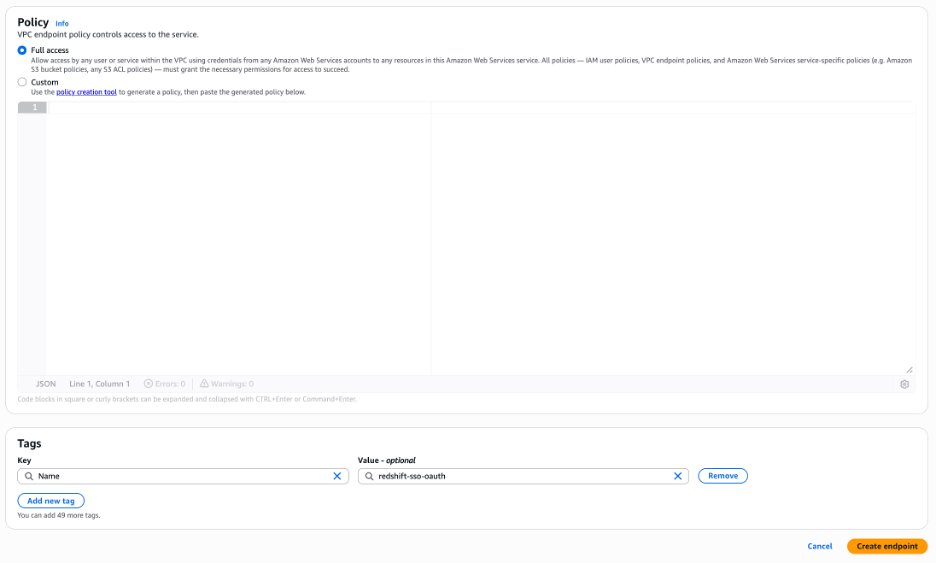
For Policy, to allow all operations by all principals on all resources over the interface endpoint, select Full access. To restrict access, select Custom and enter a policy. This option is available only if the service supports VPC endpoint policies. For more information, see Endpoint policies.
(Optional) To add a tag, choose Add new tag and enter the tag key and the tag value.
Choose Create endpoint. The following screenshot shows the policy and tag settings before you create the endpoint.
Figure 7: Create an interface VPC endpoint, part 3
Repeat steps 1–14 for the identity store endpoint, search for identitystore and select the service for your Region (com.amazonaws.<region>.identitystore).
Two settings in the preceding steps are important:
Enable private DNS name is required. Amazon Redshift resolves the public service hostname, for example, oidc.<region>.amazonaws.com. Private DNS is what points that hostname at your interface endpoint, so the traffic stays inside your VPC.
Use the cluster’s security group, because the cluster is the caller. The endpoint’s security group must allow inbound HTTPS on port 443 from the cluster. Reusing the cluster’s own security group is the simplest approach when it already allows traffic from itself. A dedicated security group needs an explicit port 443 inbound rule from the cluster’s security group.
(Optional) To create an interface endpoint using the command line
Step 4 (optional): Create endpoints for AWS Glue and AWS Lake Formation
Complete this step only if your cluster queries external data through the AWS Glue Data Catalog and AWS Lake Formation. Common examples include Amazon S3 Tables, a capability of Amazon S3, and data lakes registered with Lake Formation. If you only need single sign-on, you can skip to Step 5. Amazon Redshift calls the AWS Glue Data Catalog to enumerate databases and tables, and calls AWS Lake Formation to check permissions and vend temporary credentials for the underlying data. Like the authentication calls, these are made by the cluster, so with enhanced VPC routing enabled they travel through your VPC and need a path of their own.
Repeat steps 1–14 from Step 3 for:
com.amazonaws.<region>.glue.
com.amazonaws.<region>.lakeformation.
With these endpoints in place, Amazon Redshift routes external catalog operations such as listing external tables through the VPC endpoints rather than the public internet, keeping metadata traffic on the AWS network.
Step 5: Create an Amazon S3 gateway endpoint
With enhanced VPC routing enabled, anything the cluster does against Amazon S3 (COPY, UNLOAD, and Amazon S3 Tables) also travels through your VPC. Create a gateway endpoint and associate it with the route table(s) used by your cluster’s subnets:
In the navigation pane, choose Endpoints, then choose Create endpoint.
For Type, choose AWS services.
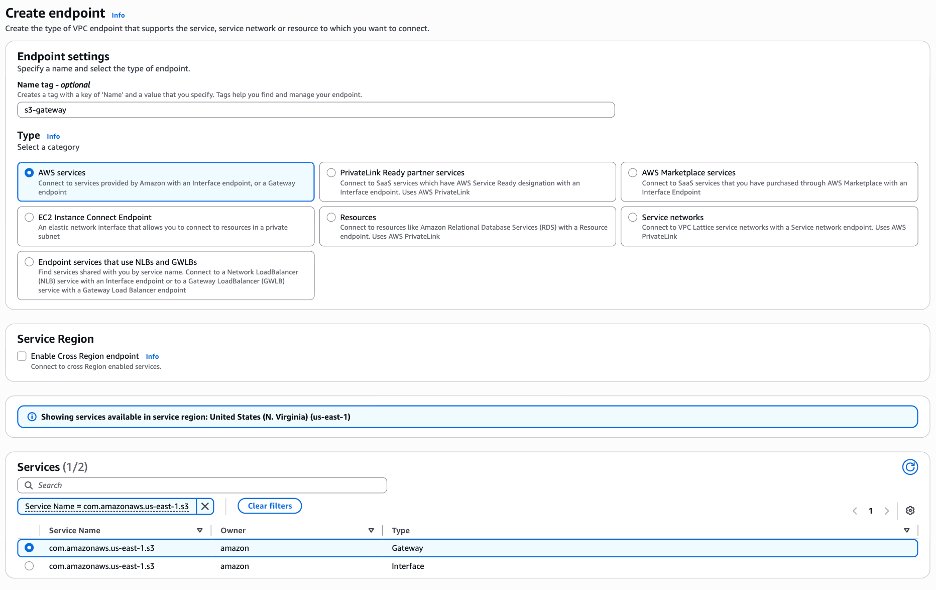
For Service name, search for s3 and select the service for your Region with Type: Gateway (com.amazonaws.<region>.s3). The following screenshot shows the Create endpoint page with the Amazon S3 gateway service selected.
Figure 8: Create an Amazon S3 gateway endpoint, part 1
For VPC, choose your Amazon Redshift VPC.
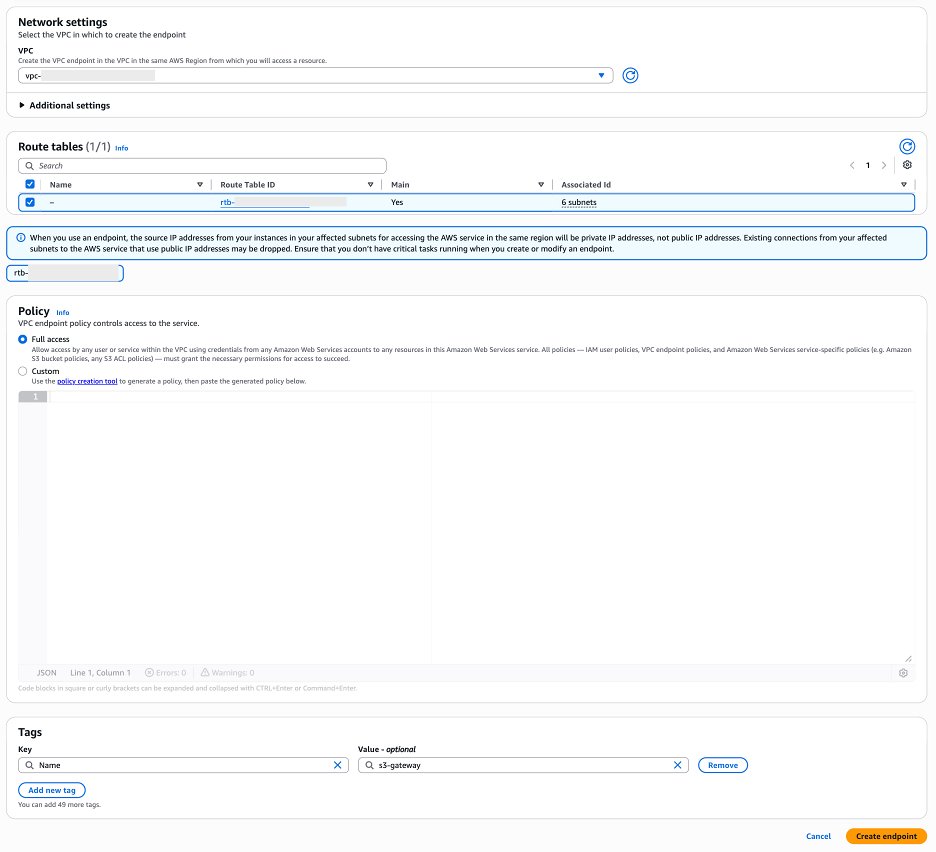
For Route tables, select the route table(s) associated with the subnets your cluster runs in.
Choose Create endpoint. The following screenshot shows the VPC and route table selections for the S3 gateway endpoint.
Figure 9: Create an Amazon S3 gateway endpoint, part 2
Step 6: Validate the endpoints
Confirm in the Amazon VPC console that every endpoint you created is available, and that private DNS is enabled on the interface endpoints.
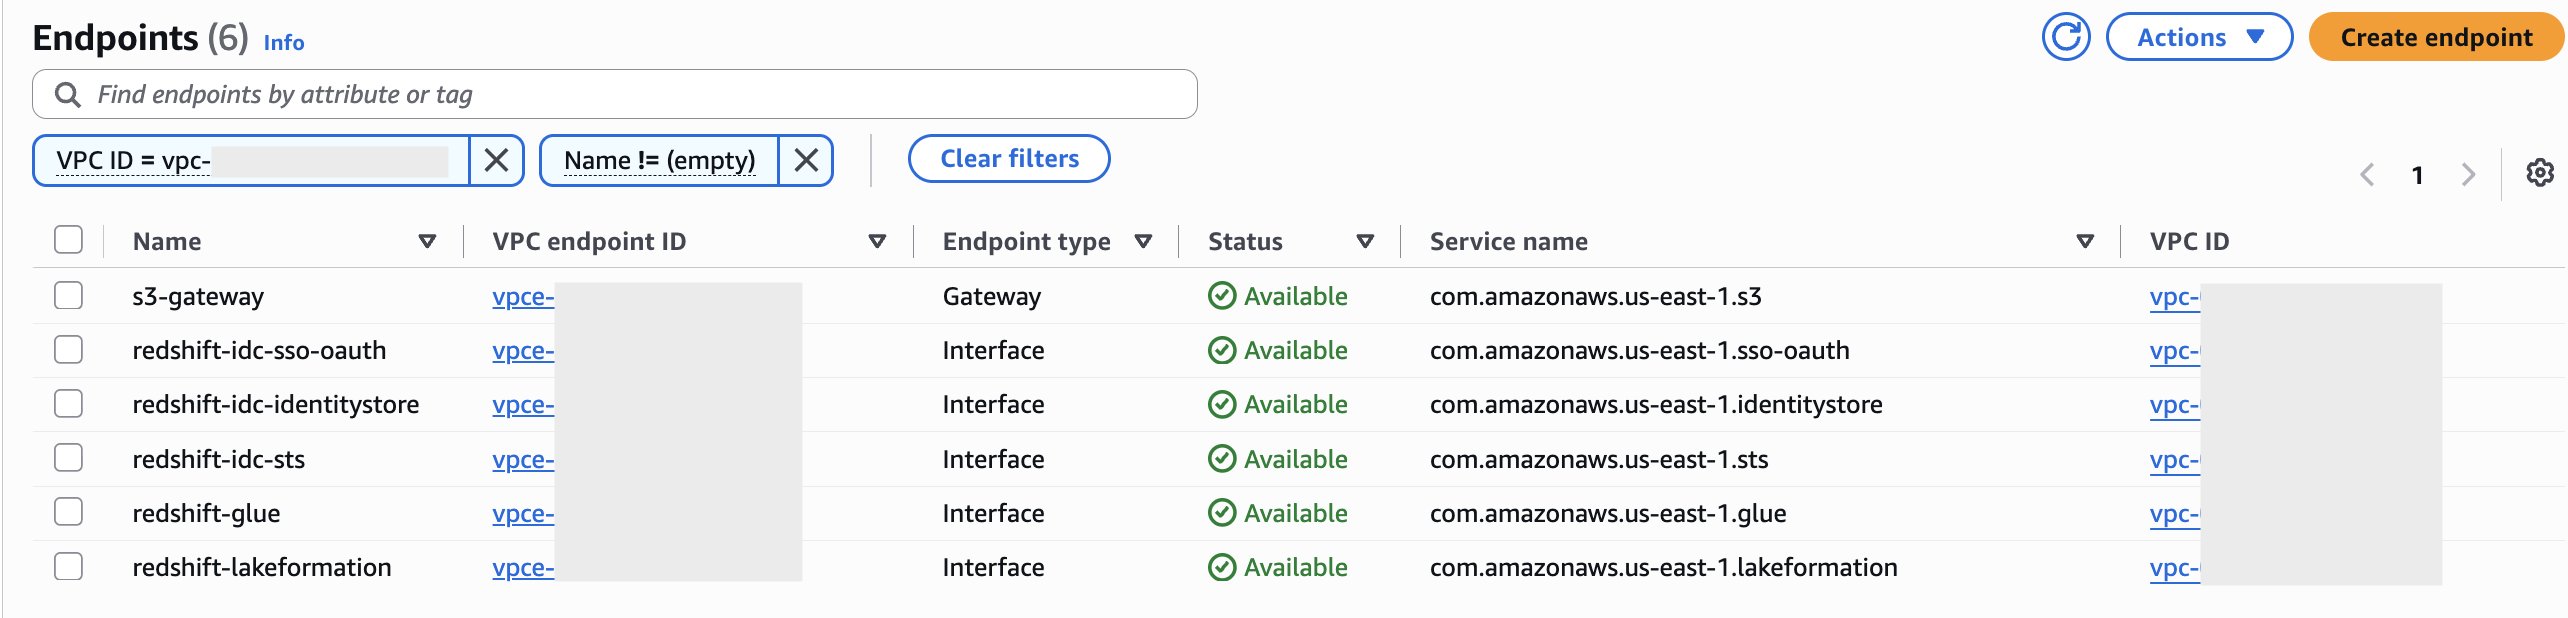
In the endpoints list, use the filter bar to filter by VPC ID (choose VPC ID and select your Amazon Redshift VPC). Then locate the endpoints you created for this walkthrough, sso-oauth, identitystore, the Amazon S3 gateway endpoint, and (if you created them) glue and lakeformation.
Confirm each endpoint shows a Status of Available.
Select each interface endpoint (sso-oauth, identitystore, glue, lakeformation) and, on the Details tab, confirm Private DNS names enabled is Yes. The following screenshot shows the completed endpoints list with each endpoint in the Available state.
Figure 10: VPC endpoints created in this walkthrough, in the Available state
Step 7: Test single sign-on with Amazon Redshift Query Editor V2
On the Amazon Redshift console, choose Query editor v2.
Choose your cluster and then choose IAM Identity Center as the connection method.
Sign in with your corporate credentials when prompted.
Expand the cluster in the tree view to list databases, schemas, and tables.
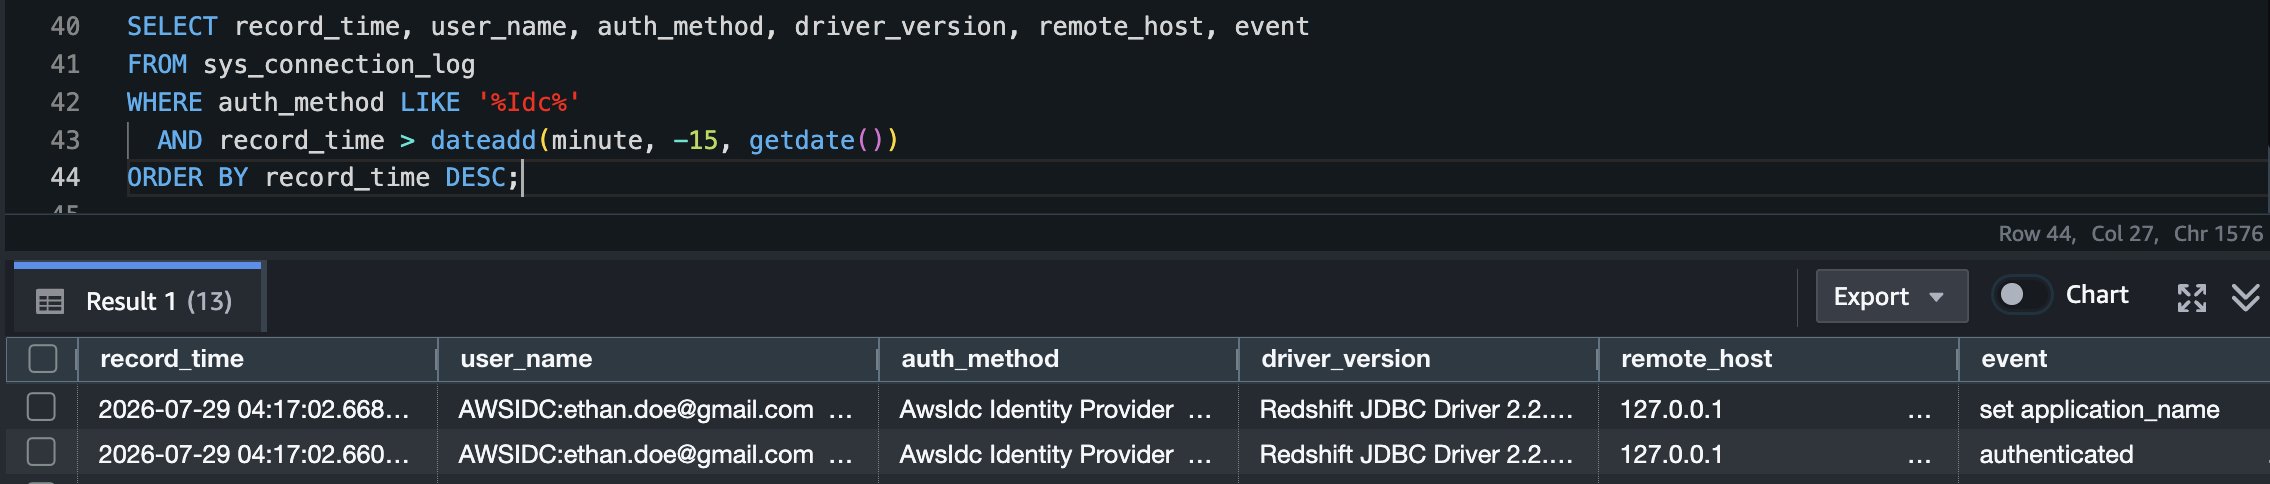
The database list populates within a few seconds. Confirm the login on the server side by querying the connection log. Run this as a user who does not use IAM Identity Center, for example a database user with a password, or through the Amazon Redshift Data API:
SELECT record_time, user_name, auth_method, driver_version, remote_host, event
FROM sys_connection_log
WHERE auth_method LIKE '%Idc%'
AND record_time > dateadd(minute, -15, getdate())
ORDER BY record_time DESC;
A successful sign-in shows user_name as <idc_namespace>:<[email protected]> with event of authenticated, which confirms that the identity was resolved through the endpoints you created. The following screenshot shows the sys_connection_log query results, where each IAM Identity Center sign-in appears with a user_name in the <idc_namespace>:<[email protected]> format.
Figure 11: Query Editor V2 connected with IAM Identity Center, showing the database list
Step 8: Test single sign-on with a SQL client
Testing from a SQL client on an EC2 instance inside your VPC is the stronger validation, and we recommend doing both. Query Editor V2 connects through an Amazon Redshift managed proxy, so its connections are recorded with a loopback address. A client running inside your VPC connects to the cluster endpoint directly, which is exactly the path the endpoints you created are there to serve.
Set up SQL Workbench/J
SQL Workbench/J connects through the Amazon Redshift JDBC driver. On an EC2 instance in the same VPC as your cluster, download and install SQL Workbench/J.
Download the latest Amazon Redshift JDBC driver together with its dependent libraries, and extract the archive to a folder on the instance.
Start SQL Workbench/J, and choose File, then Manage Drivers.
Choose the Create a new entry icon, and for Name, enter Amazon Redshift.
For Library, choose the folder icon, and select the driver JAR file along with every JAR file in the dependent libraries folder. Keep only one version of the driver in the list, and remove any previous entries.
Choose File, then Connect window, and choose the Create a new connection profile icon. Enter a name for the profile, such as redshift-idc.
For Driver, choose the Amazon Redshift driver that you created.
For URL, enter your cluster endpoint in the form jdbc:redshift://<cluster endpoint>:5439/<database>, for example jdbc:redshift://my-redshift-cluster.abc123xyz789.ca-central-1.redshift.amazonaws.com:5439/dev.
Leave Username and Password empty. The browser plugin obtains the identity interactively.
Choose Extended Properties, and add the following three properties:
The Region of your IAM Identity Center instance, such as ca-central-1
Clear Separate connection per tab, so that each editor tab reuses the same physical connection rather than prompting you to sign in again.
Choose Test. Your default browser opens. Sign in with your corporate credentials, and then choose Allow access so that the Amazon Redshift JDBC driver can access your data.
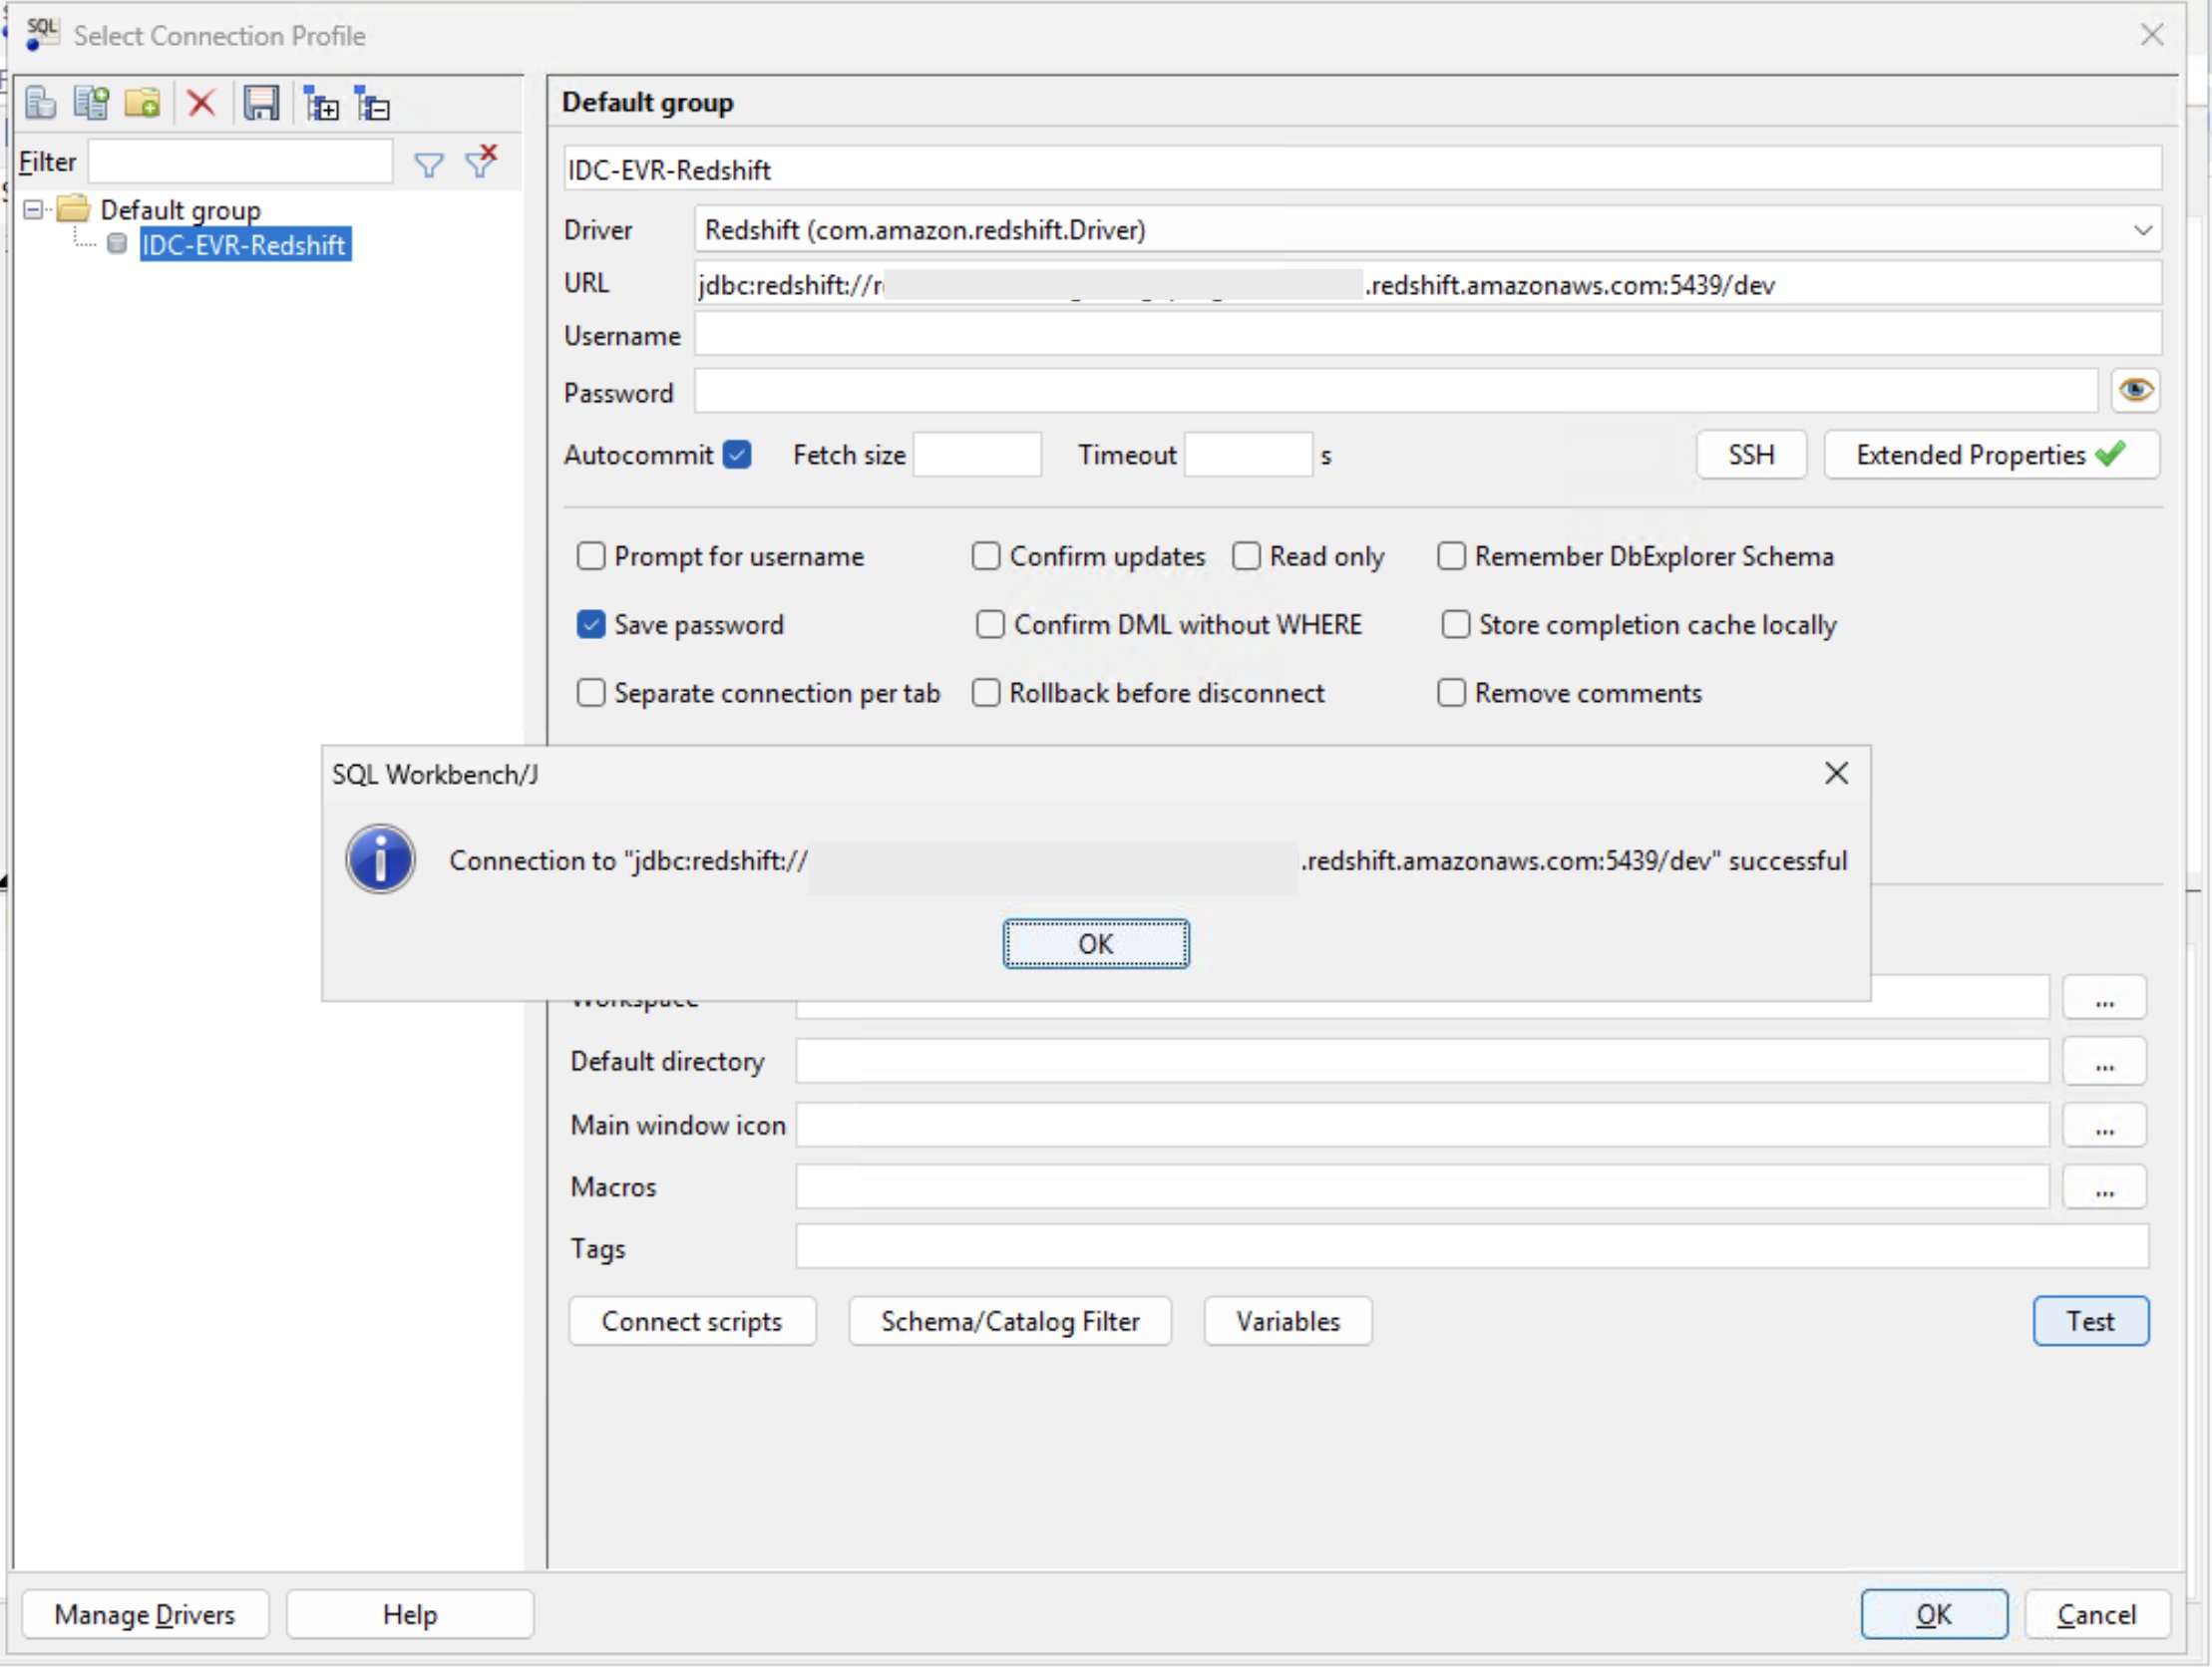
If the connection succeeds, you see a prompt confirming the connection to your Amazon Redshift endpoint, as shown in the following screenshot.
Figure 12: SQL Workbench/J connection for Amazon Redshift using the IAM Identity Center browser plugin
In the browser, you will see the following message once the authentication is successful.
Congratulations!You have IAM Identity Center single sign-on working on an Amazon Redshift cluster with enhanced VPC routing enabled.
Step 9: Verify the calls on AWS CloudTrail
You can confirm from AWS CloudTrail that these calls travel through your interface endpoints rather than the internet. Each event includes a vpcEndpointId field naming the endpoint the call traversed, along with a vpcEndpointAccountId field identifying the account that owns it.
The following table maps each interface endpoint to the CloudTrail event you’ll see:
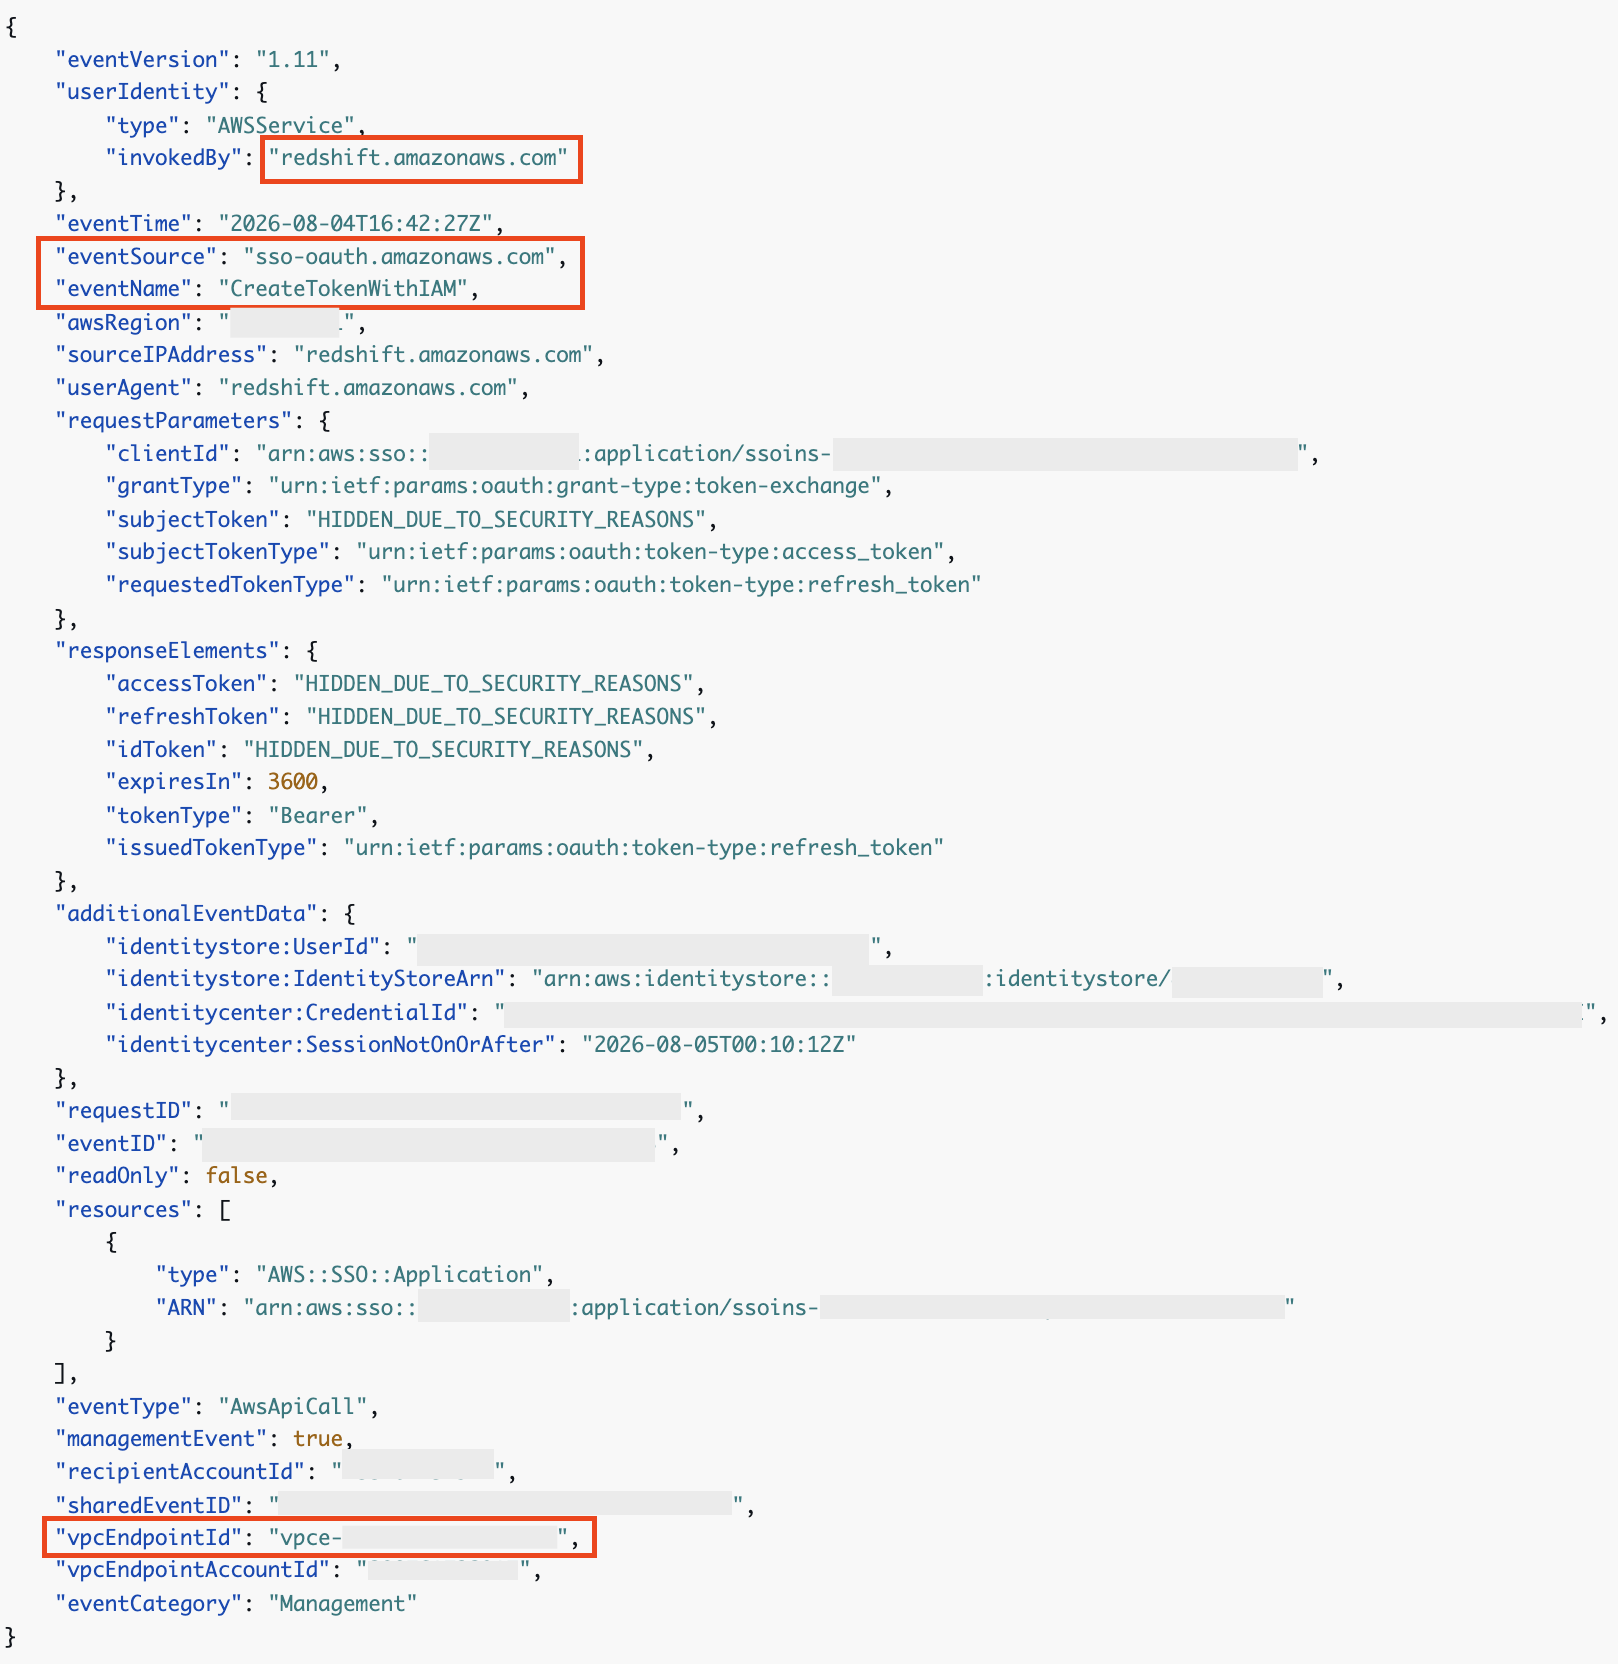
The following screenshot shows the snippet from the CloudTrail logs showing the CreateTokenWithIAM event that Amazon Redshift generates when it exchanges the IAM Identity Center access token. The eventSource is sso-oauth.amazonaws.com, and the vpcEndpointId field confirms the call traversed your interface VPC endpoint rather than the public internet. The invokedBy field shows the call originated from Amazon Redshift (redshift.amazonaws.com), not from the client.
Figure 13: CloudTrail CreateTokenWithIAM event traversing the sso-oauth interface endpoint
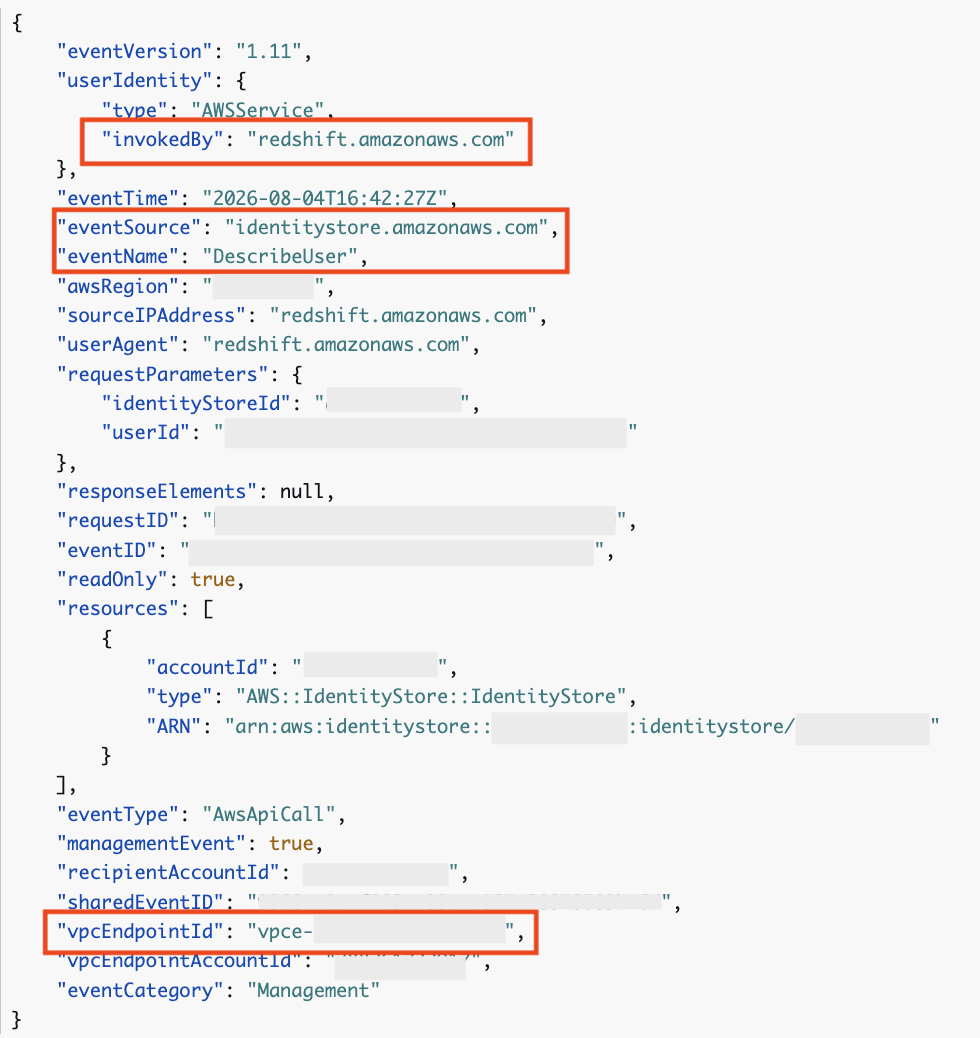
Similarly, the following screenshot shows a DescribeUser event (event source identitystore.amazonaws.com) generated when Amazon Redshift resolves the authenticated user against the identity store. As with the previous event, the invokedBy field shows the call originated from Amazon Redshift, and the vpcEndpointId field confirms it traversed the identitystore interface endpoint.
Figure 14: CloudTrail DescribeUser event traversing the identitystore interface endpoint
Note: where the events appear depends on how your IAM Identity Center instance is deployed:
CreateTokenWithIAM (event source sso-oauth.amazonaws.com) is recorded in the same account as your Amazon Redshift cluster.
Identity Store API calls (DescribeUser, ListGroupMembershipsForMember, BatchDescribeGroup) are recorded in the account that owns your IAM Identity Center instance. The event source is identitystore.amazonaws.com. If you use a centralized instance in a delegated administrator or management account, these events appear in that account and not in the account running your cluster. Searching the cluster’s own account returns nothing, even when authentication is working normally. To confirm which account to look in, run aws sso-admin list-instances and check OwnerAccountId.
Clean up
To avoid incurring future charges, delete the resources you created for this walkthrough. These endpoints provide the network path for single sign-on while enhanced VPC routing is enabled, so remove them only if you no longer need the integration.
On the Amazon VPC console, choose Endpoints.
Select the sso-oauth and identitystore interface endpoints you created, and choose Actions, then Delete VPC endpoints.
Select the glue and lakeformation interface endpoints, if you created them, and delete them.
Select the Amazon S3 gateway endpoint and delete it. This also removes its route table entries.
Terminate the EC2 instance you used to test the SQL client connection, if you created one for this walkthrough.
If you no longer need the integration, remove the IAM Identity Center application assignment for Amazon Redshift and delete the associated IAM role and policy.
Conclusion
In this post, we showed you how to enable AWS IAM Identity Center authentication for Amazon Redshift on clusters with enhanced VPC routing enabled. Your users get single sign-on with their corporate credentials, and the authentication traffic stays private to your VPC. The key concept is that Amazon Redshift, not your client, validates the access token. Because enhanced VPC routing is enabled, Amazon Redshift routes that validation call through your VPC. On a cluster running patch 204 or later, interface endpoints for sso-oauth and identitystore give Amazon Redshift a private path over AWS PrivateLink. Adding endpoints for AWS Glue, AWS Lake Formation, and Amazon S3 extends the same benefit to data lake and lakehouse queries.
Try this setup in your own environment and let us know what you think in the comments. For more information, see the following resources:
AWS IAM Identity Center integrates with external identity provider (IdP) to provide customers with a centralized authentication and authorization solution for AWS resources across AWS Organizations. AWS continues to invest into IAM Identity Center with a growing number of AWS services that natively integrate with IAM Identity Center. As your AWS organization scales, maintaining visibility into who has access to which applications and enforcing governance policies across accounts and Regions becomes increasingly complex. Identity Center helps address this by centralizing authentication and authorization for AWS resources across your organization, integrating with your external identity provider and a growing number of AWS services. However, as adoption scales, tracking access assignments and enforcing governance policies consistently becomes its own challenge.
This blog post focuses on planning your integration between an identity provider and IAM Identity Center for managed applications in your organization. We also walk through deploying and using an automated Identity Center discovery and reporting sample solution to help answer the governance and security questions:
Which users or groups have access to which AWS applications?
Who last accessed a specific AWS application and when?
Which users and groups are assigned to which IAM Identity Center applications across organization and AWS Regions?
How can you quickly generate reports to assist with compliance audits or security reviews?
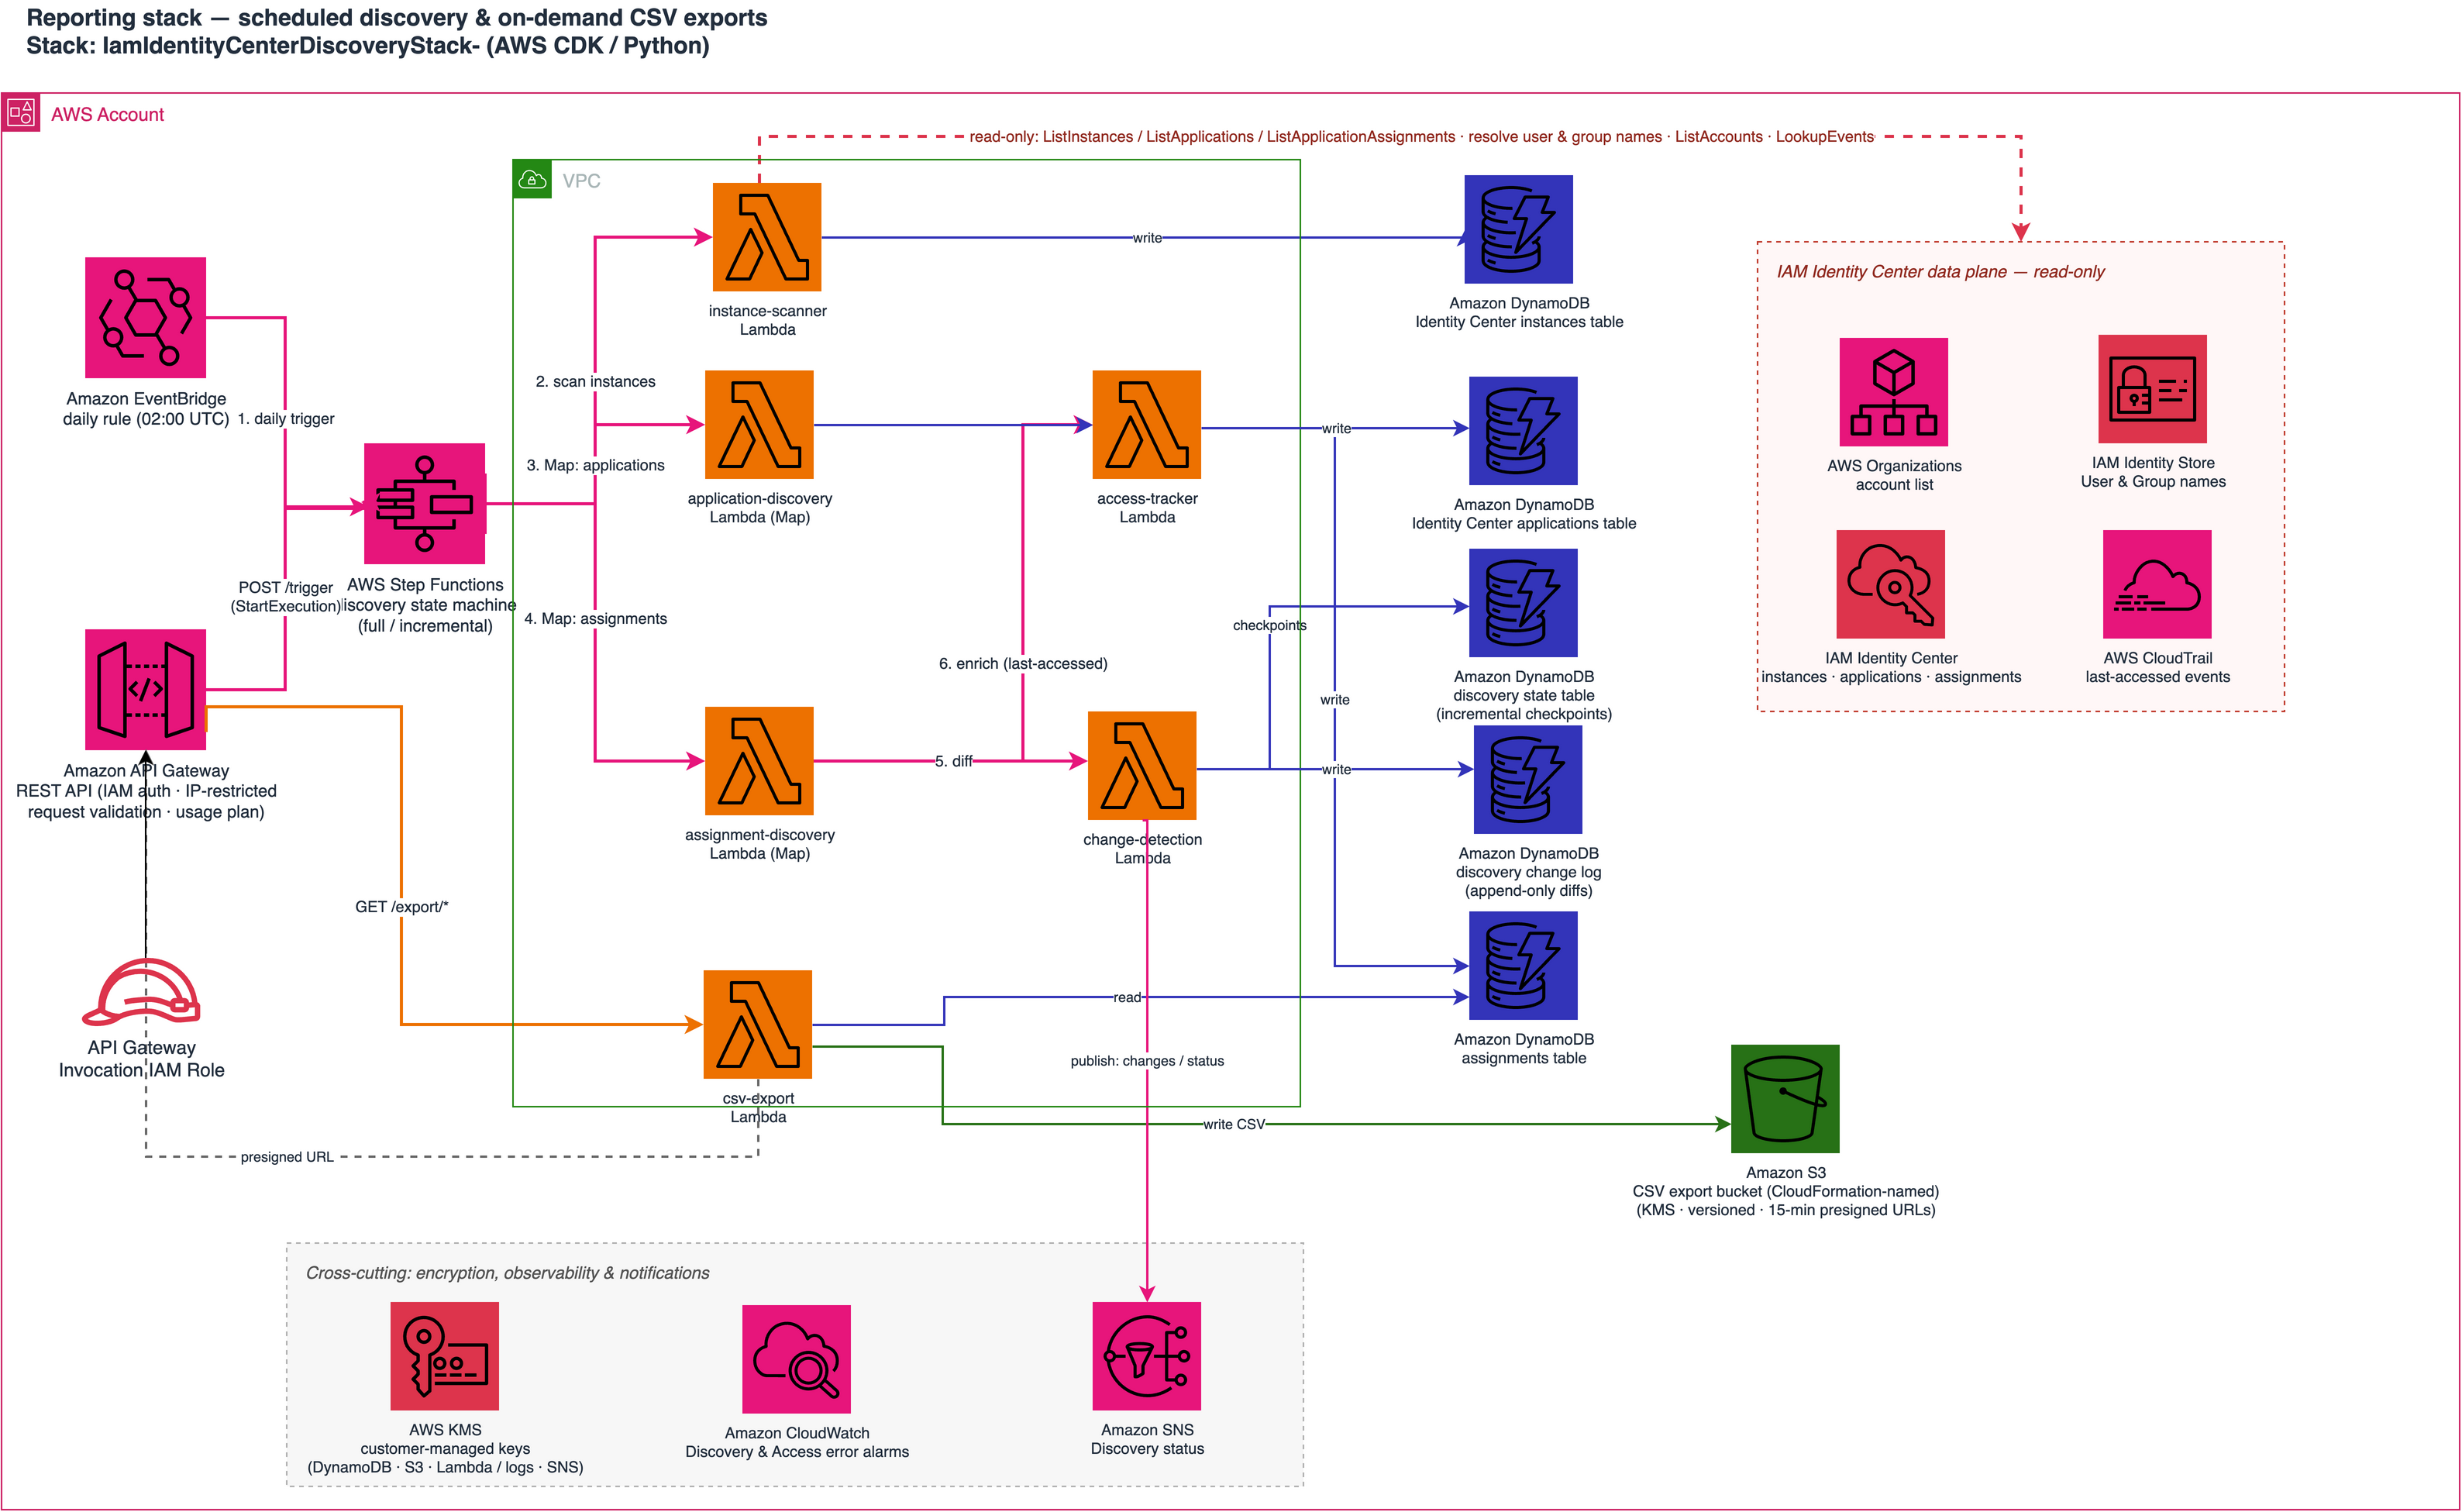
The sample solution will identify associated AWS applications and the corresponding user and group assignments for the IAM Identity Center instances within your organization. The output is stored in a queryable format and generates CSV files for downstream analysis or reporting.
Plan identity governance for Identity Center application assignments
There are four key areas to start on when planning how to manage delegation and provisioning access across IAM Identity Center managed AWS applications. Bring together key stakeholders across security, governance, application, and business teams to make sure the implementation and integration will fit into the overall identity governance strategy.
Who can provision managed AWS applications: You can implement the IAM restrictions for creation of new AWS resources within AWS accounts in your organization. For example, if you restrict provisioning into a production AWS account to only infrastructure as code (IaC) IAM roles, you would continue implementing restrictions using AWS identity policies, service control policies (SCP), resource control policies (RCP), or IaC policy evaluation tools like Open Policy Agent (OPA) or Checkov.
Who manages user and group assignments: The managed application administrator handles authorization to managed applications within an AWS account. It’s recommended to clearly define roles and responsibilities across the workflow. You would have an IaC pipeline manage the integrated AWS resource provisioning with IAM Identity Center, then another workflow to allow requests to manage user and group membership for the managed application.
How authentication flows from the IdP to AWS resources: Users will authenticate into Identity Center, then be authorized to access AWS managed applications. From there, they will be authorized to access the associated AWS service and resources tied to the managed application. Depending on the AWS service, the associated downstream resources might have their own IAM principals that the users can access.
Mapping IdP identities to AWS resource access: There needs to be a link for workforce users and groups in your IdP, to Identity Center managed applications, and to downstream resources and permissions. Identifying the relationship will help you understand access within your AWS environment. Trusted identity propagation (TIP) is an additional feature of Identity Center that provides an end to end trail of the identity to the downstream service.
Create and manage an Identity Center application assignment lifeycle
After you have IAM Identity Center set up within an organization instance, your member AWS accounts can start creating associated AWS resources. Within each member AWS account, the IAM principals that provision AWS resources will need two types of service-specific IAM permissions:
The first type of IAM permissions will be specific to the AWS service you want to provision. For example, to create an Amazon SageMaker AI domain, you would need the same IAM permissions to create the SageMaker AI domain and the downstream AWS resources SageMaker AI might use.
The second type of IAM permissions is specific to IAM Identity Center. The IAM principal used to create the resource, in this example SageMaker AI, will also need permissions to manage applications within the Identity Center instance.
IAM Identity Center application Amazon Resource Names (ARNs) follow a different standard naming convention that isn’t based on the original resource name that was provided during resource creation. For example, when a user creates an Amazon Simple Storage Service (Amazon S3) bucket and sets a specific bucket name, that bucket name is included in the ARN: arn:[partition]:s3:::[bucket-name]. Identity Center application ARNs use unique identifiers (GUIDs) generated at creation time.
Manage access for an Identity Center application
After the IAM Identity Center application is created, you will need to manage access to the Identity Center application and associated AWS resources. To continue with the SageMaker AI domain example, after the domain is created, an authorized IAM principal will need to assign Identity Center users or groups from the Identity Center instance to the domain. For Identity Center, you will need two types of Identity Center IAM permissions.
The first type of IAM permissions is used to list IAM Identity Center users and groups within the Identity Center instance. This is needed to read and select specific IAM users or groups to assign to an Identity Center application.
Although IAM Identity Center users and groups have a GUID, the GUIDs aren’t clearly linked to the resource friendly names. For example, a group name could be Read-Only and the resource GUID could be 1234567890-abcdef12-3456-7890-abcd-ef1234567890 in the identity store. Additionally, the IAM actions to list users or groups require the AllUsers or AllGroups parameter. Because List actions require access to users and groups, a restrictive IAM policy can’t be used to prevent IAM principals from seeing a subset of users or groups within the identity store. The second type of IAM permission is used to create and manage application assignments for the Identity Center application within the Identity Center instance.
Because the IAM Identity Center application ARN is created using a unique application ID during creation, it’s not recommended to implement an IAM policy restricting authorized IAM principals to manage specific Identity Center applications. For example, to limit the application assignments to only a specific set of applications, you would need to:
Create the AWS resource with IAM Identity Center as the authentication mechanism
Query the Identity Center application ARN for the associated AWS resource
Identify the IAM principal that will be used for application assignments
Create or update an IAM policy associated to that IAM principal to allow application assignments for that specific application
Create or update an SCP to restrict application assignment to that specific IAM principal
In lieu of implementing resource restrictions within identity policies, you should limit management of IAM Identity Center application and application assignments to a limited number of authorized IAM principals. In addition, it is recommended to implement detective and reactive capabilities to manage Identity Center application assignments.
Plan your naming conventions and automation strategy
IAM Identity Center provides several APIs to capture information about your AWS organization instances, applications, and assignments. Before implementing automation or guardrails, you should develop a methodical approach and understand what outcome you’re working backwards from. Start by defining naming conventions and deciding what parts of the workflow you want to centralize.
Determine a naming convention for groups within your IdP: For example: AWS_<ACCT#>_<AWS_Service>_<LOB>_<ENV>_<AppName>. The IdP group name would look like: AWS_123412341234_SageMaker_Data_PROD_GTLabel.
Define the naming convention for AWS resources for your Identity Center integrated applications: For example: <AWS_Service>_<LOB>_<AppName>. The AWS resource name would look like: SageMaker_Data_GTLabel.
Define the naming convention for Identity Center application names: For example: <AWS_Service>_<LOB>_<ENV>_<AppName>. The Identity Center application name would look like: SageMaker_Data_PROD_GTLabel.
Decide on the restrictions that you want to implement within your AWS environment. Depending on your enterprise’s security standard, you can implement specific restrictions based on mapping of a similar combination of ENV (environment), AWS service, LOB (line of business), or application name.
Choose the portions of the application workflow that you want to centralize. This could include creating the application, making application assignments, or remediating issues.
As more configurations and permissions are centralized, additional overhead and bottlenecks can be introduced. It’s important to find the right balance for your enterprise. For example, if you centralize application assignments, each application team will need to submit a request to modify assignments that will be reviewed by a centralized team and could result in a delayed response. Conversely, if each application team handles their own assignments, there’s a risk that application assignments won’t align to enterprise security standards.
By understanding your goals and how you want to reach them, you can tailor the sample solution accordingly. Getting alignment on this requires planning and coordination across multiple teams within your organization. When thinking about more customized authorization logic—such as using provisioned AWS resource metadata—you should review how the specific AWS service integrates with IAM Identity Center managed applications. For example, if you want to find the Identity Center application ARN for a specific AWS resource, such as a SageMaker AI domain, use the following approach. A reverse lookup is necessary because AWS services create Identity Center applications with GUID-based ARNs that aren’t easily discoverable.
Amazon API Gateway – Provides an IAM-authenticated REST API for a Lambda function to generate and export reports as CSV files
Amazon S3 – Stores the encrypted CSV file exports, with lifecycle policies and time-limited Amazon S3 presigned download URLs
Deploy the IAM Identity Center reporting sample
The following procedure deploys the automated discovery and reporting infrastructure using AWS Cloud Development Kit (AWS CDK). Make sure you have the following prerequisites in place, then continue with the steps to set up the solution.
Prerequisites
You need to have the following to test the solution in this post.
An AWS organization with an IAM Identity Center organization instance with delegated administrator access configured
IAM Identity Center configured with at least one instance
export IDC_EXTERNAL_ID="$(uuidgen)" # alternatively you can set this value — member-account roles need the same value

cdk deploy --parameters AllowedIpRange=10.0.0.0/8 --parameters CrossAccountExternalId="$IDC_EXTERNAL_ID"
Note: AllowedIPRange is optional but recommended as a security best practice. The parameter will add a network restriction to download the Amazon S3 presigned URL export.
Optional: For AWS account-level Identity Center instance discovery, a cross-account IAM role is required.
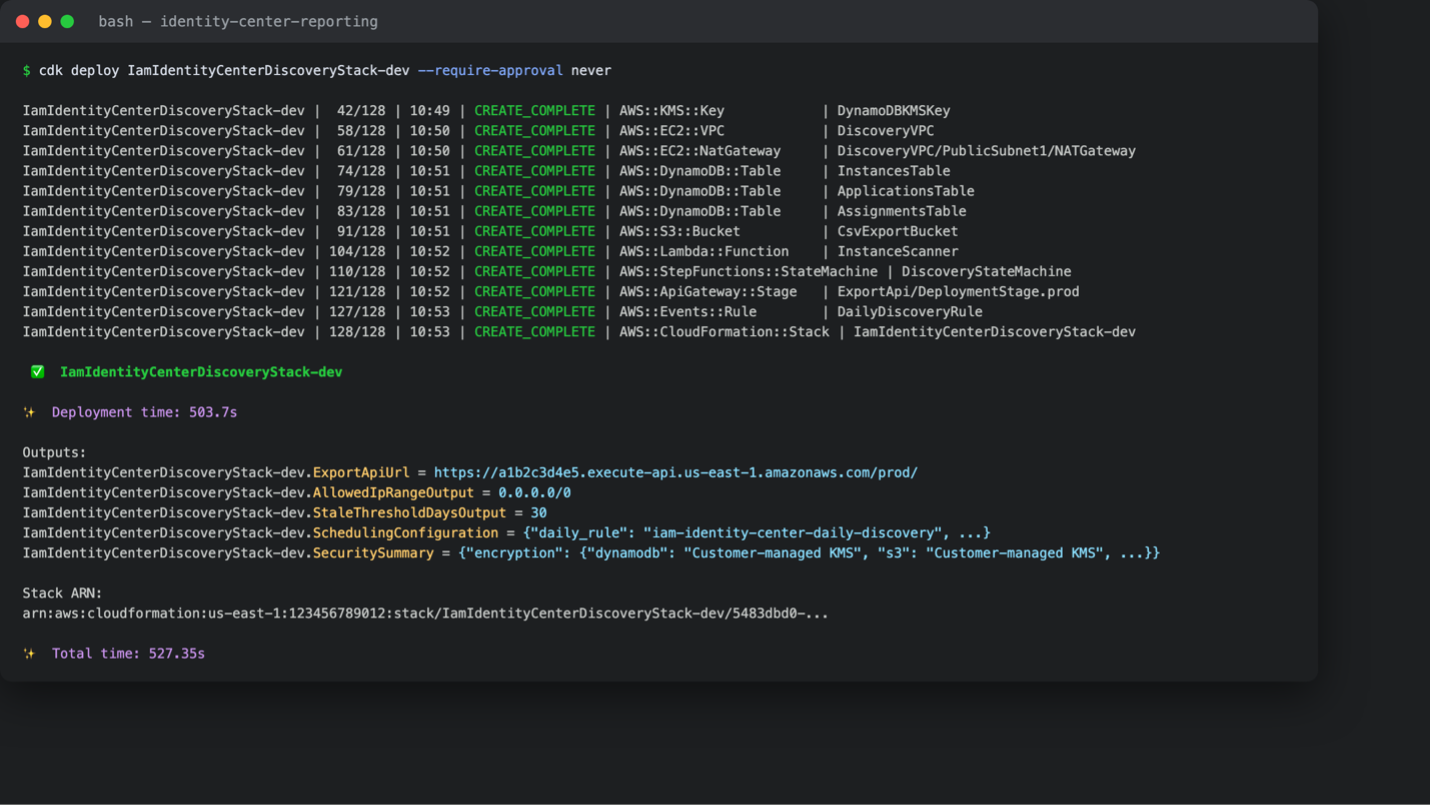
Figure 2: Successful AWS CDK deployment of the reporting stack
After the stack is successfully deployed, obtain the CDK output values for the API Gateway URL and S3 bucket name. If using a command line to deploy, these values will be displayed after the stack successfully deploys. It can also be found in the AWS Management Console as AWS CloudFormation stack output. The output will be used for generating reports in the following sections.
Note that this stack is for the reporting stack only. Reactive monitoring and deployment are described in the next section.
After the reporting stack is successfully deployed, the automation will run on a daily schedule. The first discovery run executes immediately after deployment. You can monitor discovery execution history and detailed logs through the the AWS Step Functions console. Review the detailed Lambda function logs in Amazon CloudWatch Logs. Query discovered instances, applications, and assignments through the DynamoDB console for one-time analysis.
Generate reports for Identity Center application assignments
To generate on-demand reports as CSV files from the REST API:
You can use the generated CSV files to help identify anomalies or non-compliant assignments, such as:
Each PROD application should only have GROUP assignments. OpenSearch_PROD has a USER principal type and so is non-compliant.
Each PROD application should only allow PROD groups assigned. SageMaker_PROD has a DEV group name (Engineering-Team-Dev) assigned and so is non-compliant.
Based on the testing and analysis of the output from the IAM Identity Center governance reporting sample solution, it’s important to start thinking about what restrictions to put in place for application assignments. It’s also important to conduct this exercise before taking action within the Identity Center remediation sample solution in the next section.
IAM Identity Center remediation
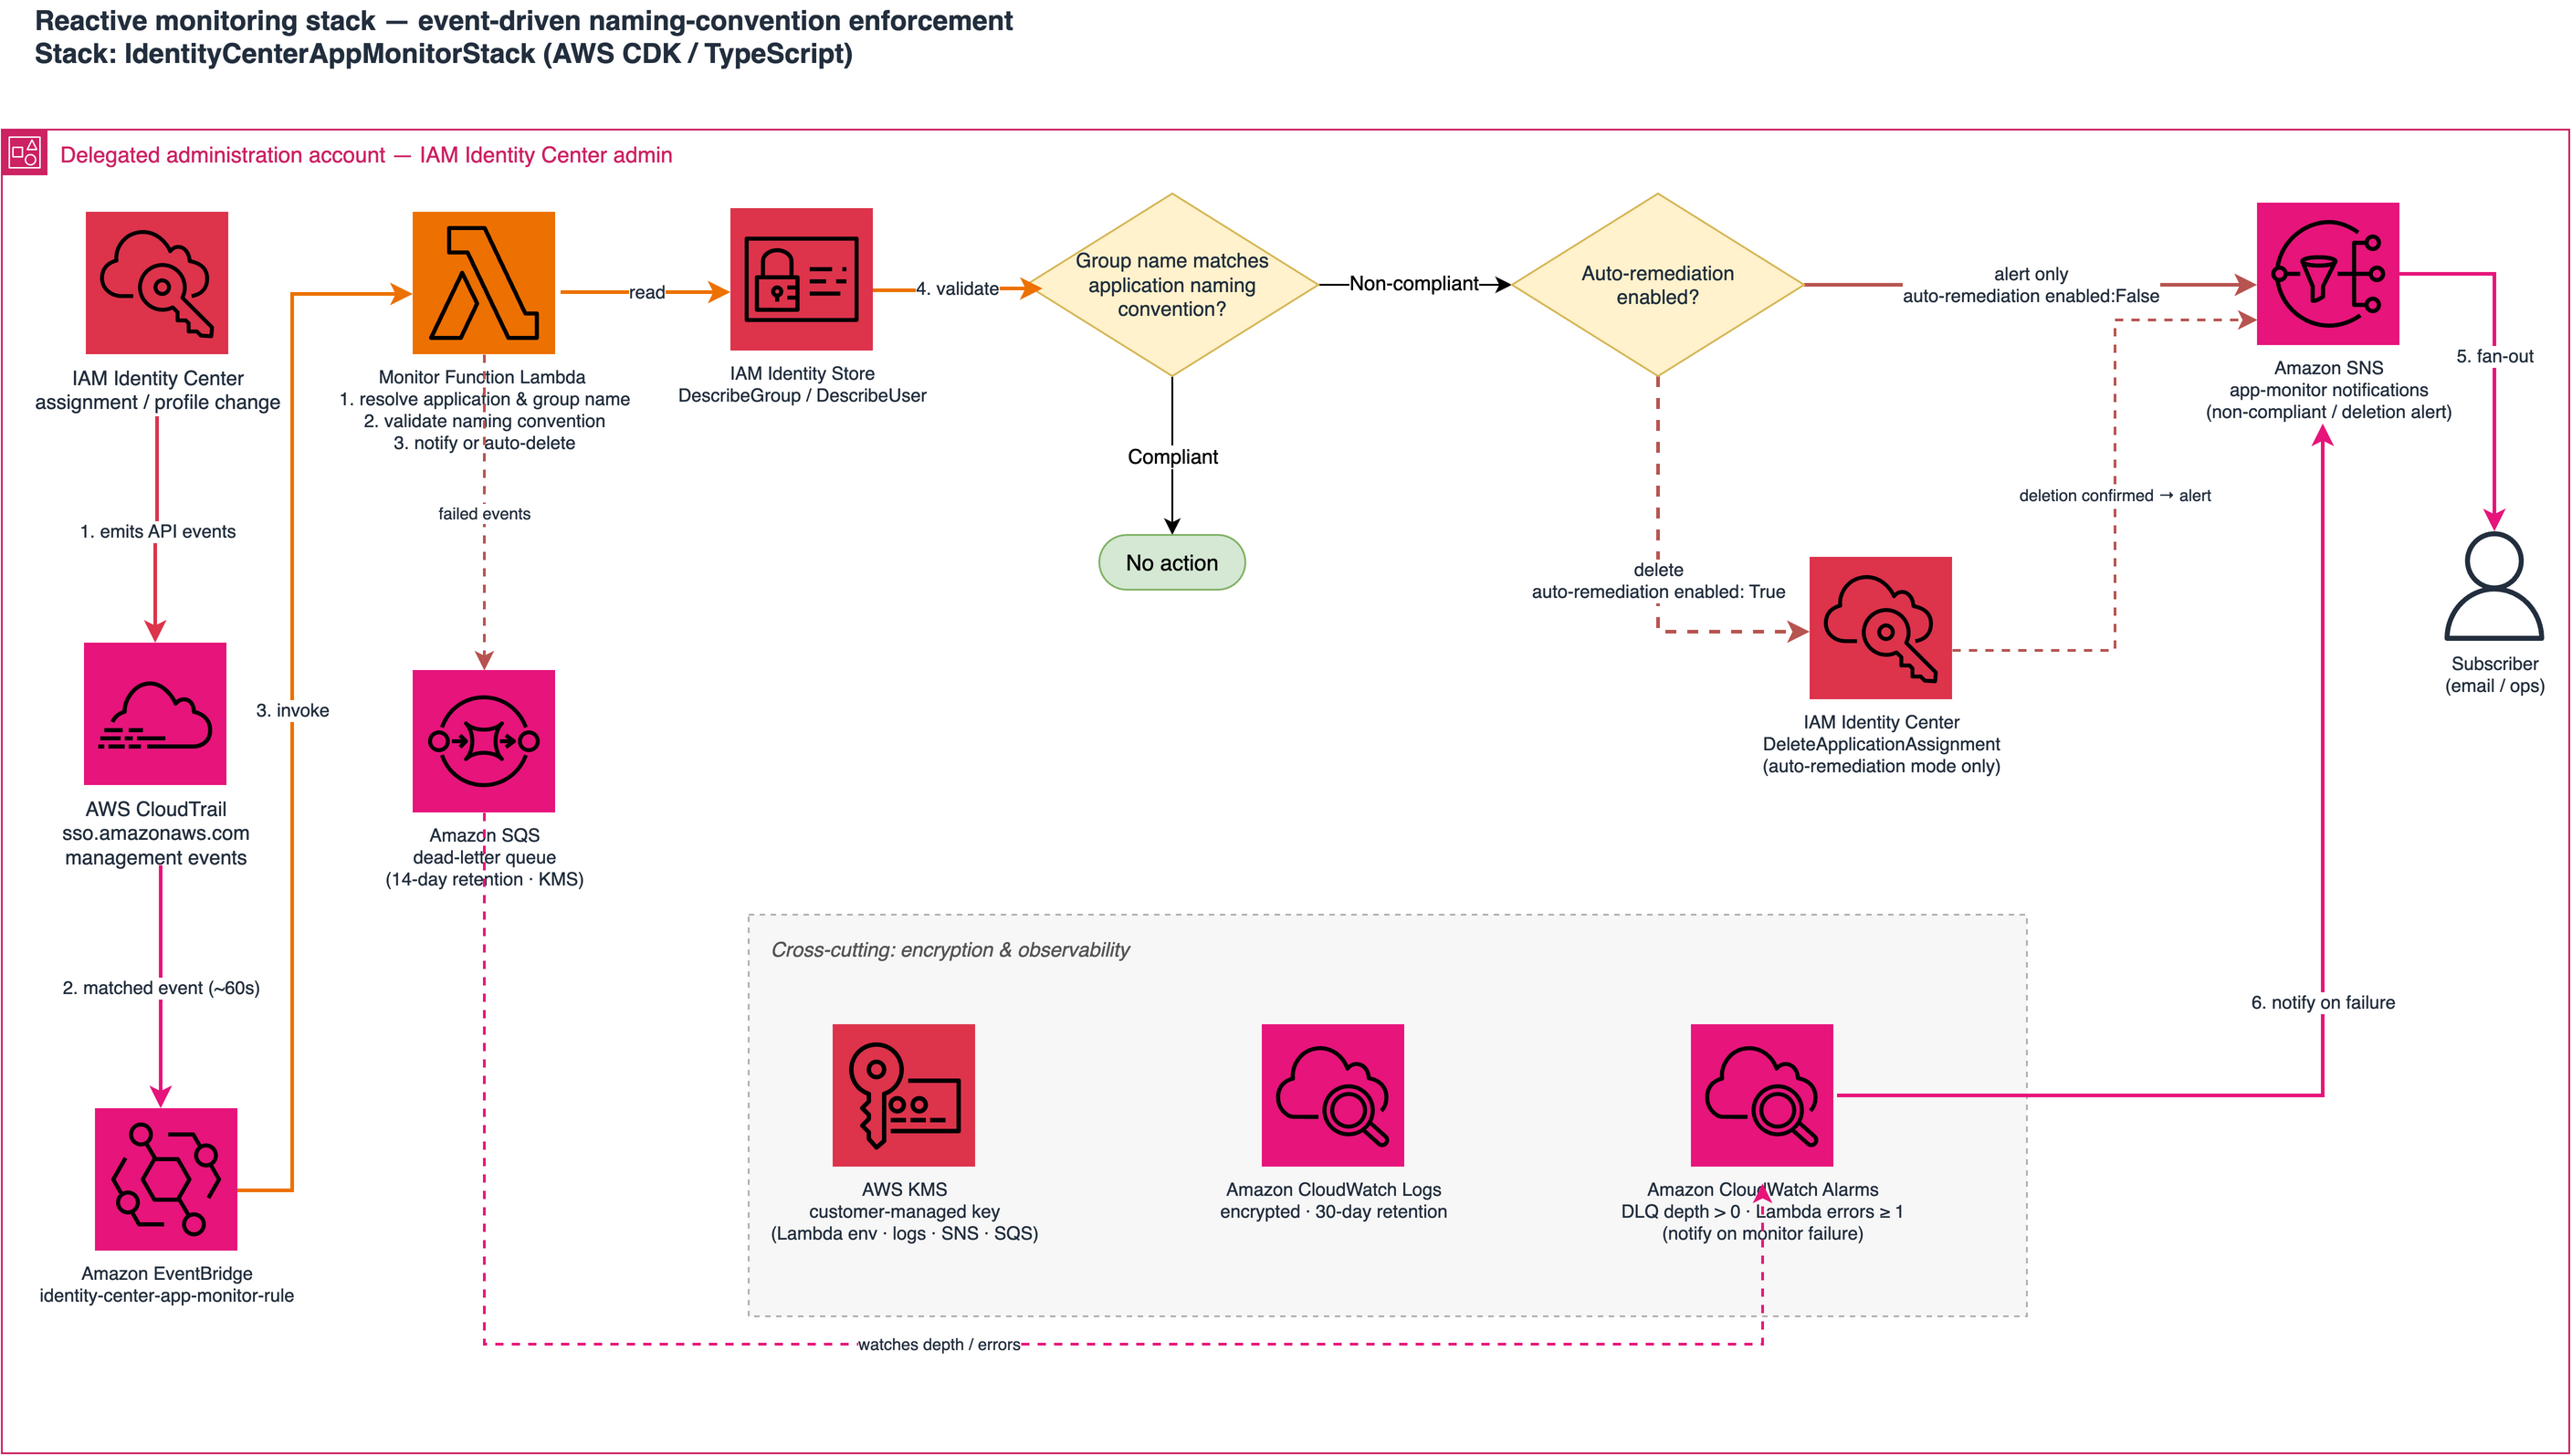
The following diagram shows the IAM Identity Center remediation architecture.
The IAM Identity Center remediation sample solution deploys the following resources:
Amazon EventBridge – Matches IAM Identity Center assignment and profile events from CloudTrail (sso.amazonaws.com) and invokes the monitor function across the following IAM actions:
CreateApplicationAssignment
DeleteApplicationAssignment
PutApplicationAssignmentConfiguration
AssociateProfile
DisassociateProfile
CreateProfile
UpdateProfile
DeleteProfile
Lambda – Resolves the application and group names, validates the assignment against your naming convention, and notifies or remediates based on the configured mode
AWS KMS – Customer-managed key to encrypt the Lambda environment variables, CloudWatch logs, SNS topic, and dead-letter queue
Amazon CloudWatch – Log group stores the function’s structured, encrypted logs as an audit trail
Flexible naming policies support regex-based pattern matching for specific organizational requirements. The automation actions are logged to CloudWatch with structured JSON for additional analysis and reporting.
The following procedure deploys the remediation infrastructure using AWS Cloud Development Kit (AWS CDK). Make sure you have the following prerequisites in place, then continue with the steps to set up the solution.
Prerequisites
You need the following to run the remediation solution:
An AWS organization with an IAM Identity Center organization instance with delegated administrator access configured
IAM Identity Center configured with at least one instance and an IdP
Python 3.12 & Node.js 18 or later installed for CDK deployment
Provide your IAM instance ARN and the account ID where IAM Identity Center is administered:
git clone https://github.com/aws-samples/sample-iam-idc-application-discovery-reporting # only needed if you did not clone in the previous reporting section
cd identity-center-remediation
cdk deploy --context enableAutoDeletion=false --parameters IdentityCenterInstanceArn=arn:aws:sso:::instance/ssoins-<INSERT-ORG-INSTANCE-ID> --parameters ManagementAccountId=<INSERT-MANAGEMENT-ACCOUNT>
Note: If you don’t pass a parameter for GroupNameRegex, the default action of the sample solution is to verify the group name appears as a whole word in the application name: Case-insensitive, splitting on -, _, and spaces, so ReadOnly matches sagemaker_readonly but read does not. If different validation is needed, the sample can be deployed with the regex value for GroupNameRegex.
After the solution is deployed, we will walk through testing both a compliant and non-compliant application assignment.
Gather Identity Center and application information
For this blog, we have already created two groups within the IdP that is integrated into an IAM Identity Center instance. We also already created two applications within Identity Center instance to use. Next, we’ll need to gather information specific to the environment to run through each example.
Obtain the IAM Identity Center instance ARN and set the value.
After you have the output for IAM Identity Center groups and applications, select two groups and one application that you want to test with. You will need to set additional variables for each group GUID and application ARN. In this example, I select the following two groups (ReadOnly and Developer) for testing and set the environment variables using export:
As part of this validation, the sample solution verifies the group name appears as a whole word in the application name: Case-insensitive, splitting on the -, _, characters and spaces, so ReadOnly matches sagemaker_readonly but read does not. For different use-cases, The GroupNameRegex parameter can be used during deployment.
Test compliant and non-compliant assignments
Run the following command to add the ReadOnly group assignment to the sagemaker_readonly application:
aws sso-admin create-application-assignment --application-arn $APP_READONLY --principal-id $GRP_READONLY --principal-type GROUP
The group assignment request meets the validation criteria because the application name sagemaker_readonly contains the group name ReadOnly. The output logs for this validation exist within the associated lambda function CloudWatch log group /aws/lambda/identity-center-app-monitor”.
In this example, the logs will show:
✓ COMPLIANT - Group name found in application name
Run the following command to try to add the Developer group assignment to the sagemaker_readonly application:
aws sso-admin create-application-assignment --application-arn $APP_READONLY --principal-id $GRP_DEVELOPER --principal-type GROUP
The group assignment request doesn’t meet the validation criteria because the application name sagemaker_readonly doesn’t contain the group name Developer. The output logs for this validation exists within the associated lambda function CloudWatch log group /aws/lambda/identity-center-app-monitor. Note that the remediation action listed shows NOTIFICATION_ONLY, meaning it only sent a notification to the configured SNS topic and did not take action. If you want the group assignment to be deleted, the value should be set to enableAutoDeletion=true.
In this example, the logs will show:
✗ NON-COMPLIANT - Group name not found in application name
Scheduled reporting gives baseline visibility into IAM Identity Center managed applications. Event-driven monitoring can provide near real-time notification or enforcement. Together, these sample solutions can help align and scale Identity Center with your governance and security standards through both historical analysis and immediate response.
Clean up
For each deployed CDK stack, run the following commands in the AWS account where it was deployed.
To delete the remediation stack, run the following commands:
cd sample-iam-idc-application-discovery-reporting/identity-center-remediation
cdk destroy
To delete the reporting stack, run the following commands:
cd sample-iam-idc-application-discovery-reporting/identity-center-reporting
cdk destroy
IAM governance automation at scale
Achieving effective IAM Identity Center governance at scale requires moving beyond manual processes to automated, continuous monitoring and reporting. The following high-level steps can provide an Identity center governance framework:
Deploy the sample automation with an IAM principal that has access in your delegated administrator account.
Establish a baseline by running your first discovery and reviewing the generated reports.
Configure naming policies to match your organization’s security conventions.
Deploy the event-driven monitoring capabilities to enable real-time policy enforcement and automated response based on the security policies.
Start in notification mode to establish a baseline before enabling auto-remediation.
Integrate with your governance tools by connecting the API endpoints to your compliance dashboards or ITSM tools.
Move to auto-remediation once you have validated policies are working as expected.
Conclusion
Managing AWS IAM Identity Center at scale doesn’t have to be a manual, time-consuming process. By implementing automated discovery and reporting combined with real-time event-driven monitoring, you can maintain continuous visibility into your organization’s identity and access landscape, respond immediately to policy violations, and enforce governance policies consistently across your organization. Automation reduces operational work, strengthens security, speeds up incident response, and maintains compliance. Start by deploying these solutions to gain visibility and enable real-time enforcement.
If you have feedback about this post, submit comments in the Comments section below. If you have questions about this post, start a new thread on AWS re:Post or contact AWS Support.
Today we are taking a look at Dell’s latest laptop for the mainstream business segment, the Intel-based Dell Pro 5 14. The 14-inch laptop hits all the high notes, pairing an Intel Core Ultra Series 3 processor with great modularity, particularly a LPCAMM2 LPDDR5X memory module
Real-time event pipelines rarely get to work with a uniform schema. Whether it’s IoT metrics, ecommerce clickstreams, or financial pricing vectors, each event type brings its own schema. An equity trade and a rates trade, for instance, carry almost entirely different fields. Ingesting these multi-schema streams has traditionally forced suboptimal architectural choices. You build separate tables for each event type or maintain a wide STRUCT where every possible field across all event types must be declared upfront (fast reads, but sparse and rigid). The other option is to flatten everything into an unwieldy schema with hundreds of columns. To sidestep that maintenance burden, many teams dump events into a plain JSON string column that introduces significant performance penalty. Querying a single nested field requires your engine to deserialize the entire JSON blob for every row. At scale, you burn compute and budget scanning terabytes of raw text to extract a few bytes of data.
Adding to the challenge, these pipelines typically demand mixed processing speeds. You need a real-time path (not near-real-time) to flag anomalies or high-risk events with sub-second latency, while simultaneously pushing those same events into analytical storage for deep historical analysis in batch.
With AWS Glue 6.0, you can tackle all of these challenges (schema heterogeneity, JSON scanning overhead, and mixed-latency requirements) from a single pipeline. Built on Apache Spark 4.1 with Apache Iceberg v3 support, AWS Glue 6.0 brings Variant columns, Variant shredding, Spark Real-Time Mode (RTM), and Arrow-native user-defined functions (UDFs) to a fully managed, serverless environment.
In this post, we walk you through how to build this multi-layer architecture using a financial services use case: a market risk pipeline processing trade pricing vectors. While the example is finance, the patterns apply wherever you deal with heterogeneous schemas, expensive JSON parsing, and mixed real-time/batch requirements such as IoT device fleets, multi-tenant SaaS platforms, logistics tracking, and beyond. We will show you how to flag high-risk trades with sub-second latency, stream everything into an Iceberg v3 data lake as Variants, and run batch Value at Risk (VaR) computations efficiently using Arrow-native UDFs.
Solution overview
A bank’s Market Risk team receives a continuous stream of trade pricing vectors from front-office systems. Each trade event carries:
A trade ID and book/desk IDs.
A pricing vector as semi-structured data. The schema varies by asset class (for example, equities carry risk sensitivities known as Greeks such as delta/gamma, foreign exchange (FX) carries volatility surfaces, rates carry curve sensitivities).
A region ID for jurisdictional reporting (uses a column DEFAULT value, so rows that omit it get auto-populated).
The team needs three things from this stream, each at a different speed. We build the pipeline in three layers, each addressing a distinct requirement with a purpose-built AWS Glue 6.0 capability.
Layer 1: Real-time trade position breach detection (sub-second latency)
Positions must be updated in sub-second time, not seconds of traditional micro-batch streaming. For a team monitoring position limits, those seconds mean trades can breach limits before the system reacts. Spark Real-Time Mode (RTM) eliminates the micro-batch boundary entirely, letting records flow continuously through the pipeline so that high-risk trades trigger alerts within sub-second latency of arrival.
Every trade must land in a queryable data lake within seconds, with heterogeneous pricing vectors stored without declaring a fixed schema upfront. The Iceberg v3 Variant type handles this natively. The raw semi-structured payload goes into a single column regardless of asset class schema. At write time, Variant shredding automatically extracts fields observed in the data into typed Parquet columns, so downstream analytical queries read only the columns they need without deserializing the full blob. Trade amendments and cancellations are handled at a lower cost with deletion vectors (merge-on-read), and column DEFAULT values reduce boilerplate in ingestion code.
Layer 3: Batch risk computation (minutes to hours latency)
Risk metrics like Value at Risk (VaR) must be computed in Python across millions of trades. Traditional row-by-row pickle serialization between the Java Virtual Machine (JVM) and Python is the bottleneck. Arrow-native UDFs process data as vectorized columnar batches, eliminating serialization overhead and accelerating Python-based risk calculations.
The solution uses three separate AWS Glue 6.0 jobs, each independently scalable:
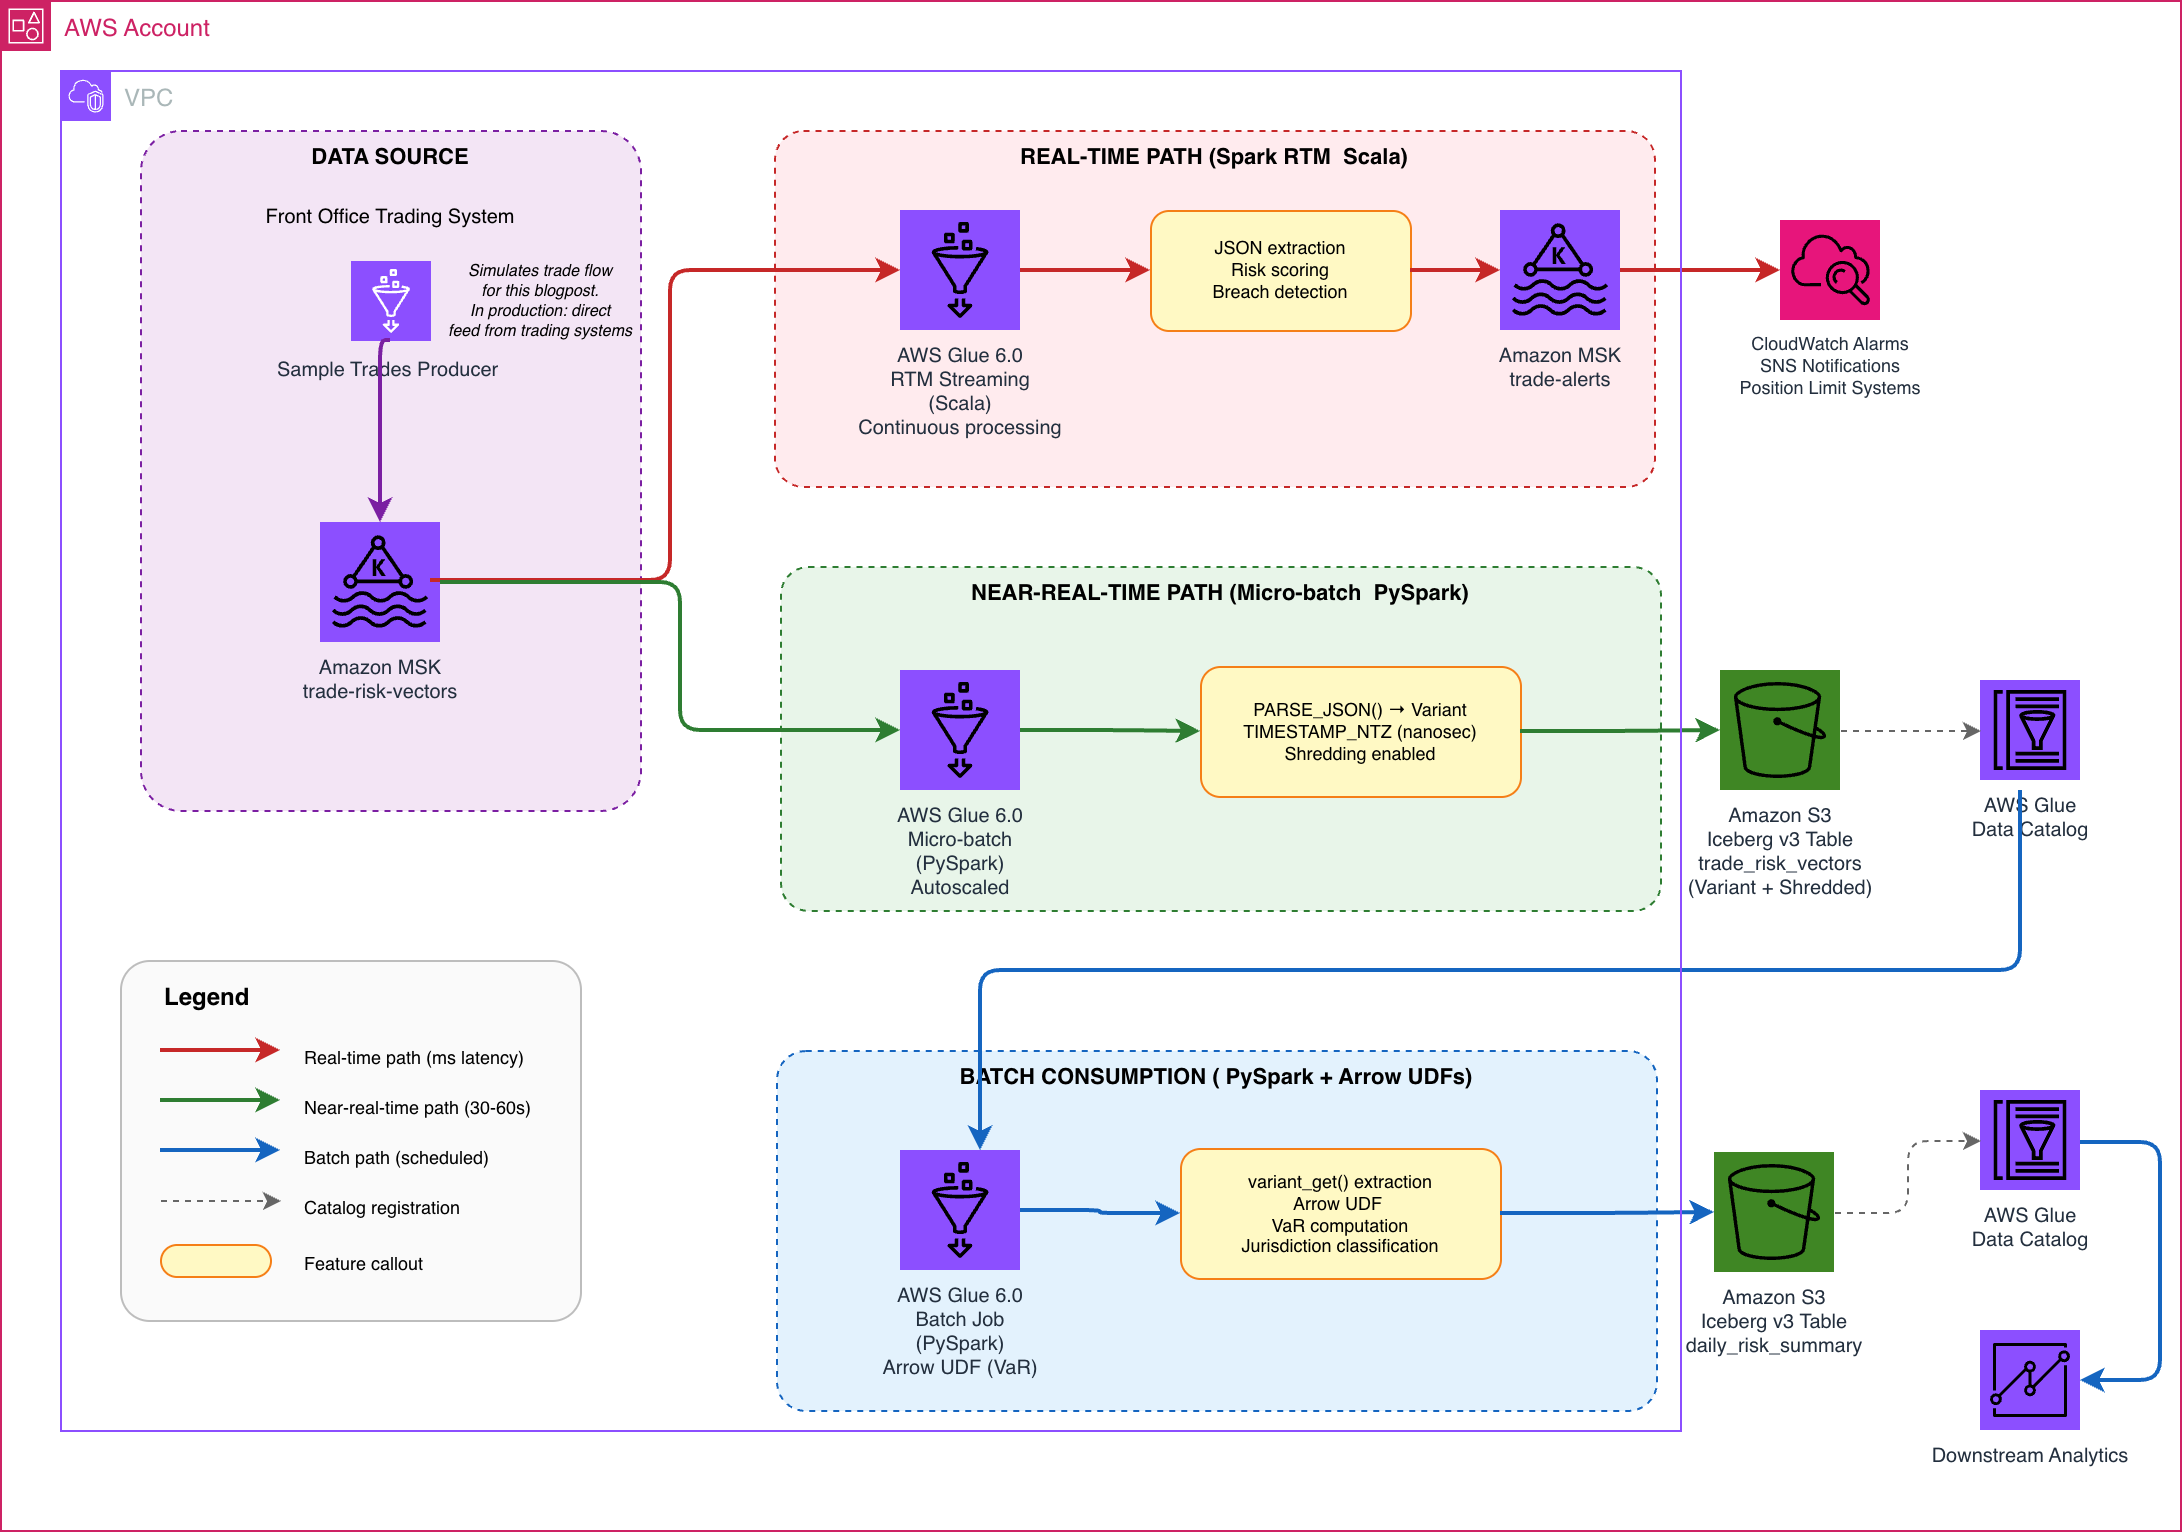
Real-time path (Scala, gluestreaming): Reads trades from Amazon Managed Streaming for Apache Kafka (Amazon MSK), enriches them with risk scores and breach flags, and writes alerts to a downstream Kafka topic. It runs with a fixed set of workers that are always on. Downstream fraud detection and position limit systems consume the alerts topic for real-time blocking decisions.
Near-real-time path (PySpark, gluestreaming): Reads from the same MSK topic and lands the full trade history into an Iceberg v3 table. It uses Glue auto scaling and can scale down between batches, keeping costs lower.
Batch analytics (PySpark, glueetl): Reads from the Iceberg v3 table, extracts fields using variant_get, computes VaR across the portfolio, and writes aggregated risk reports to a downstream summary table.
The following diagram illustrates the solution architecture.
Figure 1: Real-time market risk pipeline on AWS Glue 6.0
Prerequisites
To follow along with this post, you need the following:
An AWS account in a Region where AWS Glue 6.0 is available.
We provide an AWS CloudFormation template that provisions all the resources needed for this walkthrough.
The stack provisions the following resources:
An Amazon MSK cluster with two topics: trade-risk-vectors (input) and trade-alerts (real-time alerts output).
An Amazon S3 bucket for Iceberg table storage and streaming checkpoints.
An AWS Glue database (risk_analytics_<account-id>_glue6b1).
An IAM role (GlueRole-<account-id>-glue6b1) with permissions for Glue, MSK, S3, and CloudWatch.
Virtual private cloud (VPC) networking: A Glue network connection (connection-<account-id>-glue6b1), S3 gateway endpoint, and Glue interface endpoint.
AWS Glue job rtm-alerts-<account-id>-glue6b1 (Scala): This job reads trades from MSK, scores risk in real time using Spark RTM, writes alerts to the trade-alerts topic.
AWS Glue job nrt-ingestion-<account-id>-glue6b1 (PySpark): This job reads trades from MSK, writes to Iceberg v3 table with Variant + shredding enabled.
AWS Glue job batch-var-<account-id>-glue6b1 (PySpark): This job reads from Iceberg v3 table, computes VaR with Arrow UDF, demonstrates deletion vectors.
AWS Glue job producer-<account-id>-glue6b1-helper (PySpark): This job generates sample trade events (equities, FX, rates) to the trade-risk-vectors topic.
Choose Create stack > With new resources > Upload a template file, and upload the downloaded template.
Enter the following parameters:
VpcId: Your VPC ID.
SubnetIds: At least two subnets in different Availability Zones.
SecurityGroupId: A dedicated security group that allows all inbound TCP traffic from itself (self-referencing rule).
RouteTableId: The main route table for your VPC.
Acknowledge the IAM capabilities and choose Create stack.
Stack creation takes approximately 20 minutes.
After the stack completes, open the AWS Glue console and start the jobs in this order:
Start rtm-alerts-<account-id>-glue6b1 and nrt-ingestion-<account-id>-glue6b1.
Once both show RUNNING, start producer-<account-id>-glue6b1-helper.
After the producer finishes (~3.5 minutes), run batch-var-<account-id>-glue6b1 for risk aggregation.
The consumers must be running before the producer starts so that trades are scored in real time and landed in the Iceberg table as they arrive. The batch job runs last because it reads from the Iceberg table that the near-real-time path populates.
Understand the Iceberg v3 table design
The CloudFormation stack provisions Glue jobs that create two Iceberg v3 tables, trade_risk_vectors (primary trade store) and daily_risk_summary (batch VaR output), using new data types and features:
VARIANT: Stores semi-structured pricing vectors without requiring a fixed schema.
DEFAULT values: Automatically applies provided defaults when fields aren’t provided.
Deletion vectors (merge-on-read): Enables fast row-level updates and deletes.
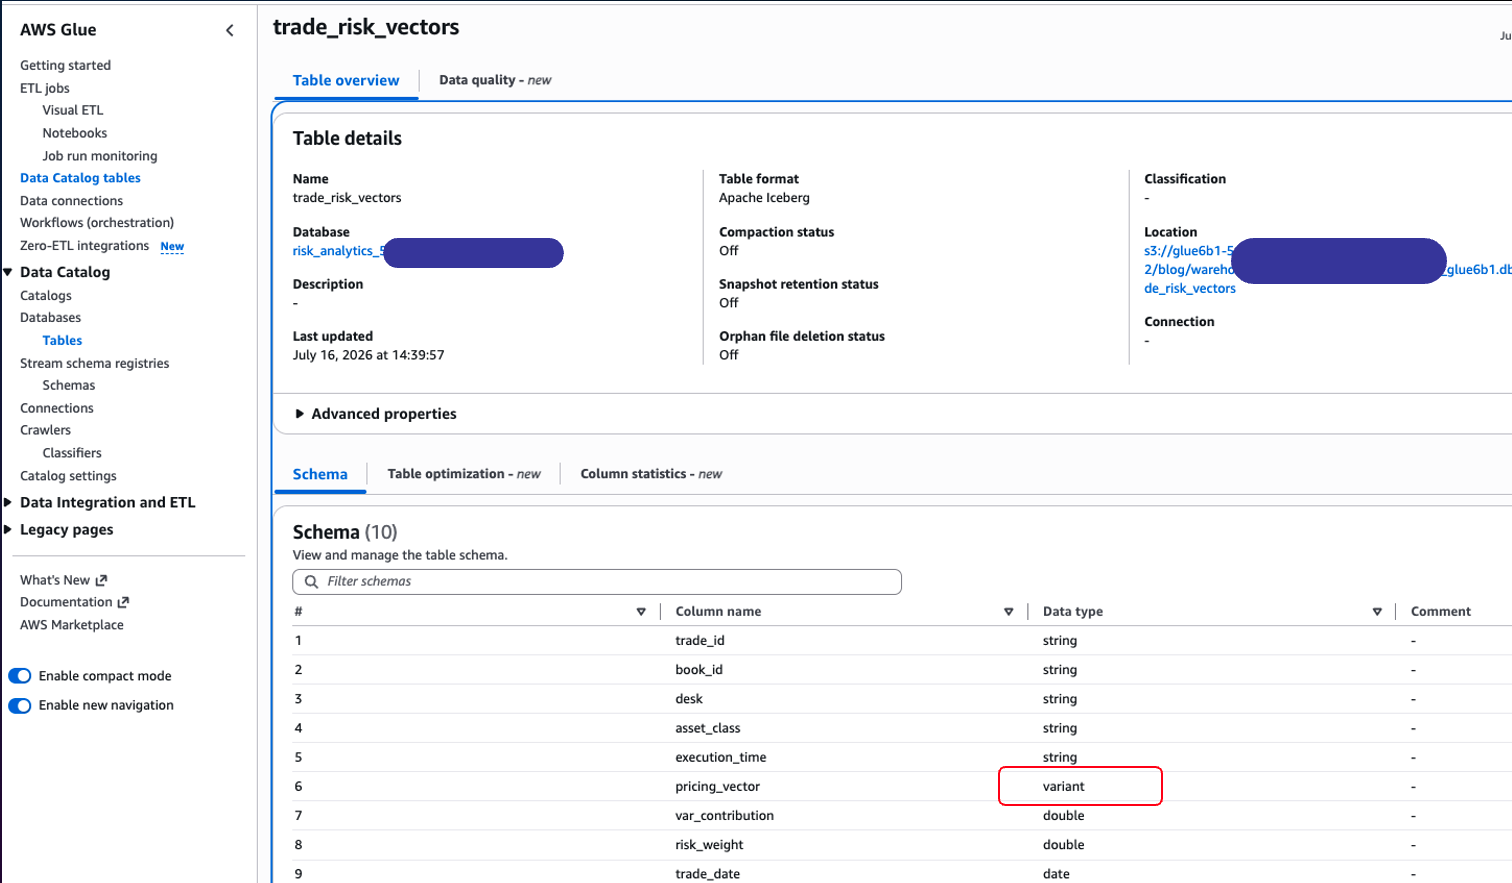
Open the AWS Glue console under Data Catalog > Tables > trade_risk_vectors.
Figure 2: The trade_risk_vectors table in the AWS Glue Data Catalog
Note the use of DEFAULT values for asset_class, var_contribution, risk_weight, and region. This is an Iceberg v3 feature that applies defaults automatically when values aren’t provided during writes, reducing boilerplate in ingestion code. The pricing_vector column is defined as a Variant type, and write.parquet.shred-variants='true' automatically extracts Variant fields into separate typed Parquet columns at write time for faster downstream queries.
Sample trade event generator
The CloudFormation stack includes a Glue job (producer-<accountid>-glue6b1-helper) that produces realistic trade events to the trade-risk-vectors MSK topic. Each event carries a pricing_vector with a completely different schema per asset class. This is exactly the problem Variant solves.
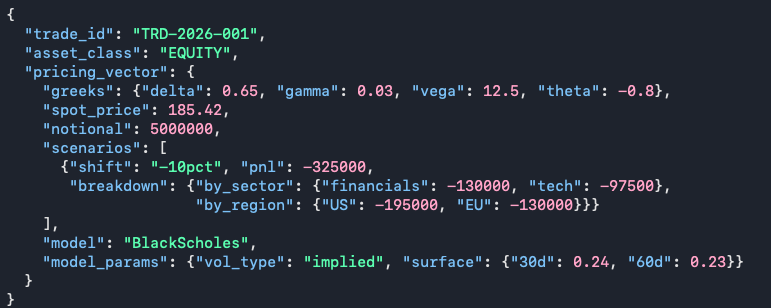
Equity trade (greeks, scenarios with sector/region breakdowns):
Figure 3: Sample equity trade pricing vector
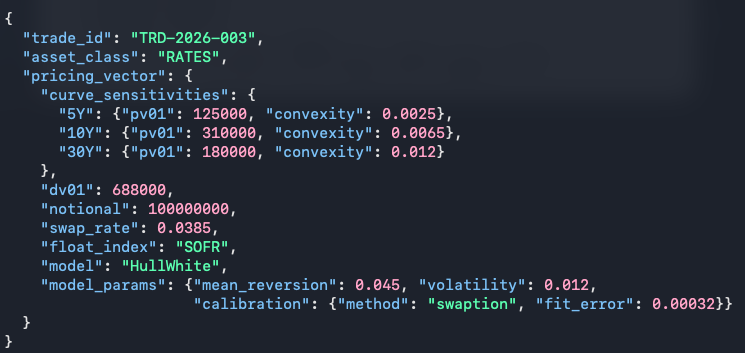
Rates trade (curve sensitivities per tenor, calibration params):
Figure 4: Sample rates trade pricing vector
Completely different structures: greeks vs curve sensitivities, BlackScholes vs HullWhite. Both land in the same pricing_vector VARIANT column with no schema changes required.
Ingest trades with Spark Real-Time Mode
Traditional Spark Structured Streaming uses micro-batches: collect records, schedule a job, process, commit, wait. Even with small batches, the fixed overhead of planning and scheduling adds noticeable latency per batch. For a risk team monitoring position limits, the delay can let a trade breach a limit before the system reacts.
The following Scala job reads trade events from Amazon MSK, applies lightweight risk rules based on data directly available in the event, and writes alerts to a Kafka topic, all with sub-second latency. The real-time path intentionally avoids external lookups (market data, volatility surfaces) to stay fast. The full VaR computation happens later in the batch layer where latency is less critical.
You can view the complete job code in the AWS Glue console under the rtm-alerts-<accountid>-glue6b1 job. Additionally, all the scripts are available in the GitHub repository.
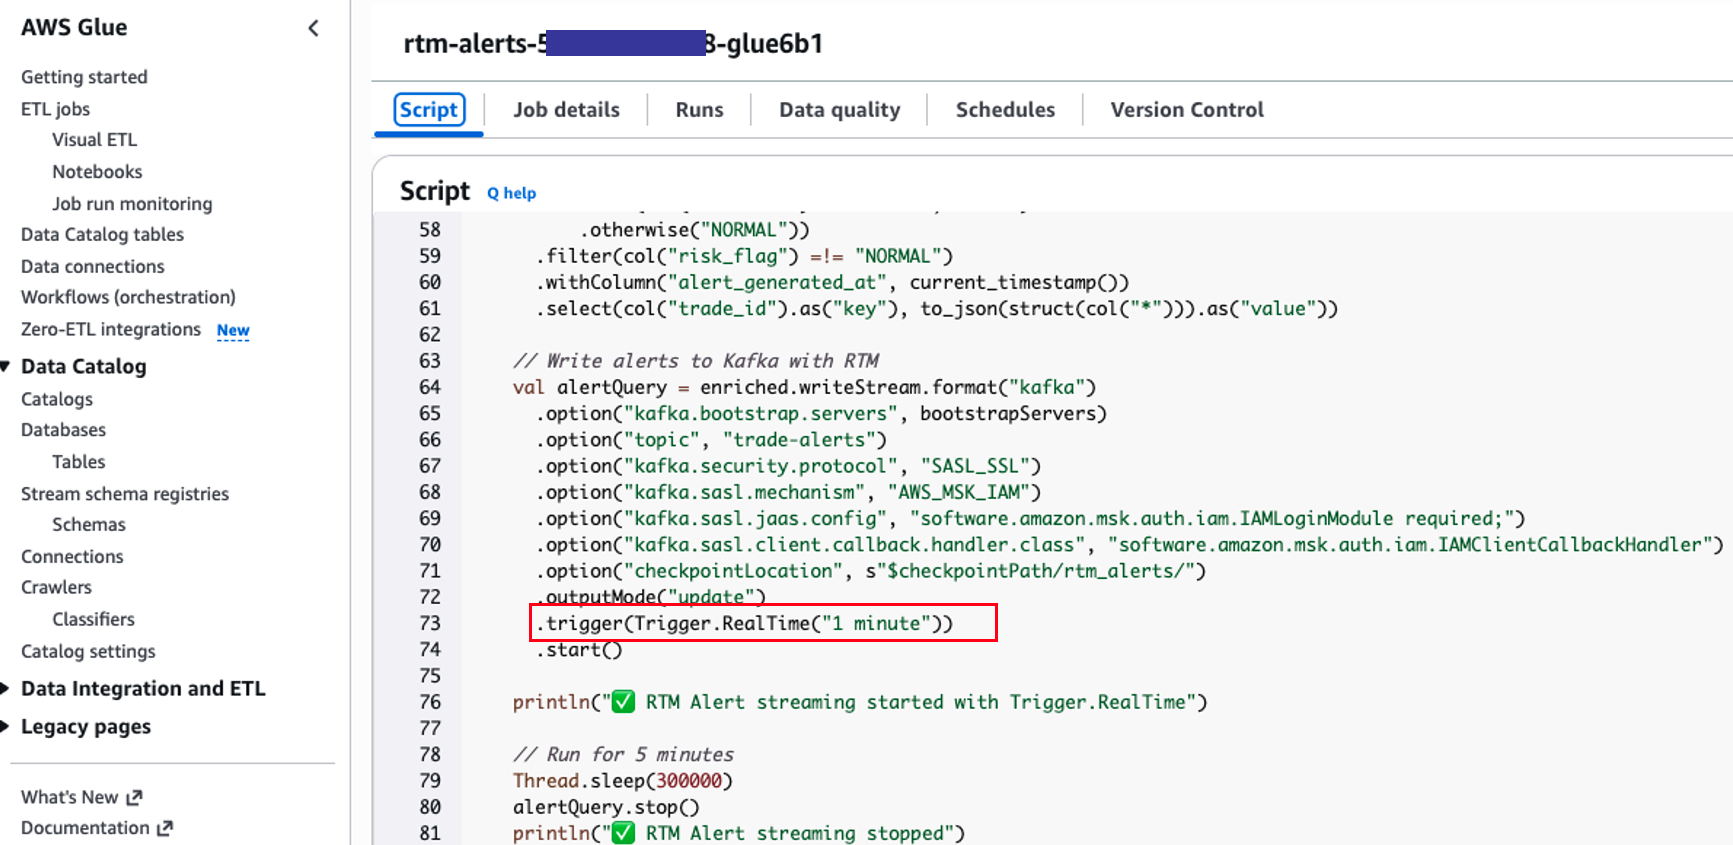
Figure 5: Scala real-time job that scores trades and writes alerts
The Trigger.RealTime("1 minute") is what distinguishes this from a traditional micro-batch. Records flow through the pipeline continuously. Records are processed the instant they arrive. The 1-minute parameter controls how often Spark checkpoints its progress for recovery. It does not control how often records are processed. RTM on AWS Glue 6.0 currently supports Kafka-source, stateless, Scala workloads with fixed workers (no auto scaling) and update output mode only. This makes it ideal for stateless transformations that require sub-second latency, such as the filter, enrich, score, and route pattern shown here. The heavier computation (VaR, aggregations) runs in the micro-batch/batch layer where sub-second latency is less critical.
The real-time path acts as a circuit breaker: trades over $50M notional are flagged CRITICAL, over $25M flagged HIGH. Downstream systems consume the trade-alerts topic and can block or escalate before the next trade executes. The detailed VaR computation (which requires market data, volatility surfaces, and the full pricing vector) runs in the batch consumption layer where latency is less sensitive.
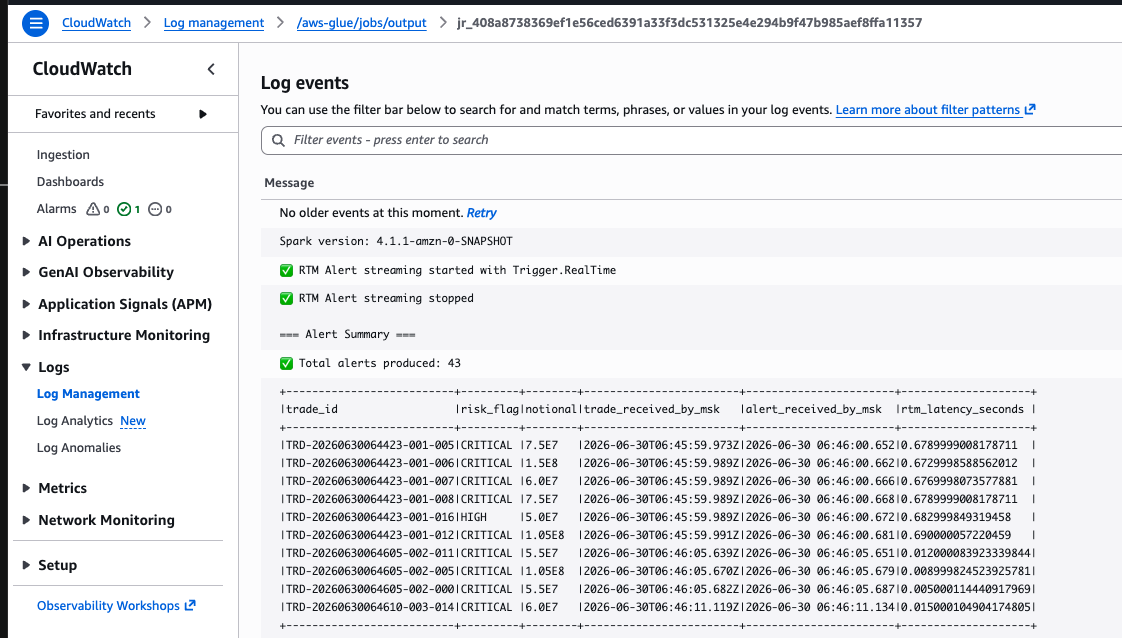
After the streaming phase completes, the job reads back from the trade-alerts topic and measures end-to-end latency. It compares two MSK timestamps: when the trade was received by MSK from the producer, and when the alert was received by MSK from RTM.
To verify the alerts and latency, open the Amazon CloudWatch console > Log groups > /aws-glue/jobs/output and select the RTM job’s log stream. You will see the alert summary showing each flagged trade with its end-to-end latency. The following is a sample.
Figure 6: CloudWatch output showing flagged trades and end-to-end latency
Store trades in Iceberg v3 with Variant shredding enabled
The near-real-time path reads from the same MSK topic but writes to an Iceberg v3 table using standard micro-batch streaming. This job runs separately with auto scaling enabled, scaling between batches, keeping costs lower than the always-on real-time path.
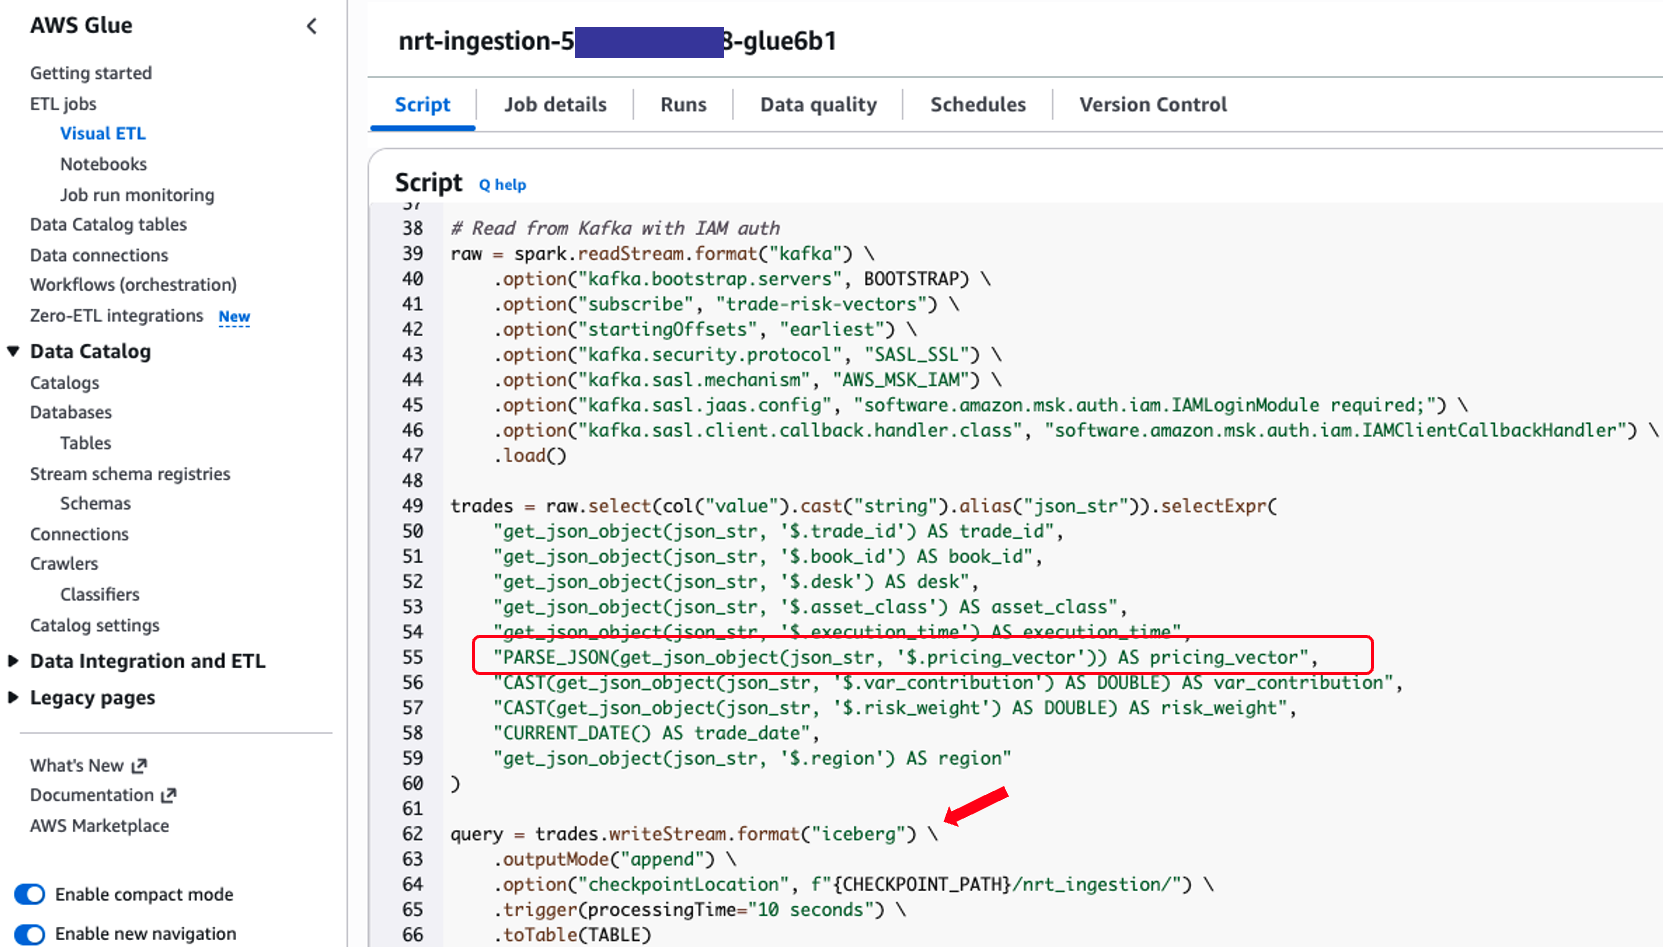
You can view the complete job code in the AWS Glue console under the nrt-ingestion-<accountId>-glue6b1 job. The critical aspects are the Variant conversion and the Iceberg write:
Figure 7: Near-real-time PySpark job writing trades to Iceberg v3 as a Variant
The PARSE_JSON() function converts the raw pricing vector into a native Variant, regardless of the asset class schema. Whether the incoming trade is an equity with greeks, an FX option with a volatility surface, or a rates swap with curve sensitivities, it all goes into the same column. Since the table has write.parquet.shred-variants enabled, fields observed in the initial sample are automatically extracted into typed Parquet columns for fast downstream queries.
How shredding works
During the write process, Spark automatically extracts the Variant fields it observes into separate typed Parquet columns at write time, a feature called shredding. At the start of each write, the engine buffers a sample of rows (controlled by write.parquet.variant-inference-buffer-size), infers which fields exist and their types, then uses that schema to shred all subsequent rows in the file. Every field observed in that sample gets its own typed column, including nested objects. Rows that lack a particular field simply store NULL in that shredded column. For our risk table, fields like $.greeks.delta, $.dv01, and $.model all live in their own typed Parquet columns, even if only one asset class carries a specific field. The result: faster read performance because queries access only the typed columns they need, skipping the rest of the document entirely. Shredding is transparent to queries. variant_get() calls work the same way whether the field is shredded or not. The query engine automatically routes to the shredded column when available, falling back to the binary Variant blob for fields that aren’t part of the inferred schema.
Note: Shredding adds write latency because the engine must infer the schema and write additional typed columns. In this pipeline, we enable shredding on the near-real-time path and absorb that cost, since the downstream read benefits (batch VaR, ad-hoc queries, audit) far outweigh the write penalty. For latency-sensitive pipelines where every millisecond on the write path matters, you can disable shredding on the streaming table and instead write shredded data in a separate batch job that reads from the unshredded table and inserts into a shredded copy. This approach trades architectural simplicity for lower ingestion latency.
Build the batch consumption layer
The third AWS Glue 6.0 job reads from the Iceberg v3 table, extracts risk metrics from the Variant column, computes VaR using an Arrow-native UDF, and writes aggregated results to a summary table.
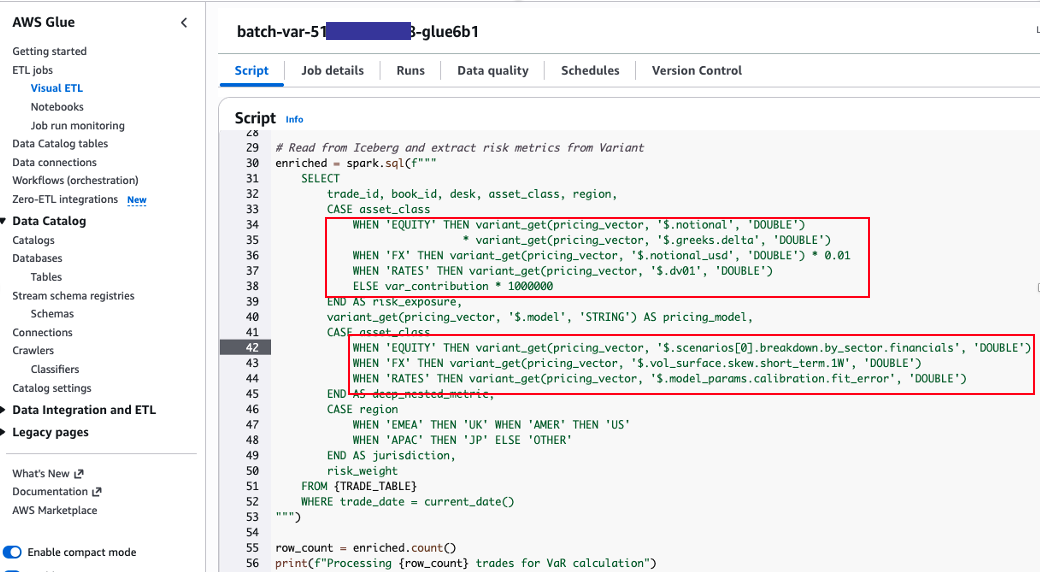
You can view the complete job code in the AWS Glue console under the batch-var-<accountid>-glue6b1 job. The key aspects are the variant_get extraction from deeply nested structures and the Arrow-native UDF:
Figure 8: Extracting nested Variant fields with variant_get
Notice how variant_get reaches into arbitrarily nested structures: $.greeks.delta (2 levels), $.scenarios[0].breakdown.by_sector.financials (5 levels), $.model_params.calibration.fit_error (4 levels). All with the same function call. No pre-flattening, no schema-per-asset-class tables, no ETL to restructure the data before querying.
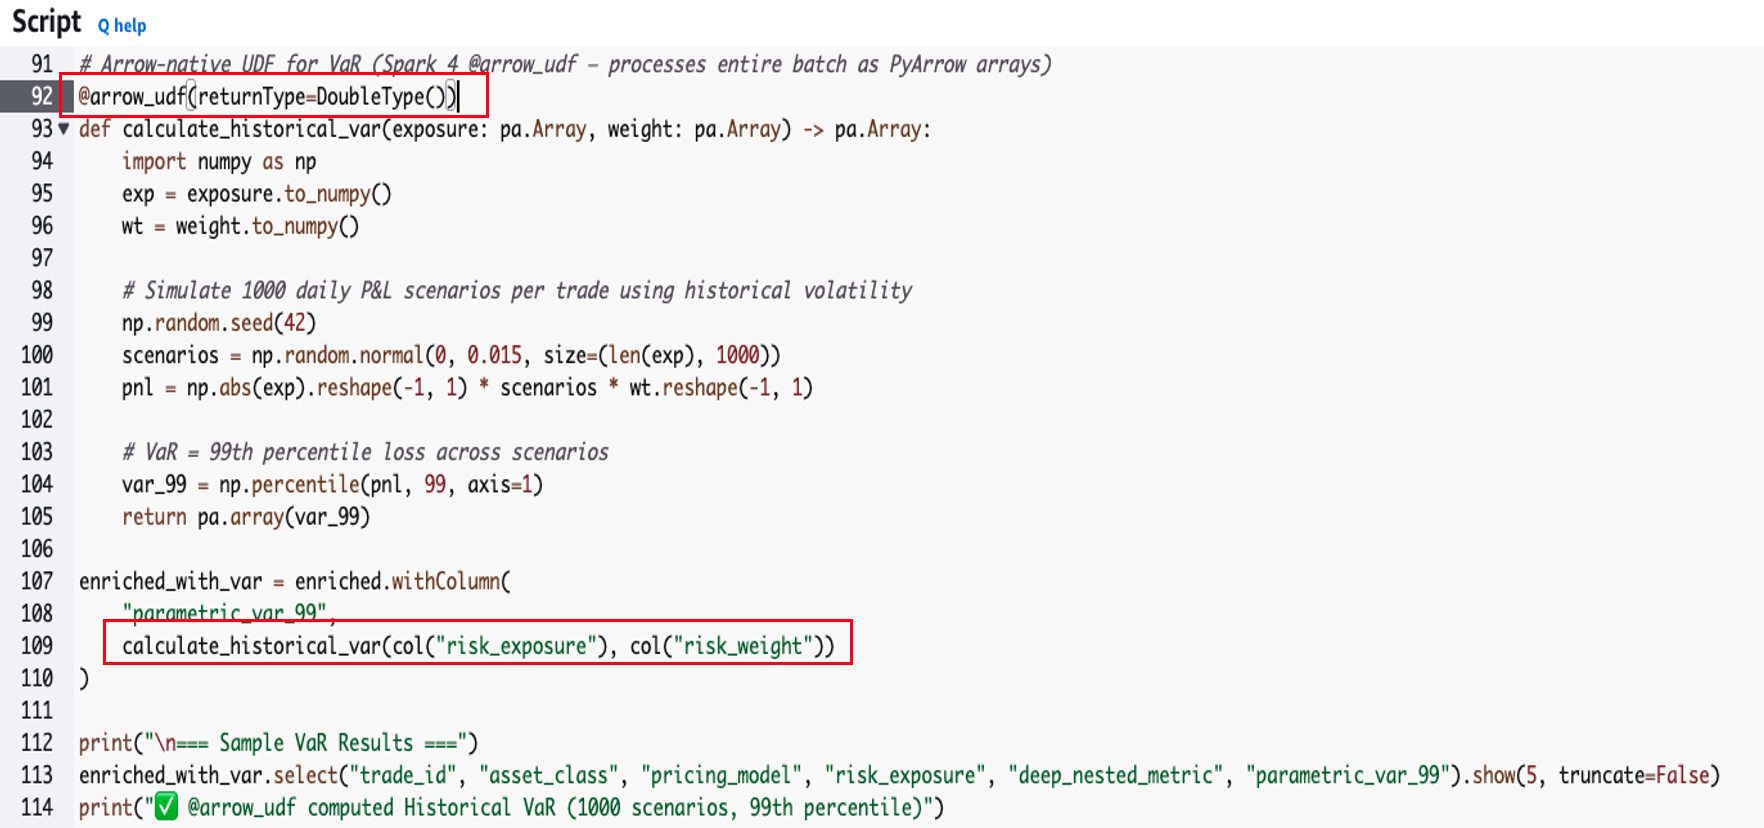
Once the risk metrics are extracted, we need to run a Monte Carlo-style Historical VaR that simulates 1,000 daily profit and loss (P&L) scenarios per trade and returns the 99th percentile loss. This is where the @arrow_udf decorator comes in.
Figure 9: Arrow-native UDF computing Historical VaR
The @arrow_udf decorator is new in Spark 4.1. Your function receives and returns pyarrow.Array directly, operating on the entire batch of rows at once. There is no pickle serialization, no row-by-row invocation, and no Pandas conversion. Data flows as native Arrow columnar arrays between the JVM and Python. For compute-heavy operations like VaR across hundreds of thousands of rows, this can be significantly faster than traditional scalar UDFs. Additionally, you can use the built-in UDF profilers to identify performance and memory bottlenecks in compute-heavy UDFs such as VaR calculations.
Handle late trade corrections with deletion vectors
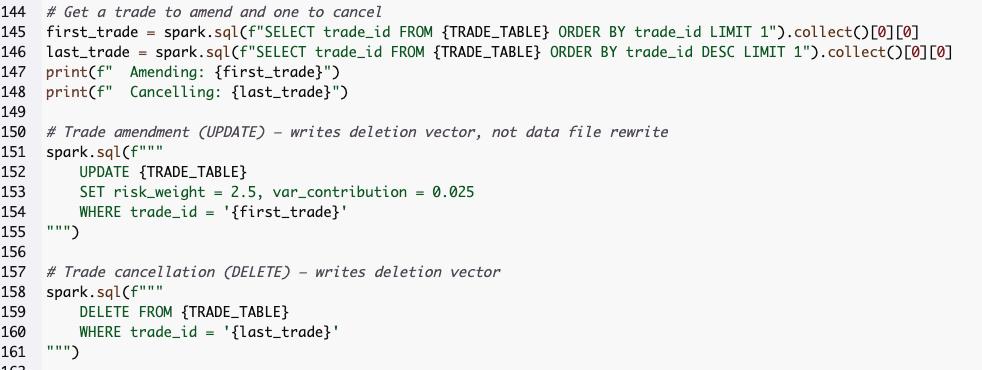
In financial markets, trade amendments and cancellations are common. The batch VaR job demonstrates this after completing the risk computation. It amends one trade and cancels another.
Figure 10: Amending and cancelling trades with merge-on-read
Prior to Iceberg v3, row-level deletes required either rewriting entire data files (copy-on-write) or maintaining separate positional delete files that store (file_path, row_position) pairs as Parquet rows (merge-on-read). Both approaches are expensive at scale. Copy-on-write rewrites gigabytes for a single amendment, and positional deletes degrade read performance as delete files accumulate (each read must parse and hash-join all delete records against the data file).
Because we configured the table with write.delete.mode='merge-on-read', UPDATEs and DELETEs write deletion vectors instead of positional delete files used in Iceberg v2. A deletion vector is a Roaring Bitmap stored in a Puffin file (.puffin), one per affected data file, marking which row positions are deleted. At read time, the engine loads a single bitmap and skips flagged positions with a bit check. No file joins, no linear scan through multiple delete files. The bitmap is compact regardless of how many rows are deleted, and read performance remains predictable as amendments accumulate.
The batch job also verifies the deletion vectors were created. You can see the results in the job’s output logs.
Figure 11: Output verifying deletion vectors were created
Clean up
To avoid incurring further charges, delete the CloudFormation stack. This removes all resources provisioned as part of this post, including the S3 bucket, Glue jobs, Iceberg tables, MSK cluster, and IAM roles.
Conclusion
In this post, we built a multi-layer market risk pipeline using AWS Glue 6.0 (real-time alerting, near-real-time ingestion, and batch analytics):
Spark Real-Time Mode (RTM) on the real-time path delivers sub-second trade scoring and breach alerting, eliminating the micro-batch boundary so position limits are enforced before the next trade executes.
Iceberg v3 Variant on the near-real-time path stores heterogeneous pricing vectors without schema flattening. One table handles equities, FX, and rates with different schemas per row.
Variant shredding delivers faster reads by automatically extracting fields into separate typed Parquet columns at write time with no manual tuning required.
Arrow-native UDFs eliminate pickle serialization overhead for Python-based risk calculations, processing data as vectorized columnar batches on the batch layer.
Deletion vectors handle trade amendments and cancellations without costly data file rewrites, using compact Roaring Bitmaps instead of accumulating positional delete files.
Default values reduce boilerplate in ingestion code.
Version
4.0 of the OpenShot video editor has been released.
OpenShot 4.0 has arrived, bringing some of the biggest creative workflow
upgrades in our history. You can now record your screen, webcam, microphone, and
system audio directly into a project. You can correct and grade footage with
color wheels, curves, LUTs, and professional video scopes. You can also isolate
subjects with locally run machine learning models and create everything from
animated audio visualizations to cinematic film looks.
The news that interested me the most last week was the DuckLabs acquisition. AWS has signed a definitive agreement to acquire DuckLabs, the Amsterdam-based company behind DuckDB, the popular open source analytical database that runs in-process and executes SQL directly against files like Parquet, CSV, and JSON. DuckDB stays open source under its independent foundation and the MIT license, and over time AWS plans to combine its speed at everyday queries with the enterprise scale of services like Amazon S3, Amazon Redshift, and Amazon Athena. Co-founded by Hannes Mühleisen and Mark Raasveldt, DuckDB runs locally or on Amazon S3, which makes it remarkably fast for the everyday queries (a terabyte or less) that make up the bulk of real-world analytics. It also happens to pair beautifully with AI agents, which “poke” and experiment their way through data much like humans do. The co-founders will continue leading its technical direction while AWS combines DuckDB’s speed with analytics services like Amazon EMR, AWS Glue, and Amazon SageMaker. For the bigger picture on why this matters, Andy Warfield, Vice President and Distinguished Engineer shared his thoughts on the post DuckDB and the changing physics of analytics on All Things Distributed.
Now, let’s get into this week’s AWS news…
Last week’s launches Here are some launches and updates from this past week that caught my attention:
Amazon ECS now automatically detects and recovers container instances that lose agent connectivity – Amazon ECS now continuously monitors agent connectivity to the control plane and surfaces a new AGENT_CONNECTIVITY health event across AWS Fargate, Amazon ECS Managed Instances, and Amazon ECS on EC2. On Fargate and Managed Instances, ECS handles recovery automatically, draining tasks, launching replacements, and deregistering the impaired instance. On EC2, you can wire the event into your own workflow. Available at no additional cost in all AWS Commercial and AWS GovCloud (US) Regions.
AWS Lambda introduces public preview runtimes, starting with Node.js 26 and Python 3.15 – You can now test upcoming Lambda runtimes before they reach general availability. Preview runtimes use the same identifier as the eventual GA version, so your functions graduate automatically with no action required. Third-party tools and deployment frameworks can also validate compatibility ahead of GA. Not meant for production yet (breaking changes are possible), but a great way to get ahead of your next upgrade. Available in all AWS commercial, AWS GovCloud (US), and China Regions.
AWS IoT Core adds a native InfluxDB rule action – You can now route time-series data from your IoT devices straight into InfluxDB (Amazon Timestream-managed or self-hosted) without writing custom code or standing up an intermediate service. IoT Core formats data into InfluxDB’s line protocol and supports device-side and server-side batching. Available in all AWS Regions where Amazon Timestream for InfluxDB is offered.
Amazon GameLift Servers now includes enhanced DDoS protection – Your game servers now get automatic protection against network and transport layer (layers 3 and 4) DDoS attacks – UDP reflection, SYN floods, and similar vectors – with nothing to enable or opt into. Built on top of AWS Shield Standard with gaming-optimized traffic shaping, it turns on the moment your servers start running (Server SDK 5) at no extra cost. It’s available in all supported GameLift Servers Regions except China (Beijing) and China (Ningxia).
Amazon SageMaker HyperPod expands support for Ray – You can now run Ray workloads on SageMaker HyperPod with built-in observability, resilient training, and accelerated inference. Create and manage Ray clusters from Amazon SageMaker Studio, attach JupyterLab or your local IDE so a multi-node cluster behaves like a local dev environment, and get auto-provisioned Grafana dashboards. Node auto recovery, hung job detection, and tiered checkpointing keep large training runs healthy, while Ray Serve adds a tiered KV cache for inference. Your existing open source Ray code runs unchanged. Available for HyperPod clusters orchestrated by Amazon EKS.
For a full list of AWS announcements, be sure to keep an eye on the What’s New with AWS page.
Other AWS news Here are some additional posts and resources that you might find interesting:
Happy 20th birthday, Amazon EC2! – Amazon EC2 turns 20. Channy Yun looks back at how EC2 grew from a single m1.small instance type in one Region to more than 1,200 instance types across 39 Regions, along with the custom silicon journey from the first Graviton to Graviton5 and Trainium3. A fun and worthwhile read on the service that still underpins so much of AWS – including Amazon ECS, Amazon EKS, AWS Lambda, Amazon SageMaker, and Amazon Bedrock.
Agentic Resource Discovery (ARD): an open specification for agent discovery – As organizations scale up agents, tools, and MCP servers, those resources end up scattered across clouds, on-premises infrastructure, and SaaS platforms – each with its own registry and metadata. ARD is a new open specification (Apache 2.0) that defines a common way to describe and discover agentic resources, so publishers “describe once” and consumers “discover everywhere” – think DNS, but for agents. AWS contributed feedback but doesn’t own the spec, and it complements the AWS Agent Registry by letting you federate across catalogs without migrating.
Get started with the Agent Toolkit for AWS in the AWS CLI – A single AWS CLI command (aws configure agent-toolkit) now equips AI coding agents like Kiro, Claude Code, Codex, and Cursor with curated, up-to-date AWS knowledge and a secure connection to thousands of AWS APIs through the AWS MCP Server. If you build with an AI coding assistant, this helps it choose the right services, use modern APIs, and follow security best practices – so it gets AWS code right more often the first time.
Upcoming AWS events Check your calendar and sign up for upcoming AWS events:
AWS Summits – Free in-person events where builders come together to learn, connect, and explore the latest in cloud and AI. Upcoming stops include Zurich (September 2), São Paulo (September 3), Tel Aviv (September 10), and Dubai (September 30). Can’t attend in person? You can stream sessions through the Global Livestream and On-Demand Hub. I’ll be presenting two sessions on generative AI and Amazon Bedrock at the São Paulo Summit – if you’re there, come say hello.
Join the AWS Builder Center to connect with builders, share solutions, and access content that supports your development. Browse here for upcoming AWS-led in-person and virtual events and developer-focused events.
That’s all for this week. Check back next Monday for another Weekly Roundup!
— Daniel Abib
This post is part of our Weekly Roundup series. Check back each week for a quick roundup of interesting news and announcements from AWS!
The Netdev 0x1A conference was
held in Rome, Italy from July 13 through July 16. Conference organizer
Jami Hadi Salim has let us know that the videos and slides for all sessions are now
available. Topics include Linux QUIC, shared memory socket transport, eBPF-based
DDoS protection, and more.
By the time Linus Torvalds released
7.3-rc1 and closed the merge window for this release, 15,267 non-merge
changesets had been pulled into the mainline repository. That is the
second-highest commit count for an -rc1 release in the kernel’s history;
only the 6.7-rc1 release, which included nearly 3,000 commits of bcachefs
history, had more. About 13,000 of those commits entered the mainline
after the first 7.3 merge-window summary
was written so, needless to say, there are a lot of changes to cover.
Modern bot threats are increasingly driven by determined, sophisticated attackers. Often it is not even one person, but a group trading techniques with each other or a commercial service sold to anyone willing to pay. For many of them, getting past bot detection is a full-time job they genuinely enjoy. Block them and they get to work, finding a workaround. AI has simplified this further, making it even easier to set up complex configurations for attackers, lowering the overhead of an attack.
This shift puts defenders at an economic disadvantage. Responding and adapting to new attacks takes care, evidence, and effort to ensure efforts to block attackers don’t impact real users on the way. Attackers have no such concerns and are primarily constrained by their time and their pool of proxies, and ensuring their infrastructure providers don’t shut down their accounts.
Their advantage is the cost of adaptation. Attackers can adapt as often and continuously as they need, while most defenses are deployed in discrete, managed releases. Cloudflare analyzes more than a trillion requests a day for signs of automated abuse, so we see how fast attackers change tactics. That gap in responsiveness is widening.
The inconvenient truth: bot detection across the industry often rests on a hopeful assumption that if you make the wall tall enough, attackers stay out. In reality, a determined attack always finds a way through. The question is not whether a determined attacker can get through. They will. The question is what happens when they do.
Today we are launching Adaptive Intelligence, a new bot detection engine that starts from the opposite idea. Rather than betting on a wall that keeps every attacker out, Adaptive Intelligence makes getting through so slow and costly that the attack stops being worth running.
We believe that no other bot detection works this way.
One attacker, many disguises
Not every attack is obvious to spot. The most sophisticated ones are built to disappear into ordinary traffic.
An attacker can spread requests across a large residential proxy network, keep the rate from each address low, and move patiently through a login, checkout, or account-recovery flow. Every request comes from a different address, often with a fresh user agent or a new bot fingerprint, so each one looks like a new visitor. No single source ever crosses a rate limit.
This is what makes the shape so hard to stop. Tighten the thresholds too far and real customers are turned away, which is the outcome you are trying hardest to avoid. The attack lives in the space between one request and the next, and a defense that studies each request on its own will never see it.
The flaw of deterministic detection
The challenge with rule-based systems is that they hand the attacker a stationary target. They iterate in days while the model waits months for its next update, so by the time it catches up, the tooling has already moved on.
Bot detection has always answered a new attack technique by writing a rule to catch it. That works, until the attacker studies the signal, learns how to circumvent it, and forces another rule to be written. Some of the most advanced attackers have even created tooling to semi-automate this process. The defender appears permanently disadvantaged.
This kind of detection is “deterministic”, meaning that the same input always produces the same output. A defense that never changes teaches the attacker how to beat it and indirectly drives bot operators to build more capable automated attacks. Against a deterministic defense, automated probes return a clean yes or no, and over enough attempts that feedback teaches an attacker exactly where the edges of the system are. The economics are in the attacker’s favor.
Changing the economics of attack
Adaptive Intelligence aims to reverse the economics and put them back in the defender's favor.
A defense that keeps changing flips that calculation, but only if two things are true at once. First, it has to cost the defender less to react than it costs the attacker to work around it. Second, attackers must be starved of the feedback they use to adapt, so they cannot simply learn their way back in. Get both right and the attacker's own loop turns against them: nothing they learned stays true, and each new attempt costs more than the last, until the attack is no longer worth running.
Part of that is giving an attacker less to learn from. Adaptive Intelligence can recognize a bot from a signal without visibly reacting to it, so the attacker keeps relying on a tell they do not realize we can see. And it treats detection as a statistical judgment rather than a fixed rule. That makes it non-deterministic. It weighs many signals at once, so there is no single piece of logic for an attacker to isolate and beat.
A new detection engine
Your bot score already comes from several detection methods working together: machine learning, behavioral validation, JavaScript fingerprinting, a library of heuristics, and checks that recognize known, verified bots like search crawlers.
Adaptive Intelligence is a brand new bot detection engine that sits behind bot score. Where every other system is built to keep attackers out by accumulating rules, Adaptive Intelligence is built with the assumption that attackers will eventually get in, and makes that attempt as costly as possible.
Below, we explain three components our Adaptive Intelligence detection engine will have, that are unique when compared to traditional models: improving itself, disposable rule generation, and learning from the traffic it protects. Launching today is its first component: the machine learning at the center of your bot score, now retraining continuously instead of shipping as a fixed version. It aggregates network signals from across Cloudflare's network and measures the probability of automated abuse for every request. Where a fixed model sits still, Adaptive Intelligence keeps moving. The second and third components explained below are soon to follow.
1. Improving itself
The engine retrains continuously on live traffic. As new bypass tools and bot frameworks appear, it learns from them and folds that knowledge into the model behind your bot score, without waiting for a scheduled release. A technique that shows up this week is one the engine can recognize this week. The score you already build on stays close to what attackers are actually doing, rather than drifting further from reality between updates.
2. Disposable rule generation
A disposable rule is a rule that we expect the attacker to adapt to, but doesn’t improve the attacker's bot in the process. Adaptive Intelligence is designed to create disposable rules aimed at a specific attack, deploy and retire them at random intervals, and never leave them in place long enough to become a fixed target. Because the rules keep appearing and vanishing, they inject noise into the very signal an attacker relies on to train against us, so an attacker never gets the steady yes-or-no that a static defense leaks. No single rule has to be perfect or unbeatable. It only has to last long enough to do its job, then make way for the next one. By the time an attacker has reverse-engineered a specific pattern, the engine has already moved on, rendering their engineering effort worthless.
3. Learning from the traffic it protects
Adaptive Intelligence will also learn from the patterns it sees across millions of sites. When a customer flags a real visitor we scored incorrectly, or our own measurement catches a miss, that correction becomes a training signal. Over time the engine tunes to the problems Cloudflare's customers are actually facing, so the protection you get reflects the current threat landscape instead of a snapshot of an older one.
How it works
Adaptive Intelligence runs in a loop: observe, train, deploy, validate. The range of signals it draws on keeps growing as we connect more of the network into it.
Cloudflare has run this kind of automated loop against DDoS attacks for years: sample traffic, TLS fingerprint the patterns behind an attack, push protections out across the network, and keep measuring so they can be adjusted or retired as the traffic changes. Bots are a harder version of the problem, because the signals are quieter and the story only shows up over time. Any one signal can look perfectly normal on its own. It is the relationships between them, and the company they keep, that reveal a bot hiding in normal traffic.
Adaptive Intelligence evaluates traffic over several time windows at once. A short window catches a sudden burst as it develops. A longer window reveals the behavior that repeats across thousands of addresses, clients, and sessions that have no reason to behave alike, and ties those scattered requests back to a single source. The same engine that spots an obvious scraping spike also surfaces a slow, distributed credential-stuffing attack sending only a handful of requests from each address.
Building new detections automatically
As the next parts of Adaptive Intelligence come online, mining systems will search recent, labeled traffic for combinations of signals that separate an emerging attack from real users.
Often, a useful detection comes from the relationship between signals we already know, rather than a signal we have never seen before. A client might claim to be one browser while producing the network or JavaScript signals of another. A request might look normal on its own but form an odd sequence alongside the rest of the session. Automated mining lets us test many of these combinations and turn the strongest into candidate detections.
These candidates are deliberately narrow. They do not need to catch every bot on the Internet, or even every request in the current attack. That makes them quick to build and easy to replace when an attack changes tactics.
It remembers
Attackers do not attack once. They pause, retool, and come back. Retiring a detection does not mean forgetting the pattern behind it. The engine keeps a memory of past attacks even after their detections stop firing, so an attacker cannot escape just by flipping between two profiles and betting the second one looks new.
That memory gives the system a head start when a familiar attack returns or a related one appears. A detection can expire when it stops earning its place, while the evidence behind it stays available to build the next one. Nothing piles up as stale rules in production, and the system never has to learn an old attack from scratch.
The result is one automated loop that can react to an obvious spike or quietly gather evidence on a patient, distributed attack that stays under traditional thresholds.
Deploying safely
Constant change only helps if every change is safe, and the bar is high. Customers can live with the occasional bot slipping through, but a real visitor wrongly turned away is the failure that actually costs. That is the worry that makes teams cautious about automatic updates, so a new detection has to earn its place before it affects anyone.
We test each candidate against recent real traffic and measure how much known automation it catches and how often it would flag a genuine visitor by mistake. It rolls out gradually as an input to your bot score while we watch score distributions, challenge outcomes, and customer feedback, and we can pause or roll it back before it reaches your whole network. Every update has to prove it is at least as good as the one it replaces, on the measures that matter for this kind of system, precision and recall among them.
One vision: Adaptive Intelligence and Precursor
This engine does not work alone. Last month we introduced Precursor, a continuous behavioral validation engine for bot management built with privacy in mind, which measures automated abuse based on how a visitor behaves once they reach the browser: the timing, the movement, the small human signals that automation struggles to fake. Precursor and Adaptive Intelligence were built as two parts of one idea to detect malicious automation. Precursor does so through measuring continuous session-behavior; Adaptive Intelligence learns from bot detection signals across the whole network, and the signals from one make the other harder to fool.
It also reflects how we think about the problem: the bot detection engine should shrink what gets through, and keep adapting faster than the attacker on the other side.
What's coming next
Continuous retraining is the foundation, and more of the engine comes online from here. We are expanding automatic detection generation for bots, connecting more of what Cloudflare sees across the network, the challenge, and the browser into a single view of a session, and giving you more ways to act on what the engine finds.
Knowing that no defense will keep every determined attacker out lets us aim for something more useful: making each attempt short-lived while costing the attacker more than it will ever return. Adaptive Intelligence reacts faster to new techniques, and gives attackers less to learn from each time it makes a change. The attacker who never quits now faces a defense that is different each time they return, so their persistence stops paying off.
Getting started
Enterprise customers should turn on "Auto Update Machine Learning" in the Bot Management dashboard. With it on, you get Adaptive Intelligence automatically, with no version to migrate and nothing to configure, and the bot score you already build on keeps working unchanged. If you are not sure it is enabled, check now so you are covered from day one.
Running workloads on Amazon Elastic Kubernetes Service (Amazon EKS) can involve managing failures like OOMKilled or IP exhaustion. Engineers must repeatedly collect pod logs, trace events, and check node logs—a process that slows at night/weekends, with critical data lost when pods are deleted or nodes become unhealthy. This collection phase is pure overhead on mean time to resolution (MTTR): the incident stays open while an engineer gathers data that a machine could have captured the moment the failure occurred. Automating it shortens MTTR and lets the on-call engineer start at the analysis step instead of the data-gathering step.
Existing AI tools have limitations: K8sGPT only analyzes current resource state, and Amazon Bedrock Agents requires manual tool integration and pipeline setup. Neither provides end-to-end automated incident investigation.
AWS DevOps Agent addresses these gaps—a frontier agent that connects code repositories, observability tools, CI/CD pipelines, and skills to autonomously analyze root causes. This post shows how to build an automated incident response pipeline using the DevOps Agent Operator, a Kubernetes Operator that detects EKS failures and triggers DevOps Agent investigations automatically.
Solution overview
AWS DevOps Agent provides powerful incident analysis. However, it does not detect pod failures inside an EKS cluster on its own. To start an investigation, an external source must trigger DevOps Agent through a webhook. When this trigger occurs, two conditions must be met:
Immediate failure detection: You must detect the failure before the pod is rescheduled or deleted.
Sufficient context: You must send the data that the analysis needs, such as the manifest, logs, events, and node information.
The DevOps Agent Operator is a Kubernetes Operator that meets both conditions automatically.
Why use an Operator?
DevOps Agent runs only when something calls it through a webhook or a manual trigger. In 24/7 operations, doing this manually is not practical. Kubernetes keeps events for only about an hour, restarted containers overwrite their logs, and deleted pods lose them entirely. If you do not collect data right after a failure, the key evidence is gone for good.
DevOps Agent can already run describe and logs with kubectl, and tools like Datadog can detect failures and trigger it.
A separate Operator still adds value for three reasons:
Proactive preservation of volatile data: The Operator detects state changes in milliseconds via watch and preserves data to S3/CloudWatch instantly—before external tool delays (metric collection, alert evaluation, webhook delivery) let evidence disappear.
Selective collection of node-level data: kubectl exposes only container-level and event data, but root causes often live deeper in the node—for example, OOMKilled traces to node dmesg, and IP exhaustion details are in IPAMD introspection. Because the Operator knows the real-time pod-to-node mapping, it collects only what each failure type needs from the exact node.
Encoding operational knowledge in code: The Operator pattern captures human expertise in code, applying different strategies per failure type—dmesg/memory for OOMKilled, previous logs/restart history for CrashLoopBackOff, IPAMD/ENI mappings for IP exhaustion—directly improving analysis accuracy.
In short, the Operator captures evidence at the failure site before it disappears and collects data beyond the reach of kubectl, giving DevOps Agent the best possible material to analyze.
Note: If data collection or an upload to Amazon S3 or CloudWatch Logs fails, the reconcile returns an error and the pod is requeued with exponential backoff rather than dropped, and throttled AWS API requests are retried automatically. The Operator also runs a single reconcile worker and marks each pod with a processed annotation, so a mass failure—for example, 100 replicas crashing at once—is handled one pod at a time and each pod is reported only once. For noisy clusters, WEBHOOK_MIN_SEVERITY and WEBHOOK_SKIP_CATEGORIES let you narrow which failures trigger an investigation.
Architecture
Figure 1. End-to-end flow from failure detection to investigation.
The preceding diagram shows the full flow. The DevOps Agent Operator detects a failure inside the EKS cluster and sends the context to AWS DevOps Agent.
Getting started
Prerequisites
Region availability: AWS DevOps Agent is available in six AWS Regions—US East (N. Virginia), US West (Oregon), Europe (Frankfurt), Europe (Ireland), Asia Pacific (Sydney), and Asia Pacific (Tokyo). Create your Agent Space in one of these Regions.
Node type: Node-level log collection uses AWS Systems Manager Run Command against the EC2 instance that ran the failed pod, so it requires Amazon EKS managed node groups or self-managed EC2 nodes. On AWS Fargate, the Operator still collects Kubernetes-level data—the pod manifest, events, and container logs—but node-level data such as dmesg output and IPAMD introspection is not available.
Systems Manager registration: Attach the AmazonSSMManagedInstanceCore policy to your node group’s IAM role so the nodes appear as managed nodes. Without it, node-level collection is skipped and only Kubernetes-level data is collected.
Setting up this solution involves two steps.
The first step is to configure the Agent Space for DevOps Agent. You connect the sources that DevOps Agent needs to analyze an incident, such as code repositories and observability tools. You also set up a generic webhook to receive failure information from the Operator.
The second step is to deploy the DevOps Agent Operator to the EKS cluster. When the Operator detects a pod failure, it collects the context and sends it automatically to the webhook that you set up in the first step.
After you complete these steps, you have an end-to-end pipeline. When a pod failure occurs, DevOps Agent starts an investigation automatically.
Step 1: Configure the Agent Space for DevOps Agent
Configure the webhook
DevOps Agent supports two types of webhooks:
Integration-specific webhooks: Created automatically when you set up an integration with an external solution, such as Slack or Datadog.
Generic webhooks: Created manually to trigger an investigation from sources that an external integration does not cover.
The DevOps Agent Operator uses a generic webhook. It maintains security through HMAC-SHA256 authentication.
For detailed setup instructions, see the following documentation. This post creates a generic webhook as an example.
You connect GitHub or GitLab so that DevOps Agent can track deployment events and correlate code changes with failures.
Register GitHub or GitLab at the AWS account level.
Connect the repositories that you want to monitor to the Agent Space.
With this connection, DevOps Agent can analyze the recent deployment history and code changes when a failure occurs. DevOps Agent currently supports GitHub and GitLab. For GitLab, you can use both the managed instance and a self-managed instance that is reachable from outside.
For detailed setup instructions, see the following documentation. This post uses GitHub as an example.
DevOps Agent joins your team’s existing communication channels to share its investigation activity. When you connect Slack, you can follow the full process in real time, from failure detection to completed analysis.
For detailed setup instructions, see the following documentation. This post uses Slack as an example.
Note: To keep this example readable, the policy allows ssm:SendCommand on EC2 instances in the account. In production, restrict it to your cluster’s nodes with an IAM condition key—for example, a StringEquals condition on ssm:resourceTag/eks:cluster-name in a statement that targets only the instance ARN—so that the Operator cannot run commands on unrelated instances. Keep the AWS-RunShellScript document ARN in a separate statement without the condition, because a document carries no instance tags and a single combined statement would deny the call.
Next, create the policy from this file.
aws iam create-policy \
    --policy-name devops-agent-operator-policy \
    --policy-document file://devops-agent-operator-permission.json
aws iam create-role \
    --role-name devops-agent-operator-role \
    --assume-role-policy-document file://devops-agent-operator-trust-policy.json

aws iam attach-role-policy --role-name devops-agent-operator-role --policy-arn=arn:aws:iam::<aws-account-id>:policy/devops-agent-operator-policy
1.4. Associate Pod Identity
EKS Pod Identity associates Kubernetes service accounts directly with IAM roles, enabling pods to access AWS services like Amazon CloudWatch under the principle of least privilege. For more information, see Learn how EKS Pod Identity grants pods access to AWS services.
Pod Identity requires the eks-pod-identity-agent add-on, which is not installed on existing clusters by default. If your cluster does not have it yet, add it first:
Because the Operator is a reference implementation, the sample provides source code only—no prebuilt container image. Build the image with the Dockerfile at the following location and push it to a registry that you control, which also keeps the image that runs in your cluster inside your own supply chain. Then use that image to deploy the Operator. Building the image locally requires Go 1.25 or later. The Operator is built against the Kubernetes 1.35 client libraries and uses only the core Pod, Node, and Event APIs.
The following steps are based on the example YAML files for the DevOps Agent Operator. Download the repository, or run the following command to download the files, and then continue.
Open the 05-deployment.yaml file, and then change the following variables to values that match your environment.
containers:
- name: manager
    # Use the image that you built in step 2
    image: <operator-image>:latest
    ...
    env:
    # Required settings
    - name: DEVOPS_AGENT_WEBHOOK_URL
        value: "<devops-agent-webhook-url>"
    ...
    - name: EKS_CLUSTER_NAME
        value: "<eks-cluster-name>"
    - name: AWS_REGION
        value: "<aws-region>"
    - name: AWS_ACCOUNT_ID
        value: "<aws-account-id>"
    # Optional settings
    - name: ENABLE_SSM_COLLECTION
        value: "true"
    - name: CLOUDWATCH_LOG_GROUP
        value: "<cloudwatch-log-group-name>"
Also change the 04-configmap.yaml file to values that match your environment.
data:
  # Comma-separated list of namespaces to watch (empty = all namespaces)
  WATCH_NAMESPACES: ""
  # Comma-separated list of namespaces to exclude
  EXCLUDE_NAMESPACES: "kube-system,kube-public,kube-node-lease"
  # Enable AWS SSM node log collection (requires IAM permissions)
  ENABLE_SSM_COLLECTION: "true"
  # AWS region for SSM and S3
  AWS_REGION: "<aws-region>"
  ...
In a shared or multi-tenant cluster, set WATCH_NAMESPACES to the namespaces that your team owns so that the Operator does not collect data from other teams’ workloads. If you leave it empty, the Operator watches every namespace except those listed in EXCLUDE_NAMESPACES.
Note: DevOps Agent references the collected data only while it investigates the incident, so you do not need to retain it long-term. Keeping a short retention period on the CloudWatch log group—and a matching S3 Lifecycle expiration rule on the bucket—keeps the storage cost of this solution minimal.
# Expire the incident logs in CloudWatch Logs after 14 days
aws logs put-retention-policy \
    --log-group-name <cloudwatch-log-group-name> \
    --retention-in-days 14

# Expire the incident objects in Amazon S3 after 14 days
aws s3api put-bucket-lifecycle-configuration \
    --bucket <s3-bucket-name> \
    --lifecycle-configuration '{"Rules":[{"ID":"expire-incident-data","Status":"Enabled","Filter":{"Prefix":"incidents/"},"Expiration":{"Days":14}}]}'
3.2. Create the webhook secret
Edit the 06-webhook-secret.yaml file:
stringData:
  webhook-secret: "<webhook-secret>"
3.3. Deploy the Kubernetes resources
kubectl apply -f .
The example deployment runs a single replica with leader election enabled, so you can raise the replica count for availability without two Operators processing the same failure.
3.4. Verify the deployment
# Check the pod status
kubectl get pods -n devops-agent-operator-system

# Check the logs
kubectl logs -f deployment/devops-agent-operator \
  -n devops-agent-operator-system
When the Operator works correctly, it produces the following logs:
Use case: Automated analysis of an OOMKilled failure
The following scenario shows how the DevOps Agent Operator and DevOps Agent work together. In this environment, Slack is connected as the notification channel for DevOps Agent, and GitHub is connected as the pipeline.
Scenario
In this scenario, a developer pushed a code change to add a new feature to the web-python service and built a new container image. The developer then updated the running web-python deployment in the EKS cluster with the newly built image.
After the new version rolled out successfully, the developer verified that other services were unaffected. Shortly after, a Slack notification arrived. DevOps Agent reported that the pod that was just deployed had terminated with an OOMKilled status, and that it was investigating the related incident.
kubectl get pods -o custom-columns='NAME:.metadata.name,READY:.status.containerStatuses[*].ready,STATUS:.status.phase,RESTARTS:.status.containerStatuses[*].restartCount,IMAGE:.spec.containers[*].image'
NAME READY STATUS RESTARTS IMAGE
web-python-56b9874b88-tdljd true Running 0 <your-registry>/web-python:sha-96cd2b0

# Deploy the new version
kubectl get pods -o custom-columns='NAME:.metadata.name,READY:.status.containerStatuses[*].ready,STATUS:.status.phase,RESTARTS:.status.containerStatuses[*].restartCount,IMAGE:.spec.containers[*].image'
NAME READY STATUS RESTARTS IMAGE
web-python-645b4f7867-lvqgr true Running 0 <your-registry>/web-python:sha-15d1398
The following steps describe what happens after the pod with the new image is deployed.
Step-by-step flow
1. Failure detection
The kubelet detects the OOM termination of the web-python container and updates the pod status. The informer in the DevOps Agent Operator receives this change in real time. It detects the change from the previous state (Running) to the current failure state (OOMKilled).
As soon as the Operator detects the failure, it collects Kubernetes-level data including pod manifests, pod logs, previous crash logs, and OOM-related event timelines.
3. Node-level data collection
It then gathers node-level data such as kubelet, containerd, and ipamd logs, disk/memory/network usage, and the kernel OOM killer log from dmesg output.
4. Data storage
Based on your configuration, the Operator stores the collected data in CloudWatch Logs and Amazon S3. DevOps Agent can reference the data in CloudWatch Logs during the investigation when it needs to.
5. DevOps Agent trigger
The Operator sends a webhook request that includes an HMAC-SHA256 signature to DevOps Agent. The payload includes investigation instructions for the AI agent.
The DevOps Agent Operator handles steps 1 through 5. You can also see these steps in the logs of the Operator pod.
# 1. Failure detection
2026-05-30T07:24:05Z INFO Failure detected {"controller": "pod", ... "pod": {"name":"web-python-645b4f7867-lvqgr","namespace":"default"}, "failureType": "OOMKilled", "container": "web-python", "exitCode": 137}

# 2-3. Data collection
2026-05-30T07:24:06Z INFO ssm-collector Collecting node logs via SSM {"node": "ip-192-168-1-10.ec2.internal", "instanceID": "i-0123456789abcdef0"}
...

# 4. Data storage
2026-05-30T07:24:08Z INFO cloudwatch CloudWatch Logs upload completed {"logGroup": "cw-log-group-devops-agent-operator", "logStream": "incidents/2026-05-30T07-24-05Z/default/web-python-645b4f7867-lvqgr", "eventsCount": 13}
...

# 5. DevOps Agent trigger
...
2026-05-30T07:24:08Z INFO webhook Webhook request with S3 reference successful {"incidentId": "2026-05-30T07-24-05Z/default/web-python-645b4f7867-lvqgr", "status": 200}
6-7. DevOps Agent Investigation
As DevOps Agent starts the investigation, it shares the incident and its investigation status in the Slack channel that you configured for communication. Through this notification, the engineer can open the Agent Space and follow the investigation in real time.
Figure 2. DevOps Agent announces the OOMKilled incident in Slack.
Skill-based investigation: DevOps Agent automatically selects the skill that matches the incident type. Following the OOMKilled skill, it systematically performs the steps to check the memory configuration, analyze usage patterns, and review the code change history.
Figure 3. The investigation timeline opens with the payload the Operator sent.
Correlation analysis: In addition to the troubleshooting data that it receives, DevOps Agent connects the following sources for its analysis:
GitHub: Checks recent code changes for memory-related modifications.
CloudWatch: Checks memory usage trends in Container Insights.
In this scenario, you can see that DevOps Agent starts its analysis from the data that the Operator uploaded to CloudWatch Logs, as the skill specifies.
Figure 4. DevOps Agent runs four investigation tasks in parallel.
Figure 5. DevOps Agent reads the manifest and application code from the connected repository.
The skill also specifies the relationship between the GitHub repository that you connected as a pipeline and the container image. DevOps Agent uses this information to review the code changes that occurred recently.
This information helps DevOps Agent identify the root cause of the incident.
Figure 6. Two findings: the unbounded list and the deployment that introduced it.
8. Analysis results
DevOps Agent organizes the analysis results:
Investigation Timeline: This tab shows the agent’s investigation steps—which skills it referenced and what data it analyzed. This view helps you optimize the skill to guide investigations more efficiently.
Root causes: This section summarizes the root cause from the overall investigation.
Unbounded `processed_records` list in web-python application causes memory leak at ~20Mi/min
The Python Flask application in image `<your-registry>/web-python:sha-15d1398` contains a background worker thread (`_cache_worker`) that generates 500 records every 2 seconds and appends processed results to an in-memory list called `processed_records`. Unlike the `cache` list which has eviction logic capped at 80MB (`CACHE_SIZE_MB`), the `processed_records` list has NO eviction or size limit — it grows unboundedly. With Python/Flask overhead (~30MB) + the cache growing toward its 80MB cap, the remaining headroom within the 200Mi container memory limit is exhausted in approximately 10 minutes. This was confirmed by two consecutive pod instances (lvqgr and 7rwdj) both being OOMKilled after exactly ~10 minutes of runtime.
With the investigation from DevOps Agent, the engineer can identify the cause of the problem.
In the preceding example, you can see how the agent identifies a critical memory leak in the recently changed service code. It then reasons about the cause of the OOM event together with the commit ID.
Figure 7. The Root cause tab with its supporting observations.
9. Analysis and mitigation plan through chat
The engineer reviews the results and, when needed, can ask DevOps Agent follow-up questions:
“Check whether other services show a similar memory growth pattern.”
“Will fixing it with approach A help solve the problem?”
In the following example, the engineer asks whether increasing the pod memory limit will help solve the problem. The agent responds based on its investigation.
Figure 8. Follow-up chat on whether a higher memory limit would help.
As this shows, DevOps Agent goes beyond simple problem analysis. It uses the context that it accumulated during the investigation to respond to the engineer’s follow-up questions with detailed explanations.
In this scenario, the problem is a logic issue in the source code. For that reason, DevOps Agent could not provide a clear plan at the Kubernetes or AWS infrastructure level. However, based on the root cause, you can receive a mitigation plan related to a rollback.
Figure 9. The Mitigation plan tab proposes a rollback.
Conclusion
In this post, we introduced the DevOps Agent Operator – a Kubernetes Operator that automatically detects EKS workload failures, collects diagnostic data, and triggers AWS DevOps Agent for root cause analysis.
By combining these two tools, engineers gain the following benefits:
Faster response: Automatic data collection and analysis as soon as a failure occurs, even during nights and weekends.
No loss of information: Immediate preservation of all troubleshooting data before a pod is rescheduled or deleted.
Comprehensive analysis: DevOps Agent analyzes code repositories, observability tools, and CI/CD pipelines together to trace root causes that are hard to find with a single tool.
Organizational knowledge: Through skills, the solution reflects your team’s operational knowledge, enabling incident response with consistent quality.
Continuous improvement: Proactive recommendations based on accumulated incident data help prevent future incidents.
Looking ahead, there are several ways to extend this solution:
Support for more resource types: Extend monitoring beyond pods to Job, CronJob, Deployment, and StatefulSet.
MCP server integration: DevOps Agent supports Model Context Protocol (MCP) servers, enabling advanced workflows such as querying additional resources during analysis or performing pattern analysis on past incidents.
Proactive pattern analysis: As incident data accumulates in Amazon S3 and CloudWatch Logs, DevOps Agent can identify recurring patterns – such as “OOMKilled repeats every Monday morning” – and recommend preventive measures.
The DevOps Agent Operator project is open source on GitHub. It is a reference implementation rather than a supported product: use it as a working example of how to encode your own detection conditions and collection strategy for the failures your team actually sees.
To try it yourself, clone the repository, follow the deployment steps in this post, and point the Operator at your own Agent Space webhook. Start with a non-production cluster and a narrow WATCH_NAMESPACES list, then widen the scope once you see the investigations that DevOps Agent produces.
To provide the best experiences, we use technologies like cookies to store and/or access device information. Consenting to these technologies will allow us to process data such as browsing behavior or unique IDs on this site. Not consenting or withdrawing consent, may adversely affect certain features and functions.
Functional
Always active
The technical storage or access is strictly necessary for the legitimate purpose of enabling the use of a specific service explicitly requested by the subscriber or user, or for the sole purpose of carrying out the transmission of a communication over an electronic communications network.
Preferences
The technical storage or access is necessary for the legitimate purpose of storing preferences that are not requested by the subscriber or user.
Statistics
The technical storage or access that is used exclusively for statistical purposes.The technical storage or access that is used exclusively for anonymous statistical purposes. Without a subpoena, voluntary compliance on the part of your Internet Service Provider, or additional records from a third party, information stored or retrieved for this purpose alone cannot usually be used to identify you.
Marketing
The technical storage or access is required to create user profiles to send advertising, or to track the user on a website or across several websites for similar marketing purposes.