Dell Pro Max 16 Plus Review A More Mobile NVIDIA RTX Pro 5000 Blackwell System

Post Syndicated from Ryan Smith original https://www.servethehome.com/dell-pro-max-16-plus-review-intel-nvidia-rtx-pro-5000-blackwell-system/

Sparing no expense, Dell’s flagship workstation laptop, the Pro Max 16 Plus, aims to deliver as much performance as is possible in a 16-inch laptop while still being modestly portable

The post Dell Pro Max 16 Plus Review A More Mobile NVIDIA RTX Pro 5000 Blackwell System appeared first on ServeTheHome.

Невзоров за възможна двойна употреба

Post Syndicated from Светла Енчева original https://www.toest.bg/nevzorov-za-vuzmozhna-dvoyna-upotreba/

Невзоров за възможна двойна употреба

Замисляли ли сте се как и държавата, и обществото проявяват склонност да не забелязват някои неща, които са толкова видими, че могат да ни извадят очите? В някакъв момент сякаш някой ни натиска копчето и дружно забелязваме. И започва масово чудене: къде са били институциите досега, къде е било обществото, къде са били медиите, къде сме гледали ние самите?

Край Варна в продължение на няколко години се строи незаконно селище от над 100 сгради.

Това се е случвало поне от 2023 г. – по времето на двама кметове (Иван Портних и Благомир Коцев) и на няколко правителства. Селището в защитената местност Баба Алино дори се е рекламирало преди три години. Но мащабът на беззаконието стана водеща тема едва в края на май 2026 г.

Междувременно в случая са замесени всевъзможни институции на различни нива, чиито представители твърдят, че не са направили нищо нередно. По-точно така се оправдават представителите на институциите, които си правят труда да кажат нещо по въпроса. Сред тях не е ДАНС, нито посланичката на Украйна, които също имат отношение към случая. Но нека караме поред.

Откъслечни знаци

Всъщност не е съвсем коректно да се твърди, че никой не е алармирал публично за незаконните строежи в Баба Алино. Затова е много интересно да се проследи избирателната пропускливост на чуваемостта.

Още към октомври 2023 г. Регионалната дирекция по горите и Държавното горско стопанство във Варна са разполагали със сигнал за незаконна сеч, във връзка с който извършват проверка и уведомяват прокуратурата. След това се подават още сигнали, образуват се и досъдебни производства.

През март 2025 г. тогавашният зам.-кмет на Варна Илия Коев (уволнен от Благомир Коцев на 9 юни 2026 г.) говори по БНТ за незаконната сеч в района и обещава Общината да предприеме мерки. Взета е и позиция на фирмата, която обещава, че всичко ще е законно. Нито Коев обаче, нито репортерът на БНТ споменават името на фирмата – КУБ, както и това на инвеститора Олег Невзоров. Не става дума също, че в района вече има построени сгради.

Абревиатурата КУБ се вкарва в публичното пространство от „Възраждане“

през септември 2025 г. – първо в заседание на парламентарната Комисия за контрол над службите за сигурност, а след това и месеци наред в заседания на Народното събрание. „Възраждане“ впрочем прикачва към фирмата на Невзоров квалификацията „престъпна украинска групировка“.

През октомври 2025 г. BIRD и журналистът от „Дневник“ Спас Спасов споменават Невзоров във връзка с ареста на Благомир Коцев, изразявайки предположението, че именно той е тайният свидетел срещу варненския кмет. И това е контекстът, в който е споменаван Невзоров в този период. Самият той отрича да е въпросният таен свидетел. Но няколко дни преди ареста на Коцев ДАНС издава заповед за изгонването на Невзоров от страната. Дни по-късно заповедта е оттеглена – поведение, твърде нетипично за тази институция, чиито решения не подлежат на никакъв контрол.

Таймингът

Накратко, какво се случва в Баба Алино и кой го извършва, е публично известно още през 2025 г. То обаче е тема най-вече на проруската партия „Възраждане“, която вижда подходящ повод да уличи „лошите“ украинци, а Невзоров се споменава основно в контекста на ареста на Благомир Коцев. Като изключим Спас Спасов, който още през октомври 2025 г. обръща внимание на незаконните строежи.

Иронично, за незаконното селище край Варна се заговори масово чак когато кметът Благомир Коцев реши най-сетне да даде гласност на случая. Това моментално беше използвано от правителството на „Прогресивна България“ срещу него.

Малко вероятно е Румен Радев чак сега да научава за незаконната дейност на фирмата на Невзоров – още повече че докато е заемал президентския пост, той е имал достъп до мистериозно отменения доклад на ДАНС. Ако беше използвал случая в предизборната кампания, това щеше да е удар срещу основните му политически конкуренти – ГЕРБ и ПП–ДБ, които не са направили нужното, за да спрат беззаконието. И срещу ДПС, което се оказва свързано с комай всяко крупно беззаконие.

Изобщо, в тази история като че няма невинни. Всеки по веригата е отговорен. Било с издаването на документи с невярно съдържание, било с бездействието си, било с недостатъчно решителните си действия.

Преди изборите обаче Радев се позиционира в максимално широк периметър, за да привлече повече избиратели. А освен срещу политическите му конкуренти,

случаят в Баба Алино може да се използва и срещу Украйна.

Защото незаконното строителство се извършва от фирма на украински бизнесмен, който на всичкото отгоре развива дейност и в организация, подкрепяща украинските бежанци. Участвал е в публични събития, на които е присъствала и посланичката на Украйна Олеся Илашчук.

В допълнение, вътрешният министър Иван Дерменджиев твърди, че Илашчук се е намесила във връзка със заповедта на ДАНС за екстрадирането на Невзоров. Как точно се е намесила, не е известно, но думите на Дерменджиев оставят впечатлението, че тя се е застъпила за Невзоров. Как посланик на чужда държава може да повлияе на решение на българските разузнавателни служби – също е неясно.

Незаконното селище в Баба Алино се превръща във водеща тема точно сега, когато правителството на Радев поема курс към промяна на геополитическата ориентация на България.

На първо време този курс е основно за вътрешна употреба и цели постепенна промяна на нагласите на обществото. Сред начините за постигане на тази промяна са нарочването на врагове и оправдаването на антидемократични режими.

Антидемократичен чеклист
Началото на края на демокрацията няма да бъде поставено с идващи танкове. Един вид, ако чакате „танковете да дойдат“, няма да стане. Ще има „по-малко пречки“, „повече ефективност“ и много заглушени теми. За червените лампички, които мигат, преди демокрацията да изгасне – от Светла Енчева.
Невзоров за възможна двойна употреба

В периода, в който публичното говорене в България е заето основно с Баба Алино, а много медии използват въведеното от „Възраждане“ клише „украинска групировка“, се случиха някои на пръв поглед несвързани събития, които обаче, взети заедно, създават обща картина към каква България се стреми новата власт.

На 1 юни беше възстановена Асамблеята „Знаме на мира“ – детски фестивал, създаден по идея на Людмила Живкова, дъщерята на социалистическия диктатор Тодор Живков. Днес фондацията, която организира Асамблеята, се ръководи от дъщерята на Людмила Живкова – Евгения. Както някога, така и днес фестивалът е не на последно място политическо събитие, демонстриращо определена геополитическа ориентация. А „мирът“ е „руският“. Чий да е, ако се изразим в стил „Радев“.

Седмица по-късно държавата се посвети на добрите си отношения с Китай. Президентката Илияна Йотова, премиерът Румен Радев и вицепремиерът Гълъб Донев поотделно проведоха срещи с Шън Ицин – държавната съветничка на Китайската народна република, и обещаха да задълбочат отношенията на България с азиатската социалистическа страна. Освен че произвежда голяма част от нещата, които се продават, и че се опитва да разшири влиянието си по света, Китай е държава, която системно нарушава човешките права, налага цензура и следи всяка крачка на гражданите си.

И ето, на 9 юни министърът на отбраната Димитър Стоянов заяви, че България вече няма да изпраща оръжия на Украйна. Дали действително ще престане, или ще изпраща под сурдинка, както и през 2022 г., когато бившата председателка на БСП Корнелия Нинова, по онова време министърка, уж не даваше, е друг въпрос. Важно е публичното послание – в момент, в който навсякъде се говори за „украински групировки“.

КУБ с двойно дъно

Една от основните характеристики на дискриминацията е вменяването на колективна вина. Макар повечето извършители на престъпления да са мъже, не се говори за „мъжка престъпност“, но когато ром наруши закона, това вече е „ромска престъпност“. И често общественият гняв се насочва срещу всички роми.

По същия начин незаконното селище в Баба Алино става повод да се вменява вина на всички украинци, за което допринасят и устойчивите клишета „украинска групировка“ и „престъпна украинска групировка“. А фактът, че Олег Невзоров е подпомагал украински бежанци, се използва за настройване на общественото мнение и срещу тях.

В тази ситуация е много важно и какво не се казва.

Когато се поставя знак за равенство между Невзоров, държавата му по произход и съгражданите му, обикновено се изпуска от поглед, че украинската държава разследва него и негови роднини за престъпления – заради строителни измами в Одеса, заради невърнати кредити, фалшифициране на документи и придобиване на оръжия с фалшив сертификат.

Публикация в „Капитал“ на Спас Спасов хвърля светлина и върху политическата ориентация на Невзоров. През 2020 г. той се е кандидатирал за кмет на Таировската община в Одеса от проруската партия „Победа Пальчевского“, която също е финансирал. Партията е кръстена на лидера си Андрей Палчевский. Той пък е свързан с друга проруска партия („Опозиционна платформа – За живот“), чиято лидерка Наталия Королевска понастоящем се издирва от украинските власти. Същата Королевска е свързана със сдружението United Women, научаваме пак от статия на Спас Спасов – от юли 2025 г. Сдружението, на което Невзоров е спонсор, хем помага на украински бежанки, хем членовете на управителния му съвет са с проруски възгледи.

От BIRD споменават и за данни за връзки с руските служби на сътрудника на Невзоров – грузинеца Джони Читадзе (депортиран от България заради заповедта на ДАНС, в която е бил включен и Невзоров, преди ДАНС да отмени мярката за него).

Как е възможно хем да си за Русия, хем да помагаш на бежанци от Украйна? Ами очевидно е възможно. Като в „Хлапето“ на Чарли Чаплин – детето чупи прозорци, героят на Чаплин ги поправя. Нападайки родината им, Русия прогонва милиони украинци, а после нейни хора се грижат за прогонените. И ги държат под око. Затворен цикъл. Ако нещо се обърка, то се пише на сметката на Украйна („престъпна украинска групировка“), а Русия остава чиста.

Помните ли българите, осъдени във Великобритания, защото са били руски шпиони? Процесът срещу тях не се превърна в атака срещу България, въпреки че двама от групата (Катрин Иванова и Бисер Джамбазов) са оказвали помощ на свои сънародници в Обединеното кралство. Разкритията не бяха използвани и като кампания срещу БСП, макар че Джамбазов е бил член на партията и че двамата са кръстили организацията си Българска социална платформа – БСП.

Ето как не фактите сами по себе си, а употребата им задава посоката на публичното говорене.

Остава послевкус на активно мероприятие.

Освен че се използва в контекста на геополитическата преориентация на България, казусът с незаконното селище в Баба Алино играе и друга роля. Той успешно отвлича общественото внимание от трагедията край Петрохан и Околчица (също използвана за политически цели), при която загинаха шестима души, между тях и дете, и въпросите около която продължават да са доста повече от отговорите.

Впрочем и в двата случая е намесена ДАНС, но не това е най-важното. По-важното е как общественото внимание може да бъде моделирано и насочвано. Как и институции, и медии, и общество (с незначителни изключения) години наред са слепи за нещо огромно. И изведнъж проглеждат, но точно по определен начин и в точно определена посока.

И така до следващото „откриване“ на нещо, което ще бъде използвано за поредното разчистване на сметки. И за отвличане на вниманието от нещо друго.

Заглавно изображение: Съвсем истински слон в стаята, който никой не вижда, защото всички са заети да пият чай. Сидни, Австралия, март 1939 г.

Пунктуацията на вметнатите части, между другото, никак не е между другото

Post Syndicated from original https://www.toest.bg/punktuatsiiata-na-vmetnatite-chasti-mezhdu-drugoto-nikak-ne-e-mezhdu-drugoto/

Пунктуацията на вметнатите части, между другото, никак не е  между другото

Случвало ли ви се е да започнете да пишете текст най-вече защото даден проблем ви занимава, имате някакво обяснение, но не и в детайли, и искате най-накрая да си ги изясните? На мен ми се случва почти всеки път, когато започвам статия за рубриката „Порция език“. Просто трябва на мен самата да ми е интересно да стигна до отговор, който не знам, да вникна във философията на нещата или пък да ги систематизирам в съзнанието си. Разбира се, надявам се това да е интересно и полезно и за читателите, след като е свързано с езика.

И така, от известно време ме занимава проблемът с вметнатите части в българския език и свързващите думи (linking words, connectors, linkers) в английския. Между тях има припокриване, но и доста разлики. А защо е необходимо да ги сравняваме, ще попитате вероятно. Причината е чисто практическа: пунктуацията им се подчинява на различни правила и наблюденията ми показват, че

често българските съответствия на английските свързващи думи (например освен това – moreover) се отделят погрешно със запетая от останалите думи в изречението.

Какво вмятаме и как свързваме?

В българската граматика като вметнати части се разглеждат думи и изрази, които не са същински части на простото изречение (подлог, сказуемо, допълнение и т.н.). Разделят се на две основни групи по своето значение. И тук започвам да се чудя дали изобщо да ви занимавам с това, защото то няма никакво, ама наистина никакво отношение към пунктуацията. Добре, да го направим за пълнота, а и заради още нещо.

Първата група включва вметнати части, с които изразяваме своето лично отношение към казаното, например: може би, вероятно, за съжаление, очевидно, наистина, всъщност, впрочем, естествено, разбира се, според мен.

Във втората група са думите и изразите, с които установяваме връзка с вече казаното, обобщаваме, изброяваме факти и противопоставяме, например: следователно; значи; общо взето; в крайна сметка; например; първо… второ… трето…; от една страна… от друга страна; напротив; обаче.

Логично е да си помислим, че вметнатите части от втората група са като английските свързващи думи, но не е точно така. Да речем, besides this и as a result са типични свързващи думи, обаче българските им съответствия освен това и в резултат (на това) не се третират като вметнати части. Примери има и за обратното, и то много: английските аналози на вметнатите части от първата група не са свързващи думи в класическия смисъл, макар че, ако сте учили езика и сте стигнали до ниво В2, в съответния урок сте срещнали поне personally и in my opinion за изразяване на мнение¹.

От какво зависи пунктуацията на вметнатите части?

Нашите вметнати части отново се разделят на две групи: едните се отделят със запетая (или с две запетаи, ако са в средата на изречението), а другите – не. Критерият е дали винаги се употребяват като вметнати части, или могат да функционират и като вметнати части, и като така добре познатите ни сказуемо, обстоятелствено пояснение, допълнение, определение. Звучи сложно и абстрактно, затова ще дам примери с надеждата да остане поне само сложно.

Тази работа изисква внимание и не може да се върши между другото.
Тази работа изисква внимание, между другото, и не може да се върши през пръсти.

В първото изречение между другото е същинска негова част – обстоятелствено пояснение (как да се върши?), а във второто съчетанието е употребено като вметната част (с нея сигнализираме, че вмъкваме, добавяме някаква информация). Ето защо тук отделяме между другото със запетаи – защото има изречения, в които може да не е вметната част.

Сред вметнатите части, които се пишат със запетая, има някои глаголи и изрази, съдържащи глаголи. Това е логично, защото глаголите могат да бъдат и сказуеми в изреченията. Когато обаче разбира се, значи, изглежда, моля, така да се каже, да речем, да кажем са вметнати части, ги отделяме със запетая. Ще дам примери с изглежда, защото много често запетаите се пропускат:

Целият свят изглежда полудял. (сказуемо)
Целият свят, изглежда, е полудял. (вметната част)

Към посочените вметнати части, които се отделят със запетая, следва да прибавим и следните по-често срещани: от една страна… от друга страна; първо… второ… трето; обратно; напротив; естествено; за съжаление; честно казано.

При другата група вметнати части не се употребява запетая. Просто не се налага, защото езикът като велик режисьор е отредил само една роля на тези посредствени актьори. Все пак и сред тях има по-известни: всъщност, впрочем, може би, наистина, според мен, обаче, например, действително, вероятно, по всяка вероятност, навярно, следователно, като че ли, сякаш, в крайна сметка. Ето два примера:

Вероятно някои вулкани не са угаснали, а само задрямали.
Постоянно говорим за изкуствения интелект, но какво знаем за него всъщност?

Къде са клопките?

1. Пунктуацията на английските свързващи думи няма нищо общо с пунктуацията на българските вметнати части. Обикновено те са в началото на изречението и след тях се поставя запетая.

In the end, the stronger team won the match.
Im my view, the government is not decisive enough.
Our company’s results are getting worse. Therefore, we need to make some changes.

Ако преведем изреченията, всички запетаи ще паднат, защото съответствията на свързващите думи могат да бъдат само вметнати части и нищо друго:

В крайна сметка по-силният отбор спечели мача.
Според мен правителството не е достатъчно решително.
Резултатите на нашата компания се влошават. Следователно трябва да направим промени.

2. Някои английски свързващи думи не се третират като вметнати части и съответно не се отделят със запетая в българските изречения. Такива са, да речем: furthermore, moreover, besides (this) – освен това; nevertheless – въпреки това; according to (source) – според (източник).

There was a massive traffic jam in the city this morning. Nevertheless, I managed to get to the meeting right on time.
Тази сутрин имаше голямо задръстване в града. Въпреки това успях да стигна навреме за срещата.

3. По-горе посочихме, че вметнати части като всъщност, впрочем, може би, вероятно, по всяка вероятност не се отделят със запетаи. В английския език обаче actually, by the way и in all probability се придружават от запетаи и в началото, и в средата, и в края на изречението².

Впрочем кога затваря фитнес залата?
By the way, when does the gym close?

4. Моля, обърнете специално внимание на думата обаче. Дори и да не сте толкова вещи в английската пунктуация, предполагам, знаете, че however e свързваща дума, която се огражда със запетаи. Българското обаче е вметната част, която не се отделя със запетаи. Усложняващо обстоятелство е, че обаче може да бъде и съюз – тогава пред него се пише запетая. Повече обяснения и примери за пунктуацията на думата може да намерите тук.

Къде са слабите места на правилата?

Естествено, ще си позволя да коментирам само двете основни правила за нашите вметнати части. Според мен е крайно нереалистично всеки път да се питаме дали могат да бъдат и същински части на изречението, или не могат, и да ги пишем съответно със или без запетая. Надали това е бил и замисълът на кодификатора. По-скоро се разчита, след като конкретните вметнати части са разделени на две и изброени, ние да проверяваме всяка дума или израз към коя група се числи (и евентуално да запомним пунктуацията на често употребяваните).

Това върши работа, но в българския език има и други вметнати части освен примерите, придружаващи правилата. Ето някои думи и изрази, над чиято пунктуация ние трябва да си блъскаме главата, ако искаме да ги употребим: несъмнено, безсъмнено, безспорно, явно, моля, с една дума/с две думи, в допълнение, за жалост, за щастие, за радост, по дяволите, в общи линии, като цяло, най-малкото. (Като написах по дяволите, осъзнах, че ругатните и псувните, общо взето, следва да са вметнати части в изречението, значи и там трябва да се замисляте, ако сте склонни да се изразявате нецензурно в писмен вид.)

Да вземем за пример изречението Несъмнено новото откритие ще намери приложение в практиката. Дали има изречение, в което несъмнено не е вметната част? Да, може направо да преобразуваме предишното: Приложението на новото откритие в практиката е несъмнено (несъмнено е част от съставно именно сказуемо). Следователно в първото изречение трябва да поставим запетая: Несъмнено, новото откритие ще намери приложение в практиката. Аз лично бих си я спестила, защото е неуместна. Ако преместим несъмнено в средата, запетаите ще бъдат още по-неуместни според мен, макар това със сигурност да е вметната част – показваме своята увереност в това, което казваме: Новото откритие, несъмнено, ще намери приложение в практиката.

Защо се получава така? Мисля, че вметнатите части, които се отделят със запетая (разбира се, напротив, за съжаление и др.), на практика се открояват от останалите думи в изречението и смислово, и интонационно – привличат логическото ударение, изговарят се с паузи, – а тези, които не изискват запетая (впрочем, може би, навярно и др.) се вписват по-плавно в потока на речта. По-скоро това са причините да употребяваме или не запетаи при различните вметнати части, а не синтактичният критерий, на който се крепят двете основни правила. Сега може би става ясно защо отделянето на несъмнено със запетаи изглежда неуместно, макар че теоретично е правилно – върху тази дума не се акцентира, когато произнасяме изречението.

Няма да премълча и нещо, което отдавна ми е като трън в очите: вметнатите части наистина и действително не се отделят със запетая, защото не могат да бъдат части на изречението. Напротив, могат и академичният тълковен речник посочва такива употреби, които се игнорират неясно защо. Ето ви един пример:

Иване, наистина ли ще се жениш? (В действителност ли имаш такова намерение, или са само слухове?)

Затова, когато думата е употребена като вметната част, запетая следва да се постави. Особено пък ако е придружена от съюза и:

И наистина, вчера Иван се ожени. (Потвърждавам, вярно е това, че Иван се е оженил.)

Допускам, че обяснението за това „недоглеждане“ може да е следното: много често е трудно да се определи кога думи като наистина и действително са употребени като вметнати части и кога – като същински части на изречението.³

Приключвайки тази статия, реших да преброя колко вметнати части съм употребила дотук. Оказаха се 18 (без примерите, разбира се; ето, станаха 19 с разбира се). Ако не знаех правилата за пунктуацията им, щях да допусна доста грешки. Вероятно и вие използвате немалко вметнати думи и изрази, когато пишете, а може и да се водите от пунктуацията на английския, ако той е работният ви език. Искаме или не, моделите в него ни влияят и това влияние няма да отслабва. Остава да наблюдаваме колко устойчиви ще се окажат българските езикови модели, в това число и пунктуационните.

1 В тази статия няма да навлизаме в детайли по отношение на английските свързващи думи (linking words), в които често се включват и дискурсни маркери (discourse markers) или пък термините се употребяват като взаимнозаменяеми. Целта ни е да наблегнем на разликите в пунктуационните модели в българския и английския език, затова даваме примери и с изрази, които не са linking words в тесния смисъл на това понятие, а също и с наречия, съответстващи на нашите вметнати части.

2 Изключение има за actually – в средата на изречението не се огражда със запетаи.

3 Аналогичен е примерът с напротив, но с обратен знак. Тази дума е посочена от кодификатора като вметната част, която се отделят със запетая, следователно има изречения, в които тя може да бъде същинска тяхна част. Колкото и да се опитвам, не мога да измисля такова изречение на съвременен книжовен български език.


Езикът може да е вкусен и извън блюдото – онзи, българският език, на който говорим от малки и на който около 24 май се кълнем в обич. А той в същността си е средство за общуване и за да ни служи добре, непрекъснато се променя. Да го погледнем в неговата динамика и да се опитаме да разберем какво става и защо, кои са движещите механизми и как те са свързани с обществените процеси. И тъй като задачата не е лека, ще го правим постепенно – на порции.

Larson: Are insecure code completions a vulnerability?

Post Syndicated from jzb original https://lwn.net/Articles/1077413/

Seth Larson, the Python Software Foundation’s security
developer-in-residence
, has written
about
the difficulty in classifying insecure code completion in
the PyCharm IDE using
its Full
Line code completion
plugin. Larson discovered that the plugin,
which uses a local “deep learning module” to offer code completions,
suggests code that would lead to severe vulnerabilities. He was unsure
whether it warranted a CVE or not, however:

I reported this behavior to JetBrains for “Full Line Code Completion” v253.29346.142
and clearly their support staff weren’t certain whether this defect
was a security vulnerability or not either. When I asked to
publish a blog post about this behavior after they confirmed
this report wasn’t a “direct security vulnerability” (which
I agree with) but then was asked not to publicize my report and referred to
PyCharm’s Coordinated Disclosure Policy
so… which is it? Security vulnerability or not?

I ended up waiting the 90 days anyway and I didn’t hear back with
any substantive update from the development team. I double-checked
again today using “Full Line Code Completion” v261.24374.152 and the
behavior is identical, suggesting the same insecure code for both
contexts.

This isn’t meant to be a specific dig at PyCharm or JetBrains, I
have no-doubt that examples like this exist in every code generation
model available.

Automated Threat Hunting: Turning Threat Intelligence into Executable Hunt Plans

Post Syndicated from Blake McDermott original https://www.rapid7.com/blog/post/ai-automated-threat-hunting-turns-threat-intelligence-into-executable-hunt-plans

Blake McDermott is Senior Threat Hunter at Rapid7.

Every week, threat hunt teams are faced with a steady flow of blogs, advisories, and DFIR reports containing valuable intelligence about adversary behaviors, tactics, techniques, and procedures. The challenge is turning that intelligence into repeatable, behavior-based hunting logic quickly enough to be useful. Indicators of compromise still have value, but they age quickly. Behavioral detections give defenders a better way to look for how attackers operate, rather than relying only on what they leave behind.

To help solve this, Rapid7’s Internal Security team built an automated threat hunting pipeline that transforms threat intelligence reporting into structured, executable hunt plans. The pipeline uses large language models to extract adversary behaviors, map them to MITRE ATT&CK techniques, generate detection queries across multiple tools, and support analyst-ready briefings in minutes rather than days.

Why manual threat hunting does not scale

A single threat intelligence report can describe dozens of adversary behaviors across multiple ATT&CK techniques. Translating that report into useful hunt logic often requires an analyst to read the full source, identify relevant behaviors, map them to ATT&CK, write queries for each security tool, validate syntax, execute searches, and triage the results.

For a report covering 40 to 50 techniques, that process can consume much of a working week. When multiple high-quality reports land at once, manual hunting quickly becomes unsustainable. The goal of this project was to reduce the mechanical work involved in building hunt plans, while keeping analysts in control of validation, interpretation, and decision-making.

How the automated threat hunting pipeline works

The pipeline runs in four stages, each designed to be inspectable, repeatable, and easy for analysts to refine over time.

Stage 1: Threat intelligence ingestion

The pipeline accepts a threat intelligence blog or report via URL or pasted text. It extracts the core article body, removes navigation and boilerplate content, and validates the material to ensure there is enough substance for analysis. This creates a clean input for the model and reduces the risk of irrelevant page content influencing the output.

Stage 2: ATT&CK technique extraction

The cleaned content is then sent to a large language model with a structured prompt that instructs it to act as a MITRE ATT&CK analyst. The model identifies adversary techniques referenced in the report and returns each one with its technique ID, technique name, tactic category, and a short summary of how the threat actor used it.

The prompt is tuned to focus on offensive behaviors and adversary tradecraft. Defensive recommendations, control guidance, and mitigation strategies are excluded from this specific workflow so the output reflects what the attacker did, rather than what defenders should implement in response. That focus helps preserve the hunting value of the source material while leaving room for separate workflows that generate defensive recommendations or control improvements.

For example, when applied to a Rapid7 threat research report on BPFdoor activity in telecom networks, the pipeline identified 16 techniques across seven ATT&CK tactics, including Initial Access, Persistence, Defense Evasion, Credential Access, Collection, Command and Control, and Execution. That structured extraction became the foundation for a hunt plan with detection coverage across InsightIDR, Velociraptor, and Sigma, giving analysts a faster path from source intelligence to behavior-based hunting logic.

Stage 3: Detection query generation

For each identified technique, the pipeline generates detection content across several tools and formats. This includes LEQL queries for InsightIDR, targeting activity such as process execution, authentication events, network connections, and file modifications. It also includes Velociraptor VQL queries and artifact recommendations for live host interrogation, Sigma rules that can be shared across teams or converted into other SIEM formats, and YARA rules where relevant.

Every generated query is reviewed by an analyst before use. LLMs can accelerate drafting and reduce repetitive work, but analyst validation remains essential for accuracy, syntax, and operational fit.

Stage 4: Hunt plan assembly

The pipeline assembles a structured markdown hunt plan organized by ATT&CK tactic. Each report includes an executive summary, an IOC sweep section when indicators are present, and a behavioral hunting section containing generated queries in fenced code blocks with clear explanations of what each query is designed to detect. This gives analysts a consistent output they can inspect, edit, execute, and reuse.

Building a reusable detection query library

A key design decision was the introduction of a persistent query cache. Each technique’s generated queries are saved as standalone markdown files, creating a growing library of reusable detection content.

This cache reduces cost and execution time because techniques seen in previous reports can be loaded from the library rather than regenerated. It also creates a practical feedback loop: analysts can correct, tune, and improve cached queries over time, and those improvements persist across future hunt plans.

By tracking which reports and campaigns reference each technique, the team can build an organic view of recurring adversary behavior and identify which techniques appear across multiple actors or campaigns. Over time, this helps narrow the focus to behaviors most relevant to the environment, providing useful context.

Executing hunts and analyzing results

Once a hunt plan has been reviewed and validated, a separate process executes approved queries against InsightIDR. Results are then parsed and summarized into a briefing that highlights which queries returned results, why those results may matter, which findings may require immediate investigation, and how the activity relates to the threat actor’s known tradecraft.

Analysts can then ask follow-up questions conversationally, such as which findings should be prioritized, which hosts or users require deeper review, or how results should be interpreted based on risk.

Velociraptor queries are still executed manually because of the level of access involved. Given the potential impact of live host interrogation, the team made the deliberate decision to keep that execution under direct analyst control.

Practical use cases for automated threat hunting

The pipeline has already proven useful across several hunting scenarios: For advanced threat actor reporting, it can process DFIR reports and APT advisories to quickly determine whether known tradecraft appears in the environment. For insider threat hunting, it can be adapted to focus on data movement, anomalous access patterns, staging, and exfiltration behaviors. For security hardening, it can process reports about common persistence mechanisms and misconfigurations to validate whether the environment is exposed to known attack paths.

Across each use case, the value comes from shortening the path between intelligence and action.

Automating the repetitive work, not the expertise

By automating the repetitive work of reading reports, mapping techniques, and drafting queries, analysts can spend more time interpreting results, understanding context, and making decisions. The pipeline turns a daily flood of threat intelligence into structured, queryable, and continuously improving detection content. What previously required hours or days of manual effort can now be completed in minutes, while the underlying library compounds in value with every report processed.

Choosing the right workflow orchestration service for your use case: Amazon MWAA and AWS Step Functions

Post Syndicated from Rajkumar Raghuwanshi original https://aws.amazon.com/blogs/big-data/choosing-the-right-workflow-orchestration-service-for-your-use-case-amazon-mwaa-and-aws-step-functions/

Whether you’re processing financial data, managing e-commerce orders, or training machine learning (ML) models, efficiently coordinating complex processes is essential. Amazon Web Services (AWS) offers two services for workflow orchestration: Amazon Managed Workflows for Apache Airflow (Amazon MWAA) and AWS Step Functions.

This post explores how to select the right workflow orchestration service based on your specific use case requirements. We’ll examine key workflow characteristics, present real-world scenarios, and provide practical guidance to help you make an informed decision for your particular needs.

Understanding workflow orchestration requirements

Before exploring specific services, consider the key dimensions that influence workflow orchestration needs:

  • Data statefulness: Does your workflow process independent units of work (stateless) or create dependencies where each step modifies data from previous steps (stateful)?
  • Execution duration: Are your workflows short-lived (seconds to minutes) or long-running (hours to days)?
  • Scheduling requirements: Do you need built-in time-based execution or rely primarily on event triggers?
  • Recovery capabilities: How critical is the ability to restart from specific failure points rather than reprocessing entirely?
  • Integration complexity: What systems, services, and data sources need to be coordinated?
  • Security and access control: Do you need fine-grained permissions for different workflow components?

Let’s explore how these requirements map to real-world use cases and the appropriate orchestration solutions.

Use case: Enterprise data analytics pipeline

This scenario illustrates how Amazon MWAA handles complex, stateful data pipelines with built-in scheduling and granular recovery.

Business challenge

A global financial services company processes massive volumes of transaction data daily, requiring sophisticated data analytics capabilities. Their requirements include:

  • Designed to process 5-10 TB of financial transaction data daily
  • Running complex extract, transform, and load (ETL) jobs with multiple transformation stages
  • Generating regulatory reports for compliance use cases
  • Supporting both scheduled batch processing and event-driven workflows
  • Capable of handling long-running jobs that can take up to 12 hours
  • Ensuring data consistency and integrity throughout the pipeline

Workflow characteristics

  • Data statefulness: Highly stateful workflows where each processing step modifies transaction data, creating dependencies throughout the pipeline
  • Execution duration: Supports long-running processes extending 2-12 hours
  • Scheduling needs: Mixed time-based and event-driven patterns
  • Recovery requirements: Critical ability to resume from specific failure points
  • Integration complexity: Orchestrates multiple AWS services and external systems

Solution: Amazon Managed Workflows for Apache Airflow (Amazon MWAA)

For this enterprise data analytics scenario, Amazon MWAA provides capabilities that align well with these requirements:

Stateful workflow management

MWAA excels at managing complex, stateful data pipelines where data consistency is critical. When processing terabytes of financial data, MWAA’s ability to resume from the last successful checkpoint helps prevent costly reprocessing and maintain data integrity.

The following code example demonstrates how to structure a complex financial ETL pipeline in MWAA:

# Example: Complex ETL pipeline with proper dependency management
from airflow import DAG
from airflow.operators.python_operator import PythonOperator
from datetime import datetime, timedelta

dag = DAG(
	'financial_etl_pipeline',
	schedule_interval='0 2 * * *',  # Daily at 2 AM
	start_date=datetime(2024, 1, 1),
	catchup=False
)

# Define tasks
extract_transactions = PythonOperator(task_id='extract_transactions', ...)
extract_market_data = PythonOperator(task_id='extract_market_data', ...)
transform_data = PythonOperator(task_id='transform_data', ...)
load_warehouse = PythonOperator(task_id='load_warehouse', ...)
generate_reports = PythonOperator(task_id='generate_reports', ...)

# Express complex dependencies clearly
[extract_transactions, extract_market_data] >> transform_data >> [load_warehouse, generate_reports]

This Directed Acyclic Graph (DAG) shows how to define task dependencies for parallel data extraction followed by sequential transformation and loading operations. The >> operator clearly defines the workflow dependencies. Transformation only begins after both extraction tasks complete successfully.

Built-in scheduling capabilities

MWAA includes native scheduling capabilities, making it straightforward to set up recurring workflows without additional services. The schedule_interval parameter in the DAG definition provides flexible scheduling options using cron syntax.

Granular recovery and resume control

During production incidents, operations teams can use the MWAA web interface to restart or bypass specific steps with a few clicks. This capability is important for stateful applications where restarting the entire workflow could compromise data consistency.

The MWAA web interface provides a visual representation of the workflow execution, allowing operators to:

Identify failed tasks – Examine task logs for troubleshooting – Clear the status of specific tasks – Restart execution from specific points

Figure 1: A Directed Acyclic Graph (DAG) in MWAA showing parallel execution ofAmazon Redshift Data APItasks. If any task fails, you can re-run specific tasks rather than restarting from the beginning.

Comprehensive monitoring and operational control

MWAA’s metadata server maintains comprehensive execution logs, enabling organizations to build operational dashboards for: – Real-time workflow monitoring – Task completion rate tracking – Pipeline execution pattern analysis – Optimization opportunity identification

Implementation considerations

  • Infrastructure planning: While MWAA requires capacity planning, the automatic scaling capabilities effectively handle variable workloads by setting minimum and maximum worker counts.
  • Security model: MWAA uses a shared execution role across DAGs, but you can implement additional security through resource-level policies and separate environments for different teams.
  • Cost predictability: The worker-hour pricing model provides predictable costs for long-running jobs, making budget planning more straightforward.

Use case: Real-time serverless application orchestration

This scenario shows how AWS Step Functions handles event-driven, serverless workflows that need to scale automatically with unpredictable traffic.

Business challenge

An e-commerce platform needs to orchestrate real-time order processing workflows that can handle thousands of concurrent orders during peak shopping periods. Their requirements include:

  • Designed for processing customer orders in real-time (targeting sub-second response times)
  • Coordinating payment validation, inventory checks, and fulfillment
  • Integrating with multiple AWS services (AWS Lambda, Amazon Simple Queue Service (Amazon SQS), Amazon Simple Notification Service (Amazon SNS), Amazon DynamoDB)
  • Designed to handle traffic spikes during promotional events
  • Implementing approval workflows for high-value orders
  • Maintaining cost efficiency during variable load periods

Workflow characteristics

  • Data statefulness: Primarily stateless processing where each customer order represents an independent transaction
  • Execution duration: Supports rapid, real-time processing with sub-second to few-minute response times.
  • Event-driven nature: Core architectural pattern where workflows are triggered by specific customer actions
  • Integration requirements: Extensive coordination with AWS serverless services
  • Scalability needs: Highly unpredictable traffic patterns requiring automatic scaling

Solution: AWS Step Functions

For this real-time e-commerce scenario, AWS Step Functions provides capabilities that align well with these requirements:

Serverless architecture and automatic scaling

Step Functions automatically scales to handle traffic spikes without infrastructure management. During peak shopping events like Black Friday, the service handles increased load without manual intervention.

Event-driven workflow execution

Step Functions is designed for order-triggered workflows that need immediate execution. The following JSON definition shows how to structure an e-commerce order processing workflow:

{
  "Comment": "E-commerce Order Processing Workflow",
  "StartAt": "ValidatePayment",
  "States": {
    "ValidatePayment": {
      "Type": "Task",
      "Resource": "arn:aws:lambda:region:account:function:ValidatePayment",
      "Retry": [
        {
          "ErrorEquals": ["States.TaskFailed"],
          "IntervalSeconds": 2,
          "MaxAttempts": 3,
          "BackoffRate": 2.0
        }
      ],
      "Next": "CheckInventory"
    },
    "CheckInventory": {
      "Type": "Parallel",
      "Branches": [
        {
          "StartAt": "CheckWarehouse1",
          "States": {
            "CheckWarehouse1": {
              "Type": "Task",
              "Resource": "arn:aws:lambda:region:account:function:CheckWarehouse",
              "End": true
            }
          }
        },
        {
          "StartAt": "CheckWarehouse2", 
          "States": {
            "CheckWarehouse2": {
              "Type": "Task",
              "Resource": "arn:aws:lambda:region:account:function:CheckWarehouse",
              "End": true
            }
          }
        }
      ],
      "Next": "ProcessOrder"
    },
    "ProcessOrder": {
      "Type": "Task",
      "Resource": "arn:aws:lambda:region:account:function:ProcessOrder",
      "End": true
    }
  }
}

This Step Functions definition demonstrates several key capabilities: – The ValidatePayment state includes built-in retry logic with exponential backoff – The CheckInventory state uses parallel execution to simultaneously check multiple warehouses – Each Lambda function is called via its Amazon Resource Name (ARN), providing direct integration with AWS services

Figure 2: A complex workflow in AWS Step Functions, involving multiple stages of data processing. The parallel execution doesn’t allow resuming from a specific mid-execution step, but the branching structure provides automated error handling and recovery.

Native AWS service integration

Step Functions provides direct integration with Lambda functions, SQS queues, SNS topics, and DynamoDB, eliminating the need for custom connectors or additional infrastructure components.

Cost-effective pay-per-use model

The pay-per-execution pricing model aligns with variable order volumes, keeping costs minimal during slow periods while scaling automatically during busy times.

Human approval workflow support

Step Functions supports human approval steps, making it suitable for high-value order workflows that require manual review or approval processes.

Implementation considerations

  • Error handling: Built-in retry mechanisms and error handling patterns help provide reliable order processing with configurable retry policies.
  • Visual monitoring: The Step Functions console provides real-time visibility into order processing status, enabling quick identification of bottlenecks.
  • Security model: Fine-grained AWS Identity and Access Management (IAM) roles per step so that payment processing functions have different permissions than inventory management functions.

Choosing the right workflow orchestration service

When selecting between Amazon MWAA and AWS Step Functions, consider these workflow characteristics:

Consider Amazon MWAA when your use case involves:

  • Complex stateful data processing where workflows modify data state and require recovery mechanisms to maintain consistency
  • Long-running batch jobs executing for hours or days where computational investment is substantial
  • Built-in scheduling requirements where regular batch processing needs time-based orchestration
  • Granular recovery needs where resuming from specific failure points is business-critical
  • Complex task dependencies involving sophisticated relationships between workflow tasks
  • Existing Apache Airflow expertise where teams have substantial investment in Apache Airflow knowledge

Consider AWS Step Functions when your use case involves:

  • Event-driven serverless workflows triggered by external events requiring immediate response
  • Stateless processing where each workflow execution operates independently
  • Short to medium duration tasks completing within minutes to hours
  • Heavy AWS service integration involving extensive coordination with Lambda functions and other AWS services
  • Human approval workflows requiring manual intervention or decision-making
  • Variable load patterns with unpredictable traffic requiring automatic scaling

Decision framework

To help guide your decision process, consider the following questions:

Figure 3: Decision tree guiding through key considerations for choosing between Amazon MWAA and AWS Step Functions based on workflow characteristics.

Figure 4: Comprehensive comparison between Amazon MWAA and AWS Step Functions, highlighting decision factors for choosing the right workflow orchestration service.

Conclusion

Both Amazon Managed Workflows for Apache Airflow and AWS Step Functions are workflow orchestration services, each designed to address specific use case requirements. By understanding your workflow characteristics and aligning them with the strengths of each service, you can make an informed decision that supports your business needs.

For complex, stateful workflows with long execution times and sophisticated recovery requirements, Amazon MWAA provides robust capabilities. For event-driven, serverless workflows with tight AWS integration and variable load patterns, AWS Step Functions is a strong fit.

Remember that these services are not mutually exclusive. Many organizations use both to address different workflow orchestration needs across their application portfolio. By focusing on your specific use case requirements, you can select the right tool for each job and build resilient, efficient workflow orchestration solutions on AWS.

If you have questions or feedback about choosing between these services, leave a comment.


About the authors

Rajkumar Raghuwanshi

Rajkumar Raghuwanshi

Rajkumar is a Delivery Consultant, within AWS Professional Services, specializing in helping customers design and optimize their data and analytics workloads on AWS. With expertise spanning database modernization, data migration, and analytics architecture, he builds scalable, cloud-native solutions that enable customers to unlock the full value of their data.

Shuvajit Ghosh

Shuvajit Ghosh

Shuvajit is a Delivery Consultant – Data & Analytics within AWS Professional Services, with over a decade of experience architecting enterprise-scale data warehouses, lakehouse platforms, and modern data ecosystems. He specializes in data lakehouse architectures, end-to-end ETL/ELT pipeline design, data lineage, and container-based solutions using services like Amazon Redshift, Amazon OpenSearch Service, AWS Glue, Lake Formation, Apache Iceberg, dbt, and Amazon MWAA.

Nishad

Nishad Mankar

Nishad is a Delivery Consultant with AWS Professional Services, passionate about helping customers harness the power of data on the cloud. He brings deep expertise in analytics architecture, data platform modernization, and database migration, enabling organizations to build robust, scalable solutions on AWS. From architecting modern data pipelines to optimizing complex workloads, Nishad partners closely with customers to accelerate their cloud journey and deliver measurable business outcomes.

Real-time CDC from Aurora PostgreSQL to Amazon S3 Tables using Debezium and Firehose

Post Syndicated from Chintan Agrawal original https://aws.amazon.com/blogs/big-data/real-time-cdc-from-aurora-postgresql-to-amazon-s3-tables-using-debezium-and-firehose/

Enterprises running transactional workloads on Amazon Aurora PostgreSQL-Compatible Edition (Aurora PostgreSQL) need their operational data available for analytics. However, analytical queries and cross-database joins compete for resources on OLTP-optimized clusters. Batch exports introduce latency, and when data spans multiple Aurora clusters, there’s no straightforward way to join datasets or run cross-domain analytics. Real-time change data capture (CDC) addresses this by streaming row-level changes into a separate analytics layer. However, most CDC approaches write append-only records that require downstream consumers to reconstruct current state from the change log.

In this post, we show you how to build a CDC pipeline that delivers query-ready Iceberg tables directly. The pipeline captures inserts, updates, and deletes from Aurora PostgreSQL and applies them as row-level operations in Amazon S3 Tables, a capability of Amazon Simple Storage Service (Amazon S3). The destination tables always reflect the current state of the source database. You use Debezium on Amazon MSK Connect for change capture and Amazon Managed Streaming for Apache Kafka (Amazon MSK) for streaming. You also use AWS Lambda to transform CDC events and resolve operation semantics, and Amazon Data Firehose to deliver records into Iceberg tables. You deploy the infrastructure using the AWS Cloud Development Kit (AWS CDK).

Apache Iceberg supports row-level updates, deletes, ACID transactions, schema evolution, and time travel natively. S3 Tables handles Iceberg snapshot management and compaction automatically. With AWS Lake Formation for access control, multiple teams can query the tables through Amazon Athena, Amazon Redshift, or Amazon SageMaker Unified Studio.

Solution overview

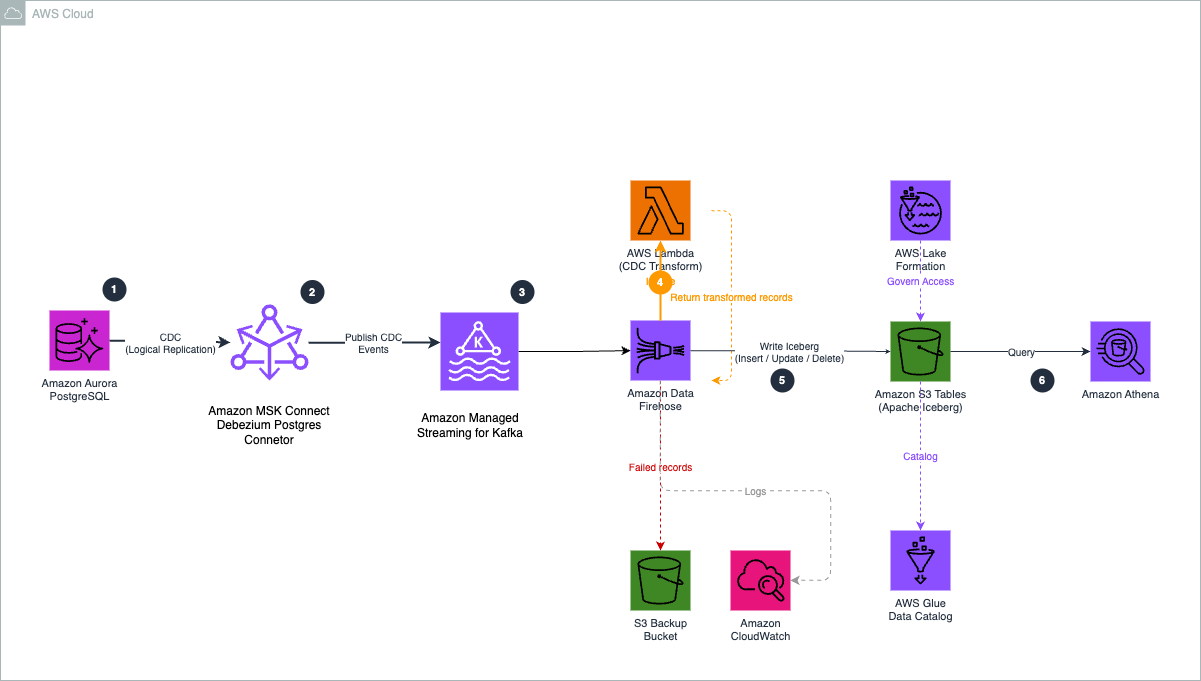
The following diagram shows the architecture of the CDC pipeline.

Figure 1. CDC pipeline architecture from Aurora PostgreSQL to Amazon S3 Tables.

Figure 1. CDC pipeline architecture from Aurora PostgreSQL to Amazon S3 Tables.

The pipeline uses six components:

  1. Aurora PostgreSQL to Debezium. Debezium runs on MSK Connect in your VPC and uses PostgreSQL’s native logical replication to stream row-level changes from the write-ahead log (WAL), with minimal impact on query performance.
  2. Debezium to Amazon MSK. The ByLogicalTableRouter SMT reroutes CDC events from multiple tables into a single topic (aurora.cdc.all-tables), retaining the source table name in each message.
  3. Amazon MSK to Firehose. Firehose connects to the MSK cluster using the IAM access control over AWS PrivateLink and continuously polls the topic for new messages.
  4. Firehose to Lambda. For each batch, Firehose invokes the Lambda function to decode the Kafka message, flatten the Debezium envelope, and set otfMetadata routing with the destination table and operation type.
  5. Firehose to S3 Tables. Firehose reads the otfMetadata, routes each record to the correct Iceberg table, and performs the appropriate row-level operation using configured unique keys (for example, order_id for orders). S3 Tables handles compaction and snapshot management automatically.
  6. Query and access control. After data lands in S3 Tables, you can query the Iceberg tables with Amazon Athena, Amazon Redshift, or Amazon SageMaker Unified Studio, with AWS Lake Formation managing fine-grained access control.

Firehose supports one MSK topic per delivery stream. The single-topic routing pattern uses a Debezium SMT to consolidate multiple tables into one topic, and a Lambda function to route records to the correct destination. With this, you can serve multiple tables through one Firehose stream, reducing cost and operational complexity.

Debezium event transformation

Debezium produces CDC events in an envelope structure containing both the previous and current state of a row, along with metadata about the source database, table, and operation type. However, Firehose expects records in a flattened JSON format with routing metadata that indicates the target table and operation type.

The Lambda function bridges this gap by performing three operations on each record:

  1. Decode. When Firehose uses Amazon MSK as a source, it delivers the Kafka message value as a base64-encoded string in the kafkaRecordValue field. The function base64-decodes this field to obtain the raw Debezium JSON payload.
  2. Flatten and extract. Pulls the row data from the Debezium envelope. For inserts and updates, the function uses the after field (the row after the change). For deletes, it uses the before field, because the after field is null when a row is removed.
  3. Route. Sets the otfMetadata block with destinationTableName (extracted from the Debezium source.table field) and operation (mapped from Debezium’s single-character codes to Firehose’s operation types).

The following table shows how Debezium operation codes map to Firehose Iceberg operations:

Debezium code Meaning Firehose operation
c Row created (insert) insert
u Row updated update
d Row deleted delete
r Snapshot read (initial load) insert

When Debezium starts with snapshot.mode=initial, it reads all existing rows and emits them as r (read) events. These represent rows that existed before CDC began, so they are mapped to insert to establish the baseline state in the destination tables.

For example, the function transforms this Debezium envelope:

{
"op": "c",
"before": null,
"after": {"order_id": 1, "customer_id": 1, "total_amount": 299.99},
"source": {"table": "orders", "db": "cdcdemo"}
}

Into a response record with routing metadata:

{
"recordId": "<original-record-id>",
"result": "Ok",
"kafkaRecordValue": "<base64-encoded flattened row JSON>",
"metadata": {
"otfMetadata": {
"destinationDatabaseName": "aurora_cdc",
"destinationTableName": "orders",
"operation": "insert"
}
}
}

The kafkaRecordValue contains the base64-encoded flattened row data (for example, {"order_id": 1, "customer_id": 1, "total_amount": 299.99}), and the otfMetadata block tells Firehose which table to write to and which operation to perform.

With this routing metadata, a single Firehose stream can write to multiple destination tables. For more information, see Route incoming records to different Iceberg tables.

Walkthrough

The following sections walk you through building the CDC pipeline end to end. Before you begin, complete the prerequisites.

Prerequisites

Before you begin, make sure you have the following:

Step 1: Enable CDC in Aurora PostgreSQL

PostgreSQL supports change data capture through its logical replication framework, which allows database changes to be streamed from the write-ahead log (WAL). Debezium uses this mechanism to continuously read row-level changes and publish them to Kafka topics.

To enable logical replication in Aurora PostgreSQL, configure a custom DB cluster parameter group:

  1. Create a custom parameter group and set the following parameter: rds.logical_replication = 1.
  2. Apply the parameter group to your Aurora cluster and reboot the cluster for the change to take effect.
  3. Connect to your Aurora PostgreSQL cluster and create the source tables:
CREATE TABLE public.orders (
    order_id SERIAL PRIMARY KEY,
    customer_id INTEGER,
    order_date VARCHAR(50),
    total_amount DECIMAL(12,2),
    status VARCHAR(50),
    created_at TIMESTAMP DEFAULT NOW(),
    updated_at TIMESTAMP DEFAULT NOW()
);
CREATE TABLE public.products (
    product_id SERIAL PRIMARY KEY,
    product_name VARCHAR(255),
    category VARCHAR(100),
    price DECIMAL(10,2),
    stock_quantity INTEGER,
    created_at TIMESTAMP DEFAULT NOW(),
    updated_at TIMESTAMP DEFAULT NOW()
);
  1. Create a publication that defines which tables are included in the change stream. Debezium automatically creates the logical replication slot when the connector starts for the first time, so you don’t need to create one manually.
CREATE PUBLICATION dbz_publication FOR TABLE public.orders, public.products;
  1. Verify the publication was created:
SELECT * FROM pg_publication WHERE pubname = 'dbz_publication';

You should see one row returned, confirming the publication is active.

Important: When the Debezium connector starts (Step 6), it creates a replication slot named debezium_slot. This slot retains WAL segments until consumed. If the connector is stopped for an extended period, WAL segments can accumulate and increase storage usage on the Aurora cluster. Monitor the ReplicationSlotDiskUsage Amazon CloudWatch metric for your Aurora cluster.

Step 2: Build and register the Debezium plugin

MSK Connect runs connectors using custom plugins that you upload to Amazon S3. In this step, you download the Debezium PostgreSQL connector, package it as a ZIP file, upload it to S3, and register it with MSK Connect.

First, create an S3 bucket for the plugin, or use an existing metadata management bucket:

aws s3 mb s3://<your-plugin-bucket> --region <your-region>

Download and package the Debezium connector:

DEBEZIUM_VERSION=2.7.3.Final
curl -LO "https://repo1.maven.org/maven2/io/debezium/debezium-connector-postgres/${DEBEZIUM_VERSION}/debezium-connector-postgres-${DEBEZIUM_VERSION}-plugin.tar.gz"
mkdir -p debezium-plugin
tar -xzf debezium-connector-postgres-${DEBEZIUM_VERSION}-plugin.tar.gz -C debezium-plugin/
cd debezium-plugin && zip -r ../debezium-postgres-connector.zip . && cd ..
aws s3 cp debezium-postgres-connector.zip s3://<your-plugin-bucket>/plugins/

Register the plugin with MSK Connect:

aws kafkaconnect create-custom-plugin \
    --custom-plugin-name debezium-postgres-connector \
    --content-type ZIP \
    --location "s3Location={bucketArn=arn:aws:s3:::<your-plugin-bucket>,fileKey=plugins/debezium-postgres-connector.zip}"

Create a worker configuration that tells MSK Connect to serialize Kafka messages as JSON without schemas:

aws kafkaconnect create-worker-configuration \
    --name debezium-worker-config \
    --properties-file-content "$(echo -n 'key.converter=org.apache.kafka.connect.json.JsonConverter
value.converter=org.apache.kafka.connect.json.JsonConverter
key.converter.schemas.enable=false
value.converter.schemas.enable=false' | base64)"

Note the customPluginArn and workerConfigurationArn from the output. You need these for the CDK configuration in the next step.

Note: The custom plugin and worker configuration are created through the AWS CLI because the Debezium connector JARs must be downloaded from the Debezium project and packaged manually. The remaining infrastructure is deployed using the AWS CDK in the following steps.

Step 3: Configure the CDK project

Clone the sample repository and install dependencies:

git clone https://github.com/aws-samples/sample-aurora-cdc-s3tables.git
cd sample-aurora-cdc-s3tables/cdk
npm install

Open cdk/lib/v2/config.ts and update the configuration values to match your environment:

export const CONFIG = {
account: '<your-account-id>',
region: '<your-region>',
// VPC - must match your Aurora cluster's VPC
vpcId: '<your-vpc-id>',
subnetIds: ['<subnet-1>', '<subnet-2>'],
auroraSecurityGroupId: '<aurora-security-group-id>',
// Aurora connection details
auroraEndpoint: '<aurora-cluster-endpoint>',
auroraPort: '5432',
auroraDbName: '<database-name>',
auroraUser: '<db-user>',
auroraSecretArn: '<secrets-manager-arn>',
// Debezium - use the ARNs from Step 2
debeziumPluginArn: '<customPluginArn-from-step-2>',
debeziumWorkerConfigArn: '<workerConfigurationArn-from-step-2>',
debeziumPluginBucket: '<your-plugin-bucket-name>',
debeziumTopicPrefix: 'aurora.cdc',
debeziumTables: 'public.orders,public.products',
// S3 Tables - the table bucket name must be globally unique
s3TablesBucketName: '<your-table-bucket-name>',
s3TablesNamespace: 'aurora_cdc',
tables: ['orders', 'products'],
tableKeys: { orders: 'order_id', products: 'product_id' },
// Firehose - general purpose S3 bucket for failed record backup
firehoseBackupBucket: '<your-backup-bucket-name>',
};

Key configuration notes:

  • auroraSecurityGroupId. The security group attached to your Aurora cluster. The CDK creates an MSK security group with ingress rules allowing traffic from this security group, and a reverse rule allowing MSK Connect workers to reach Aurora on port 5432.
  • tableKeys. The primary key column for each table. Firehose uses these to match incoming records against existing rows for update and delete operations in the Iceberg tables.
  • s3TablesBucketName. The name for your S3 table bucket. Table bucket names must be unique for your account in the chosen Region.

Step 4: Deploy the CDK stacks

Deploy all six stacks with a single command. The CDK resolves the dependency order automatically:

npx cdk --app "npx ts-node bin/app-v2.ts" deploy --all

When prompted, review the AWS Identity and Access Management (IAM) changes and confirm the deployment. The CDK deploys the following stacks:

Stack What it creates
CdcMskCluster Amazon MSK cluster (2x kafka.m5.large brokers) with dual authentication (IAM for Firehose, unauthenticated for Debezium), custom configuration with auto.create.topics.enable=true, security groups with ingress rules for Aurora and MSK Connect workers
CdcMskConnectIam MSK Connect service execution role with permissions for Kafka cluster operations, VPC networking, S3 plugin access, and AWS Secrets Manager; Amazon CloudWatch Logs group for connector logs
CdcS3Tables S3 table bucket, aurora_cdc namespace, two Iceberg tables (orders, products) with column schemas
CdcLambdaTransform Lambda function for CDC event transformation and multi-table routing
CdcFirehoseRole Firehose IAM role with permissions for Amazon MSK, S3 Tables, AWS Glue Data Catalog, AWS Lake Formation, VPC networking, and Lambda invocation
CdcFirehose Firehose delivery stream with MSK as source (private connectivity through AWS PrivateLink), Lambda processing, Apache Iceberg Tables as destination with two table configurations, and S3 backup bucket for failed records

The MSK cluster takes approximately 25 minutes to create. The Debezium connector takes approximately 5 minutes after the cluster is ready. You can monitor the deployment progress in the AWS CloudFormation console.

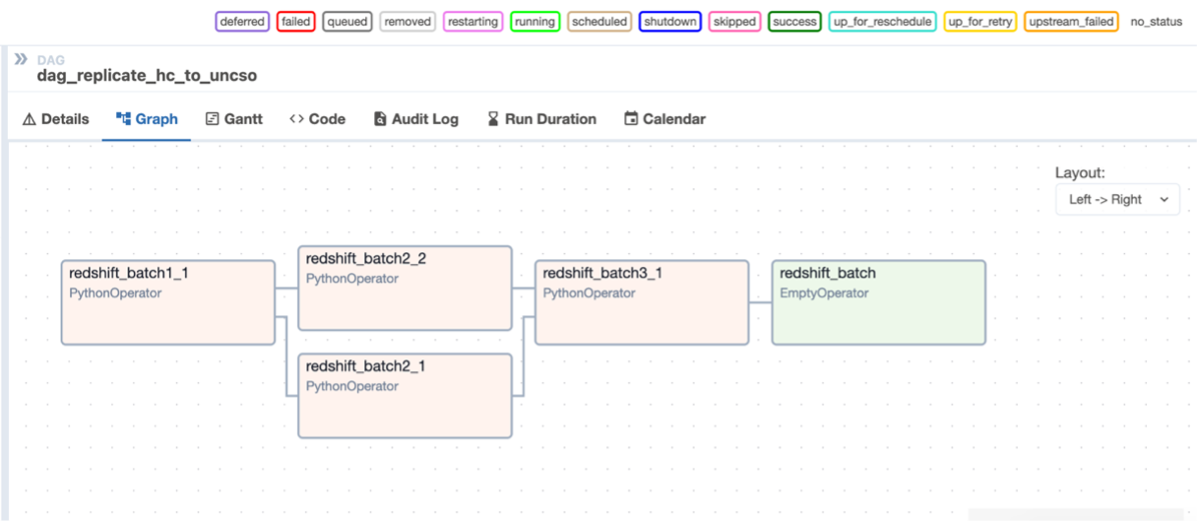
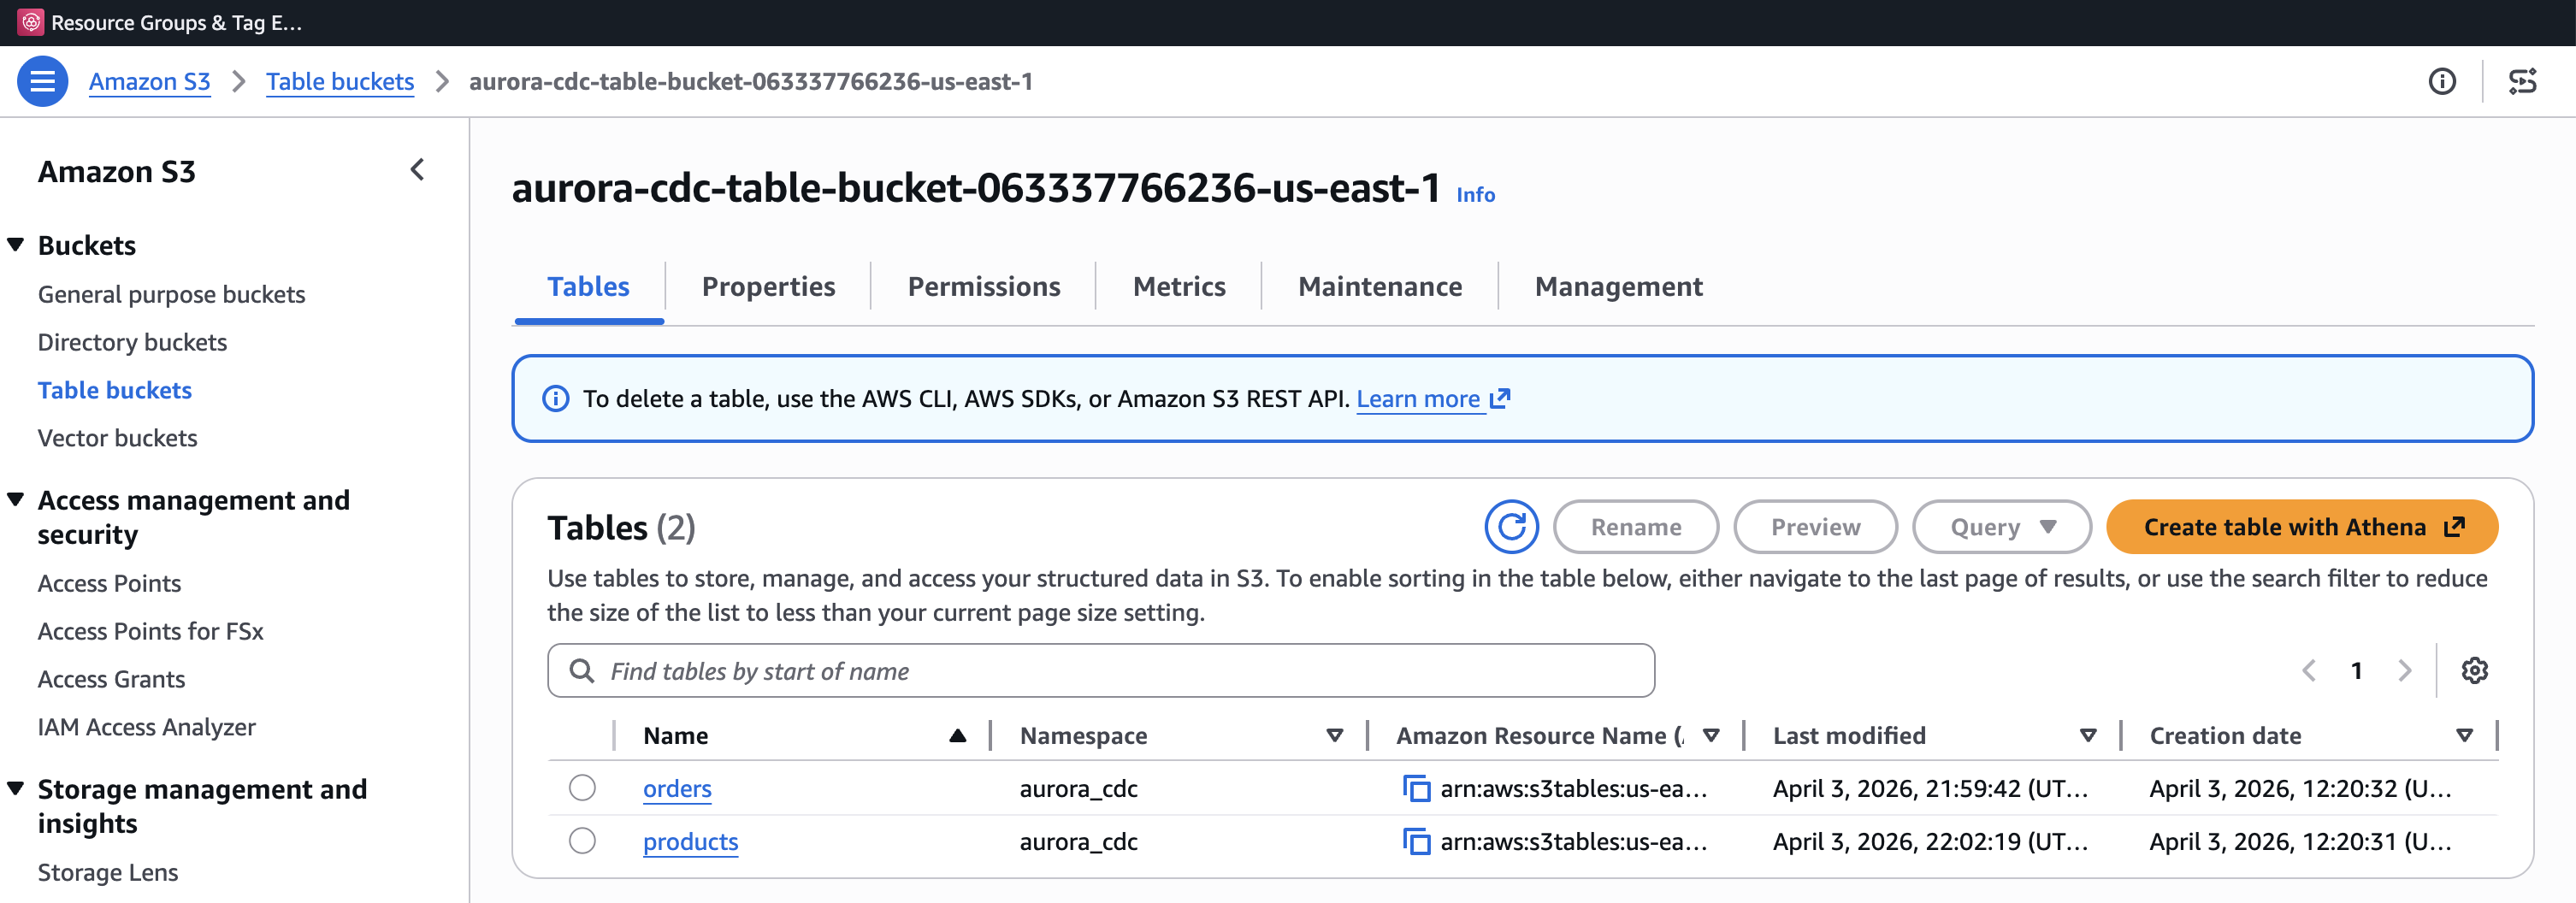
After the deployment completes, you can verify the resources in the AWS console. The S3 table bucket shows the two Iceberg tables in the aurora_cdc namespace.

Figure 2. S3 table bucket showing the orders and products Iceberg tables in the aurora_cdc namespace.

Figure 2. S3 table bucket showing the orders and products Iceberg tables in the aurora_cdc namespace.

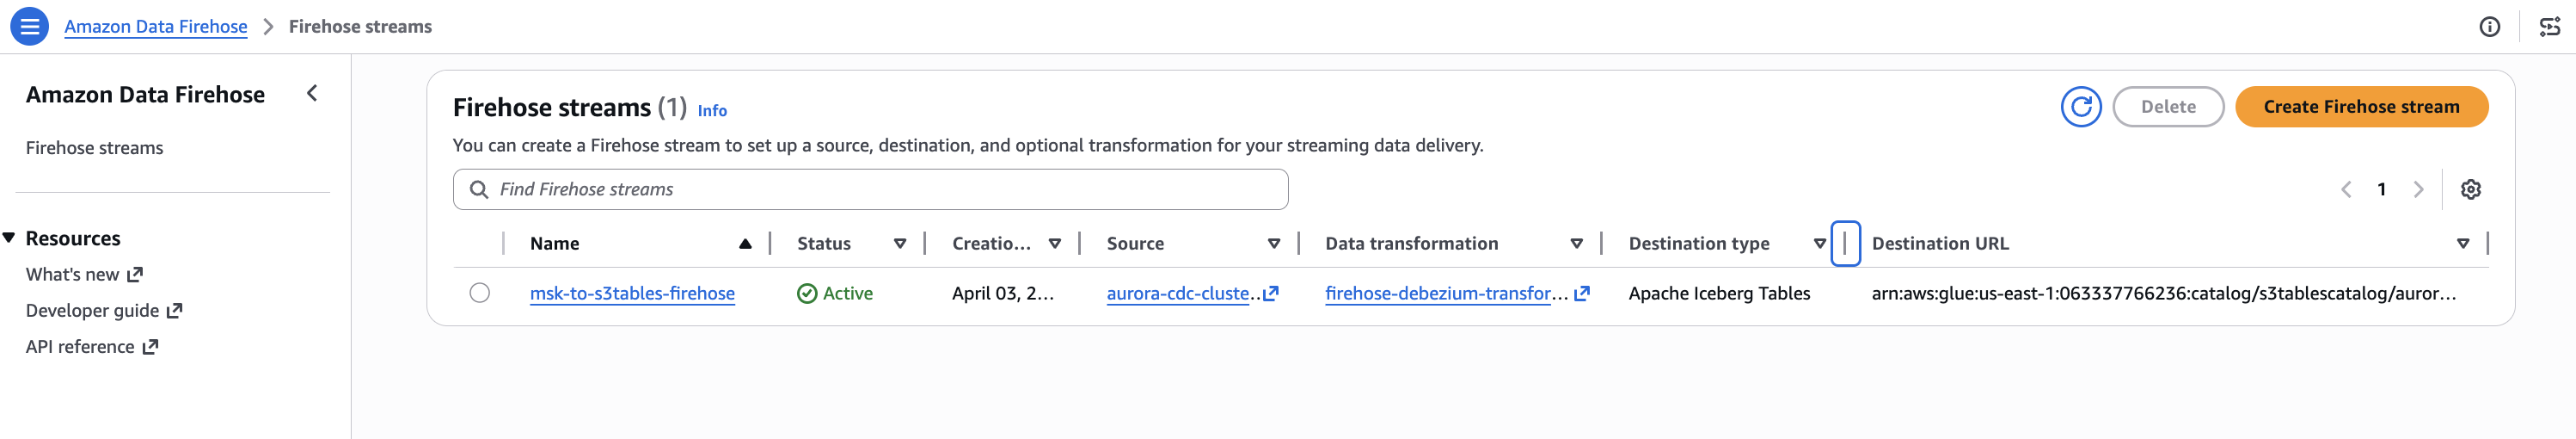
The Firehose delivery stream shows the MSK source, Lambda transformation, and Apache Iceberg Tables destination.

Figure 3. Amazon Data Firehose delivery stream with MSK source, Lambda transformation, and Apache Iceberg Tables destination.

Figure 3. Amazon Data Firehose delivery stream with MSK source, Lambda transformation, and Apache Iceberg Tables destination.

The MSK cluster uses dual authentication (IAM for Firehose, unauthenticated for Debezium through TLS_PLAINTEXT), multi-VPC private connectivity for Firehose PrivateLink access, and auto.create.topics.enable=true so Debezium can create topics on first connect. VPC connectivity and the cluster resource policy are configured as CLI steps in Step 5.

Step 5: Enable MSK VPC connectivity, grant Lake Formation permissions, and apply MSK cluster policy

After the CDK deployment completes, enable multi-VPC private connectivity with IAM on the MSK cluster. Firehose requires this to create an AWS PrivateLink endpoint to the MSK brokers. This setting can’t be configured during cluster creation and must be applied as an update, which triggers a rolling broker restart (approximately 20–30 minutes).

# Get the cluster ARN and current version from the CdcMskCluster stack outputs
MSK_ARN=<msk-cluster-arn>
CLUSTER_VERSION=$(aws kafka describe-cluster-v2 \
    --cluster-arn $MSK_ARN \
    --region <your-region> \
    --query 'ClusterInfo.CurrentVersion' --output text)
# Enable VPC connectivity with IAM
aws kafka update-connectivity \
    --cluster-arn $MSK_ARN \
    --current-version $CLUSTER_VERSION \
    --connectivity-info '{"VpcConnectivity":{"ClientAuthentication":{"Sasl":{"Iam":{"Enabled":true}}}}}' \
    --region <your-region>

Wait for the cluster state to return to ACTIVE before proceeding:

aws kafka describe-cluster-v2 \
    --cluster-arn $MSK_ARN \
    --region <your-region> \
    --query 'ClusterInfo.State'

Next, grant the Firehose IAM role permissions through AWS Lake Formation. S3 Tables uses a sub-catalog format for the CatalogId parameter, which differs from the standard AWS Glue Data Catalog. These permissions require a data lake administrator identity.

Grant database-level and table-level permissions to the Firehose role:

# Grant database-level permissions
aws lakeformation grant-permissions \
    --region <your-region> \
    --principal '{"DataLakePrincipalIdentifier": "<firehose-role-arn>"}' \
    --resource '{"Database": {"CatalogId": "<account-id>:s3tablescatalog/<table-bucket-name>", "Name": "aurora_cdc"}}' \
    --permissions '["ALL"]'
# Grant table-level permissions (wildcard for the tables in the namespace)
aws lakeformation grant-permissions \
    --region <your-region> \
    --principal '{"DataLakePrincipalIdentifier": "<firehose-role-arn>"}' \
    --resource '{"Table": {"CatalogId": "<account-id>:s3tablescatalog/<table-bucket-name>", "DatabaseName": "aurora_cdc", "TableWildcard": {}}}' \
    --permissions '["ALL"]'

Note the CatalogId format: <account-id>:s3tablescatalog/<table-bucket-name>. This is specific to S3 Tables and tells Lake Formation to look up permissions in the S3 Tables catalog rather than the default Glue Data Catalog. For more information, see Integrating Amazon S3 Tables with AWS analytics services.

Next, attach a resource-based policy to the MSK cluster that grants the Firehose service principal permission to create VPC connections:

aws kafka put-cluster-policy \
    --cluster-arn <msk-cluster-arn> \
    --region <your-region> \
    --policy '{
"Version": "2012-10-17",
"Statement": [{
"Effect": "Allow",
"Principal": {"Service": "firehose.amazonaws.com"},
"Action": ["kafka:CreateVpcConnection", "kafka:GetBootstrapBrokers", "kafka:DescribeClusterV2"],
"Resource": "<msk-cluster-arn>"
}]
}'

You can find the <msk-cluster-arn> in the CdcMskCluster stack outputs from Step 4, and the <firehose-role-arn> in the CdcFirehoseRole stack outputs.

Step 6: Create the Debezium connector

With the MSK cluster running and Lake Formation permissions in place, create the Debezium connector using the MSK Connect API. The connector reads changes from Aurora PostgreSQL and publishes them to the MSK topic.

Firehose supports only one MSK topic per delivery stream, so each source table would otherwise need its own Firehose stream and VPC connection. To avoid this, the connector uses the Debezium ByLogicalTableRouter Single Message Transform (SMT) to route changes from multiple tables into a single topic (aurora.cdc.all-tables). The Lambda function then uses the source table name in each message to direct records to the correct Iceberg table. This single-topic pattern uses one Firehose stream for multiple tables, reducing cost and operational complexity.

First, retrieve the MSK bootstrap servers from the cluster:

aws kafka get-bootstrap-brokers \
    --cluster-arn <msk-cluster-arn> \
    --region <your-region>

Note the BootstrapBrokerString value (the PLAINTEXT brokers). Then create the connector:

aws kafkaconnect create-connector --cli-input-json '{
"connectorName": "aurora-postgres-debezium-connector",
"kafkaCluster": {
"apacheKafkaCluster": {
"bootstrapServers": "<bootstrap-servers>",
"vpc": {
"subnets": ["<subnet-1>", "<subnet-2>"],
"securityGroups": ["<msk-security-group-id>"]
}
}
},
"kafkaClusterClientAuthentication": {"authenticationType": "NONE"},
"kafkaClusterEncryptionInTransit": {"encryptionType": "PLAINTEXT"},
"kafkaConnectVersion": "2.7.1",
"plugins": [{"customPlugin": {"customPluginArn": "<custom-plugin-arn>", "revision": 1}}],
"serviceExecutionRoleArn": "<msk-connect-service-role-arn>",
"capacity": {"provisionedCapacity": {"mcuCount": 2, "workerCount": 2}},
"workerConfiguration": {"workerConfigurationArn": "<worker-config-arn>", "revision": 1},
"connectorConfiguration": {
"connector.class": "io.debezium.connector.postgresql.PostgresConnector",
"tasks.max": "1",
"database.hostname": "<aurora-cluster-endpoint>",
"database.port": "5432",
"database.user": "<db-user>",
"database.password": "<db-password>",
"database.dbname": "<database-name>",
"database.server.name": "aurora_cdc",
"plugin.name": "pgoutput",
"slot.name": "debezium_slot",
"publication.name": "dbz_publication",
"table.include.list": "public.orders,public.products",
"topic.prefix": "aurora.cdc",
"schema.history.internal.kafka.topic": "schema-changes.aurora",
"schema.history.internal.kafka.bootstrap.servers": "<bootstrap-servers>",
"decimal.handling.mode": "string",
"time.precision.mode": "adaptive_time_microseconds",
"tombstones.on.delete": "false",
"snapshot.mode": "initial",
"publication.autocreate.mode": "filtered",
"transforms": "Reroute",
"transforms.Reroute.type": "io.debezium.transforms.ByLogicalTableRouter",
"transforms.Reroute.topic.regex": "aurora\\\\\\\\.cdc\\\\\\\\.public\\\\\\\\.(.*)",
"transforms.Reroute.topic.replacement": "aurora.cdc.all-tables"
},
"logDelivery": {
"workerLogDelivery": {
"cloudWatchLogs": {
"enabled": true,
"logGroup": "/aws/msk-connect/aurora-cdc-debezium"
}
}
}
}'

The <msk-security-group-id> and <msk-connect-service-role-arn> can be found in the CdcMskCluster and CdcMskConnectIam stack outputs respectively. The ByLogicalTableRouter Single Message Transform routes CDC events from the monitored tables into a single topic (aurora.cdc.all-tables).

Step 7: Verify the Debezium connector

After creating the connector, verify that it is running and has completed its initial snapshot.

aws kafkaconnect list-connectors --region <your-region> \
    --query 'connectors[?connectorName==`aurora-postgres-debezium-connector`].{Name:connectorName,State:connectorState}' \
    --output table

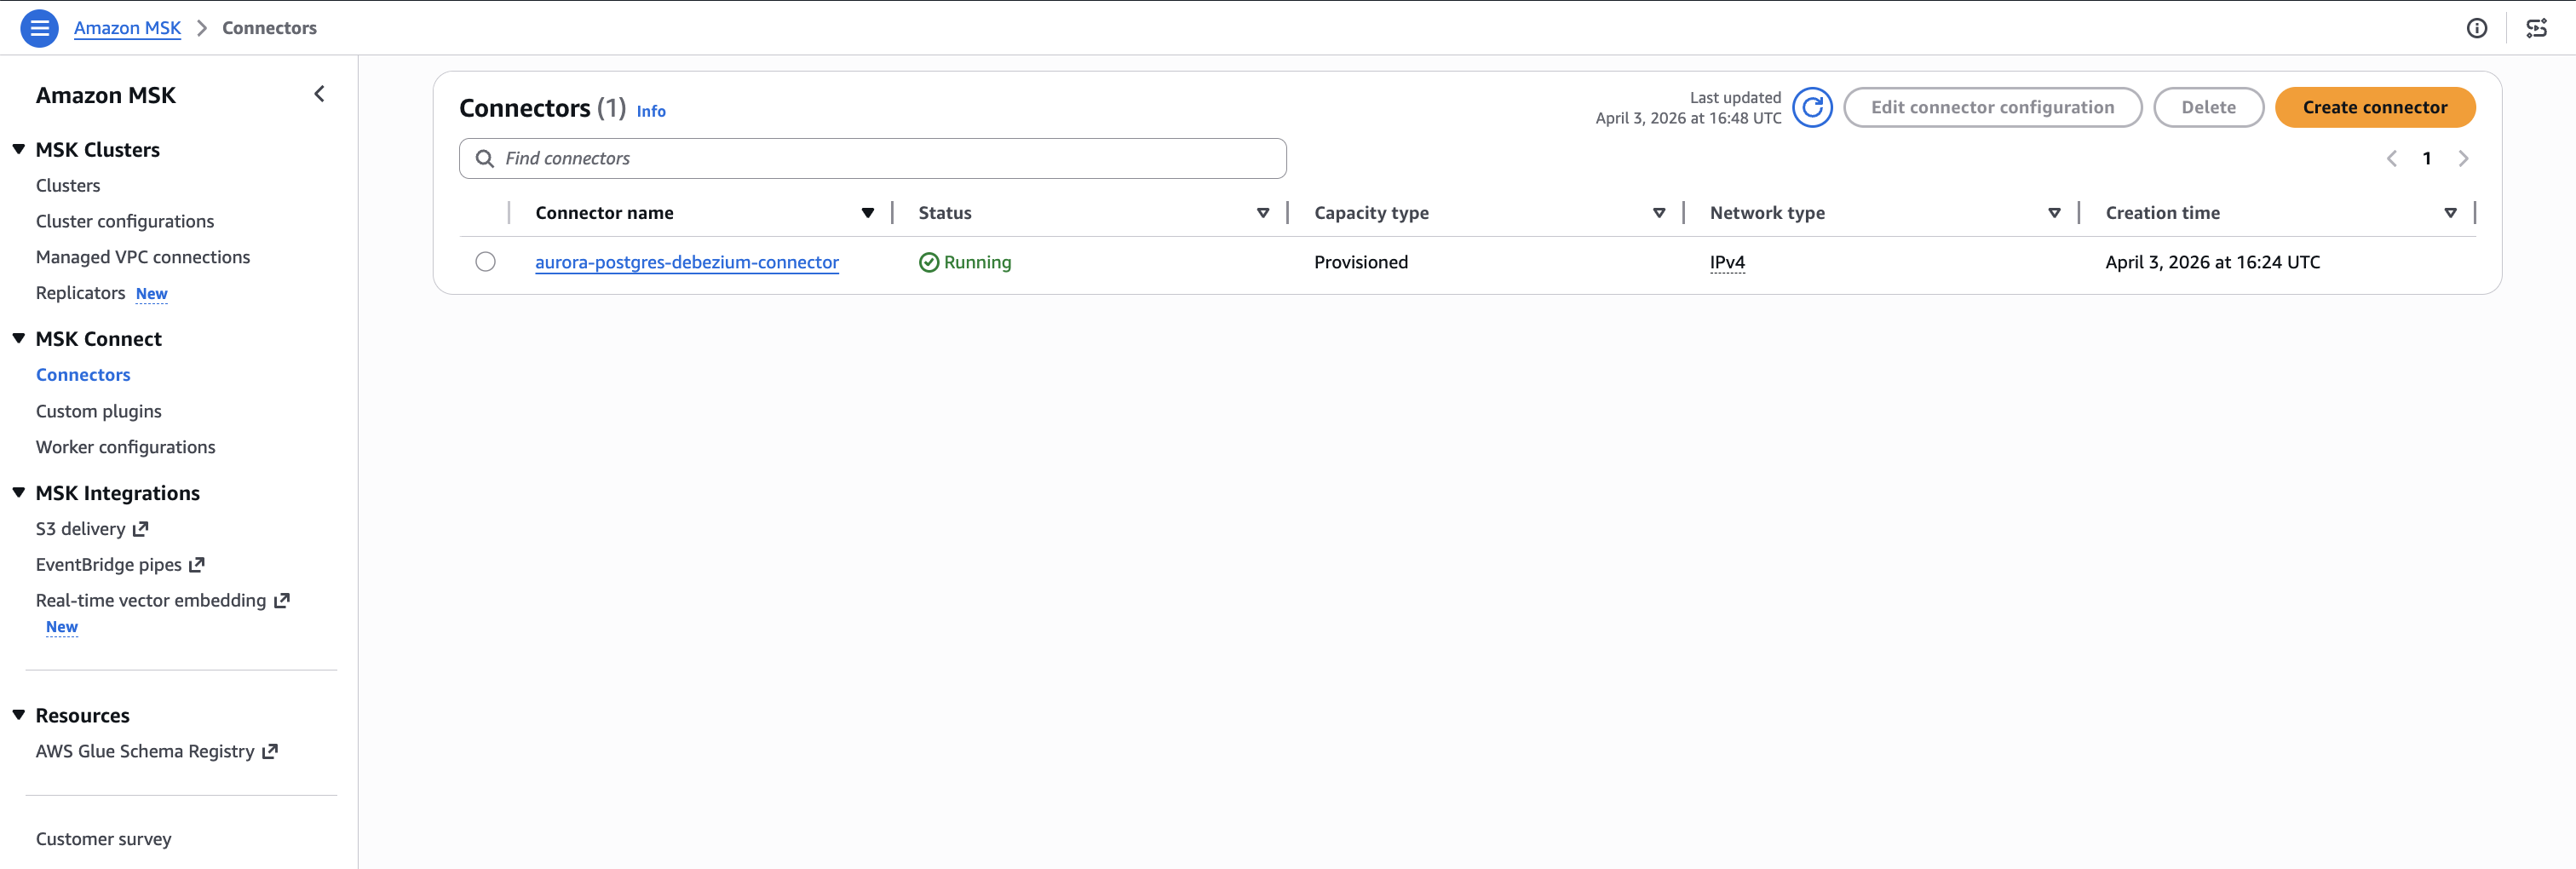
The connector state should show RUNNING, as shown in the following figure.

Figure 4. Debezium connector running on Amazon MSK Connect.

Figure 4. Debezium connector running on Amazon MSK Connect.

Check the CloudWatch Logs to confirm the snapshot completed:

aws logs tail /aws/msk-connect/aurora-cdc-debezium --follow --region <your-region>

You should see messages indicating the transition to streaming mode:

Finished exporting 0 records for table 'public.orders' (1 of 2 tables)
Finished exporting 0 records for table 'public.products' (2 of 2 tables)
Snapshot completed
Starting streaming

If the tables were empty when the connector started, the export count is 0. If you had existing data, the snapshot captures the existing rows as r (read) operations, which the Lambda function maps to insert operations in the Iceberg tables.

Verify that the Firehose delivery stream is active:

aws firehose describe-delivery-stream \
    --delivery-stream-name msk-to-s3tables-firehose \
    --region <your-region> \
    --query 'DeliveryStreamDescription.DeliveryStreamStatus'

The status should return ACTIVE.

Step 8: Test the pipeline

Insert test data into the Aurora PostgreSQL source tables. Each insert triggers a CDC event that flows through the pipeline: Aurora WAL to Debezium to MSK topic to Firehose to Lambda transform to S3 Tables.

-- Insert orders
INSERT INTO public.orders (customer_id, order_date, total_amount, status)
VALUES
(1, '2026-01-20', 299.99, 'shipped'),
(2, '2026-01-21', 149.50, 'processing'),
(1, '2026-01-22', 89.99, 'delivered');
-- Insert products
INSERT INTO public.products (product_name, category, price, stock_quantity)
VALUES
('Wireless Headphones', 'Electronics', 79.99, 150),
('Running Shoes', 'Sports', 129.99, 75),
('Coffee Maker', 'Kitchen', 49.99, 200);

This creates six records across two tables. Each record generates a Debezium CDC event with operation type c (create), which the Lambda function maps to an insert operation in the corresponding Iceberg table.

Step 9: Verify data delivery

Check the Firehose IncomingRecords metric to confirm records are flowing through the delivery stream:

aws cloudwatch get-metric-statistics \
    --namespace AWS/Firehose \
    --metric-name IncomingRecords \
    --dimensions Name=DeliveryStreamName,Value=msk-to-s3tables-firehose \
    --start-time $(date -u -v-10M +%Y-%m-%dT%H:%M:%S) \
    --end-time $(date -u +%Y-%m-%dT%H:%M:%S) \
    --period 60 --statistics Sum \
    --region <your-region>

You should see a Sum value of 6 or more. If the value is 0, wait another minute and retry. There can be a short delay between MSK topic delivery and Firehose metric reporting.

If records aren’t appearing, check the Firehose error output in the backup S3 bucket and the Lambda function’s CloudWatch Logs for transformation errors.

Step 10: Query data using Amazon Athena

With data delivered to S3 Tables, you can query the Iceberg tables using Amazon Athena. S3 Tables integrates with the AWS Glue Data Catalog as a sub-catalog, so you reference tables using the S3 Tables catalog format.

Tip: If records aren’t appearing in Athena, check the Firehose IncomingRecords CloudWatch metric and the Lambda function’s CloudWatch Logs for transformation errors.

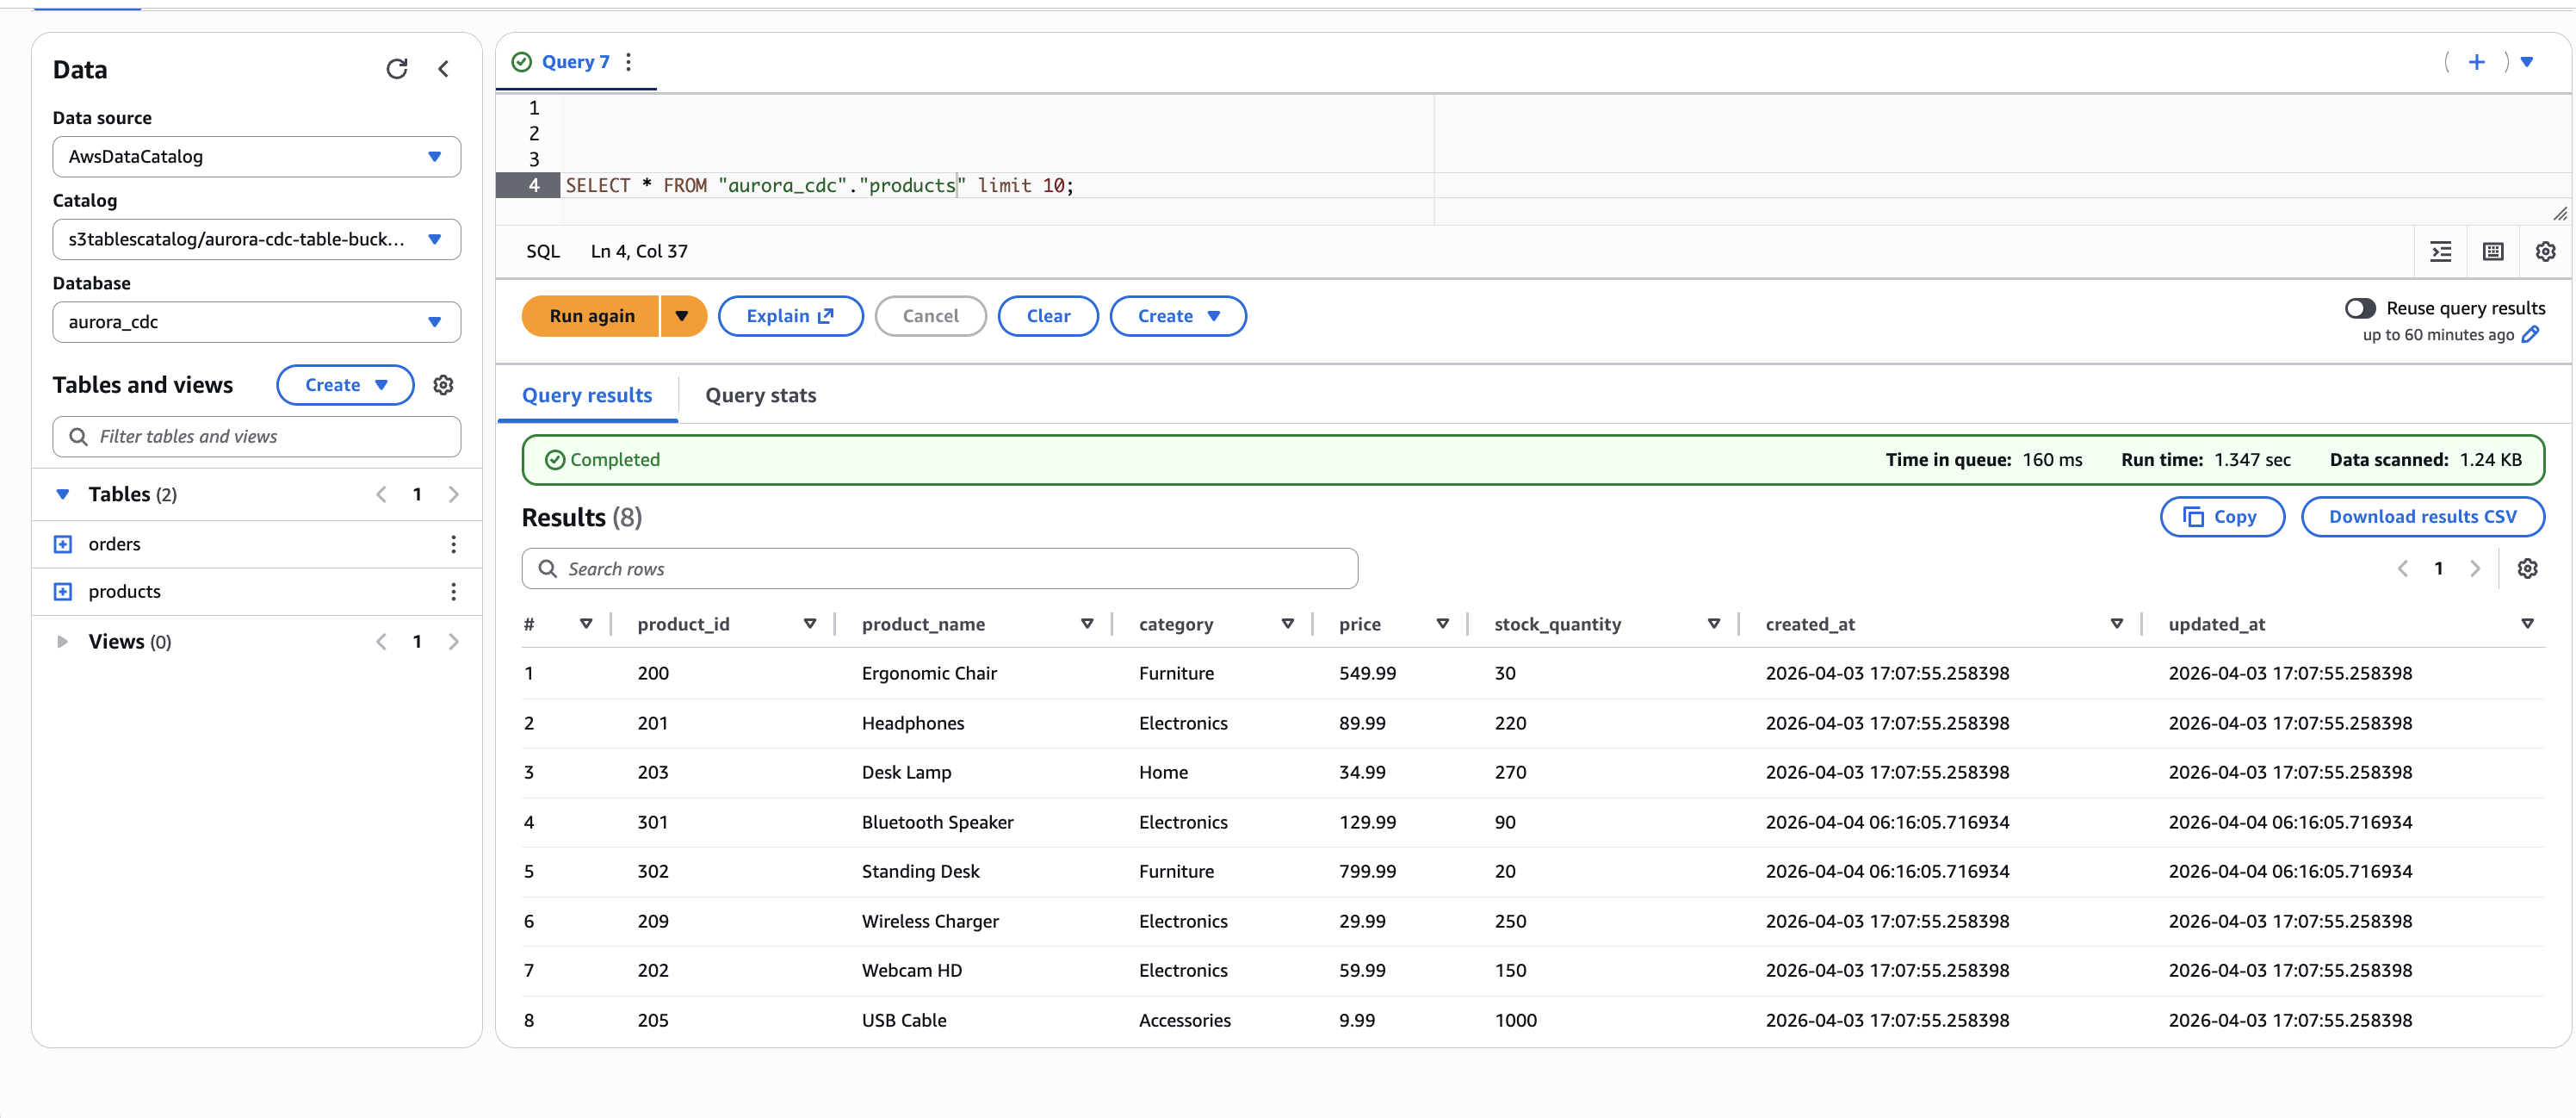
Open the Athena console, select the AwsDataCatalog data source, and run the following queries:

SELECT * FROM "s3tablescatalog/<table-bucket-name>"."aurora_cdc"."products" LIMIT 10;
SELECT * FROM "s3tablescatalog/<table-bucket-name>"."aurora_cdc"."orders" LIMIT 10;

Replace <table-bucket-name> with your S3 table bucket name. You should see the records from the initial snapshot that Debezium captured when the connector started.

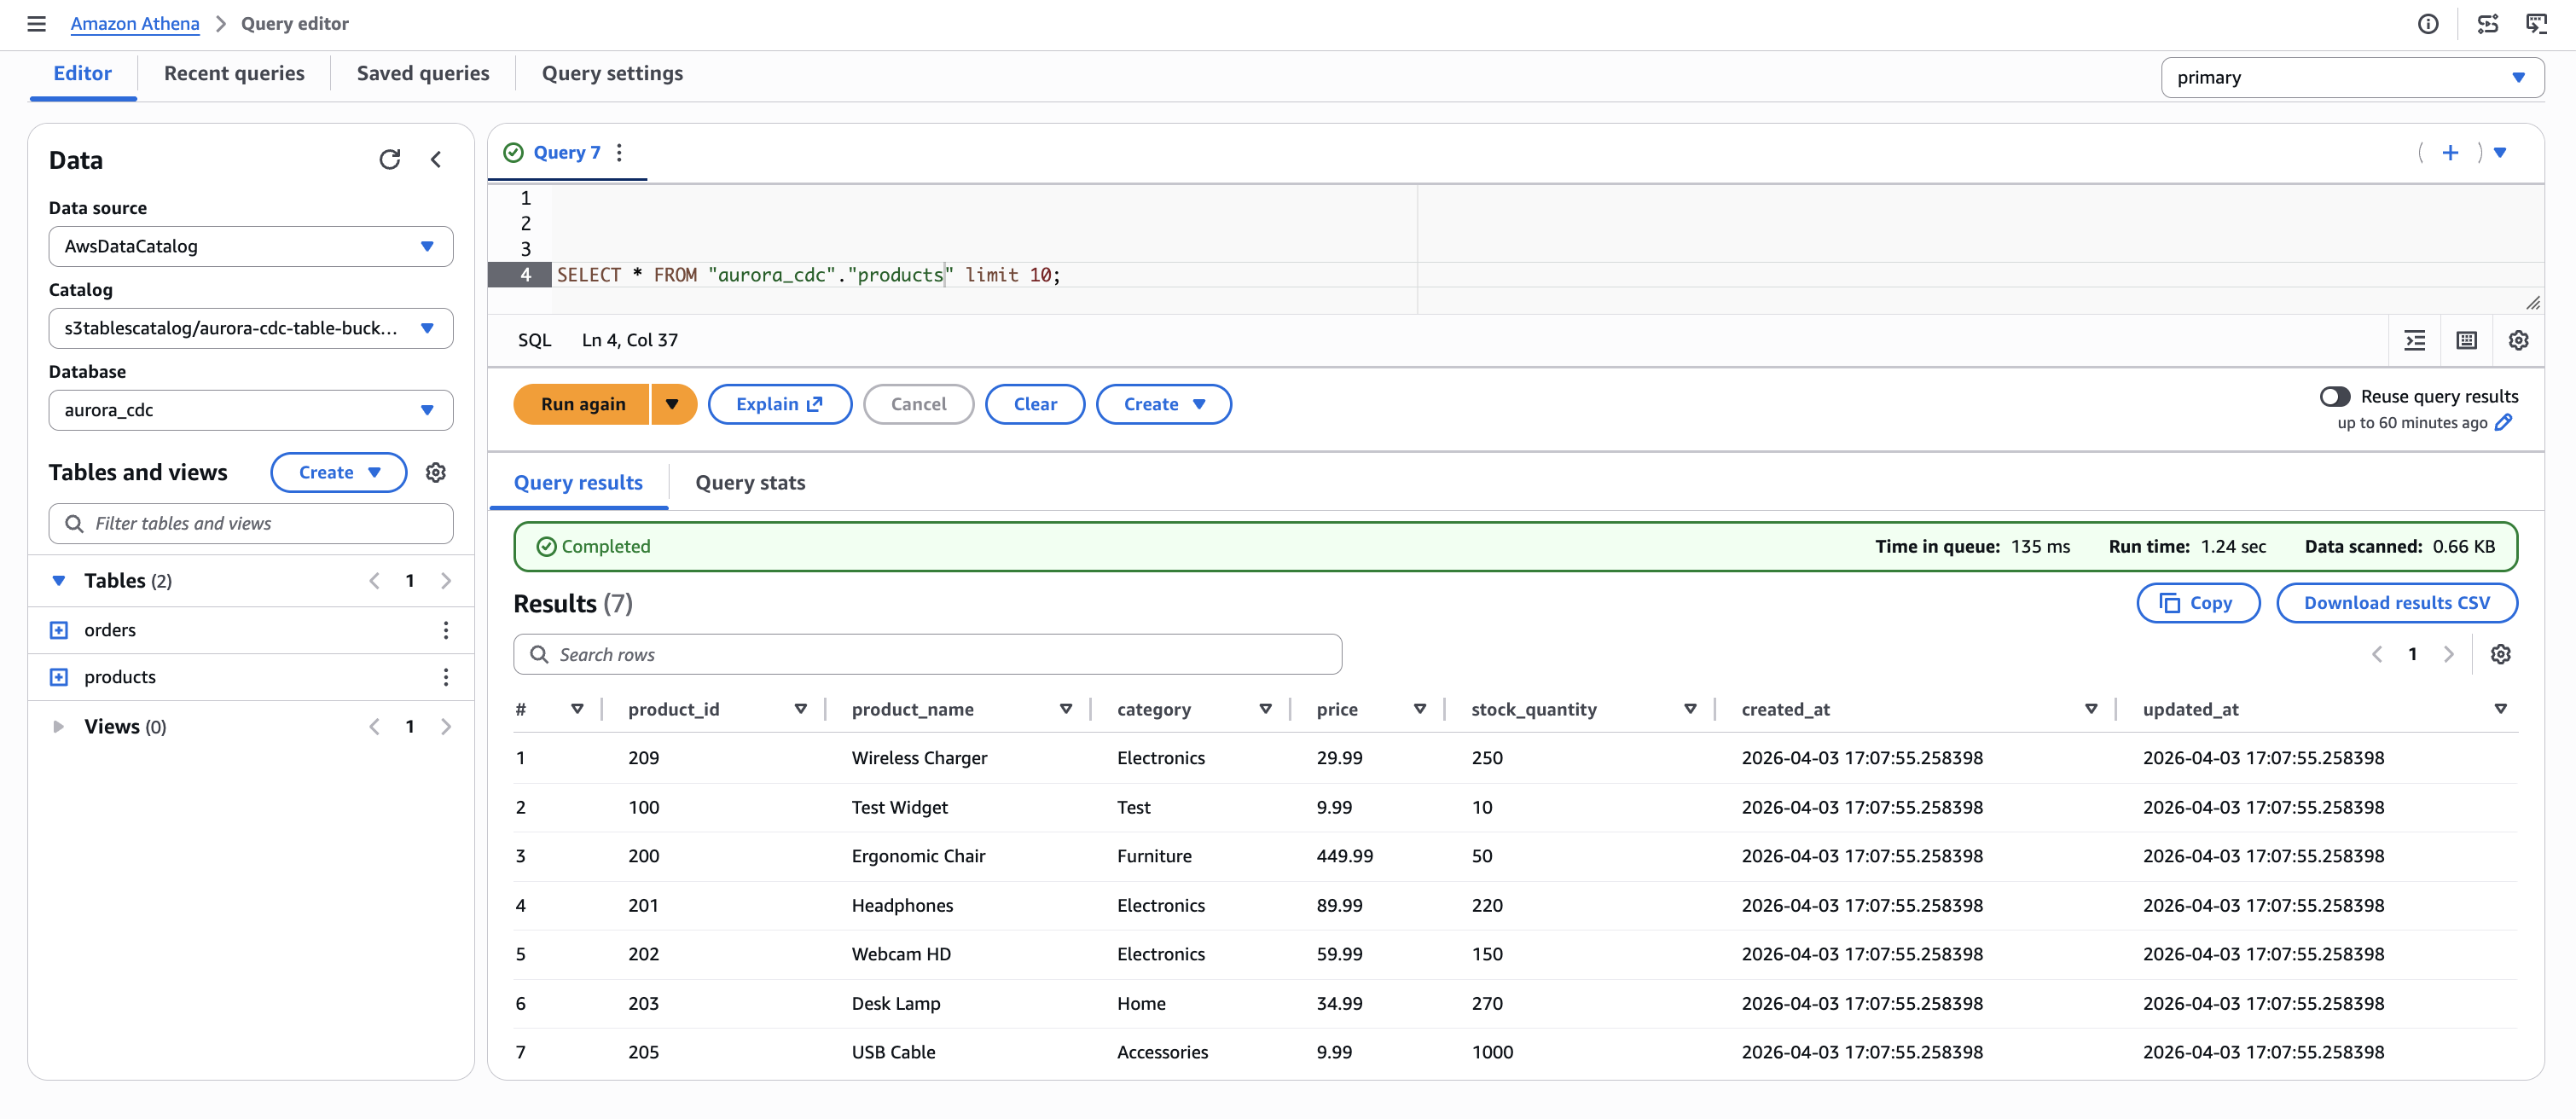
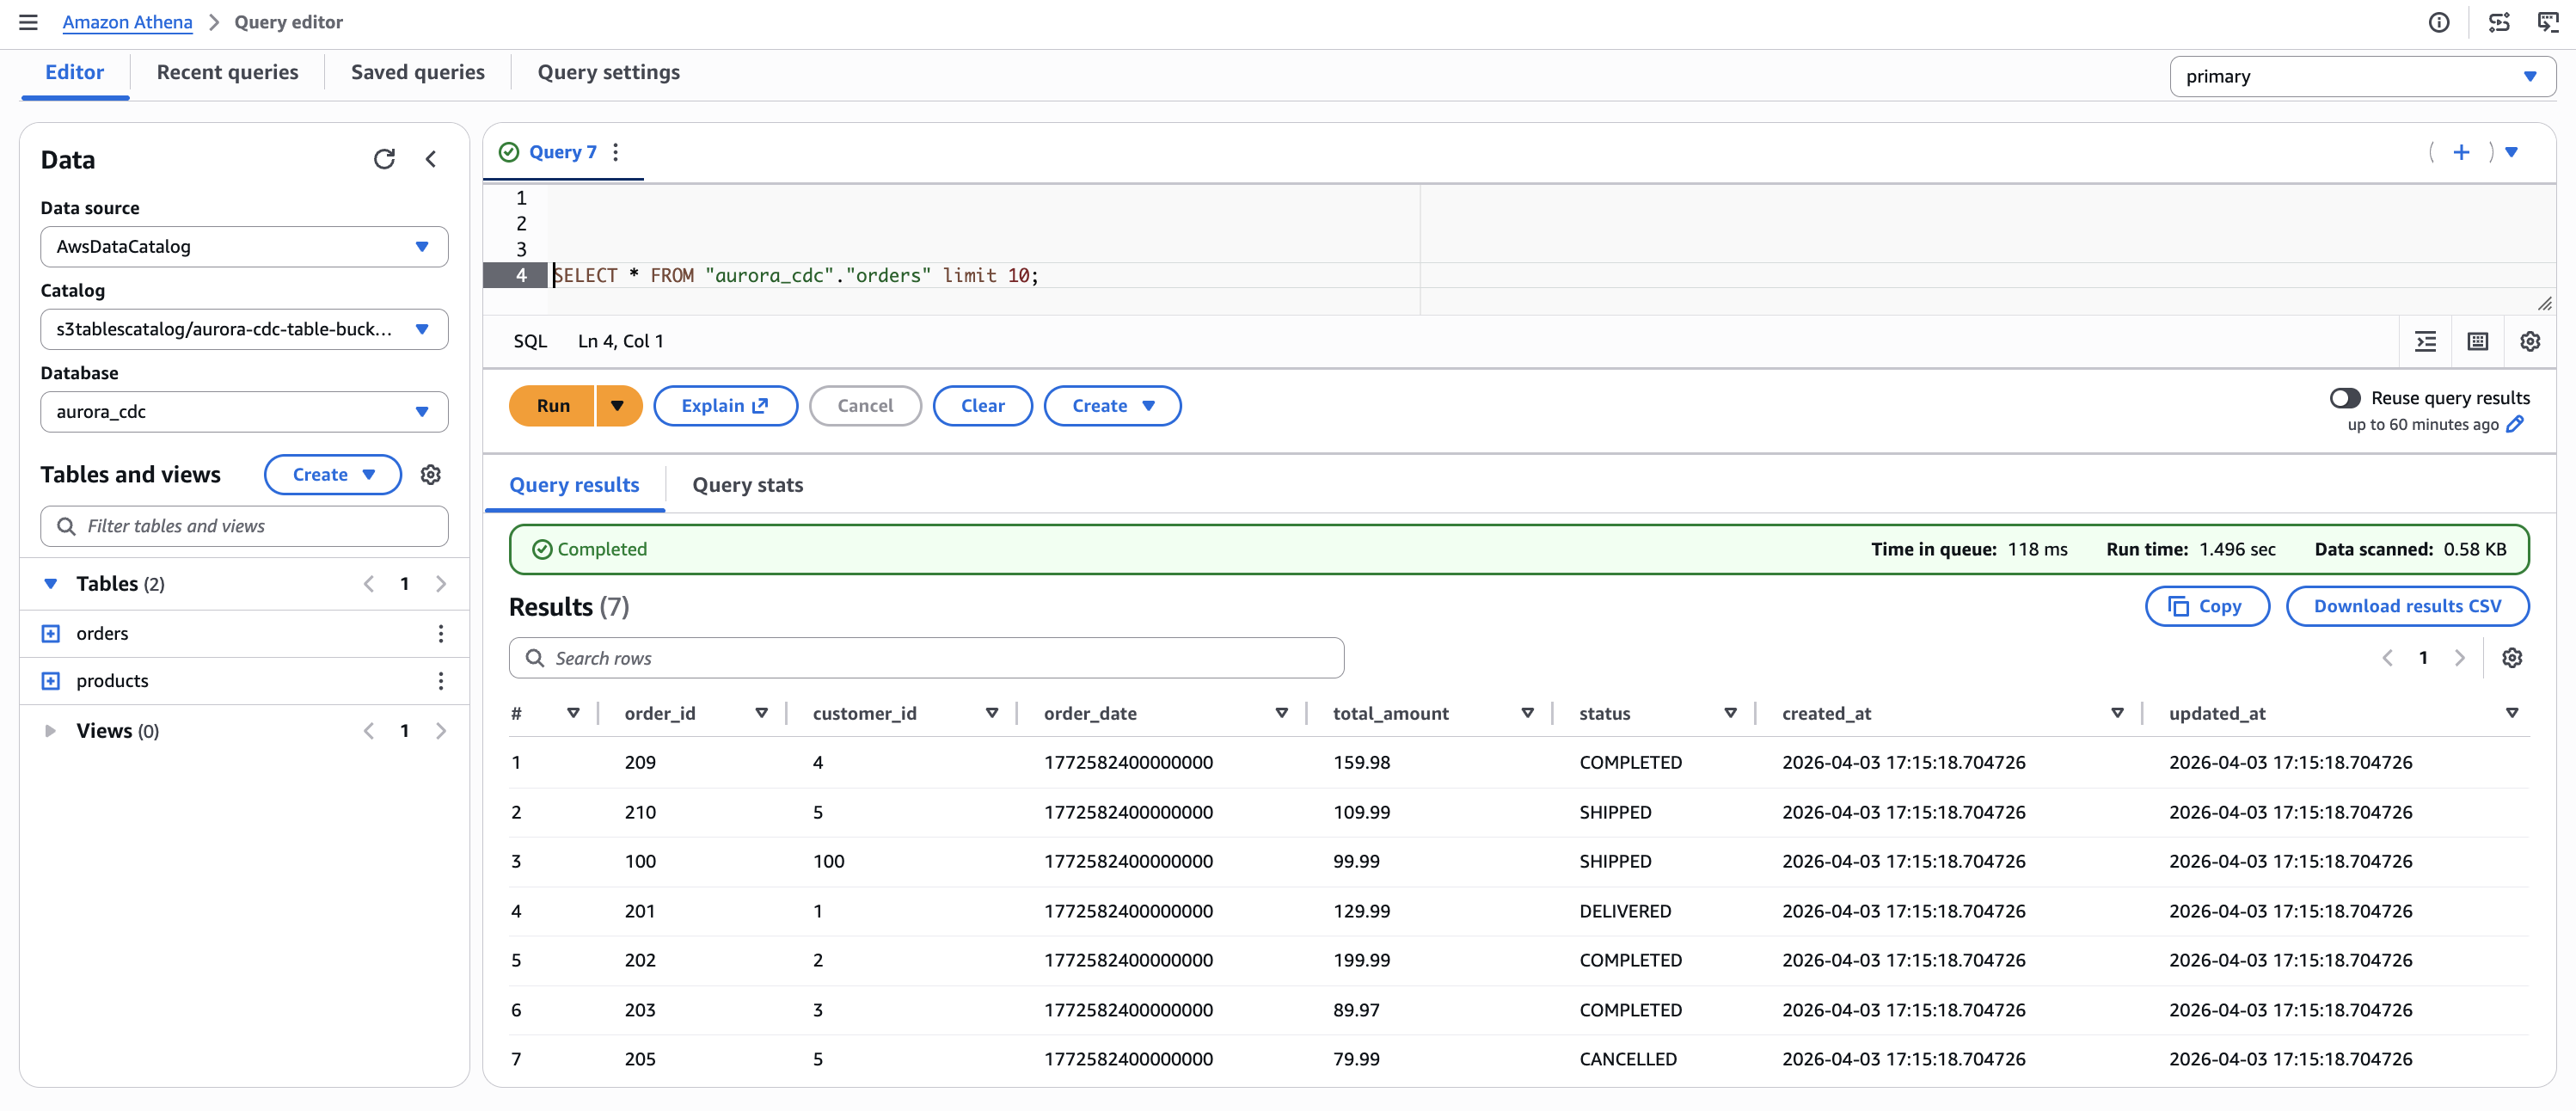
The following figures show the initial state of both tables as queried through Athena. At this point, the products table contains seven records and the orders table contains seven records, captured during the Debezium initial snapshot.

Figure 5. Initial state of the products table in Amazon Athena, showing seven records captured from Aurora PostgreSQL through the CDC pipeline.

Figure 5. Initial state of the products table in Amazon Athena, showing seven records captured from Aurora PostgreSQL through the CDC pipeline.

Figure 6. Initial state of the orders table in Amazon Athena, showing seven records captured from Aurora PostgreSQL through the CDC pipeline.

Figure 6. Initial state of the orders table in Amazon Athena, showing seven records captured from Aurora PostgreSQL through the CDC pipeline.

Now test that update and delete operations propagate correctly. Run the following statements in Aurora:

-- Insert new records
INSERT INTO public.products (product_name, category, price, stock_quantity)
VALUES ('Bluetooth Speaker', 'Electronics', 129.99, 90), ('Standing Desk', 'Furniture', 799.99, 20);
INSERT INTO public.orders (customer_id, order_date, total_amount, status)
VALUES (201, '2026-04-03', 149.99, 'NEW'), (202, '2026-04-03', 249.50, 'NEW'), (203, '2026-04-03', 79.90, 'NEW');
-- Update existing records
UPDATE public.products SET stock_quantity = 30, price = 549.99 WHERE product_name = 'Ergonomic Chair';
UPDATE public.orders SET status = 'DELIVERED' WHERE order_id = 201;
-- Delete a record
DELETE FROM public.products WHERE product_name = 'Test Widget';

Wait for the changes to propagate through the pipeline, then query Athena again. The following figures show the results after the insert, update, and delete operations have been applied.

In the products table, the Test Widget record (product_id 100) is no longer present because it was removed by the delete operation. The Ergonomic Chair row now reflects the updated price (549.99) and stock quantity (30). Two new records, Bluetooth Speaker and Standing Desk, appear with a later created_at timestamp, confirming they were inserted after the initial snapshot.

Figure 7. Products table after CDC operations. The Ergonomic Chair, Headphones, and Desk Lamp rows reflect updated values. Bluetooth Speaker and Standing Desk are newly inserted records. The Test Widget record has been removed by the delete operation.

Figure 7. Products table after CDC operations. The Ergonomic Chair, Headphones, and Desk Lamp rows reflect updated values. Bluetooth Speaker and Standing Desk are newly inserted records. The Test Widget record has been removed by the delete operation.

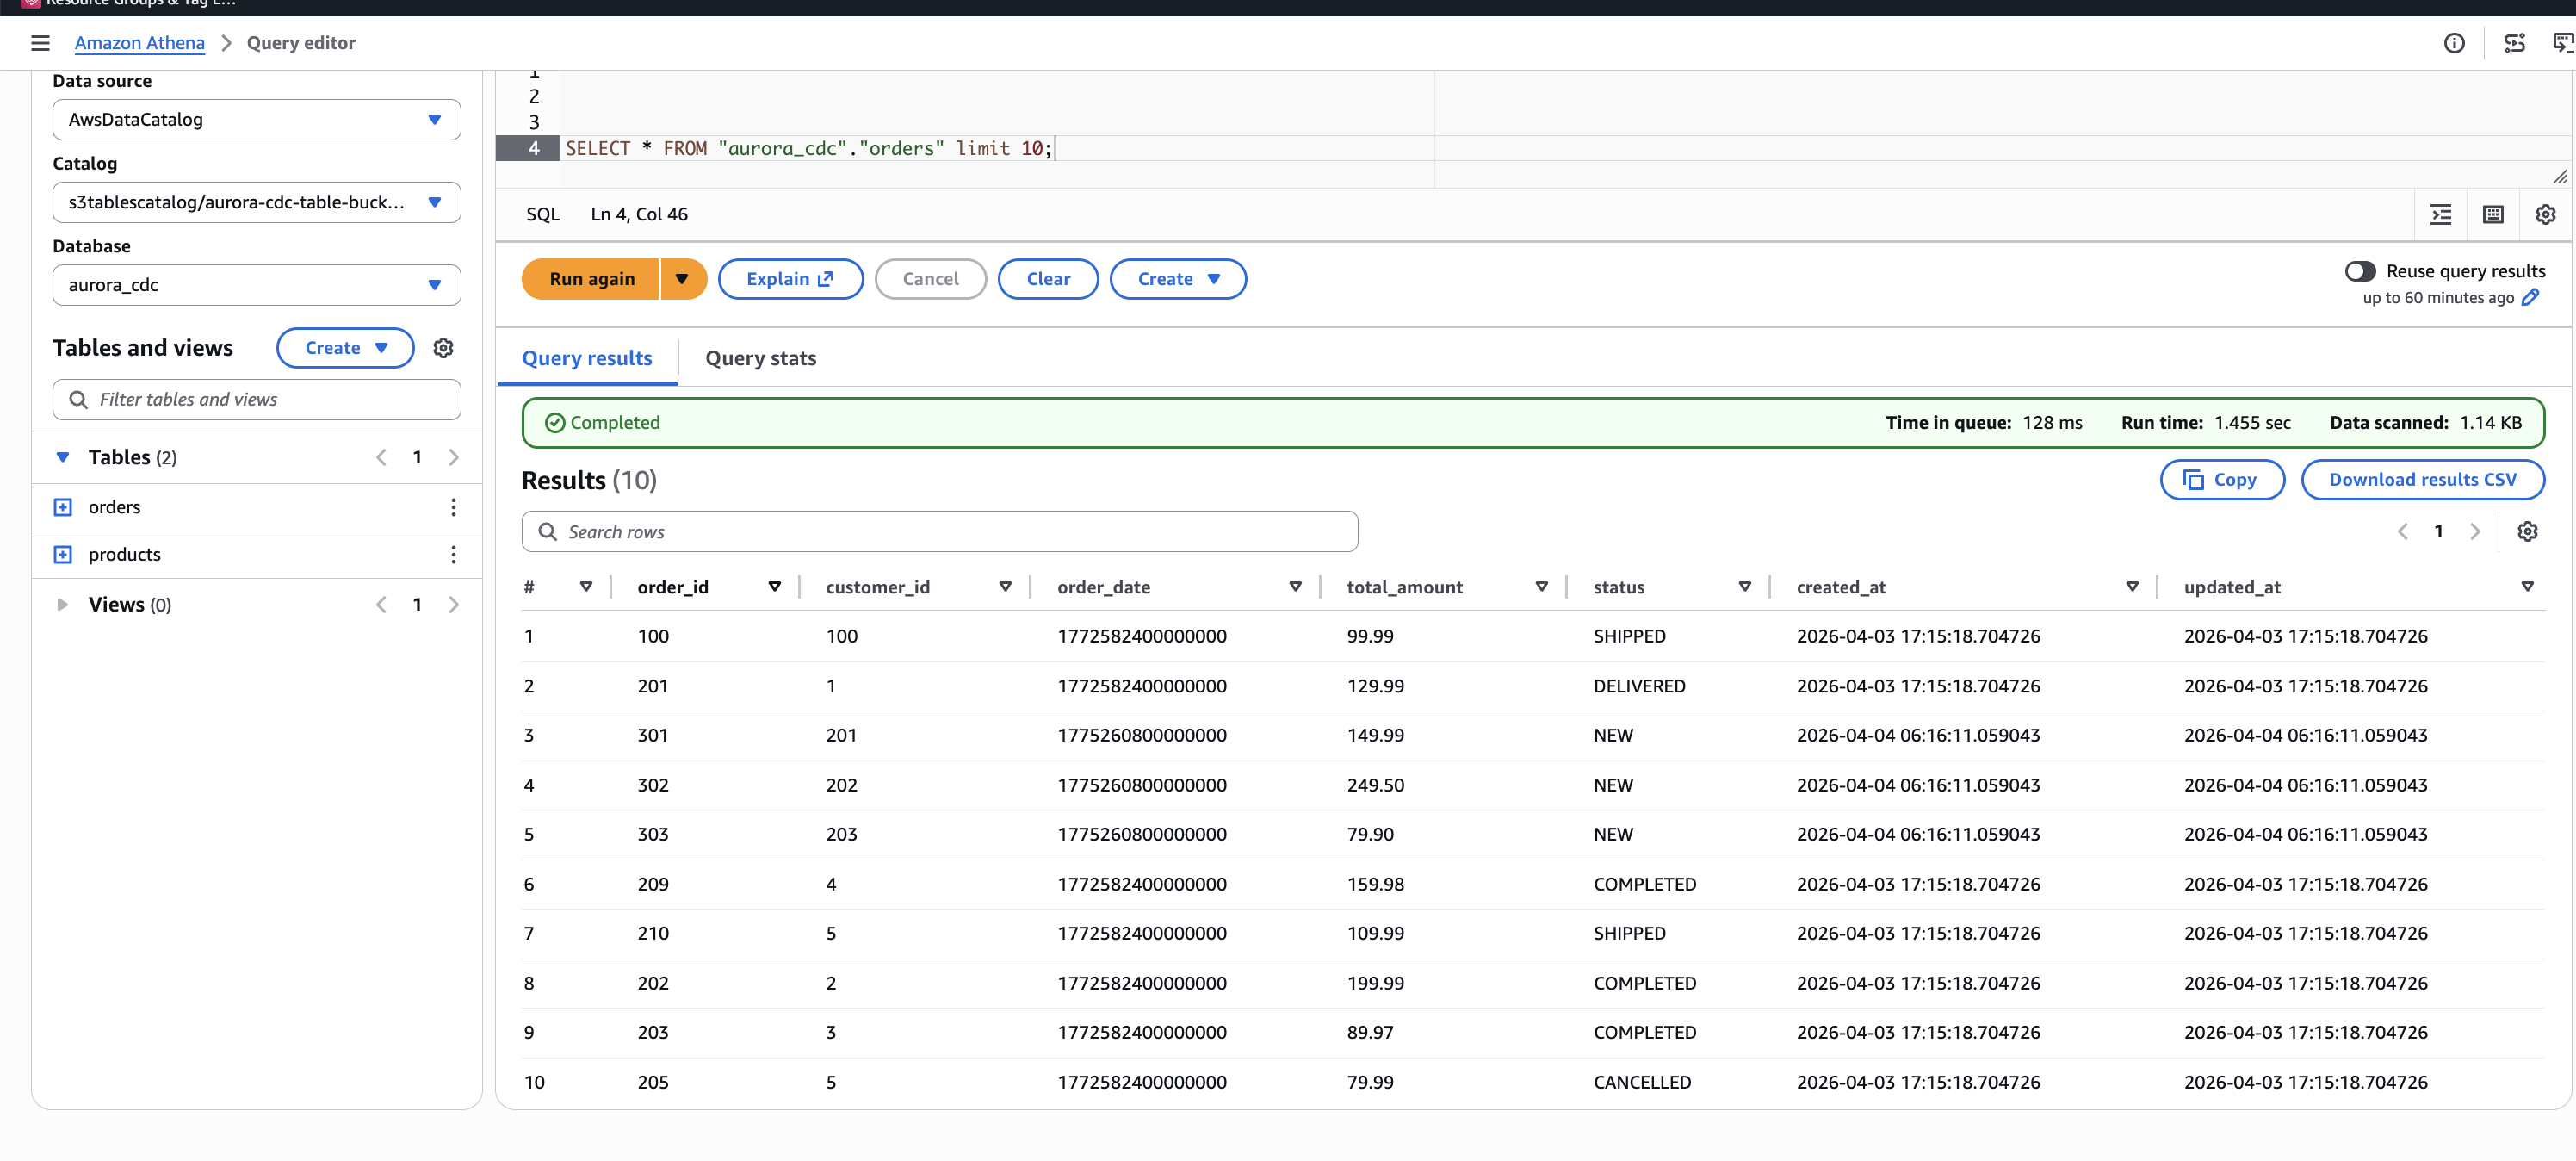
In the orders table, order 100 now shows a status of SHIPPED and order 201 shows DELIVERED, reflecting the update operations. Three new orders (301, 302, 303) appear with status NEW and a later timestamp, confirming they were inserted after the initial load.

Figure 8. Orders table after CDC operations. Orders 100 and 201 reflect updated status values. Orders 301, 302, and 303 are newly inserted records.

Figure 8. Orders table after CDC operations. Orders 100 and 201 reflect updated status values. Orders 301, 302, and 303 are newly inserted records.

This confirms that the pipeline correctly handles the three CDC operation types: inserts, updates, and deletes are captured from the Aurora WAL by Debezium, routed through the single MSK topic, transformed by the Lambda function, and applied as row-level Iceberg operations by Firehose.

S3 Tables handles compaction and snapshot management for Iceberg tables automatically, including compaction of small data files and expiration of old snapshots. You don’t need to run manual maintenance operations.

You can also use Iceberg’s time travel capability to query the table as it existed before the updates:

SELECT * FROM "s3tablescatalog/<table-bucket-name>"."aurora_cdc"."orders"
FOR TIMESTAMP AS OF current_timestamp - interval '5' minute;

This returns the original data before the update, demonstrating the time travel capability that Apache Iceberg provides through S3 Tables.

Cleaning up

To avoid ongoing charges, delete the resources in reverse dependency order.

Delete the CDK stacks:

cd cdk
npx cdk --app "npx ts-node bin/app-v2.ts" destroy --all

Delete the Debezium custom plugin and worker configuration that were created through the AWS CLI in Step 2:

aws kafkaconnect delete-custom-plugin --custom-plugin-arn <plugin-arn>
aws kafkaconnect delete-worker-configuration --worker-configuration-arn <worker-config-arn>

Clean up the Aurora PostgreSQL replication resources:

SELECT pg_drop_replication_slot('debezium_slot');
DROP PUBLICATION dbz_publication;

Important: The replication slot (debezium_slot) was created automatically by Debezium. If you plan to redeploy the pipeline later, you don’t need to drop the slot and publication. However, the replication slot continues to retain WAL segments while the connector isn’t running, which can increase storage usage on the Aurora cluster. The MSK cluster is the largest cost component of this solution and can’t be paused. It can only be deleted and recreated.

Conclusion

In this post, we showed you how to build a near real-time CDC pipeline from Aurora PostgreSQL to Apache Iceberg tables in Amazon S3 Tables. The key architectural decisions include:

  • Single-topic routing with multi-table delivery. The Debezium ByLogicalTableRouter SMT routes CDC events from multiple tables through one MSK topic, and the Lambda otfMetadata routing directs each record to the correct Iceberg table. This reduces VPC connection costs by using a single Firehose stream for inserts, updates, and deletes across multiple destination tables.
  • Fully managed CDC pipeline. MSK Connect runs Debezium, Firehose handles delivery with automatic retries, and S3 Tables manages Iceberg compaction and snapshots. The Lambda transform preserves CDC semantics by mapping Debezium operations to Iceberg row-level operations.
  • Governed lakehouse access. Lake Formation controls fine-grained access to the Iceberg tables, and data from multiple isolated Aurora clusters can be unified in a single S3 Tables namespace for cross-domain analytics.
  • Infrastructure as code. Six AWS CDK stacks deploy the core pipeline, with Lake Formation permissions, MSK cluster policy, and Debezium connector configured through documented CLI steps.

To get started, clone the sample repository and follow the walkthrough steps. For more information about the services used in this solution, see the Amazon MSK Developer Guide, Amazon Data Firehose Developer Guide, and Amazon S3 Tables User Guide.

We encourage you to try this solution and adapt it to your own CDC workloads. If you have questions or feedback, leave a comment on this post.


About the author

Chintan Agrawal

Chintan Agrawal

Chintan is a Solutions Architect with over 7 years of experience, with a specialization in Analytics and Healthcare domain. He possesses a strong enthusiasm for assisting clients in discovering valuable insights from their data. Through his expertise, he constructs innovative solutions that empower businesses to arrive at informed, data-driven choices.

Introducing the Snowflake and AWS Custom Lens for the AWS Well-Architected Framework

Post Syndicated from Nidhi Gupta original https://aws.amazon.com/blogs/architecture/introducing-the-snowflake-and-aws-custom-lens-for-the-aws-well-architected-framework/

Running Snowflake on AWS means navigating two distinct sets of best practices simultaneously: AWS Well-Architected guidance for infrastructure, and Snowflake Well-Architected Framework guidance for compute, data organization, and governance. Without a unified review framework, security controls go unmapped to Snowflake configurations. Production readiness timelines stretch as teams reconcile guidance from two separate review processes, and compliance posture becomes difficult to demonstrate when audit evidence spans disconnected sources. The Snowflake and AWS Custom Well-Architected Framework Lens closes that gap.

The lens brings together AWS Well-Architected best practices and Snowflake guidance into a single review experience, with integrated recommendations that reflect how the two services compose in production. It evaluates your architecture across the seven AWS Well-Architected pillars: security, reliability, performance efficiency, cost optimization, operational excellence, and sustainability. A single review surfaces findings like misconfigured Snowflake network policies alongside Amazon Virtual Private Cloud (Amazon VPC) controls, or cost inefficiencies that span both Snowflake virtual warehouse sizing and Amazon Elastic Compute Cloud (Amazon EC2) instance selection. In this post, we walk through each pillar, the three access points (AWS Management Console, Kiro, and Snowflake Cortex Code), and how to run your first review.

What’s in the lens?

The Snowflake and AWS Custom WAF Lens defines seven pillars for joint Snowflake-on-AWS architectures, drawing from both the seven-pillar AWS Well-Architected Framework and the five-pillar Snowflake Well-Architected Framework.

Pillar 1: Security and identity

Security for Snowflake on AWS requires coordinated identity and access controls across two distinct planes. On the AWS infrastructure side, services like AWS Key Management Service (AWS KMS), AWS IAM Identity Center, and Amazon VPC configurations govern access and encryption. On the Snowflake side, network policies, role-based access control (RBAC) hierarchies, and OAuth or key pair authentication control who can access data. The following table maps the most critical security domains (identity, network, authentication, and authorization) across both services, with integrated recommendations for where the two layers must align to help prevent unauthorized access.

Domain AWS guidance Snowflake guidance Integrated recommendation
Network security Amazon VPC design, AWS PrivateLink endpoints, AWS service endpoints, Amazon EC2 security groups Network policies, IP allow lists Use AWS PrivateLink between Amazon VPC and Snowflake; layer Snowflake network policies on top of EC2 security groups for defense-in-depth
Identity and access AWS Identity and Access Management (IAM) roles, federation, least privilege Database roles, role hierarchy, MFA Federate Snowflake authentication through AWS IAM Identity Center; map identity provider groups to Snowflake database roles for consistent RBAC
Authentication MFA for human IAM users; integrate with corporate IdP via IAM Identity Center RSA key pair for service accounts; SAML SSO or OAuth for humans; disable-password only Store private keys in AWS Secrets Manager; rotate via automation; unified IdP for both systems via SAML federation
Authorization Service control policies at organization level as hard guardrails; permission boundaries on delegated roles Role hierarchy with inheritance; SECURITYADMIN for grants separate for SYSADMIN Map AWS IAM roles 1:1 to Snowflake functional roles with workload identity federation

Pillar 2: Data governance and compliance

Protecting data itself, independent of who accesses it, spans two complementary layers. On the AWS infrastructure side, services like AWS KMS, AWS IAM Identity Center, and Amazon Simple Storage Service (Amazon S3) lifecycle policies govern encryption, classification, and retention of data at rest. On the Snowflake side, dynamic data masking, row access policies, Tri-Secret Secure, and automatic classification protect sensitive data at the query layer. The following table maps the most critical governance domains (classification, dynamic data masking, lineage, retention, and compliance) across both systems, with integrated recommendations for maintaining consistent data protection end-to-end.

Domain AWS guidance Snowflake guidance Integrated recommendation
Data protection AWS KMS customer-managed keys, Amazon S3 encryption Dynamic masking, row access policies, Tri-Secret Secure Use AWS KMS with Snowflake Tri-Secret Secure for dual-custody encryption; apply Snowflake masking policies for column-level protection
Audit and compliance AWS CloudTrail, AWS Config, AWS Security Hub Event tables, Account Usage, Access History, Sensitive data classification Stream Snowflake audit logs to Amazon CloudWatch or Amazon OpenSearch Service using Amazon S3 and Amazon EventBridge for consolidated compliance monitoring. AWS provides compliance-enabling capabilities; your team uses them to support and demonstrate compliance.
Row access policies AWS Lake Formation row-level filters, Amazon S3 Access Points for team-scoped access Row access policies for multi-tenant isolation or regional data residency; role-based row visibility Define row-level security once in Snowflake (single enforcement point); restrict AWS-side to pipeline service account

Pillar 3: Reliability

Reliability in a Snowflake on AWS architecture depends on how well the two systems coordinate during failure scenarios, from AWS infrastructure disruptions to Snowflake service availability events. The following table covers the key reliability domains, including cross-Region replication, failover configuration, and workload isolation, with integrated guidance for building a resilient architecture across both systems.

Domain AWS guidance Snowflake guidance Integrated recommendation
Disaster recovery Multi-AZ, cross-Region replication, Amazon Route 53 failover Database replication, failover groups, client redirect Configure Snowflake cross-Region replication to a secondary AWS Region; use Snowflake client redirect for automated failover to the secondary Region
Data durability Amazon S3 11-nines durability, versioning Time Travel, Fail-safe, zero-copy clones Align Snowflake Time Travel retention with Amazon S3 versioning policies; use zero-copy clones for pre-deployment testing without storage overhead
Recovery objectives RTO and RPO planning, backup strategies Replication lag monitoring, failover SLAs Define joint RTO and RPO targets that account for both Snowflake replication lag and AWS infrastructure recovery time

Pillar 4: Performance optimization

Performance efficiency for Snowflake on AWS requires tuning at both the infrastructure and application levels. AWS instance selection, network throughput, and storage configuration directly affect how Snowflake warehouses perform. Snowflake-specific patterns like warehouse sizing, query optimization, and clustering keys determine how efficiently compute is used. The following table covers the primary performance domains with integrated recommendations for both layers.

Domain AWS guidance Snowflake guidance Integrated recommendation
Compute sizing Amazon EC2 instance selection, automatic scaling Warehouse sizing, multi-cluster warehouses, auto-suspend Right-size Snowflake warehouses based on query profiling; use multi-cluster warehouses for concurrency scaling aligned with application tier automatic scaling
Data organization Amazon S3 partitioning, file format optimization Clustering keys, search optimization, materialized views Optimize Amazon S3 staging file sizes for Snowpipe ingestion; apply clustering keys on frequently filtered columns, ordered from lowest to highest cardinality Note: This ordering is specific to Snowflake’s micro-partition architecture. Unlike traditional databases where high-cardinality columns are typically indexed first, Snowflake achieves better partition pruning when the lowest-cardinality column leads the clustering key.
Caching and latency Amazon CloudFront, Amazon ElastiCache Result cache, warehouse cache, query acceleration Design query patterns to maximize Snowflake result cache hits; use Amazon ElastiCache for application-layer caching of frequently accessed Snowflake results

Pillar 5: Cost optimization and FinOps

Cost optimization across Snowflake and AWS involves two distinct billing models that you must manage together. AWS infrastructure costs follow a consumption and reservation model, and Snowflake charges are driven by compute credits and storage. Without a unified view, teams often optimize one application at the expense of the other. The following table addresses the key cost domains with integrated recommendations for reducing spend across both billing models.

Domain AWS guidance Snowflake guidance Integrated recommendation
Cost visibility AWS Cost Explorer, AWS Budgets, AWS Cost and Usage Reports (CUR) Resource monitors, account usage views, credit tracking Combine AWS Cost Explorer data with Snowflake credit consumption in an integrated FinOps dashboard; tag resources with matching cost-center labels
Compute efficiency

AWS Savings Plans, Amazon EC2 Spot Instances

Note: Savings Plans and Spot apply to customer-managed AWS compute (ETL pipelines, application tier) that feeds Snowflake, not to Snowflake warehouse compute itself.

Auto-suspend, warehouse right-sizing, serverless features Pair Snowflake capacity commitments with AWS Savings Plans for predictable baseline; use auto-suspend aggressively for development warehouses
Storage efficiency Amazon S3 lifecycle policies, S3 Intelligent-Tiering Time Travel retention optimization, transient tables Align Snowflake Time Travel retention (1 day for development, 90 days for regulated data) with Amazon S3 lifecycle transitions to Amazon S3 Glacier

Pillar 6: Operational excellence

Operational excellence for Snowflake on AWS means building observability, automation, and incident response workflows that span both applications. Amazon CloudWatch, AWS Systems Manager, and Snowflake’s query history and task monitoring each provide partial visibility, but a well-operated architecture connects them into a coherent operational picture. The following table covers the core operational domains with integrated guidance for managing both applications as a single system.

Domain AWS guidance Snowflake guidance Integrated recommendation
Monitoring Amazon CloudWatch, AWS X-Ray, Amazon OpenSearch Service Snowsight dashboards, Account Usage, query history Export Snowflake metrics to Amazon CloudWatch using Amazon S3 integration for unified operational dashboards
Automation and IaC AWS CloudFormation, AWS Cloud Development Kit (AWS CDK), Terraform Snowflake Terraform provider, CI/CD pipelines Manage Snowflake objects alongside AWS infrastructure in the same Terraform state; use CI/CD pipelines for database migration workflows
Incident response Amazon EventBridge, Amazon Simple Notification Service (Amazon SNS), AWS Lambda auto-remediation Alerts, resource monitors, task monitoring Trigger AWS Lambda auto-remediation from Snowflake resource monitor alerts via notification integrations and Amazon SNS

Pillar 7: Sustainability

This is the first joint ISV-AWS WAF lens to treat the sustainability pillar as a first-class concern. For Snowflake on AWS, sustainability decisions span AWS Region selection and energy efficiency choices on the infrastructure side, and warehouse consolidation, query efficiency, and data lifecycle management on the Snowflake side. The following table covers the sustainability domains with integrated recommendations that reduce the environmental footprint of your combined architecture.

Domain AWS guidance Snowflake guidance Integrated recommendation
Region selection AWS Customer Carbon Footprint Tool, region-level carbon intensity Snowflake Region availability Select AWS Regions aligned with sustainability goals for non-latency-sensitive Snowflake workloads; prefer secondary Regions with high renewable energy percentages for DR
Compute efficiency AWS Compute Optimizer, Amazon EC2 Auto Scaling Warehouse auto-suspend, serverless tasks Enforce aggressive auto-suspend policies for development and batch workloads to alleviate idle compute; prefer serverless features for intermittent workloads
Data lifecycle Amazon S3 Intelligent-Tiering, Amazon S3 Glacier lifecycle policies Time Travel retention, transient tables, zero-copy clones Minimize storage footprint by aligning Time Travel retention to actual recovery needs; replace full data copies with zero-copy clones for development and testing
Query efficiency Batch and real-time processing best practices Query profiling, clustering keys, materialized views, result caching Optimize query patterns to reduce total compute-seconds; apply clustering keys to avoid full table scans

Three ways to use the lens

You can access the lens across three environments, each designed for a different workflow and team preference. Whether your team works primarily in the AWS Management Console, prefers an AI-assisted review inside an IDE, or operates within Snowflake, you can run a full Well-Architected review without switching contexts.

1. AWS Well-Architected Tool console

The lens is available directly in the AWS Well-Architected Tool console for structured reviews against your Snowflake on AWS workloads. A structured questionnaire covers all seven pillars with Snowflake-specific questions, and each best practice is risk-rated as High Risk, Medium Risk, or No Risk Identified. The review generates an improvement plan with prioritized actions and links to AWS and Snowflake documentation, milestone tracking to measure progress over time, and PDF or JSON export for stakeholder reporting and compliance evidence.

AWS Well-Architected Tool console showing the Snowflake and AWS custom lens applied to a workload

To get started:

  1. Download the Snowflake AWS Custom Lens JSON file to your local computer.
  2. Sign in to the AWS Well-Architected Tool console and choose Custom lenses in the navigation pane.
  3. Choose Create custom lens, upload the downloaded JSON file, and choose Submit.

2. Kiro

For teams that prefer an AI-assisted, conversational approach, the Snowflake and AWS WAF Lens is available as a Kiro Power, an integrated capability within Kiro, the AI-powered IDE of AWS. The review runs conversationally inside the IDE with checkbox-based questions for each pillar, so you can avoid navigating a separate console. Findings are classified using a Red, Yellow, Green system for quick risk identification. Recommendations are organized into three time horizons: Now (1–2 weeks), Next (30–60 days), and Later (90 or more days). The output includes automation mapping for Proactive Health Checks and Blueprint defaults, and supports both customer-ready and internal delivery plan formats. Guidance is context-aware, accounting for your specific workload type, compliance requirements, and multi-Region needs.

Kiro IDE running the Snowflake WAF Power with checkbox questions for the security pillar

To get started:

  1. Download the Snowflake WAF Power to your local computer and unzip it.
  2. In Kiro, choose Open Folder and select the unzipped folder.
  3. Enter “Run a Snowflake and AWS WAF review” in the chat to begin.

3. Snowflake Cortex Code

In addition to using the AWS Well-Architected Tool and Kiro, you can also opt for the Cortex Code coding assistant path. The joint Well-Architected review is packaged as a Cortex Code skill that you can invoke to start the review process. When invoked, the skill opens with an architecture overview and asks how you want to proceed. You can run the full review interactively with AI-guided recommendations. Cortex Code is available as both a CLI and directly within Snowsight, so you can choose whichever fits your workflow.

Option A: Cortex Code CLI (local terminal)

Cortex Code CLI prompt running the joint-waf-aws-lens skill in a terminal window

To get started:

    1. Download the Cortex Code zip file for AWS WAF Lens to a location that you want on your local computer and unzip it.


  1. Open a terminal window on your computer and enter cortex skill add <path_to_the_unzipped_folder> at the shell prompt. The following screenshot shows an example.

Terminal output confirming successful addition of the joint-waf-aws-lens skill to Cortex Code

  • Launch Cortex Code CLI by entering cortex at the shell prompt.
  • In the Cortex Code CLI chat window, enter invoke the joint-waf-aws-lens skill to get started.

Option B: Cortex Code in Snowsight (browser-based)

For teams that prefer to stay within the Snowflake UI, Cortex Code is also available directly in Snowsight, with no local install required.

Cortex Code assistant panel in Snowsight with the joint-waf skill loaded as context

To get started:

  • Download the Cortex Code zip file for AWS WAF Lens and unzip it.
  • In Snowsight, navigate to Projects > Workspaces and open (or create) a workspace where you want to run this skill.
  • Choose the Cortex Code icon in the lower-right corner of Snowsight to open the assistant panel.
  • Choose + Add context in the chat area of the assistant panel and select Upload Skill Folder(s), then choose the unzipped skill folder.
  • In the message box, enter run the joint-waf skill and press Enter to begin the review.

How the pillars come together

What makes this lens unique is that it integrates AWS infrastructure guidance directly into Snowflake-specific best practices.

Rather than running separate reviews for each application, the lens helps identify Snowflake architectural risks alongside the corresponding AWS remediation paths, showing where both layers need to be aligned.

Built for Snowflake on AWS

This lens reflects integrated expertise across both services:

  1. Unified security model – AWS provides network isolation, encryption infrastructure, and identity federation. Snowflake provides data-layer protections like dynamic masking, row access policies, and Tri-Secret Secure. The lens shows how these layers compose into a coherent security posture.
  2. FinOps integration – The cost pillar addresses the challenge of optimizing spend across two billing models: AWS infrastructure costs and Snowflake consumption costs.
  3. Operational coherence – The operational excellence pillar bridges AWS-native observability (Amazon CloudWatch, Amazon OpenSearch Service) and Snowflake-native monitoring (Snowsight, Account Usage), so you can build connected dashboards and incident response workflows that span both services.
  4. Sustainability as a first-class pillar – This is the first joint ISV-AWS WAF lens to include sustainability as a first-class pillar. It combines AWS Region selection strategies with warehouse consolidation, query efficiency optimization, and data lifecycle management.

Getting started with the Snowflake and AWS WAF Lens

To get the most out of your first review, start with the Security and Reliability pillars, where integrated AWS and Snowflake guidance surfaces the highest-impact findings for most production workloads. Use the improvement plan output to prioritize actions across your team, and export the results as PDF or JSON for stakeholder reporting and compliance evidence.

The following resources will help you go deeper on the AWS services and Snowflake capabilities referenced throughout this post.

  1. AWS Well-Architected Tool
  2. AWS Well-Architected Framework
  3. Kiro Documentation
  4. Snowflake Cortex Code
  5. Snowflake WAF
  6. Tri-Secret Secure in Snowflake
  7. Snowflake Snowpipe
  8. Snowflake zero-copy cloning
  9. Snowflake Workload Identity Federation
  10. Snowflake sensitive data classification

What’s next

This is the first release of the Snowflake and AWS WAF Lens, and we’re actively expanding its coverage with deeper guidance on Snowflake on AWS architecture.

We’re committed to making Snowflake on AWS well-architected in the cloud. Start your first review in either the AWS Well-Architected Tool or Snowflake Cortex Code CLI today, or reach out to your AWS account team or Snowflake account team to schedule a guided workshop.


About the authors

Now available: Amazon EC2 M9g and M9gd instances powered by new AWS Graviton5 processors

Post Syndicated from Esra Kayabali original https://aws.amazon.com/blogs/aws/now-available-amazon-ec2-m9g-and-m9gd-instances-powered-by-new-aws-graviton5-processors/

AWS Graviton processors have improved steadily across generations, with each iteration delivering advances in compute performance, price-performance, and energy efficiency. At re:Invent 2025, we announced Amazon EC2 M9g, the first Graviton5-powered instances, in preview. Since then, customers have tested M9g across a wide range of workloads and shared their results. ClickHouse saw a 36% performance boost compared to M8g, with zero code changes. Honeycomb achieved 36% better throughput per core compared to Graviton4, across a 6-month A/B test of production observability workloads. HubSpot deployed M9g for MySQL databases and saw query duration drop by up to 60%. Today, M9g instances are generally available, alongside the new M9gd instances for customers who need high-speed, low-latency local NVMe SSD storage. Both are powered by Graviton5, the most powerful and most energy efficient processor AWS has ever built.

While many Arm-based instances have been introduced across the industry, no one comes close to the breadth and depth of the AWS Graviton footprint. After five generations of custom silicon and eight years of continuous investment, Graviton powers over 350 instance types serving more than 120,000 customers, from startups to large enterprises, a robust ISV partner ecosystem, and a broad set of managed services. You can use Graviton for a broad variety of workloads, including web applications, microservices, analytics, databases, machine learning (ML) inference, electronic design automation (EDA), gaming, and video encoding. As workloads grow more compute-intensive and data-driven, many have asked for more processing power, along with greater network and storage bandwidth to move more data and complete workloads faster. We’ve also designed these instances to efficiently package compute, memory, and I/O to maximize energy utilization.

As AI shifts from answering questions to taking actions, running code, using tools, evaluating results, and orchestrating multi-step tasks, the demand for CPU compute is growing rapidly. Graviton5 is built for this shift. With 192 cores, a 5x larger L3 cache, up to 33% lower inter-core latency, and DDR5 memory delivering high bandwidth, Graviton5 helps agents spend less time waiting on CPU-bound steps, processing more instructions, handling large numbers of concurrent environments, and keeping accelerators moving.

Meta is deploying Graviton at scale starting with tens of millions of cores to support its agentic AI efforts, making Meta one of the largest Graviton customers in the world. Agentic AI workloads, including real-time reasoning, code generation, and the orchestration of multi-step tasks, are CPU-intensive and benefit from the higher compute performance, larger caches, higher memory bandwidth, and core density in Graviton5.

What’s new in M9g and M9gd
Built on the sixth-generation AWS Nitro System, M9g instances are powered by AWS Graviton5 processors that deliver higher compute performance, larger caches, and improved memory and I/O scalability compared to Graviton4 processors. Graviton5 offers up to 25% better compute performance compared to Graviton4-based instances, with up to 35% faster performance for web applications, up to 35% for machine learning inference, and up to 30% for databases. As the first CPU in the AWS fleet to support the latest generation of PCIe Gen6 and DDR5-8800 memory, AWS Graviton5 instances deliver the fastest memory of any processor instances in the cloud, and 5 times more L3 cache compared to the previous generation. These improvements also come with better energy efficiency, helping you meet sustainability targets without compromising capability.

Networking and storage bandwidth have been expanded to keep pace with compute growth. M9g and M9gd instances offer up to 15% higher network bandwidth and 20% higher Amazon Elastic Block Store (Amazon EBS) bandwidth on average across sizes, with up to twice the network bandwidth for the largest instance size. M9g and M9gd instances also support Instance Bandwidth Configuration (IBC), a feature that helps you adjust the allocation of bandwidth between Amazon EBS and Amazon Virtual Private Cloud (Amazon VPC) networking for an Amazon EC2 instance by up to 25%. IBC can help optimize performance for workloads with specific bandwidth requirements, such as database read and write performance, query processing, and logging. These enhancements support faster data movement and improved throughput for workloads that rely on high I/O performance.

Security and isolation are foundational requirements for running workloads in the cloud. Within the Nitro System, the AWS Nitro Hypervisor is designed to isolate instances from each other as well as AWS operators. With M9g and M9gd instances we are raising the bar on security even further with the introduction of Nitro Isolation Engine. Nitro Isolation Engine is an enhancement to the Nitro System, which enforces isolation of instances and harnesses formal verification to provide assurances of isolation with mathematical precision. Nitro Isolation Engine is a purpose-built component that is responsible for enforcing isolation between virtual machines, including mediation of all access to virtual machine memory, CPU register state, and I/O devices through a minimal set of APIs. Nitro Isolation Engine leverages formal verification, a technique to mathematically demonstrate that the hardware or software behaves as intended, and not just in specific test cases. This intensive verification technique establishes Nitro as the first formally verified cloud hypervisor, pioneering a new standard for mathematically proven cloud security.

M9g instances provide one vCPU for every four GiB of memory and are well suited for a broad range of general-purpose workloads, including application servers, microservices, midsize data stores, gaming servers, caching fleets, containerized applications, large-scale Java applications, code repositories, web applications, and agentic AI.

For workloads that need high-speed, low-latency local storage, M9gd instances provide up to 11.4 TB of NVMe SSD storage and 30% higher IOPS and storage performance compared to Graviton4-based M8gd instances. M9gd instances are well suited for general-purpose workloads that require a balance of compute and memory with high-speed, low-latency local storage, including application servers, microservices, gaming servers, midsize key-value data stores, caching fleets, data logging, media processing, batch and log processing, and applications that need temporary storage such as caches and scratch files.

Here are the key specifications across the family:

M9g vCPUs Memory (GiB) Network bandwidth (Gbps) EBS bandwidth (Gbps)
medium 1 4 Up to 15 Up to 12
large 2 8 Up to 15 Up to 12
xlarge 4 16 Up to 15 Up to 12
2xlarge 8 32 Up to 17 Up to 12
4xlarge 16 64 Up to 17 Up to 12
8xlarge 32 128 17 12
12xlarge 48 192 25 18
16xlarge 64 256 34 24
24xlarge 96 384 50 36
48xlarge 192 768 100 72
metal-48xl 192 768 100 72

M9gd instances include local NVMe SSD storage. The table below shows the instance storage for each size. Compute, memory, network, and EBS bandwidth specifications are the same as M9g.

M9gd vCPUs Memory (GiB) Instance storage (GB) Network bandwidth (Gbps) EBS bandwidth (Gbps)
medium 1 4 1 x 59 NVMe SSD Up to 15 Up to 12
large 2 8 1 x 118 NVMe SSD Up to 15 Up to 12
xlarge 4 16 1 x 237 NVMe SSD Up to 15 Up to 12
2xlarge 8 32 1 x 475 NVMe SSD Up to 17 Up to 12
4xlarge 16 64 1 x 950 NVMe SSD Up to 17 Up to 12
8xlarge 32 128 1 x 1900 NVMe SSD 17 12
12xlarge 48 192 3 x 950 NVMe SSD 25 18
16xlarge 64 256 1 x 3800 NVMe SSD 34 24
24xlarge 96 384 3 x 1900 NVMe SSD 50 36
48xlarge 192 768 3 x 3800 NVMe SSD 100 72
metal-48xl 192 768 3 x 3800 NVMe SSD 100 72

Now available
M9g and M9gd instances are available in the US East (N. Virginia), US East (Ohio), US West (Oregon), and Europe (Frankfurt) Regions. M9g and M9gd instances are available for purchase through Savings Plans, On-Demand, Spot Instances, Dedicated Instances, or Dedicated Hosts. For more information, visit Amazon EC2 pricing.

To get started with M9g and M9gd instances, several resources are available. The AWS Graviton Getting Started Guide is a technical guide covering how to build, run, and optimize workloads on Graviton-based instances. The Graviton Savings Dashboard helps you track and measure the cost savings from running workloads on Graviton-based instances. And AWS Transform is an AI-powered service that automates code transformations for migrating Java applications from x86 to Graviton-based Amazon EC2 instances, handling compatibility analysis, automated recompilation, dependency updates, and validation.

To learn more about Graviton-based instances, visit AWS Graviton Processors or Level up your compute with AWS Graviton.

— Esra

[$] AI agent runs amok in Fedora and elsewhere

Post Syndicated from jzb original https://lwn.net/Articles/1077035/

Agentic AI systems can be used to do a variety of things
autonomously on behalf of a human user: open or manage bugs, generate
code, submit pull-requests, and (apparently) even complain about
rejection
. In May, a Fedora developer discovered that an allegedly
rogue agent had been pestering the project in a number of ways:
reassigning bugs, fabricating unhelpful replies to bugs, and even
persuading maintainers to merge questionable code into the Anaconda
installer
. It also submitted a number of pull requests (PRs),
some accepted, to several upstream projects. The Fedora account
associated with the agent has had its group privileges revoked and the
messes have been mopped up, but the motive behind the agent’s actions is still
a mystery.

Security updates for Wednesday

Post Syndicated from jzb original https://lwn.net/Articles/1077362/

Security updates have been issued by AlmaLinux (poppler), Debian (dnsmasq, mistral, okular, openssl, poppler, and strongswan), Fedora (exim, firefox, pcs, putty, and xorg-x11-server), Mageia (freeciv, golang-x-net, jq, libssh, libxmp, libxpm, minetest, ruby-net-ssh, tor, and wireshark), SUSE (389-ds, ack, agama-web-ui, amazon-ssm-agent, avahi, dpkg, elemental-register, elemental-system-agent, elemental-toolkit, ggml-devel-9500, go1.25, go1.26, kernel, kubernetes1.23, kubernetes1.24, kubernetes1.26, libsoup, mariadb, netty, netty-tcnative, NetworkManager, nginx, perl-CryptX, perl-XML-LibXML, podofo, polkit, python-Django, python-requests, samba, strongswan, vim, and xen), and Ubuntu (cyborg, gdk-pixbuf, golang-golang-x-net-dev, nginx, node-lodash, openssl, openssl, openssl1.0, qemu, tomcat9, tomcat10, and vim).

Route public traffic to private applications with Cloudflare

Post Syndicated from Enrique Somoza original https://blog.cloudflare.com/private-origins-dns-routing/

For most of the Internet’s history, public and private infrastructure operated as separate worlds. Public applications lived behind content delivery networks (CDNs) and web application firewalls (WAFs). Private applications lived behind virtual private networks (VPNs), firewalls, and separate operational stacks. We think that distinction is becoming obsolete.

Many of the applications organizations care about are not public websites. They are internal APIs, AI agent backends, MCP servers, operational tools, and services that were never designed to be exposed to the public Internet. Yet these applications still need modern security, performance, and programmability services. Security should be a property of the traffic reaching an application, not an accident of where the application happens to sit.

Until now, applying those services to private applications often required public IPs, firewall exceptions, connector software, or complex networking. As a result, many private applications missed out on capabilities such as WAF, bot management, rate limiting, caching, traffic acceleration, rewrites, and Workers, despite needing the same protections and controls as public-facing applications.

Today, we’re launching Application Services for Private Origins in closed beta for eligible Enterprise customers. Customers can now securely route traffic to private origins without exposing those origins to the public Internet. This allows Cloudflare’s security, performance, and programmability services to protect applications running on private networks, just as they do for public Internet applications.

WAF rules, bot management, rate limiting, caching, rewrites, and Workers can now sit in front of private origins without requiring public IP exposure, inbound firewall rules, or cloudflared running on the origin.

Four use cases, one application layer

This routing model builds on connectivity patterns Cloudflare already supports today through Cloudflare Tunnel, Cloudflare One Client, and private network integrations. For years, Cloudflare Tunnel has allowed customers to route public traffic to private applications through cloudflared. This new capability extends the same model to existing Cloudflare WAN or Cloudflare Mesh connectivity without requiring connector software running on the origin.

Much of that connectivity is orchestrated through Cloudflare’s private networking routing layer that determines how traffic reaches private destinations across Cloudflare Tunnels, Virtual Networks, Cloudflare Mesh, and other connectivity models. Customers can define their routing behavior through APIs and the dashboard instead of managing separate networking stacks for each product.

We have extended Cloudflare’s private networking layer directly into the application services stack, allowing security and performance proxy infrastructure to treat private IPs as valid origin targets for public hostnames. As a result, the same private IPs previously reachable only through Cloudflare Tunnel, Cloudflare One, Cloudflare Mesh, or Cloudflare WAN can now sit behind Cloudflare’s security, performance, and programmability services the same way public origins already do.

This also creates a more unified model across Cloudflare products. Workers VPC bindings and Spectrum private origin routing now rely on the same underlying private connectivity layer, giving customers a single source of truth for controlling how private traffic moves through their Cloudflare environment.

Application traffic now falls into four combinations based on where users come from and where applications live:


The combination on the upper right is what Cloudflare has always done: users on the Internet reach applications on the Internet, with Cloudflare in the middle. The bottom right is Cloudflare One: users on private networks reach public services securely. 

The upper left is what we are shipping today. The bottom left, private-to-private, is what we are building toward next.

What is shipping today

Until now, getting public traffic to a private origin often meant making tradeoffs. Customers could use Cloudflare Tunnel, which runs cloudflared, our connector software, on or near the origin, or Cloudflare Load Balancing with private origin pools for health checks and failover. In many cases, organizations also maintained parallel infrastructure such as public-facing load balancers, reverse proxies, mTLS between hops, and TLS termination across multiple layers. As a result, applying Cloudflare’s full Application Services stack to private applications often required additional complexity, operational overhead, or separate products. Application Services for Private Origins removes those tradeoffs.

What was missing was a path for customers who already operate Cloudflare WAN (IPsec tunnels, GRE tunnels, CNI links) or Cloudflare Mesh. They had built private connectivity into Cloudflare for site-to-site networking and Zero Trust, and they wanted to use that same connectivity for public traffic to private origins. That is what Application Services for Private Origins delivers.

When you toggle Use private network routing on a proxied A or AAAA record, Cloudflare’s WAF, rate limiting, caching, bot management, and transform rules all run as normal on Cloudflare’s network. The only difference is the final hop: instead of reaching the origin over the public Internet, Cloudflare routes the connection through your existing private network connectivity.

The toggle is enabled automatically for RFC 1918 private IPv4 ranges (10.x.x.x, 172.16.x.x–172.31.x.x, and 192.168.x.x), RFC 6598 CGNAT ranges (100.64.x.x–100.127.x.x), and RFC 4193 Unique Local IPv6 Addresses (FC00::/7), since these addresses are only reachable within private networks. For public IP addresses that are reachable only through your private network or tunnel, you can enable the toggle manually.


What the API looks like

For customers automating deployments through the API, private routing is simply an additional attribute on a standard DNS record.

POST /zones/{zone_id}/dns_records
{
 "type": "A",
 "name": "app.example.com",
 "content": "10.0.0.50",
 "ttl": 300,
 "proxied": true,
 "use_private_routing": true
}

Behind the scenes, Cloudflare’s proxy platform determines where to send traffic for app.example.com by querying Cloudflare’s Origin API. The response includes metadata indicating that the destination should be reached through a private network path:

{
 "zone_name": "example.com",
 "ipv4_addresses": ["10.0.0.50"],
 "use_private_routing": true
}

The use_private_routing flag is the key signal. When our proxy sees it, instead of attempting to connect directly to the private IP address over the public Internet, it hands the request to our private networking layer, which then routes the connection across the customer’s existing private network connectivity, whether that’s IPsec, GRE, Cloudflare Tunnel, CNI, or Cloudflare Mesh.

Beyond HTTP: Spectrum and Workers VPC

The same routing model now extends beyond HTTP applications. The origin does not have to be a web server. It can be a TCP database, a UDP logging endpoint, or a private API that Workers call directly. The common thread is that Cloudflare sits between your traffic and your private network, applying the same security, performance, and routing layer regardless of protocol or where the request originated.

Spectrum, Cloudflare’s Layer 4 proxy, can now sit in front of TCP and UDP services running on private IPs. Instead of creating a load balancer pool as an intermediary, Spectrum applications can specify a virtual_network_id directly on the origin configuration. When you create a Spectrum application, you can include the virtual network ID alongside your private origin IP:

{
 "protocol": "tcp/22",
 "dns": {
   "type": "CNAME",
   "name": "ssh.example.com"
 },
 "origin_direct": ["tcp://10.0.0.50:22"],
 "virtual_network_id": "fab9ac85-491b-44c8-b7ae-dd44d4f4672e"
}

When you create or update a Spectrum application with a private origin and virtual network, Cloudflare verifies that the IP address matches a route in your Cloudflare Tunnel before the configuration is saved. If no matching route exists, the API rejects the request and the application is not created. Once saved, Spectrum hands the connection to your virtual network, which routes it through the associated tunnel, via the same path that HTTP traffic uses when you enable private network routing on a DNS record. In this initial release, Spectrum private origins are supported through Cloudflare Tunnel. Support for additional private network connectivity options will follow in future releases.

This means you can now put Spectrum in front of any TCP/UDP service running on a private IP. The service stays private. No public IP, connector software, or load balancer required.

Workers VPC closes the loop for code running on Cloudflare. A binding tells the Workers runtime to route through the same private path as DNS records. Browsers, mobile apps, Workers, and AI agents all reach your private origins through Cloudflare: DNS records for Internet traffic, bindings for Workers.

What comes next

Public-to-private routing is in closed beta today, and we are targeting GA (General Availability) in Q4 2026.

Beyond GA, we are building toward private-to-private traffic flows: users, services, and AI agents on private networks securely reaching applications on other private networks, with Cloudflare’s application services sitting in the middle.

We are moving toward a model where the same Cloudflare infrastructure can secure traffic regardless of whether the user or the origin is public.

The end state is a world where an employee on Cloudflare One Client accessing wiki.company.internal gets the same WAF, rate limiting, and bot management protections as a customer accessing a public API. An AI agent consuming a proprietary internal API runs through the same security stack as a browser. Service-to-service traffic across clouds and data centers gets the same controls as Internet traffic, even when neither the user nor the server sits on the public Internet.

Get started today

Routing to private origins is available today in closed beta for eligible Enterprise customers. Reach out to your Cloudflare account team to request access. Once enabled, follow our developer documentation, which walks through the full setup. You will need Cloudflare One connectivity (IPsec, GRE, CNI, or Cloudflare Mesh) and a return route for Cloudflare’s source IP range 100.64.0.0/12 in your private network.

Questions or feedback? Join the conversation in our community forums or reach out to your account team.

The collective thoughts of the interwebz