Tag Archives: Amazon Data Firehose

Accelerating log analytics at scale with AWS Glue and Apache Iceberg materialized views

Post Syndicated from Shinu Tharol original https://aws.amazon.com/blogs/big-data/accelerating-log-analytics-at-scale-with-aws-glue-and-apache-iceberg-materialized-views/

Managing high-volume application logs at scale presents challenges from slow query performance and difficulty running complex aggregations to maintaining real-time analytics on streaming data. Apache Iceberg materialized views with AWS Glue, Amazon Data Firehose, and AWS Lambda address these challenges by accelerating log analytics through pre-computed query results.

In this post, you learn how to build an application log pipeline for production use with Amazon CloudWatch Logs, AWS Lambda, Amazon Data Firehose, AWS Glue, and Apache Iceberg materialized tables. You then use materialized views to accelerate query performance. This solution helps you achieve faster query response times on large-scale log data without requiring you to manage continuous data lake refresh.

Solution overview

This solution accelerates log analytics by pre-computing query results through Apache Iceberg materialized views. By querying pre-aggregated results instead of scanning raw log data for every request, you can help reduce query response times. For example, queries that previously took minutes scanning terabytes of raw data may return in seconds from the compact materialized view. Results update automatically as new logs arrive, helping you handle high-volume log streams while maintaining fast analytics performance.

Architecture overview

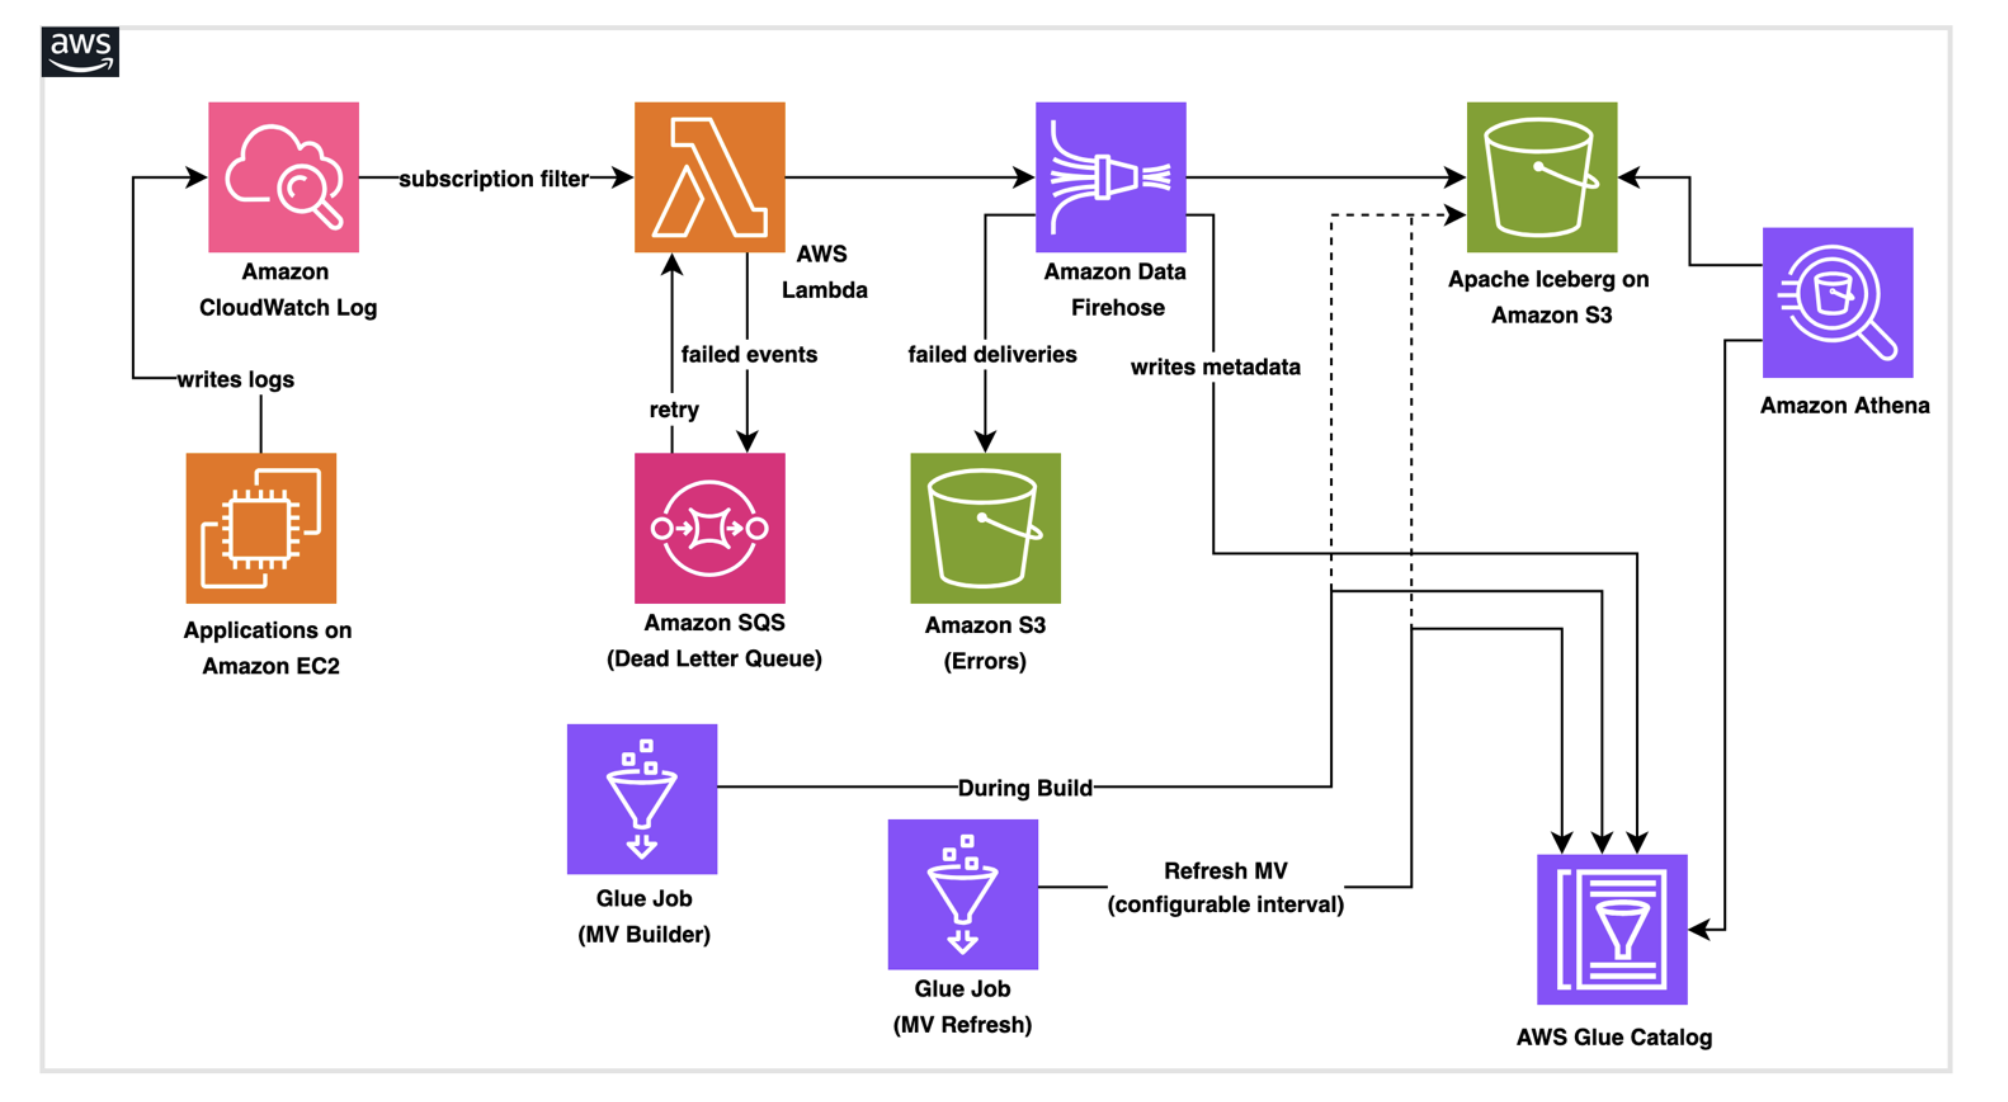
The architecture consists of AWS services working together to create a data pipeline:

  • Amazon CloudWatch Logs receives application logs and system events, then routes them to downstream targets using CloudWatch Logs subscription filters. CloudWatch Logs has a built-in retry mechanism. If the destination service returns a retryable error, CloudWatch Logs automatically retries delivery for up to 24 hours.
  • AWS Lambda serves as the transformation layer, parsing log messages, enriching data, and preparing records for storage.
  • Amazon Data Firehose buffers incoming data and handles the technical requirements of writing to Apache Iceberg tables (an open-source data table format), including batch optimization, schema validation, and automatic retry logic for failed writes.
  • Apache Iceberg tables stored in Amazon Simple Storage Service (Amazon S3) provide ACID transaction support, schema evolution capabilities, and efficient query performance. Materialized views are managed tables in the AWS Glue Data Catalog that store precomputed query results in Apache Iceberg format.
  • AWS Glue runs a one-time job during stack creation to provision the Iceberg database, base table, and materialized view structure in the Data Catalog. A second scheduled Glue job refreshes the materialized view by recomputing aggregations from the base table on a configurable interval helping downstream queries through Amazon Athena return up-to-date, pre-aggregated results without scanning raw data.

This architecture is designed to support automatic scaling, serverless infrastructure, error handling that routes failed records to Amazon S3 for analysis and replay, capture of failed Lambda invocations for automatic retry, and real-time monitoring through Amazon CloudWatch metrics.

Prerequisites

Before you deploy the solution, review the following prerequisites.

  • AWS account with necessary permissions to execute an AWS CloudFormation template, run AWS Glue jobs, run queries to verify Iceberg table data using Amazon Athena.
  • Basic familiarity with Boto3 to understand Python code. Foundational understanding of Apache Iceberg concepts.

Solution deployment

The following deployment steps guide you through implementing this solution in your AWS account.

Step 1: Deploy the AWS CloudFormation pipeline stack

You can deploy this solution using an AWS CloudFormation stack. The template handles creating Amazon S3 buckets, uploading AWS Glue and Lambda scripts, provisioning IAM roles, configuring the Firehose delivery stream, and running the Glue job to create the Iceberg database, base table, and materialized view.

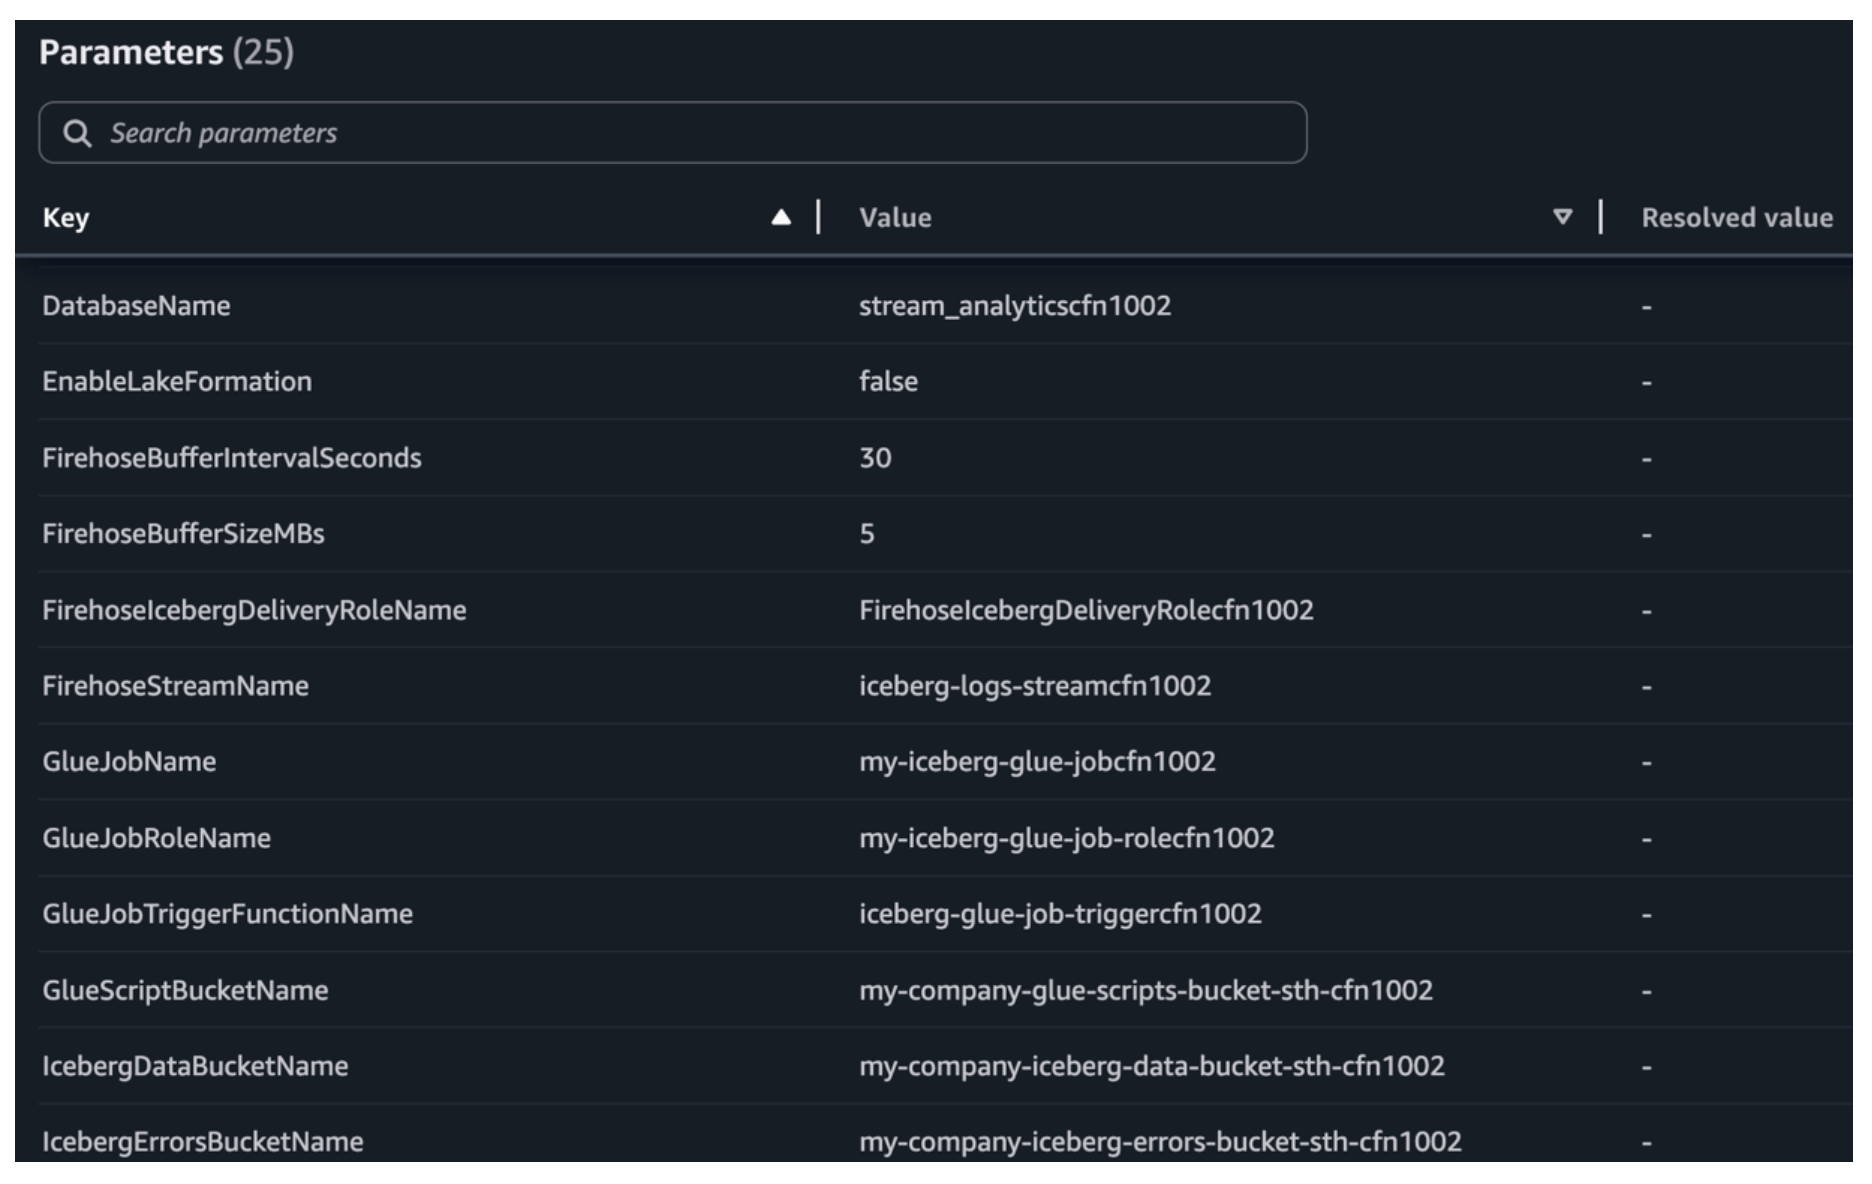
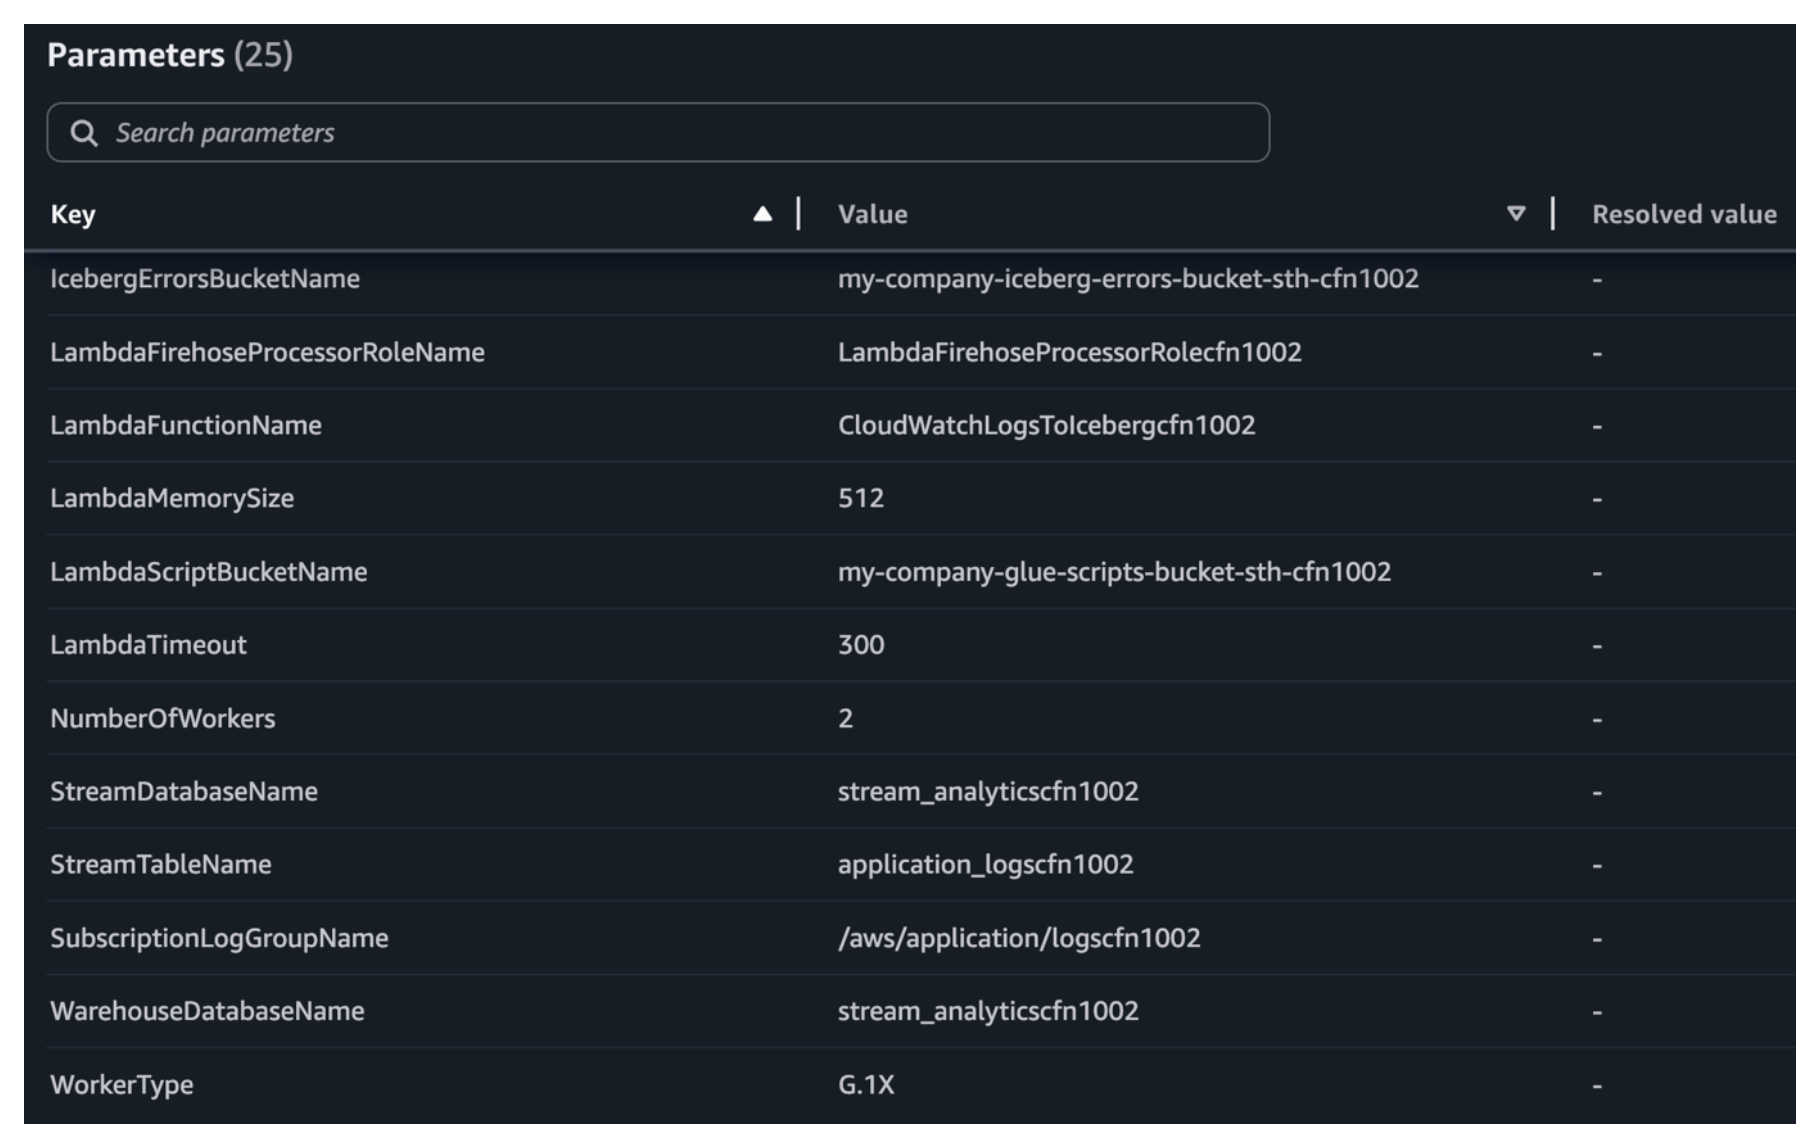
Launch the stack in the AWS CloudFormation console. Review the parameters marked REQUIRED and adjust the toggle options (CreateScriptBucket, EnableLakeFormation, CreateSubscriptionLogGroup) based on your environment. Other parameters include preconfigured defaults that you should review for your environment. Choose the CloudFormation stack to deploy resources using the AWS CloudFormation console.

Pipeline stack required parameters view in the AWS CloudFormation console.

Additional pipeline stack required parameters in the AWS CloudFormation console.

Step 2: Test the end-to-end pipeline

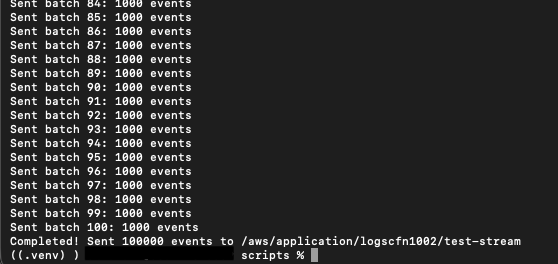
Send sample log events matching the Iceberg table schema (for example, id, customer_name, amount, and order_date) to the CloudWatch log group. The subscription filter triggers the Lambda, which forwards records to Firehose for delivery into the Iceberg table.

git clone https://github.com/aws-samples/sample-log-analytics-iceberg-mv.git
cd sample-log-analytics-iceberg-mv
python3 scripts/send_test_logs.py
Terminal output showing the test log event script sending sample records to the CloudWatch log group

Execution of test events.

Verify data delivery and refresh the materialized view

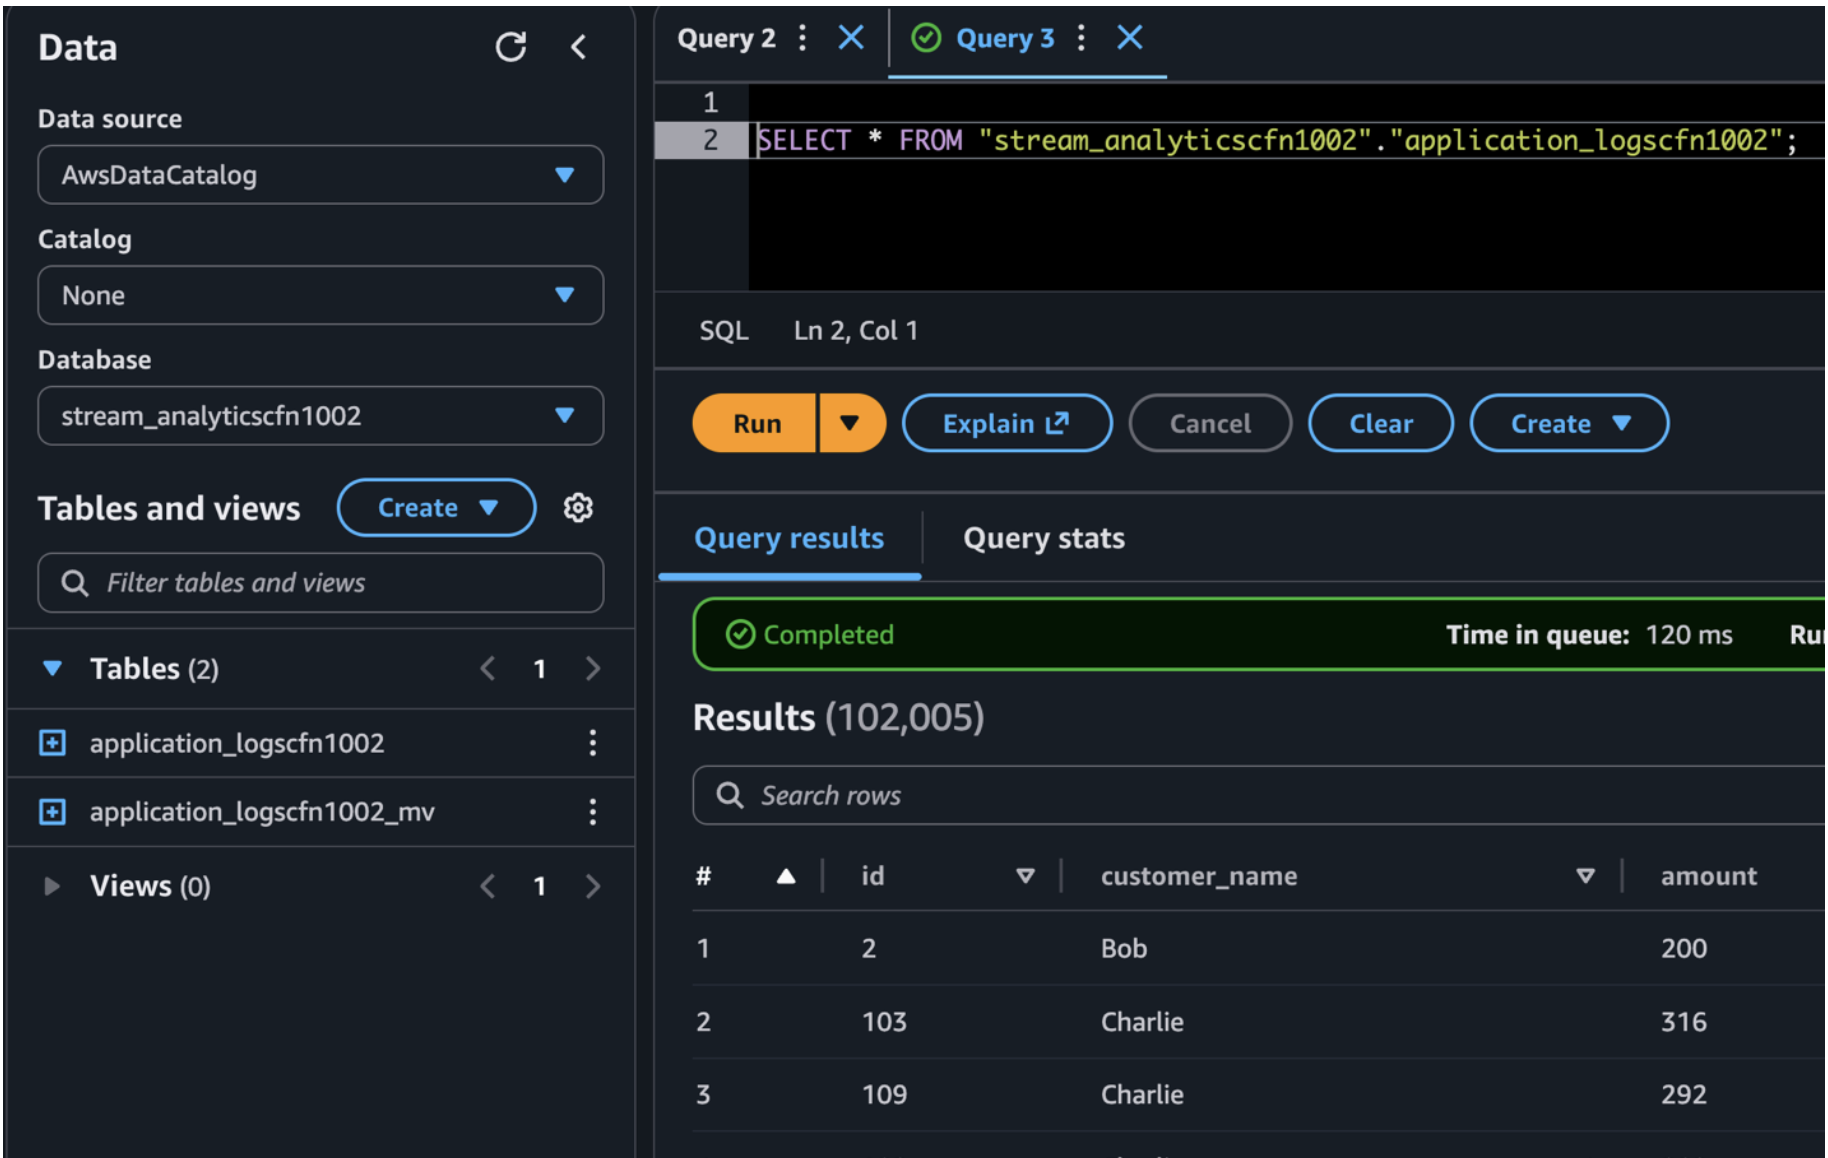
Allow approximately 30 seconds (learn more in Buffer data for dynamic partitioning) for the Firehose buffer to flush. After the buffer flushes, run the following query in Amazon Athena to verify that data has been successfully delivered to the base table.

Query result using Amazon Athena.

Automated materialized view refresh

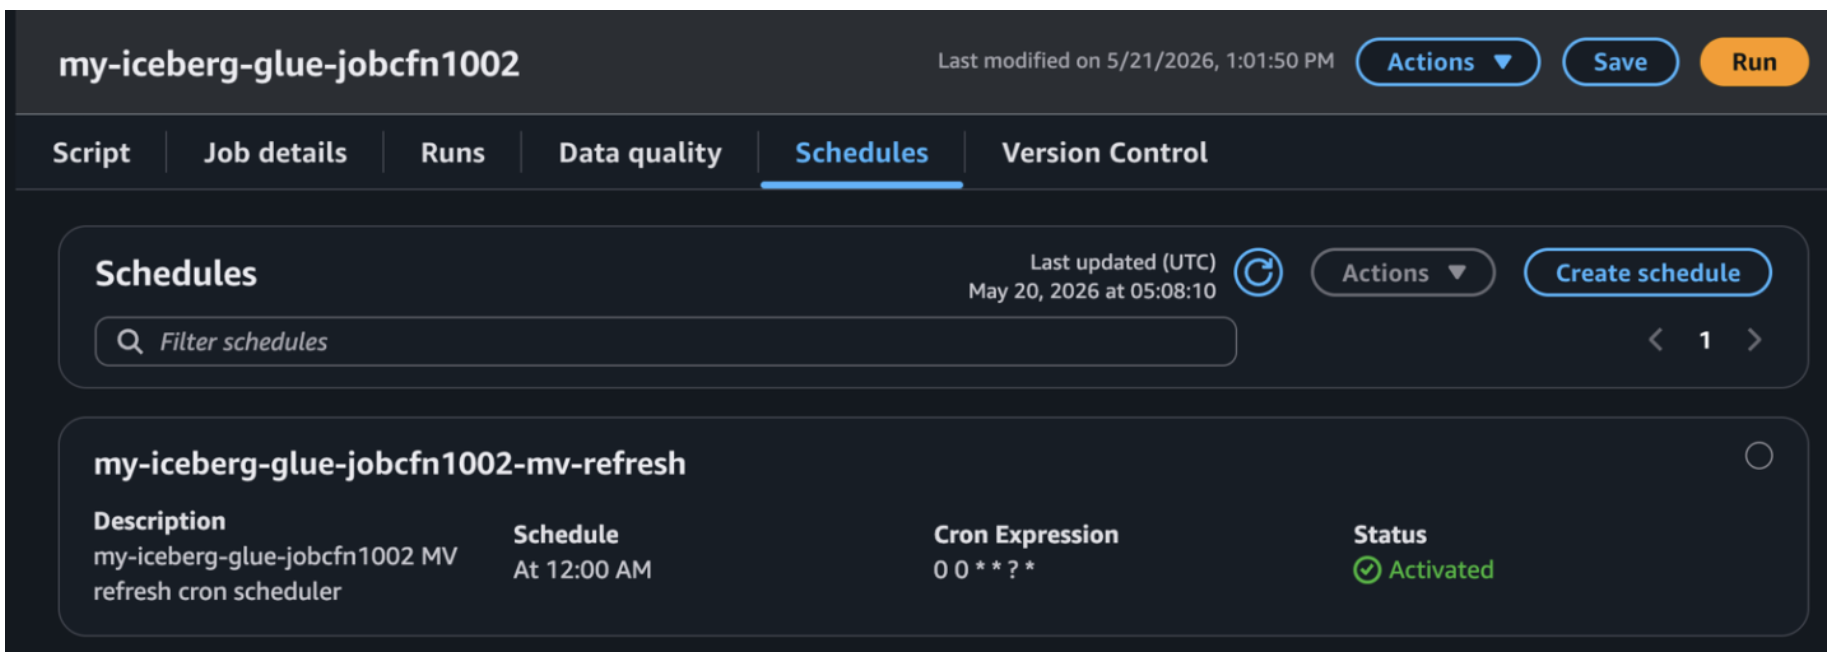
In this example, the AWS CloudFormation stack provisions a Glue job configured to run the materialized view (MV) refresh once daily at midnight UTC, meaning the MV reflects data up to the previous day. You can adjust the trigger’s cron schedule to match common MV refresh requirements such as hourly, every 15 minutes, or on demand.

The Glue job performs a full recomputation of the aggregations from the base Iceberg table and writes the results to the MV. Downstream consumers querying through Athena read from this pre-aggregated view, delivering faster performance. This is especially critical in real production scenarios where the base table contains millions of records and numerous columns. Computing aggregations directly from raw data at query time would degrade downstream application performance.

Job scheduled view in the AWS Glue console.

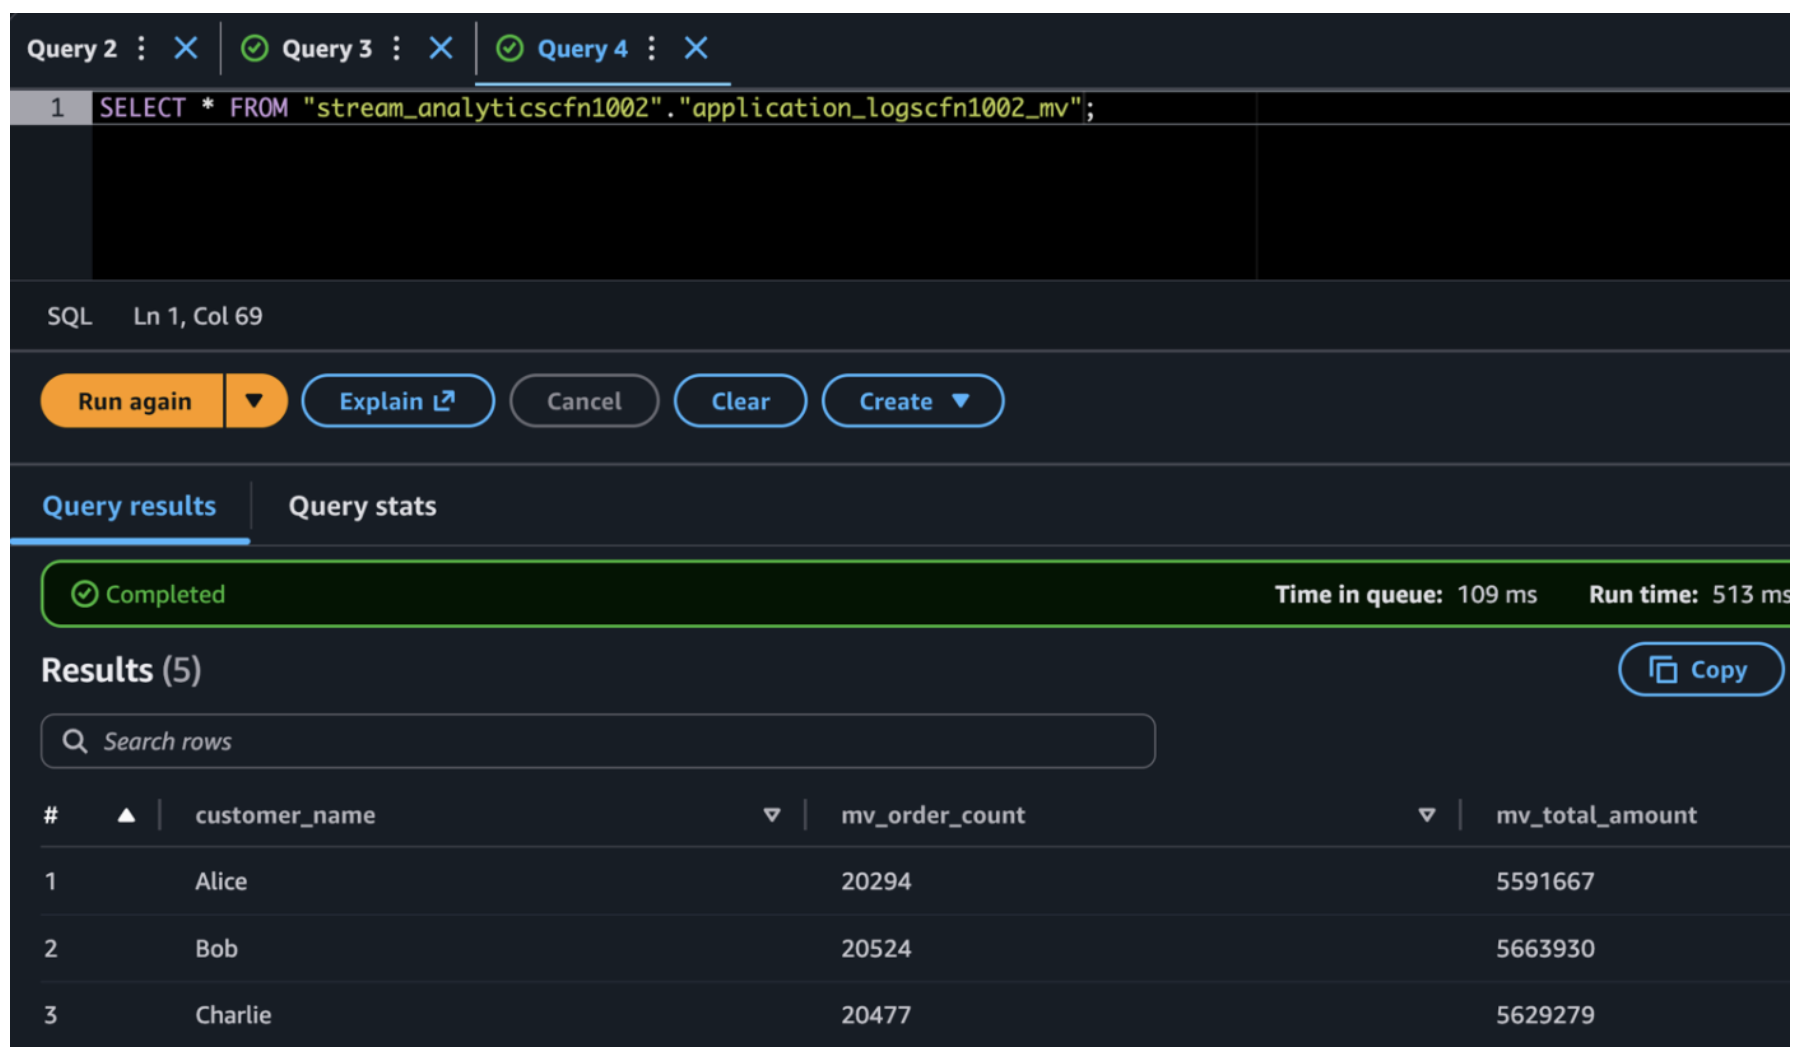
In a production environment, the base Iceberg table stores every individual order event, potentially millions of rows with dozens of columns growing daily. When dashboards or downstream applications need aggregated insights like daily revenue per customer or monthly order counts by region, querying the base table directly forces Athena to scan terabytes of raw data on every request. This results in slow response times and high costs at scale. The materialized view solves this by pre-computing these business-level aggregations once during the scheduled refresh, storing the results in a compact, purpose-built table with far fewer rows and columns. This means a dashboard query that would scan millions of raw records now reads from a pre-aggregated table, designed to reduce query response time. The base table remains your source of truth for granular, row-level lookups, while the materialized view serves as the performance layer for repeated analytical queries with embedded business logic.

Materialized View query result using Amazon Athena

Alternative: Amazon S3 Tables

This solution can also be implemented using Amazon S3 Tables, which provides a fully managed Apache Iceberg experience with native support for materialized views. In this post, we use the Glue-based approach to demonstrate the underlying mechanics and provide full flexibility to customize refresh logic for your specific requirements. To learn more, see Getting started with S3 Tables.

Clean up

To avoid incurring future charges, delete the resources you created as part of this exercise if you are not planning to use them further. Delete the stacks created in the previous steps, then empty and delete the Amazon S3 buckets.

Conclusion

This solution shows how to build a scalable application log data pipeline that delivers log events from Amazon CloudWatch Logs to Apache Iceberg tables using AWS Lambda and Amazon Data Firehose. This architecture uses fully managed AWS services to minimize operational overhead while providing high availability and consistent performance.

Key strengths include serverless infrastructure designed to support automatic scaling, error handling designed to route failed records to Amazon S3 for troubleshooting and replay, and analytics capabilities through Apache Iceberg’s ACID transactions and query performance optimizations. As you move this solution into production, we recommend that you implement data quality checks in Lambda and configure encryption at rest and in transit for your data. You can also establish data retention policies and explore partitioning strategies for better query performance.

You now have a log analytics pipeline built for production use that scales with your workload.

Additional resources


About the author

Shinu Tharol

Shinu Tharol

Shinu is a Technical Account Manager at AWS, delivering technical guidance and strategic support to enterprise customers. His expertise includes cloud operations, artificial intelligence, data analytics, and cloud cost optimization, enabling customers to maximize their AWS investments while maintaining operational excellence.

Getting your SMS short code production-ready with AWS End User Messaging

Post Syndicated from Harshvardhan Chunawala original https://aws.amazon.com/blogs/messaging-and-targeting/getting-your-sms-short-code-production-ready-with-aws-end-user-messaging/

Getting your Short Message Service (SMS) short code production-ready requires you to configure the Amazon Web Services (AWS) infrastructure that controls how your messages are sent, monitored, and protected. You have provisioned your short code, and it is active on carrier networks. In this post, we walk through that setup using AWS End User Messaging SMS, covering 12 configuration steps from compliance through phased traffic migration. Total estimated time is 2 to 4 hours of configuration plus 1 to 3 business days for limit increase approvals.mess

The guide to SMS short codes with AWS End User Messaging covers the application and registration process up through provisioning. This post picks up from that point and provides an operational readiness walkthrough that takes you from “Active” status to confidently sending your first production message, including a final validation step to confirm readiness.

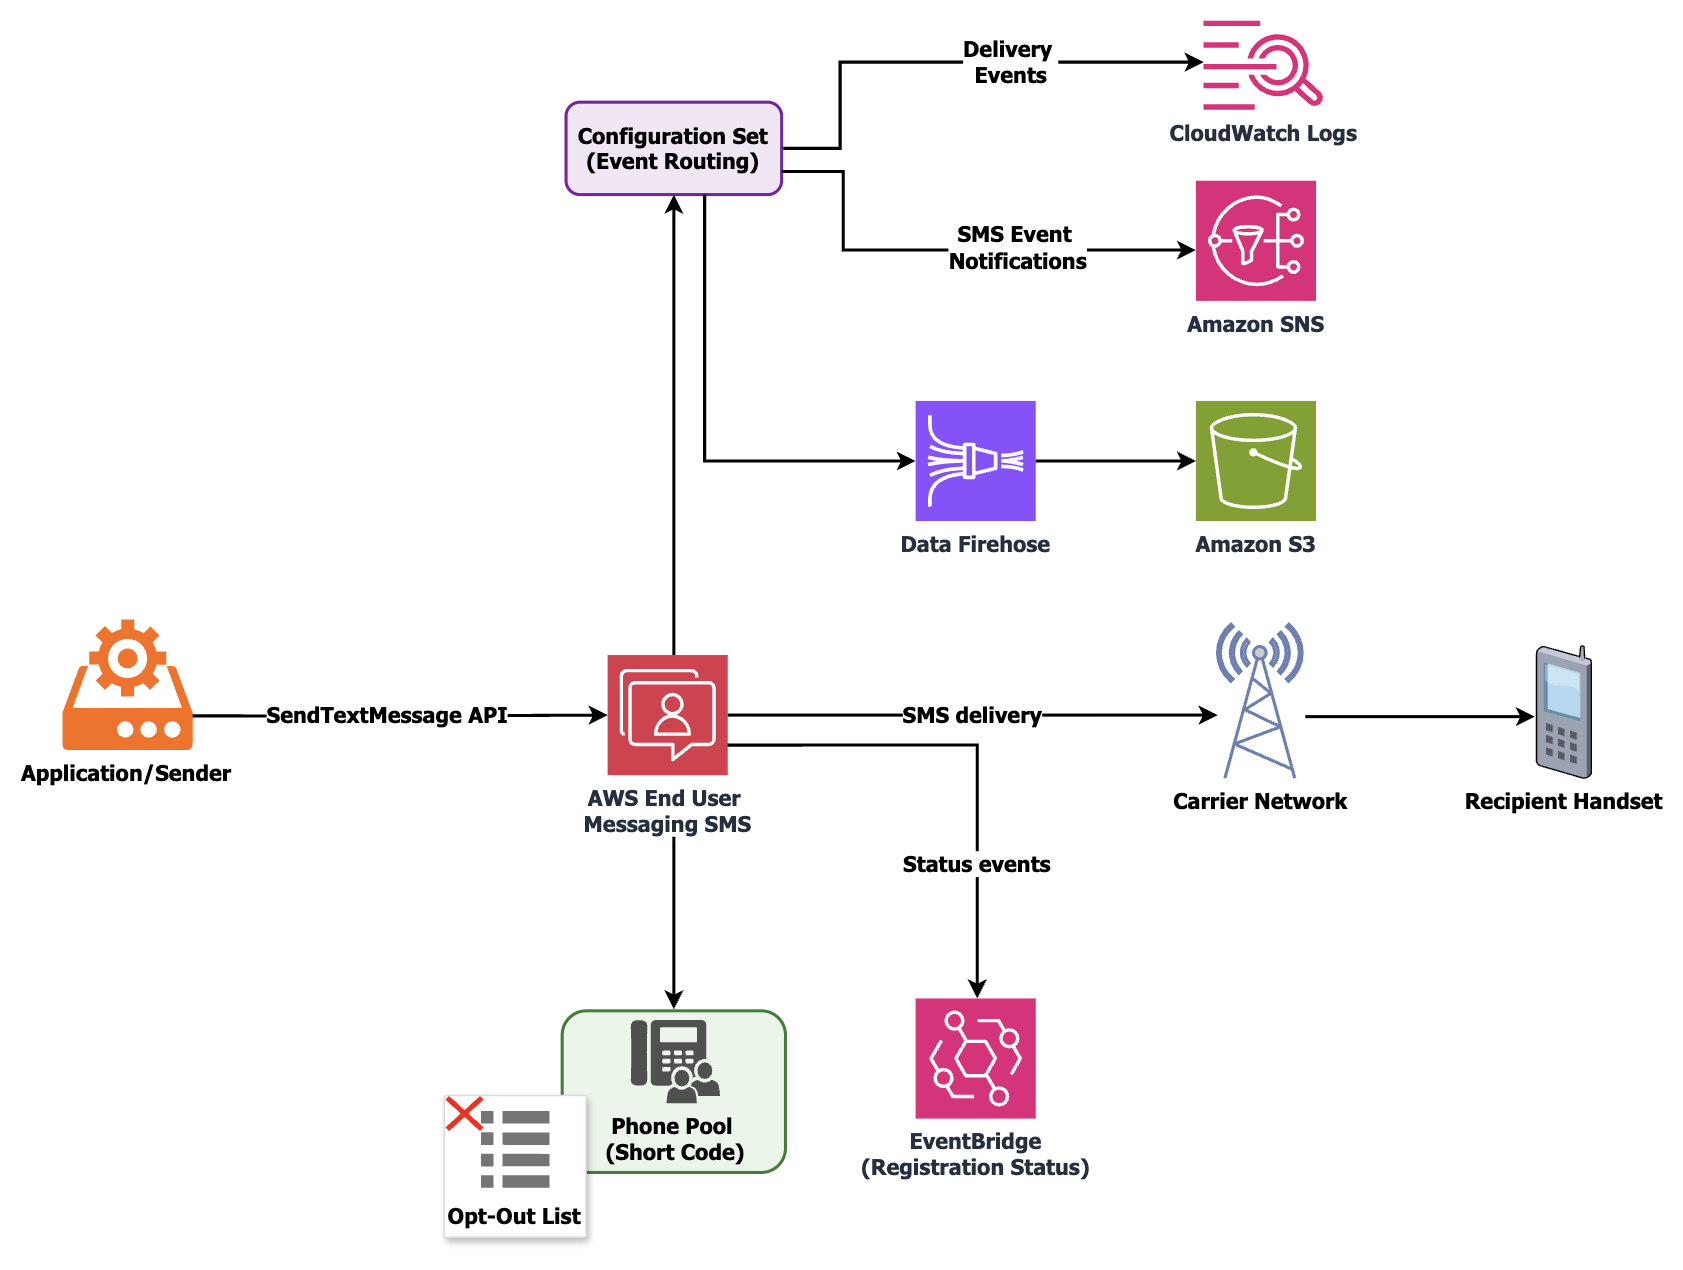
The following diagram shows the end-to-end message flow and event routing architecture covered in this walkthrough.

End-to-end SMS short code architecture showing message flow from sender through AWS End User Messaging SMS to carriers and recipient handsets, with event routing to Amazon CloudWatch, Amazon Simple Notification Service (Amazon SNS), and Amazon Data Firehose destinations

Prerequisites

You need the following to follow along with this walkthrough:

  1. An AWS account with access to the AWS End User Messaging SMS console.
  2. A short code with Active status in the AWS Management Console (carrier provisioning finished).
  3. Permissions to create AWS Identity and Access Management (IAM) roles, Amazon CloudWatch Log Groups, and Amazon Simple Notification Service (Amazon SNS) topics.
  4. AWS Command Line Interface (AWS CLI) v2 or an AWS SDK installed and configured.
  5. Your approved registration documentation, including the service name, keyword responses, and message templates submitted to carriers.

Step 1: Verify your short code is active and delivering

Navigate to the AWS End User Messaging SMS console, choose Phone numbers, and locate your provisioned short code. Confirm that the status shows Active, then send a test message to a phone number you control using the SendTextMessage API or the console test feature. Verify delivery on your handset.

Carrier-side activation can take up to 24 to 48 hours to fully propagate across all networks after provisioning finishes. If the console shows Active but your test message does not arrive, submit a support case so the team can verify propagation status with the carrier.

You can also verify using the AWS CLI:

aws pinpoint-sms-voice-v2 send-text-message \
    --destination-phone-number "+15555550100" \
    --origination-identity "12345" \
    --message-body "Test message from short code" \
    --message-type TRANSACTIONAL \
    --configuration-set-name "prod-otp-shortcode"
# Replace +15555550100 with your test phone number, 12345 with your short
# code, and prod-otp-shortcode with your configuration set name from Step 3.

Step 2: Configure keywords and verify message compliance

US carriers require every short code to respond to HELP and STOP keywords. You defined these during your registration, and this step confirms they are configured correctly in your account.

In the SMS console, choose Phone numbers, select your short code, and choose the Keywords tab. Verify that STOP returns the opt-out response you submitted during registration, and that HELP returns your support contact response (which must include a phone number or email). Add any custom keywords your use case requires, such as YES for double opt-in confirmation flows. You can manage keywords programmatically using the PutKeyword API.

To add or update a keyword programmatically:

aws pinpoint-sms-voice-v2 put-keyword \
    --origination-identity "12345" \
    --keyword "YES" \
    --keyword-message "You have confirmed your subscription to Acme Health Alerts. Msg&data rates may apply. Reply STOP to opt out." \
    --keyword-action AUTOMATIC_RESPONSE
# Replace 12345 with your short code, YES with your custom keyword, and the
# keyword-message text with your approved response.

To verify your current keyword configuration:

aws pinpoint-sms-voice-v2 describe-keywords \
    --origination-identity "12345"
# Replace 12345 with your short code.

Beyond keyword configuration, carrier compliance does not end at registration approval. The content you send in production must stay aligned with what carriers reviewed and approved. Here is what to keep consistent.

Use the exact brand or program name from your approved registration across all keyword responses, confirmation messages, and outbound templates. If carriers approved your registration under “Acme Health Alerts,” every message your short code sends should reference that name. Mixing variations creates inconsistencies that auditors flag during reviews. For example, do not use the company name in one message and the product name in another.

Your HELP, STOP, and confirmation responses must match the templates submitted during registration. Do not add or remove opt-out language, change frequency disclosures, or alter customer care contact details post-approval without updating the registration through a support case. If your organization operates multiple domains, use the domain documented in the registration. For example, you might have one domain for the application and another for marketing. Carrier reviewers cross-reference message content, opt-in screenshots, and privacy policy URLs with what was submitted.

Humans conduct carrier reviews, and message content that is concise and limited to the essentials is reviewed consistently. All messages must remain under 160 characters.

Step 3: Create a configuration set with event destinations

A configuration set controls where your SMS delivery events are streamed and which event types are captured. Without one, you are limited to the basic events that AWS End User Messaging SMS sends to Amazon EventBridge by default. These default events omit recipient details and full carrier response context.

Create a configuration set with a descriptive name such as prod-otp-shortcode or marketing-sc-us. Then create at least one event destination. The three main options are Amazon CloudWatch Logs (for operational monitoring and alarming), Amazon SNS (for real-time event fanout to downstream systems), and Amazon Data Firehose (for durable archival and analytics).

Amazon Data Firehose typically delivers to an Amazon Simple Storage Service (Amazon S3) bucket, where you can query delivery history using Amazon Athena for compliance audits or delivery pattern analysis.

# Create the configuration set
aws pinpoint-sms-voice-v2 create-configuration-set \
    --configuration-set-name "prod-otp-shortcode"

# Add a CloudWatch Logs event destination
aws pinpoint-sms-voice-v2 create-event-destination \
    --configuration-set-name "prod-otp-shortcode" \
    --event-destination-name "otp-delivery-logs" \
    --matching-event-types TEXT_DELIVERED TEXT_FAILED TEXT_QUEUED TEXT_CARRIER_UNREACHABLE TEXT_TTL_EXPIRED \
    --cloud-watch-logs-destination '{
        "IamRoleArn": "arn:aws:iam::123456789012:role/SMSEventsToCloudWatch",
        "LogGroupArn": "arn:aws:logs:us-east-1:123456789012:log-group:/aws/sms/prod-otp-shortcode"
    }'
# Replace prod-otp-shortcode with your configuration set name, otp-delivery-logs
# with a descriptive destination name, and the ARN values with your IAM role ARN
# (must have logs:PutLogEvents permission) and CloudWatch Log Group ARN.

Important: When sending messages with SendTextMessage, always specify your ConfigurationSetName parameter so events route to the appropriate destination.

Required event types

Event type Description
TEXT_DELIVERED Message successfully delivered to recipient handset.
TEXT_FAILED Message delivery failed.
TEXT_QUEUED Message accepted and queued for delivery.
TEXT_CARRIER_UNREACHABLE Carrier network unreachable.
TEXT_TTL_EXPIRED Message expired before delivery.

For a detailed walkthrough of configuration sets including multi-tenant architectures, see How to send SMS using configuration sets with AWS End User Messaging.

Step 4: Create a phone pool and associate your short code

A pool is a logical container that groups origination identities and controls routing behavior. Creating one gives you deterministic control over which number sends your messages and how opt-outs are enforced.

# Create the pool
aws pinpoint-sms-voice-v2 create-pool \
    --origination-identity "12345" \
    --iso-country-code "US" \
    --message-type TRANSACTIONAL

# Disable shared routes so only your short code is used
aws pinpoint-sms-voice-v2 update-pool \
    --pool-id "pool-1234567890abcdef0" \
    --shared-routes-enabled false
# Replace 12345 with your short code, US with your destination country code,
# and pool-1234567890abcdef0 with the Pool ID returned by create-pool.

Configuration parameters

Parameter Recommended value Rationale
Pool name us-otp-pool Descriptive, environment-prefixed.
SharedRoutesEnabled False Prevents fallback to shared routes; only your short code is used.
Opt-out list Associate one Manages opt-out state per use case.
IsoCountryCode US Restricts to destination country your short code serves.

If you operate multiple use cases on separate short codes, create a dedicated pool for each. For example, use one short code for one-time password (OTP) traffic and another for transactional notifications. This isolation means a recipient opting out of marketing messages does not lose access to authentication codes.

Step 5: Request your throughput increase

Short codes start at a default of 100 messages per second (MPS). If your production volume will exceed this, request an increase before your launch date rather than after traffic is flowing.

Create a case in the AWS Support Center, choose Service limit increase, then choose End User Messaging SMS. Provide your short code phone number, requested MPS, use case description, and expected peak volume. Allow 1 to 3 business days for processing.

To estimate your required MPS:

Required MPS = (Peak hourly volume / 3,600) x 2

Short codes support scaling to thousands of MPS, so start with a value that covers your expected peak and request further increases as traffic grows.

Step 6: Request a spending limit increase

AWS accounts have a default monthly SMS spending limit. To keep delivery uninterrupted at your expected volume, request an increase that accommodates your projected monthly spend before you begin sending.

Create a support case under Service limit increase > End User Messaging SMS > Account Spend Threshold. Provide your estimated monthly spend, use case description, and website URL.

For details, see Requesting increases to your monthly SMS spending quota.

Step 7: Restrict destination countries

If your short code serves a single country (US-only, for example), restrict sending to that country. This protects your account from artificially inflated traffic (SMS pumping). In pumping attacks, messages are routed to international premium-rate numbers, generating significant charges.

In the SMS console, navigate to Account settings, then choose Countries and keep only the countries you intend to send to. The pool-level IsoCountryCode restriction from Step 4 provides an additional enforcement layer at the sending path. Combining account-level country restrictions with pool-level country codes gives you two independent controls that both must be satisfied before a message is sent internationally.

For a detailed walkthrough on SMS fraud prevention controls, see Defending against SMS pumping: new AWS features to help combat artificially inflated traffic.

Step 8: Set up monitoring and alarms

With event destinations configured in Step 3, build proactive alerting that surfaces delivery trends before they affect your end users.

Alarm Metric / Source Threshold
Delivery success rate CloudWatch SMS metrics Alert when below 95%.
Spend threshold CloudWatch billing metric Alert at 80% of monthly limit.
Delivery failures Amazon EventBridge rule on TEXT_FAILED Route to Amazon SNS topic or AWS Lambda.
Carrier unreachable Amazon EventBridge rule on TEXT_CARRIER_UNREACHABLE Route to Amazon SNS topic or AWS Lambda.

Build a CloudWatch dashboard showing messages sent per minute, success versus failure breakdown, and spend accumulation over time.

You can also configure Amazon EventBridge to notify you of registration status changes. AWS End User Messaging SMS publishes events for statuses including REQUIRES_UPDATES, REVIEWING, and PROVISIONING, which is useful if a carrier requests changes during a proactive audit after your short code is already active.

For metric details, see Monitoring SMS activity with Amazon CloudWatch.

Step 9: Track OTP verification success (if applicable)

If your short code delivers OTP or two-factor authentication (2FA) codes, track end-to-end verification success in addition to carrier delivery receipts. A “delivered” status at the carrier level does not confirm the end user received and entered the code.

Tracking verification rates gives you insight into latency patterns when codes expire before arrival, geographic delivery trends, and opportunities to improve conversion. Some use cases involve asynchronous processing where several minutes of computation occur before the SMS is sent. For these, measure the full round-trip from the triggering action to message delivery. This separates application-side latency from carrier-side delivery latency.

For implementation guidance, see Track OTP success with AWS End User Messaging SMS feedback.

Step 10: Set up cost visibility

SMS costs include AWS charges plus per-message carrier surcharges. Setting up cost visibility from day one lets you track spend trends, catch anomalies early, and optimize over time.

Start by activating AWS Cost Explorer and creating a cost allocation tag for your SMS workload. Then configure an AWS Budget with threshold alerts. For example, you might notify at 80% of projected monthly spend. This gives you advance warning of unexpected cost increases, whether from traffic spikes, retry loops, or blocked-country leakage.

Step 11: Plan your traffic migration

A phased rollout validates delivery performance at each stage before you increase volume.

Start with a canary phase (Day 1 to 3) where you route 5 to 10% of traffic to the short code and monitor delivery rates, latency, and event logs. Move to a ramp phase (Day 3 to 7) at 50%, validating throughput and carrier-level delivery across your recipient base. Finish the full migration (Day 7+) at 100%. Decommission your previous origination identity only after confirming stability for at least 48 hours.

Step 12: Validate production readiness and send

Before declaring your short code production-ready, run through the following validation checks:

  1. Confirm your CloudWatch dashboard shows events flowing for TEXT_DELIVERED and TEXT_FAILED (from Step 3).
  2. Send a test message that triggers your STOP keyword. Verify the correct opt-out response is returned and the phone number appears in your opt-out list.
  3. Send a test message that triggers your HELP keyword. Verify the response matches your approved registration.
  4. Check your MPS quota in the support case response (from Step 5). Confirm it matches or exceeds your calculated peak.
  5. Review your country restrictions (from Step 7). Attempt to send a message to a blocked country and confirm it is rejected.
  6. Verify your CloudWatch alarm fires by temporarily lowering the threshold, or by checking that the alarm state is not INSUFFICIENT_DATA.

After all six checks pass, you are ready to begin your phased migration (Step 11) and scale to full production traffic. At this point, your short code is configured, monitored, compliant, and protected.

Automate with a validation script

You can use an AI coding assistant such as Kiro to generate a validation script tailored to your environment. Try a prompt like: “Write a boto3 script that validates my SMS short code is production-ready by checking Active status, HELP/STOP keywords, configuration set existence, and pool association using the pinpoint-sms-voice-v2 client.”

Refine the prompt with specifics from the following reference implementation, such as exact API names, filter parameters, and output format, to match your requirements.

The following script is an example of what that output looks like:

import boto3
import sys

SHORT_CODE = "12345"  # TODO: Replace with your short code (e.g., "67890")
POOL_ID = "pool-1234567890abcdef0"  # TODO: Replace with your pool ID from Step 4
CONFIG_SET_NAME = "prod-otp-shortcode"  # TODO: Replace with your configuration set name from Step 3

client = boto3.client("pinpoint-sms-voice-v2")

# Note: For accounts with many resources, implement NextToken pagination
# on describe_* calls. This script assumes results fit in a single page.


def check_short_code_active():
    """Step 1: Verify short code is Active."""
    response = client.describe_phone_numbers(
        Filters=[
            {"Name": "status", "Values": ["ACTIVE"]},
            {"Name": "number-type", "Values": ["SHORT_CODE"]}
        ]
    )
    numbers = [
        n for n in response["PhoneNumbers"]
        if n["PhoneNumber"] == SHORT_CODE
    ]
    assert len(numbers) > 0, f"Short code {SHORT_CODE} not found or not Active"
    print(f"[PASS] Short code {SHORT_CODE} is Active")


def check_keywords_configured():
    """Step 2: Verify HELP and STOP keywords exist."""
    response = client.describe_keywords(OriginationIdentity=SHORT_CODE)
    keyword_names = [kw["Keyword"].upper() for kw in response["Keywords"]]
    assert "STOP" in keyword_names, "STOP keyword not configured"
    assert "HELP" in keyword_names, "HELP keyword not configured"
    print("[PASS] HELP and STOP keywords configured")


def check_configuration_set():
    """Step 3: Verify configuration set exists."""
    response = client.describe_configuration_sets(
        ConfigurationSetNames=[CONFIG_SET_NAME]
    )
    assert len(response["ConfigurationSets"]) > 0, f"Configuration set {CONFIG_SET_NAME} not found"
    print(f"[PASS] Configuration set '{CONFIG_SET_NAME}' exists")


def check_pool_association():
    """Step 4: Verify pool exists and short code is associated to it."""
    response = client.describe_pools(PoolIds=[POOL_ID])
    assert len(response["Pools"]) > 0, f"Pool {POOL_ID} not found"

    # Verify short code is associated to the pool
    assoc_response = client.list_pool_origination_identities(PoolId=POOL_ID)
    identities = [
        oi["OriginationIdentity"]
        for oi in assoc_response["OriginationIdentities"]
    ]
    assert any(SHORT_CODE in oi for oi in identities), \
        f"Short code {SHORT_CODE} not associated with pool {POOL_ID}"
    print(f"[PASS] Pool '{POOL_ID}' exists and short code is associated")


if __name__ == "__main__":
    checks = [
        check_short_code_active,
        check_keywords_configured,
        check_configuration_set,
        check_pool_association,
    ]
    for check in checks:
        try:
            check()
        except Exception as e:
            print(f"[FAIL] {check.__doc__} - {e}")
            sys.exit(1)
    print("\nAll validation checks passed. Ready for production traffic.")

Cleaning up

If you created test resources while following this walkthrough, you can delete them through the AWS End User Messaging SMS console or with the API to avoid confusion with your production configuration. This includes a test configuration set, test pool, or test event destinations used for validation. Do not delete your production configuration set, pool, or keyword settings.

If you requested a test-level MPS increase or spending limit for validation, update these to your production values through a new support case before going live.

Quick reference checklist

Step Action Key API / Service
1 Verify short code is Active and test delivery SendTextMessage
2 Configure keywords and verify message compliance PutKeyword
3 Create configuration set with event destinations CreateConfigurationSet
4 Create pool and associate short code CreatePool, AssociateOriginationIdentity
5 Request MPS increase for expected throughput AWS Support
6 Request spending limit increase AWS Support
7 Restrict destination countries Console / UpdateAccount
8 Set up CloudWatch alarms and dashboards Amazon CloudWatch
9 Track OTP verification success (if applicable) SMS Feedback events
10 Set up cost visibility AWS Cost Explorer, AWS Budgets
11 Plan phased traffic migration Application-level routing
12 Validate production readiness and send All of the preceding

Conclusion

In this post, we walked through how to configure a newly provisioned SMS short code for production use with AWS End User Messaging SMS. The 12 steps cover keyword verification, message compliance, event monitoring, throughput planning, country restrictions, cost visibility, phased traffic migration, and a final production validation.

You can adapt the sequence to your specific use case and volume profile. For the full registration and application process, see A guide to SMS short codes with AWS End User Messaging. To start configuring, navigate to the AWS End User Messaging SMS console. For the full API reference, see the AWS End User Messaging SMS documentation.


About the author

Real-time CDC from Aurora PostgreSQL to Amazon S3 Tables using Debezium and Firehose

Post Syndicated from Chintan Agrawal original https://aws.amazon.com/blogs/big-data/real-time-cdc-from-aurora-postgresql-to-amazon-s3-tables-using-debezium-and-firehose/

Enterprises running transactional workloads on Amazon Aurora PostgreSQL-Compatible Edition (Aurora PostgreSQL) need their operational data available for analytics. However, analytical queries and cross-database joins compete for resources on OLTP-optimized clusters. Batch exports introduce latency, and when data spans multiple Aurora clusters, there’s no straightforward way to join datasets or run cross-domain analytics. Real-time change data capture (CDC) addresses this by streaming row-level changes into a separate analytics layer. However, most CDC approaches write append-only records that require downstream consumers to reconstruct current state from the change log.

In this post, we show you how to build a CDC pipeline that delivers query-ready Iceberg tables directly. The pipeline captures inserts, updates, and deletes from Aurora PostgreSQL and applies them as row-level operations in Amazon S3 Tables, a capability of Amazon Simple Storage Service (Amazon S3). The destination tables always reflect the current state of the source database. You use Debezium on Amazon MSK Connect for change capture and Amazon Managed Streaming for Apache Kafka (Amazon MSK) for streaming. You also use AWS Lambda to transform CDC events and resolve operation semantics, and Amazon Data Firehose to deliver records into Iceberg tables. You deploy the infrastructure using the AWS Cloud Development Kit (AWS CDK).

Apache Iceberg supports row-level updates, deletes, ACID transactions, schema evolution, and time travel natively. S3 Tables handles Iceberg snapshot management and compaction automatically. With AWS Lake Formation for access control, multiple teams can query the tables through Amazon Athena, Amazon Redshift, or Amazon SageMaker Unified Studio.

Solution overview

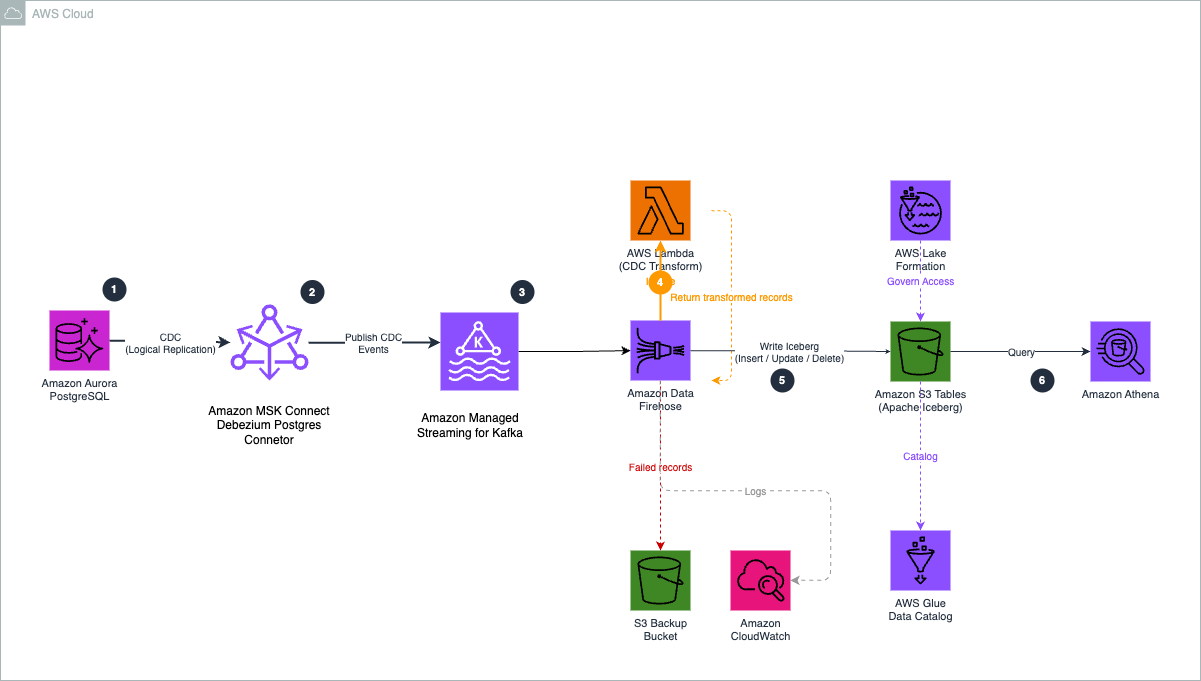
The following diagram shows the architecture of the CDC pipeline.

Figure 1. CDC pipeline architecture from Aurora PostgreSQL to Amazon S3 Tables.

Figure 1. CDC pipeline architecture from Aurora PostgreSQL to Amazon S3 Tables.

The pipeline uses six components:

  1. Aurora PostgreSQL to Debezium. Debezium runs on MSK Connect in your VPC and uses PostgreSQL’s native logical replication to stream row-level changes from the write-ahead log (WAL), with minimal impact on query performance.
  2. Debezium to Amazon MSK. The ByLogicalTableRouter SMT reroutes CDC events from multiple tables into a single topic (aurora.cdc.all-tables), retaining the source table name in each message.
  3. Amazon MSK to Firehose. Firehose connects to the MSK cluster using the IAM access control over AWS PrivateLink and continuously polls the topic for new messages.
  4. Firehose to Lambda. For each batch, Firehose invokes the Lambda function to decode the Kafka message, flatten the Debezium envelope, and set otfMetadata routing with the destination table and operation type.
  5. Firehose to S3 Tables. Firehose reads the otfMetadata, routes each record to the correct Iceberg table, and performs the appropriate row-level operation using configured unique keys (for example, order_id for orders). S3 Tables handles compaction and snapshot management automatically.
  6. Query and access control. After data lands in S3 Tables, you can query the Iceberg tables with Amazon Athena, Amazon Redshift, or Amazon SageMaker Unified Studio, with AWS Lake Formation managing fine-grained access control.

Firehose supports one MSK topic per delivery stream. The single-topic routing pattern uses a Debezium SMT to consolidate multiple tables into one topic, and a Lambda function to route records to the correct destination. With this, you can serve multiple tables through one Firehose stream, reducing cost and operational complexity.

Debezium event transformation

Debezium produces CDC events in an envelope structure containing both the previous and current state of a row, along with metadata about the source database, table, and operation type. However, Firehose expects records in a flattened JSON format with routing metadata that indicates the target table and operation type.

The Lambda function bridges this gap by performing three operations on each record:

  1. Decode. When Firehose uses Amazon MSK as a source, it delivers the Kafka message value as a base64-encoded string in the kafkaRecordValue field. The function base64-decodes this field to obtain the raw Debezium JSON payload.
  2. Flatten and extract. Pulls the row data from the Debezium envelope. For inserts and updates, the function uses the after field (the row after the change). For deletes, it uses the before field, because the after field is null when a row is removed.
  3. Route. Sets the otfMetadata block with destinationTableName (extracted from the Debezium source.table field) and operation (mapped from Debezium’s single-character codes to Firehose’s operation types).

The following table shows how Debezium operation codes map to Firehose Iceberg operations:

Debezium code Meaning Firehose operation
c Row created (insert) insert
u Row updated update
d Row deleted delete
r Snapshot read (initial load) insert

When Debezium starts with snapshot.mode=initial, it reads all existing rows and emits them as r (read) events. These represent rows that existed before CDC began, so they are mapped to insert to establish the baseline state in the destination tables.

For example, the function transforms this Debezium envelope:

{
"op": "c",
"before": null,
"after": {"order_id": 1, "customer_id": 1, "total_amount": 299.99},
"source": {"table": "orders", "db": "cdcdemo"}
}

Into a response record with routing metadata:

{
"recordId": "<original-record-id>",
"result": "Ok",
"kafkaRecordValue": "<base64-encoded flattened row JSON>",
"metadata": {
"otfMetadata": {
"destinationDatabaseName": "aurora_cdc",
"destinationTableName": "orders",
"operation": "insert"
}
}
}

The kafkaRecordValue contains the base64-encoded flattened row data (for example, {"order_id": 1, "customer_id": 1, "total_amount": 299.99}), and the otfMetadata block tells Firehose which table to write to and which operation to perform.

With this routing metadata, a single Firehose stream can write to multiple destination tables. For more information, see Route incoming records to different Iceberg tables.

Walkthrough

The following sections walk you through building the CDC pipeline end to end. Before you begin, complete the prerequisites.

Prerequisites

Before you begin, make sure you have the following:

Step 1: Enable CDC in Aurora PostgreSQL

PostgreSQL supports change data capture through its logical replication framework, which allows database changes to be streamed from the write-ahead log (WAL). Debezium uses this mechanism to continuously read row-level changes and publish them to Kafka topics.

To enable logical replication in Aurora PostgreSQL, configure a custom DB cluster parameter group:

  1. Create a custom parameter group and set the following parameter: rds.logical_replication = 1.
  2. Apply the parameter group to your Aurora cluster and reboot the cluster for the change to take effect.
  3. Connect to your Aurora PostgreSQL cluster and create the source tables:
CREATE TABLE public.orders (
    order_id SERIAL PRIMARY KEY,
    customer_id INTEGER,
    order_date VARCHAR(50),
    total_amount DECIMAL(12,2),
    status VARCHAR(50),
    created_at TIMESTAMP DEFAULT NOW(),
    updated_at TIMESTAMP DEFAULT NOW()
);
CREATE TABLE public.products (
    product_id SERIAL PRIMARY KEY,
    product_name VARCHAR(255),
    category VARCHAR(100),
    price DECIMAL(10,2),
    stock_quantity INTEGER,
    created_at TIMESTAMP DEFAULT NOW(),
    updated_at TIMESTAMP DEFAULT NOW()
);
  1. Create a publication that defines which tables are included in the change stream. Debezium automatically creates the logical replication slot when the connector starts for the first time, so you don’t need to create one manually.
CREATE PUBLICATION dbz_publication FOR TABLE public.orders, public.products;
  1. Verify the publication was created:
SELECT * FROM pg_publication WHERE pubname = 'dbz_publication';

You should see one row returned, confirming the publication is active.

Important: When the Debezium connector starts (Step 6), it creates a replication slot named debezium_slot. This slot retains WAL segments until consumed. If the connector is stopped for an extended period, WAL segments can accumulate and increase storage usage on the Aurora cluster. Monitor the ReplicationSlotDiskUsage Amazon CloudWatch metric for your Aurora cluster.

Step 2: Build and register the Debezium plugin

MSK Connect runs connectors using custom plugins that you upload to Amazon S3. In this step, you download the Debezium PostgreSQL connector, package it as a ZIP file, upload it to S3, and register it with MSK Connect.

First, create an S3 bucket for the plugin, or use an existing metadata management bucket:

aws s3 mb s3://<your-plugin-bucket> --region <your-region>

Download and package the Debezium connector:

DEBEZIUM_VERSION=2.7.3.Final
curl -LO "https://repo1.maven.org/maven2/io/debezium/debezium-connector-postgres/${DEBEZIUM_VERSION}/debezium-connector-postgres-${DEBEZIUM_VERSION}-plugin.tar.gz"
mkdir -p debezium-plugin
tar -xzf debezium-connector-postgres-${DEBEZIUM_VERSION}-plugin.tar.gz -C debezium-plugin/
cd debezium-plugin && zip -r ../debezium-postgres-connector.zip . && cd ..
aws s3 cp debezium-postgres-connector.zip s3://<your-plugin-bucket>/plugins/

Register the plugin with MSK Connect:

aws kafkaconnect create-custom-plugin \
    --custom-plugin-name debezium-postgres-connector \
    --content-type ZIP \
    --location "s3Location={bucketArn=arn:aws:s3:::<your-plugin-bucket>,fileKey=plugins/debezium-postgres-connector.zip}"

Create a worker configuration that tells MSK Connect to serialize Kafka messages as JSON without schemas:

aws kafkaconnect create-worker-configuration \
    --name debezium-worker-config \
    --properties-file-content "$(echo -n 'key.converter=org.apache.kafka.connect.json.JsonConverter
value.converter=org.apache.kafka.connect.json.JsonConverter
key.converter.schemas.enable=false
value.converter.schemas.enable=false' | base64)"

Note the customPluginArn and workerConfigurationArn from the output. You need these for the CDK configuration in the next step.

Note: The custom plugin and worker configuration are created through the AWS CLI because the Debezium connector JARs must be downloaded from the Debezium project and packaged manually. The remaining infrastructure is deployed using the AWS CDK in the following steps.

Step 3: Configure the CDK project

Clone the sample repository and install dependencies:

git clone https://github.com/aws-samples/sample-aurora-cdc-s3tables.git
cd sample-aurora-cdc-s3tables/cdk
npm install

Open cdk/lib/v2/config.ts and update the configuration values to match your environment:

export const CONFIG = {
account: '<your-account-id>',
region: '<your-region>',
// VPC - must match your Aurora cluster's VPC
vpcId: '<your-vpc-id>',
subnetIds: ['<subnet-1>', '<subnet-2>'],
auroraSecurityGroupId: '<aurora-security-group-id>',
// Aurora connection details
auroraEndpoint: '<aurora-cluster-endpoint>',
auroraPort: '5432',
auroraDbName: '<database-name>',
auroraUser: '<db-user>',
auroraSecretArn: '<secrets-manager-arn>',
// Debezium - use the ARNs from Step 2
debeziumPluginArn: '<customPluginArn-from-step-2>',
debeziumWorkerConfigArn: '<workerConfigurationArn-from-step-2>',
debeziumPluginBucket: '<your-plugin-bucket-name>',
debeziumTopicPrefix: 'aurora.cdc',
debeziumTables: 'public.orders,public.products',
// S3 Tables - the table bucket name must be globally unique
s3TablesBucketName: '<your-table-bucket-name>',
s3TablesNamespace: 'aurora_cdc',
tables: ['orders', 'products'],
tableKeys: { orders: 'order_id', products: 'product_id' },
// Firehose - general purpose S3 bucket for failed record backup
firehoseBackupBucket: '<your-backup-bucket-name>',
};

Key configuration notes:

  • auroraSecurityGroupId. The security group attached to your Aurora cluster. The CDK creates an MSK security group with ingress rules allowing traffic from this security group, and a reverse rule allowing MSK Connect workers to reach Aurora on port 5432.
  • tableKeys. The primary key column for each table. Firehose uses these to match incoming records against existing rows for update and delete operations in the Iceberg tables.
  • s3TablesBucketName. The name for your S3 table bucket. Table bucket names must be unique for your account in the chosen Region.

Step 4: Deploy the CDK stacks

Deploy all six stacks with a single command. The CDK resolves the dependency order automatically:

npx cdk --app "npx ts-node bin/app-v2.ts" deploy --all

When prompted, review the AWS Identity and Access Management (IAM) changes and confirm the deployment. The CDK deploys the following stacks:

Stack What it creates
CdcMskCluster Amazon MSK cluster (2x kafka.m5.large brokers) with dual authentication (IAM for Firehose, unauthenticated for Debezium), custom configuration with auto.create.topics.enable=true, security groups with ingress rules for Aurora and MSK Connect workers
CdcMskConnectIam MSK Connect service execution role with permissions for Kafka cluster operations, VPC networking, S3 plugin access, and AWS Secrets Manager; Amazon CloudWatch Logs group for connector logs
CdcS3Tables S3 table bucket, aurora_cdc namespace, two Iceberg tables (orders, products) with column schemas
CdcLambdaTransform Lambda function for CDC event transformation and multi-table routing
CdcFirehoseRole Firehose IAM role with permissions for Amazon MSK, S3 Tables, AWS Glue Data Catalog, AWS Lake Formation, VPC networking, and Lambda invocation
CdcFirehose Firehose delivery stream with MSK as source (private connectivity through AWS PrivateLink), Lambda processing, Apache Iceberg Tables as destination with two table configurations, and S3 backup bucket for failed records

The MSK cluster takes approximately 25 minutes to create. The Debezium connector takes approximately 5 minutes after the cluster is ready. You can monitor the deployment progress in the AWS CloudFormation console.

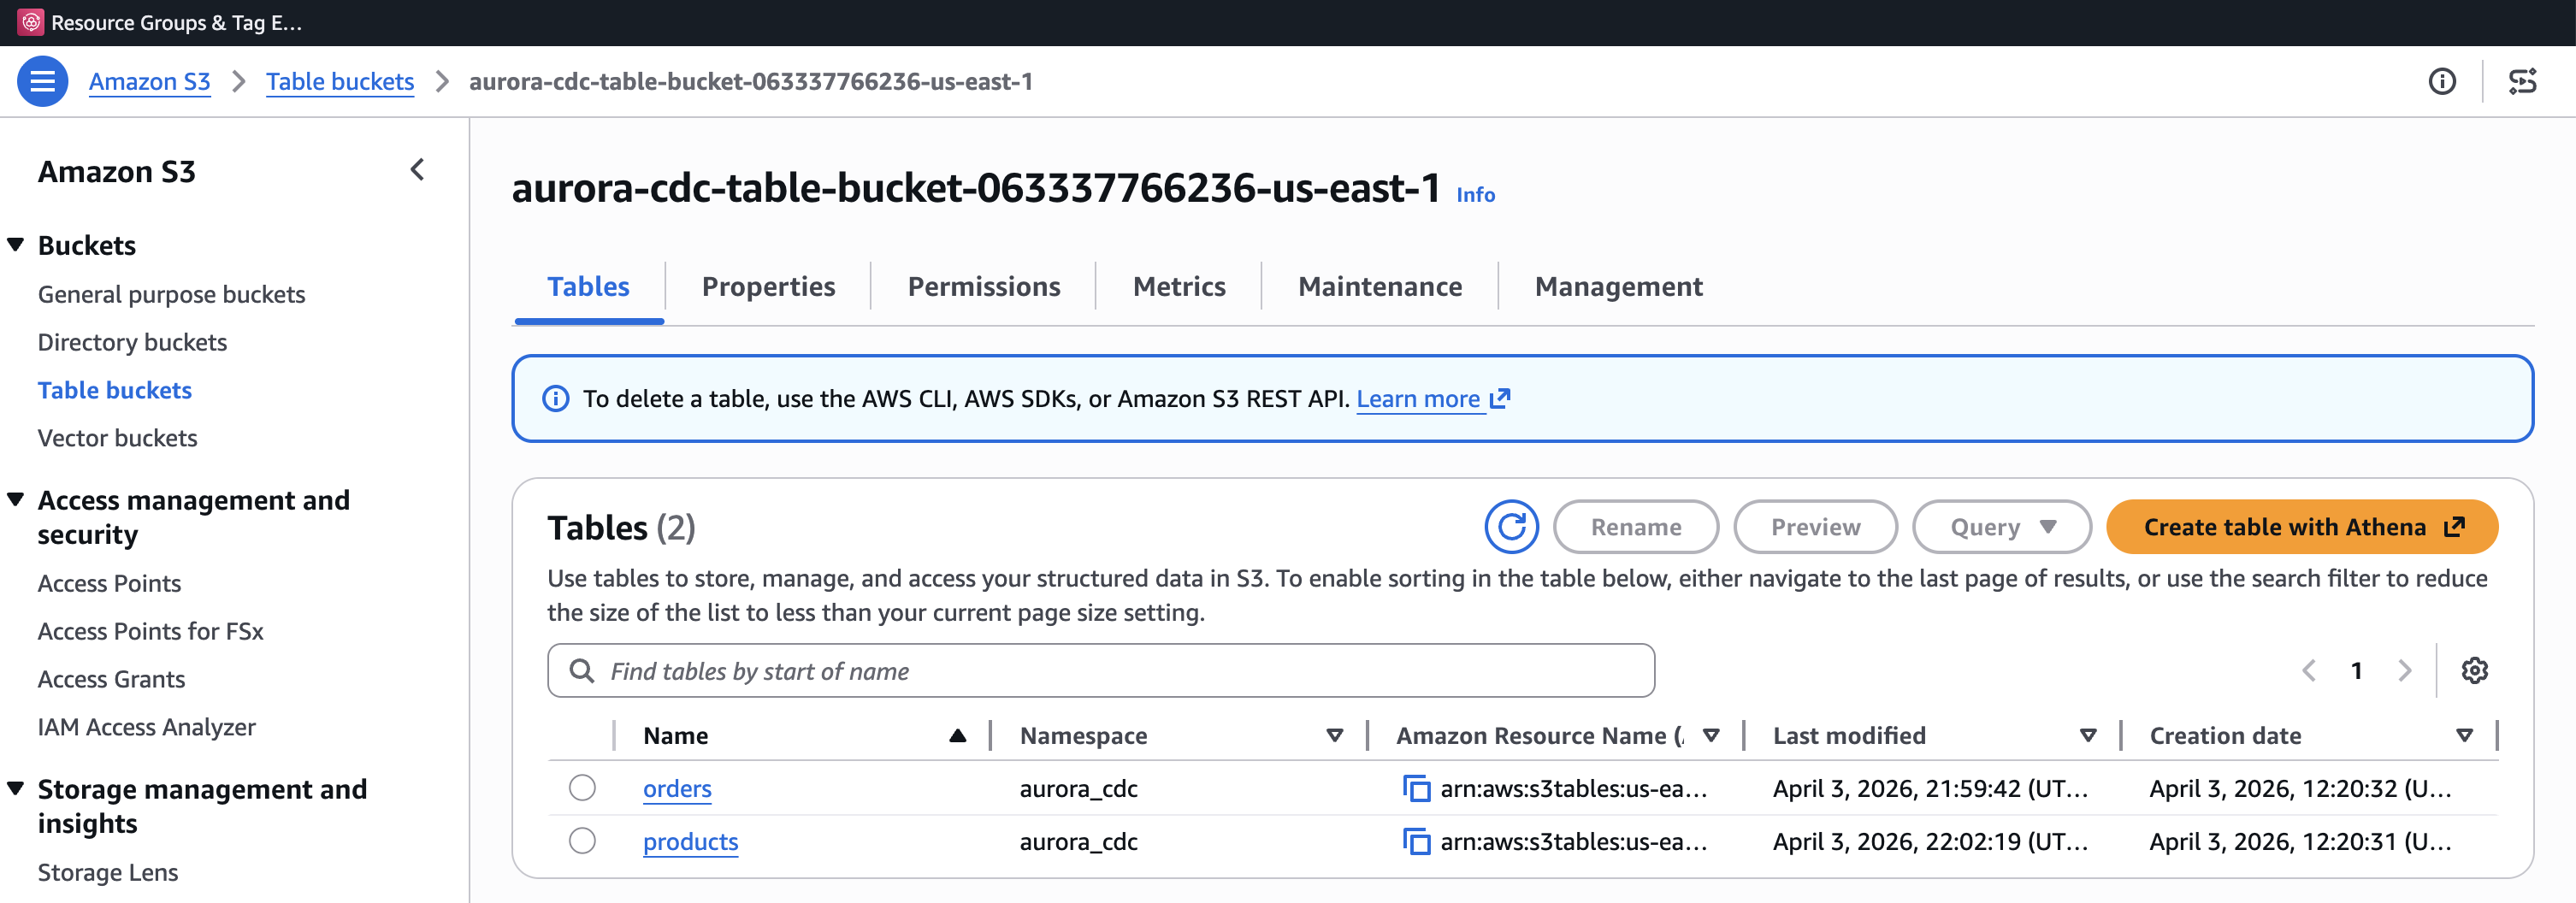
After the deployment completes, you can verify the resources in the AWS console. The S3 table bucket shows the two Iceberg tables in the aurora_cdc namespace.

Figure 2. S3 table bucket showing the orders and products Iceberg tables in the aurora_cdc namespace.

Figure 2. S3 table bucket showing the orders and products Iceberg tables in the aurora_cdc namespace.

The Firehose delivery stream shows the MSK source, Lambda transformation, and Apache Iceberg Tables destination.

Figure 3. Amazon Data Firehose delivery stream with MSK source, Lambda transformation, and Apache Iceberg Tables destination.

Figure 3. Amazon Data Firehose delivery stream with MSK source, Lambda transformation, and Apache Iceberg Tables destination.

The MSK cluster uses dual authentication (IAM for Firehose, unauthenticated for Debezium through TLS_PLAINTEXT), multi-VPC private connectivity for Firehose PrivateLink access, and auto.create.topics.enable=true so Debezium can create topics on first connect. VPC connectivity and the cluster resource policy are configured as CLI steps in Step 5.

Step 5: Enable MSK VPC connectivity, grant Lake Formation permissions, and apply MSK cluster policy

After the CDK deployment completes, enable multi-VPC private connectivity with IAM on the MSK cluster. Firehose requires this to create an AWS PrivateLink endpoint to the MSK brokers. This setting can’t be configured during cluster creation and must be applied as an update, which triggers a rolling broker restart (approximately 20–30 minutes).

# Get the cluster ARN and current version from the CdcMskCluster stack outputs
MSK_ARN=<msk-cluster-arn>
CLUSTER_VERSION=$(aws kafka describe-cluster-v2 \
    --cluster-arn $MSK_ARN \
    --region <your-region> \
    --query 'ClusterInfo.CurrentVersion' --output text)
# Enable VPC connectivity with IAM
aws kafka update-connectivity \
    --cluster-arn $MSK_ARN \
    --current-version $CLUSTER_VERSION \
    --connectivity-info '{"VpcConnectivity":{"ClientAuthentication":{"Sasl":{"Iam":{"Enabled":true}}}}}' \
    --region <your-region>

Wait for the cluster state to return to ACTIVE before proceeding:

aws kafka describe-cluster-v2 \
    --cluster-arn $MSK_ARN \
    --region <your-region> \
    --query 'ClusterInfo.State'

Next, grant the Firehose IAM role permissions through AWS Lake Formation. S3 Tables uses a sub-catalog format for the CatalogId parameter, which differs from the standard AWS Glue Data Catalog. These permissions require a data lake administrator identity.

Grant database-level and table-level permissions to the Firehose role:

# Grant database-level permissions
aws lakeformation grant-permissions \
    --region <your-region> \
    --principal '{"DataLakePrincipalIdentifier": "<firehose-role-arn>"}' \
    --resource '{"Database": {"CatalogId": "<account-id>:s3tablescatalog/<table-bucket-name>", "Name": "aurora_cdc"}}' \
    --permissions '["ALL"]'
# Grant table-level permissions (wildcard for the tables in the namespace)
aws lakeformation grant-permissions \
    --region <your-region> \
    --principal '{"DataLakePrincipalIdentifier": "<firehose-role-arn>"}' \
    --resource '{"Table": {"CatalogId": "<account-id>:s3tablescatalog/<table-bucket-name>", "DatabaseName": "aurora_cdc", "TableWildcard": {}}}' \
    --permissions '["ALL"]'

Note the CatalogId format: <account-id>:s3tablescatalog/<table-bucket-name>. This is specific to S3 Tables and tells Lake Formation to look up permissions in the S3 Tables catalog rather than the default Glue Data Catalog. For more information, see Integrating Amazon S3 Tables with AWS analytics services.

Next, attach a resource-based policy to the MSK cluster that grants the Firehose service principal permission to create VPC connections:

aws kafka put-cluster-policy \
    --cluster-arn <msk-cluster-arn> \
    --region <your-region> \
    --policy '{
"Version": "2012-10-17",
"Statement": [{
"Effect": "Allow",
"Principal": {"Service": "firehose.amazonaws.com"},
"Action": ["kafka:CreateVpcConnection", "kafka:GetBootstrapBrokers", "kafka:DescribeClusterV2"],
"Resource": "<msk-cluster-arn>"
}]
}'

You can find the <msk-cluster-arn> in the CdcMskCluster stack outputs from Step 4, and the <firehose-role-arn> in the CdcFirehoseRole stack outputs.

Step 6: Create the Debezium connector

With the MSK cluster running and Lake Formation permissions in place, create the Debezium connector using the MSK Connect API. The connector reads changes from Aurora PostgreSQL and publishes them to the MSK topic.

Firehose supports only one MSK topic per delivery stream, so each source table would otherwise need its own Firehose stream and VPC connection. To avoid this, the connector uses the Debezium ByLogicalTableRouter Single Message Transform (SMT) to route changes from multiple tables into a single topic (aurora.cdc.all-tables). The Lambda function then uses the source table name in each message to direct records to the correct Iceberg table. This single-topic pattern uses one Firehose stream for multiple tables, reducing cost and operational complexity.

First, retrieve the MSK bootstrap servers from the cluster:

aws kafka get-bootstrap-brokers \
    --cluster-arn <msk-cluster-arn> \
    --region <your-region>

Note the BootstrapBrokerString value (the PLAINTEXT brokers). Then create the connector:

aws kafkaconnect create-connector --cli-input-json '{
"connectorName": "aurora-postgres-debezium-connector",
"kafkaCluster": {
"apacheKafkaCluster": {
"bootstrapServers": "<bootstrap-servers>",
"vpc": {
"subnets": ["<subnet-1>", "<subnet-2>"],
"securityGroups": ["<msk-security-group-id>"]
}
}
},
"kafkaClusterClientAuthentication": {"authenticationType": "NONE"},
"kafkaClusterEncryptionInTransit": {"encryptionType": "PLAINTEXT"},
"kafkaConnectVersion": "2.7.1",
"plugins": [{"customPlugin": {"customPluginArn": "<custom-plugin-arn>", "revision": 1}}],
"serviceExecutionRoleArn": "<msk-connect-service-role-arn>",
"capacity": {"provisionedCapacity": {"mcuCount": 2, "workerCount": 2}},
"workerConfiguration": {"workerConfigurationArn": "<worker-config-arn>", "revision": 1},
"connectorConfiguration": {
"connector.class": "io.debezium.connector.postgresql.PostgresConnector",
"tasks.max": "1",
"database.hostname": "<aurora-cluster-endpoint>",
"database.port": "5432",
"database.user": "<db-user>",
"database.password": "<db-password>",
"database.dbname": "<database-name>",
"database.server.name": "aurora_cdc",
"plugin.name": "pgoutput",
"slot.name": "debezium_slot",
"publication.name": "dbz_publication",
"table.include.list": "public.orders,public.products",
"topic.prefix": "aurora.cdc",
"schema.history.internal.kafka.topic": "schema-changes.aurora",
"schema.history.internal.kafka.bootstrap.servers": "<bootstrap-servers>",
"decimal.handling.mode": "string",
"time.precision.mode": "adaptive_time_microseconds",
"tombstones.on.delete": "false",
"snapshot.mode": "initial",
"publication.autocreate.mode": "filtered",
"transforms": "Reroute",
"transforms.Reroute.type": "io.debezium.transforms.ByLogicalTableRouter",
"transforms.Reroute.topic.regex": "aurora\\\\\\\\.cdc\\\\\\\\.public\\\\\\\\.(.*)",
"transforms.Reroute.topic.replacement": "aurora.cdc.all-tables"
},
"logDelivery": {
"workerLogDelivery": {
"cloudWatchLogs": {
"enabled": true,
"logGroup": "/aws/msk-connect/aurora-cdc-debezium"
}
}
}
}'

The <msk-security-group-id> and <msk-connect-service-role-arn> can be found in the CdcMskCluster and CdcMskConnectIam stack outputs respectively. The ByLogicalTableRouter Single Message Transform routes CDC events from the monitored tables into a single topic (aurora.cdc.all-tables).

Step 7: Verify the Debezium connector

After creating the connector, verify that it is running and has completed its initial snapshot.

aws kafkaconnect list-connectors --region <your-region> \
    --query 'connectors[?connectorName==`aurora-postgres-debezium-connector`].{Name:connectorName,State:connectorState}' \
    --output table

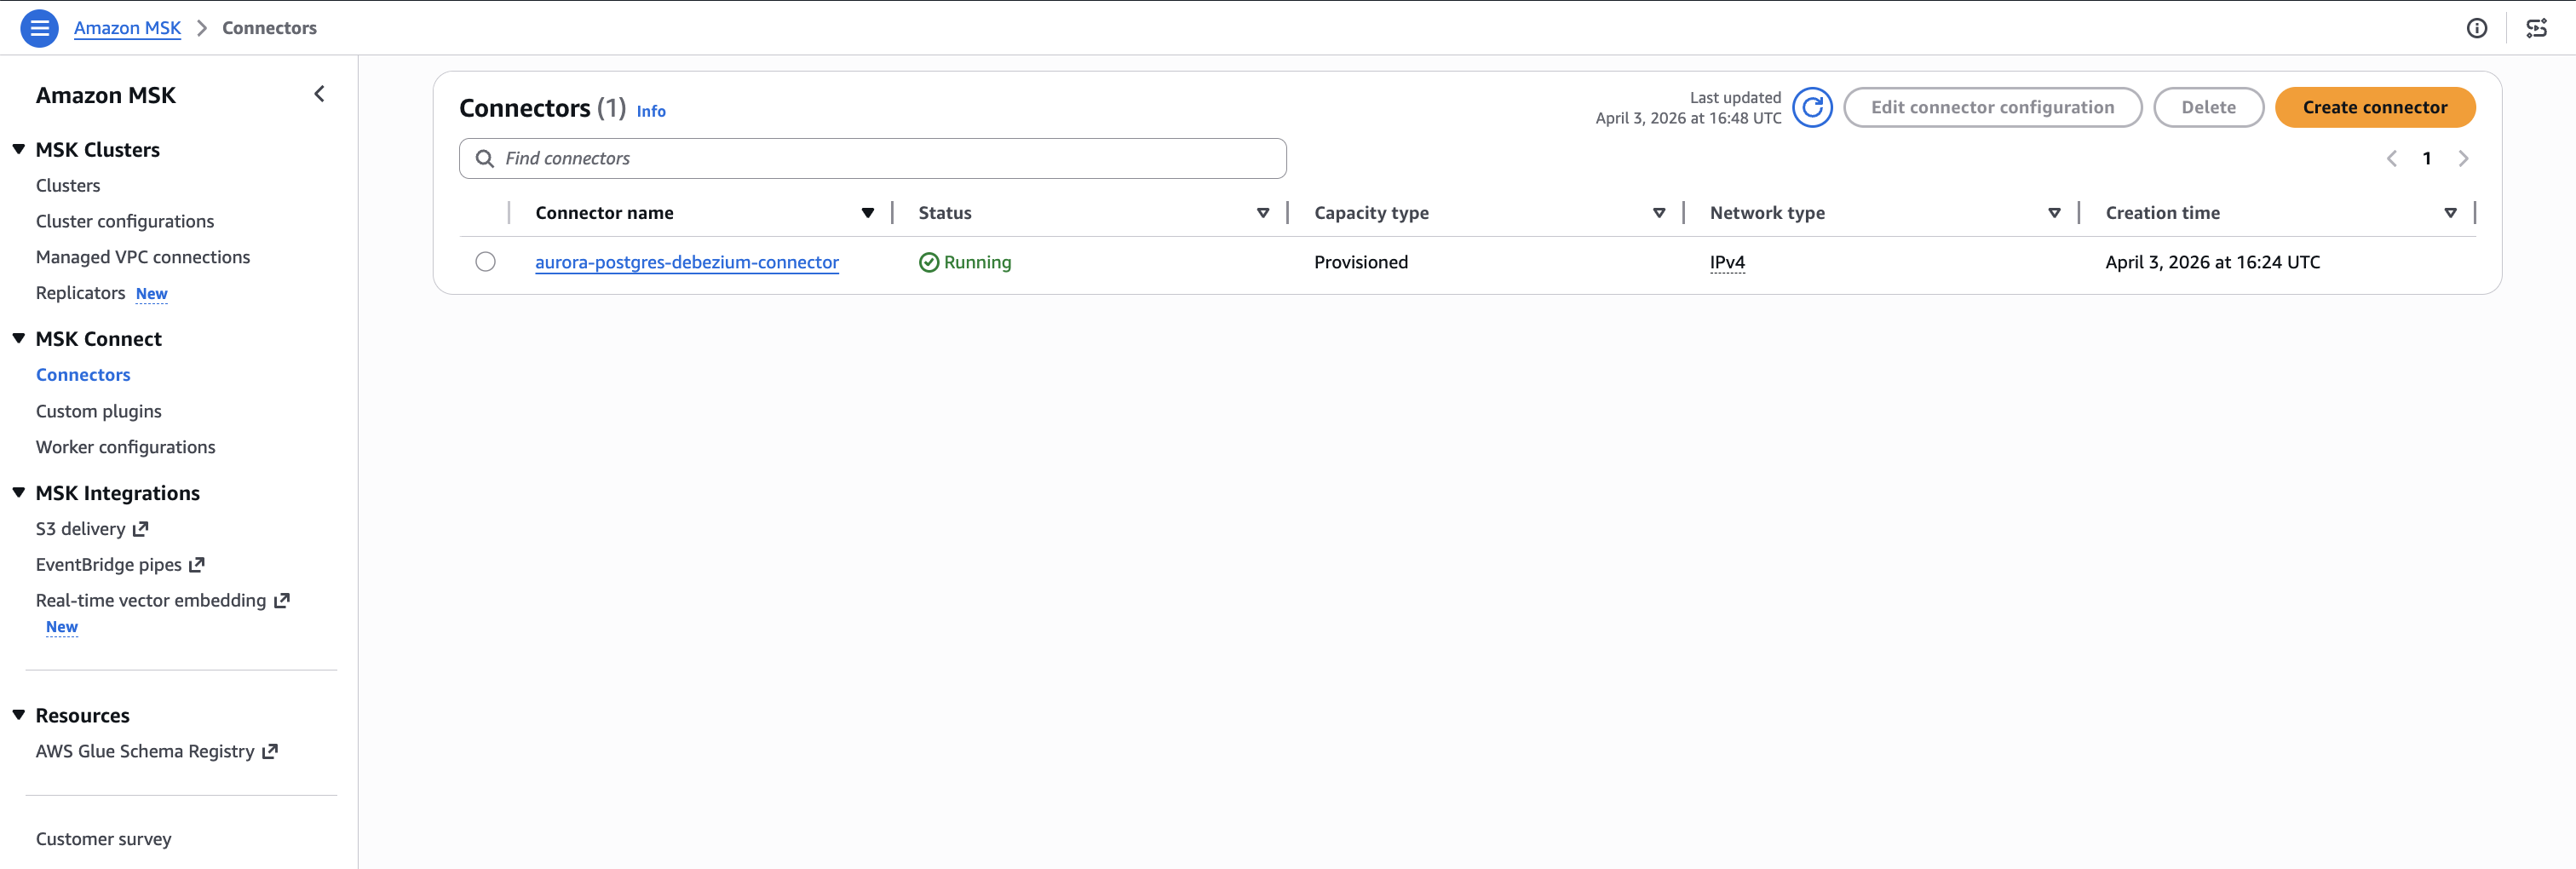
The connector state should show RUNNING, as shown in the following figure.

Figure 4. Debezium connector running on Amazon MSK Connect.

Figure 4. Debezium connector running on Amazon MSK Connect.

Check the CloudWatch Logs to confirm the snapshot completed:

aws logs tail /aws/msk-connect/aurora-cdc-debezium --follow --region <your-region>

You should see messages indicating the transition to streaming mode:

Finished exporting 0 records for table 'public.orders' (1 of 2 tables)
Finished exporting 0 records for table 'public.products' (2 of 2 tables)
Snapshot completed
Starting streaming

If the tables were empty when the connector started, the export count is 0. If you had existing data, the snapshot captures the existing rows as r (read) operations, which the Lambda function maps to insert operations in the Iceberg tables.

Verify that the Firehose delivery stream is active:

aws firehose describe-delivery-stream \
    --delivery-stream-name msk-to-s3tables-firehose \
    --region <your-region> \
    --query 'DeliveryStreamDescription.DeliveryStreamStatus'

The status should return ACTIVE.

Step 8: Test the pipeline

Insert test data into the Aurora PostgreSQL source tables. Each insert triggers a CDC event that flows through the pipeline: Aurora WAL to Debezium to MSK topic to Firehose to Lambda transform to S3 Tables.

-- Insert orders
INSERT INTO public.orders (customer_id, order_date, total_amount, status)
VALUES
(1, '2026-01-20', 299.99, 'shipped'),
(2, '2026-01-21', 149.50, 'processing'),
(1, '2026-01-22', 89.99, 'delivered');
-- Insert products
INSERT INTO public.products (product_name, category, price, stock_quantity)
VALUES
('Wireless Headphones', 'Electronics', 79.99, 150),
('Running Shoes', 'Sports', 129.99, 75),
('Coffee Maker', 'Kitchen', 49.99, 200);

This creates six records across two tables. Each record generates a Debezium CDC event with operation type c (create), which the Lambda function maps to an insert operation in the corresponding Iceberg table.

Step 9: Verify data delivery

Check the Firehose IncomingRecords metric to confirm records are flowing through the delivery stream:

aws cloudwatch get-metric-statistics \
    --namespace AWS/Firehose \
    --metric-name IncomingRecords \
    --dimensions Name=DeliveryStreamName,Value=msk-to-s3tables-firehose \
    --start-time $(date -u -v-10M +%Y-%m-%dT%H:%M:%S) \
    --end-time $(date -u +%Y-%m-%dT%H:%M:%S) \
    --period 60 --statistics Sum \
    --region <your-region>

You should see a Sum value of 6 or more. If the value is 0, wait another minute and retry. There can be a short delay between MSK topic delivery and Firehose metric reporting.

If records aren’t appearing, check the Firehose error output in the backup S3 bucket and the Lambda function’s CloudWatch Logs for transformation errors.

Step 10: Query data using Amazon Athena

With data delivered to S3 Tables, you can query the Iceberg tables using Amazon Athena. S3 Tables integrates with the AWS Glue Data Catalog as a sub-catalog, so you reference tables using the S3 Tables catalog format.

Tip: If records aren’t appearing in Athena, check the Firehose IncomingRecords CloudWatch metric and the Lambda function’s CloudWatch Logs for transformation errors.

Open the Athena console, select the AwsDataCatalog data source, and run the following queries:

SELECT * FROM "s3tablescatalog/<table-bucket-name>"."aurora_cdc"."products" LIMIT 10;
SELECT * FROM "s3tablescatalog/<table-bucket-name>"."aurora_cdc"."orders" LIMIT 10;

Replace <table-bucket-name> with your S3 table bucket name. You should see the records from the initial snapshot that Debezium captured when the connector started.

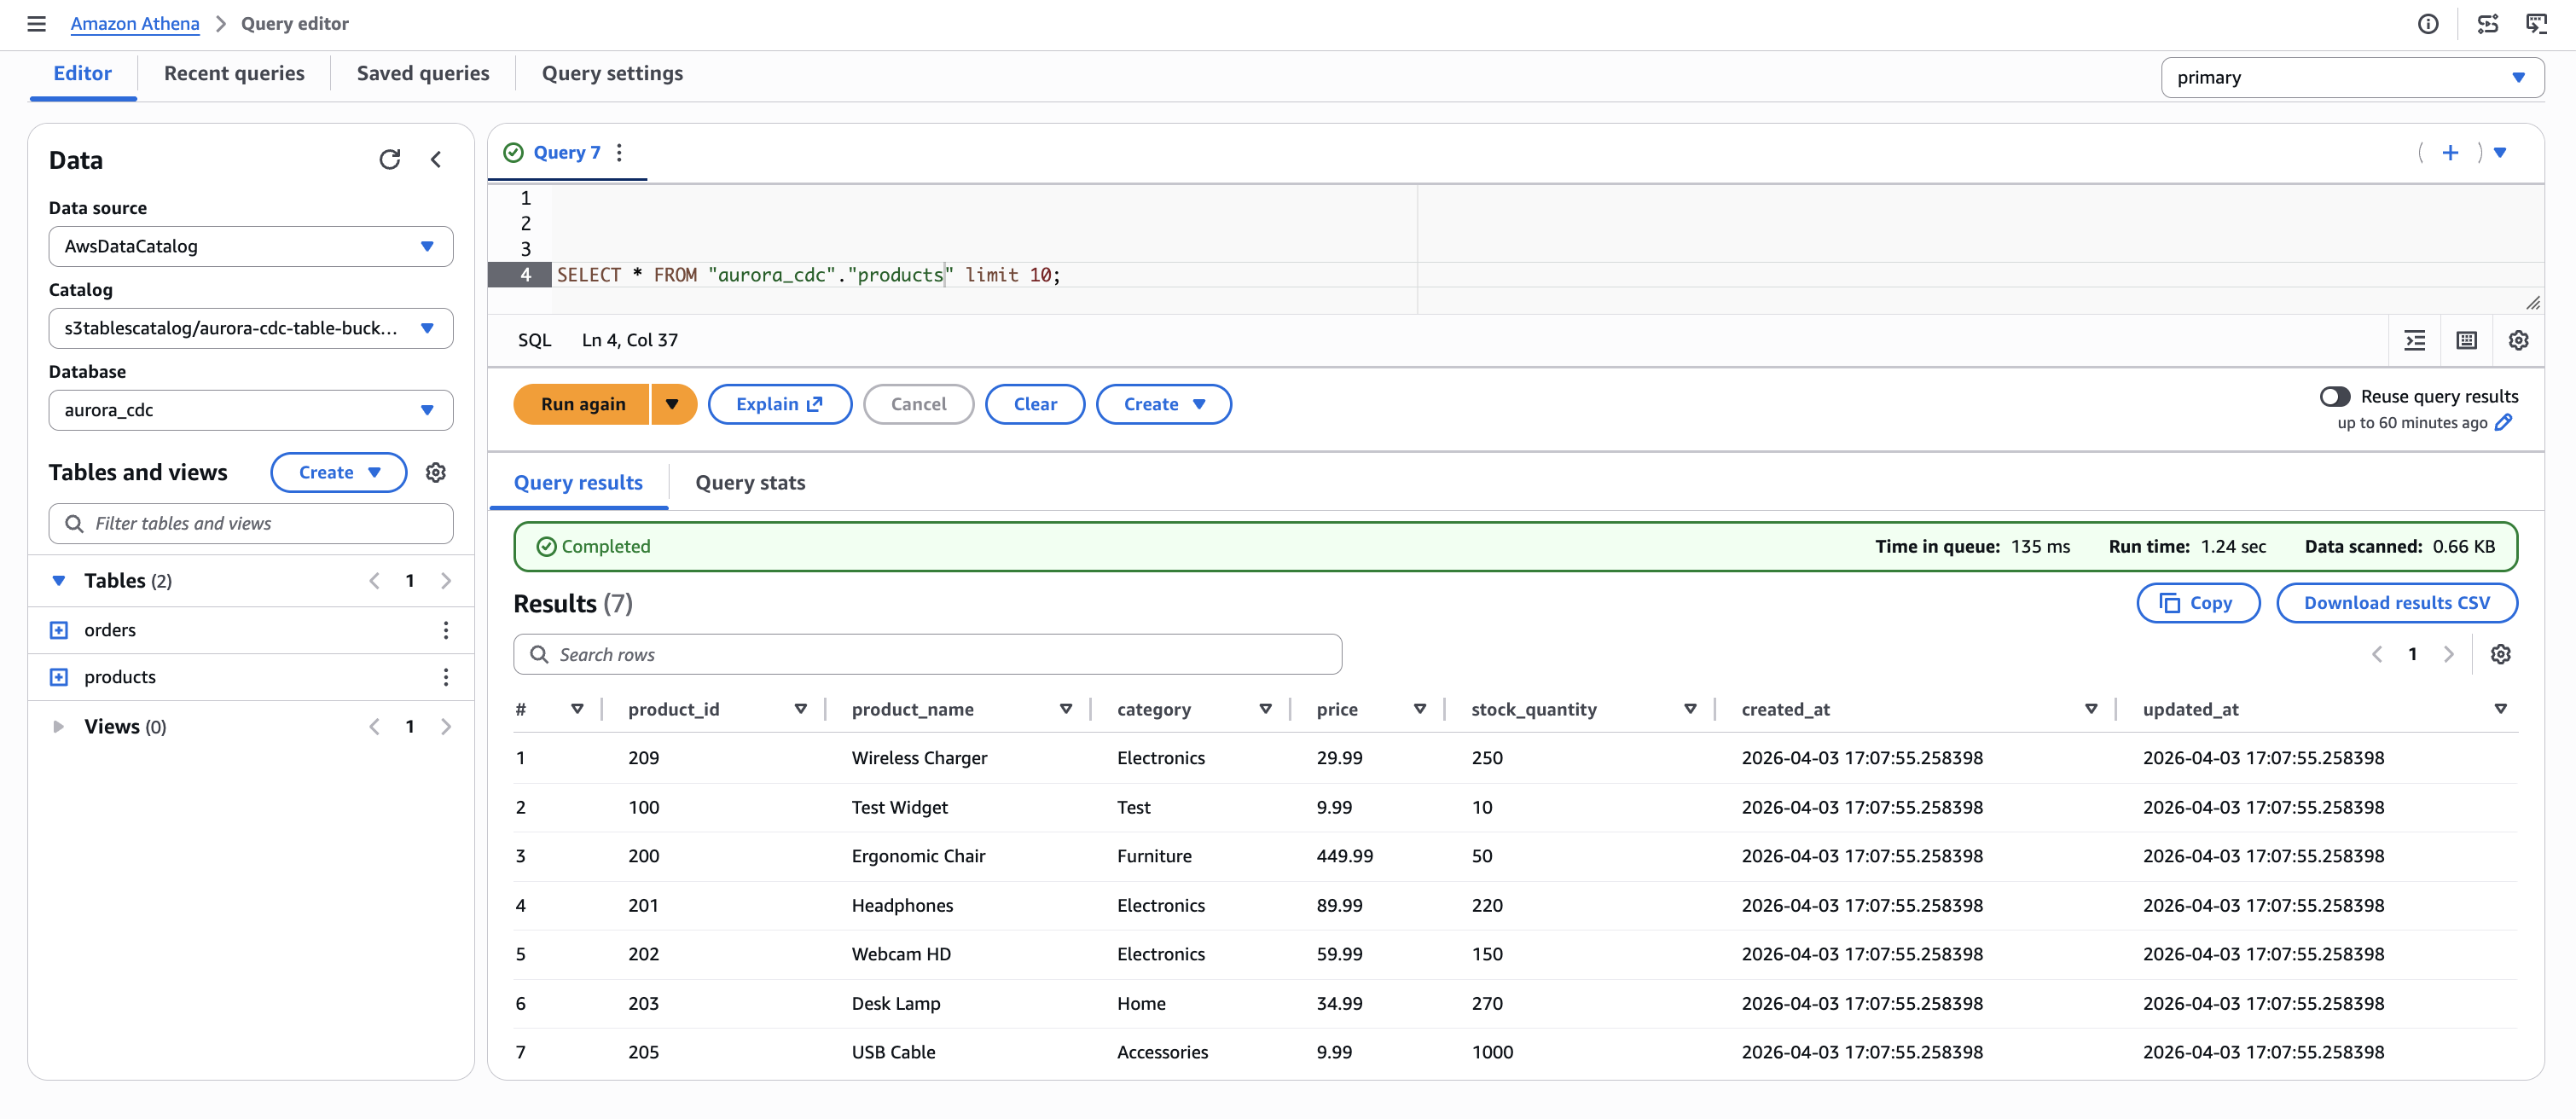
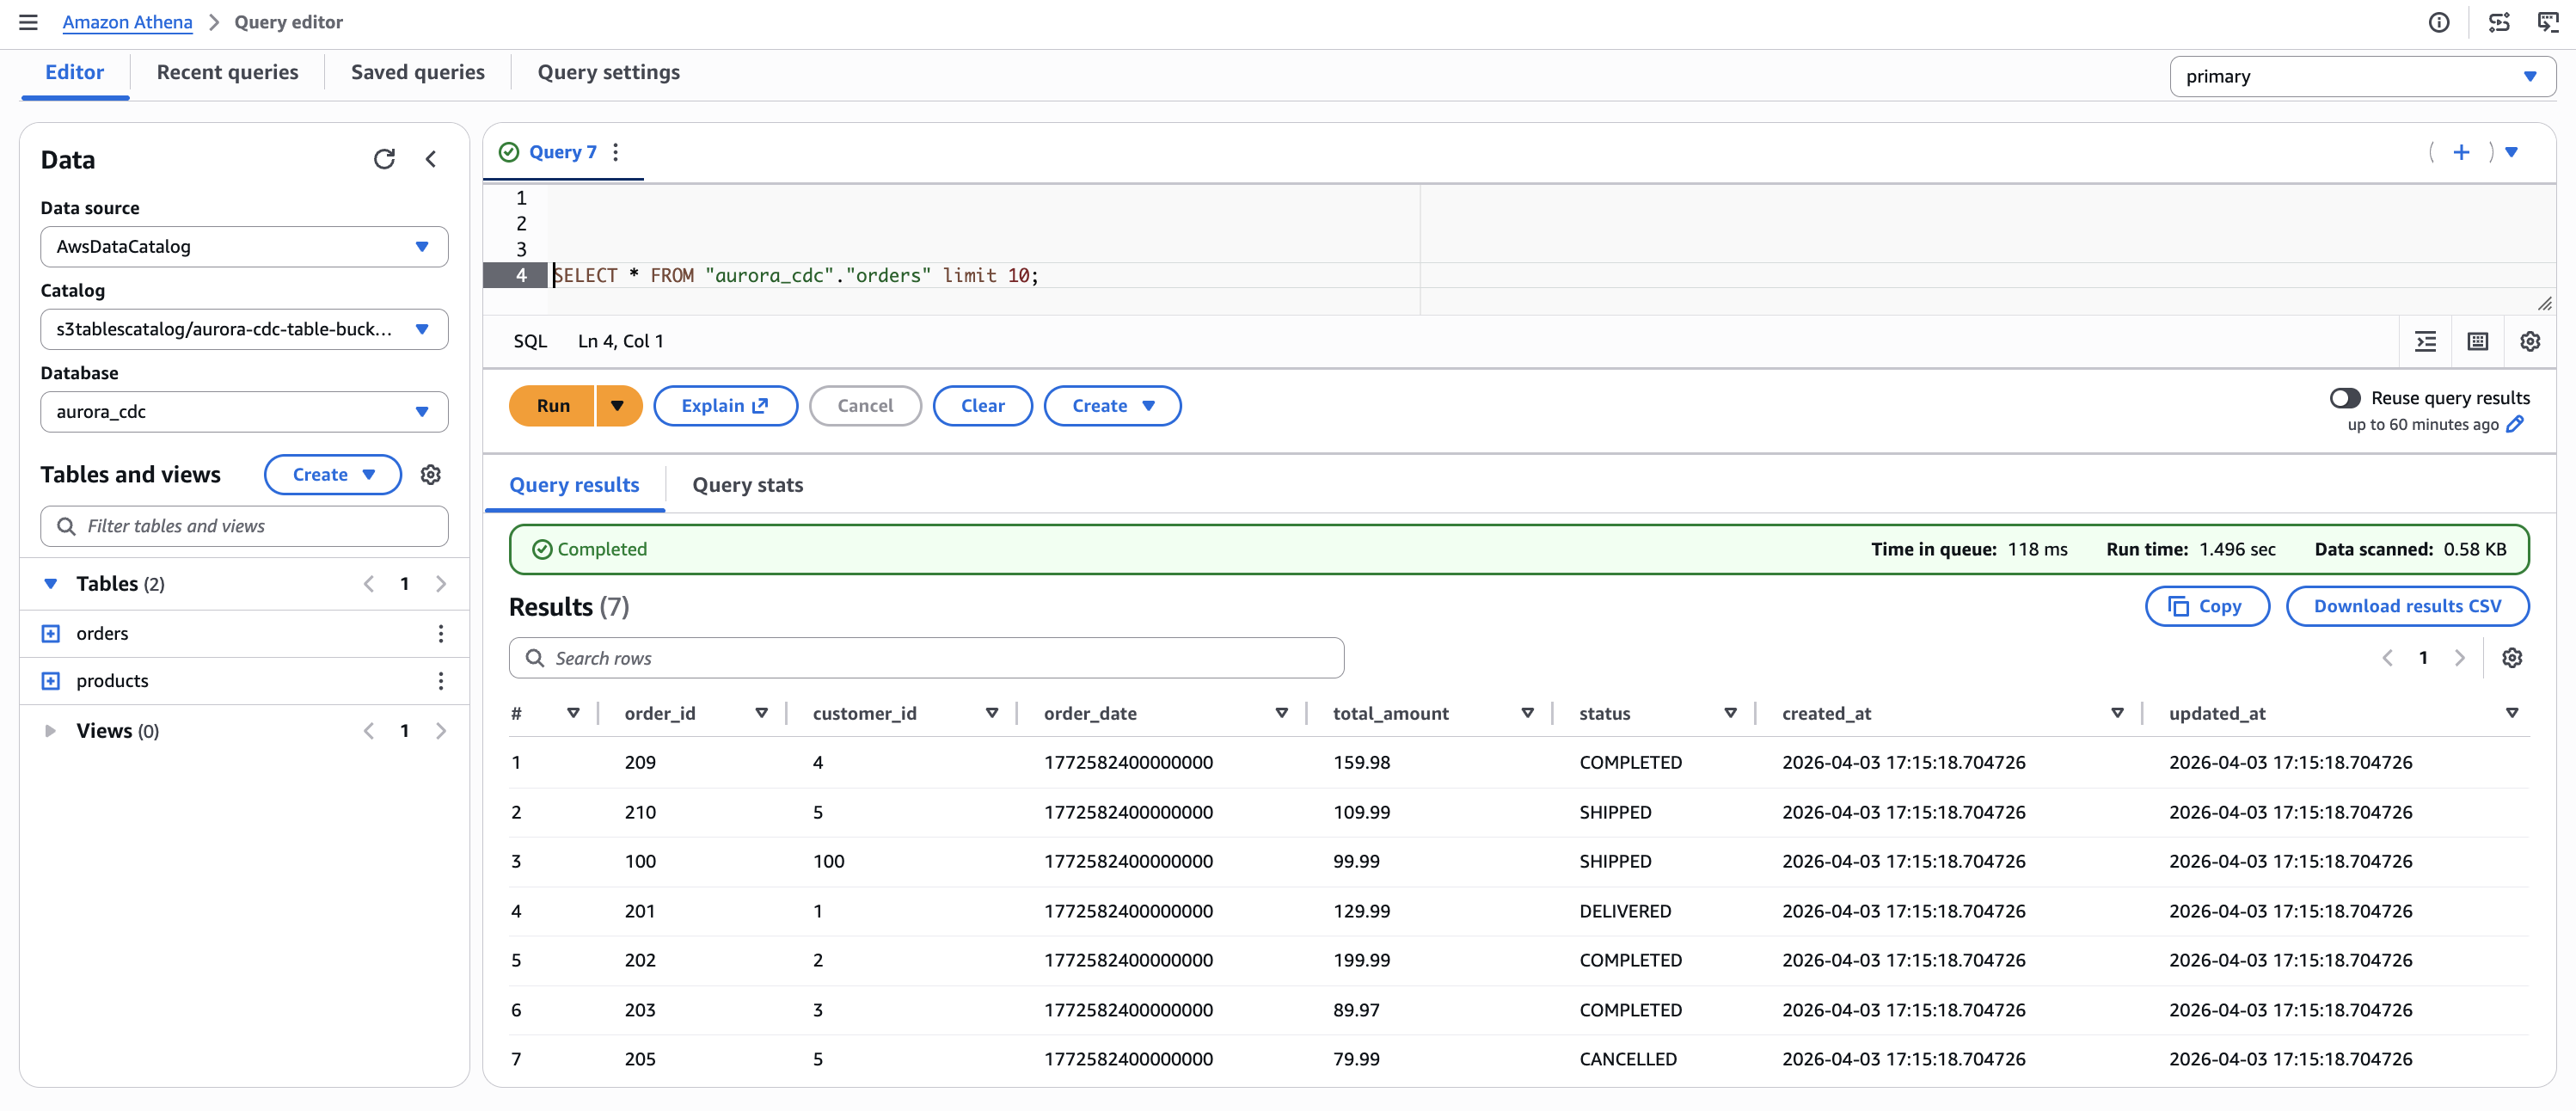
The following figures show the initial state of both tables as queried through Athena. At this point, the products table contains seven records and the orders table contains seven records, captured during the Debezium initial snapshot.

Figure 5. Initial state of the products table in Amazon Athena, showing seven records captured from Aurora PostgreSQL through the CDC pipeline.

Figure 5. Initial state of the products table in Amazon Athena, showing seven records captured from Aurora PostgreSQL through the CDC pipeline.

Figure 6. Initial state of the orders table in Amazon Athena, showing seven records captured from Aurora PostgreSQL through the CDC pipeline.

Figure 6. Initial state of the orders table in Amazon Athena, showing seven records captured from Aurora PostgreSQL through the CDC pipeline.

Now test that update and delete operations propagate correctly. Run the following statements in Aurora:

-- Insert new records
INSERT INTO public.products (product_name, category, price, stock_quantity)
VALUES ('Bluetooth Speaker', 'Electronics', 129.99, 90), ('Standing Desk', 'Furniture', 799.99, 20);
INSERT INTO public.orders (customer_id, order_date, total_amount, status)
VALUES (201, '2026-04-03', 149.99, 'NEW'), (202, '2026-04-03', 249.50, 'NEW'), (203, '2026-04-03', 79.90, 'NEW');
-- Update existing records
UPDATE public.products SET stock_quantity = 30, price = 549.99 WHERE product_name = 'Ergonomic Chair';
UPDATE public.orders SET status = 'DELIVERED' WHERE order_id = 201;
-- Delete a record
DELETE FROM public.products WHERE product_name = 'Test Widget';

Wait for the changes to propagate through the pipeline, then query Athena again. The following figures show the results after the insert, update, and delete operations have been applied.

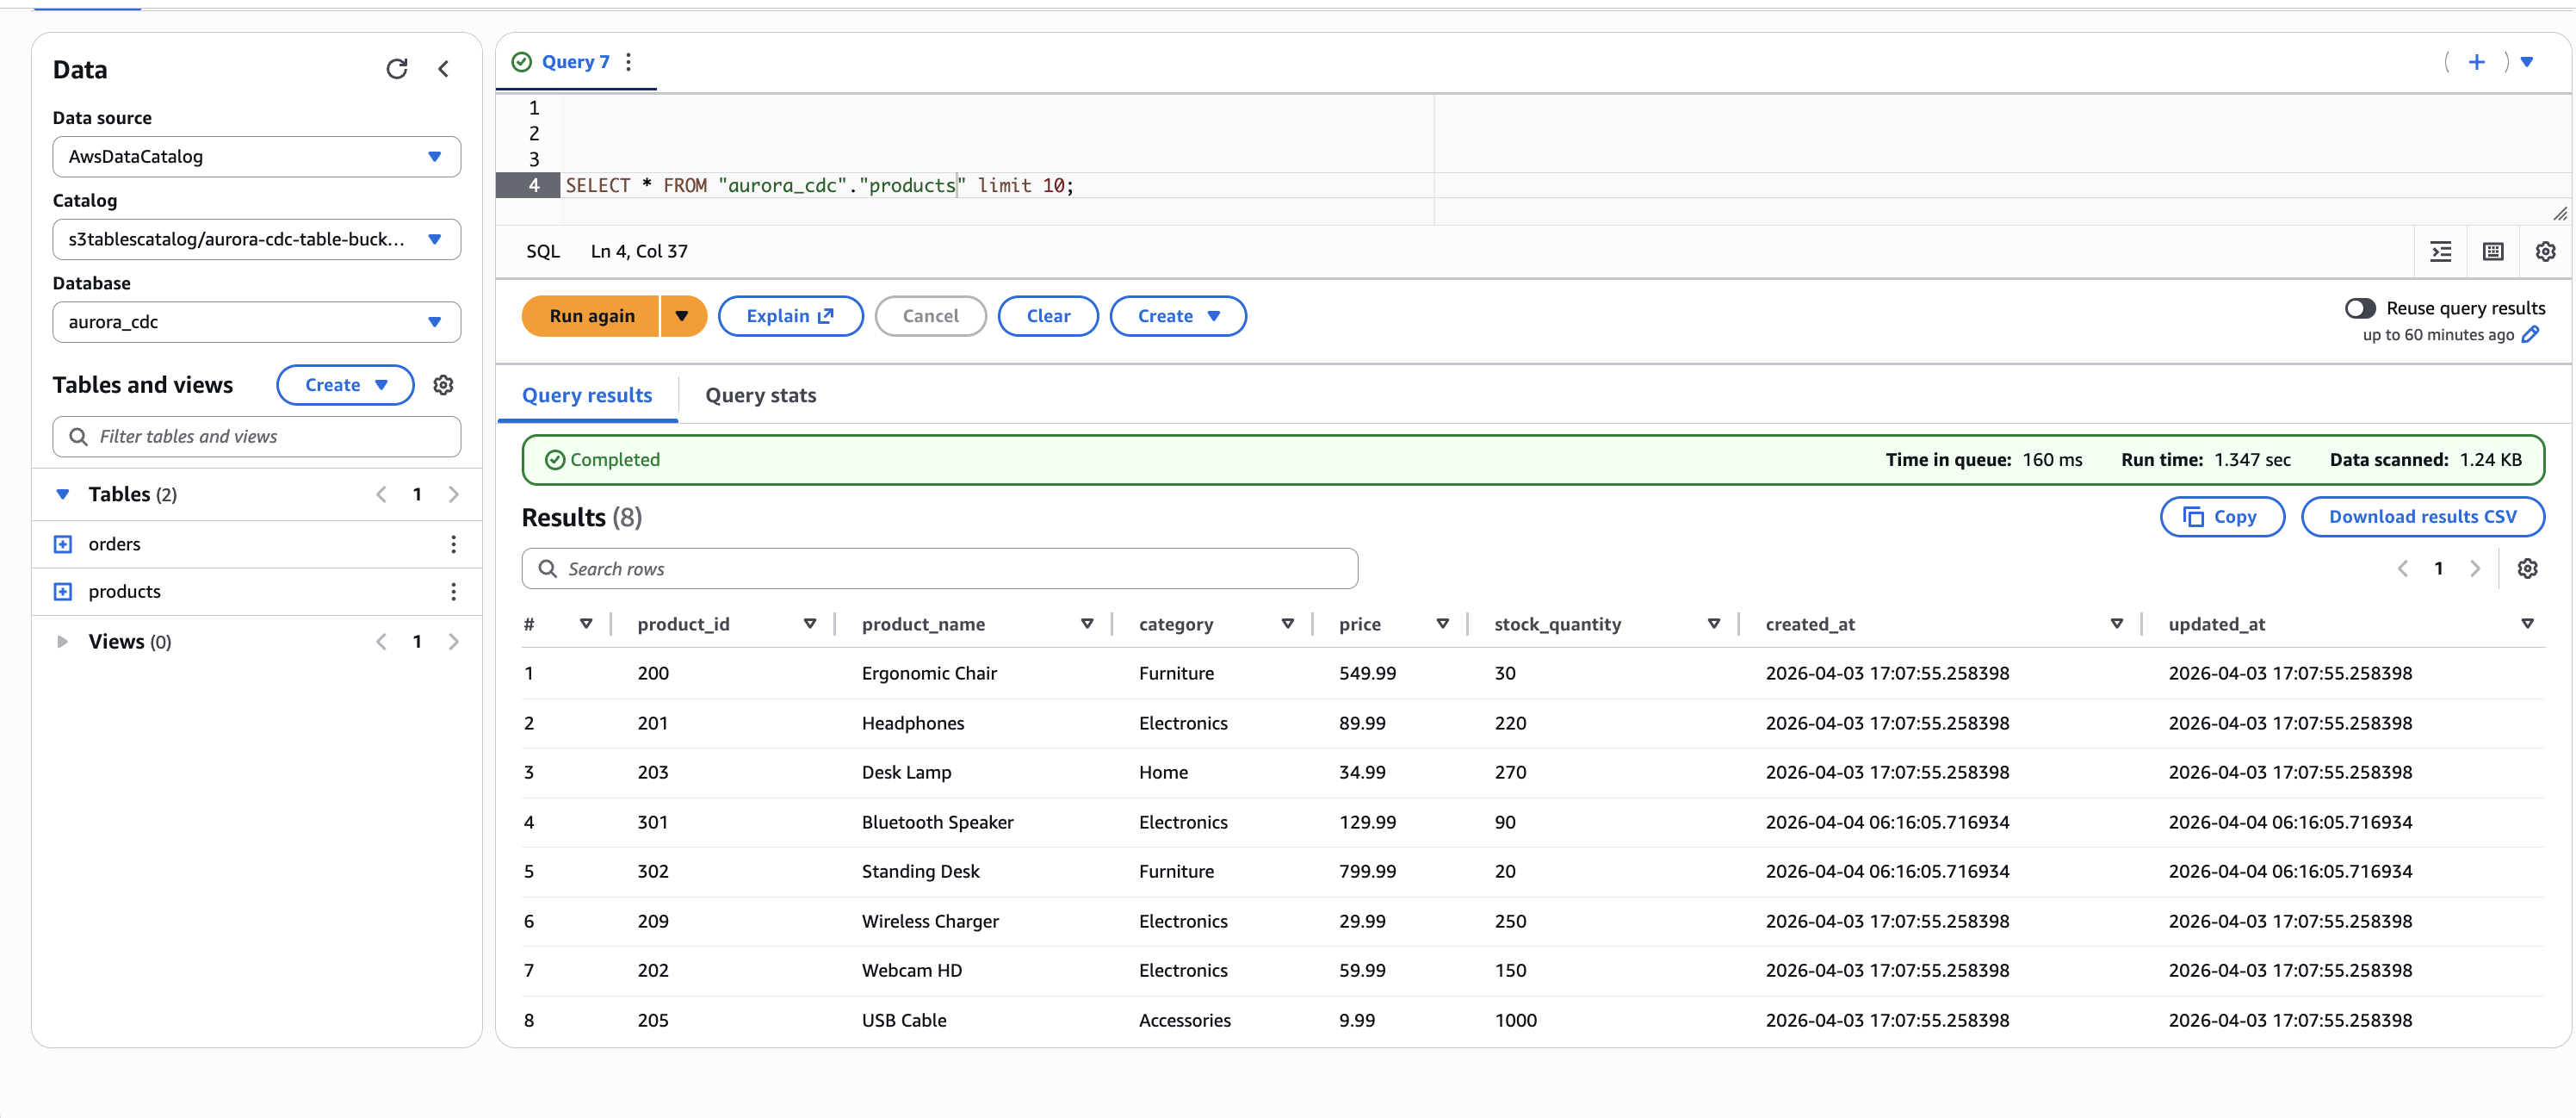
In the products table, the Test Widget record (product_id 100) is no longer present because it was removed by the delete operation. The Ergonomic Chair row now reflects the updated price (549.99) and stock quantity (30). Two new records, Bluetooth Speaker and Standing Desk, appear with a later created_at timestamp, confirming they were inserted after the initial snapshot.

Figure 7. Products table after CDC operations. The Ergonomic Chair, Headphones, and Desk Lamp rows reflect updated values. Bluetooth Speaker and Standing Desk are newly inserted records. The Test Widget record has been removed by the delete operation.

Figure 7. Products table after CDC operations. The Ergonomic Chair, Headphones, and Desk Lamp rows reflect updated values. Bluetooth Speaker and Standing Desk are newly inserted records. The Test Widget record has been removed by the delete operation.

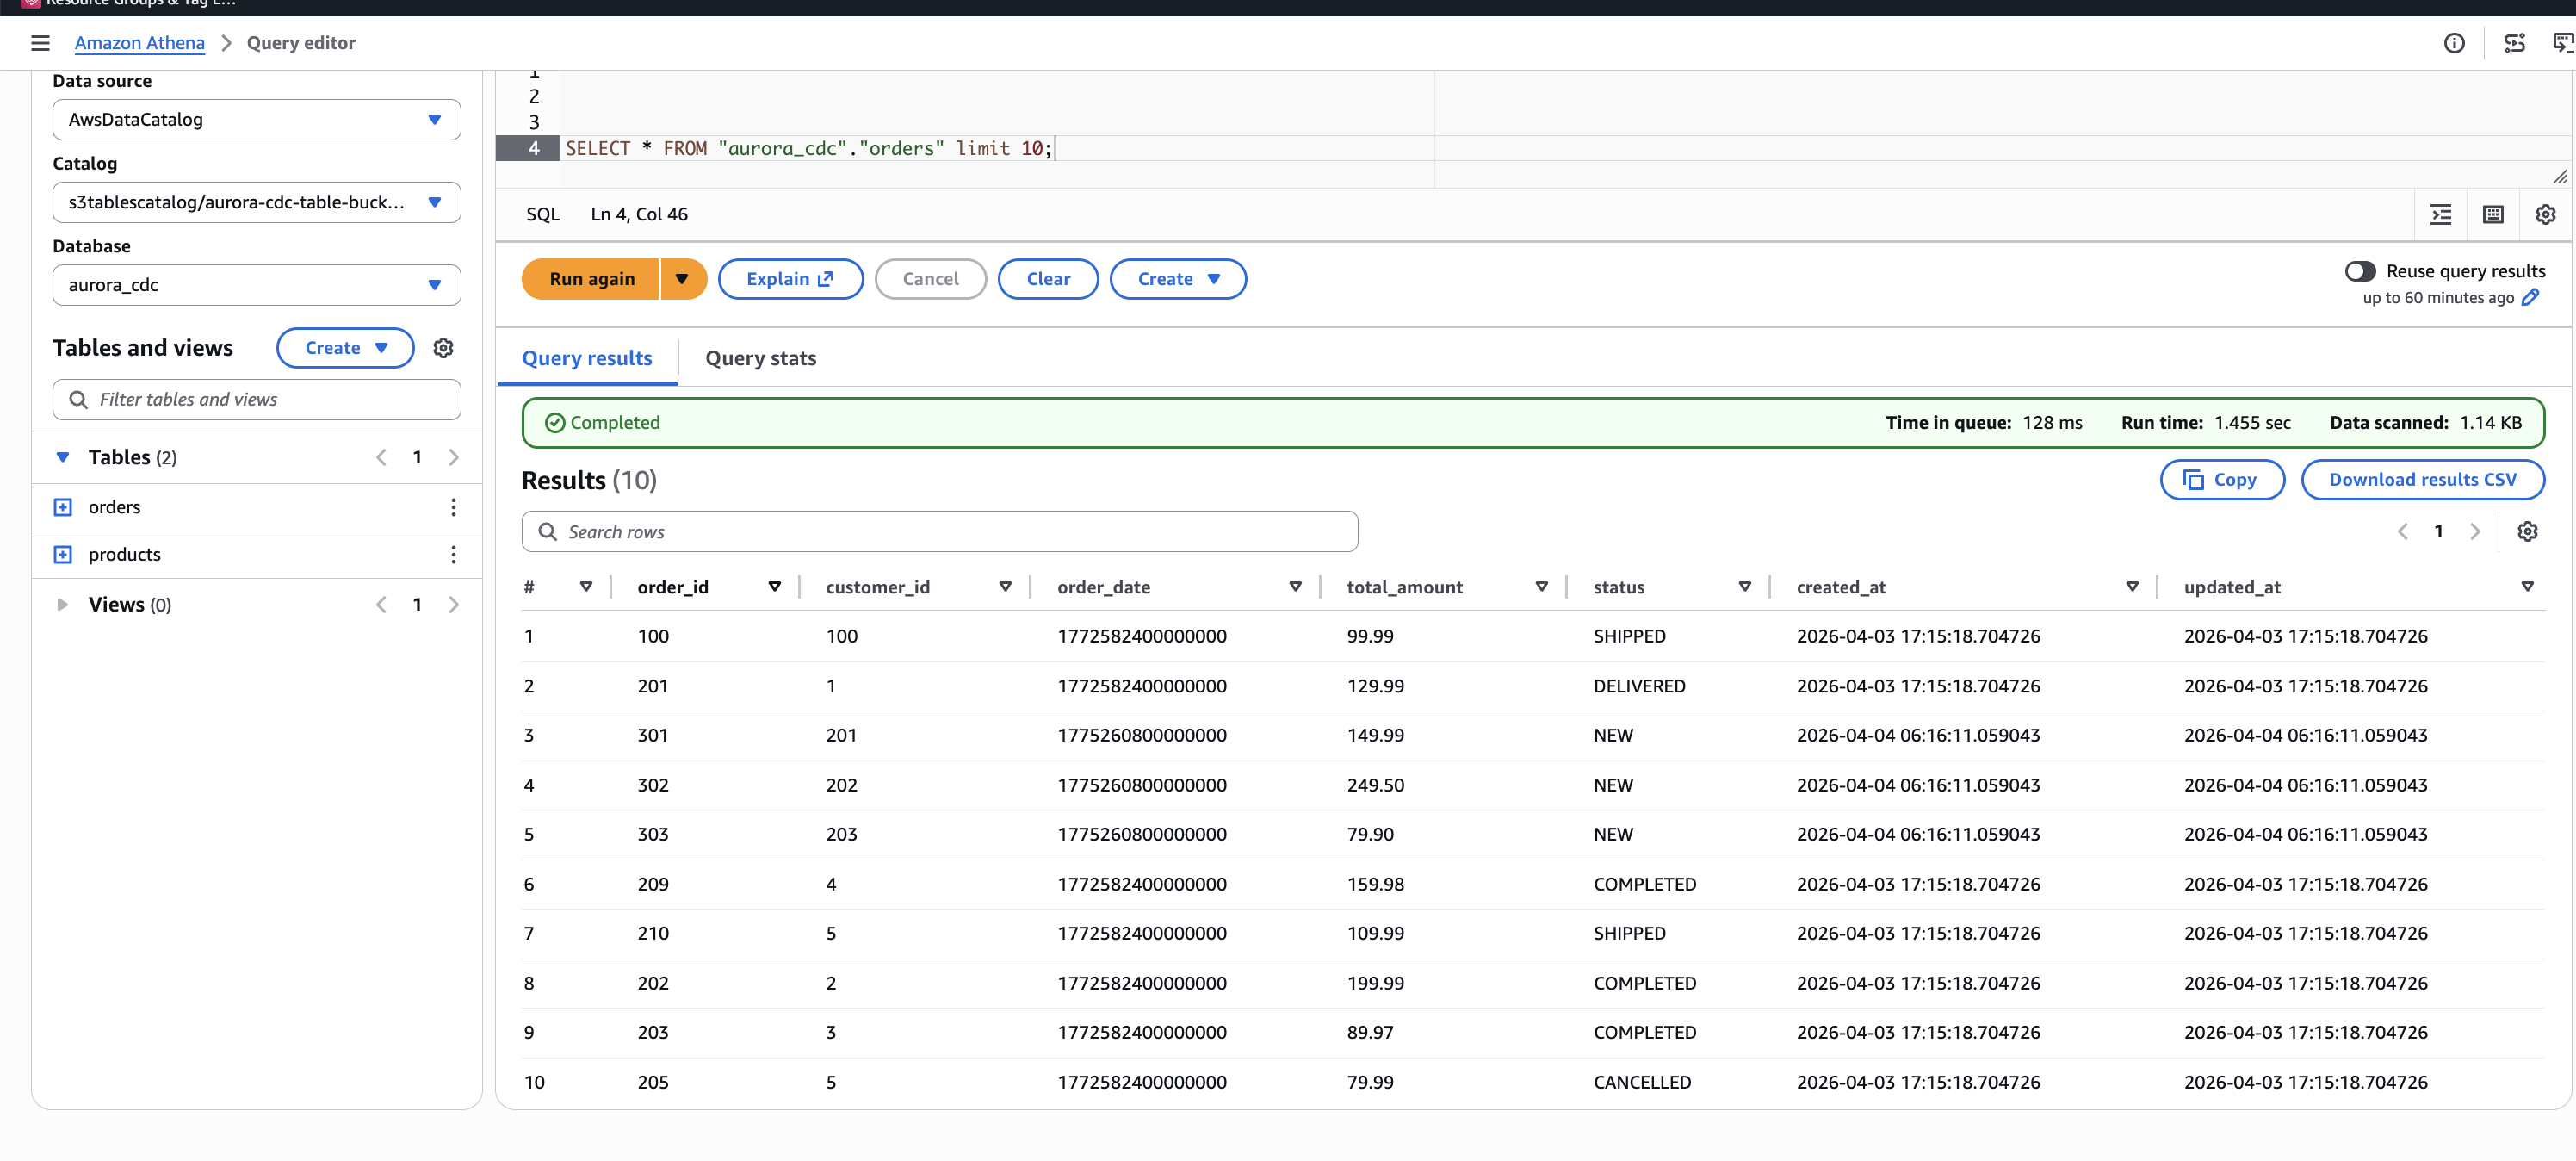
In the orders table, order 100 now shows a status of SHIPPED and order 201 shows DELIVERED, reflecting the update operations. Three new orders (301, 302, 303) appear with status NEW and a later timestamp, confirming they were inserted after the initial load.

Figure 8. Orders table after CDC operations. Orders 100 and 201 reflect updated status values. Orders 301, 302, and 303 are newly inserted records.

Figure 8. Orders table after CDC operations. Orders 100 and 201 reflect updated status values. Orders 301, 302, and 303 are newly inserted records.

This confirms that the pipeline correctly handles the three CDC operation types: inserts, updates, and deletes are captured from the Aurora WAL by Debezium, routed through the single MSK topic, transformed by the Lambda function, and applied as row-level Iceberg operations by Firehose.

S3 Tables handles compaction and snapshot management for Iceberg tables automatically, including compaction of small data files and expiration of old snapshots. You don’t need to run manual maintenance operations.

You can also use Iceberg’s time travel capability to query the table as it existed before the updates:

SELECT * FROM "s3tablescatalog/<table-bucket-name>"."aurora_cdc"."orders"
FOR TIMESTAMP AS OF current_timestamp - interval '5' minute;

This returns the original data before the update, demonstrating the time travel capability that Apache Iceberg provides through S3 Tables.

Cleaning up

To avoid ongoing charges, delete the resources in reverse dependency order.

Delete the CDK stacks:

cd cdk
npx cdk --app "npx ts-node bin/app-v2.ts" destroy --all

Delete the Debezium custom plugin and worker configuration that were created through the AWS CLI in Step 2:

aws kafkaconnect delete-custom-plugin --custom-plugin-arn <plugin-arn>
aws kafkaconnect delete-worker-configuration --worker-configuration-arn <worker-config-arn>

Clean up the Aurora PostgreSQL replication resources:

SELECT pg_drop_replication_slot('debezium_slot');
DROP PUBLICATION dbz_publication;

Important: The replication slot (debezium_slot) was created automatically by Debezium. If you plan to redeploy the pipeline later, you don’t need to drop the slot and publication. However, the replication slot continues to retain WAL segments while the connector isn’t running, which can increase storage usage on the Aurora cluster. The MSK cluster is the largest cost component of this solution and can’t be paused. It can only be deleted and recreated.

Conclusion

In this post, we showed you how to build a near real-time CDC pipeline from Aurora PostgreSQL to Apache Iceberg tables in Amazon S3 Tables. The key architectural decisions include:

  • Single-topic routing with multi-table delivery. The Debezium ByLogicalTableRouter SMT routes CDC events from multiple tables through one MSK topic, and the Lambda otfMetadata routing directs each record to the correct Iceberg table. This reduces VPC connection costs by using a single Firehose stream for inserts, updates, and deletes across multiple destination tables.
  • Fully managed CDC pipeline. MSK Connect runs Debezium, Firehose handles delivery with automatic retries, and S3 Tables manages Iceberg compaction and snapshots. The Lambda transform preserves CDC semantics by mapping Debezium operations to Iceberg row-level operations.
  • Governed lakehouse access. Lake Formation controls fine-grained access to the Iceberg tables, and data from multiple isolated Aurora clusters can be unified in a single S3 Tables namespace for cross-domain analytics.
  • Infrastructure as code. Six AWS CDK stacks deploy the core pipeline, with Lake Formation permissions, MSK cluster policy, and Debezium connector configured through documented CLI steps.

To get started, clone the sample repository and follow the walkthrough steps. For more information about the services used in this solution, see the Amazon MSK Developer Guide, Amazon Data Firehose Developer Guide, and Amazon S3 Tables User Guide.

We encourage you to try this solution and adapt it to your own CDC workloads. If you have questions or feedback, leave a comment on this post.


About the author
Chintan Agrawal

Chintan Agrawal

Chintan is a Solutions Architect with over 7 years of experience, with a specialization in Analytics and Healthcare domain. He possesses a strong enthusiasm for assisting clients in discovering valuable insights from their data. Through his expertise, he constructs innovative solutions that empower businesses to arrive at informed, data-driven choices.

Power data ingestion into Splunk using Amazon Data Firehose

Post Syndicated from Tarik Makota original https://aws.amazon.com/blogs/big-data/power-data-ingestion-into-splunk-using-amazon-data-firehose/

Last updated: December 17, 2025


Originally published: December 18, 2017

Amazon Data Firehose supports Splunk Enterprise and Splunk Cloud as a delivery destination. This native integration between Splunk Enterprise, Splunk Cloud, and Amazon Data Firehose is designed to make AWS data ingestion setup seamless, while offering a secure and fault-tolerant delivery mechanism. We want to enable customers to monitor and analyze machine data from any source and use it to deliver operational intelligence and optimize IT, security, and business performance.

With Amazon Data Firehose, customers can use a fully managed, reliable, and scalable data streaming solution to Splunk. In this post, we tell you a bit more about the Amazon Data Firehose and Splunk integration. We also show you how to ingest large amounts of data into Splunk using Amazon Data Firehose.

Push vs. Pull data ingestion

Presently, customers use a combination of two ingestion patterns, primarily based on data source and volume, in addition to existing company infrastructure and expertise:

  1. Pull-based approach: Using dedicated pollers running the popular Splunk Add-on for AWS to pull data from various AWS services such as Amazon CloudWatch or Amazon S3.
  2. Push-based approach: Streaming data directly from AWS to Splunk HTTP Event Collector (HEC) by using Amazon Data Firehose. Examples of applicable data sources include CloudWatch Logs and Amazon Kinesis Data Streams.

The pull-based approach offers data delivery guarantees such as retries and checkpointing out of the box. However, it requires more ops to manage and orchestrate the dedicated pollers, which are commonly running on Amazon EC2 instances. With this setup, you pay for the infrastructure even when it’s idle.

On the other hand, the push-based approach offers a low-latency scalable data pipeline made up of serverless resources like Amazon Data Firehose sending directly to Splunk indexers (by using Splunk HEC). This approach translates into lower operational complexity and cost. However, if you need guaranteed data delivery then you have to design your solution to handle issues such as a Splunk connection failure or Lambda execution failure. To do so, you might use, for example, AWS Lambda Dead Letter Queues.

How about getting the best of both worlds?

Let’s go over the new integration’s end-to-end solution and examine how Amazon Data Firehose and Splunk together expand the push-based approach into a native AWS solution for applicable data sources.

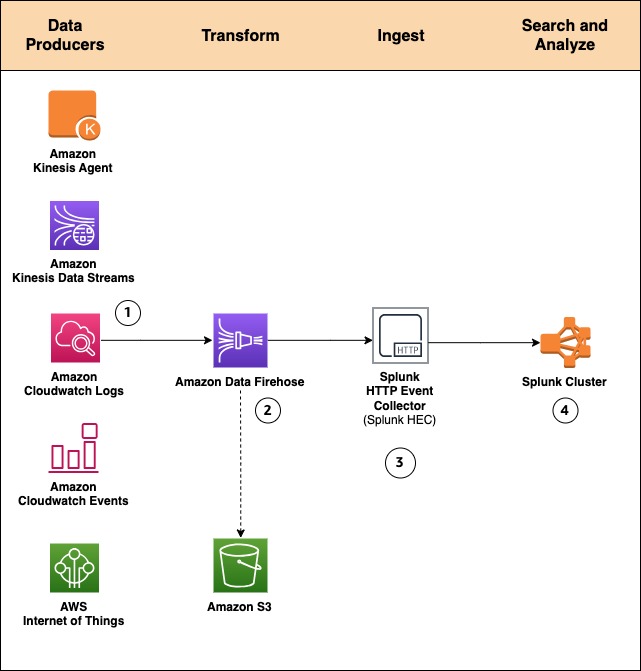
By using a managed service like Amazon Data Firehose for data ingestion into Splunk, we provide out-of-the-box reliability and scalability. One of the pain points of the old approach was the overhead of managing the data collection nodes (Splunk heavy forwarders). With the new Amazon Data Firehose to Splunk integration, there are no forwarders to manage or set up. Data producers (1) are configured through the AWS Management Console to drop data into Amazon Data Firehose.

You can also create your own data producers. For example, you can drop data into a Firehose delivery stream by using Amazon Kinesis Agent, or by using the Firehose API (PutRecord(), PutRecordBatch()), or by writing to a Kinesis Data Stream configured to be the data source of a Firehose delivery stream. For more details, refer to Sending Data to an Amazon Data Firehose Delivery Stream.

You might need to transform the data before it goes into Splunk for analysis. For example, you might want to enrich it or filter or anonymize sensitive data. You can do so using AWS Lambda and enabling data transformation in Amazon Data Firehose. In this scenario, Amazon Data Firehose is used to decompress the Amazon CloudWatch logs by enabling the feature.

Systems fail all the time. Let’s see how this integration handles outside failures to guarantee data durability. In cases when Amazon Data Firehose can’t deliver data to the Splunk Cluster, data is automatically backed up to an S3 bucket. You can configure this feature while creating the Firehose delivery stream (2). You can choose to back up all data or only the data that’s failed during delivery to Splunk.

In addition to using S3 for data backup, this Firehose integration with Splunk supports Splunk Indexer Acknowledgments to guarantee event delivery. This feature is configured on Splunk’s HTTP Event Collector (HEC) (3). It ensures that HEC returns an acknowledgment to Amazon Data Firehose only after data has been indexed and is available in the Splunk cluster (4).

Now let’s look at a hands-on exercise that shows how to forward VPC flow logs to Splunk.

How-to guide

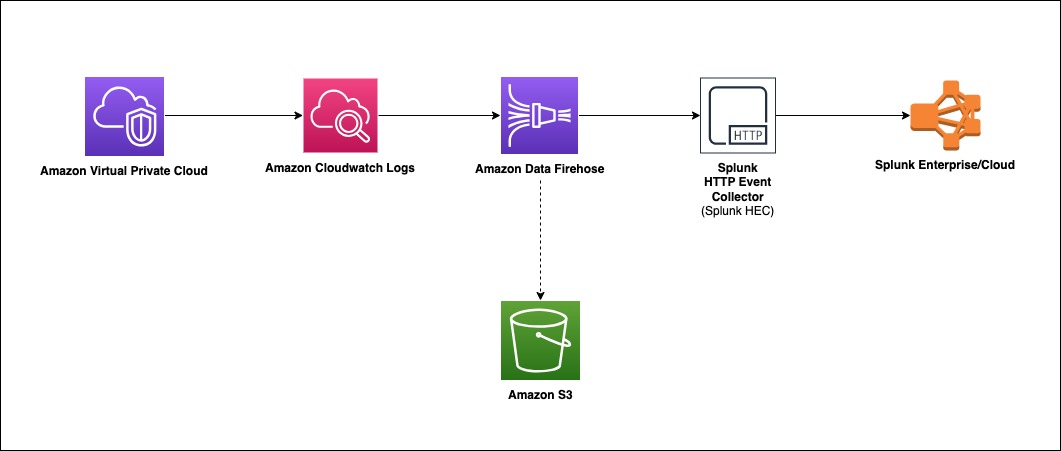
To process VPC flow logs, we implement the following architecture.

Amazon Virtual Private Cloud (Amazon VPC) delivers flow log files into an Amazon CloudWatch Logs group. Using a CloudWatch Logs subscription filter, we set up real-time delivery of CloudWatch Logs to an Amazon Data Firehose stream.

Data coming from CloudWatch Logs is compressed with gzip compression. To work with this compression, we will enable decompression for the Firehose stream. Firehose then delivers the raw logs to the Splunk Http Event Collector (HEC).

If delivery to the Splunk HEC fails, Firehose deposits the logs into an Amazon S3 bucket. You can then ingest the events from S3 using an alternate mechanism such as a Lambda function.

When data reaches Splunk (Enterprise or Cloud), Splunk parsing configurations (packaged in the Splunk Add-on for Amazon Data Firehose) extract and parse all fields. They make data ready for querying and visualization using Splunk Enterprise and Splunk Cloud.

Walkthrough

Install the Splunk Add-on for Amazon Data Firehose

The Splunk Add-on for Amazon Data Firehose enables Splunk (be it Splunk Enterprise, Splunk App for AWS, or Splunk Enterprise Security) to use data ingested from Amazon Data Firehose. Install the Add-on on all the indexers with an HTTP Event Collector (HEC). The Add-on is available for download from Splunkbase. For troubleshooting assistance, please refer to: AWS Data Firehose troubleshooting documentationSplunk’s official troubleshooting guide

HTTP Event Collector (HEC)

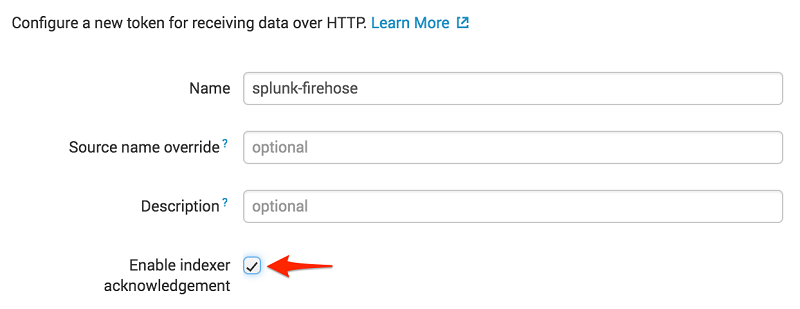
Before you can use Amazon Data Firehose to deliver data to Splunk, set up the Splunk HEC to receive the data. From Splunk web, go to the Setting menu, choose Data Inputs, and choose HTTP Event Collector. Choose Global Settings, ensure All tokens is enabled, and then choose Save. Then choose New Token to create a new HEC endpoint and token. When you create a new token, make sure that Enable indexer acknowledgment is checked.

When prompted to select a source type, select aws:cloudwatchlogs:vpcflow

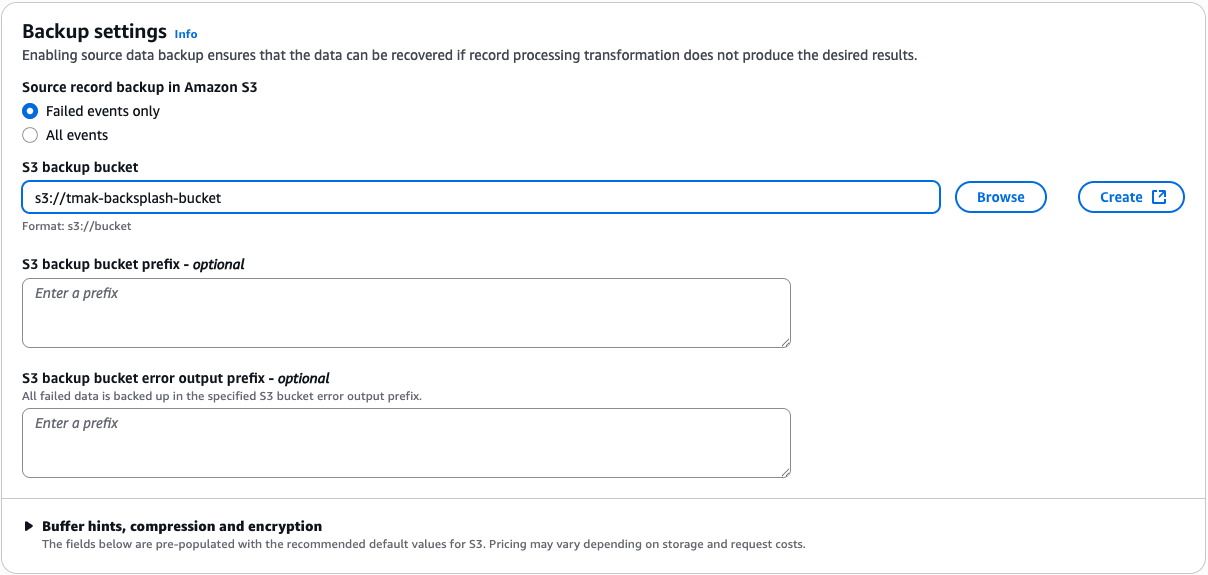
Create an S3 backsplash bucket

To provide for situations in which Amazon Data Firehose can’t deliver data to the Splunk Cluster, we use an S3 bucket to back up the data. You can configure this feature to back up all data or only the data that’s failed during delivery to Splunk.

Note: Bucket names are unique.

aws s3 create-bucket --bucket <your-s3-bucket-name> --create-bucket-configuration LocationConstraint=<your-region>

Create an Amazon Data Firehose delivery stream

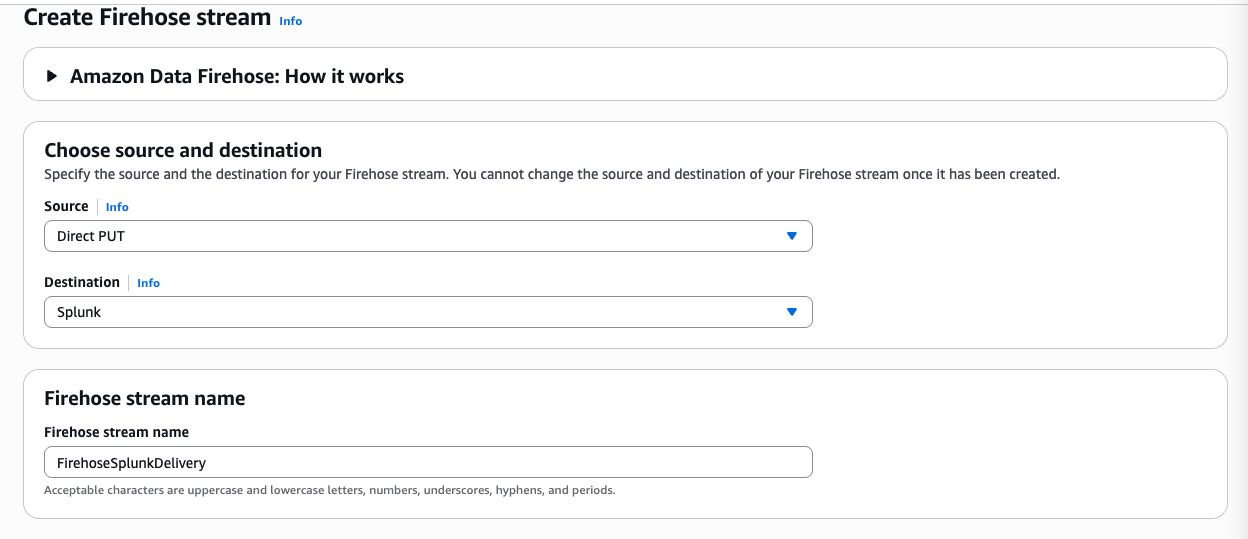
On the AWS console, open the Amazon Data Firehose console, and choose Create Firehose Stream.

Select DirectPUT as the source and Splunk as the destination.

Create Firehose Stream

If you are using Firehose to deliver CloudWatch Logs and want to deliver decompressed data to your Firehose stream destination, use Firehose Data Format Conversion (Parquet, ORC) or Dynamic partitioning. You must enable decompression for your Firehose stream, check out Deliver decompressed Amazon CloudWatch Logs to Amazon S3 and Splunk using Amazon Data Firehose

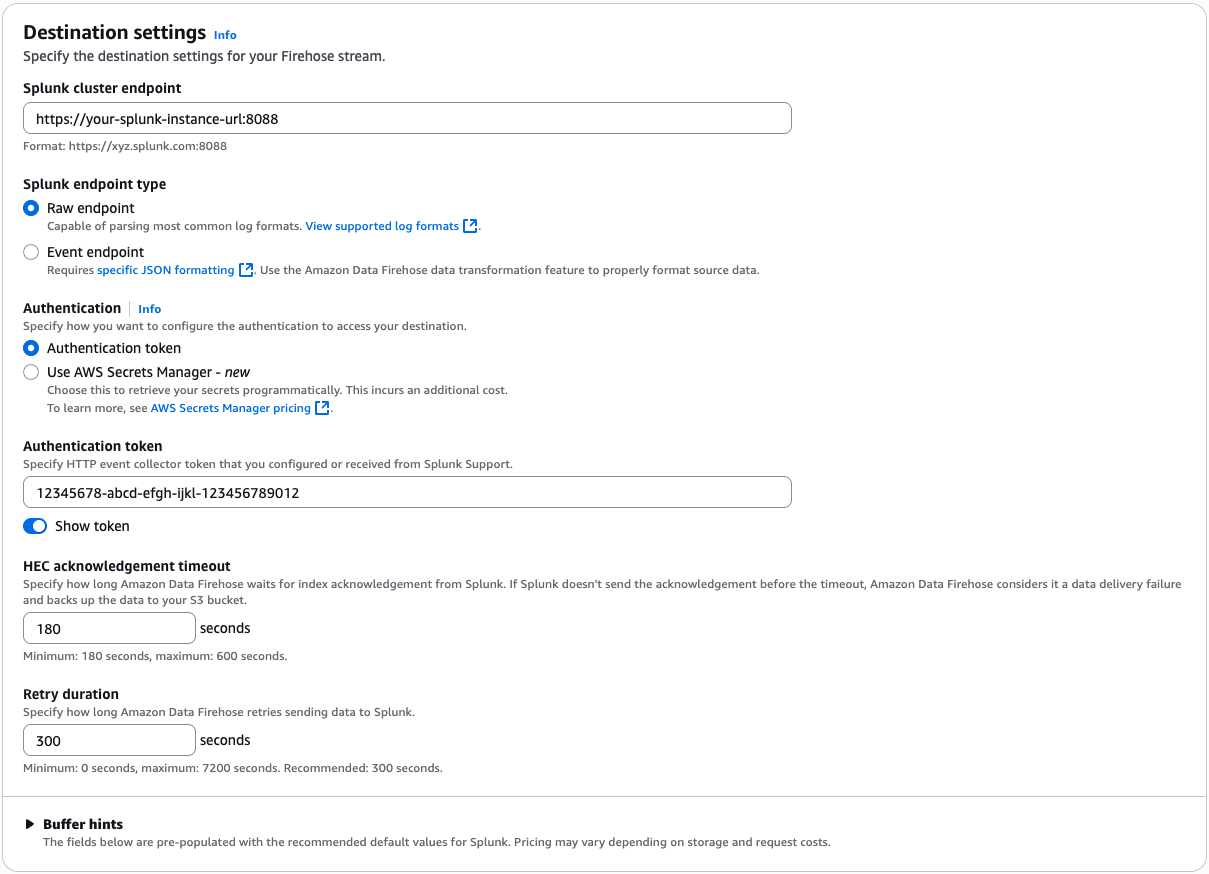
Enter your Splunk HTTP Event Collector (HEC) information in destination settings

Firehose Destination setting

Note: Amazon Data Firehose requires the Splunk HTTP Event Collector (HEC) endpoint to be terminated with a valid CA-signed certificate matching the DNS hostname used to connect to your HEC endpoint. You receive delivery errors if you are using a self-signed certificate.

In this example, we only back up logs that fail during delivery.

Backsplash S3 settings

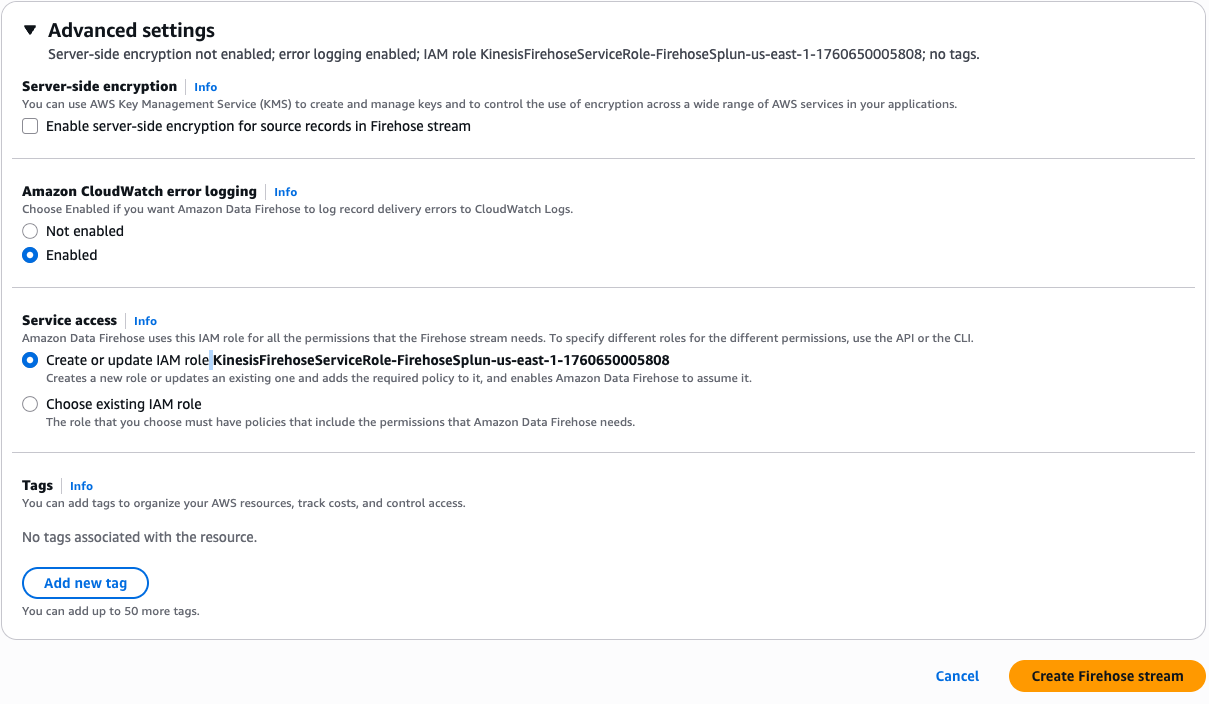
To monitor your Firehose delivery stream, enable error logging. Doing this means that you can monitor record delivery errors. Create an IAM role for the Firehose stream by choosing Create new, or Choose existing IAM role.

Advance settings for cloudwatch loggings

You now get a chance to review and adjust the Firehose stream settings. When you are satisfied, choose Create Firehose Stream.

Create a VPC Flow Log

To send events from Amazon VPC, you need to set up a VPC flow log. If you already have a VPC flow log you want to use, you can skip to the “Publish CloudWatch to Amazon Data Firehose” section.

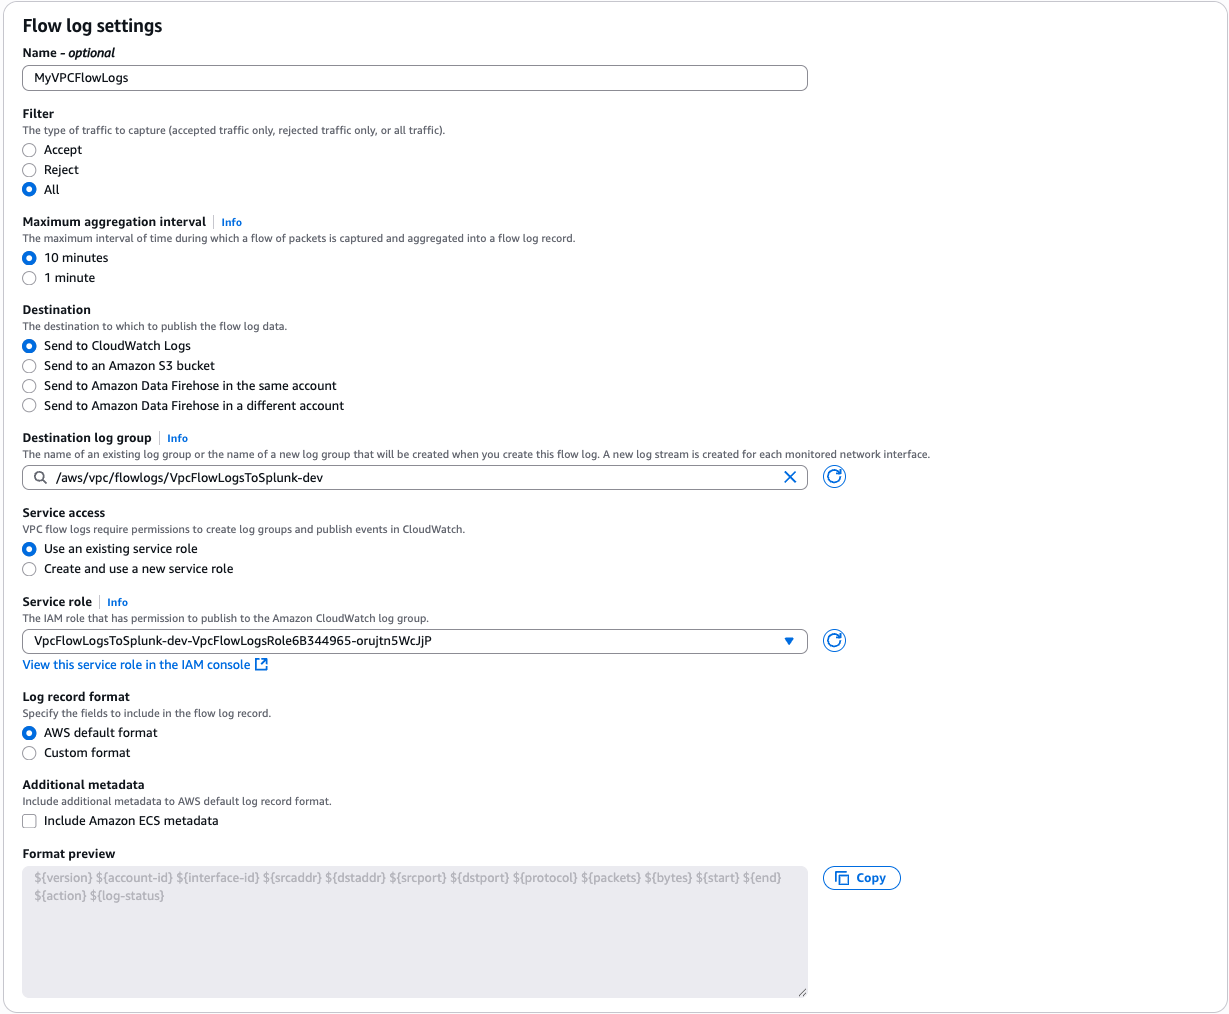
On the AWS console, open the Amazon VPC service. Then choose VPC, and choose the VPC you want to send flow logs from. Choose Flow Logs, and then choose Create Flow Log. If you don’t have an IAM role that allows your VPC to publish logs to CloudWatch, choose Create and use a new service role.

VPC Flow Logs Settings

Once active, your VPC flow log should look like the following.

Flow logs

Publish CloudWatch to Amazon Data Firehose

When you generate traffic to or from your VPC, the log group is created in Amazon CloudWatch. We create an IAM role to allow Cloudwatch to publish logs to the Amazon Data Firehose Stream.

To allow CloudWatch to publish to your Firehose stream, you need to give it permissions.

$ aws iam create-role --role-name CWLtoFirehoseRole --assume-role-policy-document file://TrustPolicyForCWLToFireHose.json


Here is the content for TrustPolicyForCWLToFireHose.json.

{
  "Statement": {
    "Effect": "Allow",
    "Principal": { "Service": "logs.us-east-1.amazonaws.com" },
    "Action": "sts:AssumeRole"
  }
}

Attach the policy to the newly created role.

$ aws iam put-role-policy 
    --role-name CWLtoFirehoseRole 
    --policy-name Permissions-Policy-For-CWL 
    --policy-document file://PermissionPolicyForCWLToFireHose.json

Here is the content for PermissionPolicyForCWLToFireHose.json.

{
    "Statement":[
      {
        "Effect":"Allow",
        "Action":["firehose:*"],
        "Resource":["arn:aws:firehose:us-east-1:YOUR-AWS-ACCT-NUM:deliverystream/FirehoseSplunkDeliveryStream"]
      },
      {
        "Effect":"Allow",
        "Action":["iam:PassRole"],
        "Resource":["arn:aws:iam::YOUR-AWS-ACCT-NUM:role/CWLtoFirehoseRole"]
      }
    ]
}

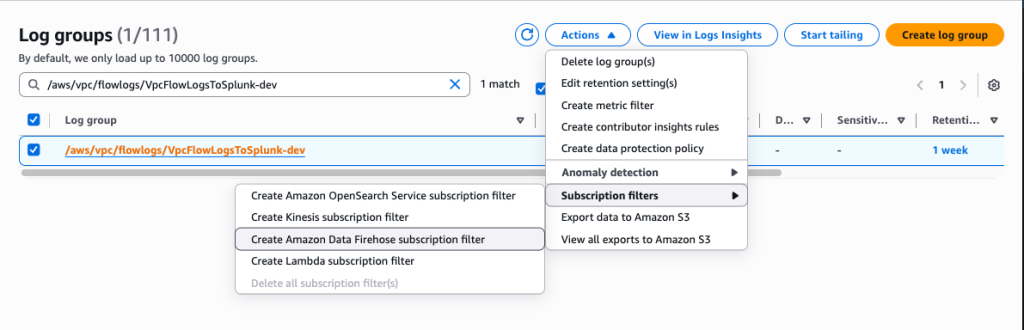
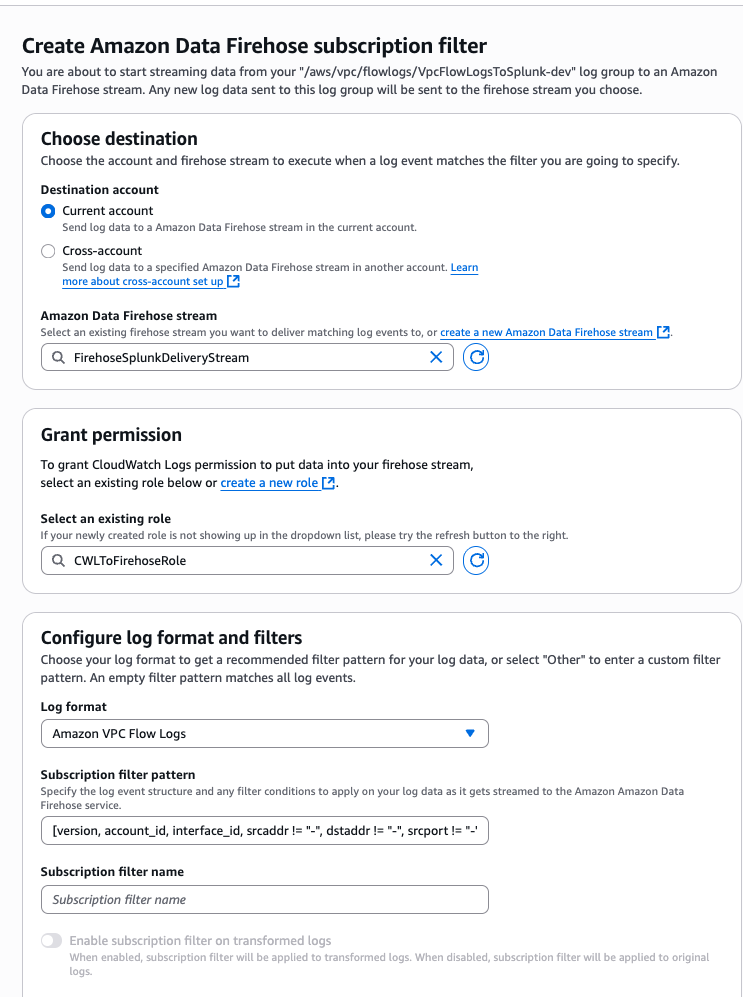
The new log group has no subscription filter, so set up a subscription filter. Setting this up establishes a real-time data feed from the log group to your Firehose delivery stream. Select the VPC flow log and choose Actions. Then choose Subscription filters followed by Create Amazon Data Firehose subscription filter.

Subscription Filter option

Subscription filter details

When you run the AWS CLI command preceding, you don’t get any acknowledgment. To validate that your CloudWatch Log Group is subscribed to your Firehose stream, check the CloudWatch console.

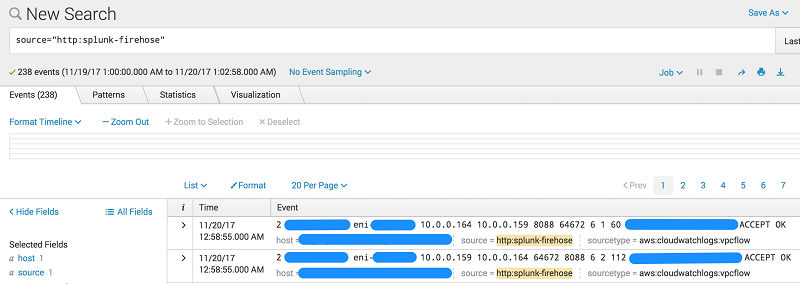
As soon as the subscription filter is created, the real-time log data from the log group goes into your Firehose delivery stream. Your stream then delivers it to your Splunk Enterprise or Splunk Cloud environment for querying and visualization. The screenshot following is from Splunk Enterprise.

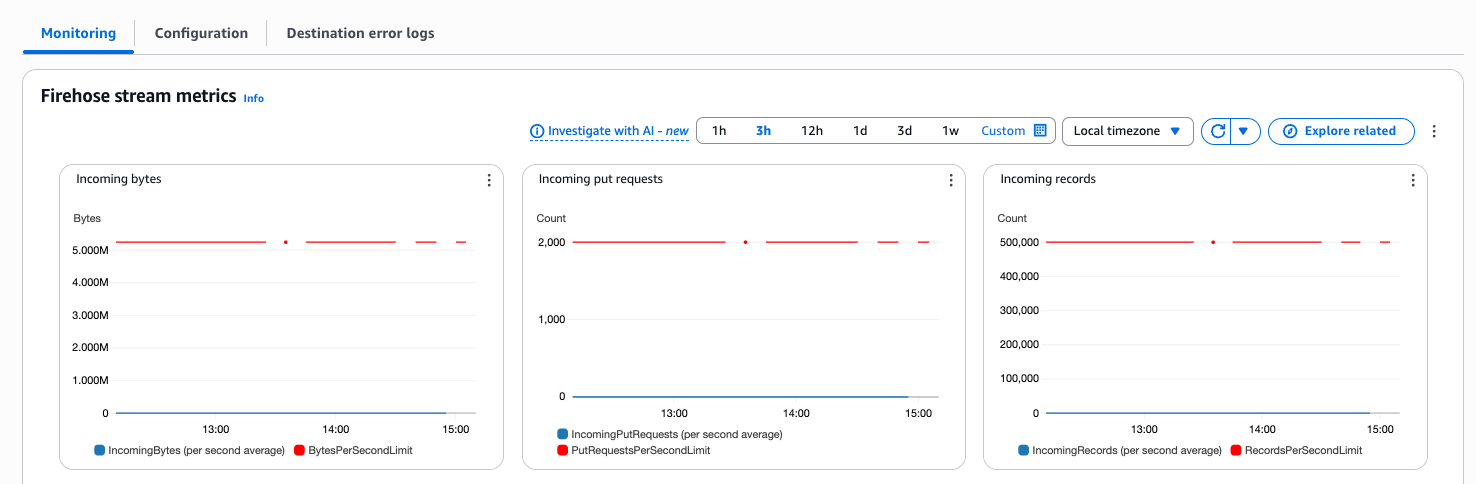
In addition, you can monitor and view metrics associated with your delivery stream using the AWS console.

Conclusion

Although our walkthrough uses VPC Flow Logs, the pattern can be used in many other scenarios. These include ingesting data from AWS IoT, other CloudWatch logs and events, Kinesis Streams or other data sources using the Kinesis Agent or Kinesis Producer Library. You may use a Lambda blueprint or disable record transformation entirely depending on your use case. For an additional use case using Amazon Data Firehose, check out This is My Architecture Video, which discusses how to securely centralize cross-account data analytics using Kinesis and Splunk.

If you found this post useful, be sure to check out Integrating Splunk with Amazon Kinesis Streams.


About the Authors

Tarik Makota

Tarik Makota

Tarik is a solutions architect with the Amazon Web Services Partner Network. He provides technical guidance, design advice and thought leadership to AWS’ most strategic software partners. His career includes work in an extremely broad software development and architecture roles across ERP, financial printing, benefit delivery and administration and financial services. He holds an M.S. in Software Development and Management from Rochester Institute of Technology.

Roy Arsan

Roy Arsan

Roy is a solutions architect in the Splunk Partner Integrations team. He has a background in product development, cloud architecture, and building consumer and enterprise cloud applications. More recently, he has architected Splunk solutions on major cloud providers, including an AWS Quick Start for Splunk that enables AWS users to easily deploy distributed Splunk Enterprise straight from their AWS console. He’s also the co-author of the AWS Lambda blueprints for Splunk. He holds an M.S. in Computer Science Engineering from the University of Michigan.
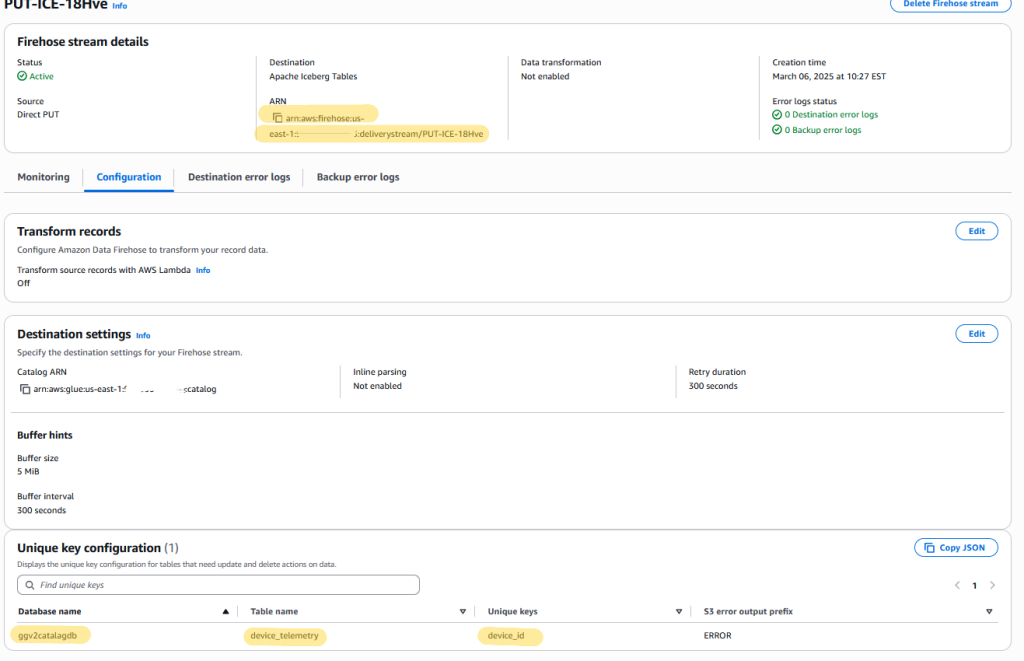


Yashika Jain

Yashika Jain

Yashika is a Senior Cloud Analytics Engineer at AWS, specializing in real-time analytics and event-driven architectures. She is committed to helping customers by providing deep technical guidance, driving best practices across real-time data platforms and solving complex issues related to their streaming data architectures.

Mitali Sheth

Mitali Sheth

Mitali is a Streaming Data Engineer in the AWS Professional Services team, specializing in real-time analytics and event-driven architectures for AWS’ most strategic software customers. More recently, she has focused on data governance with AWS Lake Formation, building reliable data pipelines with AWS Glue, and modernizing streaming infrastructure with Amazon MSK and Amazon Managed Flink for large-scale enterprise deployments. She holds an M.S. in Computer Science from the University of Florida.

Optimize industrial IoT analytics with Amazon Data Firehose and Amazon S3 Tables with Apache Iceberg

Post Syndicated from Ashok Padmanabhan original https://aws.amazon.com/blogs/big-data/optimize-industrial-iot-analytics-with-amazon-data-firehose-and-amazon-s3-tables-with-apache-iceberg/

Manufacturing organizations are racing to digitize their operations through Industry 4.0 initiatives. A key challenge they face is capturing, processing, and analyzing real-time data from industrial equipment to enable data-driven decision making.Modern manufacturing facilities generate massive amounts of real-time data from their production lines. Capturing this valuable data requires a two-tier architecture: first, an edge device that understands industrial protocols collects data directly from the shop floor sensors. Then, these edge gateways securely buffer and transmit the data to AWS Cloud, providing reliability during network interruptions.

In this post, we show how to use AWS service integrations to minimize custom code while providing a robust platform for industrial data ingestion, processing, and analytics. By using Amazon S3 Tables and its built-in optimizations, you can maximize query performance and minimize costs without additional infrastructure setup. Additionally, AWS IoT Greengrass supports VPC endpoints, and you can securely communicate between the edge gateway (hosted on premises) and AWS.

Solution overview

Let’s consider a manufacturing line with and equipment sensors capturing flow rate, temperature, and pressure. To perform analysis on this data, you ingest real-time streaming data from these sensors into the AWS environment using an edge gateway. After data lands in AWS, you can use various analytics services to gain insights.

To demonstrate the data flow from the edge to the cloud, we have assets, machines, and tools publish data using MQTT. Optionally, we use a simulated edge device that publishes data to a local MQTT endpoint. We use an edge gateway with an AWS IoT Greengrass V2 edge runtime to stream data through Amazon Data Firehose in the cloud to S3 Tables.

The following diagram illustrates the solution architecture.

High Level Arch

Fig 1 : High Level Architecture

The workflow consists of the following steps:

  1. Collect data from Internet of Things (IoT) sensors and stream real-time data from edge devices to the AWS Cloud using AWS IoT Greengrass.
  2. Ingest, transform, and land data in near real time using Data Firehose, with the Firehose component on AWS IoT Greengrass, and S3 Tables integration.
  3. Store and organize the tabular data using S3 Tables, which provides purpose-built storage for Apache Iceberg format with a simple, performant, and cost-effective querying solution.
  4. Query and analyze the tabular data using Amazon Athena.

The edge data flow consists of the following key components:

  • IoT device to local MQTT broker – A simulated device used to generate data for the purposes of this post. In a typical production implementation, this would be your equipment or gateway that supports MQTT. IoT devices can publish messages to a local MQTT broker (Moquette) running on AWS IoT Greengrass.
  • MQTT bridge – The MQTT bridge component relays messages between:
    • MQTT broker (where client devices communicate)
    • Local AWS IoT Greengrass publish/subscribe (IPC)
  • Local PubSub (custom) component – This component completes the following tasks:
    • Subscribes to the local IPC messages.
    • Forwards messages to the kinesisfirehose/message topic.
    • Uses the IPC interface to subscribe to messages.
  • Firehose component – The Firehose component subscribes to the kinesisfirehose/message topic. The component then streams the data to Data Firehose in the cloud. It uses QoS 1 for reliable message delivery.

You can scale this solution to multiple edge locations, so you have a seamless view of data across multiple locations of the manufacturing site, as a low-code solution.In the following sections, we walk through the steps to configure the cloud data ingestion flow:

  1. Create an S3 Tables bucket and enable integration with AWS analytics services.
  2. Create a namespace in the table bucket using the AWS Command Line Interface (AWS CLI).
  3. Create a table in the table bucket with the defined schema using the AWS CLI.
  4. Create an AWS Identity and Access Management (IAM) role for Data Firehose with necessary permissions.
  5. Configure AWS Lake Formation permissions:
    • Grant Super permissions on specific tables for the Data Firehose role.
  6. Set up a Data Firehose stream:
    • Choose Direct PUT as the source and Iceberg tables as the destination.
    • Configure the destination settings with database and table names.
    • Specify an Amazon Simple Storage Service (Amazon S3) bucket for error output.
    • Associate the IAM role created earlier.
  7. Verify and query data using Athena:
    • Grant Lake Formation permissions for Athena access.
    • Query the table to verify data ingestion.

Prerequisites

You must have the following prerequisites:

  • An AWS account
  • The required IAM privileges to launch AWS IoT Greengrass on an edge gateway (or another supported device)
  • An Amazon Elastic Compute Cloud (Amazon EC2) instance with a supported operating system to perform a proof of concept

Install AWS IoT Greengrass on the edge gateway

For instructions to install AWS IoT Greengrass, refer to Install the AWS IoT Greengrass Core software. After you complete the installation, you will have a core device provisioned, as shown in the following screenshot. The status of the device says Healthy, which means that your account is able to communicate with the device successfully.

For a proof of concept, you can use an Ubuntu-based EC2 instance as your edge gateway.

Greengrass Core Device

Fig 2: Greengrass Core Device

Provision a Data Firehose stream

For detailed steps on setting up Data Firehose to deliver data to Iceberg tables, refer to Deliver data to Apache Iceberg Tables with Amazon Data Firehose. For S3 Tables integration, refer to Build a data lake for streaming data with Amazon S3 Tables and Amazon Data Firehose.

Because you’re using AWS IoT Greengrass to stream data, you can skip the Kinesis Data Generator steps mentioned in these tutorials. The data will instead flow from your edge devices through the Greengrass components to Data Firehose.After you complete these steps, you will have a Firehose stream and S3 Tables bucket, as shown in the following screenshot. Note the Amazon Resource Name (ARN) of the Firehose stream to use in subsequent steps.

Amazon Data Firehose Stream

Fig 3: Amazon Data Firehose Stream

Deploy the Greengrass components

Complete the following steps to configure and deploy the Greengrass components. For more details, refer to Create deployments.

  1. Use the following configuration to enable message routing from local MQTT to the AWS IoT Greengrass PubSub component. Note the topic in the code. This is the MQTT topic where the devices will send the data to.
{
  "reset": [""],
  "merge": {
    "mqttTopicMapping": {
      "HelloWorldIotCoreMapping": {
        "topic": "clients/#",
        "source": "LocalMqtt",
        "target": "Pubsub"
      }
    }
  }
}
  1. Use the following configuration to deploy the Firehose component. Use the Firehose stream ARN that you noted earlier.
{
"reset": [""],
"merge": {
   "lambdaExecutionParameters": {
     "EnvironmentVariables": {
       "DEFAULT_DELIVERY_STREAM_ARN": "arn:aws:firehose:us-east-1:<<account-id>>:deliverystream/<<stream name>>"
         }
     },
   "containerMode": "NoContainer"
      }
}
  1. Use the following configuration to deploy the legacy subscription router component (Note that this is a dependent component to the Firehose component):
{
"reset": [""],
"merge": {
   "subscriptions": {
      "aws-greengrass-kinesisfirehose": {
          "id": "aws-greengrass-kinesisfirehose",
          "source": "component:aws.greengrass.KinesisFirehose",
          "subject": "kinesisfirehose/message/status",
         "target": "cloud"
                  }
           }
         }
}
  1. Create and deploy a custom PubSub component. You can use the following sample code snippet in your preferred language to deploy as a Greengrass component. You can use gdk to create custom components.
{
"reset": [""],
"merge": {
   "subscriptions": {
      "aws-greengrass-kinesisfirehose": {
         "id": "aws-greengrass-kinesisfirehose",
        "source": "component:aws.greengrass.KinesisFirehose",
        "subject": "kinesisfirehose/message/status",
          "target": "cloud"
        }
        }
    }
       }

After you deploy the components, you will see them on the Components tab of your core device.

Greengrass Components

Fig 4: AWS IoT Greengrass components

Ingest data

In this step, you ingest the data from your device to AWS IoT Greengrass, which will subsequently land in Data Firehose. Complete the following steps:

  1. From your edge device that is MQTT aware, or your edge gateway, publish the data to the topic defined earlier ( client/#). For example, we publish the data to the client/devices/telemetry MQTT topic.
  2. If you want to do this as a proof of concept, refer to Create a virtual device with Amazon EC2 to create a sample IoT device.

The following code is a sample payload for our example:

PAYLOAD="{
\"device_id\": \"$DEVICE_ID\",
\"timestamp\": \"$TIMESTAMP\",
\"temperature\": $TEMPERATURE,
\"pressure\": $PRESSURE,
\"flow_rate\": $FLOW_RATE,
\"vibration\": $VIBRATION,
\"motor_speed\": $MOTOR_SPEED,
\"status\": \"$STATUS\",
\"battery\": $((RANDOM % 30 + 70 )),
}"

For additional details on how to publish messages from a sample device, refer to Just-in-time provisioning.

The MQTT bridge component will route the payload from the MQTT topic (client/devices/telemetry) to an IPC topic by the same name. The custom component that you deployed earlier will listen to the IPC topic client/devices/telemetry and publish to the IPC topic kinesisfirehose/message. The message must follow the structure described in Input data.

Validate the data in Athena

You can now query the data published from the edge IoT device using Athena. On the Athena console, find the catalog and database that you set up, and run the following query:SELECT * FROM <<database>>."device_telemetry" limit 10;You should see the data displayed as shown in the following screenshot. Note the database and table name that you had defined as part of the “Provision a Data Firehose” stream step.

Validate Data in Athena

Fig 5: Validate Data in Athena

Scale out the solution

In the preceding sections, we showed how multiple equipments can ingest data into the cloud using a single Greengrass edge gateway device. Because manufacturing locations are distributed in a real-world scenario, you might set up Greengrass devices at other sites and publish the data to the same Firehose stream. This makes sure the data from different sites is landed into a single S3 bucket, is partitioned appropriately (Device_Id in our example), and can be queried seamlessly.

Clean up

After you validate the results, you can delete the following resources to avoid incurring additional costs:

  1. Delete the EC2 Ubuntu instance you created for your proof of concept.
  2. Delete the Firehose delivery stream and associated resources.
  3. Drop the Athena tables created for querying the data.
  4. Delete the S3 Tables bucket you provisioned.

Conclusion

In this post, we showed how to set up a scalable edge-to-cloud near real-time data ingestion framework using AWS IoT Greengrass and start performing analytics on the data within AWS services using a low-code approach. We demonstrated how to optimize the data storage into Iceberg format with S3 Tables, and transform the streaming data before it lands on the storage layer using Data Firehose. We also discussed how you can scale this solution horizontally across multiple manufacturing locations (plants or sites) to create a low-code solution to analyze data in near real time.

To learn more, refer to the following resources:


About the authors

Joyson Neville Lewis is a Sr. Conversational AI Architect with AWS Professional Services. Joyson worked as a Software/Data engineer before diving into the Conversational AI and Industrial IoT space. He assists AWS customers to materialize their AI visions using Voice Assistant/Chatbot and IoT solutions.

Anil Vure is a Sr. IoT Data Architect with AWS Professional services. Anil has extensive experience building large-scale data platforms and works with manufacturing customers designing high-speed data ingestion systems.

Ashok Padmanabhan is a Sr. IoT Data Architect with AWS Professional Services. Ashok primarily works with manufacturing and automotive customers to design and build Industry 4.0 solutions.

Overcome your Kafka Connect challenges with Amazon Data Firehose

Post Syndicated from Swapna Bandla original https://aws.amazon.com/blogs/big-data/overcome-your-kafka-connect-challenges-with-amazon-data-firehose/

Apache Kafka is a popular open source distributed streaming platform that is widely used in the AWS ecosystem. It’s designed to handle real-time, high-throughput data streams, making it well-suited for building real-time data pipelines to meet the streaming needs of modern cloud-based applications.

For AWS customers looking to run Apache Kafka, but don’t want to worry about the undifferentiated heavy lifting involved with self-managing their Kafka clusters, Amazon Managed Streaming for Apache Kafka (Amazon MSK) offers fully managed Apache Kafka. This means Amazon MSK provisions your servers, configures your Kafka clusters, replaces servers when they fail, orchestrates server patches and upgrades, makes sure clusters are architected for high availability, makes sure data is durably stored and secured, sets up monitoring and alarms, and runs scaling to support load changes. With a managed service, you can spend your time developing and running streaming event applications.

For applications to use data sent to Kafka, you need to write, deploy, and manage application code that consumes data from Kafka.

Kafka Connect is an open-source component of the Kafka project that provides a framework for connecting with external systems such as databases, key-value stores, search indexes, and file systems from your Kafka clusters. On AWS, our customers commonly write and manage connectors using the Kafka Connect framework to move data out of their Kafka clusters into persistent storage, like Amazon Simple Storage Service (Amazon S3), for long-term storage and historical analysis.

At scale, customers need to programmatically manage their Kafka Connect infrastructure for consistent deployments when updates are required, as well as the code for error handling, retries, compression, or data transformation as it is delivered from your Kafka cluster. However, this introduces a need for investment into the software development lifecycle (SDLC) of this management software. Although the SDLC is a cost-effective and time-efficient process to help development teams build high-quality software, for many customers, this process is not desirable for their data delivery use case, particularly when they could dedicate more resources towards innovating for other key business differentiators. Beyond SDLC challenges, many customers face fluctuating data streaming throughput. For instance:

  • Online gaming businesses experience throughput variations based on game usage
  • Video streaming applications see changes in throughput depending on viewership
  • Traditional businesses have throughput fluctuations tied to consumer activity

Striking the right balance between resources and workload can be challenging. Under-provisioning can lead to consumer lag, processing delays, and potential data loss during peak loads, hampering real-time data flows and business operations. On the other hand, over-provisioning results in underutilized resources and unnecessary high costs, making the setup economically inefficient for customers. Even the action of scaling up your infrastructure introduces additional delays because resources need to be provisioned and acquired for your Kafka Connect cluster.

Even when you can estimate aggregated throughput, predicting throughput per individual stream remains difficult. As a result, to achieve smooth operations, you might resort to over-provisioning your Kafka Connect resources (CPU) for your streams. This approach, though functional, might not be the most efficient or cost-effective solution.

Customers have been asking for a fully serverless solution that will not only handle managing resource allocation, but transition the cost model to only pay for the data they are delivering from the Kafka topic, instead of underlying resources that require constant monitoring and management.

In September 2023, we announced a new integration between Amazon and Amazon Data Firehose, allowing builders to deliver data from their MSK topics to their destination sinks with a fully managed, serverless solution. With this new integration, you no longer needed to develop and manage your own code to read, transform, and write your data to your sink using Kafka Connect. Data Firehose abstracts away the retry logic required when reading data from your MSK cluster and delivering it to the desired sink, as well as infrastructure provisioning, because it can scale out and scale in automatically to adjust to the volume of data to transfer. There are no provisioning or maintenance operations required on your side.

At release, the checkpoint time to start consuming data from the MSK topic was the creation time of the Firehose stream. Data Firehose couldn’t start reading from other points on the data stream. This caused challenges for several different use cases.

For customers that are setting up a mechanism to sink data from their cluster for the first time, all data in the topic older than the timestamp of Firehose stream creation would need another way to be persisted. For example, customers using Kafka Connect connectors, like These users were limited in using Data Firehose because they wanted to sink all the data from the topic to their sink, but Data Firehose couldn’t read data from earlier than the timestamp of Firehose stream creation.

For other customers that were running Kafka Connect and needed to migrate from their Kafka Connect infrastructure to Data Firehose, this required some extra coordination. The release functionality of Data Firehose means you can’t point your Firehose stream to a specific point on the source topic, so a migration requires stopping data ingest to the source MSK topic and waiting for Kafka Connect to sink all the data to the destination. Then you can create the Firehose stream and restart the producers such that the Firehose stream can then consume new messages from the topic. This adds additional, and non-trivial, overhead to the migration effort when attempting to cut over from an existing Kafka Connect infrastructure to a new Firehose stream.

To address these challenges, we’re happy to announce a new feature in the Data Firehose integration with Amazon MSK. You can now specify the Firehose stream to either read from the earliest position on the Kafka topic or from a custom timestamp to begin reading from your MSK topic.

In the first post of this series, we focused on managed data delivery from Kafka to your data lake. In this post, we extend the solution to choose a custom timestamp for your MSK topic to be synced to Amazon S3.

Overview of Data Firehose integration with Amazon MSK

Data Firehose integrates with Amazon MSK to offer a fully managed solution that simplifies the processing and delivery of streaming data from Kafka clusters into data lakes stored on Amazon S3. With just a few clicks, you can continuously load data from your desired Kafka clusters to an S3 bucket in the same account, eliminating the need to develop or run your own connector applications. The following are some of the key benefits to this approach:

  • Fully managed service – Data Firehose is a fully managed service that handles the provisioning, scaling, and operational tasks, allowing you to focus on configuring the data delivery pipeline.
  • Simplified configuration – With Data Firehose, you can set up the data delivery pipeline from Amazon MSK to your sink with just a few clicks on the AWS Management Console.
  • Automatic scaling – Data Firehose automatically scales to match the throughput of your Amazon MSK data, without the need for ongoing administration.
  • Data transformation and optimization – Data Firehose offers features like JSON to Parquet/ORC conversion and batch aggregation to optimize the delivered file size, simplifying data analytical processing workflows.
  • Error handling and retries – Data Firehose automatically retries data delivery in case of failures, with configurable retry durations and backup options.
  • Offset select option – With Data Firehose, you can select the starting position for the MSK delivery stream to be delivered within a topic from three options:
    • Firehose stream creation time – This allows you to deliver data starting from Firehose stream creation time. When migrating from to Data Firehose, if you have an option to pause the producer, you can consider this option.
    • Earliest – This allows you to deliver data starting from MSK topic creation time. You can choose this option if you’re setting a new delivery pipeline with Data Firehose from Amazon MSK to Amazon S3.
    • At timestamp – This option allows you to provide a specific start date and time in the topic from where you want the Firehose stream to read data. The time is in your local time zone. You can choose this option if you prefer not to stop your producer applications while migrating from Kafka Connect to Data Firehose. You can refer to the Python script and steps provided later in this post to derive the timestamp for the latest events in your topic that were consumed by Kafka Connect.

The following are benefits of the new timestamp selection feature with Data Firehose:

  • You can select the starting position of the MSK topic, not just from the point that the Firehose stream is created, but from any point from the earliest timestamp of the topic.
  • You can replay the MSK stream delivery if required, for example in the case of testing scenarios to select from different timestamps with the option to select from a specific timestamp.
  • When migrating from Kafka Connect to Data Firehose, gaps or duplicates can be managed by selecting the starting timestamp for Data Firehose delivery from the point where Kafka Connect delivery ended. Because the new custom timestamp feature isn’t monitoring Kafka consumer offsets per partition, the timestamp you select for your Kafka topic should be a few minutes before the timestamp at which you stopped Kafka Connect. The earlier the timestamp you select, the more duplicate records you will have downstream. The closer the timestamp to the time of Kafka Connect stopping, the higher the likelihood of data loss if certain partitions have fallen behind. Be sure to select a timestamp appropriate to your requirements.

Overview of solution

We discuss two scenarios to stream data.

In Scenario 1, we migrate to Data Firehose from Kafka Connect with the following steps:

  1. Derive the latest timestamp from MSK events that Kafka Connect delivered to Amazon S3.
  2. Create a Firehose delivery stream with Amazon MSK as the source and Amazon S3 as the destination with the topic starting position as Earliest.
  3. Query Amazon S3 to validate the data loaded.

In Scenario 2, we create a new data pipeline from Amazon MSK to Amazon S3 with Data Firehose:

  1. Create a Firehose delivery stream with Amazon MSK as the source and Amazon S3 as the destination with the topic starting position as At timestamp.
  2. Query Amazon S3 to validate the data loaded.

The solution architecture is depicted in the following diagram.

Prerequisites

You should have the following prerequisites:

  • An AWS account and access to the following AWS services:
  • An MSK provisioned or MSK serverless cluster with topics created and data streaming to it. The sample topic used in this is order.
  • An EC2 instance configured to use as a Kafka admin client. Refer to Create an IAM role for instructions to create the client machine and IAM role that you will need to run commands against your MSK cluster.
  • An S3 bucket for delivering data from Amazon MSK using Data Firehose.
  • Kafka Connect to deliver data from Amazon MSK to Amazon S3 if you want to migrate from Kafka Connect (Scenario 1).

Migrate to Data Firehose from Kafka Connect

To reduce duplicates and minimize data loss, you need to configure your custom timestamp for Data Firehose to read events as close to the timestamp of the oldest committed offset that Kafka Connect reported. You can follow the steps in this section to visualize how the timestamps of each committed offset will vary by partition across the topic you want to read from. This is for demonstration purposes and doesn’t scale as a solution for workloads with a large number of partitions.

Sample data was generated for demonstration purposes by following the instructions referenced in the following GitHub repo. We set up a sample producer application that generates clickstream events to simulate users browsing and performing actions on an imaginary ecommerce website.

To derive the latest timestamp from MSK events that Kafka Connect delivered to Amazon S3, complete the following steps:

  1. From your Kafka client, query Amazon MSK to retrieve the Kafka Connect consumer group ID:
    ./kafka-consumer-groups.sh --bootstrap-server $bs --list --command-config client.properties

  2. Stop Kafka Connect.
  3. Query Amazon MSK for the latest offset and associated timestamp for the consumer group belonging to Kafka Connect.

You can use the get_latest_offsets.py Python script from the following GitHub repo as a reference to get the timestamp associated with the latest offsets for your Kafka Connect consumer group. To enable authentication and authorization for a non-Java client with an IAM authenticated MSK cluster, refer to the following GitHub repo for instructions on installing the aws-msk-iam-sasl-signer-python package for your client.

python3 get_latest_offsets.py --broker-list $bs --topic-name “order” --consumer-group-id “connect-msk-serverless-connector-090224” --aws-region “eu-west-1”

Note the earliest timestamp across all the partitions.

Create a data pipeline from Amazon MSK to Amazon S3 with Data Firehose

The steps in this section are applicable to both scenarios. Complete the following steps to create your data pipeline:

  1. On the Data Firehose console, choose Firehose streams in the navigation pane.
  2. Choose Create Firehose stream.
  3. For Source, choose Amazon MSK.
  4. For Destination, choose Amazon S3.
  5. For Source settings, browse to the MSK cluster and enter the topic name you created as part of the prerequisites.
  6. Configure the Firehose stream starting position based on your scenario:
    1. For Scenario 1, set Topic starting position as At Timestamp and enter the timestamp you noted in the previous section.
    2. For Scenario 2, set Topic starting position as Earliest.
  7. For Firehose stream name, leave the default generated name or enter a name of your preference.
  8. For Destination settings, browse to the S3 bucket created as part of the prerequisites to stream data.

Within this S3 bucket, by default, a folder structure with YYYY/MM/dd/HH will be automatically created. Data will be delivered to subfolders pertaining to the HH subfolder according to the Data Firehose to Amazon S3 ingestion timestamp.

  1. Under Advanced settings, you can choose to create the default IAM role for all the permissions that Data Firehose needs or choose existing an IAM role that has the policies that Data Firehose needs.
  2. Choose Create Firehose stream.

On the Amazon S3 console, you can verify the data streamed to the S3 folder according to your chosen offset settings.

Clean up

To avoid incurring future charges, delete the resources you created as part of this exercise if you’re not planning to use them further.

Conclusion

Data Firehose provides a straightforward way to deliver data from Amazon MSK to Amazon S3, enabling you to save costs and reduce latency to seconds. To try Data Firehose with Amazon S3, refer to the Delivery to Amazon S3 using Amazon Data Firehose lab.


About the Authors

Swapna Bandla is a Senior Solutions Architect in the AWS Analytics Specialist SA Team. Swapna has a passion towards understanding customers data and analytics needs and empowering them to develop cloud-based well-architected solutions. Outside of work, she enjoys spending time with her family.

Austin Groeneveld is a Streaming Specialist Solutions Architect at Amazon Web Services (AWS), based in the San Francisco Bay Area. In this role, Austin is passionate about helping customers accelerate insights from their data using the AWS platform. He is particularly fascinated by the growing role that data streaming plays in driving innovation in the data analytics space. Outside of his work at AWS, Austin enjoys watching and playing soccer, traveling, and spending quality time with his family.

Stream data from Amazon MSK to Apache Iceberg tables in Amazon S3 and Amazon S3 Tables using Amazon Data Firehose

Post Syndicated from Pratik Patel original https://aws.amazon.com/blogs/big-data/stream-data-from-amazon-msk-to-apache-iceberg-tables-in-amazon-s3-and-amazon-s3-tables-using-amazon-data-firehose/

In today’s data-driven/fast-paced landscape/environment real-time streaming analytics has become critical for business success. From detecting fraudulent transactions in financial services to monitoring Internet of Things (IoT) sensor data in manufacturing, or tracking user behavior in ecommerce platforms, streaming analytics enables organizations to make split-second decisions and respond to opportunities and threats as they emerge.

Increasingly, organizations are adopting Apache Iceberg, an open source table format that simplifies data processing on large datasets stored in data lakes. Iceberg brings SQL-like familiarity to big data, offering capabilities such as ACID transactions, row-level operations, partition evolution, data versioning, incremental processing, and advanced query scanning. It seamlessly integrates with popular open source big data processing frameworks Apache Spark, Apache Hive, Apache Flink, Presto, and Trino. Amazon Simple Storage Service (Amazon S3) supports Iceberg tables both directly using the Iceberg table format and in Amazon S3 Tables.

Although Amazon Managed Streaming for Apache Kafka (Amazon MSK) provides robust, scalable streaming capabilities for real-time data needs, many customers need to efficiently and seamlessly deliver their streaming data from Amazon MSK to Iceberg tables in Amazon S3 and S3 Tables. This is where Amazon Data Firehose (Firehose) comes in. With its built-in support for Iceberg tables in Amazon S3 and S3 Tables, Firehose makes it possible to seamlessly deliver streaming data from provisioned MSK clusters to Iceberg tables in Amazon S3 and S3 Tables.

As a fully managed extract, transform, and load (ETL) service, Firehose reads data from your Apache Kafka topics, transforms the records, and writes them directly to Iceberg tables in your data lake in Amazon S3. This new capability requires no code or infrastructure management on your part, allowing for continuous, efficient data loading from Amazon MSK to Iceberg in Amazon S3.In this post, we walk through two solutions that demonstrate how to stream data from your Amazon MSK provisioned cluster to Iceberg-based data lakes in Amazon S3 using Firehose.

Solution 1 overview: Amazon MSK to Iceberg tables in Amazon S3

The following diagram illustrates the high-level architecture to deliver streaming messages from Amazon MSK to Iceberg tables in Amazon S3.

bdb-4769-image-1

Prerequisites

To follow the tutorial in this post, you need the following prerequisites:

Verify permission

Before configuring the Firehose delivery stream, you must verify the destination table available in the Data Catalog.

  1. On the AWS Glue console, go to Glue Data Catalog and verify the Iceberg table is available with the required attributes.

bdb-4769-image-2

  1. Verify your Amazon MSK provisioned cluster is up and running with IAM authentication, and multi-VPC connectivity is enabled for it.

bdb-4769-image-3

  1. Grant Firehose access to your private MSK cluster:
    1. On the Amazon MSK console, go to the cluster and choose Properties and Security settings.
    2. Edit the cluster policy and define a policy similar to the following example:
{
  "Version": "2012-10-17",
  "Statement": [
    {
      "Principal": {
        "Service": [
          "firehose.amazonaws.com"
        ]
    },
    "Effect": "Allow",
    "Action": [
      "kafka:CreateVpcConnection"
    ],
    "Resource": "<Amazon MSK cluster-arn>"
    }
  ]
}

This ensures Firehose has the necessary permissions on the source Amazon MSK provisioned cluster.

Create a Firehose role

This section describes the permissions that grant Firehose access to ingest, process, and deliver data from source to destination. You must specify an IAM role that grants Firehose permissions to ingest source data from the specified Amazon MSK provisioned cluster. Make sure that the following trust policies are attached to that role so that Firehose can assume it:

{
  "Version": "2012-10-17",
  "Statement": [
    {
      "Principal": {
        "Service": [
          "firehose.amazonaws.com"
        ]
      },
      "Effect": "Allow",
      "Action": "sts:AssumeRole"
    }
  ]
}

Make sure that this role grants Firehose the following permissions to ingest source data from the specified Amazon MSK provisioned cluster:

{
   "Version": "2012-10-17",      
   "Statement": [{
        "Effect":"Allow",
        "Action": [
           "kafka:GetBootstrapBrokers",
           "kafka:DescribeCluster",
           "kafka:DescribeClusterV2",
           "kafka-cluster:Connect"
         ],
         "Resource": "<CLUSTER-ARN>"
       },
       {
         "Effect":"Allow",
         "Action": [
           "kafka-cluster:DescribeTopic",
           "kafka-cluster:DescribeTopicDynamicConfiguration",
           "kafka-cluster:ReadData"
         ],
         "Resource": "<TOPIC-ARN>"
       }]
}

Make sure the Firehose role has permissions to the Glue Data Catalog and S3 bucket:

{
    "Version": "2012-10-17",  
    "Statement":
    [    
        {      
            "Effect": "Allow",      
            "Action": [
                "glue:GetTable",
                "glue:GetDatabase",
                "glue:UpdateTable"
            ],      
            "Resource": [   
                "arn:aws:glue:<region>:<aws-account-id>:catalog",
                "arn:aws:glue:<region>:<aws-account-id>:database/*",
                "arn:aws:glue:<region>:<aws-account-id>:table/*/*"             
            ]    
        },        
        {      
            "Effect": "Allow",      
            "Action": [
                "s3:AbortMultipartUpload",
                "s3:GetBucketLocation",
                "s3:GetObject",
                "s3:ListBucket",
                "s3:ListBucketMultipartUploads",
                "s3:PutObject",
                "s3:DeleteObject"
            ],      
            "Resource": [   
                "arn:aws:s3:::<S3 bucket name>",
                "arn:aws:s3:::<S3 bucket name>/*"              
            ]    
        } 
    ]
}    

For detailed policies, refer to the following resources:

Now you have verified that your source MSK cluster and destination Iceberg table are available, you’re ready to set up Firehose to deliver streaming data to the Iceberg tables in Amazon S3.

Create a Firehose stream

Complete the following steps to create a Firehose stream:

  1. On the Firehose console, choose Create Firehose stream.
  2. Choose Amazon MSK for Source and Apache Iceberg Tables for Destination.

bdb-4769-image-4

  1. Provide a Firehose stream name and specify the cluster configurations.

bdb-4769-image-5

  1. You can choose an MSK cluster in the current account or another account.
  2. To choose the cluster, it must be in active state with IAM as one of its access control methods and multi-VPC connectivity should be enabled.

bdb-4769-image-6

  1. Provide the MSK topic name from which Firehose will read the data.

bdb-4769-image-7

  1. Enter the Firehose stream name.

bdb-4769-image-8

  1. Enter the destination settings where you can opt to send data in the current account or across accounts.
  2. Select the account location as Current account, choose an appropriate AWS Region, and for Catalog, choose the current account ID.

bdb-4769-image-9

To route streaming data to different Iceberg tables and perform operations such as insert, update, and delete, you can use Firehose JQ expressions. You can find the required information here.

  1. Provide the unique key configuration, which makes it possible to perform update and delete actions on your data.

bdb-4769-image-10

  1. Go to Buffer hints and configure Buffer size to 1 MiB and Buffer interval to 60 seconds. You can tune these settings according to your use case needs.
  2. Configure your backup settings by providing an S3 backup bucket.

With Firehose, you can configure backup settings by specifying an S3 backup bucket with custom prefixes like error, so failed records are automatically preserved and accessible for troubleshooting and reprocessing.

bdb-4769-image-11

  1. Under Advanced settings, enable Amazon CloudWatch error logging.

bdb-4769-image-12

  1. Under Service access, choose the IAM role you created earlier for Firehose.
  2. Verify your configurations and choose Create Firehose stream.

bdb-4769-image-14

The Firehose stream will be available and it will stream data from the MSK topic to the Iceberg table in Amazon S3.

bdb-4769-image-15

You can query the table with Amazon Athena to validate the streaming data.

  1. On the Athena console, open the query editor.
  2. Choose the Iceberg table and run a table preview.

You will be able to access the streaming data in the table.

bdb-4769-image-16

Solution 2 overview: Amazon MSK to S3 Tables

S3 Tables is built on Iceberg’s open table format, providing table-like capabilities directly to Amazon S3. You can organize and query data using familiar table semantics while using Iceberg’s features for schema evolution, partition evolution, and time travel capabilities. The feature performs ACID-compliant transactions and supports INSERT, UPDATE, and DELETE operations in Amazon S3 data, making data lake management more efficient and reliable.

You can use Firehose to deliver streaming data from an Amazon MSK provisioned cluster to Iceberg tables in Amazon S3. You can create an S3 table bucket using the Amazon S3 console, and it registers the bucket to AWS Lake Formation, which helps you manage fine-grained access control for your Iceberg-based data lake on S3 Tables. The following diagram illustrates the solution architecture.

Prerequisites

You should have the following prerequisites:

  • An AWS account
  • An active Amazon MSK provisioned cluster with IAM access control authentication enabled and multi-VPC connectivity
  • The Firehose role mentioned earlier with the additional IAM policy:
{
    "Version": "2012-10-17",
    "Statement": [
        {
            "Sid": "Statement1",
            "Effect": "Allow",
            "Action": [
                "lakeformation:GetDataAccess"
            ],
            "Resource": [
                "*"
            ]
        }
    ]
}

Further, in your Firehose role, add s3tablescatalog as a resource to provide access to S3 Table as shown below.

Create an S3 table bucket

To create an S3 table bucket on the Amazon S3 console, refer to Creating a table bucket.

When you create your first table bucket with the Enable integration option, Amazon S3 attempts to automatically integrate your table bucket with AWS analytics services. This integration makes it possible to use AWS analytics services to query all tables in the current Region. This is an important step for the further set up. If this integration is already in place, you can use the AWS Command Line Interface (AWS CLI) as follows:

aws s3tables create-table-bucket --region <region id> --name <bucket name>

bdb-4769-image-18

Create a namespace

An S3 table namespace is a logical construct within an S3 table bucket. Each table belongs to a single namespace. Before creating a table, you must create a namespace to group tables under. You can create a namespace by using the Amazon S3 REST API, AWS SDK, AWS CLI, or integrated query engines.

You can use the following AWS CLI to create a table namespace:

aws s3tables create-namespace --table-bucket-arn arn:aws:s3tables:us-east-1:111122223333:bucket/amzn-s3-demo-bucket --namespace example_namespace

Create a table

An S3 table is a sub-resource of a table bucket. This resource stores S3 tables in Iceberg format so you can work with them using query engines and other applications that support Iceberg. You can create a table with the following AWS CLI command:

aws s3tables create-table --cli-input-json file://mytabledefinition.json

The following code is for mytabledefinition.json:

{
    "tableBucketARN": "arn:aws:s3tables:us-east-1:111122223333:bucket/amzn-s3-demo-table-bucket",
    "namespace": "example_namespace ",
    "name": "example_table",
    "format": "ICEBERG",
    "metadata": {
        "iceberg": {
            "schema": {
                "fields": [
                     {"name": "id", "type": "int", "required": true},
                     {"name": "name", "type": "string"},
                     {"name": "value", "type": "int"}
                ]
            }
        }
    }
}

Now you have the required table with the relevant attributes available in Lake Formation.

Grant Lake Formation permissions on your table resources

After integration, Lake Formation manages access to your table resources. It uses its own permissions model (Lake Formation permissions) that enables fine-grained access control for Glue Data Catalog resources. To allow Firehose to write data to S3 Tables, you can grant a principal Lake Formation permission on a table in the S3 table bucket, either through the Lake Formation console or AWS CLI. Complete the following steps:

  1. Make sure you’re running AWS CLI commands as a data lake administrator. For more information, see Create a data lake administrator.
  2. Run the following command to grant Lake Formation permissions on the table in the S3 table bucket to an IAM principal (Firehose role) to access the table:
aws lakeformation grant-permissions \
--region <region e.g. us-east-1> \
--cli-input-json \
'{
    "Principal": {
        "DataLakePrincipalIdentifier": "<Amazon Data Firehose role ARN e.g. arn:aws:iam::<accound-id>:role/ExampleRole>"
    },
    "Resource": {
        "Table": {
            "CatalogId": "<account-id>:<s3tablescatalog>/<S3 table bucket name>",
            "DatabaseName": "<S3 table bucket namespace e.g. test_namespace>",
            "Name": "<S3 table bucket table name e.g. test_table>"
        }
    },
    "Permissions": [
        "ALL"
    ]
}'

Set up a Firehose stream to S3 Tables

To set up a Firehose stream to S3 Tables using the Firehose console, complete the following steps:

  1. On the Firehose console, choose Create Firehose stream.
  2. For Source, choose Amazon MSK.
  3. For Destination, choose Apache Iceberg Tables.
  4. Enter a Firehose stream name.
  5. Configure your source settings.
  6. For Destination settings, select Current Account, choose your Region, and enter the name of the table bucket you want to stream in.
  7. Configure the database and table names using Unique Key configuration settings, JSONQuery expressions, or in an AWS Lambda function.

For more information, refer to Route incoming records to a single Iceberg table and Route incoming records to different Iceberg tables.

  1. Under Backup settings, specify a S3 backup bucket.
  2. For Existing IAM roles under Advanced settings, choose the IAM role you created for Firehose.
  3. Choose Create Firehose stream.

The Firehose stream will be available and it will stream data from the Amazon MSK topic to the Iceberg table. You can verify it by querying the Iceberg table using an Athena query.

bdb-4769-image-19

Clean up

It’s always a good practice to clean up the resources created as part of this post to avoid additional costs. To clean up your resources, delete the MSK cluster, Firehose stream, Iceberg S3 table bucket, S3 general purpose bucket, and CloudWatch logs.

Conclusion

In this post, we demonstrated two approaches for data streaming from Amazon MSK to data lakes using Firehose: direct streaming to Iceberg tables in Amazon S3, and streaming to S3 Tables. Firehose alleviates the complexity of traditional data pipeline management by offering a fully managed, no-code approach that handles data transformation, compression, and error handling automatically. The seamless integration between Amazon MSK, Firehose, and Iceberg format in Amazon S3 demonstrates AWS’s commitment to simplifying big data architectures while maintaining the robust features of ACID compliance and advanced query capabilities that modern data lakes demand. We hope you found this post helpful and encourage you to try out this solution and simplify your streaming data pipelines to Iceberg tables.


About the authors

bdb-4769-image-21Pratik Patel is Sr. Technical Account Manager and streaming analytics specialist. He works with AWS customers and provides ongoing support and technical guidance to help plan and build solutions using best practices and proactively keep customers’ AWS environments operationally healthy.

Amar is a seasoned Data Analytics specialist at AWS UK, who helps AWS customers to deliver large-scale data solutions. With deep expertise in AWS analytics and machine learning services, he enables organizations to drive data-driven transformation and innovation. He is passionate about building high-impact solutions and actively engages with the tech community to share knowledge and best practices in data analytics.

bdb-4769-image-22Priyanka Chaudhary is a Senior Solutions Architect and data analytics specialist. She works with AWS customers as their trusted advisor, providing technical guidance and support in building Well-Architected, innovative industry solutions.

PackScan: Building real-time sort center analytics with AWS Services

Post Syndicated from Sairam Vangapally original https://aws.amazon.com/blogs/big-data/packscan-building-real-time-sort-center-analytics-with-aws-services/

Amazon manages a complex logistics network with multiple touch points, from fulfillment centers to sort centers to final customer delivery. Among these, sort centers play a crucial role in the middle mile, providing faster and more efficient package movement. Within Amazon’s Middle Mile operations, high-volume sort centers process millions of packages daily, making immediate access to operational data essential for optimizing efficiency and decision-making. Real-time visibility into key metrics—such as package movements, container statuses, and associate productivity—is critical for smooth logistics operations. To address the need for real-time operational planning, the Amazon Middle Mile team developed PackScan, a cloud-based platform designed to provide instant insights across the network. By significantly reducing data latency, PackScan enables proactive decision-making, so teams can monitor inbound package flows, optimize outbound shipments based on live data, track associate productivity, identify bottlenecks, and enhance overall operational efficiency—all in real time.

In this post, we explore how PackScan uses Amazon cloud-based services to drive real-time visibility, improve logistics efficiency, and support the seamless movement of packages across Amazon’s Middle Mile network.

Prerequisites

This post assumes a foundational understanding of the following services and concepts:

Although hands-on experience is not required, a conceptual understanding of these services will help in understanding the architecture, design patterns, and components discussed throughout the article.

Business challenges

Amazon’s sort centers handle over 15 million packages daily across more than 120 facilities in North America. Given this scale, even minor delays in operational insights can lead to inefficiencies, increased costs, and escalations. Traditionally, data latencies of up to an hour have restricted the ability to make proactive decisions, directly affecting productivity, resource allocation, and responsiveness—especially during peak periods like holiday seasons and big deal days.

Without immediate visibility into package movements, container statuses, and associate performance, operational teams face challenges in identifying and resolving bottlenecks in real time. The lack of timely insights can disrupt the flow of packages, leading to shipment delays, reduced throughput, and suboptimal facility performance. Addressing these inefficiencies required a solution capable of delivering real-time, high-fidelity data to support rapid decision-making.

To bridge this gap, Amazon’s Middle Mile organization needed a scalable platform that could enhance visibility, minimize latency, and provide up-to-the-minute insights into logistics operations. PackScan was designed to meet these demands, giving teams access to the real-time data necessary to optimize workflows, mitigate bottlenecks, and improve overall efficiency.

Data flow

In 2024, PackScan was deployed across 80 sort centers in the USA, enabling real-time package analytics. The solution powers Grafana dashboards, which refresh every 10 seconds by fetching live package data from OpenSearch Service. With this near real-time visibility, operations teams can monitor package movement and sorting efficiency across sort centers. The following diagram outlines how package scan data is ingested, processed, and made actionable.

Each sort center is equipped with hardware at inbound stations where packages arrive from trailers. Integrated barcode scanners automatically scan each package as it enters the sorting process. Every scan generates an SNS event, capturing key attributes such as the package ID, dimensions, the associate who performed the scan, and the timestamp and location of the scan.

After they’re generated, these SNS events are ingested into Data Firehose through a Lambda function, where the data undergoes real-time enrichment. During this process, additional attributes are appended, including the business logic rules. The enriched data is then streamed into OpenSearch Service, where events are indexed to enable fast and efficient querying. With the indexed package scan events available in OpenSearch Service, real-time analytics and monitoring become possible. The Grafana dashboards query this data every 10 seconds, providing operational insights into package inflow metrics and associate performance.

Solution overview

PackScan was implemented using a structured and scalable approach, using AWS cloud-based services to enable high-frequency data ingestion, real-time processing, and actionable insights. The architecture is designed to minimize latency while providing reliability, scalability, and operational efficiency. The solution is built around a serverless, event-driven architecture that dynamically scales based on data ingestion volumes. The architecture—illustrated in the following figure—enabled us to build a real-time data solution, utilizing the advantages of various AWS services to provide low-latency analytics, high scalability, and real-time operational insights across Amazon’s sort centers.

The following are the key components and features of the solution:

  • Real-time data processing – Lambda functions serve as the processing backbone of the system, handling 500,000 scan events per second. Each incoming event is processed by applying data transformations, enrichment, and validation before passing it downstream.
  • High-frequency data ingestion and streaming – Data Firehose is the primary ingestion pipeline, handling millions of scan events daily from thousands of barcode scanners across multiple sort centers. The Firehose streams handle incoming data of 12,000 PUT requests per second, maintaining smooth ingestion and low-latency streaming. Data retention policies are set to buffer and forward enriched events every 60 seconds or upon reaching 5 MB batch size, optimizing storage and processing efficiency.
  • Optimized querying and operational insights – OpenSearch Service is used to index and store the processed scan events, providing real-time querying and anomaly detection. The OpenSearch cluster consists of 12 data nodes (r5.4xlarge.search) and 3 primary nodes (r5.large.search), processing up to 10 GB of data per day with a rolling index strategy, where indexes are rotated every 24 hours to maintain query performance. The system supports concurrent queries per second, enabling logistics teams to perform rapid lookups and gain instant visibility into package movements.
  • Live visualization and dashboarding – Grafana, hosted on an m5.12xlarge EC2 instance, provides real-time visualization of key logistics metrics. The dashboards refresh every 10 seconds, querying OpenSearch and displaying up-to-the-minute package analytics. The setup includes multiple preconfigured dashboards, monitoring package flow at different inbound stations, and workforce efficiency. These dashboards support concurrent users, enabling supervisors and associates to track and optimize operations proactively. The following screenshot shows one of the real-time dashboards, with details of package flow by different routes within sort centers.

The entire PackScan architecture is designed for automatic scaling, adjusting dynamically based on data ingestion volume to maintain efficiency during peak and off-peak operations. This approach provides cost-effective resource utilization while maintaining high availability and performance.

Business outcomes

The implementation of PackScan has led to measurable improvements in operational efficiency, workforce productivity, and real-time decision-making across Amazon’s sort centers. By reducing data latency and enabling real-time insights, PackScan has transformed logistics operations in meaningful ways:

  • Widespread deployment – PackScan was deployed across 80 sort centers, supporting approximately 1,000 display monitors that provide real-time operational insights.
  • Significant reduction in data latency – Data latency dropped from approximately 1 hour to less than 1 minute, allowing for real-time operational responsiveness and minimizing workflow disruptions.
  • Proactive operational management – With dynamic workload balancing and instant bottleneck identification, supervisors can now address issues as they arise, leading to smoother operations and fewer escalations.
  • Boost in workforce productivity – The real-time performance feedback has enhanced associate engagement, resulting in a 25% increase in throughput per hour and 12% reduction in labor hours.

Overall, PackScan has redefined real-time logistics visibility within Amazon’s Middle Mile operations, empowering operational teams with actionable insights, enhanced workforce efficiency, and a data-driven approach to package movement and sort center performance.

Lessons learned and best practices

The deployment and scaling of PackScan provided valuable insights into optimizing real-time logistics visibility. Several key lessons and best practices emerged from this implementation:

  • Cloud architecture drives efficiency – Adopting Amazon technologies provides seamless scalability, reduced operational overhead, and lower infrastructure costs, while maintaining high reliability. The following table shows an approximate breakdown of monthly service costs observed in production. This is an estimation based on current pricing; we recommend checking the respective AWS service pricing pages to generate the most up-to-date quote. This architecture demonstrates that with combination of provisioned and serverless design, production-ready solutions can be built and scaled at a fraction of the cost of traditional infrastructure.
AWS Service Description Estimated Monthly Cost
Amazon EC2 Three EC2 instances of type m5.12xlarge hosting Grafana $1,700
AWS Lambda Streams SNS events to Data Firehose $4,000
Amazon Data Firehose Real-time data delivery with 12,000 records streaming to OpenSearch Service $1,500
Amazon OpenSearch Service Indexing and querying package scan events $28,000
  • Real-time visibility is a game changer – Immediate access to operational data enhances agility, enabling teams to make timely, data-driven decisions that prevent bottlenecks and improve throughput.
  • Continuous monitoring enhances decision-making – Operational dashboards should evolve with business needs. Regular monitoring and updates provide accuracy, usability, and relevance in driving informed decision-making.

By applying these best practices, PackScan has set a foundation for scalable, real-time logistics management, making sure that Amazon’s Middle Mile operations remain proactive, efficient, and highly responsive to changing business demands.

Conclusion

PackScan has successfully transformed real-time operational visibility within Amazon’s sort centers, addressing critical challenges in data latency, workforce productivity, and logistics efficiency. By using AWS services, particularly Data Firehose for real-time data delivery and OpenSearch Service for analytics, PackScan has enabled proactive decision-making, streamlined operations, and enhanced throughput in high-volume sort environments. Looking ahead, future enhancements will focus on further elevating operational intelligence and scalability, including:

  • Integrating predictive analytics to anticipate workflow bottlenecks and optimize resource allocation
  • Scaling the solution across additional operational scenarios, providing greater resilience and adaptability to dynamic logistics environments

With these advancements, PackScan will continue to drive operational excellence, cost-efficiency, and real-time decision-making capabilities, reinforcing Amazon’s commitment to innovation in logistics and supply chain management.

For those interested in implementing similar solutions, we recommend exploring AWS Serverless Architecture Patterns and the AWS Architecture Blog for additional insights and best practices in building scalable, real-time analytics solutions.


About the authors

Sairam Vangapally is a Data Engineer at Amazon with extensive experience architecting real-time, large-scale data platforms that power critical logistics operations across North America. He has led the design and deployment of end-to-end data pipelines, enabling high-throughput ingestion, transformation, and analytics at scale. He is passionate about building resilient data infrastructure and driving cross-functional collaboration to deliver solutions that accelerate operational insights and business impact.

Nitin Goyal serves as a Data Engineering Manager in Amazon’s Sort Center organization, where he leads initiatives to optimize operational efficiency across North American facilities. With over nine years of tenure at Amazon spanning multiple teams, he specializes in architecting high-performance data systems, with particular emphasis on real-time streaming pipelines, artificial intelligence, and low-latency solutions. His expertise drives the development of sophisticated operational workflows that enhance sort center productivity and effectiveness.

How Airties achieved scalability and cost-efficiency by moving from Kafka to Amazon Kinesis Data Streams

Post Syndicated from Steven Aerts, Reza Radmehr original https://aws.amazon.com/blogs/big-data/how-airties-achieved-scalability-and-cost-efficiency-by-moving-from-kafka-to-amazon-kinesis-data-streams/

This post was cowritten with Steven Aerts and Reza Radmehr from Airties.

Airties is a wireless networking company that provides AI-driven solutions for enhancing home connectivity. Founded in 2004, Airties specializes in developing software and hardware for wireless home networking, including Wi-Fi mesh systems, extenders, and routers. The flagship software as a service (SaaS) product, Airties Home, is an AI-driven platform designed to automate customer experience management for home connectivity, offering proactive customer care, network optimization, and real-time insights. By using AWS managed services, Airties can focus on their core mission: improving home Wi-Fi experiences through automated optimization and proactive issue resolution. This includes minimizing network downtime, enabling faster diagnostic capabilities for troubleshooting, and enhancing overall Wi-Fi quality. The solution has demonstrated significant impact in reducing both the frequency of help desk calls and average call duration, leading to improved customer satisfaction and reduced operational costs for Airties while delivering enhanced service quality to their customers and the end-users.

In 2023, Airties initiated a strategic migration from Apache Kafka running on Amazon Elastic Compute Cloud (Amazon EC2) to Amazon Kinesis Data Streams. Prior to this migration, Airties operated multiple fixed-size Kafka clusters, each deployed in a single Availability Zone to minimize cross-AZ traffic costs. Although this architecture served its purpose, it required constant monitoring and manual scaling to handle varying data loads. The transition to Kinesis Data Streams marked a significant step in their cloud optimization journey, enabling true serverless operations with automatic scaling capabilities. This migration resulted in substantial infrastructure cost reduction while improving system reliability, eliminating the need for manual cluster management and capacity planning.

This post explores the strategies the Airties team employed during this transformation, the challenges they overcame, and how they achieved a more efficient, scalable, and maintenance-free streaming infrastructure.

Kafka use cases for Airties workloads

Airties continuously ingests data from tens of millions of access points (such as modems and routers) using AWS IoT Core. Before the transition, these messages were queued and stored within multiple siloed Kafka clusters, with each cluster deployed in a separate Availability Zone to minimize cross-AZ traffic costs. This fragmented architecture created several operational challenges. The segmented data storage required complex extract, transform, and load (ETL) processes to consolidate information across clusters, increasing the time to derive meaningful insights. The data collected serves multiple critical purposes—from real-time monitoring and reactive troubleshooting to predictive maintenance and historical analysis. However, the siloed nature of the data storage made it particularly challenging to perform cross-cluster analytics and delayed the ability to identify network-wide patterns and trends.

The data processing architecture at Airties served two distinct use cases. The first was a traditional streaming pattern with a batch reader processing data in bulk for analytical purposes. The second use case used Kafka as a queryable data store—a pattern that, though unconventional, has become increasingly common in large-scale data architectures.

For this second use case, Airties needed to provide immediate access to historical device data when troubleshooting customer issues or analyzing specific network events. This was implemented by maintaining a mapping of data points to their Kafka offsets in a database. When customer support or analytics teams needed to retrieve specific historical data, they could quickly locate and fetch the exact records from high-retention Kafka topics using these stored offsets. This approach eliminated the need for a separate database system while maintaining fast access to historical data.

To handle the massive scale of operations, this solution was horizontally scaled across dozens of Kafka clusters, with each cluster responsible for managing approximately 25 TB of records.

The following diagram illustrates the previous Kafka-based architecture.

Challenges with the Kafka-based architecture

At Airties, managing and scaling Kafka clusters has presented several challenges, hindering the organization from focusing on delivering business value effectively:

  • Operational overhead: Maintaining and monitoring Kafka clusters requires significant manual effort and operational overhead at Airties. Tasks such as managing cluster upgrades, handling hardware failures and rotation, and conducting load testing constantly demand engineering attention. These operational tasks take away from the team’s ability to concentrate on core business functions and value-adding activities within the company.
  • Scaling complexities : The process of scaling Kafka clusters involves multiple manual steps that create operational burden for the cloud team. These include configuring new brokers, rebalancing partitions across nodes, and providing proper data distribution—all while maintaining system stability. As data volume and throughput requirements fluctuate, scaling typically involves adding or removing entire Kafka clusters, which is a complex and time-consuming process for the Airties team.
  • Right-sizing cluster capacity: The static nature of Kafka clusters created a “one-size-fits-none” situation for Airties. For large-scale deployments with high data volumes and throughput requirements, adding new clusters required significant manual work, including capacity planning, broker configuration, and partition rebalancing, making it inefficient for handling dynamic scaling needs. Conversely, for smaller deployments, the standard cluster size was oversized, leading to resource waste and unnecessary costs.

How the new architecture addresses these challenges

The Airties team needed to find a scalable, high-performance, and cost-effective solution for real-time data processing that would allow seamless scaling with increasing data volumes. Data durability was a critical requirement, because losing device telemetry data would create permanent gaps in customer analytics and historical troubleshooting capabilities. Although temporary delays in data access could be tolerated, the loss of any device data point was unacceptable for maintaining service quality and customer support effectiveness.

To address these challenges, Airties implemented two different approaches for different scenarios.

The primary use case was real-time data streaming with Kinesis Data Streams. Airties replaced Kafka with Kinesis Data Streams to handle the continuous ingestion and processing of telemetry data from tens of millions of endpoints. This shift offered significant advantages:

  • Auto-scaling capabilities : Kinesis Data Streams can be scaled through simple API calls, alleviating the need for complex configurations and manual interventions.
  • Stream isolation : Each stream operates independently, meaning scaling operations on one stream have no impact on others. This alleviated the risks associated with cluster-wide changes in their previous Kafka setup.
  • Dynamic shard management : Unlike Kafka, where changing the number of partitions requires creating a new topic, Kinesis Data Streams allows adding or removing shards dynamically without losing message ordering within a partition.
  • Application Auto Scaling: Airties implemented AWS Application Auto Scaling with Kinesis Data Streams, allowing the system to automatically adjust the number of shards based on actual usage patterns and throughput requirements.

These features empowered Airties to efficiently manage resources, optimizing costs during periods of lower activity while seamlessly scaling up to handle peak loads.

For providing on-demand access to historical device data, Airties implemented a decoupled architecture that separates streaming, storage, and data access concerns. This approach replaced the previous solution where historical data was stored directly in Kafka topics. The new architecture consists of several key components working together:

  • Data collection and processing : The architecture begins with a consumer application that processes data from Kinesis Data Streams. This application implements analyzing the data, as making it available for detailed historical analysis. The result of the data analysis is written to Amazon Data Firehose, which buffers the data, writing it regularly to Amazon Simple Storage Service (Amazon S3), where it can later be picked up by Amazon EMR. This path is optimized for efficient storage and bulk reading from Amazon S3 by Amazon EMR. For raw data storage, multiple raw data samples are batched together in bulk files, which are stored in a separate Amazon S3 path. This path is optimized for storage efficiency and fetching raw data using Amazon S3 range queries.
  • Indexing and metadata management: To enable fast data retrieval, the architecture implements a sophisticated indexing system. For each record in the uploaded bulk files, two crucial pieces of information are recorded in an Amazon DynamoDB table: the Amazon S3 location (bucket and key) where the bulk file was written, and the sequence number of the corresponding data record in the Kinesis Data Streams queue. This indexing strategy provides low-latency access to specific data points, efficient querying capabilities for both real-time and historical data, automatic scaling to handle increasing data volumes, and high availability for metadata lookups.
  • Ad-hoc data retrieval: When specific historical data needs to be accessed, the system follows an efficient retrieval process. First, the application queries the DynamoDB table using the relevant identifiers. The query returns the exact Amazon S3 location and offset where the required data is stored. The application then fetches the specific data directly from Amazon S3 using range queries. This approach enables quick access to historical data points, minimal data transfer costs by retrieving only needed records, efficient troubleshooting and analysis workflows, and reduced latency for customer support operations.

This decoupled architecture uses the strengths of each AWS service: Amazon Kinesis Data Streams provides scalable and reliable real-time data streaming, while Amazon S3 delivers durable and cost-effective object storage for raw data, and Amazon DynamoDB enables fast and flexible storage of metadata and indexing. By separating streaming from storage and utilizing each service for its specific strengths, Airties created a more cost-effective and scalable solution for ad-hoc data access needs, aligning each component with its optimal AWS service. The new architecture not only improved data access performance but also significantly reduced operational complexity. Instead of managing Kafka topics for historical data storage, Airties now benefits from fully managed AWS services that automatically handle scaling, durability, and availability. This approach has proven particularly valuable for customer support scenarios, where quick access to historical device data is crucial for resolving issues efficiently.

Solution overview

Airties’s new architecture involves several critical components, including efficient data ingestion, indexing with AWS Lambda functions, optimized data aggregation and processing, and comprehensive monitoring and management practices using Amazon CloudWatch. The following diagram illustrates this architecture.

The new architecture consists of the following key stages:

  • Data collection and storage: The data journey begins with Kinesis Data Streams, which ingests real-time data from millions of access points. This streaming data is then processed by a consumer application that batches the data into bulk files (also known as briefcase files) for efficient storage in Amazon S3. This approach of streaming, batching, and then storing minimizes write operations and reduces overall costs, while providing data durability through built-in replication in Amazon S3. When the data is in Amazon S3, it’s readily available for both immediate processing and long-term analysis. The processing pipeline continues with aggregators that read data from Amazon S3, process it, and store aggregated results back in Amazon S3. By integrating AWS Glue for ETL operations and Amazon Athena for SQL-based querying, Airties can process large volumes of data efficiently and generate insights quickly and cost-effectively.
  • Data aggregation and bulk file creation: The aggregators play a crucial role in the initial data processing. They aggregate the incoming data based on predefined criteria and create bulk files. This aggregation process reduces the volume of data that needs to be processed in subsequent steps, optimizing the overall data processing workflow. The aggregators then write these bulk files directly to Amazon S3.
  • Indexing: Upon successful upload of a bulk file to Amazon S3 by the aggregators, the aggregator will write an index entry for the bulk file an Amazon DynamoDB table. This indexing mechanism allows for efficient retrieval of data based on device IDs and timestamps, facilitating quick access to relevant data using S3 range queries on the bulk files.
  • Further processing and analysis: The bulk files stored in Amazon S3 are now in a format optimized for querying and analysis. These files can be further processed using AWS Glue and analyzed using Athena, allowing for complex queries and in-depth data exploration without the need for additional data transformation steps.
  • Monitoring and management: To maintain the reliability and performance of the Kafka-less architecture, comprehensive monitoring and management practices were implemented. CloudWatch provides real-time monitoring of system performance and resource utilization, allowing for proactive management of potential issues. Additionally, automated alerts and notifications make sure anomalies are promptly addressed.

Results and benefits

The transition to this new architecture yielded significant benefits for Airties:

  • Scalability and performance: The new architecture empowers Airties to scale seamlessly with increasing data volumes. The ability to independently scale reader and writer operations has reduced performance impacts during high-demand periods. This is a significant improvement over the previous Kafka-based system, where scaling often required complex reconfigurations and could affect the entire cluster. With Kinesis Data Streams, Airties can now handle peak loads effortlessly while optimizing resource usage during quieter periods.
  • Reliability and fault tolerance: By using AWS managed services, Airties has significantly reduced system latency and improved overall uptime. The automatic data replication and recovery processes of Kinesis Data Streams provide enhanced data durability, a critical requirement for Airties’s operations. The improved high availability means that Airties can now offer more reliable services to their customers, minimizing disruptions and enhancing the overall quality of their home connectivity solutions.
  • Operational efficiency: The new architecture has dramatically reduced the need for manual intervention in capacity management. This shift has freed up valuable engineering resources, allowing the team to focus on delivering business value rather than managing infrastructure. The simplified operational model has increased the team’s productivity, empowering them to innovate faster and respond more quickly to customer needs. The reduction in operational overhead has also led to faster deployment cycles and more frequent feature releases, enhancing Airties’s competitiveness in the market.
  • Environmental impact and sustainability: The transition to a serverless architecture demonstrated significant environmental benefits, achieving a remarkable 40% reduction in energy consumption. This substantial decrease in energy usage was achieved by eliminating the need for constantly running EC2 instances and using more efficient, managed AWS services. This improvement in energy efficiency aligns with Airties’s commitment to environmental sustainability and establishes them as an environmentally responsible leader in the tech industry.
  • Cost optimization: The financial benefits of transitioning to a Kafka-less architecture are clearly demonstrated through comprehensive AWS Cost Explorer data. As shown in the following diagram, the total cost breakdown across all relevant services from January to July includes EC2 instances, DynamoDB, other Amazon EC2 costs, Kinesis Data Streams, Amazon S3, and Amazon Data Firehose. The most notable change was a 33% reduction in total monthly infrastructure costs (compared to January baseline), primarily achieved through significant decrease in Amazon EC2 related costs as the migration progressed, elimination of dedicated Kafka infrastructure, and efficient use of the AWS pay-as-you-go model. Although new costs were introduced for managed services (DynamoDB, Kinesis Data Streams, Amazon Data Firehose, Amazon S3), the overall monthly AWS costs maintained a clear downward trend. With these cost savings, Airties can offer more competitive pricing to their customers. The diagram below shows monthly cost breakdown during the transition.

Conclusion

The transition to this new architecture with Kinesis Data Streams has marked a significant milestone in Airties’s journey towards operational excellence and sustainability. These initiatives have not only enhanced system performance and scalability, but have also resulted in substantial cost savings (33%) and energy efficiency (40%). By using advanced technologies and innovative solutions on AWS, the Airties team continues to set the benchmark for efficient, reliable, and sustainable operations, while paving the way for a sustainable future. In order to explore how you can modernize your streaming architecture with AWS, see the Kinesis Data Streams documentation and watch this re:invent session on serverless data streaming with Kinesis Data Streams and AWS Lambda.


About the Authors

Steven Aerts is a principal software engineer at Airties, where his team is responsible for ingesting, processing, and analyzing the data of tens of millions of homes to improve their Wi-Fi experience. He was a speaker at conferences like Devoxx and AWS Summit Dubai, and is an open source contributor.

Reza Radmehr is a Sr. Leader of Cloud Infrastructure and Operations at Airties, where he leads AWS infrastructure design, DevOps and SRE automation, and FinOps practices. He focuses on building scalable, cost-efficient, and reliable systems, driving operational excellence through smart, data-driven cloud strategies. He is passionate about blending financial insight with technical innovation to improve performance and efficiency at scale.

Ramazan Ginkaya is a Sr. Technical Account Manager at AWS with over 17 years of experience in IT, telecommunications, and cloud computing. He is a passionate problem-solver, providing technical guidance to AWS customers to help them achieve operational excellence and maximize the value of cloud computing.

Unify streaming and analytical data with Amazon Data Firehose and Amazon SageMaker Lakehouse

Post Syndicated from Kalyan Janaki original https://aws.amazon.com/blogs/big-data/unify-streaming-and-analytical-data-with-amazon-data-firehose-and-amazon-sagemaker-lakehouse/

Organizations are increasingly required to derive real-time insights from their data while maintaining the ability to perform analytics. This dual requirement presents a significant challenge: how to effectively bridge the gap between streaming data and analytical workloads without creating complex, hard-to-maintain data pipelines. In this post, we demonstrate how to simplify this process using Amazon Data Firehose (Firehose) to deliver streaming data directly to Apache Iceberg tables in Amazon SageMaker Lakehouse, creating a streamlined pipeline that reduces complexity and maintenance overhead.

Streaming data empowers AI and machine learning (ML) models to learn and adapt in real time, which is crucial for applications that require immediate insights or dynamic responses to changing conditions. This creates new opportunities for business agility and innovation. Key use cases include predicting equipment failures based on sensor data, monitoring supply chain processes in real time, and enabling AI applications to respond dynamically to changing conditions. Real-time streaming data helps customers make quick decisions, fundamentally changing how businesses compete in real-time markets.

Amazon Data Firehose seamlessly acquires, transforms, and delivers data streams to lakehouses, data lakes, data warehouses, and analytics services, with automatic scaling and delivery within seconds. For analytical workloads, a lakehouse architecture has emerged as an effective solution, combining the best elements of data lakes and data warehouses. Apache Iceberg, an open table format, enables this transformation by providing transactional guarantees, schema evolution, and efficient metadata handling that were previously only available in traditional data warehouses. SageMaker Lakehouse unifies your data across Amazon Simple Storage Service (Amazon S3) data lakes, Amazon Redshift data warehouses, and other sources, and gives you the flexibility to access your data in-place with Iceberg-compatible tools and engines. By using SageMaker Lakehouse, organizations can harness the power of Iceberg while benefiting from the scalability and flexibility of a cloud-based solution. This integration removes the traditional barriers between data storage and ML processes, so data workers can work directly with Iceberg tables in their preferred tools and notebooks.

In this post, we show you how to create Iceberg tables in Amazon SageMaker Unified Studio and stream data to these tables using Firehose. With this integration, data engineers, analysts, and data scientists can seamlessly collaborate and build end-to-end analytics and ML workflows using SageMaker Unified Studio, removing traditional silos and accelerating the journey from data ingestion to production ML models.

Solution overview

The following diagram illustrates the architecture of how Firehose can deliver real-time data to SageMaker Lakehouse.

This post includes an AWS CloudFormation template to set up supporting resources so Firehose can deliver streaming data to Iceberg tables. You can review and customize it to suit your needs. The template performs the following operations:

Prerequisites

For this walkthrough, you should have the following prerequisites:

After you create the prerequisites, verify you can log in to SageMaker Unified Studio and the project is created successfully. Every project created in SageMaker Unified Studio gets a project location and project IAM role, as highlighted in the following screenshot.

Create an Iceberg table

For this solution, we use Amazon Athena as the engine for our query editor. Complete the following steps to create your Iceberg table:

  1. In SageMaker Unified Studio, on the Build menu, choose Query Editor.

  1. Choose Athena as the engine for query editor and choose the AWS Glue database created for the project.

  1. Use the following SQL statement to create the Iceberg table. Make sure to provide your project AWS Glue database and project Amazon S3 location (can be found on the project overview page):
CREATE TABLE firehose_events (
type struct<device: string, event: string, action: string>,
customer_id string,
event_timestamp timestamp,
region string)
LOCATION '<PROJECT_S3_LOCATION>/iceberg/events'
TBLPROPERTIES (
'table_type'='iceberg',
'write_compression'='zstd'
);

Deploy the supporting resources

The next step is to deploy the required resources into your AWS environment by using a CloudFormation template. Complete the following steps:

  1. Choose Launch Stack.
  2. Choose Next.
  3. Leave the stack name as firehose-lakehouse.
  4. Provide the user name and password that you want to use for accessing the Amazon Kinesis Data Generator application.
  5. For DatabaseName, enter the AWS Glue database name.
  6. For ProjectBucketName, enter the project bucket name (located on the SageMaker Unified Studio project details page).
  7. For TableName, enter the table name created in SageMaker Unified Studio.
  8. Choose Next.

  1. Select I acknowledge that AWS CloudFormation might create IAM resources and choose Next.

  1. Complete the stack.

Create a Firehose stream

Complete the following steps to create a Firehose stream to deliver data to Amazon S3:

  1. On the Firehose console, choose Create Firehose stream.

  1. For Source, choose Direct PUT.
  2. For Destination, choose Apache Iceberg Tables.

This example chooses Direct PUT as the source, but you can apply the same steps for other Firehose sources, such as Amazon Kinesis Data Streams and Amazon Managed Streaming for Apache Kafka (Amazon MSK).

  1. For Firehose stream name, enter firehose-iceberg-events.

  1. Collect the database name and table name from the SageMaker Unified Studio project to use in the next step.

  1. In the Destination settings section, enable Inline parsing for routing information and provide the database name and table name from the previous step.

Make sure you enclose the database and table names in double quotes if you want to deliver data to a single database and table. Amazon Data Firehose can also route records to different tables based on the content of the record. For more information, refer to Route incoming records to different Iceberg tables.

  1. Under Buffer hints, reduce the buffer size to 1 MiB and the buffer interval to 60 seconds. You can fine-tune these settings based on your use case latency needs.

  1. In the Backup settings section, enter the S3 bucket created by the CloudFormation template (s3://firehose-demo-iceberg-<account_id>-<region>) and the error output prefix (error/events-1/).

  1. In the Advanced settings section, enable Amazon CloudWatch error logging to troubleshoot any failures, and in for Existing IAM roles, choose the role that starts with Firehose-Iceberg-Stack-FirehoseIamRole-*, created by the CloudFormation template.
  2. Choose Create Firehose stream.

Generate streaming data

Use the Amazon Kinesis Data Generator to publish data records into your Firehose stream:

  1. On the AWS CloudFormation console, choose Stacks in the navigation pane and open your stack.
  2. Select the nested stack for the generator, and go to the Outputs tab.
  3. Choose the Amazon Kinesis Data Generator URL.

  1. Enter the credentials that you defined when deploying the CloudFormation stack.

  1. Choose the AWS Region where you deployed the CloudFormation stack and choose your Firehose stream.
  2. For the template, replace the default values with the following code:
{
"type": {
"device": "{{random.arrayElement(["mobile", "desktop", "tablet"])}}",
"event": "{{random.arrayElement(["firehose_events_1", "firehose_events_2"])}}",
"action": "update"
},
"customer_id": "{{random.number({ "min": 1, "max": 1500})}}",
"event_timestamp": "{{date.now("YYYY-MM-DDTHH:mm:ss.SSS")}}",
"region": "{{random.arrayElement(["pdx", "nyc"])}}"
}
  1. Before sending data, choose Test template to see an example payload.
  2. Choose Send data.

You can monitor the progress of the data stream.

Query the table in SageMaker Unified Studio

Now that Firehose is delivering data to SageMaker Lakehouse, you can perform analytics on that data in SageMaker Unified Studio using different AWS analytics services.

Clean up

It’s generally a good practice to clean up the resources created as part of this post to avoid additional cost. Complete the following steps:

  1. On the AWS CloudFormation console, choose Stacks in the navigation pane.
  2. Select the stack firehose-lakehouse* and on the Actions menu, choose Delete Stack.
  3. In SageMaker Unified Studio, delete the domain created for this post.

Conclusion

Streaming data allows models to make predictions or decisions based on the latest information, which is crucial for time-sensitive applications. By incorporating real-time data, models can make more accurate predictions and decisions. Streaming data can help organizations avoid the costs associated with storing and processing large datasets, because it focuses on the most relevant information. Amazon Data Firehose makes it straightforward to bring real-time streaming data to data lakes in Iceberg format and unifying it with other data assets in SageMaker Lakehouse, making streaming data accessible by various analytics and AI services in SageMaker Unified Studio to deliver real-time insights. Try out the solution for your own use case, and share your feedback and questions in the comments.


About the Authors

Kalyan Janaki is Senior Big Data & Analytics Specialist with Amazon Web Services. He helps customers architect and build highly scalable, performant, and secure cloud-based solutions on AWS.

Phaneendra Vuliyaragoli is a Product Management Lead for Amazon Data Firehose at AWS. In this role, Phaneendra leads the product and go-to-market strategy for Amazon Data Firehose.

Maria Ho is a Product Marketing Manager for Streaming and Messaging services at AWS. She works with services including Amazon Managed Streaming for Apache Kafka (Amazon MSK), Amazon Managed Service for Apache Flink, Amazon Data Firehose, Amazon Kinesis Data Streams, Amazon MQ, Amazon Simple Queue Service (Amazon SQS), and Amazon Simple Notification Services (Amazon SNS).

Streamline AWS WAF log analysis with Apache Iceberg and Amazon Data Firehose

Post Syndicated from Charishma Makineni original https://aws.amazon.com/blogs/big-data/streamline-aws-waf-log-analysis-with-apache-iceberg-and-amazon-data-firehose/

Organizations are rapidly expanding their digital presence, creating opportunities to serve customers better through web applications. AWS WAF logs play a vital role in this expansion by enabling organizations to proactively monitor security, enforce compliance, and strengthen application defense. AWS WAF log analysis is essential across many industries, including banking, retail, and healthcare, each needing to deliver secure digital experiences.

To optimize their security operations, organizations are adopting modern approaches that combine real-time monitoring with scalable data analytics. They are using data lake architectures and Apache Iceberg to efficiently process large volumes of security data while minimizing operational overhead. Apache Iceberg combines enterprise reliability with SQL simplicity when working with security data stored in Amazon Simple Storage Service (Amazon S3), enabling organizations to focus on security insights rather than infrastructure management.

Apache Iceberg enhances security analytics through several key capabilities. It seamlessly integrates with various AWS services and analysis tools while supporting concurrent read-write operations for simultaneous log ingestion and analysis. Its time travel feature enables thorough security forensics and incident investigation, and its schema evolution support allows teams to adapt to emerging security patterns without disrupting existing workflows. These capabilities make Apache Iceberg an ideal choice for building robust security analytics solutions. However, organizations often struggle when building their own solutions to deliver data to Apache Iceberg tables. These include managing complex extract, transform, and load (ETL) processes, handling schema validation, providing reliable delivery, and maintaining custom code for data transformations. Teams must also build resilient error handling, implement retry logic, and manage scaling infrastructure—all while maintaining data consistency and high availability. These challenges take valuable time away from analyzing security data and deriving insights.

To address these challenges, Amazon Data Firehose provides real-time data delivery to Apache Iceberg tables within seconds. Firehose delivers high reliability across multiple Availability Zones while automatically scaling to match throughput requirements. It is fully managed and requires no infrastructure management or custom code development. Firehose delivers streaming data with configurable buffering options that can be optimized for near-zero latency. It also provides built-in data transformation, compression, and encryption capabilities, along with automatic retry mechanisms to provide reliable data delivery. This makes it an ideal choice for streaming AWS WAF logs directly into a data lake while minimizing operational overhead.

In this post, we demonstrate how to build a scalable AWS WAF log analysis solution using Firehose and Apache Iceberg. Firehose simplifies the entire process—from log ingestion to storage—by allowing you to configure a delivery stream that delivers AWS WAF logs directly to Apache Iceberg tables in Amazon S3. The solution requires no infrastructure setup and you pay only for the data you process.

Solution overview

To implement this solution, you first configure AWS WAF logging to capture web traffic information. This captures detailed information about traffic analyzed by the web access control lists (ACLs). Each log entry includes the request timestamp, detailed request information, and rule matches that were triggered. These logs are continuously streamed to Firehose in real time.

Firehose writes these logs into an Apache Iceberg table, which is stored in Amazon S3. When Firehose delivers data to the S3 table, it uses the AWS Glue Data Catalog to store and manage table metadata. This metadata includes schema information, partition details, and file locations, enabling seamless data discovery and querying across AWS analytics services.

Finally, security teams can analyze data in the Apache Iceberg tables using various AWS services, including Amazon Redshift, Amazon Athena, Amazon EMR, and Amazon SageMaker. For this demonstration, we use Athena to run SQL queries against the security logs.

The following diagram illustrates the solution architecture.


The implementation consists of four steps:

  1. Deploy the base infrastructure using AWS CloudFormation.
  2. Create an Apache Iceberg table using an AWS Glue notebook.
  3. Create a Firehose stream to handle the log data.
  4. Configure AWS WAF logging to send data to the Apache Iceberg table through the Firehose stream.

You can deploy the required resources into your AWS environment in the US East (N. Virginia) AWS Region using a CloudFormation template. This template creates an S3 bucket for storing AWS WAF logs, an AWS Glue database for the Apache Iceberg tables, and the AWS Identity and Access Management (IAM) roles and policies needed for the solution.

Prerequisites

Before you get started, make sure you have the following prerequisites:

  • An AWS account with access to the US East (N. Virginia) Region
  • AWS WAF configured with a web ACL in the US East (N. Virginia) Region

If you don’t have AWS WAF set up, refer to the AWS WAF Workshop to create a sample web application with AWS WAF.

AWS WAF logs use case-sensitive field names (like httpRequest and webaclId). For successful log ingestion, this solution uses the Apache Iceberg API through an AWS Glue job to create tables—this is a reliable approach that preserves the exact field names from the AWS WAF logs. Although AWS Glue crawlers and Athena DDLs offer convenient ways to create Apache Iceberg tables, they convert mixed-case column names to lowercase, which can affect AWS WAF log processing. By using an AWS Glue job with the Apache Iceberg API, case-sensitivity of column names is preserved, providing proper mapping between AWS WAF log fields and table columns.

Deploy the CloudFormation stack

Complete the following steps to deploy the solution resources with AWS CloudFormation:

  1. Sign in to the AWS CloudFormation console.
  2. Choose Launch Stack.
    Launch Cloudformation Stack
  3. Choose Next.
  4. For Stack name, leave as WAF-Firehose-Iceberg-Stack.
  5. Under Parameters, specify whether AWS Lake Formation permissions are to be used for the AWS Glue tables.
  6. Choose Next.

  1. Select I acknowledge that AWS CloudFormation might create IAM resources with custom names and choose Next.


  1. Review the deployment and choose Submit.


The stack takes several minutes to deploy. After the deployment is complete, you can review the resources created by navigating to the Resources tab on the CloudFormation stack.

Create an Apache Iceberg table

Before setting up the Firehose delivery stream, you must create the destination Apache Iceberg table in the Data Catalog. This is done using AWS Glue jobs and the Apache Iceberg API, as discussed earlier. Complete the following steps to create an Apache Iceberg table:

  1. On the AWS Glue console, choose Notebooks under ETL jobs in the navigation pane.


  1. Choose Notebook option under Create job.


  1. Under Options, select Start fresh.
  2. For IAM role, choose WAF-Firehose-Iceberg-Stack-GlueServiceRole-*.
  3. Choose Create notebook.

  1. Enter the following configuration command in the notebook to configure the Spark session with Apache Iceberg extensions. Be sure to update the configuration for sql.catalog.glue_catalog.warehouse to the S3 bucket created by the CloudFormation template.
%%configure
{
    "--conf": "spark.sql.extensions=org.apache.iceberg.spark.extensions.IcebergSparkSessionExtensions --conf spark.sql.catalog.glue_catalog=org.apache.iceberg.spark.SparkCatalog --conf spark.sql.catalog.glue_catalog.warehouse=s3://<S3BucketName>/waflogdata --conf spark.sql.catalog.glue_catalog.catalog-impl=org.apache.iceberg.aws.glue.GlueCatalog --conf spark.sql.catalog.glue_catalog.io-impl=org.apache.iceberg.aws.s3.S3FileIO",
    "--datalake-formats": "iceberg"
}

  1. Enter the following SQL in the AWS Glue notebook to create the Apache Iceberg table:
# Note: This code uses Glue version 5.0 (as of April 2024)
# Please check AWS Glue release notes for the latest version and update accordingly:
# https://docs.aws.amazon.com/glue/latest/dg/release-notes.html
# To update: Change the %glue_version parameter below to the latest version

%idle_timeout 2880
%glue_version 5.0
%worker_type G.1X
%number_of_workers 5

import sys
from awsglue.transforms import *
from awsglue.utils import getResolvedOptions
from pyspark.context import SparkContext
from awsglue.context import GlueContext
from awsglue.job import Job
from pyspark.conf import SparkConf

sc = SparkContext.getOrCreate()
glueContext = GlueContext(sc)
spark = glueContext.spark_session
job = Job(glueContext)

spark.sql(""" CREATE TABLE glue_catalog.waf_logs_db.firehose_waf_logs(
  `timestamp` bigint,
  `formatVersion` int,
  `webaclId` string,
  `terminatingRuleId` string,
  `terminatingRuleType` string,
  `action` string,
  `terminatingRuleMatchDetails` array <
                                    struct <
                                        conditiontype: string,
                                        sensitivitylevel: string,
                                        location: string,
                                        matcheddata: array < string >
                                          >
                                     >,
  `httpSourceName` string,
  `httpSourceId` string,
  `ruleGroupList` array <
                      struct <
                          rulegroupid: string,
                          terminatingrule: struct <
                                              ruleid: string,
                                              action: string,
                                              rulematchdetails: array <
                                                                   struct <
                                                                       conditiontype: string,
                                                                       sensitivitylevel: string,
                                                                       location: string,
                                                                       matcheddata: array < string >
                                                                          >
                                                                    >
                                                >,
                          nonterminatingmatchingrules: array <
                                                              struct <
                                                                  ruleid: string,
                                                                  action: string,
                                                                  overriddenaction: string,
                                                                  rulematchdetails: array <
                                                                                       struct <
                                                                                           conditiontype: string,
                                                                                           sensitivitylevel: string,
                                                                                           location: string,
                                                                                           matcheddata: array < string >
                                                                                              >
                                                                   >,
                                                                  challengeresponse: struct <
                                                                            responsecode: string,
                                                                            solvetimestamp: string
                                                                              >,
                                                                  captcharesponse: struct <
                                                                            responsecode: string,
                                                                            solvetimestamp: string
                                                                              >
                                                                    >
                                                             >,
                          excludedrules: string
                            >
                       >,
`rateBasedRuleList` array <
                         struct <
                             ratebasedruleid: string,
                             limitkey: string,
                             maxrateallowed: int
                               >
                          >,
  `nonTerminatingMatchingRules` array <
                                    struct <
                                        ruleid: string,
                                        action: string,
                                        rulematchdetails: array <
                                                             struct <
                                                                 conditiontype: string,
                                                                 sensitivitylevel: string,
                                                                 location: string,
                                                                 matcheddata: array < string >
                                                                    >
                                                             >,
                                        challengeresponse: struct <
                                                            responsecode: string,
                                                            solvetimestamp: string
                                                             >,
                                        captcharesponse: struct <
                                                            responsecode: string,
                                                            solvetimestamp: string
                                                             >
                                          >
                                     >,
  `requestHeadersInserted` array <
                                struct <
                                    name: string,
                                    value: string
                                      >
                                 >,
  `responseCodeSent` string,
  `httpRequest` struct <
                    clientip: string,
                    country: string,
                    headers: array <
                                struct <
                                    name: string,
                                    value: string
                                      >
                                 >,
                    uri: string,
                    args: string,
                    httpversion: string,
                    httpmethod: string,
                    requestid: string
                      >,
  `labels` array <
               struct <
                   name: string
                     >
                >,
  `CaptchaResponse` struct <
                        responsecode: string,
                        solvetimestamp: string,
                        failureReason: string
                          >,
  `ChallengeResponse` struct <
                        responsecode: string,
                        solvetimestamp: string,
                        failureReason: string
                        >,
  `ja3Fingerprint` string,
  `overSizeFields` string,
  `requestBodySize` int,
  `requestBodySizeInspectedByWAF` int
)
USING iceberg
TBLPROPERTIES ("format-version"="2")
""")
job.commit()

  1. Navigate to the Data Catalog and waf_logs_db database to confirm the table firehose_waf_logs is created.

Create a Firehose stream

Complete the following steps to create a Firehose stream:

  1. On the Data Firehose console, choose Create Firehose stream.

  1. Choose Direct PUT for Source and Apache Iceberg Tables for Destination.

  1. For Firehose stream name, enter aws-waf-logs-firehose-iceberg-1.
  1. In the Destination settings section, enable Inline parsing for routing information. Because we’re sending all records to one table, specify the destination database and table names:
    1. For Database expression, enter "waf_logs_db".
    2. For Table expression, enter "firehose_waf_logs".

Make sure to include double quotation marks to use the literal value for the database and table name. If you don’t use double quotation marks, Firehose assumes that this is a JSON query expression and will attempt to parse the expression when processing your stream and fail. Firehose can also route to different Apache Iceberg Tables based on the content of the data. For more information, refer to Route incoming records to different Iceberg Tables.

  1. For S3 backup bucket, enter the S3 bucket created by the CloudFormation template.
  2. For S3 backup bucket error output prefix, enter error/events-1/.

  1. Under Advanced settings, select Enable server-side encryption for source records in Firehose stream.

  1. For Existing IAM roles, choose the role that starts with WAF-Firehose-Iceberg-stack-FirehoseIAMRole-*, created by the CloudFormation template.
  2. Choose Create Firehose stream.

Configure AWS WAF logs to the Firehose stream

Complete the following steps to configure AWS WAF logs to the Firehose stream.

  1. On the AWS WAF console, choose Web ACLs in the navigation pane.

  1. Choose your web ACL.
  2. On the Logging and metrics tab, choose Enable.

  1. For Amazon Data Firehose stream, choose the stream aws-waf-logs-firehose-iceberg-1.
  2. Choose Save.

Query and analyze the logs

You can query the data you’ve written to your Apache Iceberg tables using different processing engines, such as Apache Spark, Apache Flink, or Trino. In this example, we use Athena to query AWS WAF logs data stored in Apache Iceberg tables. Complete the following steps:

  1. On the Athena console, choose Settings in the top right corner.
  2. For Location of query result, enter the S3 bucket created by the CloudFormation template

s3://<S3BucketName>/athena/

  1. Enter the AWS account ID for Expected bucket owner and choose save.

  1. In the query editor, in Tables and views, choose the options menu next to firehose_waf_logs and choose Preview Table.

You should be able to see the AWS WAF logs in the Apache Iceberg tables by using Athena.

The following are some additional useful example queries:

  • Identify potential attack sources by analyzing blocked IP addresses:
-- Top 10 blocked IP addresses
SELECT httpRequest.clientip, COUNT() as block_count
FROM waf_logs_db.firehose_waf_logs
WHERE action = 'BLOCK'
GROUP BY httpRequest.clientip
ORDER BY block_count DESC
LIMIT 10;
  • Monitor attack patterns and trends over time:
-- Rate of blocked requests over time
SELECT DATE_TRUNC('hour', FROM_UNIXTIME(timestamp/1000)) as hour,
       COUNT() as request_count
FROM waf_logs_db.firehose_waf_logs
WHERE action = 'BLOCK'
GROUP BY DATE_TRUNC('hour', FROM_UNIXTIME(timestamp/1000))
ORDER BY hour;

Apache Iceberg table optimization

Although Firehose enables efficient streaming of AWS WAF logs into Apache Iceberg tables, the nature of streaming writes can result in many small files being created. This is because Firehose delivers data based on its buffering configuration, which can lead to suboptimal query performance. To address this, regular table optimization is recommended.

There are two recommended table optimization approaches:

  • Compaction – Data compaction merges small data files to reduce storage usage and improve read performance. Data files are merged and rewritten to remove obsolete data and consolidate fragmented data into larger, more efficient files.
  • Storage optimization – You can manage storage overhead by removing older, unnecessary snapshots and their associated underlying files. Additionally, this includes periodically deleting orphan files to maintain efficient storage utilization and optimal query performance.

These optimizations can be implemented using either the Data Catalog or Athena.

Table optimization using the Data Catalog

The Data Catalog provides automatic table optimization features. Within the table optimization feature, you can configure specific optimizers for compaction, snapshot retention, and orphan file deletion. A table optimization schedule can be managed and status can be monitored from the AWS Glue console.

Table optimization using Athena

Athena supports manual optimization through SQL commands. The OPTIMIZE command rewrites small files into larger files and applies file compaction:

OPTIMIZE waf_logs_db.firehose_waf_logs REWRITE DATA USING BIN_PACK 

The VACUUM command removes old snapshots and cleans up expired data files:

ALTER TABLE waf_logs_db.firehose_waf_logs SET TBLPROPERTIES (
  'vacuum_max_snapshot_age_seconds'='259200'
)
VACUUM waf_logs_db.firehose_waf_logs

You can monitor the table’s optimization status using the following query:

SELECT * FROM "waf_logs_db"."firehose_waf_logs$files"

Clean up

To avoid future charges, complete the following steps:

  1. Empty the S3 bucket.
  2. Delete the CloudFormation stack.
  3. Delete the Firehose stream.
  4. Disable AWS WAF logging.

Conclusion

In this post, we demonstrated how to build an AWS WAF log analytics pipeline using Firehose to deliver AWS WAF logs to Apache Iceberg tables on Amazon S3. The solution handles large-scale AWS WAF log processing without requiring complex code or infrastructure management. Although this post focused on Apache Iceberg tables as the destination, Data Firehose also seamlessly integrates with Amazon S3 tables. To optimize your tables for querying, Amazon S3 Tables continuously performs automatic maintenance operations, such as compaction, snapshot management, and unreferenced file removal. These operations increase table performance by compacting smaller objects into fewer, larger files.

To get started with your own implementation, try the solution in your AWS account and explore the following resources for additional features and best practices:


About the Authors

Charishma Makineni is a Senior Technical Account Manager at AWS. She provides strategic technical guidance for Independent Software Vendors (ISVs) to build and optimize solutions on AWS. She specializes in Big Data and Analytics technologies, helping organizations optimize their data-driven initiatives on AWS.

Phaneendra Vuliyaragoli is a Product Management Lead for Amazon Data Firehose at AWS. In this role, Phaneendra leads the product and go-to-market strategy for Amazon Data Firehose.

Top 6 game changers from AWS that redefine streaming data

Post Syndicated from Sai Maddali original https://aws.amazon.com/blogs/big-data/top-6-game-changers-from-aws-that-redefine-streaming-data/

Recently, AWS introduced over 50 new capabilities across its streaming services, significantly enhancing performance, scale, and cost-efficiency. Some of these innovations have tripled performance, provided 20 times faster scaling, and reduced failure recovery times by up to 90%. We have made it nearly effortless for customers to bring real-time context to AI applications and lakehouses.

In this post, we discuss the top six game changers that will redefine AWS streaming data.

Amazon MSK Express brokers: Kafka reimagined for AWS

AWS offers Express brokers for Amazon Managed Streaming for Apache Kafka (Amazon MSK)—a transformative breakthrough for customers needing high-throughput Kafka clusters that scale faster and cost less. With Express brokers, we are reimagining Kafka’s compute and storage decoupling to unlock performance and elasticity benefits. Express brokers offer up to three times more throughput than a comparable standard Apache Kafka broker, virtually unlimited storage, instant storage scaling, compute scaling in minutes vs. hours, and 90% faster recovery from failures compared to standard Kafka brokers. Customers can provision capacity in minutes without complex calculations, benefit from preset Kafka configurations, and scale capacity in a few clicks. Express brokers provide the same low-latency performance as standard Kafka, are 100% native Kafka, and offer key Amazon MSK features. There are no storage limits per broker and you only pay for the storage you use. With Express brokers for Amazon MSK, enterprises can expand their Kafka usage to support even more mission-critical use cases, while keeping both operational overhead and overall infrastructure costs low.

Amazon Kinesis Data Streams On-Demand: Scaling new heights

Amazon Kinesis Data Streams On-Demand makes it uncomplicated for developers to stream gigabytes per second of data without managing capacity or servers. Developers can create a new on-demand data stream or convert an existing data stream to on-demand mode with a single click. Kinesis Data Streams On-Demand now automatically scales to 10 GBps of write throughput and 200 GBps of read throughput per stream, a fivefold increase. Customers will automatically get this fivefold increase in scale without the need to take any action.

Streaming data to Iceberg tables in lakehouses

Enterprises are embracing lakehouses and open table formats such as Apache Iceberg to unlock value from their data. Amazon Data Firehose now supports seamless integration with Iceberg tables on Amazon Simple Storage Service (Amazon S3). Customers can stream data into Iceberg tables in Amazon S3 without any management overhead. Data Firehose compacts small files, minimizing storage inefficiencies and enhancing read performance. Data Firehose also handles schema changes while in flight, to provide consistency across evolving datasets. Because Data Firehose is fully managed and serverless, it scales seamlessly to handle high throughput streaming workloads, providing reliable and fast delivery of data. This capability also makes it straightforward to stream data stored in MSK topics and Kinesis data streams into Iceberg tables, potentially eliminating the need for custom extract, transform, and load (ETL) pipelines. Customers can now bring the power of real-time data to Iceberg tables without any additional effort—a paradigm shift for businesses. Additionally, Kinesis Data Firehose serves as a versatile bridge to stream real-time data from MSK clusters and Kinesis Data Streams into the newly launched Amazon S3 Tables and Amazon SageMaker Lakehouse. This unified approach facilitates more effective data management and analysis, supporting data-driven decision-making across the enterprise.

Unlocking the value of data stored in databases with change replication to Iceberg tables

Delivering database changes into Iceberg tables is emerging as a common pattern. Now in public preview, Data Firehose supports capturing changes made in databases such as PostgreSQL and MySQL and replicating the updates to Iceberg tables on Amazon S3. The integration uses change data capture (CDC) to continuously deliver database updates, eliminating manual processes and reducing operational overhead. Data Firehose automates tasks such as schema alignment and partitioning, making sure tables are optimized for analytics. With this new capability, customers can streamline their end-to-end data pipeline, allowing them to continually feed fresh data into an Iceberg table without needing to build a custom data pipeline.

Real-time context to generative AI applications

Customers tell us how they want to gain insights from generative AI by being able to bring their data to large language models (LLMs). They want to bring data as it’s generated to pre-trained models for more accurate and up-to-date responses. Amazon MSK provides a blueprint that allows customers to combine the context from real-time data with the powerful LLMs on Amazon Bedrock to generate accurate, up-to-date AI responses without writing custom code. Developers can configure the blueprint to generate vector embeddings using Amazon Bedrock embedding models, then index those embeddings in Amazon OpenSearch Service for data captured and stored in MSK topics. Customers can also improve the efficiency of data retrieval using built-in support for data chunking techniques from LangChain, an open source library, supporting high-quality inputs for model ingestion.

More cost-effective and reliable stream processing

AWS offers the Kinesis Client Library (KCL), an open source library, that simplifies the development of stream processing applications with Kinesis Data Streams. With KCL 3.0, customers can reduce compute costs to process streaming data by up to 33% compared to previous KCL versions. KCL 3.0 introduces an enhanced load balancing algorithm that continuously monitors the resource utilization of the stream processing workers and automatically redistributes the load from over-utilized workers to underutilized workers. These changes also enhance scalability and the overall efficiency of processing large volumes of streaming data. We have also made improvements to our Amazon Managed Service for Apache Flink. We offer the latest Flink versions on Amazon Managed Service for Apache Flink for customers to benefit from the latest innovations. Customers can also upgrade their existing applications to use new Flink versions with a new in-place version upgrade feature. Amazon Managed Service for Apache Flink now offers per-second billing, so customers can run their Flink applications for a short period and only pay for what they use, down to the nearest second.

Conclusion

AWS has made new innovations in data streaming services, bringing compelling value to customers on performance, scalability, elasticity, and ease of use. These advancements empower businesses to use real-time data more effectively, which modernizes the way for the next generation of data-driven applications and analytics. It is still Day 1!


About the authors

Sai Maddali is a Senior Manager Product Management at AWS who leads the product team for Amazon MSK. He is passionate about understanding customer needs, and using technology to deliver services that empowers customers to build innovative applications. Besides work, he enjoys traveling, cooking, and running.

Bill Crew is a Senior Product Marketing Manager. He is the lead marketer for Streaming and Messaging Services at AWS. Including Amazon Managed Streaming for Apache Kafka (Amazon MSK), Amazon Managed Service for Apache Flink, Amazon Data Firehose, Amazon Kinesis Data Streams, Amazon Message Broker (Amazon MQ), Amazon Simple Queue Service (Amazon SQS), and Amazon Simple Notification Services (Amazon SNS). Besides work, he enjoys collecting vintage vinyl records.

Replicate changes from databases to Apache Iceberg tables using Amazon Data Firehose (in preview)

Post Syndicated from Sébastien Stormacq original https://aws.amazon.com/blogs/aws/replicate-changes-from-databases-to-apache-iceberg-tables-using-amazon-data-firehose/

Today, we’re announcing the availability, in preview, of a new capability in Amazon Data Firehose that captures changes made in databases such as PostgreSQL and MySQL and replicates the updates to Apache Iceberg tables on Amazon Simple Storage Service (Amazon S3).

Apache Iceberg is a high-performance open-source table format for performing big data analytics. Apache Iceberg brings the reliability and simplicity of SQL tables to S3 data lakes and makes it possible for open source analytics engines such as Apache Spark, Apache Flink, Trino, Apache Hive, and Apache Impala to concurrently work with the same data.

This new capability provides a simple, end-to-end solution to stream database updates without impacting transaction performance of database applications. You can set up a Data Firehose stream in minutes to deliver change data capture (CDC) updates from your database. Now, you can easily replicate data from different databases into Iceberg tables on Amazon S3 and use up-to-date data for large-scale analytics and machine learning (ML) applications.

Typical Amazon Web Services (AWS) enterprise customers use hundreds of databases for transactional applications. To perform large scale analytics and ML on the latest data, they want to capture changes made in databases, such as when records in a table are inserted, modified, or deleted, and deliver the updates to their data warehouse or Amazon S3 data lake in open source table formats such as Apache Iceberg.

To do so, many customers develop extract, transform, and load (ETL) jobs to periodically read from databases. However, ETL readers impact database transaction performance, and batch jobs can add several hours of delay before data is available for analytics. To mitigate impact on database transaction performance, customers want the ability to stream changes made in the database. This stream is referred to as a change data capture (CDC) stream.

I met multiple customers that use open source distributed systems, such as Debezium, with connectors to popular databases, an Apache Kafka Connect cluster, and Kafka Connect Sink to read the events and deliver them to the destination. The initial configuration and test of such systems involves installing and configuring multiple open source components. It might take days or weeks. After setup, engineers have to monitor and manage clusters, and validate and apply open source updates, which adds to the operational overhead.

With this new data streaming capability, Amazon Data Firehose adds the ability to acquire and continually replicate CDC streams from databases to Apache Iceberg tables on Amazon S3. You set up a Data Firehose stream by specifying the source and destination. Data Firehose captures and continually replicates an initial data snapshot and then all subsequent changes made to the selected database tables as a data stream. To acquire CDC streams, Data Firehose uses the database replication log, which reduces impact on database transaction performance. When the volume of database updates increases or decreases, Data Firehose automatically partitions the data, and persists records until they’re delivered to the destination. You don’t have to provision capacity or manage and fine-tune clusters. In addition to the data itself, Data Firehose can automatically create Apache Iceberg tables using the same schema as the database tables as part of the initial Data Firehose stream creation and automatically evolve the target schema, such as new column addition, based on source schema changes.

Since Data Firehose is a fully managed service, you don’t have to rely on open source components, apply software updates, or incur operational overhead.

The continual replication of database changes to Apache Iceberg tables in Amazon S3 using Amazon Data Firehose provides you with a simple, scalable, end-to-end managed solution to deliver CDC streams into your data lake or data warehouse, where you can run large-scale analysis and ML applications.

Let’ see how to configure a new pipeline
To show you how to create a new CDC pipeline, I setup a Data Firehose stream using the AWS Management Console. As usual, I also have the choice to use the AWS Command Line Interface (AWS CLI), AWS SDKs, AWS CloudFormation, or Terraform.

For this demo, I choose a MySQL database on Amazon Relational Database Service (Amazon RDS) as source. Data Firehose also works with self-managed databases on Amazon Elastic Compute Cloud (Amazon EC2). To establish connectivity between my virtual private cloud (VPC)—where the database is deployed—and the RDS API without exposing the traffic to the internet, I create an AWS PrivateLink VPC service endpoint. You can learn how to create a VPC service endpoint for RDS API by following instructions in the Amazon RDS documentation.

I also have an S3 bucket to host the Iceberg table, and I have an AWS Identity and Access Management (IAM) role setup with correct permissions. You can refer to the list of prerequisites in the Data Firehose documentation.

To get started, I open the console and navigate to the Amazon Data Firehose section. I can see the stream already created. To create a new one, I select Create Firehose stream.

Create Firehose Stream

I select a Source and Destination. In this example: a MySQL database and Apache Iceberg Tables. I also enter a Firehose stream name for my stream.

Create Firehose Stream - screen 1

I enter the fully qualified DNS name of my Database endpoint and the Database VPC endpoint service name. I verify that Enable SSL is checked and, under Secret name, I select the name of the secret in AWS Secrets Manager where the database username and password are securely stored.

Create Firehose Stream - screen 2

Next, I configure Data Firehose to capture specific data by specifying databases, tables, and columns using explicit names or regular expressions.

I must create a watermark table. A watermark, in this context, is a marker used by Data Firehose to track the progress of incremental snapshots of database tables. It helps Data Firehose identify which parts of the table have already been captured and which parts still need to be processed. I can create the watermark table manually or let Data Firehose automatically create it for me. In that case, the database credentials passed to Data Firehose must have permissions to create a table in the source database.

Create Firehose Stream - screen 3

Next, I configure the S3 bucket Region and name to use. Data Firehose can automatically create the Iceberg tables when they don’t exist yet. Similarly, it can update the Iceberg table schema when detecting a change in your database schema.

Create Firehose Stream - screen 4

As a final step, it’s important to enable Amazon CloudWatch error logging to get feedback about the stream progress and the eventual errors. You can configure a short retention period on the CloudWatch log group to reduce the cost of log storage.

After having reviewed my configuration, I select Create Firehose stream.

Create Firehose Stream - screen 5

Once the stream is created, it will start to replicate the data. I can monitor the stream’s status and check for eventual errors.

Create Firehose Stream - screen 6

Now, it’s time to test the stream.

I open a connection to the database and insert a new line in a table.

Firehose - MySQL

Then, I navigate to the S3 bucket configured as the destination and I observe that a file has been created to store the data from the table.

View parquet files on S3 bucket

I download the file and inspect its content with the parq command (you can install that command with pip install parquet-cli)

Parquet file content

Of course, downloading and inspecting Parquet files is something I do only for demos. In real life, you’re going to use AWS Glue and Amazon Athena to manage your data catalog and to run SQL queries on your data.

Things to know
Here are a few additional things to know.

This new capability supports self-managed PostgreSQL and MySQL databases on Amazon EC2 and the following databases on Amazon RDS:

The team will continue to add support for additional databases during the preview period and after general availability. They told me they are already working on supporting SQL Server, Oracle, and MongoDB databases.

Data Firehose uses AWS PrivateLink to connect to databases in your Amazon Virtual Private Cloud (Amazon VPC).

When setting up an Amazon Data Firehose delivery stream, you can either specify specific tables and columns or use wildcards to specify a class of tables and columns. When you use wildcards, if new tables and columns are added to the database after the Data Firehose stream is created and if they match the wildcard, Data Firehose will automatically create those tables and columns in the destination.

Pricing and availability
The new data streaming capability is available today in all AWS Regions except China Regions, AWS GovCloud (US) Regions, and Asia Pacific (Malaysia) Regions. We want you to evaluate this new capability and provide us with feedback. There are no charges for your usage at the beginning of the preview. At some point in the future, it will be priced based on your actual usage, for example, based on the quantity of bytes read and delivered. There are no commitments or upfront investments. Make sure to read the pricing page to get the details.

Now, go configure your first continual database replication to Apache Iceberg tables on Amazon S3 and visit http://aws.amazon.com/firehose.

— seb

Ingest telemetry messages in near real time with Amazon API Gateway, Amazon Data Firehose, and Amazon Location Service

Post Syndicated from Srini Ponnada original https://aws.amazon.com/blogs/big-data/ingest-telemetry-messages-in-near-real-time-with-amazon-api-gateway-amazon-data-firehose-and-amazon-location-service/

Many organizations specializing in communications and navigation surveillance technologies are required to support multi-modal transportation supply chain markets such as road, water, air, space, and rail. One common use case is provisioning of emergency alerts services for multiple government agencies.

These organizations use third-party satellite-powered terminal devices for remote monitoring using telemetry and NMEA-0183 formatted messages generated in near real time. This post demonstrates how to implement a satellite-based remote alerting and response solution on the AWS Cloud to provide time-critical alerts and actionable insights, with a focus on telemetry message ingestion and alerts. Key services in the solution include Amazon API Gateway, Amazon Data Firehose, and Amazon Location Service.

The challenge

In the event of a disaster e.g. water flood, there is usually a lack of terrestrial data connectivity that prevents monitoring stations from taking actionable measures in real time. In the space analytics domain, many organizations deploy satellite-powered terminals on these monitoring stations.

These terminal devices transmit telemetry and NMEA-0183 formatted messages to a satellite network managed by a third-party entity, which is subsequently traversed down to an API endpoint.

Our AWS-powered solution aims to capture, enrich, and ingest satellite-powered telemetry messages as well as deliver alerts in near real time. This solution is based on AWS serverless services such as API Gateway, Data Firehose, and Amazon Simple Storage Service (Amazon S3), and is able to scale to more than a million terminal devices transmitting an hourly state of health telemetry message over the satellite.

Solution overview

This telemetry message processing begins with an API endpoint created using API Gateway, securing HTTPS transmission over a satellite network. This endpoint receives raw JSON messages and responds with an HTTP 200 success code. We take advantage of the direct integration between API Gateway and Data Firehose to ingest these messages into Amazon S3 in near real time. The default message reception limit on an API Gateway endpoint is 10,000 messages per second, which can be increased upon request.

Upon receiving messages through API Gateway, Data Firehose batches them into 60-second intervals or 1 MB size files, whichever comes first, and delivers them to Amazon S3. This configuration enables near real-time processing, which is essential for timely alerts and responses. We use the built-in features of Data Firehose, including AWS Lambda for necessary data transformation and Amazon Simple Notification Service (Amazon SNS) for near real-time alerts. Additionally, Data Firehose converts JSON data to Parquet format before delivering it to Amazon S3, optimizing data consumption by tools like Amazon Athena, which are ideal for partitioned data formats.

To maintain up-to-date data, an AWS Glue crawler reads and updates the AWS Glue Data Catalog from transformed Parquet files. This crawler runs one time a day by default to optimize costs, but you can adjust its schedule to meet varying end-user requirements.

We use an AWS CloudFormation template to implement the solution architecture, as illustrated in the following diagram.

Cloudformation template to implement the solution architecture

Cloudformation template to implement the solution architecture

For this post, we deliver sample JSON formatted telemetry messages to an API Gateway endpoint test interface to simulate the satellite-powered terminal device functionality. API Gateway integrates with Data Firehose, which uses Lambda to perform the following actions in near real time:

  1. Parse the message and decode the data blob from base64 encoding to utf-8. Most third-party satellite-powered terminal devices transmit messages in an encoded format and require decoding to a standard readable format such as utf-8.
  2. Use Amazon Location and append with location specifics (such as street, city, and ZIP) based on the latitude and longitude of the terminal device.
  3. Detect if the solar panel battery of the terminal device is lower than the defined threshold and generate an alert through Amazon SNS to the user-provided email address. For simplicity, the CloudFormation template creates an SNS topic within the same account instead of a cross-account consumer application. You must subscribe to the topic using an email received at the provided email address.
  4. Ingest the messages in an S3 bucket received in 1 minute or aggregate to 1 MB size files.

The solution uses the following key services:

  • Amazon API Gateway – API Gateway is a fully managed service that makes it straightforward developers to create, publish, maintain, monitor, and secure APIs at any scale. APIs act as the entry point for applications to access data, business logic, or functionality from your backend services.
  • Amazon Data Firehose – Data Firehose is an extract, transform, and load (ETL) service that reliably captures, transforms, and delivers streaming data to data lakes, data stores, and analytics services.
  • AWS Glue – The AWS Glue Data Catalog is your persistent technical metadata store in the AWS Cloud. Each AWS account has one Data Catalog per AWS Region. Each Data Catalog is a highly scalable collection of tables organized into databases. A table is metadata representation of a collection of structured or semi-structured data stored in sources such as Amazon Relational Database Service (Amazon RDS), Apache Hadoop Distributed File System (HDFS), Amazon OpenSearch Service, and others.
  • IAM – With AWS Identity and Access Management (IAM), you can specify who or what can access services and resources in AWS, centrally manage fine-grained permissions, and analyze access to refine permissions across AWS.
  • AWS Lambda – Lambda is a serverless, event-driven compute service that lets you run code for virtually any type of application or backend service without provisioning or managing servers. You can invoke Lambda functions from over 200 AWS services and software as a service (SaaS) applications, and only pay for what you use.
  • Amazon Location Service – Location Service makes it straightforward for developers to add location functionality, such as maps, points of interest, geocoding, routing, tracking, and geofencing, to their applications without sacrificing data security and user privacy.
  • Amazon S3 – Amazon S3 is an object storage service offering industry-leading scalability, data availability, security, and performance. Customers of all sizes and industries can store and protect any amount of data for virtually any use case, such as data lakes, cloud-centered applications, and mobile apps.
  • Amazon SNS – Amazon SNS sends notifications two ways: application-to-application (A2A) and application-to-person (A2P). A2A provides high-throughput, push-based, many-to-many messaging between distributed systems, microservices, and event-driven serverless applications. These applications include Amazon Simple Queue Service (SQS), Data Firehose, Lambda, and other HTTPS endpoints. A2P functionality lets you send messages to your customers with SMS texts, push notifications, and email.

Deploy the solution

AWS CloudFormation creates the API Gateway endpoint, Data Firehose delivery stream, Lambda function, Amazon Location index, SNS topic, S3 bucket, and AWS Glue database, table, and crawler. To deploy the solution, launch the CloudFormation stack and provide the following parameters:

  • S3 bucket name – The bucket that stores terminal device messages ingested in near real time by the Data Firehose delivery stream
  • Email address – The email of the user to subscribe for SNS alerts
  • Database name – The name of the AWS Glue database

Test the solution

The following is a sample JSON state of health telemetry message transmitted by a terminal device:

{
  "packetId": 29957891,
  "deviceType": 1,
  "deviceId": 6113,
  "userApplicationId": 65535,
  "organizationId": 65681,
  "data": "eyJsbiI6LTEwNC45NTUsInNpIjowLjAsImJpIjowLjIxMiwic3YiOjAuMDA4LCJsdCI6MzkuNTc1MiwiYnYiOjMuNzI4LCJkIjoxNjU4NzQ1MzM2LCJuIjo2NjksImEiOjE3MzguMCwicyI6NS4wLCJjIjozMjAuMCwiciI6LTEwMSwidGkiOjAuMDM2fQ==",
  "len": 142,
  "status": 0,
  "hiveRxTime": "2022-07-25T13:03:29"
}

The data blob in the preceding sample telemetry message is encoded in base64. The following chart explains the metadata of each key indicating state of health and location of the terminal device.

Parameter Key Sample Value Notes
Longitude ln -104.955 Negative = Westing from PM
Solar Panel Current si 0.176 (Amps)
Battery Current bi 0.228 (Amps)
Solar Panel Voltage sv 19.088 (Volts)
Latitude lt 39.5751 Positive = Northing from Equator
Battery Voltage bv 4.12 (Volts) Full charge ~4.12V Dead ~ 3.3V
Date and Time d 1658248415 Epoch Seconds
Number of Messages Sent Since Last Power Cycle n 531
Altitude a 1721.0 (Meters) GPS value
Speed s 1.0 (km/h) Stationary terminal reports non-zero value
Course: c 139.0 (degrees) Nautical heading convention
Last RSSI Value r -100 (dBm) >-90 = marginal link.
Modem Current ti 0.04 (Amps)

These telemetry messages can vary based on the default configuration of the device terminal manufacturer or user definitions.

To demonstrate the capability of the solution, we send the sample telemetry message to the API Gateway endpoint through its test interface, as shown in the following screenshot.

sample telemetry message

Sending sample telemetry message

After about a minute, you should see the delivered message to Amazon S3 through Data Firehose in the stage folder.

delivered message to Amazon S3

Delivered message to Amazon S3

You should also receive an SNS alert at the provided email address.

SNS alert message

SNS alert message

To see the results in Athena, we crawl this data with the AWS Glue crawler created by the CloudFormation template. By default, the crawler is scheduled daily to reflect newer records for the day in the stage table.

AWS Glue crawler execution

AWS Glue crawler execution

After the data is crawled successfully, you can query the results in Athena.

Query the results in Athena

Query results in Athena

Best practices and considerations

Keep in mind the following best practices when implementing this solution:

  • Make sure API Gateway is protected using an API key or other authorization method
  • Adhere to the least privilege principle for all created users and roles to mitigate potential security breaches
  • Conduct load testing of the solution using an API simulator tailored to your specific use case
  • Automate the solution using the AWS Cloud Development Kit (AWS CDK), AWS CloudFormation, or your preferred infrastructure as code (IaC) tools

Additionally, Data Firehose now supports zero buffering. For more information, refer to Amazon Kinesis Data Firehose now supports zero buffering.

Conclusion

In this post, we provided a proof of concept to implement a satellite-based remote alerting and response solution to provide time-critical alerts and actionable insights, for use cases in the space analytics domain. Make sure to adhere to AWS best practices and your organizational security policies before deploying this solution in a production environment.

Try out the solution for your own use case, and let us know your feedback and questions in the comments section.


About the authors

Srini Ponnada is a Sr. Data Architect at AWS. He has helped customers build scalable data warehousing and big data solutions for over 20 years. He loves to design and build efficient end-to-end solutions on AWS. In his spare time, he loves walking, and playing Tennis.

Munim Abbasi is currently a Sr. Data Architect at AWS with more than ten years of experience in Data & Analytics domain. Leveraging his core competencies in data architecture, design and engineering, he strives to make his customers empowered through their data by helping them deploy scalable cloud solutions adhering to AWS best practices. Outside of work, he holds great love for music, strength training and family.

Vivek Shrivastava is a Principal Data Architect, Data Lake in AWS Professional Services. He is a big data enthusiast and holds 14 AWS Certifications. He is passionate about helping customers build scalable and high-performance data analytics solutions in the cloud. In his spare time, he loves reading and finds areas for home automation.

Stream real-time data into Apache Iceberg tables in Amazon S3 using Amazon Data Firehose

Post Syndicated from Diego Garcia Garcia original https://aws.amazon.com/blogs/big-data/stream-real-time-data-into-apache-iceberg-tables-in-amazon-s3-using-amazon-data-firehose/

As businesses generate more data from a variety of sources, they need systems to effectively manage that data and use it for business outcomes—such as providing better customer experiences or reducing costs. We see these trends across many industries—online media and gaming companies providing recommendations and customized advertising, factories monitoring equipment for maintenance and failures, theme parks providing wait times for popular attractions, and many others.

To build such applications, engineering teams are increasingly adopting two trends. First, they’re replacing batch data processing pipelines with real-time streaming, so applications can derive insight and take action within seconds instead of waiting for daily or hourly batch exchange, transform, and load (ETL) jobs. Second, because traditional data warehousing approaches are unable to keep up with the volume, velocity, and variety of data, engineering teams are building data lakes and adopting open data formats such as Parquet and Apache Iceberg to store their data. Iceberg brings the reliability and simplicity of SQL tables to Amazon Simple Storage Service (Amazon S3) data lakes. By using Iceberg for storage, engineers can build applications using different analytics and machine learning frameworks such as Apache Spark, Apache Flink, Presto, Hive, or Impala, or AWS services such as Amazon SageMaker, Amazon Athena, AWS Glue, Amazon EMR, Amazon Managed Service for Apache Flink, or Amazon Redshift.

Iceberg is popular because first, it’s widely supported by different open-source frameworks and vendors. Second, it allows customers to read and write data concurrently using different frameworks. For example, you can write some records using a batch ETL Spark job and other data from a Flink application at the same time and into the same table. Third, it allows scenarios such as time travel and rollback, so you can run SQL queries on a point-in-time snapshot of your data, or rollback data to a previously known good version. Fourth, it supports schema evolution, so when your applications evolve, you can add new columns to your tables without having to rewrite data or change existing applications. To learn more, see Apache Iceberg.

In this post, we discuss how you can send real-time data streams into Iceberg tables on Amazon S3 by using Amazon Data Firehose. Amazon Data Firehose simplifies the process of streaming data by allowing users to configure a delivery stream, select a data source, and set Iceberg tables as the destination. Once set up, the Firehose stream is ready to deliver data. Firehose is integrated with over 20 AWS services, so you can deliver real-time data from Amazon Kinesis Data Streams, Amazon Managed Streaming for Apache Kafka, Amazon CloudWatch Logs, AWS Internet of Things (AWS IoT), AWS WAF, Amazon Network Firewall Logs, or from your custom applications (by invoking the Firehose API) into Iceberg tables. It’s cost effective because Firehose is serverless, you only pay for the data sent and written to your Iceberg tables. You don’t have to provision anything or pay anything when your streams are idle during nights, weekends, or other non-use hours.

Firehose also simplifies setting up and running advanced scenarios. For example, if you want to route data to different Iceberg tables to have data isolation or better query performance, you can set up a stream to automatically route records into different tables based on what’s in your incoming data and distribute records from a single stream into dozens of Iceberg tables. Firehose automatically scales—so you don’t have to plan for how much data goes into which table—and has built-in mechanisms to handle delivery failures and guarantee exactly once delivery. Firehose supports updating and deleting records in a table based on the incoming data stream, so you can support scenarios such as GDPR and right-to-forget regulations. Because Firehose is fully compatible with Iceberg, you can write data using it and simultaneously use other applications to read and write to the same tables. Firehose integrates with the AWS Glue Data Catalog, so you can use features in AWS Glue such as managed compaction for Iceberg tables.

In the following sections, you’ll learn how to set up Firehose to deliver real-time streams into Iceberg tables to address four different scenarios:

  1. Deliver data from a stream into a single Iceberg table and insert all incoming records.
  2. Deliver data from a stream into a single Iceberg table and perform record inserts, updates, and deletes.
  3. Route records to different tables based on the content of the incoming data by specifying a JSON Query expression.
  4. Route records to different tables based on the content of the incoming data by using a Lambda function.

You will also learn how to query the data you have delivered to Iceberg tables using a standard SQL query in Amazon Athena. All of the AWS services used in these examples are serverless, so you don’t have to provision and manage any infrastructure.

Solution overview

The following diagram illustrates the architecture.

In our examples, we use Kinesis Data Generator, a sample application to generate and publish data streams to Firehose. You can also set up Firehose to use other data sources for your real-time streams. We set up Firehose to deliver the stream into Iceberg tables in the Data Catalog.

Walkthrough

This post includes an AWS CloudFormation template for a quick setup. You can review and customize it to suit your needs. The template performs the following operations:

  • Creates a Data Catalog database for the destination Iceberg tables
  • Creates four tables in the AWS Glue database that are configured to use the Apache Iceberg format
  • Specifies the S3 bucket locations for the destination tables
  • Creates a Lambda function (optional)
  • Sets up an AWS Identity and Access Management (IAM) role for Firehose
  • Creates resources for Kinesis Data Generator

Prerequisites

For this walkthrough, you should have the following prerequisites:

  • An AWS account. If you don’t have an account, you can create one.

Deploy the solution

The first step is to deploy the required resources into your AWS environment by using a CloudFormation template.

  1. Sign in to the AWS Management Console for CloudFormation.
  2. Choose Launch Stack.
    Launch Cloudformation Stack
  3. Choose Next.
  4. Leave the stack name as Firehose-Iceberg-Stack, and in the parameters, enter the username and password that you want to use for accessing Kinesis Data Generator.
  5. Go to the bottom of the page and select I acknowledge that AWS CloudFormation might create IAM resources and choose Next.

  6. Review the deployment and choose Submit.

The stack can take 5–10 minutes to complete, after which you can view the deployed stack on the CloudFormation console. The following figure shows the deployed Firehose-Iceberg-stack details.

Before you set up Firehose to deliver streams, you must create the destination tables in the Data Catalog. For the examples discussed here, we use the CloudFormation template to automatically create the tables used in the examples. For your custom applications, you can create your tables using CloudFormation, or by using DDL commands in Athena or Glue. The following is the DDL command for creating a table used in our example:

CREATE TABLE firehose_iceberg_db.firehose_events_1 (
type struct<device: string, event: string, action: string>,
customer_id string,
event_timestamp timestamp,
region string)
LOCATION 's3://firehose-demo-iceberg-<account_id>-<region>/iceberg/events_1'
TBLPROPERTIES (
'table_type'='iceberg',
'write_compression'='zstd'
);

Also note that the four tables that we use in the examples have the same schema, but you can have tables with different schemas in your application.

Use case 1: Deliver data from a stream into a single Iceberg table and insert all incoming records

Now that you have set up the source for your data stream and the destination tables, you’re ready to set up Firehose to deliver streams into the Iceberg tables.

Create a Firehose stream:

  1. Go to the Data Firehose console and choose Create Firehose stream.
  2. Select Direct PUT as the Source and Apache Iceberg Tables as the Destination.

This example uses Direct PUT as the source, but the same steps can be applied for other Firehose sources such as Kinesis Data Streams, and Amazon MSK.

  1. For the Firehose stream name, enter firehose-iceberg-events-1.
  2. In Destination settings, enable Inline parsing for routing information. Because all records from the stream are inserted into a single destination table, you specify a destination database and table. By default, Firehose inserts all incoming records into the specified destination table.
    1. Database expression: “firehose_iceberg_db
    2. Table expression: “firehose_events_1

Include double quotation marks to use the literal value for the database and table name. If you do not use double quotations marks, Firehose assumes that this is a JSON Query expression and will attempt to parse the expression when processing your stream and fail.

  1. Go to Buffer hints and reduce the Buffer size to 1 MiB and the Buffer interval to 60 You can fine tune these settings for your application.
  2. For Backup settings:
    • Select the S3 bucket created by the CloudFormation template. It has the following structure: s3://firehose-demo-iceberg-<account_id>-<region>
    • For error output prefix enter: error/events-1/

  3. In Advanced settings, enable CloudWatch error logging, and in Existing IAM roles, select the role that starts with Firehose-Iceberg-Stack-FirehoseIamRole-*, created by the CloudFormation template.
  4. Choose Create Firehose stream.

Generate streaming data:

Use Kinesis Data Generator to publish data records into your Firehose stream.

  1. Go to the CloudFormation stack, select the Nested stack for the generator, and choose Outputs.
  2. Choose the KinesisDataGenerator URL and enter the credentials that you defined when deploying the CloudFormation stack.
  3. Select the AWS Region where you deployed the CloudFormation stack and select your Firehose stream.
  4. For template, replace the values on the screen with the following:
    {
    "type": {
    "device": "{{random.arrayElement(["mobile", "desktop", "tablet"])}}",
    "event": "{{random.arrayElement(["firehose_events_1", "firehose_events_2"])}}",
    "action": "update"
    },
    "customer_id": "{{random.number({ "min": 1, "max": 1500})}}",
    "event_timestamp": "{{date.now("YYYY-MM-DDTHH:mm:ss.SSS")}}",
    "region": "{{random.arrayElement(["pdx", "nyc"])}}"
    }

  5. Before sending data, choose Test template to see an example payload.
  6. Choose Send data.

Querying with Athena:

You can query the data you’ve written to your Iceberg tables using different processing engines such as Apache Spark, Apache Flink, or Trino. In this example, we will show you how you can use Athena to query data that you’ve written to Iceberg tables.

  1. Go to the Athena console.
  2. Configure a Location of query result. You can use the same S3 bucket for this but add a suffix at the end.
    s3://firehose-demo-iceberg-<account_id>-<region>/athena/

  3. In the query editor, in Tables and views, select the options button next to firehose_events_1 and select Preview Table.

You should be able to see data in the Apache Iceberg tables by using Athena.

With that, you ‘ve delivered data streams into an Apache Iceberg table using Firehose and run a SQL query against your data.

Now let’s explore the other scenarios. We will follow the same procedure as before for creating the Firehose stream and querying Iceberg tables with Amazon Athena.

Use case 2: Deliver data from a stream into a single Iceberg table and perform record inserts, updates, and deletes

One of the advantages of using Apache Iceberg is that it allows you to perform row-level operations such as updates and deletes on tables in a data lake. Firehose can be set up to automatically apply record update and delete operations in your Iceberg tables.

Things to know:

  • When you apply an update or delete operation through Firehose, the data in Amazon S3 isn’t actually deleted. Instead, a marker record is written according to the Apache Iceberg format specification to indicate that the record is updated or deleted, so subsequent read and write operations get the latest record. If you want to purge (remove the underlying data from Amazon S3) the deleted records, you can use tools developed for purging records in Apache Iceberg.
  • If you attempt to update a record using Firehose and the underlying record doesn’t already exist in the destination table, Firehose will insert the record as a new row.

Create a Firehose stream:

  1. Go to the Amazon Data Firehose console.
  2. Choose Create Firehose stream.
  3. For Source, select Direct PUT. For Destination select Apache Iceberg Tables.
  4. For the Firehose stream name, enter firehose-iceberg-events-2.
  5. In the e, enable inline parsing for routing information and provide the required values as static values for Database expression and Table expression. Because you want to be able to update records, you also need to specify the Operation expression.
    1. Database expression: “firehose_iceberg_db
    2. Table expression: “firehose_events_2
    3. Operation expression: “update

Include double quotation marks to use the literal value for the database and table name. If you do not use double quotations marks, Firehose assumes that this is a JSON Query expression and will attempt to parse the expression when processing your stream and fail.

  1. Because you want to perform update and delete operations, you need to provide the columns in the destination table that will be used as unique keys to identify the record in the destination to be updated or deleted.
    • For DestinationDatabaseName: “firehose_iceberg_db
    • For DestinationTableName: “firehose_events_2
    • In UniqueKeys, replace the existing value with: “customer_id

  2. Change the Buffer hints to 1 MiB and 60
  3. In Backup settings, select the same bucket from the stack, but enter the following in the error output prefix:
    error/events-2/

  4. In Advanced settings, enable CloudWatch Error logging and select the existing role of the stack and create the new Firehose stream.

Use Kinesis Data Generator to publish records into your Firehose stream. You might need to refresh the page or change regions so that it refreshes and shows the newly created delivery stream.

Don’t make any changes to the template and start sending data to the firehose-iceberg-events-2 stream.

Run the following query in Athena to see data in the firehose_events_2 table. Note that you can send updated records for the same unique key (same customer_id value) into your Firehose stream, and Firehose automatically applies record updates in the destination table. Thus, when you query data in Athena, you will see only one record for each unique value of customer_id, even if you have sent multiple updates into your stream.

SELECT customer_id, count(*) 
FROM "firehose_iceberg_db"."firehose_events_2" 
GROUP BY customer_id LIMIT 10;

Use case 3: Route records to different tables based on the content of the incoming data by specifying a JSON Query expression

Until now, you provided the routing and operation information as static values to perform operations on a single table. However, you can specify JSON Query expressions to define how Firehose should retrieve the destination database, destination table, and operation from your incoming data stream, and accordingly route the record and perform the corresponding operation. Based on your specification, Firehose automatically routes and delivers each record into the appropriate destination table and applies the corresponding operation.

Create a Firehose stream:

  1. Go back to the Amazon Data Firehose console.
  2. Choose Create Firehose Stream.
  3. For Source, select Direct PUT. For Destination, select Apache Iceberg Tables.
  4. For the Firehose stream name, enter firehose-iceberg-events-3.
  5. In Destination settings, enable Inline parsing for routing information.
    • For Database expression, provide the same value as before as a static string: “firehose_iceberg_db
    • For Table expression, retrieve this value from the nested incoming record using JSON Query.
      .type.event

    • For Operation expression, we will also retrieve this value from our nested record using JSON Query.
      .type.action

If you have the following incoming events with different event values, With the preceding JSON Query expressions, Firehose will parse and get “firehose_event_3” or “firehose_event_4” as the table names, and “update” as the intended operation from the incoming records.

{ "type": {   "device": "tablet",  
"event": "firehose_events_3",   "action": "update" },
"customer_id": "112", "event_timestamp": "2024-10-02T15:46:52.901",
"region": "pdx"}
{ "type": {   "device": "tablet",  
"event": "firehose_events_4",   "action": "update" },
"customer_id": "112", "event_timestamp": "2024-10-02T15:46:52.901",
"region": "pdx"}

  1. Because this is an update operation, you need to configure unique keys for each table. Also, because you want to deliver records to multiple Iceberg tables, you need to provide configurations for each of the two destination tables that records can be written to.
  2. Change the Buffer hints to 1 MiB and 60
  3. In Backup settings, select the same bucket from the stack, but in the error output prefix enter the following:
    error/events-3/

  4. In Advanced settings, select the existing IAM role created by the CloudFormation stack and create the new Firehose stream.
  5. In Kinesis Data Generator, refresh the page and select the newly created Firehose stream: firehose-iceberg-events-3

If you query the firehose_events_3 and firehose_events_4 tables using Athena, you should find the data routed to right tables by Firehose using the routing information retrieved using JSON Query expressions.

Table below showing  events with event “firehose_events_3

The following figure shows Firehose Events Table 4.

Use Case 4: Route records to different tables based on the content of the incoming data by using a Lambda function

There might be scenarios where routing information isn’t readily available in the input record. You might want to parse and process incoming records or perform a lookup to determine where to deliver the record and whether to perform an update or delete operation. For such scenarios, you can use a Lambda function to generate the routing information and operation specification. Firehose automatically invokes your Lambda function for a batch of records (with a configurable batch size). You can process incoming records in your Lambda function and provide the routing information and operation in the output of the function. To learn more about how to process Firehose records using Lambda, see Transform source data in Amazon Data Firehose. After executing your Lambda function, Firehose looks for routing information and operations in the metadata fields (in the following format) provided by your Lambda function.

    "metadata":{
        "otfMetadata":{
            "destinationTableName":"firehose_iceberg_db",
            "destinationDatabaseName":"firehose_events_*",
            "operation":"insert"
        }

So, in this use case, you will explore how you can create custom routing rules based on other values of your records. Specifically, for this use case, you will route all records with a value for Region of ‘pdx’ to table 3 and all records with a region value of ‘nyc’ to table 4.

The CloudFormation template has already created the custom processing Lambda function for you, which has the following code:

import base64
import json
print('Loading function')

def lambda_handler(event, context):
    firehose_records_output = {'records': []}

    for record in event['records']:
        payload = base64.b64decode(record['data']).decode('utf-8')
        # Process the payload based on region
        payload_json = json.loads(payload)
        region = payload_json.get('region', '')
        firehose_record_output = {}
        if region == 'pdx':
            firehose_record_output['metadata'] = {
                'otfMetadata': {
                    'destinationDatabaseName': 'firehose_iceberg_db',
                    'destinationTableName': 'firehose_events_3',
                    'operation': 'insert'
                }
            }
        elif region == 'nyc':
            firehose_record_output['metadata'] = {
                'otfMetadata': {
                    'destinationDatabaseName': 'firehose_iceberg_db',
                    'destinationTableName': 'firehose_events_4',
                    'operation': 'insert'
                }
            }

        # Create output with proper record ID, output data, result, and metadata
        firehose_record_output['recordId'] = record['recordId']
        firehose_record_output['result'] = 'Ok'
        firehose_record_output['data'] = base64.b64encode(payload.encode('utf-8'))
        firehose_records_output['records'].append(firehose_record_output)

    return firehose_records_output

Configure the Firehose stream:

  1. Go back to the Data Firehose console.
  2. Choose Create Firehose stream.
  3. For Source, select Direct PUT. For Destination, select Apache Iceberg Tables.
  4. For the Firehose stream name, enter firehose-iceberg-events-4.
  5. In Transform records, select Turn on data transformation.
  6. Browse and select the function created by the CloudFormation stack:
    • Firehose-Iceberg-Stack-FirehoseProcessingLambda-*.
    • For Version select $LATEST.
  7. You can leave the Destination Settings as default because the Lambda function will provide the required metadata for routing.
  8. Change the Buffer hints to 1 MiB and 60 seconds.
  9. In Backup settings, select the same S3 bucket from the stack, but in the error output prefix, enter the following:
    error/events-4/

  10. In Advanced settings, select the existing role of the stack and create the new Firehose stream.
  11. In Kinesis Data Generator, refresh the page and select the newly created firehose stream: firehose-iceberg-events-4.

If you run the following query, you will see that the last records that were inserted into the table are only in the Region of ‘nyc’.

SELECT * FROM "firehose_iceberg_db"."firehose_events_4" 
order by event_timestamp desc 
limit 10;

Considerations and limitations

Before using Data Firehose with Apache Iceberg, it’s important to be aware of considerations and limitations. For more information, see Considerations and limitations.

Clean up

To avoid future charges, delete the resources you created in AWS Glue, Data Catalog, and the S3 bucket used for storage.

Conclusion

It’s straightforward to set up Firehose streams to deliver streaming records into Apache Iceberg tables in Amazon S3. We hope that this post helps you get started with building some amazing applications without having to worry about writing and managing complex application code or having to manage infrastructure.

To learn more about using Amazon Data Firehose with Apache Iceberg, see the Firehose Developer Guide or try the Immersion day workshop.


About the authors

Diego Garcia Garcia is a Specialist SA Manager for Analytics at AWS. His expertise spans across Amazon’s analytics services, with a particular focus on real-time data processing and advanced analytics architectures. Diego leads a team of specialist solutions architects across EMEA, collaborating closely with customers spanning across multiple industries and geographies to design and implement solutions to their data analytics challenges.

Francisco MorilloFrancisco Morillo is a Streaming Solutions Architect at AWS. Francisco works with AWS customers, helping them design real-time analytics architectures using AWS services, supporting Amazon Managed Streaming for Apache Kafka (Amazon MSK) and Amazon Managed Service for Apache Flink.

Phaneendra Vuliyaragoli is a Product Management Lead for Amazon Data Firehose at AWS. In this role, Phaneendra leads the product and go-to-market strategy for Amazon Data Firehose.