Implement monitoring for Amazon EKS with managed services

Post Syndicated from Aritra Nag original https://aws.amazon.com/blogs/architecture/implement-monitoring-for-amazon-eks-with-managed-services/

In this post, we show you how to implement comprehensive monitoring for Amazon Elastic Kubernetes Service (Amazon EKS) workloads using AWS managed services. Amazon EKS offers compelling solutions with EKS Auto Mode and AWS Fargate, each designed for different use cases. This solution demonstrates building an EKS platform that combines flexible compute options with enterprise-grade observability using AWS native services and OpenTelemetry.

Modern containerized environments require observability that goes beyond basic CPU and memory metrics. Our approach addresses three critical challenges: reducing compute management complexity, closing observability gaps, and enabling metrics-driven automatic scaling that responds to real application demand rather than infrastructure utilization alone.

Architecture components

Amazon Managed Service for Prometheus is a fully managed Prometheus-compatible service that alleviates the operational overhead of running Prometheus infrastructure while providing automatic scaling to handle billions of metrics, built-in high availability across multiple Availability Zones, 150 days of metrics retention by default, and native integration with Grafana and other visualization tools.

AWS Distro for OpenTelemetry (ADOT) is a secure, enterprise-grade distribution of OpenTelemetry that provides standardized metrics, traces, and logs collection, native AWS service integration, automatic instrumentation for popular frameworks, and efficient data processing and export.

Amazon CloudWatch is a centralized logging and monitoring service offering structured log aggregation and search, custom metrics and alarms, integration with AWS services, and long-term log retention and analysis.

Solution overview

This section outlines the comprehensive monitoring solution architecture and its key components. We explore how the different AWS services work together to provide complete observability for your Amazon EKS workloads.

Our solution addresses key challenges through a comprehensive observability pipeline using Amazon Managed Service for Prometheus, AWS X-Ray, and Amazon CloudWatch; real metrics-based automatic scaling using custom Prometheus metrics instead of basic resource utilization; and cost optimization through strategic virtual private cloud (VPC) endpoints and compute mode selection.

The architecture showcases a Kubernetes environment with two distinct compute modes, each optimized for different use cases. EKS Auto Mode represents AWS’s latest approach to managed Kubernetes compute. It eliminates the need for node management by removing the requirement to configure node groups or instance types. The platform automatically scales compute resources based on your actual workload demands, ensuring you pay only for the resources your applications consume. It comes with integrated services including automatic configuration of VPC CNI, EBS CSI driver, and load balancer integration, making it ideal for general workloads and cost-optimized deployments. The Amazon EKS Auto Mode architecture (shown in the following diagram) provides zero node management with automatic scaling based on workload demands. This mode includes integrated networking, storage, and load balancing capabilities, making it ideal for general workloads and cost-optimized deployments.
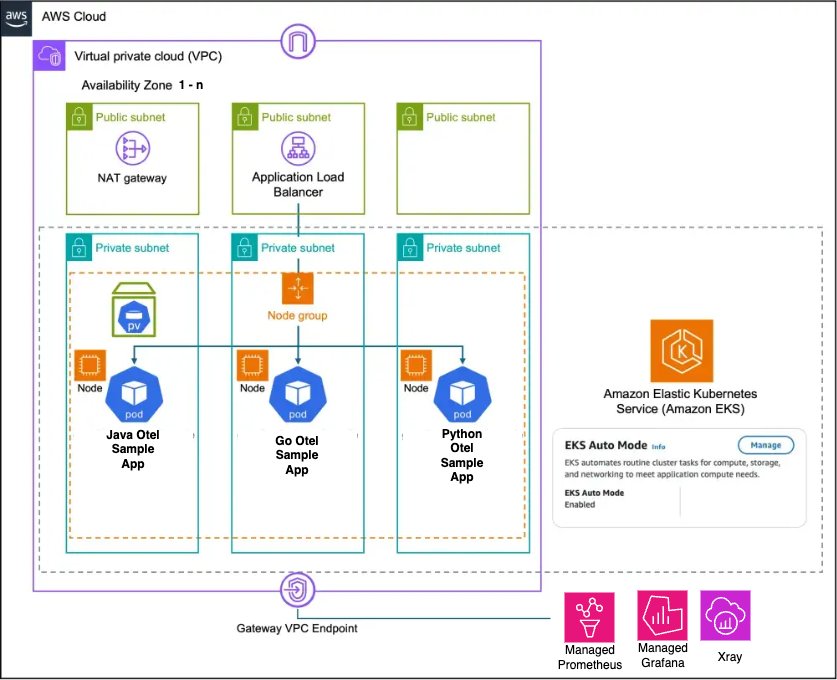
Amazon EKS Auto Mode Architecture

AWS Fargate takes a different approach by providing true serverless container execution. With Fargate, you don’t need to manage any Amazon EC2 instances, as each pod runs in its own isolated compute environment. This isolation extends to billing, where costs are tracked at the individual pod level, providing granular control over your expenses. Pods can scale independently without requiring capacity planning, making Fargate particularly well-suited for security-sensitive workloads and applications requiring strict resource isolation.The Amazon EKS Fargate architecture (shown in the following diagram) offers serverless container execution with strong isolation, where each pod runs in its own compute environment. This approach works best for security-sensitive workloads and applications requiring granular cost control.
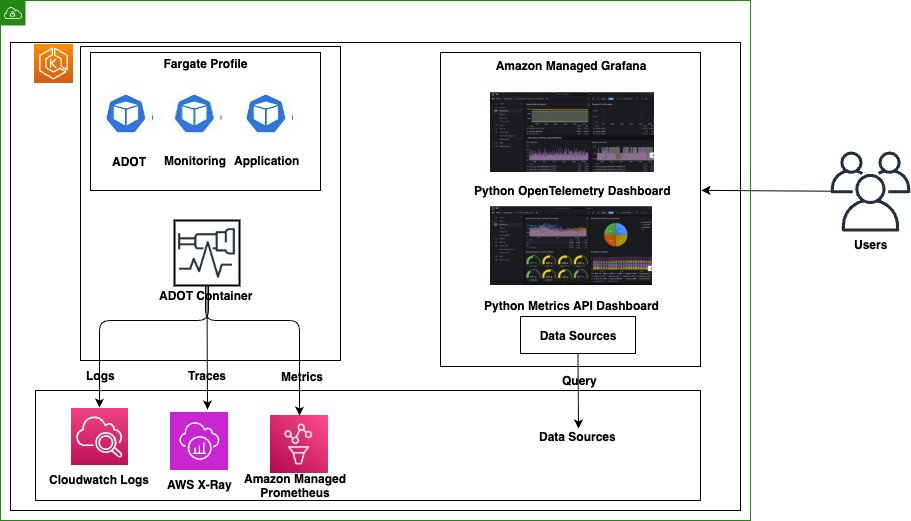
Amazon EKS Fargate Architecture

The key architectural difference lies in networking and scaling behavior. Auto Mode uses shared node networking with cluster-wide scaling decisions, whereas Fargate provides isolated pod networking with individual pod scaling.

Comprehensive observability pipeline

The following diagram illustrates the workflow of the observability pipeline.
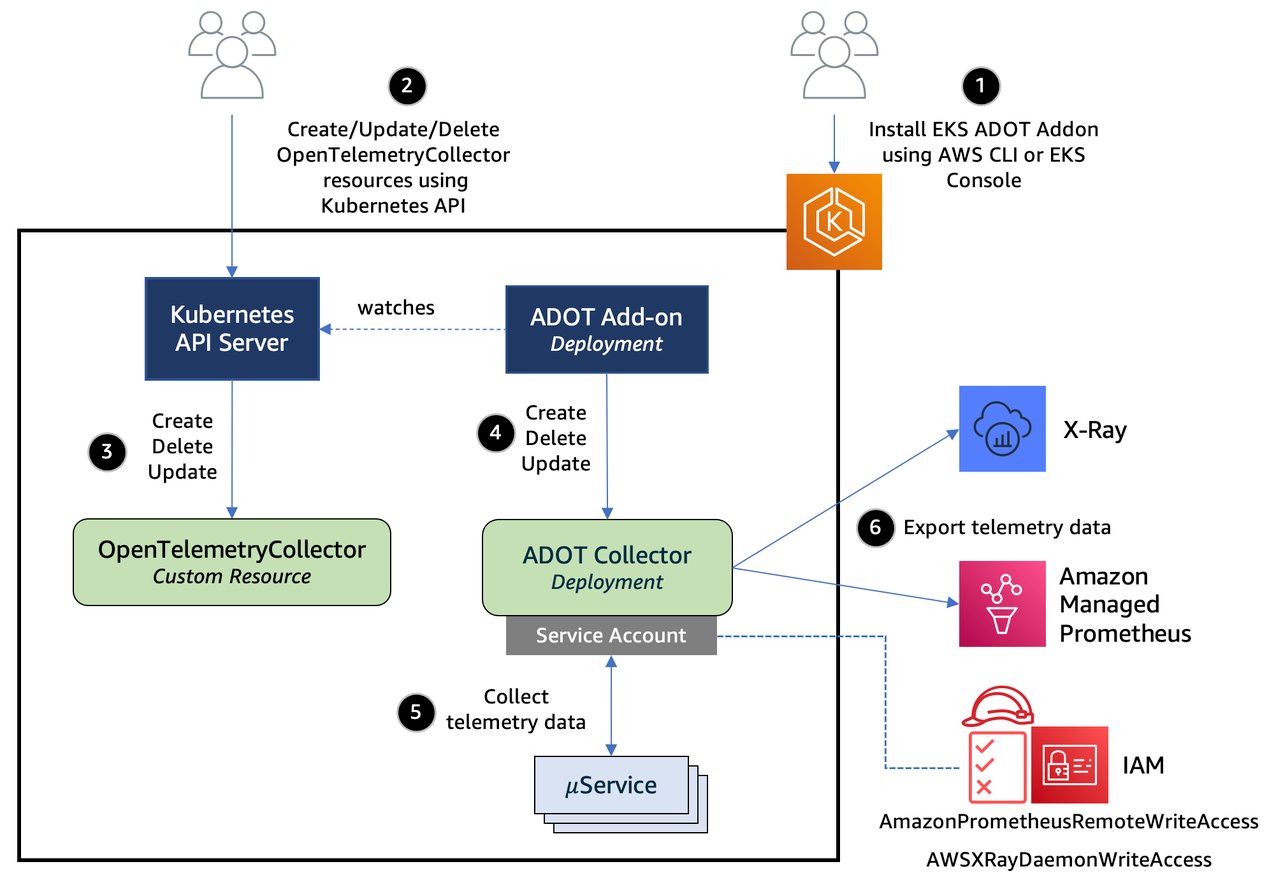
Open Telemetry Collector Agent

The observability architecture implements the three pillars of observability using AWS native services:

  • Metrics collection and storage:
    • Dual collection strategy combining direct Prometheus scraping and OpenTelemetry SDK
    • Local Prometheus server for Horizontal Pod Autoscaler (HPA) metrics and Prometheus Adapter integration
    • Amazon Managed Service for Prometheus for long-term storage and querying
    • Custom metrics exposed through Kubernetes custom metrics API
  • Distributed tracing:
    • OpenTelemetry SDK integration for automatic trace collection
    • AWS Distro for OpenTelemetry (ADOT) collector for data processing
    • AWS X-Ray for trace storage and service map visualization
    • End-to-end transaction monitoring across microservices
  • Centralized logging:
    • OpenTelemetry SDK for structured application logging
    • FluentBit for container log collection
    • CloudWatch Logs with proper retention policies
    • Log correlation with traces and metrics for comprehensive debugging

The below diagram demonstrates a modern cloud-native monitoring solution that collects and analyzes performance data from containerized applications, with data flowing from the Kubernetes workloads through the metrics pipeline to CloudWatch for centralized monitoring and observability.
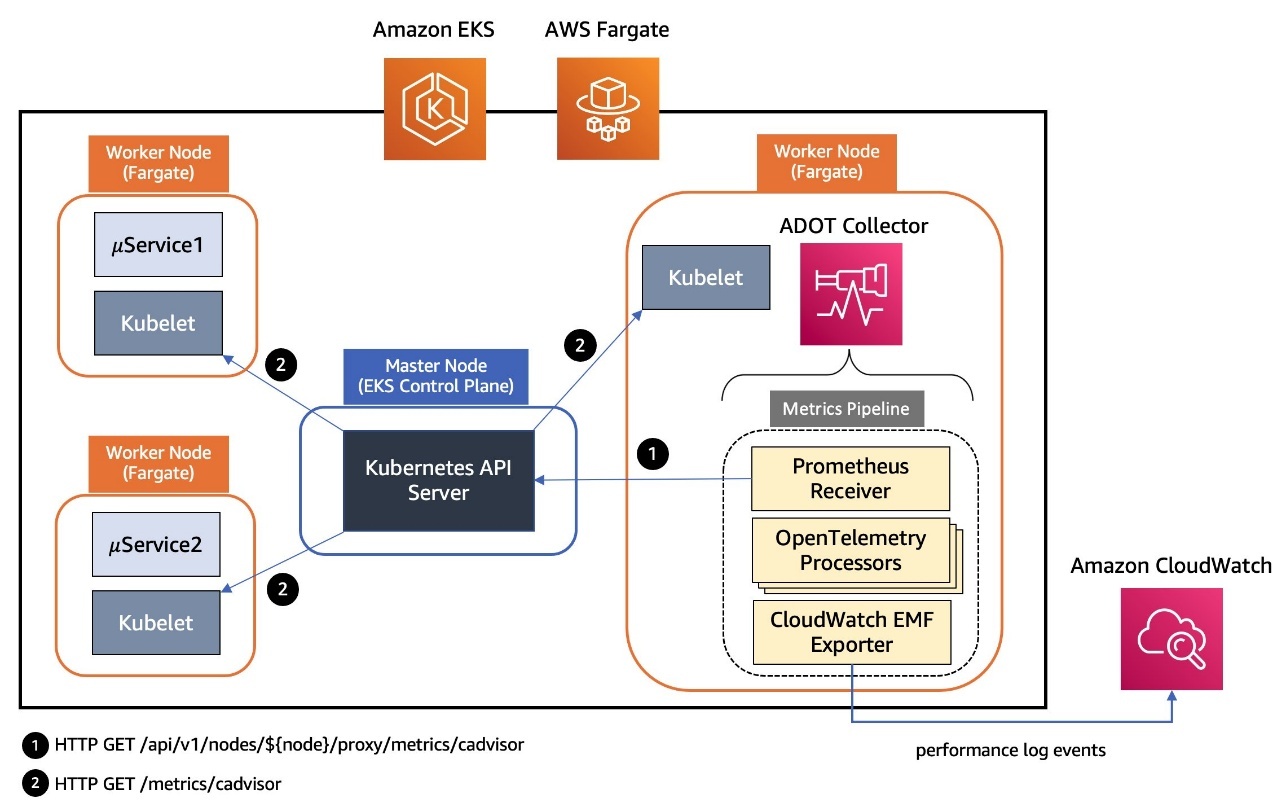
Amazon EKS Fargate and Auto Mode Telemetry Collection

In the following sections, we walk you through deploying the complete observability stack. We start with the foundational AWS services, then configure the collection agents, and finally instrument your applications.

Prerequisites

Before implementing this solution, you must have the following:

Create the observability stack

The first step to implement the observability stack involves creating the core AWS services that will store and process your observability data using the AWS CDK:

from aws_cdk import (
    Stack,
    aws_logs as logs,
    aws_aps as aps,
    aws_iam as iam,
    RemovalPolicy,
    CfnOutput
)

class ObservabilityStack(Stack):
    def __init__(self, scope: Construct, construct_id: str, **kwargs) -> None:
        super().__init__(scope, construct_id, **kwargs)

       # Create workspace for storing Prometheus metrics
        self.prometheus_workspace = aps.CfnWorkspace(
            self, "AmpWorkspace",
            alias="eks-observability-platform"
        )

        # Create CloudWatch Log Groups for storing Application Logs
        self.app_log_group = logs.LogGroup(
            self, "ApplicationLogGroup",
            log_group_name="/aws/eks/observability/applications",
            removal_policy=RemovalPolicy.DESTROY,
            retention=logs.RetentionDays.ONE_WEEK
        )
        
        # Create Otel Log Group for OpenTelemetry Logs
        self.otel_log_group = logs.LogGroup(
            self, "OtelLogGroup",
            log_group_name="/aws/eks/observability/otel",
            removal_policy=RemovalPolicy.DESTROY,
            retention=logs.RetentionDays.ONE_WEEK
        )

Deploy the infrastructure stack using the following commands:

pip install aws-cdk-lib constructs
cdk deploy ObservabilityStack

Deploy local Prometheus for HPA

This step configures Prometheus for service discovery and remote write to Amazon Managed Service for Prometheus. The local Prometheus instance enables the HPA to access custom metrics:

prometheus_config = {
    "apiVersion": "v1",
    "kind": "ConfigMap",
    "metadata": {
        "name": "prometheus-config",
        "namespace": "monitoring"
    },
    "data": {
        "prometheus.yml": f"""
global:
  scrape_interval: 15s
  evaluation_interval: 15s

remote_write:
  - url: https://aps-workspaces.{region}.amazonaws.com/workspaces/{workspace_id}/api/v1/remote_write
    queue_config:
      max_samples_per_send: 1000
      max_shards: 200
      capacity: 2500
    sigv4:
      region: {region}

scrape_configs:
  - job_name: 'kubernetes-pods'
    kubernetes_sd_configs:
      - role: pod
    relabel_configs:
      - source_labels: [__meta_kubernetes_pod_annotation_prometheus_io_scrape]
        action: keep
        regex: true
      - source_labels: [__meta_kubernetes_pod_annotation_prometheus_io_path]
        action: replace
        target_label: __metrics_path__
        regex: (.+)
      - source_labels: [__address__, __meta_kubernetes_pod_annotation_prometheus_io_port]
        action: replace
        regex: ([^:]+)(?::\d+)?;(\d+)
        replacement: $1:$2
        target_label: __address__
"""
    }
}

Apply the configuration to your cluster:

kubectl apply -f prometheus-config.yaml

Configure the ADOT Collector

Deploy the ADOT Collector with proper AWS service integration. This collector processes telemetry data from your applications and exports it to AWS services:

apiVersion: opentelemetry.io/v1alpha1
kind: OpenTelemetryCollector
metadata:
  name: otel-collector
  namespace: opentelemetry
spec:
  config: |
    receivers:
      otlp:
        protocols:
          grpc:
            endpoint: 0.0.0.0:4317
          http:
            endpoint: 0.0.0.0:4318
      prometheus:
        config:
          scrape_configs:
            - job_name: 'kubernetes-pods'
              kubernetes_sd_configs:
                - role: pod

    processors:
      batch:
        timeout: 1s
        send_batch_size: 1024
      resource:
        attributes:
          - key: ClusterName
            value: ${CLUSTER_NAME}
            action: upsert

    exporters:
      awsxray:
        region: ${AWS_REGION}
      awscloudwatchlogs:
        region: ${AWS_REGION}
        log_group_name: "/aws/eks/observability/otel"
      prometheusremotewrite:
        endpoint: https://aps-workspaces.${AWS_REGION}.amazonaws.com/workspaces/${PROMETHEUS_WORKSPACE_ID}/api/v1/remote_write
        auth:
          authenticator: sigv4auth

    extensions:
      sigv4auth:
        region: ${AWS_REGION}

    service:
      extensions: [sigv4auth]
      pipelines:
        traces:
          receivers: [otlp]
          processors: [resource, batch]
          exporters: [awsxray]
        metrics:
          receivers: [otlp, prometheus]
          processors: [resource, batch]
          exporters: [prometheusremotewrite]
        logs:
          receivers: [otlp]
          processors: [resource, batch]
          exporters: [awscloudwatchlogs]

Deploy the collector:

kubectl apply -f adot-collector.yaml

Instrument your applications

This section shows how to instrument your applications to emit telemetry data. We cover both Python and Java applications.

Instrument a Python Flask application

The following code demonstrates how to add OpenTelemetry instrumentation to a Python Flask application:

from opentelemetry import trace, metrics
from opentelemetry.sdk.trace import TracerProvider
from opentelemetry.sdk.metrics import MeterProvider
from opentelemetry.sdk.resources import Resource
from opentelemetry.exporter.otlp.proto.grpc.trace_exporter import OTLPSpanExporter
from opentelemetry.exporter.otlp.proto.grpc.metric_exporter import OTLPMetricExporter
from opentelemetry.sdk.trace.export import BatchSpanProcessor
from opentelemetry.sdk.metrics.export import PeriodicExportingMetricReader

# Configure OpenTelemetry
resource = Resource.create({
    "service.name": "flask-app",
    "service.version": "1.0.0",
    "deployment.environment": "production"
})

# Setup tracing
trace_provider = TracerProvider(resource=resource)
otlp_trace_exporter = OTLPSpanExporter(endpoint="http://otel-collector.opentelemetry:4317")
trace_provider.add_span_processor(BatchSpanProcessor(otlp_trace_exporter))
trace.set_tracer_provider(trace_provider)
tracer = trace.get_tracer(__name__)

# Setup metrics
metric_provider = MeterProvider(resource=resource)
otlp_metric_exporter = OTLPMetricExporter(endpoint="http://otel-collector.opentelemetry:4317")
metric_provider.add_metric_reader(PeriodicExportingMetricReader(otlp_metric_exporter))
metrics.set_meter_provider(metric_provider)
meter = metrics.get_meter(__name__)

# Create application metrics
request_counter = meter.create_counter(
    name="http_requests_total",
    description="Total HTTP requests",
    unit="1"
)

@app.route('/api/users')
def users():
    with tracer.start_as_current_span("get_users") as span:
        span.set_attribute("endpoint", "api_users")
        # Record metrics
        request_counter.add(1, {"endpoint": "api_users", "status": "success"})
        return jsonify({"users": ["user1", "user2", "user3"]})

Instrument a Java application

For Java applications using Spring Boot, add the following instrumentation:

@RestController
public class ApiController {
    private final Counter httpRequestsTotal;

    public ApiController(MeterRegistry meterRegistry) {
        this.httpRequestsTotal = Counter.builder("http_requests_total")
            .description("Total HTTP requests")
            .register(meterRegistry);
    }

    @GetMapping("/api/users")
    public Map<String, Object> getUsers() {
        httpRequestsTotal.increment();
        Map<String, Object> response = new HashMap<>();
        response.put("users", Arrays.asList("user1", "user2", "user3"));
        return response;
    }
}

Build and deploy your instrumented applications to the EKS cluster with the appropriate annotations for Prometheus scraping.

Configure the Prometheus Adapter for custom metrics

The Prometheus Adapter exposes custom metrics from Prometheus to the Kubernetes custom metrics API, enabling the HPA to use application-specific metrics:

prometheus_adapter_config = """
rules:
- seriesQuery: 'http_requests_total{app="flask-app"}'
  resources:
    overrides:
      kubernetes_namespace: {resource: "namespace"}
      kubernetes_pod_name: {resource: "pod"}
  name:
    as: "flask_app_requests_rate"
  metricsQuery: 'rate(http_requests_total{app="flask-app",<<.LabelMatchers>>}[1m]) * 60'
"""

# Deploy Prometheus Adapter
prometheus_adapter_deployment = {
    "apiVersion": "apps/v1",
    "kind": "Deployment",
    "metadata": {
        "name": "prometheus-adapter",
        "namespace": "monitoring"
    },
    "spec": {
        "replicas": 1,
        "selector": {"matchLabels": {"app": "prometheus-adapter"}},
        "template": {
            "metadata": {"labels": {"app": "prometheus-adapter"}},
            "spec": {
                "containers": [{
                    "name": "prometheus-adapter",
                    "image": "k8s.gcr.io/prometheus-adapter/prometheus-adapter:v0.12.0",
                    "args": [
                        "--prometheus-url=http://prometheus-service.monitoring:9090",
                        "--config=/etc/adapter/config.yaml"
                    ]
                }]
            }
        }
    }
}

Deploy the Prometheus Adapter:

kubectl apply -f prometheus-adapter.yaml

Configure HPAs with custom metrics

Create HPAs that use custom metrics instead of basic resource utilization:

apiVersion: autoscaling/v2
kind: HorizontalPodAutoscaler
metadata:
  name: flask-app-hpa
  namespace: default
spec:
  scaleTargetRef:
    apiVersion: apps/v1
    kind: Deployment
    name: flask-app
  minReplicas: 2
  maxReplicas: 10
  metrics:
  - type: Pods
    pods:
      metric:
        name: flask_app_requests_rate
      target:
        type: AverageValue
        averageValue: "10"
  behavior:
    scaleUp:
      stabilizationWindowSeconds: 60
      policies:
      - type: Percent
        value: 100
        periodSeconds: 15
    scaleDown:
      stabilizationWindowSeconds: 300
      policies:
      - type: Percent
        value: 10
        periodSeconds: 60

Apply the HPA configuration:

kubectl apply -f hpa-custom-metrics.yaml

Monitoring and visualization

After implementing this solution, you can create custom dashboards in Amazon Managed Grafana to monitor the following:

  • Application performance metrics
  • Request rates and latencies
  • Resource utilization
  • Error rates

For dashboard examples and templates, refer to the Amazon Managed Grafana documentation. The following screenshots are examples of some of the dashboards you can build:

  • OpenTelemetry Prometheus Dashboard – This dashboard displays Python application performance with request rate by endpoints, response time percentiles (P50, P95, P99), CPU utilization trends, memory usage patterns, and error rates segmented by HTTP status codes.
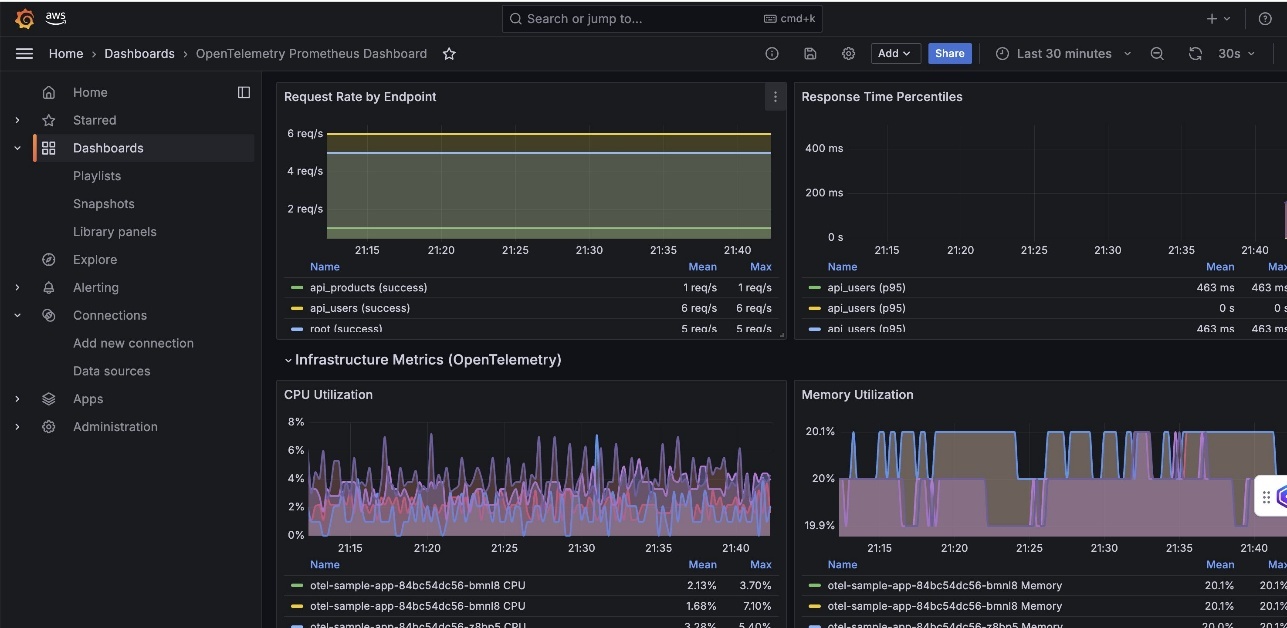
Python App OpenTelemetry Prometheus Dashboard

  • Go OpenTelemetry Application Dashboard – This dashboard focuses on Go-specific metrics including HTTP request rate, active concurrent users, goroutine counts, CPU usage, and memory allocation patterns with garbage collection insights.
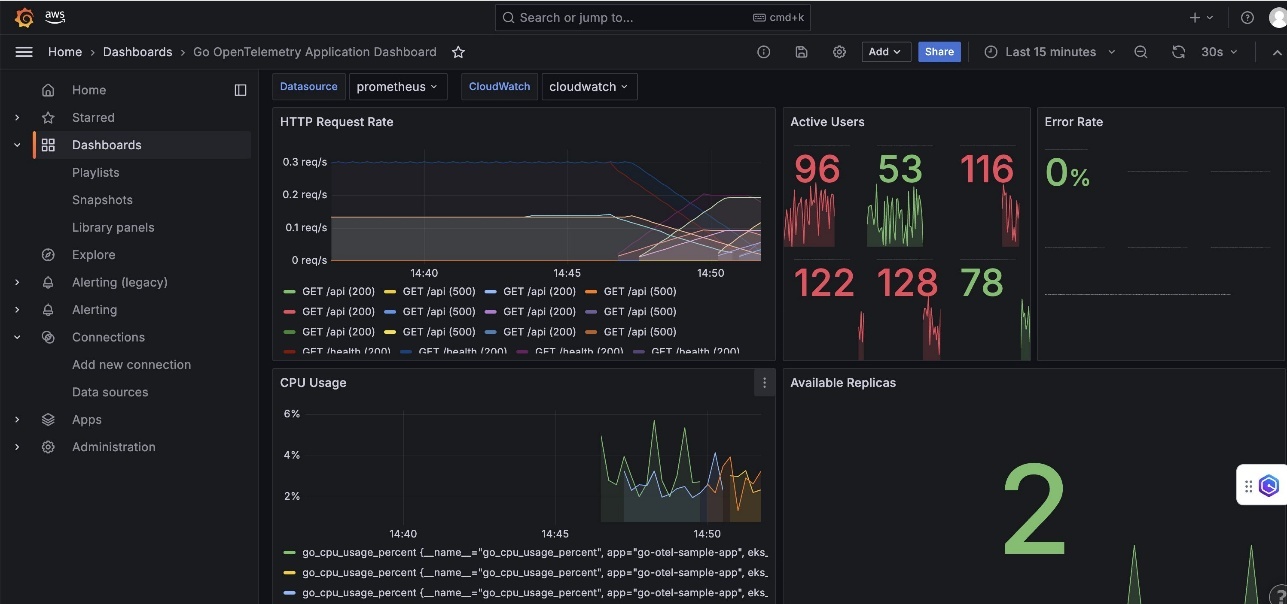
Go App OpenTelemetry Prometheus Dashboard

  • Java OTEL Sample App Monitoring – This dashboard shows JVM-specific metrics like heap memory utilization, alongside application-level metrics such as requests per second, garbage collection insights, and thread pool utilization.
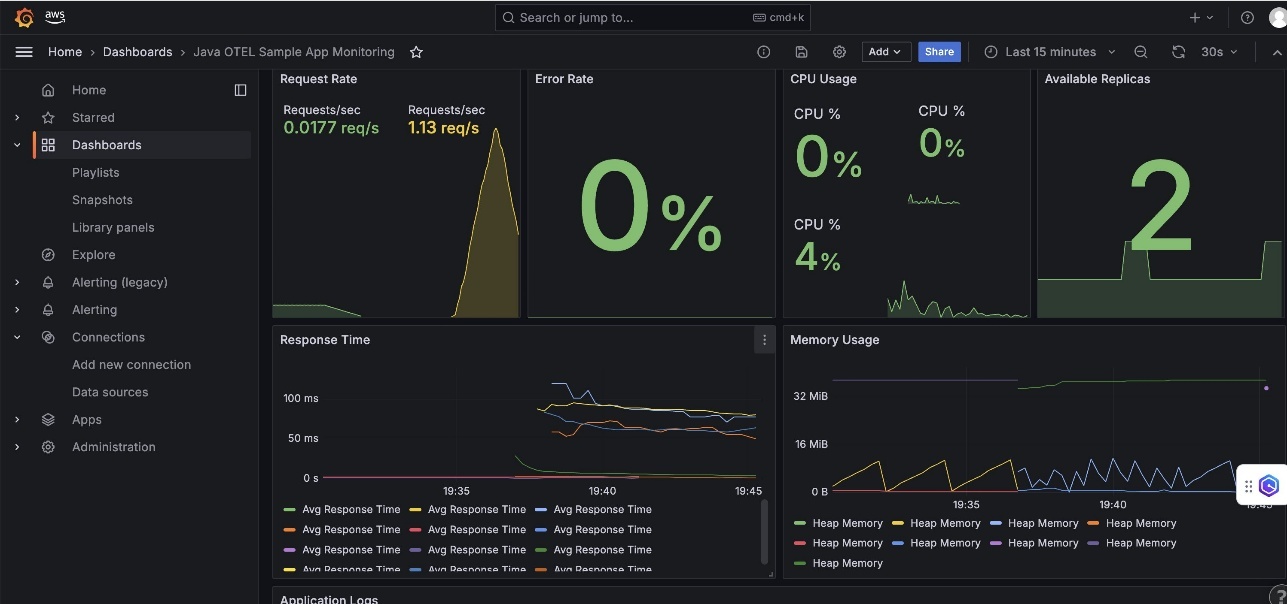
Java App OpenTelemetry Prometheus Dashboard

The dashboards enable real-time application performance monitoring, infrastructure resource utilization tracking, error rate monitoring and alerting, and automatic scaling visualization and trends.

Best practices and recommendations

Choose Amazon EKS Auto Mode for the following use cases and features:

  • You’re building general-purpose applications that benefit from cost optimization and operational simplicity
  • You’re managing mixed workload types and want to use integrated AWS service features
  • Teams want to avoid the complexity of node management
  • Cost-efficiency and ease of operations are priorities for production workloads

Choose Amazon EKS with Fargate in the following scenarios:

  • Security isolation is paramount for your applications
  • You’re running batch or event-driven workloads that require strong container isolation
  • Your organization requires granular cost attribution at the pod level
  • Compliance mandates dictate complete container isolation from the underlying infrastructure

For your observability strategy, consider the following monitoring approach:

  • Use business metrics for HPA scaling decisions
  • Implement proper metric labeling for filtering and aggregation
  • Monitor both application and infrastructure metrics
  • Set up alerting based on Service Level Indicator (SLI) and Service Level Objective (SLO) definitions

Additionally, implement the following tracing approach:

  • Instrument critical code paths with OpenTelemetry
  • Use consistent trace context propagation
  • Monitor service dependencies through AWS X-Ray service maps
  • Implement proper error handling and trace sampling

Benefits of the solution

Instead of relying on basic CPU and memory metrics, this solution configures the Prometheus Adapter to expose custom metrics to the Kubernetes HPA. The HPA configuration shown in this post enables more intelligent scaling decisions based on actual application load, resulting in better resource efficiency and improved application performance. This approach allows your applications to scale based on business-relevant metrics such as request rate, queue length, or custom application metrics rather than generic infrastructure utilization. This solution offers reduced management overhead through the following features:

  • Fully managed – Amazon Managed Service for Prometheus eliminates infrastructure management
  • Automatic scaling – Built-in high availability and scaling
  • Integrated security – Native IAM integration
  • Cost-effective – Pay only for metrics ingested and stored

You also benefit from enhanced observability:

  • Three pillars – Complete metrics, traces, and logs coverage
  • Real-time monitoring – Custom metrics for intelligent automatic scaling
  • Correlation – Trace IDs link logs, metrics, and traces
  • Business metrics – Scale based on application behavior, not just infrastructure

Troubleshooting

If the ADOT Collector isn’t receiving data, troubleshoot as follows:

  • Verify the collector service is running: $ kubectl get pods -n opentelemetry
  • Check application configuration for correct endpoint URLs
  • Verify IAM roles have proper permissions for AWS services

If the custom metrics aren’t available in the HPA, check the following:

  • Confirm the Prometheus Adapter is deployed and running
  • Verify metrics are being scraped by Prometheus: $ kubectl port-forward svc/prometheus 9090:9090
  • Check the Prometheus Adapter configuration for correct metric queries

Deployment cost considerations

In this section, we provide an estimate of the cost that will incur with the preceding solutions:

  • Amazon Managed Service for Prometheus – $0.90 per million samples ingested + $0.03 per GB-month storage
  • AWS X-Ray – $5.00 per million traces recorded
  • Amazon CloudWatch Logs – $0.50 per GB ingested + $0.03 per GB-month storage
  • Amazon EKS – $73/month control plane + compute costs (Auto Mode/Fargate variable)

For a medium-scale application (5 microservices, 2 million samples/hour, 100,000 traces/day, 10 GB logs/day), the costs are as follows:|

Service Cost
Amazon Managed Prometheus ~$80
AWS X-Ray ~$45
CloudWatch Logs ~$165
EKS Control Plane ~$73
Compute costs ~$200-400
Total ~$563-763/month

Costs are estimates based on US East (N. Virginia) pricing as of 2025 and might vary based on AWS Region, usage patterns, and AWS pricing changes. Consider the following cost optimization methods:

  • Sampling – Implement intelligent sampling for high-cardinality metrics
  • Retention – Set appropriate log retention (7–30 days for debug logs)
  • Monitoring – Use CloudWatch billing alarms to track spending
  • Regional – Deploy in single Region to minimize data transfer costs

Clean up

To avoid ongoing charges, delete the resources created in this walkthrough:

  1. Remove IAM roles and policies created for this solution through the IAM console or AWS CLI.
  2. Delete the AWS CDK stack:
cdk destroy ObservabilityStack

Conclusion

This solution demonstrates how organizations can achieve enterprise-grade Kubernetes deployments that balance flexibility, observability, and cost optimization. By combining Amazon EKS Auto Mode or Fargate with comprehensive AWS native observability services, teams can focus on application development while maintaining deep visibility into system performance. The real metrics-based automatic scaling approach represents a significant improvement over traditional resource-based scaling, enabling more intelligent infrastructure decisions that align with actual application behavior. Combined with the flexible compute options and modular architecture, this platform provides a robust foundation for modern containerized applications at scale. Key takeaways include:

  • Use AWS managed services – Reduce operational overhead with Amazon Managed Service for Prometheus and CloudWatch
  • Implement OpenTelemetry – Standardize observability across all applications
  • Custom metrics for HPA – Scale based on business metrics, not just CPU/memory
  • Structured logging – Enable better debugging and correlation
  • Security first – Implement proper IAM roles and network isolation

Organizations implementing this solution can expect reduced operational complexity, improved cost-efficiency, and enhanced visibility into their containerized applications, enabling faster development cycles and more reliable production deployments.



About the author

Ще се вика ли силно „Оставка“?

Post Syndicated from Емилия Милчева original https://www.toest.bg/shte-se-vika-li-silno-ostavka/

Ще се вика ли силно „Оставка“?

Арестът на кмета на Варна Благомир Коцев разпали обществен гняв, но не предизвика силни трусове, които да съборят правителството. Засега инициаторите на протестите заедно с политическите сили, които ги подкрепят – „Продължаваме промяната“ и „Демократична България“, залагат повече на силна обществена мобилизация и натиск. Но на улицата има и активисти и симпатизанти на „Величие“, МЕЧ и други по-малки политически сили и от тези среди вече се чуват гласове за предсрочни избори.

На протестите за независимо правосъдие в София, Варна, Русе и още четири европейски града – Лондон, Мюнхен, Брюксел и Берлин, българските граждани отново се обявиха срещу задкулисието, превзетите институции и модела на управление, в който прокуратурата служи не на закона, а на политически и олигархични интереси. Но не прозвуча високо и отчетливо „Оставка!“, така както кънтеше всяка вечер на продължилите близо 400 дни протести ДАНСwithme срещу кабинета на БСП–ДПС (май 2013 – август 2014 г.). „Оставка!“ се чуваше и от изпълнилите площад „Независимост“ през 2020–2021 г. 

Въпреки хилядите хора, излезли по улиците, се усеща умората, че в България политическият цикъл води винаги към едно и също задкулисие. Същите лица, същите „бухалки“, същите зависимости и обръчи на влияние надживяват политици, партии, обещания за реформи – като вирус, срещу който няма ваксина. Предишните протести имаха своите популярни говорители и силна медийна подкрепа. Но те станаха политици, извършиха свои грешки, влязоха в порочни съюзи и сега липсват лидерски фигури или обединяващ фронт, който да трансформира енергията в политическа сила, в натиск с ясна цел или в трайна промяна.

Протестите остават гневни, но фрагментирани. 

Искат да бъдат отстранени „бухалките“ – какво значи това? Нова прокуратура? Но конституционната промяна претърпя крах, а Борислав Сарафов остава и.ф. главен прокурор и след 21 юли с решение на прокурорската колегия на ВСС. 

Избор на ново ръководство на Комисията за противодействие на корупцията (КПК)? В момента една и съща тричленка начело с Антон Славчев и в състав Антоанета Цонкова и Пламен Йоцов е едновременно КПК и комисия за конфискация, получават по две заплати и търсят корупция при лица, свързани с точно определена политическа сила. Съпредседателят на ДБ Атанас Атанасов заговори за закриването на структурата. На заседанието на парламентарната Комисия за контрол над службите, която той временно ръководи, станаха известни някои факти. Например в КПК работят 212 души със средна заплата 4513 лв.; за 2024 г. в качеството на обвиняеми са привлечени 79 лица; няма данни за осъдени. 

КПК е паразитна структура, дублираща функциите на икономическа полиция, ГДБОП, ДАНС и прокуратурата. Това е орган, използван с оглед политическата конюнктура като инструмент за разправа. Смятам, че подобно на специализираните прокуратура и съд, и КПК трябва да бъде закрита, вместо да искаме оставката на председателя ѝ, а бюджетът на Комисията трябва да бъде пренасочен там, където обществото наистина има нужда – за обучение, специализация и достойното заплащане на младите лекари и специализанти.

Но нали разследващите функции на Антикорупционната комисия бяха приети и обсъждани в хода на съдебната реформа, за да се създаде ефективна институция за борба с корупцията по високите етажи на властта? Законът, който даде разследващи правомощия на КПК, беше приет от Народното събрание през юли 2023 г. с подкрепата на ПП–ДБ, ГЕРБ и Пеевски a.k.a ДПС, а Комисията остана орган под политическо влияние. 

Сега ПП инициира подписка, за да събере необходимите 80 депутатски гласа за освобождаването на Антон Славчев – втори опит, след като преди година първият беше неуспешен, а вероятно и този ще бъде. Славчев е временно изпълняващ длъжността от 2022 г., когато предишният шеф на комисия „Антикорупция“ и бивш главен прокурор Сотир Цацаров подаде оставка и се върна като прокурор. Събирането на подписи върви заедно с откритата от парламента процедура за избор на председател и членове на КПК. На ход е номинационната комисия, с чиито препоръки за състав обаче парламентът може да не се съобрази.

Предсрочни кметски избори във Варна?

След почти 10-часово заседание Апелативен съд – София окончателно потвърди постоянното задържане под стража на кмета на Варна и на общинските съветници Йордан Кателиев и Николай Стефанов – и тримата избрани от квотата на ПП. Безпрецедентно заседание в зала, препълнена с политици, граждани и представители на три посолства – френското, британското и нидерланското. Ситуацията предизвика заместник-председателя на съда Александър Желязков да призове да няма политическа дейност, която трябва да се върши на други места – в парламента например.

Ако политическата дейност се намеси в съдебната зала, правото излиза през прозореца.

А къде отива правото, когато в съдебната зала се намесят „Осемте джуджета“, Пепи Еврото, Мартин Божанов – Нотариуса, Красьо Черничкия и цял низ от неизвестни (засега) търговци в храма на Темида? Тогава правосъдието спира да е институция и се превръща в услуга по ценоразпис.

Тримата, които остават в ареста, са обвинени за участие в организирана престъпна група (ОПГ) за престъпления по служба, приемане на подкупи и пране на пари, действала от юли до ноември 2024 г. Четвъртият обвиняем Ивайло Маринов беше пуснат срещу подписка. 

Според обвинението Коцев, Стефанов и Кателиев са поискали сума, равняваща се на 15% от малко над милион и половина лева, които са стойността на обществена поръчка за приготвяне и доставка на храна за дом за пълнолетни лица в неравностойно положение във Варна.

Съдът не се съгласи с възражението, че делото не е трябвало да се гледа в София. То е в столицата заради данни за участие на депутат, макар и неустановен. Апелативните магистрати казаха, че това е правомощие на прокурора, което не подлежи на съдебен контрол.

По обвинението за ОПГ съдът смята, че е правилно преценено, че има данни за такова. А показанията на собственичката на фирма за кетъринг Пламенка Димитрова, която твърди, че ѝ искали подкуп, били потвърдени от още двама свидетели. Те дали доказателство за по-мащабна престъпна схема.

Докато върви разследването срещу кмета на Варна, ще продължат да излизат записи от анонимни лица, които да го уличават в корупция, преди още да са произнесени присъдите. Това ще отнема от обществената енергия за протестите, независимо от усилията на АЛДЕ, чийто член вече е „Продължаваме промяната“. А председателят на АЛДЕ Свеня Хан поиска с официално писмо до европейския комисар за демокрацията, правосъдието и върховенството на закона Майкъл Макграт спешна среща.

През последните месеци станахме свидетели на обезпокоителен модел на политическа намеса в съдебната система, нарастваща употреба на прокурорската власт за таргетиране на опозиционни фигури, както и законодателни инициативи, които подкопават демократичните механизми за контрол и баланс. Тези събития не само застрашават демократичните институции в България, но поставят под въпрос и ангажимента ѝ към основните ценности на ЕС.

Дали обществената енергия ще спихне, билбордовете със снимката на Благо Коцев ще се приберат и политическите акции на ПП ще оредеят, или ще има презареждане, зависи от много фактори. 

Първо, от капацитета на партията, която пое толкова удари и репутационни щети, започнали още със снимките с пачките и пудела, арестите на бившата вече шефка на митниците Петя Банкова и на лица, сочени за контрабандисти, и продължили с нова сила сега. 

Второ, от „Демократична България“, с която са обвързани в коалиция, и от тяхната подкрепа за политическите инициативи, които ще предприемат.

Трето, от това дали протестната вълна ще роди нови лица и послания, които да вдъхновят отвъд партийното говорене и да върнат усещането за автентичност.

Четвърто, от способността на ПП–ДБ да разграничат каузата за справедливо правосъдие от защитата на конкретни свои представители, замесени в скандали – иначе рискуват протестът да бъде възприет като партиен щит.

Пето, от това как ще реагират самата прокуратура и съдебната власт – ще има ли още арести и показни акции, които могат да разпалят недоволството, или ще се стремят да не загасне огънят под варненския случай.

И шесто, от това дали управляващото мнозинство ще продължи да действа като тефлонова коалиция – устойчива на обществен натиск, или ще се пропука отвътре, принуждавайки Борисов и Пеевски да търсят изход чрез предсрочни избори. Като така ще освободят и напрежението.

ГЕРБ партньор ли е, или враг?

Преди избори ПП–ДБ, заедно или поотделно, е добре да (си) изяснят къде стои ГЕРБ, възможни ли са разговори с най-голямата политическа сила и ако не с нея, с кой друг. През 2013–2014 г. активисти и привърженици на ГЕРБ бяха в редиците на протестиращите. Сега Бойко Борисов управлява заедно с Пеевски.

Но „предсрочни избори“ отново е в политическа употреба. Лидерите на „Възраждане“ и „Величие“ Костадин Костадинов и Ивелин Михайлов прогнозираха такива, а идеологът на „Исторически парк“ даже е съвсем сигурен:

100% вече съм сигурен, че отиваме към избори. Реториката в Народното събрание се превърна на предизборна и отново започнаха лъжите и черната кампания, която наблюдавахме в предното Народно събрание. Мисля, че на някои от следващите вотове на МЕЧ или „Да, България“ – „Продължаваме промяната“ правителството ще падне. Вчера Бойко Борисов ви го каза, че е готов да се преброим.

Да, каза го. В бравурно соло изпълнение за успехите на управляващите – „каца мед“, в която лъжичката катран бил арестът на Коцев – Борисов вкара и темата за изборите (в отговор на въпрос):

Ако сега не е за избори, тогава ние да кажем, че сме за избори. Но ако продължат така, най-добре е да се преброим пак.

С избора на омбудсман парламентът вече е готов с новия състав на „домовата книга“, от която ще се посочи служебен премиер. Пакетирана с „Произведено от Борисов/Пеевски“. Броилката си върви. „Алфа Рисърч“ преброи осем партии, ако изборите бяха днес. След ГЕРБ, ПП–ДБ са втори, Пеевски е плътно зад тях. За да има предсрочни избори, ГЕРБ и Борисов трябва да напуснат мнозинството или Пеевски – ДПС да спре да го подкрепя. 

Кой ще мигне пръв? Кой ще плати цената? Кой ще обере дивидентите?

На улицата, освен протестите за справедливо правосъдие, наесен ще има и други – срещу цените и срещу еврото (по подразбиране). А Борисов, както е известно от едни други протести за цената на тока, има опит в самосвалянето.

[$] How to write Rust in the kernel: part 3

Post Syndicated from daroc original https://lwn.net/Articles/1026694/

The interfaces between C and Rust in the kernel have grown over time; any
non-trivial Rust driver will use a number of these. Tasks like allocating memory,
dealing with immovable structures, and interacting with locks are necessary for
handling most devices. There are also many subsystem-specific bindings, but the
focus this time will be on an overview of the bindings that all kernel Rust code
can be expected to use.

Security updates for Friday

Post Syndicated from daroc original https://lwn.net/Articles/1030479/

Security updates have been issued by AlmaLinux (cloud-init, glib2, glibc, kernel, and tomcat), Debian (chromium), Fedora (luajit, minidlna, nginx-mod-modsecurity, python-asteval, rust-sequoia-octopus-librnp, and vim), Oracle (cloud-init, glib2, glibc, java-17-openjdk, kernel, python311-olamkit, tomcat, and tomcat9), SUSE (apache-commons-lang3, bind, coreutils, ffmpeg, gnutls, gstreamer-plugins-good, kubernetes1.25, kubernetes1.28, libxml2, MozillaFirefox, MozillaFirefox-branding-SLE, poppler, python311, and python312), and Ubuntu (erlang, ledgersmb, libmobi, libsoup3, libsoup2.4, linux, linux-aws, linux-aws-5.15, linux-gcp, linux-gcp-5.15, linux-gke, linux-gkeop, linux-hwe-5.15, linux-ibm, linux-ibm-5.15, linux-intel-iotg, linux-lowlatency, linux-lowlatency-hwe-5.15, linux-nvidia, linux-nvidia-tegra, linux-nvidia-tegra-5.15, linux-nvidia-tegra-igx, linux-oracle, linux-oracle-5.15, linux, linux-aws, linux-oem-6.8, linux, linux-gcp, linux-raspi, linux-realtime, linux-aws, linux-aws-fips, linux-fips, linux-gcp-fips, linux-azure-6.8, linux-azure-nvidia, linux-hwe-6.8, linux-ibm, linux-ibm-6.8, linux-lowlatency, linux-lowlatency-hwe-6.8, linux-intel-iot-realtime, linux-realtime, linux-intel-iotg-5.15, linux-oem-6.14, linux-raspi, linux-realtime, php7.0, php7.2, php8.1, php8.3, php8.4, python-aiohttp, and rails).

Гласовете на Америка – брой 5

Post Syndicated from Йоанна Елми original https://www.toest.bg/glasovete-na-amerika-broy-5/

Гласовете на Америка – брой 5

Едно от обещанията за този бюлетин е да бъде многогласен, изненадващ, различен. Затова в предпоследния брой преди ваканцията съм ви приготвила нещо, което не може да намерите никъде: новини без мнения. В откос от rapid fire (скорострелен огън) съм подбрала най-интересните и най-важни новини от последните седмици. Защото понякога реалността просто няма нужда от коментар (и често именно коментарите я превръщат в нереалност). 

Докато четете, представете си, че между всеки кратък параграф свири някаква музика или се чува звук като от анимационен филм. Може да ни пишете с идеи.

И така: 

„Много съм изненадан, че Джером Пауъл изобщо е бил назначен начело на Държавния резерв“, коментира на 16 юли президентът Доналд Тръмп, който често недоволства от Пауъл. Тръмп назначи Пауъл през 2017 г.

Министерството на природните богатства на САЩ призова посетителите на националните паркове и исторически монументи – включително на Гражданската война и Втората световна война – да съобщават на властите за „негативни“ описания на „живели в миналото или все още живи американци“. Министерството заяви, че всички описания и интерпретации, които сметне за „неуместни“, ще бъдат премахнати до 17 септември т.г. Критици посочват, че в механизма не е предвидено никакво потвърждаване на изпратената информация или на самоличността на подателя. „Хората в двата края на идеологическия спектър могат да си играят с такива акции, както си поискат, без даже да са стъпвали в националните паркове“, заявява представителка на Коалицията за опазване на националните паркове пред американското Национално радио. 

Върховният съд даде зелена светлина за закриването на Министерството на образованието на САЩ.

Министерството на образованието (МО) разпределя милиарди долари федерални средства към университетите и училищата в САЩ и отговаря за управлението на държавни програми за университетски заеми. Под негово управление е и Кабинетът за граждански права, който издава препоръки как гражданските права могат да бъдат прилагани в училищата и какви услуги, свързани с тези права, може да се предлагат на учениците – например рампи за инвалидни колички.

Законодателството на САЩ забранява на държавата да диктува какво да се преподава в училищата. МО може само да създава политики, които да изискват прилагането на вече съществуващи федерални закони, и отговаря за акредитирането на колежите и университетите. Начело на МО на САЩ в момента е Линда Макмеън, която някои читатели може би познават като бившата шефка на Световната федерация по кеч. Призиви за закриването на МО или за неговото реформиране има още от времето на управлението на Обама, като аргументите за това са, че МО разполага с непропорционални лостове за контрол над образователната система и много от функциите му могат да бъдат преразпределени към други държавни учреждения. 

Случаите на морбили в САЩ достигат до нива отпреди 33 години. 92% от заболелите са неваксинирани или с неизвестен ваксинационен статус, а 4% са получили само първа доза. Най-висок е броят на заболелите в Тексас. По време на посещението си там здравният министър Робърт Кенеди-младши заяви, че според него аутизмът и диабетът заслужават повече внимание от морбилите. Кенеди е скептичен спрямо ваксините и поддържа опроверганото вярване, че те причиняват аутизъм. 

Новият мобилен телефон с бранда на президента Тръмп няма да се произвежда в САЩ. Обещанието е, че това ще стане след време, но първата партида ще дойде от Китай. 

Американското Министерство на земеделието премахва изискванията производителите да водят отчет за използването на отровни и силно вредни химикали и пестициди. Според Министерството това намалява регулаторното бреме над производителите, а според критици ще доведе до безконтролно използване на химикали, отровни за човека. 

Изчерпването на подпочвените води в Големите равнини, където са една четвърт от посевите и се отглежда добитъкът, от който идва 40% от говеждото в САЩ, е заплаха за бъдещето на целия регион и за всички зависещи от произвежданата там храна. 

Едва 136 души са задържани за нелегално преминаване на южната граница на САЩ на 28 юни 2025 г. – това е рекорд за най-малко задържани в историята. 

Досиетата на Джефри Епстийн – за които се оказа, че не съществуват, въпреки че доскоро съществуваха, – всяват разкол сред републиканците.

Разривът е във връзка с публикуването на документите, свързани с финансиста Джефри Епстийн, който е oбвинен в трафик на хора с цел сексуална експлоатация, пише Bloomberg. Водещите съюзници на Доналд Тръмп в Конгреса, включително председателят на Камарата на представителите Майк Джонсън, призоваха президентската администрация да прояви по-голяма прозрачност. Казусът с Епстийн е част от сложна, едва ли не конспиративна теория за педофили, световен заговор и дълбока държава с участието на демократите, поради което решението на Тръмп се приема особено болезнено от избирателите му. Демократите вече се възползваха от политическата възможност и поискаха разследване по случая. Кой е Джефри Епстийн, може да си припомните тук. 

Президентът Тръмп заплаши Русия с мита, ако до 50 дни няма „сделка“ за Украйна. Митата ще бъдат наложени на държави, които имат търговски отношения с Русия. Целта ще бъде да се увеличи натискът над Москва чрез принуда върху търговските ѝ партньори, за които ще стане трудно да купуват или продават в енергийния, земеделския и оръжейния сектор. 

Идеологическата пропаст между американците става все по-дълбока.

Демократите вярват най-много на медиите, на които републиканците най-малко вярват, и обратното. Демократите имат по-разнообразна информационна диета от републиканците според най-новото проучване на PEW Research. И все пак има и малко припокриване, казват авторите с надежда. Или може би надеждата си я измислихме и е коментар. 

Има още много новини – вътрешни, външни… За свикналата на климатик Америка ще е все по-скъпо и по-трудно да се охлажда при все по-високи температури и в съревнование за електроенергия с огромните центрове за данни. Администрацията на Тръмп заяви, че няма да публикува важни доклади за климатичните промени на сайта на NASA, както бе обещано. Наводнения в Тексас взеха жертви, а забавената реакция на властите предизвика остра критика – не на последно място, защото се оказа, че предупреждения за подобни събития е имало от години, а липсата на достатъчно персонал в метеорологичните станции може би е довела до лоша координация. 

Но все пак има и други новини.

Десетилетие след като град Флинт в щата Мичиган стана нарицателно заради това, че жителите са се тровили с олово от старата водопреносна система, градската управа приключи обновяването на цялата мрежа и вече може да осигури чиста вода на населението. В 60% от регионите в САЩ има повече дървета, отколкото преди 20 години. Забраната за ползване на полиетиленови торбички пък е довела до 47% по-малко замърсяване по бреговете на Америка. Електроцентрала в щата Юта ще бъде модернизирана, за да работи с водород, което ще доведе до намаляване на въглеродните емисии и произведена енергия за шест щата. 

Новините са много. Коментарите – още повече. Затова нека се спасим в миналото – в което, както разбрахме по-горе, всичко трябва да бъде добро и положително. Но преди това – последна новина: 

Център за задържане на мигранти, заобиколен от блата с алигатори, бе открит наскоро в Националния парк „Евърглейдс“ във Флорида. Центърът е разположен на мястото на изоставено тренировъчно летище. В района има няколко влажни зони, обитавани от алигатори и питони. Местните власти наричат ​​центъра за задържане „Алигаторският Алкатрас“. 

Гласът на миналото

Гласовете на Америка – брой 5
Карикатура от 1875 г., която представя римокатолическото духовенство като крокодили/алигатори, нахлуващи на американския бряг, за да погълнат децата – бели, чернокожи, американски индианци и китайци. (Белите деца са на преден план, а останалите – на заден.) Сградата на държавното училище се издига като крепост срещу заплахата от теокрация, но е бомбардирана и в знак на бедствие над нея е издигнато знамето на Съединените щати, обърнато наопаки. Източник: Wikimedia Commons 

До началото на XX век евгениката се съсредоточава върху въпросите на расата. За разлика от учените в тази област, ранните нативисти от XIX в. се тревожат повече за религията и как да защитят културно-протестантските основи на Америка от католическите имигранти – повечето от които по това време идват от Ирландия и Германия. В основата на тази тревожност стои една стара параноя: могат ли чужденци, които се кълнат във вярност на папата, да станат верни граждани на републиката? 

„Какво трябва да се направи – пита известният проповедник Лиман Бийчър в свое емблематично съчинение от 1835 г., – за да образоваме милионите, които след двайсет години Европа ще излее върху нас?“


Абонирайте се, за да получавате този бюлетин на електронната си поща в момента, в който излезе!

Вече сте регистриран потребител на Toest.bg? Може директно от настройките на бюлетините в своя профил да изберете „Гласовете на Америка“ или да натиснете бутона по-долу:

Още нямате профил в Toest.bg? Регистрирайте се само с няколко клика:

New Mobile Phone Forensics Tool

Post Syndicated from Bruce Schneier original https://www.schneier.com/blog/archives/2025/07/new-mobile-phone-forensics-tool.html

The Chinese have a new tool called Massistant.

  • Massistant is the presumed successor to Chinese forensics tool, “MFSocket”, reported in 2019 and attributed to publicly traded cybersecurity company, Meiya Pico.
  • The forensics tool works in tandem with a corresponding desktop software.
  • Massistant gains access to device GPS location data, SMS messages, images, audio, contacts and phone services.
  • Meiya Pico maintains partnerships with domestic and international law enforcement partners, both as a surveillance hardware and software provider, as well as through training programs for law enforcement personnel.

From a news article:

The good news, per Balaam, is that Massistant leaves evidence of its compromise on the seized device, meaning users can potentially identify and delete the malware, either because the hacking tool appears as an app, or can be found and deleted using more sophisticated tools such as the Android Debug Bridge, a command line tool that lets a user connect to a device through their computer.

The bad news is that at the time of installing Massistant, the damage is done, and authorities already have the person’s data.

Slashdot thread.

Т.Е. от Е.Т. – епизод 20

Post Syndicated from Тоест original https://www.toest.bg/t-e-ot-e-t-epizod-20/

Т.Е. от Е.Т. – епизод 20

Освен записи, и други неща можем да пуснем. Например някого от високо. Както се разберем. Всичко е въпрос на договорка в този живот.

Следете видеорубриката на Елена Телбис за „Тоест“ и във Facebook, Instagram и TikTok.

Deploying external boot volumes with AWS Outposts

Post Syndicated from Mark Nguyen original https://aws.amazon.com/blogs/compute/deploying-external-boot-volumes-with-aws-outposts/

Building on our previous announcement, AWS Outposts third-party storage integration for data volumes, AWS is expanding its collaboration with third-party storage solutions by introducing support for boot volumes backed by external storage arrays. In this post we show you how to boot Amazon Elastic Compute Cloud (Amazon EC2) instances on Outposts directly from NetApp on-premise enterprise array and Pure Storage FlashArray, providing greater flexibility to align your workload needs for storage.

With this enhancement, you can now:

  • Launch EC2 instances using boot volumes backed by compatible third-party storage arrays
  • Use existing storage management workflows and tools for both boot and data volumes
  • Take advantage of advanced features like storage efficiencies and cloning for cost reduction
  • Migrate compute of existing workloads that rely on external boot volumes to Outposts
  • Employ High Availability (HA) and Disaster Recover (DR) architectures with technologies such as NetApp’s SnapMirror or Pure Storage’s ActiveDR, enabling quick and easy recovery from failures and streamline DR processes.

The boot volume integration is enabled through AWS-provided launch Amazon Machine Images (AMIs) and sample automation scripts. Two methods are supported:

  • Storage Area Network boot (SANboot), which uses Pre-boot eXecution Environment (iPXE) and Internet Small Computer System Interface (iSCSI) to attach an external volume when booting.
  • Outposts localboot, which hydrates a local Non-Volatile Memory Express (NVMe) volume using iSCSI or NVMe-over-TCP, prior to booting.

The added third-party boot volume support further strengthens the commitment of AWS to providing flexible, enterprise-grade storage options for you while maintaining the automation tenants of the AWS experience.

SANboot solution overview

SANboot is a method of booting an EC2 instance from a block volume stored on a remote storage device. iPXE is an open source boot firmware that allows computers to boot from a network location, and when combined with iSCSI, it enables the start up of an operating system (OS) from a remote iSCSI target. In this case, the iSCSI target is a third-party storage system. The EC2 instance boots from the remote block volume as if it were a local disk. Read/write operations within the OS are written directly to the external storage array.

The instance can be shutdown and the data remains persistent on the third-party storage device. iPXE is stateless by design, thus subsequent boots must go through the full SANboot process. Snapshots of the volumes can be performed by the external storage device.

SANboot prerequisites

The following prerequisites are necessary for SANboot:

  1. An Outposts rack or Outposts 2U server. Outposts 1U server is not supported.
  2. An external storage system with IP reachability to the Outposts local network through a local gateway (LGW) or local network interface (LNI).
  3. An Amazon EC2 bootable image stored as a block volume on the external storage system.
    1. The block volume should be configured with an iSCSI IQN
    2. At the time of this post, only Windows 2022 (or newer) and Red Hat Linux 9 are supported operating systems
  4. (optional) Authentication credentials stored in AWS Secrets Manager if authentication is needed.
    1. If Secrets Manager is used, your EC2 instance profile needs the following minimum required permissions:
      {
          "Version": "2012-10-17",
          "Statement": [
              {
                   "Sid": "SecretsManagerPermissions",
                   "Effect": "Allow",
                   "Action": [
                        "secretsmanager:GetSecretValue"
                   ],
                   "Resource": "<secret name>"
              }
          ] 
      }

  5. (optional) Use Outposts SANboot script from AWS Samples downloaded onto your management computer. Your computer must be capable of running Python scripts and connected to both the external storage system and the AWS Region.

SANboot deployment overview

The following diagram shows the workflow when launching an EC2 instance using SANboot.

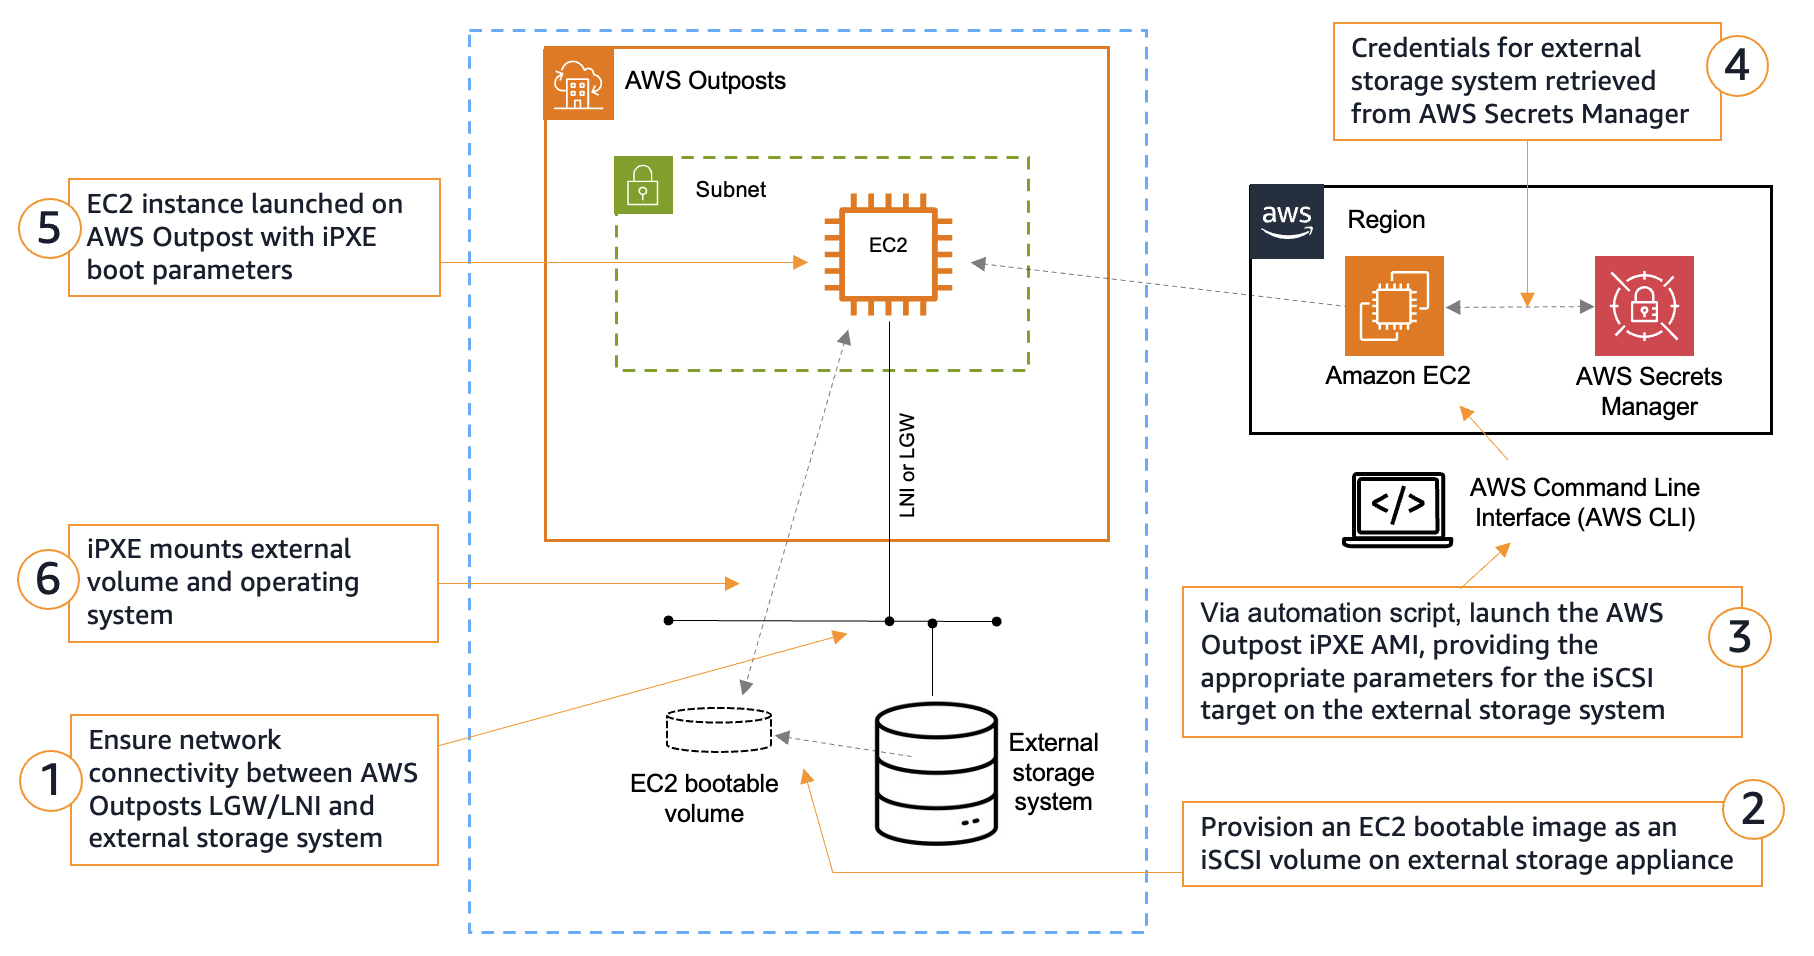
Figure 1 - SANboot workflow

Figure 1 – SANboot workflow

  1. The Outposts must have network connectivity to the external storage system through the Outposts local network connection. Specifically, the EC2 instances must communicate to the storage system. This should be a high speed connection with low latency (recommended 10Gbps or more, and under 10ms round trip). The Outposts and storage system do not have to be on the same subnet, instead they just need IP reachability.
    1. For Outposts racks, the EC2 instance connects through the LGW.
    2. For Outposts 2U servers, the EC2 instance connects through the LNI.
  2. The boot volume must be an Amazon EC2 bootable image. This includes the appropriate settings and drivers for the respective OS.
  3. Run the SANboot automation script and follow the prompts to enter the relevant parameters for your boot volume. This information is used to populate the Multipurpose Internet Mail Extension (MIME) multipart user data that iPXE uses for its initial configuration. See the following section on SANboot script walkthrough for more information.
  4. (optional) If iSCSI authentication is enabled, the SANboot automation script retrieves the credentials of the iSCSI target stored in Secrets Manager to be later populated to the iPXE script.
  5. The iPXE boot AMI launches its firmware image and executes the iPXE script. This script contains the necessary information to mount the remote iSCSI block volume. This includes the iSCSI intiator settings, the IP address of the iSCSI target, the credentials, the iSCSI port, and the iSCSI IQN. The iPXE boot AMI is a relatively small image that is pulled down from the Region. The time it takes to launch the iPXE image depends on the bandwidth of the Outposts service link connection to the Region.
  6. The iPXE firmware establishes the iSCSI connection to the target and boots the OS from the remote storage device over the local network. If applicable, then more user data information can be passed to the booting OS. The time it takes for the OS to boot depends on the speed of the local area network.

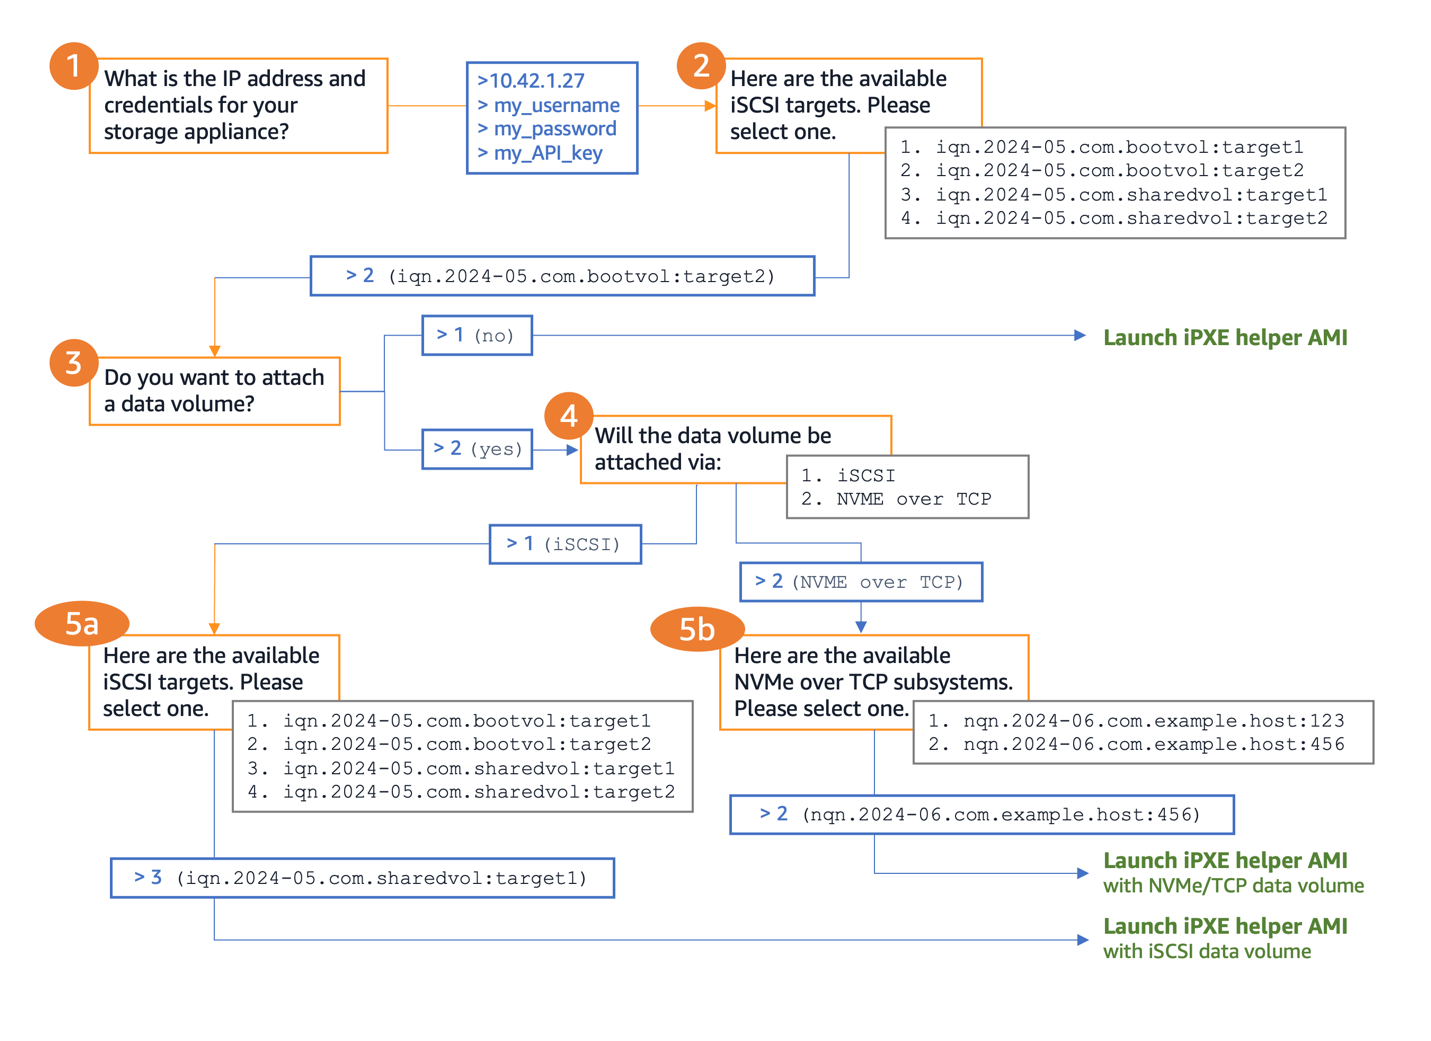
SANboot sample script walkthrough

The following diagram shows the workflow for executing the SANboot sample script.

These are the questions you step through as you run the SANboot automation script

Figure 2 – SANboot automation script walkthrough

Outposts localboot solution overview

Outposts localboot, using iSCSI or NVMe-over-TCP, is a method of booting an EC2 instance using a copy of a boot volume retrieved from a remote storage device. The original source image is not modified and remains unchanged. First, a localboot AMI is launched as a helper instance to facilitate the copying of the boot volume. The localboot instance acts as the iSCSI initiator or NVMe-over-TCP host, and mounts the remote boot volume from the third-party storage system. Then, the block volume is copied to local instance storage on the EC2 instance. The EC2 instance reboots using the local instance storage volume.

Localboot uses instance store volumes, which are ephemeral in nature. The boot volume is deleted when the EC2 instance that it is attached to is terminated or stopped. This is suitable for temporary guest desktop access or read-only workloads. Data volumes from external storage can also be mounted during the localboot process, which can be used to store data persistently.

Localboot prerequisites

The following prerequisites are necessary for localboot:

  1. An Outposts rack or Outposts 2U server.
  2. An external storage system with IP reachability to the Outposts local network through an LGW or LNI.
  3. An Amazon EC2 bootable image stored as a block volume on the external storage system.
    1. The block volume should be configured with an iSCSI IQN or NVMe-over-TCP NQN.
    2. At the time of this post, Red Hat Linux 9 is the only supported operating system.
  4. If using Outposts rack, instance types must have local NVMe drives to support instance store volumes. These include the C/M/R “d” type instances such as c5d, m5d, or r7d.
  5. Boot volumes on third-party storage systems must fit within the instance store of the instance type chosen. For example, an m5d.xlarge has one 150GB NVMe SSD for the instance store. The boot volume must be under 150GB to fit within an m5d.xlarge instance store. If the boot volume is larger, then a larger instance type must be chosen, such as an m5d.2xlarge (which has a 300GB NVMe SSD).
  6. (optional) Authentication credentials are stored in Secrets Manager if authentication is needed.
    1. If Secrets Manager is used, your EC2 instance profile needs the following minimum required permissions:
      {
          "Version": "2012-10-17",
          "Statement": [
              {
                   "Sid": "SecretsManagerPermissions",
                   "Effect": "Allow",
                   "Action": [
                        "secretsmanager:GetSecretValue"
                   ],
                   "Resource": "<secret name>"
              }
          ] 
      }

  7. (optional) Outposts localboot script from AWS Samples downloaded onto your management computer. Your computer must be capable of running Python scripts and connected to both the external storage system and the Region.

Localboot deployment overview

The following diagram shows the workflow when launching an EC2 instance using localboot.

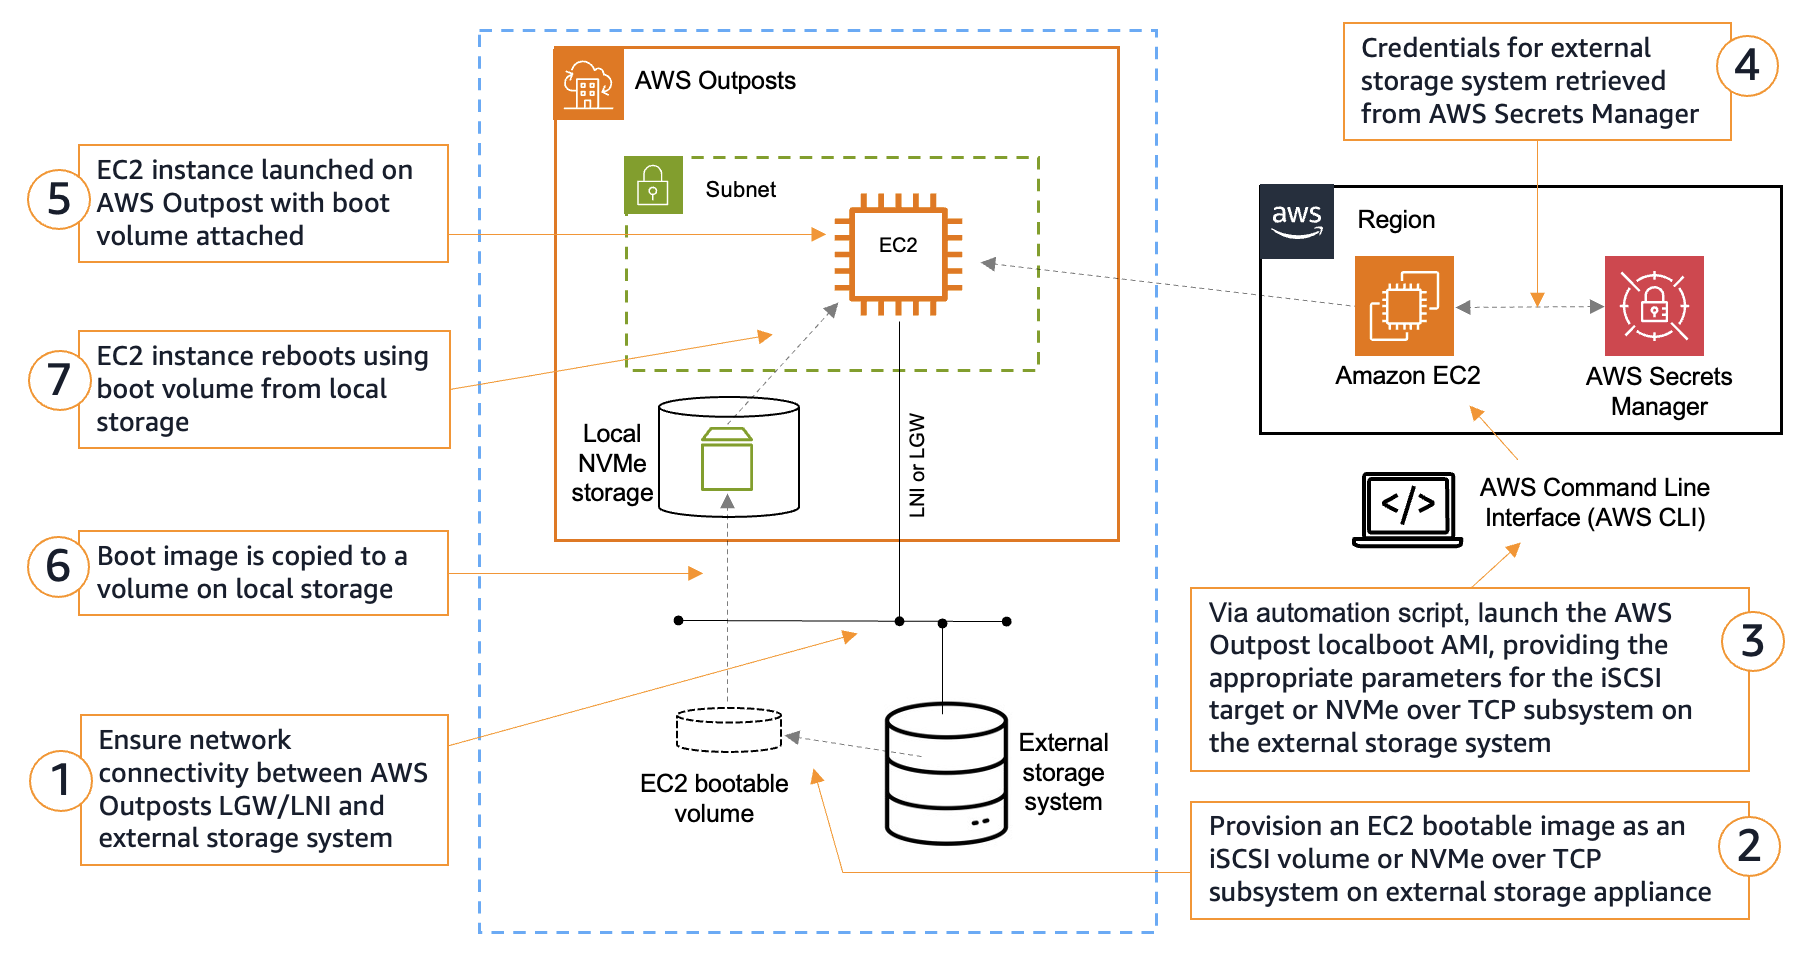
Figure 3 - Localboot workflow

Figure 3 – Localboot workflow

Steps 1 and 2 are the same as SANboot deployment, see instructions above. Starting with step 3 for localboot:

  1. Run the localboot automation script and follow the prompts to enter the relevant parameters for your boot volume. This information is used to populate the MIME multipart user data that the localboot instance uses to mount the external boot volume. Go to the following localboot script walkthrough. The user data contains the necessary information to mount the remote iSCSI or NVMe-over-TCP block volume.
  2. (Optional) The localboot automation script retrieves the credentials of the external storage appliance stored in Secrets Manager.
  3. The localboot AMI is downloaded from the Region and launched. This can take a few minutes depending on the speed of the Outposts service link connection to the Region. When booting, the localboot AMI runs the user data script to attach the boot volume from the third-party storage system.
  4. The mounted boot volume is then copied to the local instance storage of the EC2 instance and configured as the boot partition. The time it takes to copy depends on the speed of your local network. When the copying is completed, the EC2 instance reboots using the newly configured boot partition.
  5. A copy of the boot volume is booted as a new EC2 instance. If applicable, then more user data information (such as mounting a data volume) can be passed to the booting OS.

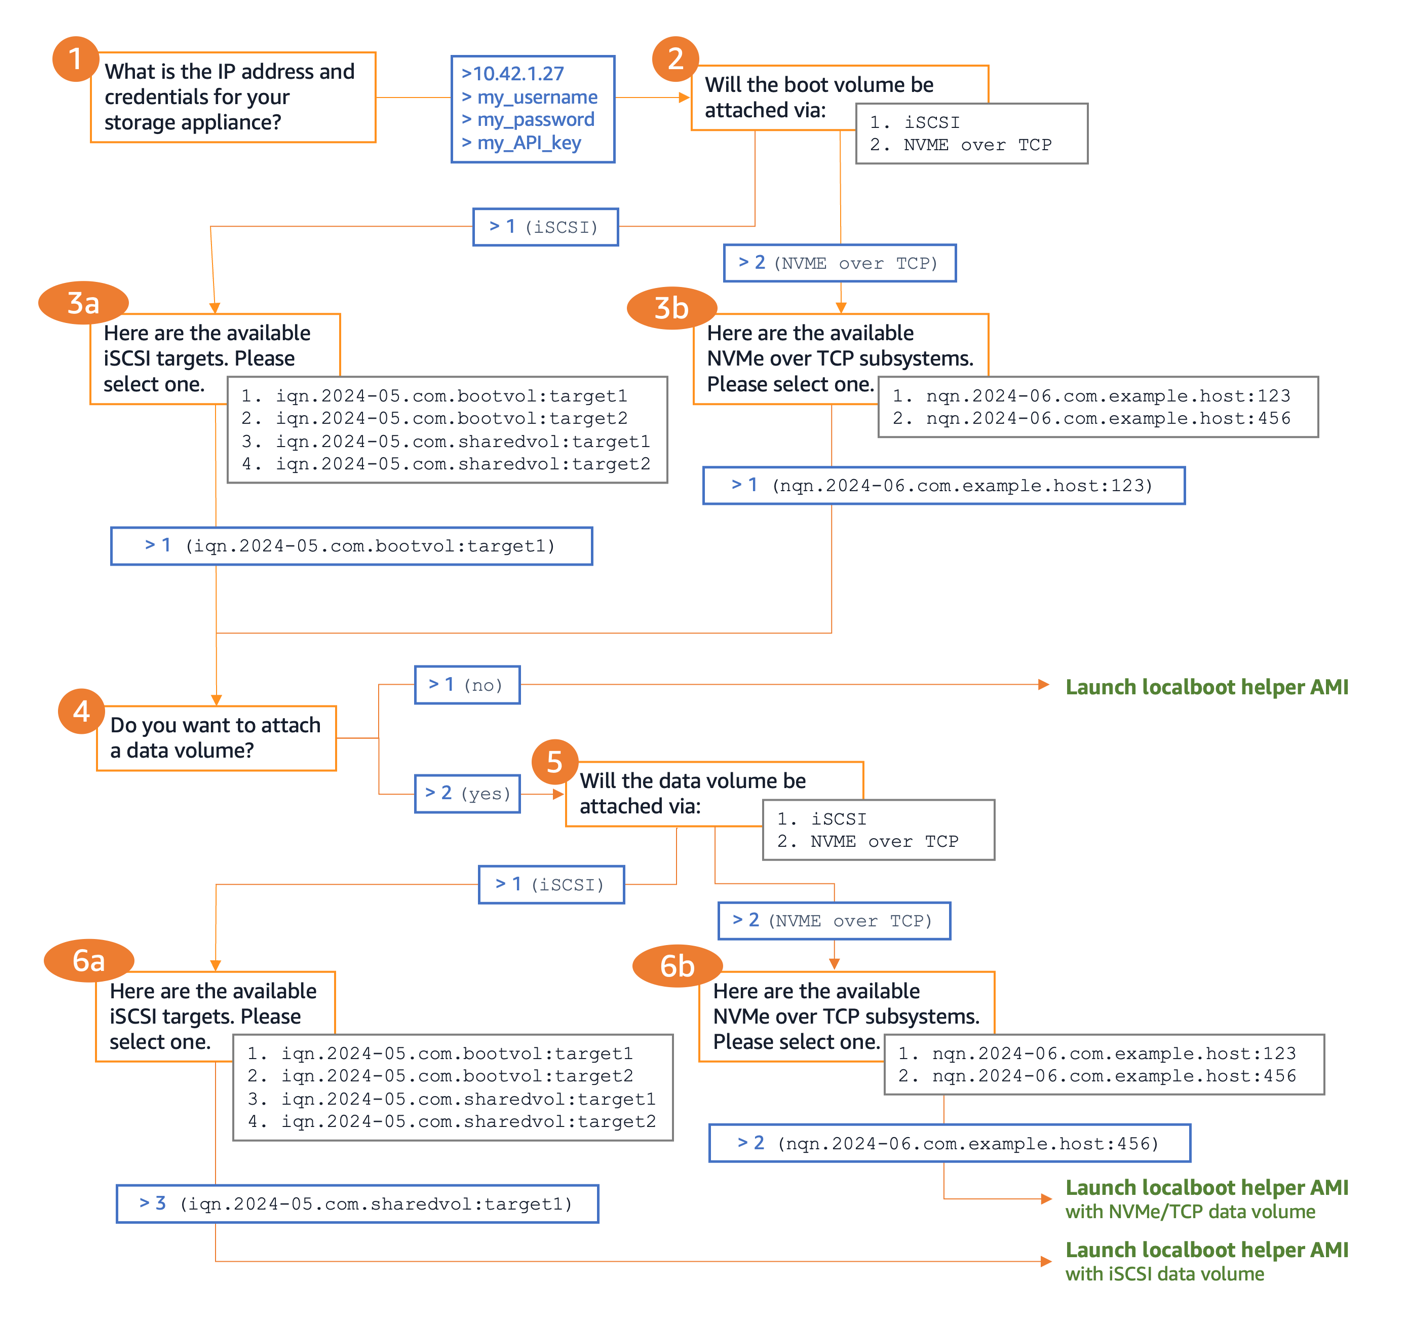
Outposts localboot sample script walkthrough

The following diagram shows the workflow for running the localboot sample script.

These are the questions you step through as you run the localboot automation script

Figure 4 – Localboot automation script walkthrough

Conclusion

The introduction of third-party boot volume support allows you to continue getting value from your existing investments in external shared storage by connecting these arrays with Amazon EC2 on Outposts. Both the SANboot and localboot methods allow you to integrate your existing storage solutions with AWS Outposts, enabling them to boot EC2 instances directly from NetApp on-premise enterprise storage arrays and Pure Storage FlashArray volumes. This capability not only enhances storage options for EC2 instances running on Outposts but also streamlines workload migration and offers advanced features such as storage efficiencies for boot volumes. Automated configuration scripts and AWS-provided helper AMIs allow you to maintain the seamless and automated experience expected from AWS, while also giving you the flexibility to use your preferred enterprise storage solutions. Combined with the previously announced support for data volumes, this development further demonstrates the commitment of AWS to offering flexible solutions that can integrate into your existing hybrid environments.

To speak to an Outposts expert and learn more, submit this form.

To learn more about how NetApp and Pure Storage solutions work with Outposts, read the NetApp on-premises storage arrays for AWS Outposts blog post and the Pure Storage FlashArray for AWS Outposts blog post.

Integrating Amazon OpenSearch Ingestion with Amazon RDS and Amazon Aurora

Post Syndicated from Michael Torio original https://aws.amazon.com/blogs/big-data/integrating-amazon-opensearch-ingestion-with-amazon-rds-and-amazon-aurora/

Unlocking powerful search capabilities for millions of items should be fast, accurate, and effortless while maintaining high relevance. Relational databases are a popular storage method for structured data, and organizations use them extensively to store their core business information. Although relational databases excel at storing and retrieving structured data, they often struggle with searching through large blocks of unstructured text and, for performance reasons, typically don’t index all columns.

In contrast, search engines such as OpenSearch index all fields, enabling rich search capabilities, including semantic search, and powerful aggregations for summarizing and analyzing numeric data. Traditionally, organizations have managed complex, inefficient, and expensive data synchronization processes, including extract, transform, and load (ETL) pipelines, to keep their search indices up to date with their databases. Those looking to enhance their applications with advanced search features need a simpler solution that can maintain search index synchronization with their databases without the overhead of managing custom data sync processes.

We are happy to announce the general availability of the integration of Amazon OpenSearch Service with Amazon Relational Database Service (Amazon RDS) and Amazon Aurora. This new integration eliminates complex data pipelines and enables near real-time data synchronization between Amazon Aurora (including Amazon Aurora MySQL-Compatible Edition and Amazon Aurora PostgreSQL-Compatible Edition) and Amazon RDS databases (including Amazon RDS for MySQL and Amazon RDS for PostgreSQL), and Amazon OpenSearch Service, unlocking advanced search capabilities such as hybrid search, ranked results, and faceted search on transactional databases. You can now deliver low-latency, high-throughput search results, live inventory updates, and personalized recommendations while focusing on creating exceptional customer experiences instead of managing data synchronization. This integration reduces the operational burden of maintaining complex ETL pipelines, reducing costs while providing instant data availability for search operations.

Amazon OpenSearch Ingestion provides near real-time data synchronization between Amazon Aurora or Amazon RDS and OpenSearch Service. Select your Aurora or RDS database, and OpenSearch Ingestion handles the rest, supporting both Aurora MySQL or RDS for MySQL (8.0 and above) and Aurora PostgreSQL or RDS for PostgreSQL (16 and above).

Solution overview

Here’s how these services work together:

  • Data ingestion – OpenSearch Ingestion first loads your database snapshot from Amazon Simple Storage Service (Amazon S3), where Aurora or Amazon RDS has exported the initial data. It then uses Aurora or Amazon RDS change data capture (CDC) streams to replicate further changes in near real time and indexes them into OpenSearch Service. This automated process keeps your data is consistently up to date in OpenSearch, making it readily available for search and analysis without manual intervention.
  • Real-time querying – OpenSearch Service offers powerful query capabilities that enable you to perform complex searches and aggregations on your data. Whether you need to analyze trends, detect anomalies, or perform search queries to return relevant results for your application, OpenSearch Service provides the tools you need.

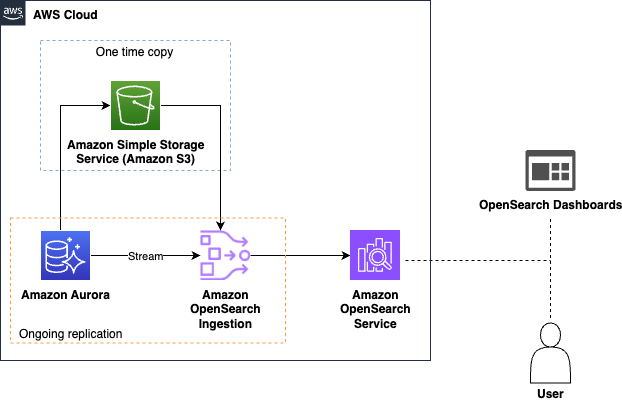
The following diagram illustrates the solution architecture for Amazon Aurora as a source:

A diagram of a processAI-generated content may be incorrect.

Getting Started

Configuring Your Database Source

Before setting up synchronization, you need to configure your source database’s logging settings. For Aurora MySQL, configure your cluster parameter group with enhanced binary log settings. For Amazon RDS, enable basic binary logging or logical replication through your instance parameter group settings. These logging configurations enable OpenSearch Ingestion to capture and replicate data changes from your database.

The sample HR database with Aurora MySQL is a good example to show how this integration works.

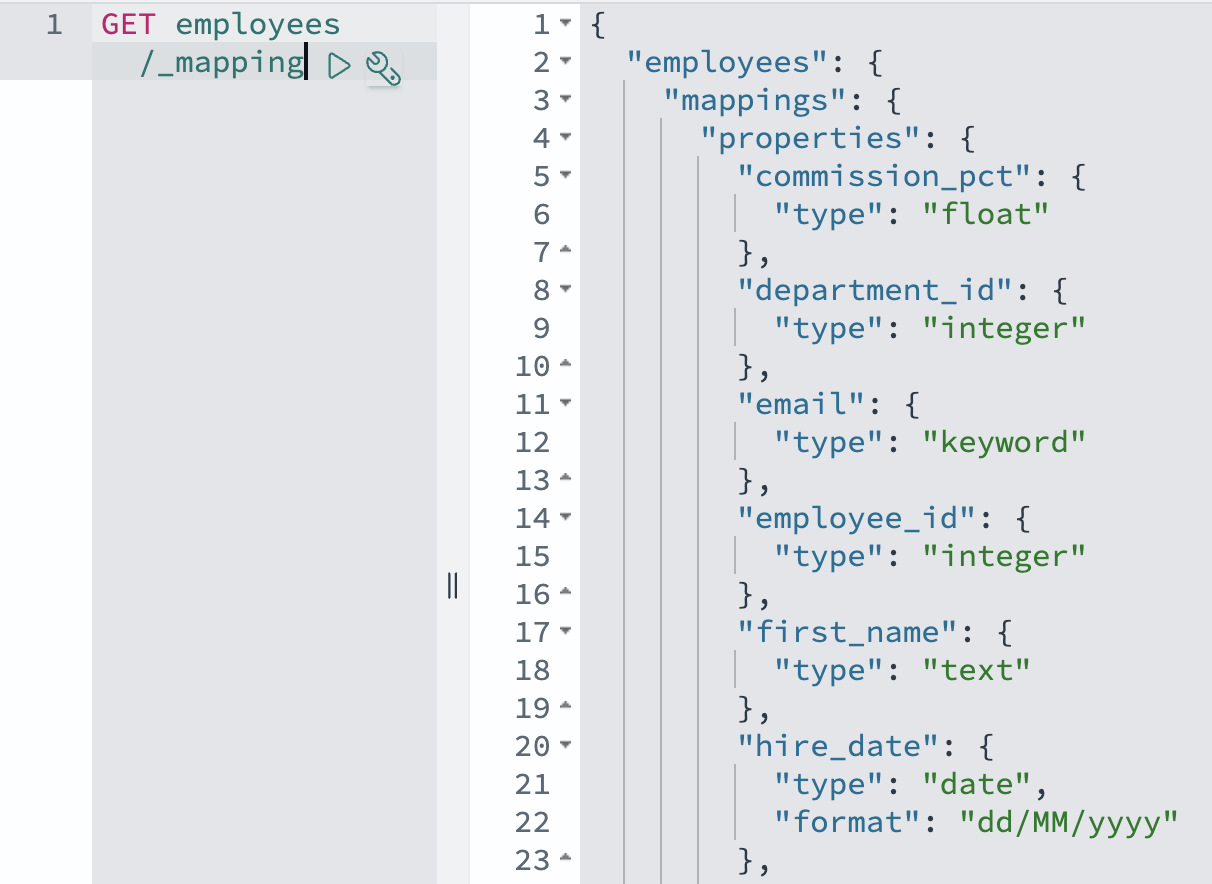
Before creating the view, we now explain how OpenSearch will represent this data. OpenSearch mappings define how documents and their fields are stored and indexed, similar to how a database schema defines tables and columns. The OpenSearch Ingestion pipeline uses dynamic mappings by default, automatically converting Aurora or Amazon RDS data types to appropriate OpenSearch field types. For example, database DATE fields become OpenSearch date types, and numeric fields are mapped to corresponding OpenSearch numeric types. Although you can customize these mappings using index templates, the default mappings typically handle common data types correctly, including dates, numbers, and text fields.

GET employees/_mapping

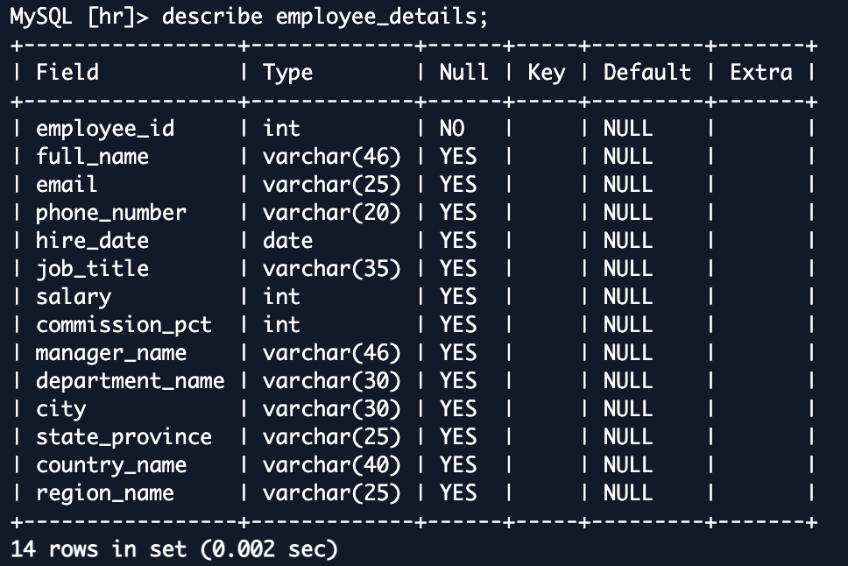
To demonstrate the integration’s ability to handle complex data relationships, we now examine how OpenSearch Ingestion handles joined data. We create a view in the sample HR database that combines information from multiple related tables into a single, searchable document in OpenSearch. This approach shows how you can transform normalized database structures into denormalized documents that are optimized for search operations.

This employee_details view combines data from multiple tables, creating a rich, denormalized representation of employee information. When replicated to OpenSearch, this view becomes a single, comprehensive document for each employee. This structure is ideal for search operations, allowing for fast and complex queries across what were originally separate tables. For example, you could easily search for employees in a specific department and country or analyze salary distributions across regions—queries that would be more complex and potentially slower in the original normalized database structure.

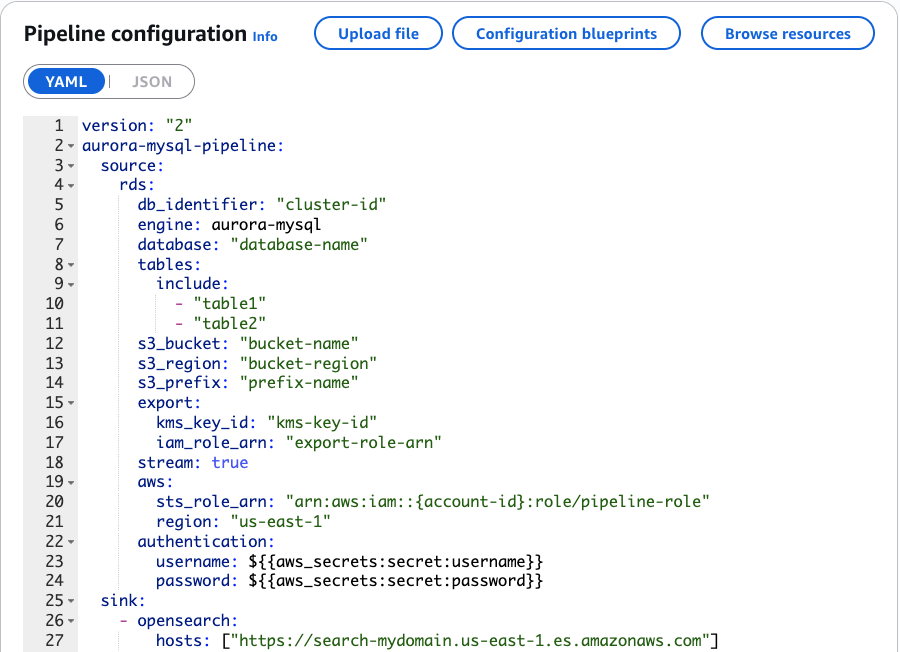
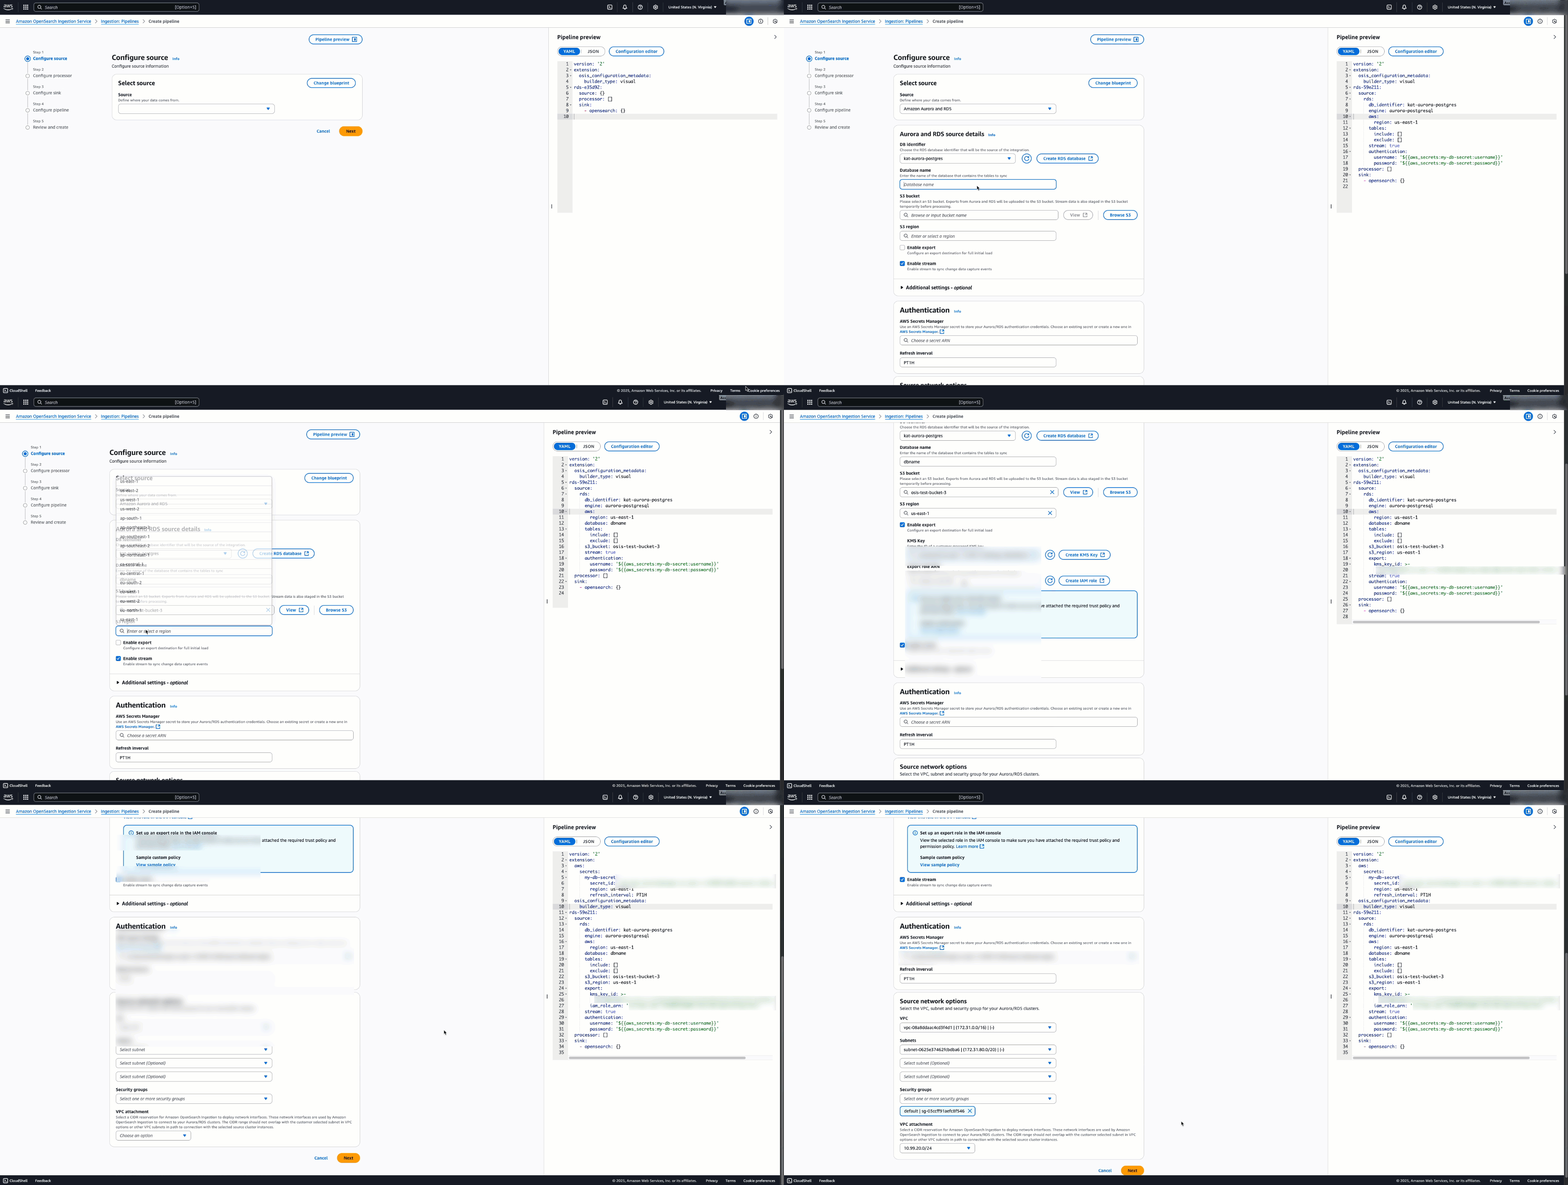
In the pipeline configuration shown in the following screenshot, you can check how OpenSearch Ingestion connects to the HR database. The configuration identifies the source database and the specific tables we want to replicate. While we created a view to understand the data relationships, the pipeline tracks changes from the underlying base tables (employees, departments, locations, and regions). OpenSearch Ingestion automatically maintains these relationships, which means that changes to these tables are properly reflected in your OpenSearch index, keeping your search data consistent with your source database.

In the gif shown below, you can see a demo of setting up this integration using the visual editor of OpenSearch Ingestion.

You can also specify index mapping templates to map your Aurora or Amazon RDS fields to the correct fields in your OpenSearch Service indexes.

For a comprehensive overview of configuration settings for the pipeline, refer to the OpenSearch Data Prepper documentation. You must set up AWS Identity and Access Management (IAM) roles for the pipeline. For instructions, refer to Configure the pipeline role.

After you configure the integration in OpenSearch Ingestion, the pipeline automatically creates indexes that you can view in OpenSearch Dashboards. OpenSearch Ingestion first triggers an automatic export of your Aurora or Amazon RDS database to Amazon S3, then loads this snapshot data from S3 into your OpenSearch cluster to create the initial indices. After this initial load, OpenSearch Ingestion continually captures changes using binary logs (binlog) for MySQL-based databases or write-ahead logs (WAL) for PostgreSQL-based databases. This way, your OpenSearch indices stay synchronized with your source database in near real time. You can view your indices in OpenSearch Dashboards by invoking:

GET _cat/indices

Example response:

Demonstrating near real time data synchronization

Consider the first five entries in the employee table:

When you make changes to your database, OpenSearch Ingestion updates Amazon OpenSearch Service with the change data. For example, the following code updates an employee’s salary:

UPDATE hr.employees SET SALARY = 26000 WHERE EMPLOYEE_ID = 100;

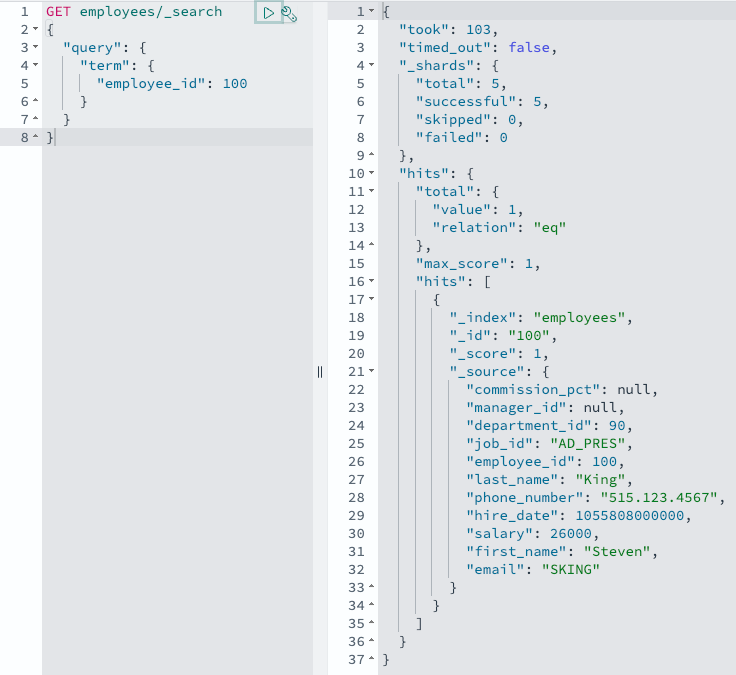
Amazon Aurora sends out a change notice, your OpenSearch Ingestion pipeline picks it up, and OpenSearch Ingestion sends the changed record to OpenSearch in near real time. You can verify this with an OpenSearch query:

GET employees/_search

Important details about this feature:

  • Monitoring – Track pipeline performance and data synchronization through CloudWatch metrics and the OpenSearch Ingestion dashboard
  • Limitations – Requires same-Region and same-account deployment, primary keys for optimal synchronization, and currently has no data definition language (DDL) statement support

Conclusion

Amazon Aurora or Amazon RDS integration with Amazon OpenSearch Service is now generally available in all AWS Regions where OpenSearch Ingestion is available.

To learn more, refer to the AWS documentation for Aurora or Amazon RDS integration with Amazon OpenSearch Service:


About the authors

Michael Torio is an Associate Specialist Solutions Architect at AWS focused on Amazon OpenSearch Service based out of Mountain View, CA. Michael enjoys helping customers leverage cloud technologies to solve their business challenges.

Sohaib Katariwala is a Senior Specialist Solutions Architect at AWS focused on Amazon OpenSearch Service based out of Chicago, IL. His interests are in all things data and analytics. More specifically he loves to help customers use AI in their data strategy to solve modern day challenges.

Arjun Nambiar is a Product Manager with Amazon OpenSearch Service. He focuses on ingestion technologies that enable ingesting data from a wide variety of sources into Amazon OpenSearch Service at scale. Arjun is interested in large-scale distributed systems and cloud-centered technologies, and is based out of Seattle, Washington.
Scale your AWS Glue for Apache Spark jobs with R type, G.12X, and G.16X workers

Post Syndicated from Noritaka Sekiyama original https://aws.amazon.com/blogs/big-data/scale-your-aws-glue-for-apache-spark-jobs-with-r-type-g-12x-and-g-16x-workers/

With AWS Glue, organizations can discover, prepare, and combine data for analytics, machine learning (ML), AI, and application development. At its core, AWS Glue for Apache Spark jobs operate by specifying your code and the number of Data Processing Units (DPUs) needed, with each DPU providing computing resources to power your data integration tasks. However, although the existing workers effectively serve most data integration needs, today’s data landscapes are becoming increasingly complex at larger scale. Organizations are dealing with larger data volumes, more diverse data sources, and increasingly sophisticated transformation requirements.

Although horizontal scaling (adding more workers) effectively addresses many data processing challenges, certain workloads benefit significantly from vertical scaling (increasing the capacity of individual workers). These scenarios include processing large, complex query plans, handling memory-intensive operations, or managing workloads that require substantial per-worker resources for operations such as large join operations, complex aggregations, and data skew scenarios. The ability to scale both horizontally and vertically provides the flexibility needed to optimize performance across diverse data processing requirements.

Responding to these growing demands, today we are pleased to announce the general availability of AWS Glue R type, G.12X, and G.16X workers, the new AWS Glue worker types for the most demanding data integration workloads. G.12X and G.16X workers offer increased compute, memory, and storage, making it possible for you to vertically scale and run even more intensive data integration jobs. R type workers offer increased memory to meet even more memory-intensive requirements. Larger worker types not only benefit the Spark executors, but also in cases where the Spark driver needs larger capacity—for instance, because the job query plan is large. To learn more about Spark driver and executors, see Key topics in Apache Spark.

This post demonstrates how AWS Glue R type, G.12X, and G.16X workers help you scale up your AWS Glue for Apache Spark jobs.

R type workers

AWS Glue R type workers are designed for memory-intensive workloads where you need more memory per worker than G worker types. G worker types run with a 1:4 vCPU to memory (GB) ratio, whereas R worker types run with a 1:8 vCPU to memory (GB) ratio. R.1X workers provide 1 DPU, with 4 vCPU, 32 GB memory, and 94 GB of disk per node. R.2X workers provide 2 DPU, with 8 vCPU, 64 GB memory, and 128 GB of disk per node. R.4X workers provide 4 DPU, with 16 vCPU, 128 GB memory, and 256 GB of disk per node. R.8X workers provide 8 DPU, with 32 vCPU, 256 GB memory, and 512 GB of disk per node. As with G worker types, you can choose R type workers with a single parameter change in the API, AWS Command Line Interface (AWS CLI), or AWS Glue Studio. Regardless of the worker used, the AWS Glue jobs have the same capabilities, including automatic scaling and interactive job authoring using notebooks. R type workers are available with AWS Glue 4.0 and 5.0.

The following table shows compute, memory, disk, and Spark configurations for each R worker type.

AWS Glue Worker Type DPU per Node vCPU Memory (GB) Disk (GB) Approximate Free Disk Space (GB) Number of Spark Executors per Node Number of Cores per Spark Executor
R.1X 1 4 32 94 44 1 4
R.2X 2 8 64 128 78 1 8
R.4X 4 16 128 256 230 1 16
R.8X 8 32 256 512 485 1 32

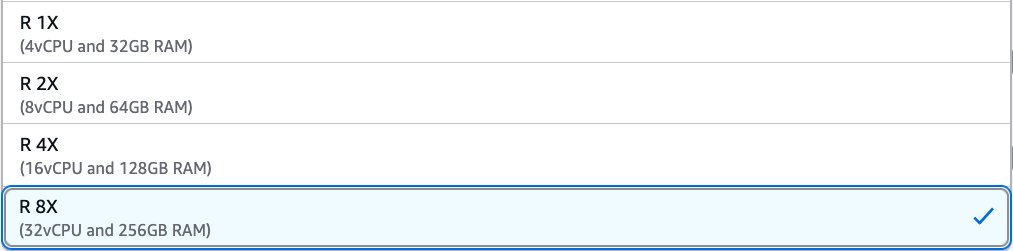
To use R type workers on an AWS Glue job, change the setting of the worker type parameter. In AWS Glue Studio, you can choose R 1X, R 2X, R 4X, or R 8X under Worker type.

In the AWS API or AWS SDK, you can specify R worker types in the WorkerType parameter. In the AWS CLI, you can use the --worker-type parameter in a create-job command.

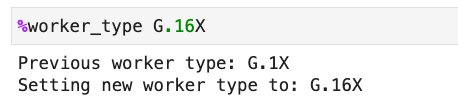
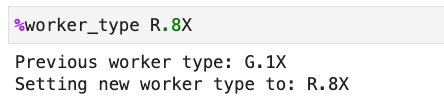
To use R worker types on an AWS Glue Studio notebook or interactive sessions, set R.1X, R.2X, R.4X, or R.8X in the %worker_type magic:

R type workers are priced at $0.52 per DPU-hour for each job, billed per second with a 1-minute minimum.

G.12X and G.16X workers

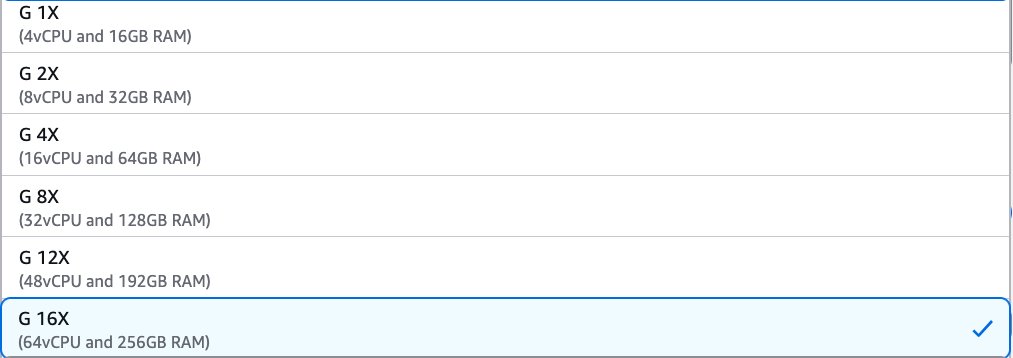
AWS Glue G.12X and G.16X workers give you more compute, memory, and storage to run your most demanding jobs. G.12X workers provide 12 DPU, with 48 vCPU, 192 GB memory, and 768 GB of disk per worker node. G.16X workers provide 16 DPU, with 64 vCPU, 256 GB memory, and 1024 GB of disk per node. G.16x is double the resources of the existing largest worker type G.8X. You can enable G.12X and G.16X workers with a single parameter change in the API, AWS CLI, or AWS Glue Studio. Regardless of the worker used, the AWS Glue jobs have the same capabilities, including automatic scaling and interactive job authoring using notebooks. G.12X and G.16X workers are available with AWS Glue 4.0 and 5.0.The following table shows compute, memory, disk, and Spark configurations for each G worker type.

AWS Glue Worker Type DPU per Node vCPU Memory (GB) Disk (GB) Approximate Free Disk Space (GB) Number of Spark Executors per Node Number of Cores per Spark Executor
G.025X 0.25 2 4 84 34 1 2
G.1X 1 4 16 94 44 1 4
G.2X 2 8 32 138 78 1 8
G.4X 4 16 64 256 230 1 16
G.8X 8 32 128 512 485 1 32
G.12X (new) 12 48 192 768 741 1 48
G.16X (new) 16 64 256 1024 996 1 64

To use G.12X and G.16X workers on an AWS Glue job, change the setting of the worker type parameter to G.12X or G.16X. In AWS Glue Studio, you can choose G 12X or G 16X under Worker type.

In the AWS API or AWS SDK, you can specify G.12X or G.16X in the WorkerType parameter. In the AWS CLI, you can use the --worker-type parameter in a create-job command.

To use G.12X and G.16X on an AWS Glue Studio notebook or interactive sessions, set G.12X or G.16X in the %worker_type magic:

G type workers are priced at $0.44 per DPU-hour for each job, billed per second with a 1-minute minimum. This is the same pricing as the existing worker types.

Choose the right worker type for your workload

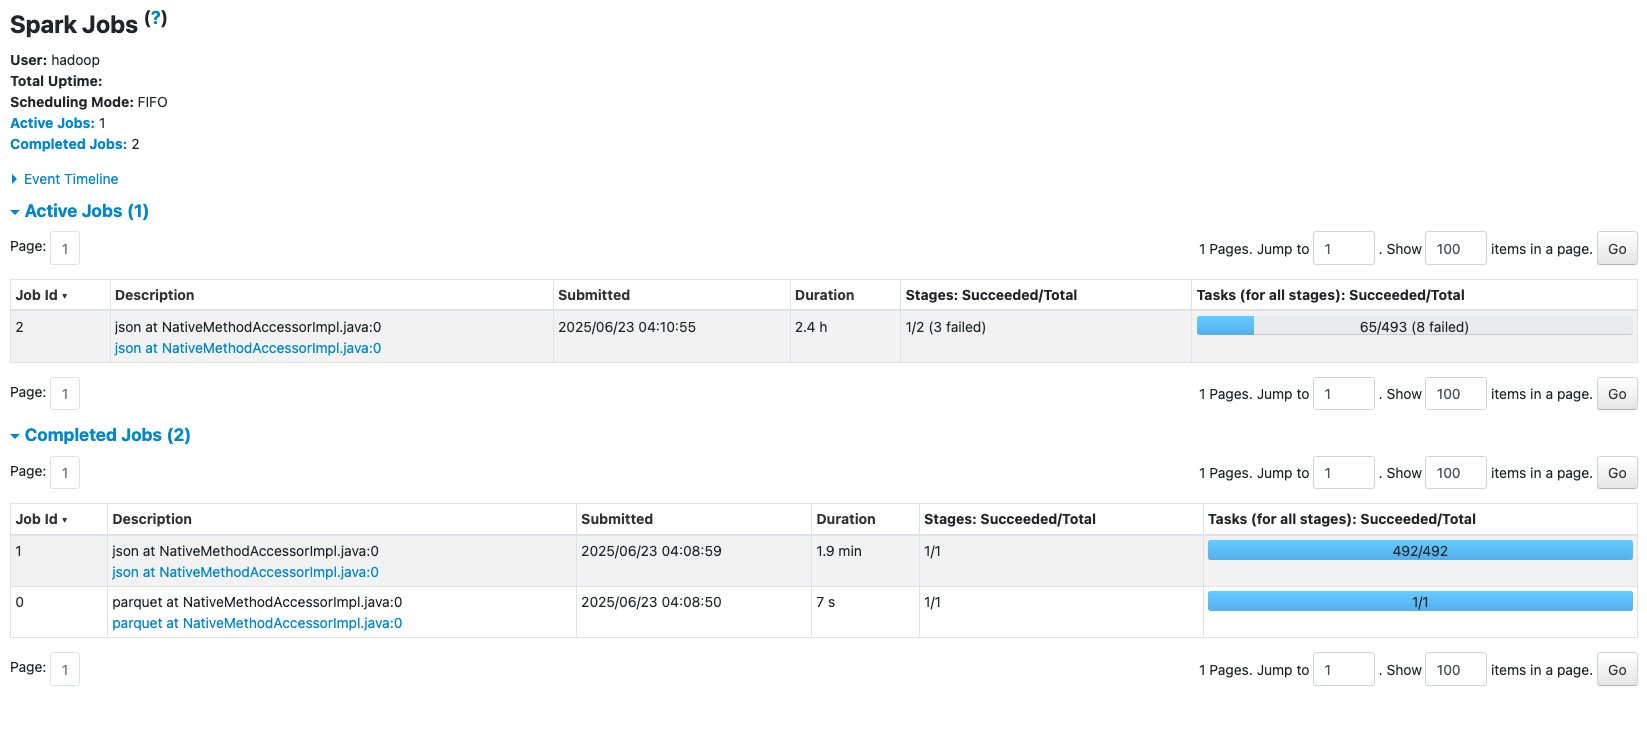
To optimize job resource utilization, run your expected application workload to identify the ideal worker type that aligns with your application’s requirements. Start with general worker types like G.1X or G.2X, and monitor your job run from AWS Glue job metrics, observability metrics, and Spark UI. For more details about how to monitor the resource metrics for AWS Glue jobs, see Best practices for performance tuning AWS Glue for Apache Spark jobs.

When your data processing workload is well distributed across workers, G.1X or G.2X work very well. However, some workloads might require more resources per worker. You can use the new G.12X, G.16X, and R type workers to address them. In this section, we discuss typical use cases where vertical scaling is effective.

Large join operations

Some joins might involve large tables where one or both sides need to be broadcast. Multi-way joins require multiple large datasets to be held in memory. With skewed joins, certain partition keys have disproportionately large data volumes. Horizontal scaling doesn’t help when the entire dataset needs to be in memory on each node for broadcast joins.

High-cardinality group by operations

This use case includes aggregations on columns with many unique values, operations requiring maintenance of large hash tables for grouping, and distinct counts on columns with high uniqueness. High-cardinality operations often result in large hash tables that need to be maintained in memory on each node. Adding more nodes doesn’t reduce the size of these per-node data structures.

Window functions and complex aggregations

Some operations might require a large window frame, or involve computing percentiles, medians, or other rank-based analytics across large datasets, in addition to complex grouping sets or CUBE operations on high-cardinality columns. These operations often require keeping large portions of data in memory per partition. Adding more nodes doesn’t reduce the memory requirement for each individual window or grouping operation.

Complex query plans

Complex query plans can have many stages and deep dependency chains, operations requiring large shuffle buffers, or multiple transformations that need to maintain large intermediate results. These query plans often involve large amounts of intermediate data that need to be held in memory. More nodes don’t necessarily simplify the plan or reduce per-node memory requirements.

Machine learning and complex analytics

With ML and analytics use cases, model training might involve large feature sets, wide transformations requiring substantial intermediate data, or complex statistical computations requiring entire datasets in memory. Many ML algorithms and complex analytics require the entire dataset or large portions of it to be processed together, which can’t be effectively distributed across more nodes.

Data skew scenarios

In some data skew scenarios, you might have to process heavily skewed data where certain partitions are significantly larger, or perform operations on datasets with high-cardinality keys, leading to uneven partition sizes. Horizontal scaling can’t address the fundamental issue of data skew, where some partitions remain much larger than others regardless of the number of nodes.

State-heavy stream processing

State-heavy stream processing can include stateful operations with large state requirements, windowed operations over streaming data with large window sizes, or processing micro-batches with complex state management. Stateful stream processing often requires maintaining large amounts of state per key or window, which can’t be easily distributed across more nodes without compromising the integrity of the state.

In-memory caching

These scenarios might include large datasets that must be be cached for repeated access, iterative algorithms requiring multiple passes over the same data, or caching large datasets for fast access, which often requires keeping substantial portions of data in each node’s memory. Horizontal scaling might not help if the entire dataset needs to be cached on each node for optimal performance.

Data skew example scenarios

Several common patterns can typically cause data skew, such as sorting or groupBy transformations on columns with non-uniformed value distributions, and join operations where certain keys appear more frequently than other keys.

In the following example, we compare the behavior with two different worker types, G.2X and R.2X in the same sample workload to process skewed data.

With G.2X workers

With the G.2X worker type, an AWS Glue job with 10 workers failed due to a No space on left device error while writing records into Amazon Simple Storage Service (Amazon S3). This was mainly caused by large shuffling on a specific column. The following Spark UI view shows the job details.

The Jobs tab shows two completed jobs and one active job where 8 tasks failed out of 493 tasks. Let’s drill down to the details.

The Executors tab shows an uneven distribution of data processing across the Spark executors, which indicates data skew in this failed job. Executors with IDs 2, 7, and 10 have failed tasks and read approximately 64.5 GiB of shuffle data as shown in the Shuffle Read column. In contrast, the other executors show 0.0 B of shuffle data in the Shuffle Read column.

The G.2X worker type can handle most Spark workloads such as data transformations and join operations. However, in this example, there was significant data skew, which caused certain executors to fail due to exceeding the allocated memory.

With R.2X workers

With the R.2X worker type, an AWS Glue job with 10 workers successfully ran without any failures. The number of workers is the same as the previous example—the only difference is the worker type. R workers have two times more memory compared to G workers. The following Spark UI view shows more details.

The Jobs tab shows three completed jobs. No failures are shown on this page.

The Executors tab shows no failed tasks per executor even though there’s an uneven distribution of shuffle reads across executors.

The results showed that R.2X workers successfully completed the workload that failed on G.2X workers using the same number of executors but with the additional memory capacity to handle the skewed data distribution.

Conclusion

In this post, we demonstrated how AWS Glue R type, G.12X, and G.16X workers can help you vertically scale your AWS Glue for Apache Spark jobs. You can start using the new R type, G.12X, and G.16X workers to scale your workload today. For more information on these new worker types and AWS Regions where the new workers are available, visit the AWS Glue documentation.

To learn more, see Getting Started with AWS Glue.


About the Authors

Noritaka Sekiyama is a Principal Big Data Architect with AWS Analytics services. He’s responsible for building software artifacts to help customers. In his spare time, he enjoys cycling on his road bike.

Tomohiro Tanaka is a Senior Cloud Support Engineer at Amazon Web Services. He’s passionate about helping customers use Apache Iceberg for their data lakes on AWS. In his free time, he enjoys a coffee break with his colleagues and making coffee at home.

Peter Tsai is a Software Development Engineer at AWS, where he enjoys solving challenges in the design and performance of the AWS Glue runtime. In his leisure time, he enjoys hiking and cycling.

Matt Su is a Senior Product Manager on the AWS Glue team. He enjoys helping customers uncover insights and make better decisions using their data with AWS Analytics services. In his spare time, he enjoys skiing and gardening.

Sean McGeehan is a Software Development Engineer at AWS, where he builds features for the AWS Glue fulfillment system. In his leisure time, he explores his home of Philadelphia and work city of New York.

The collective thoughts of the interwebz