Hugo plays a pivotal role in enabling data ingestion for Grab’s data lake, managing over 4,000 pipelines onboarded by users. The stability of Hugo pipelines is contingent upon the health of both the data sources and various Hugo components. Given the complexity of this system, pipeline failures occasionally occur, necessitating user intervention when retry mechanisms prove insufficient. These incidents present challenges such as:
Limited user visibility into pipeline issues.
Uncertainty about resolution steps due to extensive documentation.
An overwhelmed Hugo on-call team dealing with ad-hoc requests and growing infrastructure dependencies.
Raised Data Production Issues (DPIs) lacking clear Root Cause Analysis (RCA), hindering effective management.
Such challenges ultimately increase data downtime due to prolonged issue triage and resolution times.
To address these problems, we conducted a thorough analysis of failure modes and the efforts required to resolve them. Based on our findings, we propose a comprehensive automation solution.
This blog outlines the architecture and implementation of our proposed solution, consisting of modules like Signal, Diagnosis, RCA Table, Auto-resolution, Data Health API, and Data Health WorkBench, each with a specific function to enhance Hugo’s monitoring, diagnosis, and resolution capabilities.
The blog further details the impact of these automated features, such as enhanced data visibility, reduced on-call workload, and concludes with our next steps, which focus on advancing auto-resolution strategies, enriching the Data Health Workbench, and broadening diagnostics to include more infrastructure components, like Flink, for comprehensive coverage.
Architecture details
We designed the solution based on these principles:
Identify different failure modes based on past issues and analysis from first principles.
Analyse temporal relationships of pipeline execution steps to diagnose issues to failure modes.
Focus on auto-resolution, and add additional features to cover gaps which can’t be immediately addressed by auto-resolution or diagnosis.
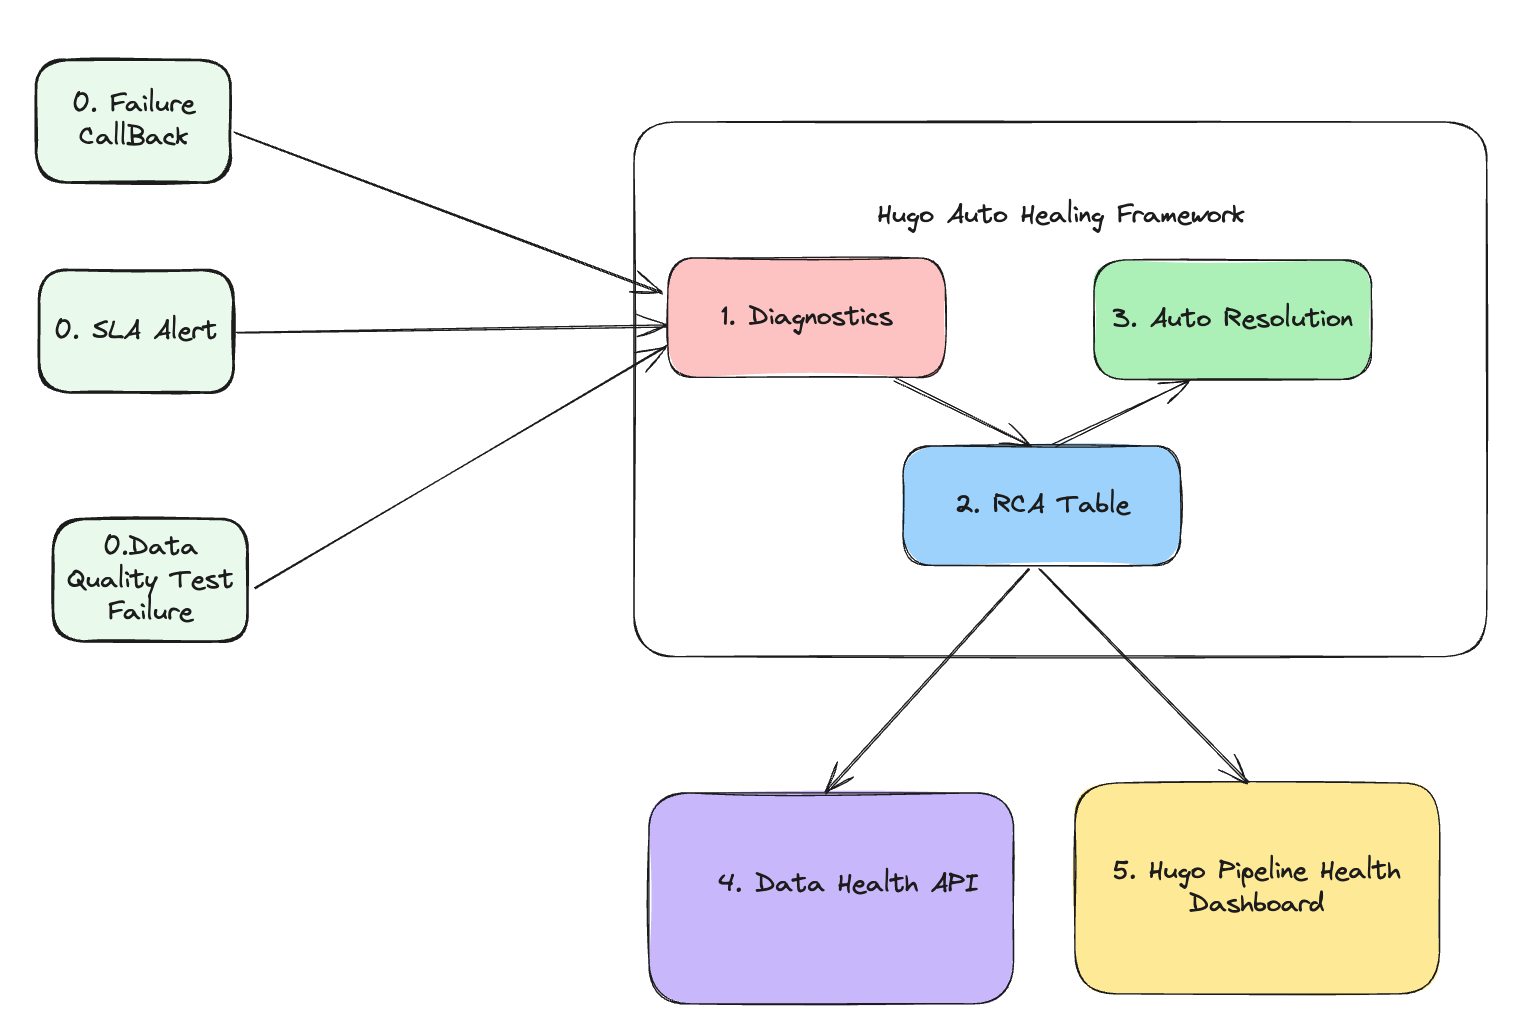
The following diagram shows the solution we proposed.
Figure 1. Architecture
The architecture consists of five core modules, each with a specific function:
Signal module: This module is responsible for collecting signals. It gathers three different types of signals that collectively define the health status of the data lake table. The signals include:
Failure callback signal: This indicates whether the pipeline runs involving this data lake table are successful or not.
SLA alert signal: This indicates whether the pipeline execution involving this data lake table meets the Service Level Agreement (SLA). For an hourly batch job, the expectation is to complete within one hour.
Data quality test failure signal: This represents various types of completeness checks to ensure that data lake tables are consistent with the source tables based on their pipeline strategies.
Diagnosis module: This is the core module responsible for diagnosing the root cause of 3 types of failures collected in the Signal module. It determines:
The root cause of the failure.
The assignee responsible for fixing the error.
The auto-resolution method to fix the issue.
Manual resolution steps if the auto-resolution fails.
RCA table: This module stores the following information:
Signals
Assignee information
Diagnosis results
Auto-resolution methods
Manual resolution steps
Auto-resolution module: This module executes the auto-resolution methods to resolve issues automatically.
Data health API: This module provides API access to other platforms. External platforms or pipelines that rely on Hugo onboarded tables can subscribe to the health status and investigate the root cause when a table is deemed unhealthy.
Hugo pipeline health dashboard: A centralised dashboard for Hugo users to visualise the health status of tables, auto resolution status, and manual fix button.
By leveraging these modules, the architecture ensures robust monitoring, diagnosis, and resolution of issues, leading to improved data health and operational efficiency.
Implementation
Signal module
There are two methods for generating these three signals. The failure signal is generated through an airflow callback, while the SLA miss and data completeness test signals are produced by Genchi. Genchi is a data quality observability platform at Grab that performs data quality checks and acts as a crucial enabler for the enforcement of data contracts.
Diagnosis module
As soon as an alert is created, the diagnosis begins. To avoid lengthy diagnosis times, Hugo has developed an innovative approach that eliminates the requirement for parsing extensive logs, such as Spark executor logs or Airflow logs. Instead, it gathers signals transmitted by the computation engine or Grab’s internal platforms.
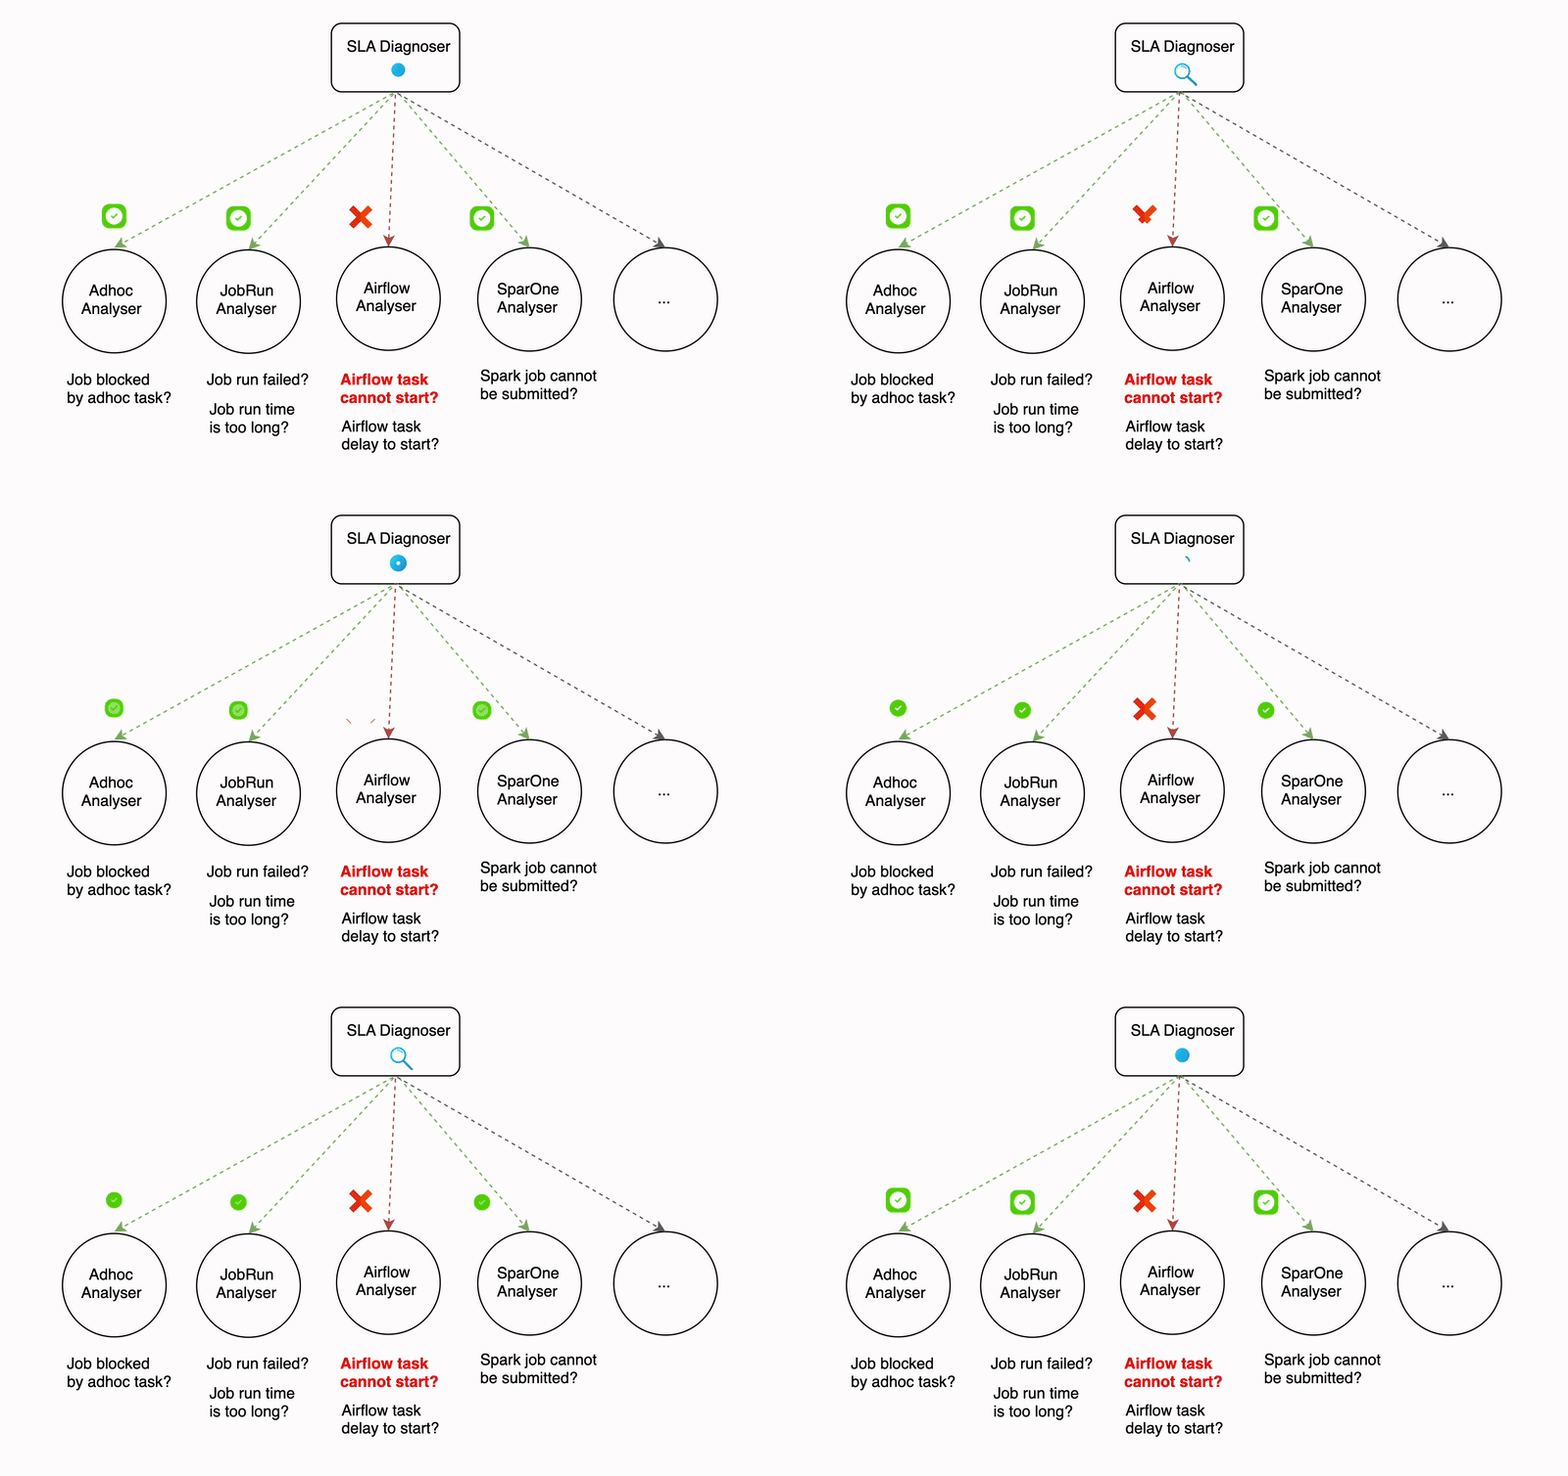
The diagnosis process can be time-consuming, even with efforts to reduce the time it takes. For example, the SLA diagnoser uses multiple analysers that run sequentially, and some of these analysers (like the Airflow analyser) make API calls that can take a significant amount of time. The more analysers that are involved in the diagnosis process, the longer it can take.
Figure 2. Diagnosis process
Parallelism in diagnosis serves as a solution to lower the overall latency when there is a surge in error traffic. The degree of parallelism differs based on the type of signal. For example, the failure signal diagnosis can be executed in thousands of processes at once, while for SLA miss and data quality test failures signals, the parallelism is determined by the number of partitions in the Kafka topic since these signals are received from Kafka.
Auto-resolution module
Auto-resolution is a flexible framework that enables the implementation of custom handlers for various types of failures. One of the common handlers employs a retry mechanism with backoff for transient errors. For instance, if Hugo receives a failure callback indicating that the root cause is a database replica lag, it would wait for an hour before re-triggering the job. This auto-resolution process runs asynchronously with the diagnosis process.
Data health API
The data health information includes a unique identifier, current status, error details, and the time of the last health check, providing a comprehensive snapshot of the dataset’s health.
Hugo converts the detailed information available in its internal data health API to the data health API specification format to be consumed by Kinabalu, our internal system designed to automate and streamline incident management processes by integrating with multiple systems such as Slack, Jira, Splunk on-call, and Datadog.
Hugo pipeline health dashboard
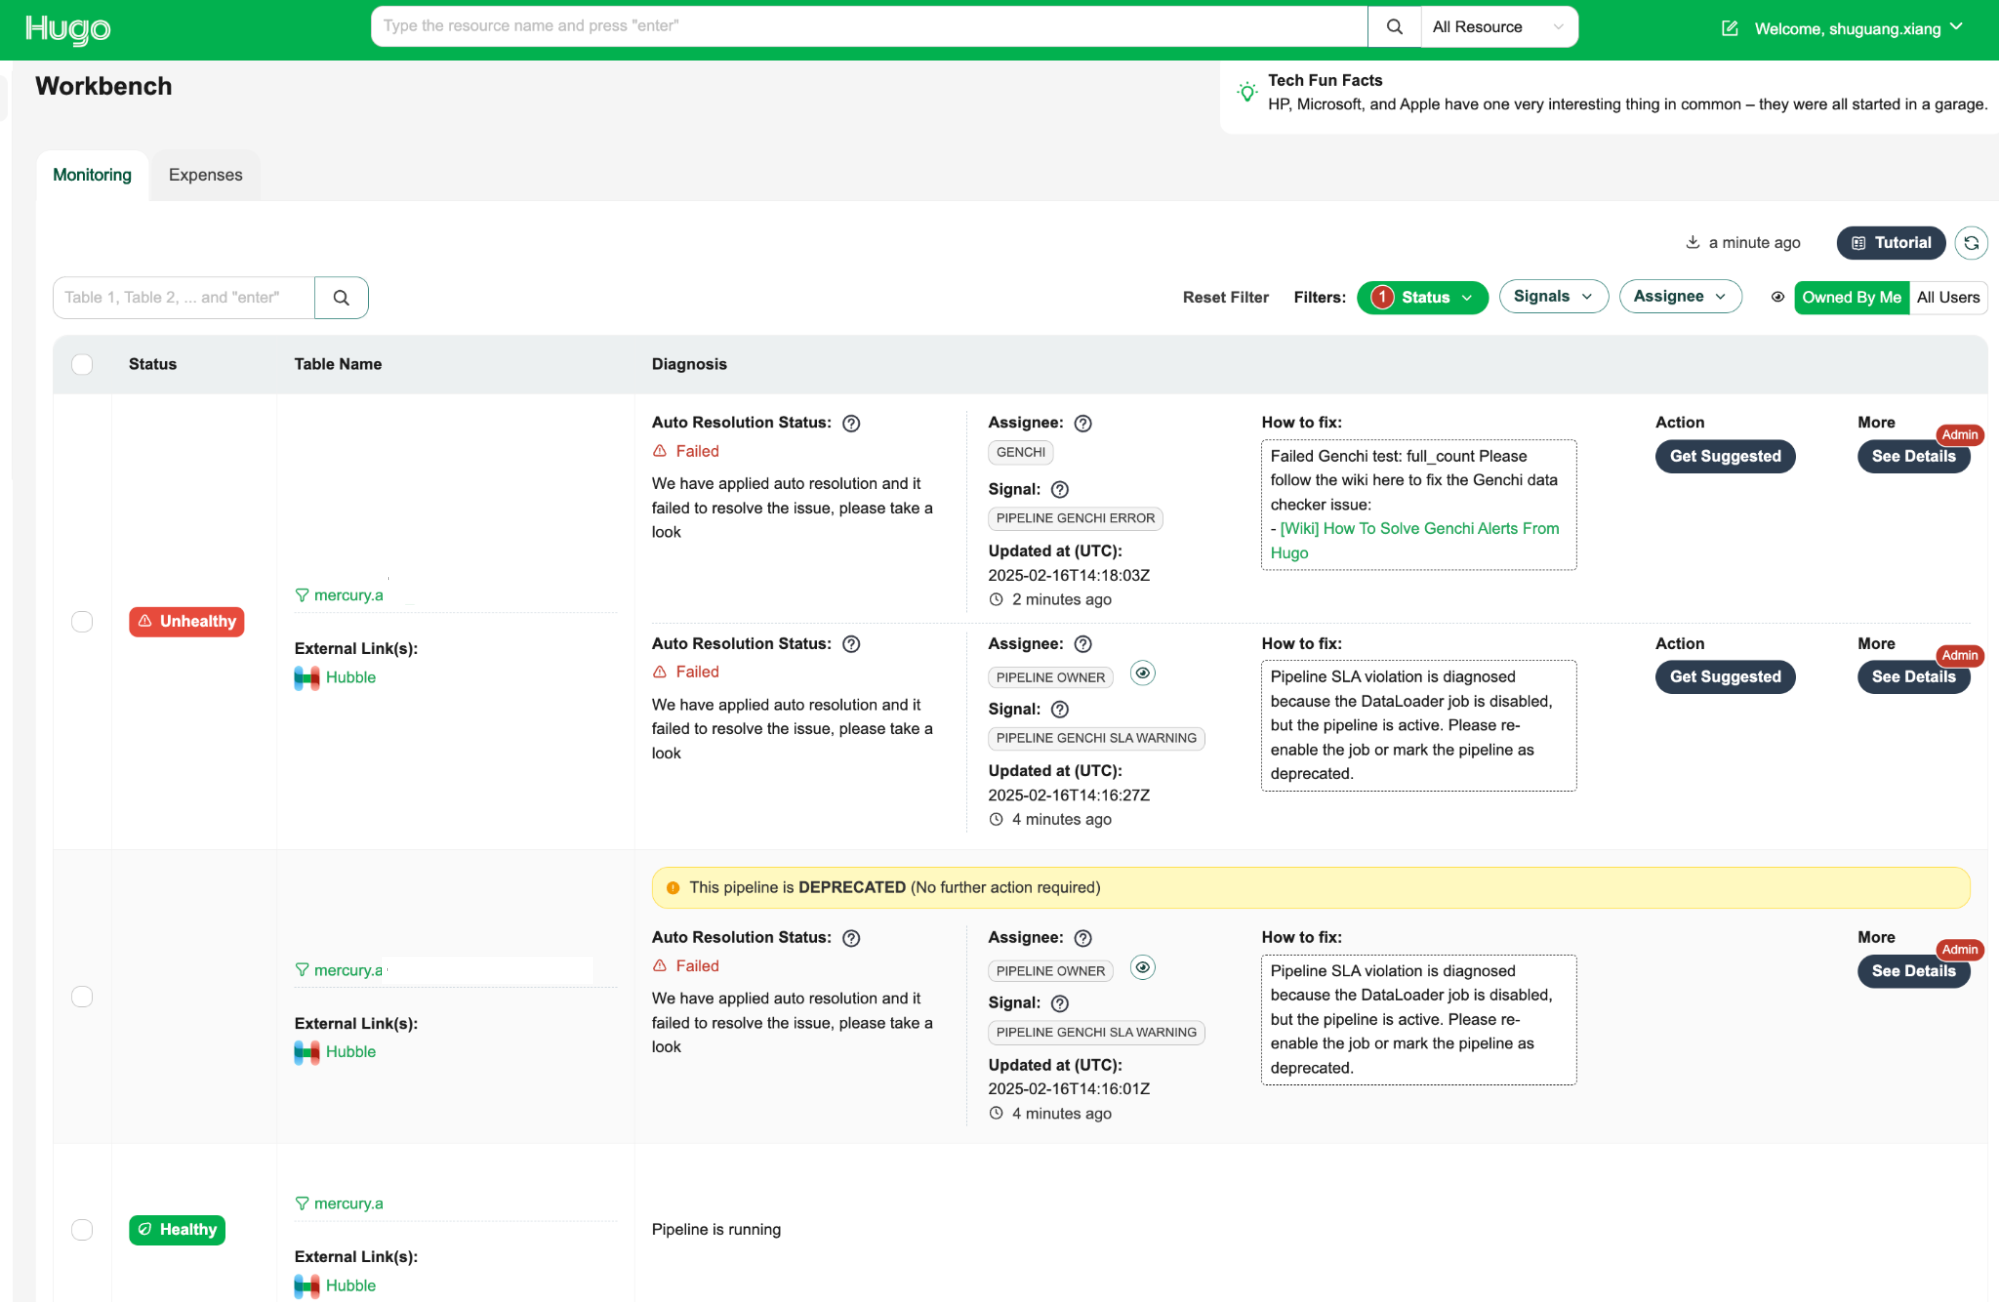
The Data Health Workbench is a centralised dashboard for Hugo users to visualise the health status of tables, auto-resolution status, and manual fix buttons. It provides a comprehensive view of data health and facilitates efficient issue resolution.
The key features are as follows:
Health status visualisation: Displays the current health status of tables, making it easy to identify unhealthy tables.
Assignee information: Indicates the assignee responsible for fixing the issue, ensuring clear accountability.
How-to-fix guide: Provides step-by-step instructions on how to resolve the issue, empowering users to take immediate action.
Action: Offers an action button to initiate the resolution process with a single click, streamlining issue resolution.
Admin feature with detailed diagnosis information: Provides admins supplementary information, including the reasoning behind the root cause identification and assignee determination, which allows for a deeper understanding of the root cause of issues.
By leveraging the Data Health Workbench, Hugo users can efficiently monitor and manage data health, ensuring data integrity and operational efficiency.
Figure 3. Data Health Workbench
Impact
The implementation of Hugo’s auto-healing and diagnosis features has resulted in significant improvements in stability and operational efficiency for our data pipelines. Here are some key outcomes:
Enhanced data visibility: We’ve improved the visibility into the health of datasets, allowing for quick identification of issues and more informed decision-making.
Timely resolution of data issues: With automated diagnostic and resolution processes, we ensure that data issues are addressed promptly, minimising data downtime and enhancing overall data availability.
Reduced on-call workload: By automating many of the common failure resolutions, the workload on Hugo on-call teams has been significantly reduced. This allows teams to focus on more complex and impactful tasks.
Scalable solution for managing complexity: The auto-resolution framework is well-equipped to handle the increasing complexity of data infrastructure, offering scalable solutions for transient errors through custom handlers and retry mechanisms.
Improved data contract management: By providing detailed pipeline health information via the Data Health API, we enable precise and accurate DPIs, complete with root cause analysis and assignee information, enhancing the management and resolution of data contract breaches.
Valuable reference for other platforms: The insights and methodologies developed through this initiative provide a valuable reference for other platform teams at Grab looking to implement similar automation and diagnostic capabilities.
Support for Grab’s success: These enhancements support Grabbers by ensuring easy access to the datasets they need and contribute to the overall success of Grab through reliable data availability.
Next steps
Our next steps involve advancing auto-resolution strategies by focusing on complex solutions like pipeline runtime optimisation to boost efficiency and minimise processing delays. We will enrich the Data Health Workbench with detailed information, enabling users to visualise and understand pipeline health more effectively and make informed corrective actions. Additionally, we plan to broaden our diagnosis capabilities by integrating more infrastructure components, such as Flink health information, to ensure a comprehensive and holistic monitoring approach for all engines within Hugo.
Join us
Grab is a leading superapp in Southeast Asia, operating across the deliveries, mobility and digital financial services sectors. Serving over 800 cities in eight Southeast Asian countries, Grab enables millions of people everyday to order food or groceries, send packages, hail a ride or taxi, pay for online purchases or access services such as lending and insurance, all through a single app. Grab was founded in 2012 with the mission to drive Southeast Asia forward by creating economic empowerment for everyone. Grab strives to serve a triple bottom line – we aim to simultaneously deliver financial performance for our shareholders and have a positive social impact, which includes economic empowerment for millions of people in the region, while mitigating our environmental footprint.
Powered by technology and driven by heart, our mission is to drive Southeast Asia forward by creating economic empowerment for everyone. If this mission speaks to you, join our team today!
On Wednesday, March 19, 2025, backup and recovery software provider Veeam published a security advisory for a critical remote code execution vulnerability tracked as CVE-2025-23120. The vulnerability affects Backup & Replication systems that are domain joined. Veeam explicitly mentions that domain-joined backup servers are against security and compliance best practices, but in reality, we believe this is likely to be a relatively common configuration.
Veeam’s advisory indicates that the vulnerability is authenticated, though the CVSS score for CVE-2025-23120 is listed as 9.9. The advisory itself states that “authenticated domain users” can exploit the vulnerability but says little else — it’s possible that additional exploitation criteria will be published later on. According to Veeam, all supported versions of Backup & Replication are affected.
No public proof-of-concept exploit has been released (at time of this blog’s publication). Veeam Backup & Replication has a very large deployment footprint, and backup solutions are commonly targeted by threat actors. Veeam Backup & Replication should not be exposed to the internet and makes for a more effective internal attack vector than an external vector. Still, plenty of previous Veeam Backup & Replication vulnerabilities have been exploited in the wild, including by ransomware groups.
As we have mentioned previously, more than 20% of Rapid7 incident response cases in 2024 involved Veeam being accessed or exploited in some manner, typically once an adversary has already established a foothold in the target environment.
Mitigation guidance
Veeam Backup & Replication 12.3.0.310 and all earlier version 12 builds are vulnerable to CVE-2025-23120, per the vendor advisory.
Customers should update to the latest version of the software (12.3 build 12.3.1.1139) immediately, without waiting for a regular patch cycle to occur. Per the vendor, unsupported software versions were not tested but should be considered vulnerable.
Rapid7 customers
InsightVM and Nexpose customers will be able to assess their exposure to CVE-2025-23120 with a vulnerability check expected to be available in tomorrow’s (Thursday, March 20) content release.
GNOME 48 (“Bengaluru”)
has been released. As usual, this release includes a number of new
features and enhancements including support for shortcuts in the Orca
screen reader on Wayland, new fonts, addition of image editing to Image Viewer, and more.
GNOME 48 includes a number of notable performance improvements. The
most significant of these is the introduction of dynamic triple
buffering. This change has undergone significant review and testing
over a period of five years and improves the perceived smoothness of
changes on screen, with fewer skipped frames and more fluid
animations. This has been achieved by enhancing the concurrency
capabilities of Mutter, the GNOME display manager, and is particularly
effective at handling sudden bursts of activity.
The GNOME 48 release also adds new applications to the GNOME Circle collection,
such as Drum Machine
and the Iotas note-taking
application. See “What’s new
for developers” a rundown of improvements for developers in
GNOME 48.
Here at Rapid7, our usual bar for calling a vulnerability an emergent threat is either known exploitation at scale, or likelihood of exploitation at scale. Apache Tomcat CVE-2025-24813 fulfills neither of these criteria, despite a variety of news headlines alleging broad exploitation in the wild. Tomcat is widely deployed and has seen a number of severe vulnerabilities over the years that have had specific configuration dependencies for successful exploitation — this one follows the same pattern.
TL;DR: Patch, but there’s no need to panic. Here’s what you need to know:
CVE-2025-24813 is an unauthenticated remote code execution vulnerability in Apache Tomcat’s partial PUT feature disclosed on March 10, 2025. Fixed versions are available.
Under specific circumstances, successful exploitation allows attackers to execute code remotely on target systems via unsafe deserialization.
Vulnerability details and proof-of-concept (PoC) exploit code are both publicly available.
Based on our analysis and those of other research firms, the conditions required for successful exploitation appear to be specific, non-default, and uncommon.
CVE-2025-24813 has reportedly been exploited in the wild; however, Rapid7 has been unable to confirm any successful exploitation occurring against real-world production environments. We assess that “exploitation” in this context likely means unsuccessful exploit attempts rather than successful compromise of production systems.
Broad exploitation is unlikely given the specific vulnerable configuration requirements (see Exploitability requirements below).
Rapid7 researchers have tested publicly available PoC code and investigated the conditions Apache indicated were required for exploitation. Like other researchers, our team found that the vendor’s exploitable configuration information differs from what we observed during testing. Additionally, our team assessed the exploitable configuration to be relatively uncommon. Based on a GitHub code search query, only a small number of open-source Tomcat projects published publicly on GitHub are using write-enabled default servlet configurations (a pre-requisite for exploitation) — approximately 200, and most have fewer than 30 stars. Rapid7’s vulnerability research team has a full testing report here.
Exploitability requirements
Per the advisory, an attacker could view security sensitive files and/or inject content into those files if ALL of the following were true:
writes enabled for the default servlet (disabled by default)
support for partial PUT (enabled by default)
a target URL for security sensitive uploads that was a sub-directory of a target URL for public uploads (ed: Rapid7 and other researchers found this to be unnecessary for exploitation)
attacker knowledge of the names of security sensitive files being uploaded (ed: Rapid7 and other researchers found this to be unnecessary for exploitation)
the security sensitive files also being uploaded via partial PUT (ed: Rapid7 and other researchers found this to be unnecessary for exploitation)
An attacker could achieve remote code execution if ALL of the following were true:
writes enabled for the default servlet (disabled by default)
support for partial PUT (enabled by default)
application was using Tomcat’s file-based session persistence (ed: disabled by default) with the default storage location
application included a library that may be leveraged in a deserialization attack (ed: this is the case for many Java applications)
Mitigation guidance
The following versions of Apache Tomcat are affected:
Apache Tomcat 11.0.0-M1 to 11.0.2 (fixed in 11.0.3 or later)
Apache Tomcat 10.1.0-M1 to 10.1.34 (fixed in 10.1.35 or later)
Apache Tomcat 9.0.0.M1 to 9.0.98 (fixed in 9.0.99 or later)
For the latest information, please see the Apache Software Foundation’s advisory.
Rapid7 customers
InsightVM and Nexpose customers can assess their exposure to CVE-2025-24813 with pre-existing vulnerability checks.
Software development is filled with repetitive tasks—managing issues, handling approvals, triggering CI/CD workflows, and more. But what if you could automate these types of tasks directly within GitHub Issues? That’s the promise of IssueOps, a methodology that turns GitHub Issues into a command center for automation.
Whether you’re a solo developer or part of an engineering team, IssueOps helps you streamline operations without ever leaving your repository.
In this article, I’ll explore the concept of IssueOps using state-machine terminology and strategies to help you work more efficiently on GitHub. After all, who doesn’t love automation?
What is IssueOps?
IssueOps is the practice of using GitHub Issues, GitHub Actions, and pull requests (PR) as an interface for automating workflows. Instead of switching between tools or manually triggering actions, you can use issue comments, labels, and state changes to kick off CI/CD pipelines, assign tasks, and even deploy applications.
Much like the various other *Ops paradigms (ChatOps, ClickOps, and so on), IssueOps is a collection of tools, workflows, and concepts that, when applied to GitHub Issues, can automate mundane, repetitive tasks. The flexibility and power of issues, along with their relationship to pull requests, create a near limitless number of possibilities, such as managing approvals and deployments. All of this can really help to simplify your workflows on GitHub. I’m speaking from personal experience here.
It’s important to note that IssueOps isn’t just a DevOps thing! Where DevOps offers a methodology to bring developers and operations into closer alignment, IssueOps is a workflow automation practice centered around GitHub Issues. IssueOps lets you run anything from complex CI/CD pipelines to a bed and breakfast reservation system. If you can interact with it via an API, there’s a good chance you can build it with IssueOps!
So, why use IssueOps?
There are lots of benefits to utilizing IssueOps. Here’s how it’s useful in practice:
It’s event driven, so you can automate the boring stuff: IssueOps lets you automate workflows directly from GitHub Issues and pull requests, turning everyday interactions—from kicking off a CI/CD pipeline and managing approvals to updating project boards—into powerful triggers for GitHub Actions.
It’s customizable, so you can tailor workflows to your needs: No two teams work the same way, and IssueOps is flexible enough to adapt. Whether you’re automating bug triage or triggering deployments, you can customize workflows based on event type and data provided.
It’s transparent, so you can keep a record: All actions taken on an issue are logged in its timeline, creating an easy-to-follow record of what happened and when.
It’s immutable, so you can audit whenever you need: Because IssueOps uses GitHub Issues and pull requests as a source of truth, every action leaves a record. No more chasing approvals in Slack or manually triggering workflows: IssueOps keeps everything structured, automated, and auditable right inside GitHub.
Defining IssueOps workflows and how they’re like finite-state machines
Most IssueOps workflows follow the same basic pattern:
A user opens an issue and provides information about a request
The issue is validated to ensure it contains the required information
The issue is submitted for processing
Approval is requested from an authorized user or team
The request is processed and the issue is closed
Suppose you’re an administrator of an organization and want to reduce the overhead of managing team members. In this instance, you could use IssueOps to build an automated membership request and approval process. Within a workflow like this, you’d have several core steps:
A user creates a request to be added to a team
The request is validated
The request is submitted for approval
An administrator approves or denies this request
The request is processed
If approved, the user is added to the team
If denied, the user is not added to the team
The user is notified of the outcome
When designing your own IssueOps workflows, it can be very helpful to think of them as a finite-state machine: a model for how objects move through a series of states in response to external events. Depending on certain rules defined within the state machine, a number of different actions can take place in response to state changes. If this is a little too complex, you can also think of it like a flow chart.
To apply this comparison to IssueOps, an issue is the object that is processed by a state machine. It changes state in response to events. As the object changes state, certain actions may be performed as part of a transition, provided any required conditions (guards) are met. Once an end state is reached, the issue can be closed.
This breaks down into a few key concepts:
State: A point in an object’s lifecycle that satisfies certain condition(s).
Event: An external occurrence that triggers a state change.
Transition: A link between two states that, when traversed by an object, will cause certain action(s) to be performed.
Action: An atomic task that is performed when a transition is taken.
Guard: A condition that is evaluated when a trigger event occurs. A transition is taken only if all associated guard condition(s) are met.
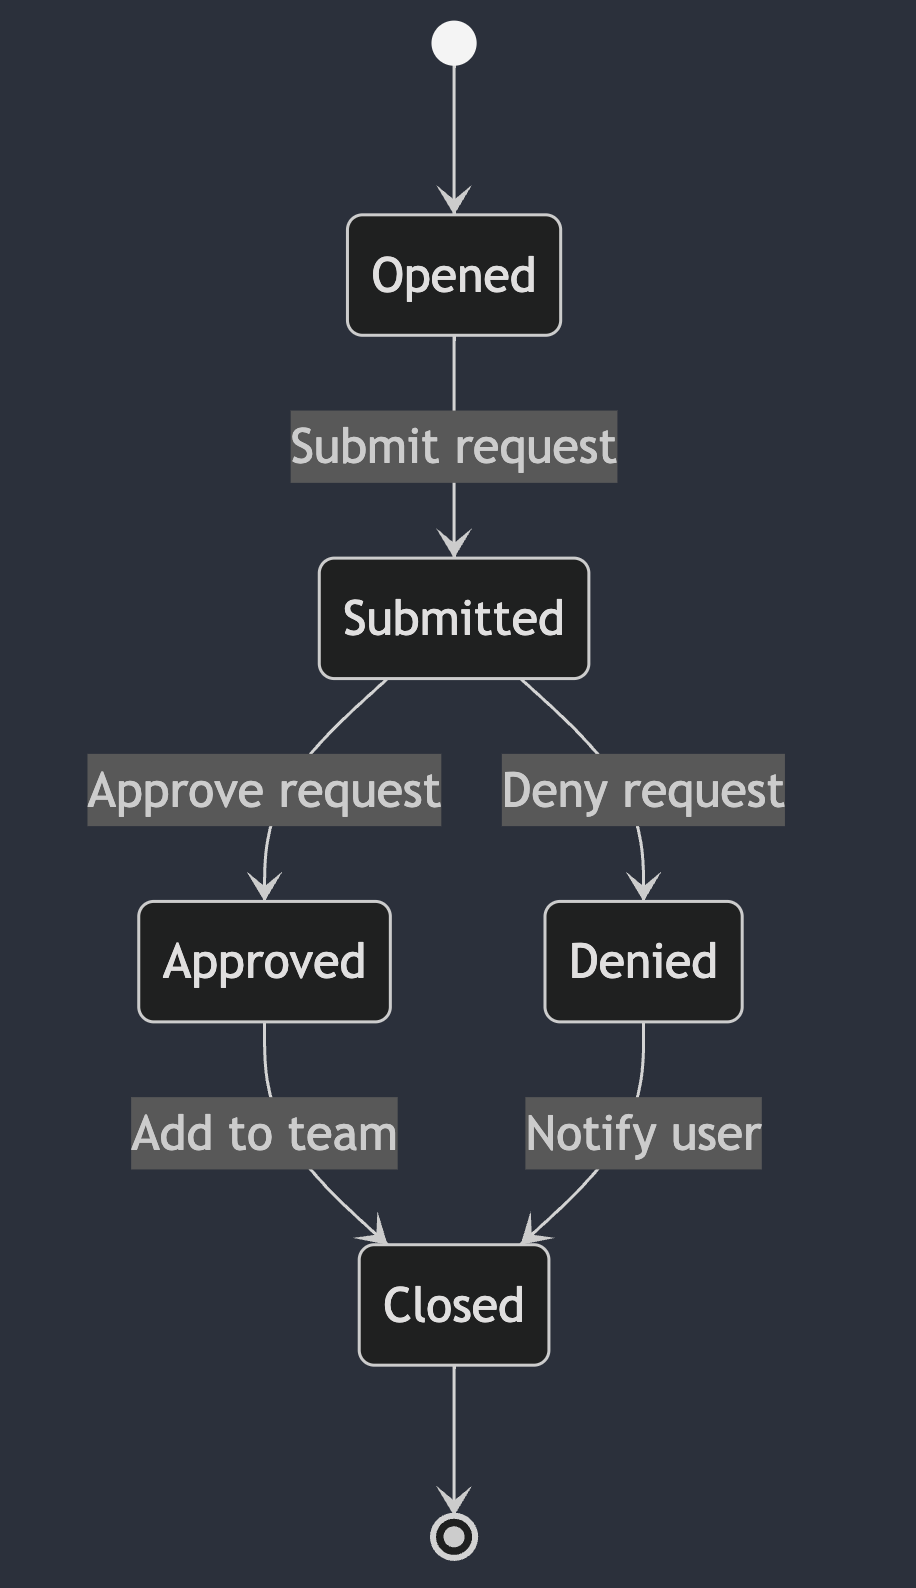
Here’s a simple state diagram for the example I discussed above.
Now, let’s dive into the state machine in more detail!
Key concepts behind state machines
The benefit of breaking your workflow down into these components is that you can look for edge cases, enforce conditions, and create a robust, reliable result.
States
Within a state machine, a state defines the current status of an object. As the object transitions through the state machine, it will change states in response to external events. When building IssueOps workflows, common states for issues include opened, submitted, approved, denied, and closed.
These should suffice as the core states to consider when building our workflows in our team membership example above.
Events
In a state machine, an event can be any form of interaction with the object and its current state. When building your own IssueOps, you should consider events from both the user and GitHub points of view.
In our team membership request example, there are several events that can trigger a change in state. The request can be created, submitted, approved, denied, or processed.
In this example, a user interacting with an issue—such as adding labels, commenting, or updating milestones—can also change its state. In GitHub Actions, there are many events that can trigger your workflows (see events that trigger workflows).
Here are a few interactions, or events, that would affect our example IssueOps workflow when it comes to managing team members:
Request
Event
State
Request is created
issues
opened
Request is approved
issue_comment
created
Request is denied
issue_comment
created
As you can see, the same GitHub workflow trigger can apply to multiple events in our state machine. Because of this, validation is key. Within your workflows, you should check both the type of event and the information provided by the user. In this case, we can conditionally trigger different workflow steps based on the content of the issue_comment event.
A transition is simply the change from one state to another. In our example, for instance, a transition occurs when someone opens an issue. When a request meets certain conditions, or guards, the change in state can take place. When the transition occurs, some actions or processing may take place, as well.
With our example workflow, you can think of the transitions themselves as the lines connecting different nodes in the state diagram. Or the lines connecting boxes in a flow chart.
Guards
Guards are conditions that must be verified before an event can trigger a transition to a different state. In our case, we know the following guards must be in place:
A request should not transition to an Approved state unless an administrator comments .approve on the issue.
A request should not transition to a Denied state unless an administrator comments .deny on the issue.
What about after the request is approved and the user is added to the team? This is referred to as an unguarded transition. There are no conditions that must be met, so the transition happens immediately!
Actions
Lastly, actions are specific tasks that are performed during a transition. They may affect the object itself, but this is not a requirement in our state machine. In our example, the following actions may take place at different times:
Administrators are notified that a request has been submitted
The user is added to the requested team
The user is notified of the outcome
A real-world example: Building a team membership workflow with IssueOps
Now that all of the explanation is out of the way, let’s dive into building our example! For reference, we’ll focus on the GitHub Actions workflows involved in building this automation. There are some additional repository and permissions settings involved that are discussed in more detail in these IssueOps docs.
Step 1: Issue form template
GitHub issue forms let you create standardized, formatted issues based on a set of form fields. Combined with the issue-ops/parser action, you can get reliable, machine-readable JSON from issue body Markdown. For our example, we are going to create a simple form that accepts a single input: the team where we want to add the user.
name: Team Membership Request
description: Submit a new membership request
title: New Team Membership Request
labels:
  - team-membership
body:
  - type: input
    id: team
    attributes:
      label: Team Name
      description: The team name you would like to join
      placeholder: my-team
    validations:
      required: true
When issues are created using this form, they will be parsed into JSON, which can then be passed to the rest of the IssueOps workflow.
{
  "team": "my-team"
}
Step 2: Issue validation
With a machine-readable issue body, we can run additional validation checks to ensure the information provided follows any rules we might have in place. For example, we can’t automatically add a user to a team if the team doesn’t exist yet! That is where the issue-ops/validator action comes into play. Using an issue form template and a custom validation script, we can confirm the existence of the team ahead of time.
module.exports = async (field) => {
  const { Octokit } = require('@octokit/rest')
  const core = require('@actions/core')

  const github = new Octokit({
    auth: core.getInput('github-token', { required: true })
  })

  try {
    // Check if the team exists
    core.info(`Checking if team '${field}' exists`)

    await github.rest.teams.getByName({
      org: process.env.GITHUB_REPOSITORY_OWNER ?? '',
      team_slug: field
    })

    core.info(`Team '${field}' exists`)
    return 'success'
  } catch (error) {
    if (error.status === 404) {
      // If the team does not exist, return an error message
      core.error(`Team '${field}' does not exist`)
      return `Team '${field}' does not exist`
    } else {
      // Otherwise, something else went wrong...
      throw error
    }
  }
}
When included in our IssueOps workflow, this adds any validation error(s) to the comment on the issue.
Step 3: Issue workflows
The main “entrypoint” of this workflow occurs when a user creates or edits their team membership request issue. This workflow should focus heavily on validating any user inputs! For example, what should happen if the user inputs a team that does not exist?
In our state machine, this workflow is responsible for handling everything up to the opened state. Any time an issue is created, edited, or updated, it will re-run validation to ensure the request is ready to be processed. In this case, an additional guard condition is introduced. Before the request can be submitted, the user must comment with .submit after validation has passed.
name: Process Issue Open/Edit

on:
  issues:
    types:
      - opened
      - edited
      - reopened

permissions:
  contents: read
  id-token: write
  issues: write

jobs:
  validate:
    name: Validate Request
    runs-on: ubuntu-latest

    # This job should only be run on issues with the `team-membership` label.
    if: ${{ contains(github.event.issue.labels.*.name, 'team-membership') }}

    steps:
      # This is required to ensure the issue form template and any validation
      # scripts are included in the workspace.
      - name: Checkout
        id: checkout
        uses: actions/checkout@v4

      # Since this workflow includes custom validation scripts, we need to
      # install Node.js and any dependencies.
      - name: Setup Node.js
        id: setup-node
        uses: actions/setup-node@v4

      # Install dependencies from `package.json`.
      - name: Install Dependencies
        id: install
        run: npm install

      # GitHub App authentication is required if you want to interact with any
      # resources outside the scope of the repository this workflow runs in.
      - name: Get GitHub App Token
        id: token
        uses: actions/create-github-app-token@v1
        with:
          app-id: ${{ vars.ISSUEOPS_APP_ID }}
          private-key: ${{ secrets.ISSUEOPS_APP_PRIVATE_KEY }}
          owner: ${{ github.repository_owner }}

      # Remove any labels and start fresh. This is important because the
      # issue may have been closed and reopened.
      - name: Remove Labels
        id: remove-label
        uses: issue-ops/labeler@v2
        with:
          action: remove
          github_token: ${{ steps.token.outputs.token }}
          labels: |
            validated
            approved
            denied
          issue_number: ${{ github.event.issue.number }}
          repository: ${{ github.repository }}

      # Parse the issue body into machine-readable JSON, so that it can be
      # processed by the rest of the workflow.
      - name: Parse Issue Body
        id: parse
        uses: issue-ops/parser@v4
        with:
          body: ${{ github.event.issue.body }}
          issue-form-template: team-membership.yml
          workspace: ${{ github.workspace }}

      # Validate early and often! Validation should be run any time an issue is
      # interacted with, to ensure that any changes to the issue body are valid.
      - name: Validate Request
        id: validate
        uses: issue-ops/validator@v3
        with:
          add-comment: true
          github-token: ${{ steps.token.outputs.token }}
          issue-form-template: team-membership.yml
          issue-number: ${{ github.event.issue.number }}
          parsed-issue-body: ${{ steps.parse.outputs.json }}
          workspace: ${{ github.workspace }}

      # If validation passes, add the validated label to the issue.
      - if: ${{ steps.validate.outputs.result == 'success' }}
        name: Add Validated Label
        id: add-label
        uses: issue-ops/labeler@v2
        with:
          action: add
          github_token: ${{ steps.token.outputs.token }}
          labels: |
            validated
          issue_number: ${{ github.event.issue.number }}
          repository: ${{ github.repository }}

      # The `issue-ops/validator` action will automatically notify the user that
      # the request was validated. However, you can optionally add instruction
      # on what to do next.
      - if: ${{ steps.validate.outputs.result == 'success' }}
        name: Notify User (Success)
        id: notify-success
        uses: peter-evans/create-or-update-comment@v4
        with:
          issue-number: ${{ github.event.issue.number }}
          body: |
            Hello! Your request has been validated successfully!

            Please comment with `.submit` to submit this request.
Step 4: Issue comment workflows
Once the issue is created, any further processing is triggered using issue comments—and this can be done with one workflow. However, to make things a bit easier to follow, we’ll break this into a few separate workflows.
Submit workflow
The first workflow handles the user submitting the request. The main task it performs is validating the issue body against the form template to ensure it hasn’t been modified.
name: Process Submit Comment

on:
  issue_comment:
    types:
      - created

permissions:
  contents: read
  id-token: write
  issues: write

jobs:
  submit:
    name: Submit Request
    runs-on: ubuntu-latest

    # This job should only be run when the following conditions are true:
    #
    # - A user comments `.submit` on the issue.
    # - The issue has the `team-membership` label.
    # - The issue has the `validated` label.
    # - The issue does not have the `approved` or `denied` labels.
    # - The issue is open.
    if: |
      startsWith(github.event.comment.body, '.submit') &&
      contains(github.event.issue.labels.*.name, 'team-membership') == true &&
      contains(github.event.issue.labels.*.name, 'approved') == false &&
      contains(github.event.issue.labels.*.name, 'denied') == false &&
      github.event.issue.state == 'open'

    steps:
      # First, we are going to re-run validation. This is important because
      # the issue body may have changed since the last time it was validated.

      # This is required to ensure the issue form template and any validation
      # scripts are included in the workspace.
      - name: Checkout
        id: checkout
        uses: actions/checkout@v4

      # Since this workflow includes custom validation scripts, we need to
      # install Node.js and any dependencies.
      - name: Setup Node.js
        id: setup-node
        uses: actions/setup-node@v4

      # Install dependencies from `package.json`.
      - name: Install Dependencies
        id: install
        run: npm install

      # GitHub App authentication is required if you want to interact with any
      # resources outside the scope of the repository this workflow runs in.
      - name: Get GitHub App Token
        id: token
        uses: actions/create-github-app-token@v1
        with:
          app-id: ${{ vars.ISSUEOPS_APP_ID }}
          private-key: ${{ secrets.ISSUEOPS_APP_PRIVATE_KEY }}
          owner: ${{ github.repository_owner }}

      # Remove the validated label. This will be re-added if validation passes.
      - name: Remove Validated Label
        id: remove-label
        uses: issue-ops/labeler@v2
        with:
          action: remove
          github_token: ${{ steps.token.outputs.token }}
          labels: |
            validated
          issue_number: ${{ github.event.issue.number }}
          repository: ${{ github.repository }}

      # Parse the issue body into machine-readable JSON, so that it can be
      # processed by the rest of the workflow.
      - name: Parse Issue Body
        id: parse
        uses: issue-ops/parser@v4
        with:
          body: ${{ github.event.issue.body }}
          issue-form-template: team-membership.yml
          workspace: ${{ github.workspace }}

      # Validate early and often! Validation should be run any time an issue is
      # interacted with, to ensure that any changes to the issue body are valid.
      - name: Validate Request
        id: validate
        uses: issue-ops/validator@v3
        with:
          add-comment: false # Don't add another validation comment.
          github-token: ${{ steps.token.outputs.token }}
          issue-form-template: team-membership.yml
          issue-number: ${{ github.event.issue.number }}
          parsed-issue-body: ${{ steps.parse.outputs.json }}
          workspace: ${{ github.workspace }}

      # If validation passed, add the validated and submitted labels to the issue.
      - if: ${{ steps.validate.outputs.result == 'success' }}
        name: Add Validated Label
        id: add-label
        uses: issue-ops/labeler@v2
        with:
          action: add
          github_token: ${{ steps.token.outputs.token }}
          labels: |
            validated
            submitted
          issue_number: ${{ github.event.issue.number }}
          repository: ${{ github.repository }}

      # If validation succeeded, alert the administrator team so they can
      # approve or deny the request.
      - if: ${{ steps.validate.outputs.result == 'success' }}
        name: Notify Admin (Success)
        id: notify-success
        uses: peter-evans/create-or-update-comment@v4
        with:
          issue-number: ${{ github.event.issue.number }}
          body: |
            👋 @issue-ops/admins! The request has been validated and is
            ready for your review. Please comment with `.approve` or `.deny`
            to approve or deny this request.
Deny workflow
If the request is denied, the user should be notified and the issue should close.
name: Process Denial Comment

on:
  issue_comment:
    types:
      - created

permissions:
  contents: read
  id-token: write
  issues: write

jobs:
  submit:
    name: Deny Request
    runs-on: ubuntu-latest

    # This job should only be run when the following conditions are true:
    #
    # - A user comments `.deny` on the issue.
    # - The issue has the `team-membership` label.
    # - The issue has the `validated` label.
    # - The issue has the `submitted` label.
    # - The issue does not have the `approved` or `denied` labels.
    # - The issue is open.
    if: |
      startsWith(github.event.comment.body, '.deny') &&
      contains(github.event.issue.labels.*.name, 'team-membership') == true &&
      contains(github.event.issue.labels.*.name, 'submitted') == true &&
      contains(github.event.issue.labels.*.name, 'validated') == true &&
      contains(github.event.issue.labels.*.name, 'approved') == false &&
      contains(github.event.issue.labels.*.name, 'denied') == false &&
      github.event.issue.state == 'open'

    steps:
      # This time, we do not need to re-run validation because the request is
      # being denied. It can just be closed.

      # However, we do need to confirm that the user who commented `.deny` is
      # a member of the administrator team.
      # GitHub App authentication is required if you want to interact with any
      # resources outside the scope of the repository this workflow runs in.
      - name: Get GitHub App Token
        id: token
        uses: actions/create-github-app-token@v1
        with:
          app-id: ${{ vars.ISSUEOPS_APP_ID }}
          private-key: ${{ secrets.ISSUEOPS_APP_PRIVATE_KEY }}
          owner: ${{ github.repository_owner }}

      # Check if the user who commented `.deny` is a member of the
      # administrator team.
      - name: Check Admin Membership
        id: check-admin
        uses: actions/github-script@v7
        with:
          github-token: ${{ steps.token.outputs.token }}
          script: |
            try {
              await github.rest.teams.getMembershipForUserInOrg({
                org: context.repo.owner,
                team_slug: 'admins',
                username: context.actor,
              })
              core.setOutput('member', 'true')
            } catch (error) {
              if (error.status === 404) {
                core.setOutput('member', 'false')
              }
              throw error
            }

      # If the user is not a member of the administrator team, exit the
      # workflow.
      - if: ${{ steps.check-admin.outputs.member == 'false' }}
        name: Exit
        run: exit 0

      # If the user is a member of the administrator team, add the denied label.
      - name: Add Denied Label
        id: add-label
        uses: issue-ops/labeler@v2
        with:
          action: add
          github_token: ${{ steps.token.outputs.token }}
          labels: |
            denied
          issue_number: ${{ github.event.issue.number }}
          repository: ${{ github.repository }}

      # Notify the user that the request was denied.
      - name: Notify User
        id: notify
        uses: peter-evans/create-or-update-comment@v4
        with:
          issue-number: ${{ github.event.issue.number }}
          body: |
            This request has been denied and will be closed.

      # Close the issue as not planned.
      - name: Close Issue
        id: close
        uses: actions/github-script@v7
        with:
          script: |
            await github.rest.issues.update({
              issue_number: ${{ github.event.issue.number }},
              owner: context.repo.owner,
              repo: context.repo.repo,
              state: 'closed',
              state_reason: 'not_planned'
            })
Approve workflow
Finally, we need to handle request approval. In this case, we need to add the user to the team, notify them, and close the issue.
name: Process Approval Comment

on:
  issue_comment:
    types:
      - created

permissions:
  contents: read
  id-token: write
  issues: write

jobs:
  submit:
    name: Approve Request
    runs-on: ubuntu-latest

    # This job should only be run when the following conditions are true:
    #
    # - A user comments `.approve` on the issue.
    # - The issue has the `team-membership` label.
    # - The issue has the `validated` label.
    # - The issue has the `submitted` label.
    # - The issue does not have the `approved` or `denied` labels.
    # - The issue is open.
    if: |
      startsWith(github.event.comment.body, '.approve') &&
      contains(github.event.issue.labels.*.name, 'team-membership') == true &&
      contains(github.event.issue.labels.*.name, 'submitted') == true &&
      contains(github.event.issue.labels.*.name, 'validated') == true &&
      contains(github.event.issue.labels.*.name, 'approved') == false &&
      contains(github.event.issue.labels.*.name, 'denied') == false &&
      github.event.issue.state == 'open'

    steps:
      # This time, we do not need to re-run validation because the request is
      # being approved. It can just be processed.

      # This is required to ensure the issue form template is included in the
      # workspace.
      - name: Checkout
        id: checkout
        uses: actions/checkout@v4

      # We do need to confirm that the user who commented `.approve` is a member
      # of the administrator team. GitHub App authentication is required if you
      # want to interact with any resources outside the scope of the repository
      # this workflow runs in.
      - name: Get GitHub App Token
        id: token
        uses: actions/create-github-app-token@v1
        with:
          app-id: ${{ vars.ISSUEOPS_APP_ID }}
          private-key: ${{ secrets.ISSUEOPS_APP_PRIVATE_KEY }}
          owner: ${{ github.repository_owner }}

      # Check if the user who commented `.approve` is a member of the
      # administrator team.
      - name: Check Admin Membership
        id: check-admin
        uses: actions/github-script@v7
        with:
          github-token: ${{ steps.token.outputs.token }}
          script: |
            try {
              await github.rest.teams.getMembershipForUserInOrg({
                org: context.repo.owner,
                team_slug: 'admins',
                username: context.actor,
              })
              core.setOutput('member', 'true')
            } catch (error) {
              if (error.status === 404) {
                core.setOutput('member', 'false')
              }
              throw error
            }

      # If the user is not a member of the administrator team, exit the
      # workflow.
      - if: ${{ steps.check-admin.outputs.member == 'false' }}
        name: Exit
        run: exit 0

      # Parse the issue body into machine-readable JSON, so that it can be
      # processed by the rest of the workflow.
      - name: Parse Issue body
        id: parse
        uses: issue-ops/parser@v4
        with:
          body: ${{ github.event.issue.body }}
          issue-form-template: team-membership.yml
          workspace: ${{ github.workspace }}

      - name: Add to Team
        id: add
        uses: actions/github-script@v7
        with:
          github-token: ${{ steps.token.outputs.token }}
          script: |
            const parsedIssue = JSON.parse('${{ steps.parse.outputs.json }}')

            await github.rest.teams.addOrUpdateMembershipForUserInOrg({
              org: context.repo.owner,
              team_slug: parsedIssue.team,
              username: '${{ github.event.issue.user.login }}',
              role: 'member'
            })

      - name: Notify User
        id: notify
        uses: peter-evans/create-or-update-comment@v4
        with:
          issue-number: ${{ github.event.issue.number }}
          body: |
            This request has been processed successfully!

      - name: Close Issue
        id: close
        uses: actions/github-script@v7
        with:
          script: |
            await github.rest.issues.update({
              issue_number: ${{ github.event.issue.number }},
              owner: context.repo.owner,
              repo: context.repo.repo,
              state: 'closed',
              state_reason: 'completed'
            })
Take this with you
And there you have it! With a handful of standardized workflows, you have an end-to-end, issue-driven process in place to manage team membership. This can be extended as far as you want, including support for removing users, auditing access, and more. With IssueOps, the sky is the limit!
Here’s the best thing about IssueOps: It brings another level of automation to a surface I’m constantly using—and that’s GitHub. By using issues and pull requests as control centers for workflows, teams can reduce friction, improve efficiency, and keep everything transparent. Whether you want to automate deployments, approvals, or bug triage, IssueOps makes it all possible, without ever leaving your repo.
In my experience, it’s always best to start small and experiment with what works best for you. With just a bit of time, you’ll see your workflows get smoother with every commit (I know I have). Happy coding! ✨
The FBI is warning of a mail-based fraud involving letters sent to businesses in the U.S. These letters resemble online ransomware notes demanding payment via Bitcoin.
Rapid7 examined a mail-based ransom demand sent to a customer from a local postcode.
There is no evidence that any of the recipients have been compromised by BianLian.
From BianLian: “Time Sensitive, Read Immediately”
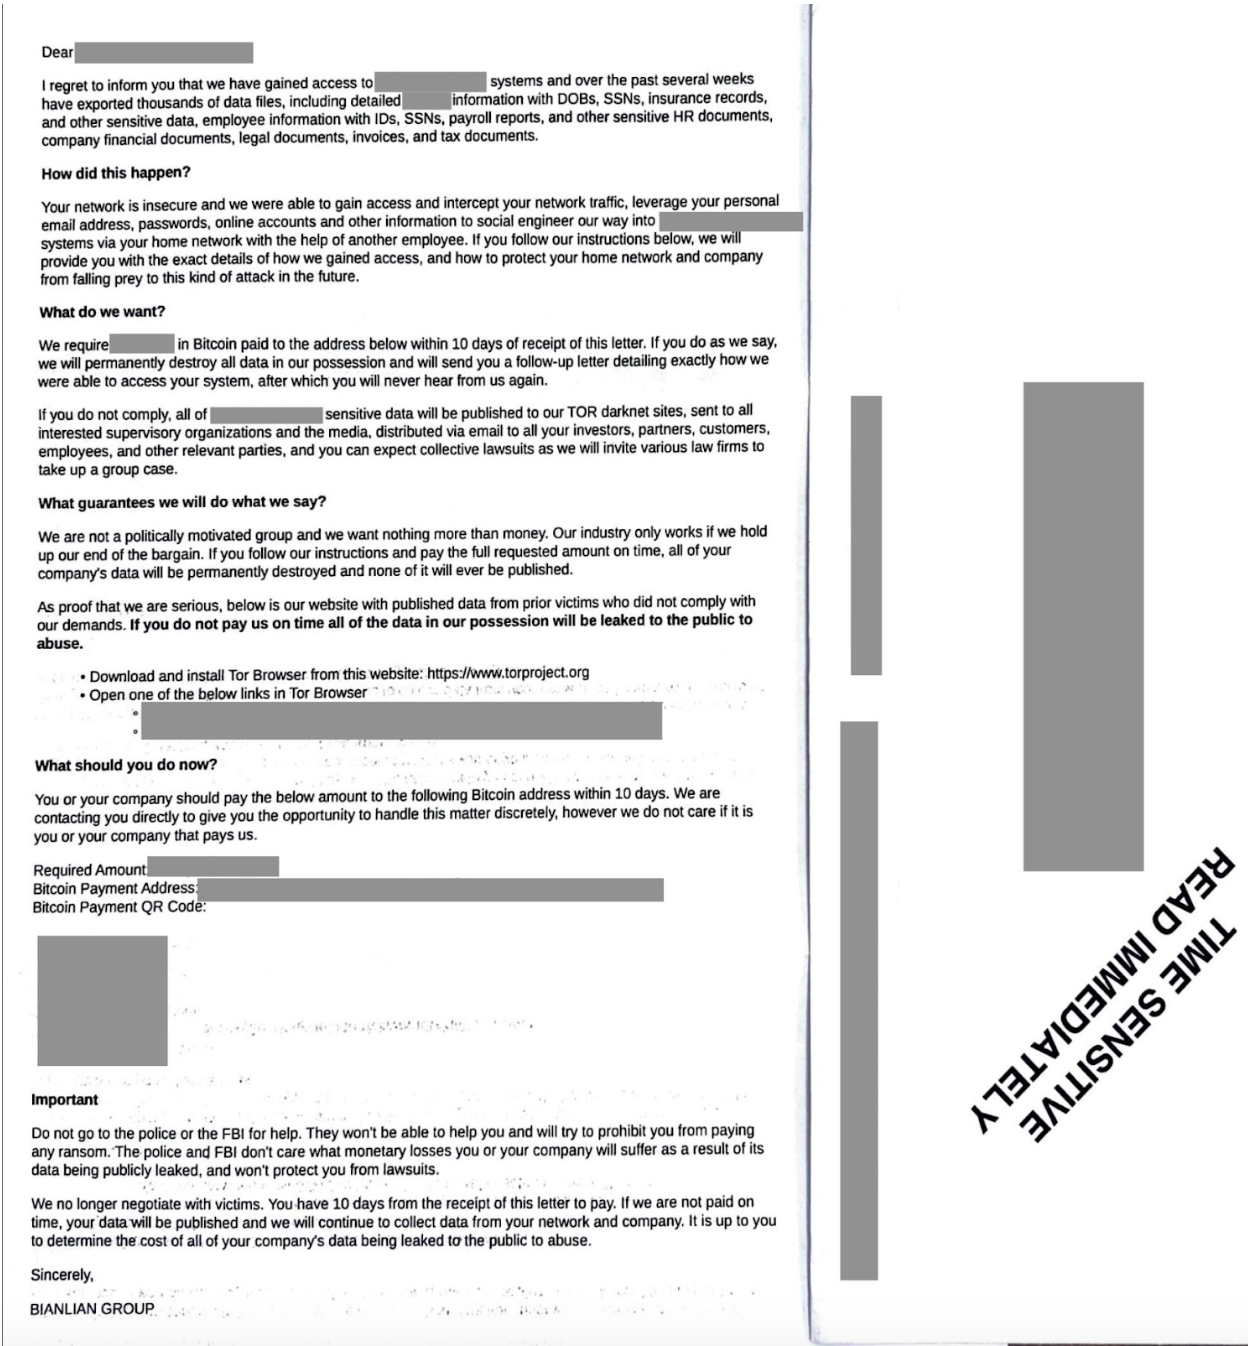
On March 5, the FBI issued an alert regarding a mail scam targeting U.S. business executives with extortion. The letters claim to be from noted ransomware group BianLian, demanding a payment in Bitcoin ranging from $250,000 to $500,000 within ten days of receipt.
The FBI alert reads as follows:
“Stamped “Time Sensitive Read Immediately”, the letter claims the “BianLian Group” gained access into the organization’s network and stole thousands of sensitive data files. The letter then goes on to threaten that the victim’s data will be published to BianLian’s data leak sites if recipients do not use an included QR code linked to a Bitcoin wallet to pay between $250,000 and $500,000 within ten days from receipt of the letter, claiming the group will not negotiate further with victims.”
The ransom note also warns recipients not to contact law enforcement, stressing that the FBI “does not care” about victims and will not help in the event of a lawsuit — a classic social engineering pressure tactic.
Rapid7 has observed that these letters are still in circulation, with one such letter received by a Rapid7 customer highlighted below. While we have redacted parts of the letter to protect the customer’s identity and other sensitive information, you can see that it follows the pattern of others seen in the wild, falsely claiming to be from BianLian:
It reads:
“I regret to inform you that we have gained access to [redacted] systems and over the past several weeks have exported thousands of data files, including detailed [redacted] information with DOBs, SSNs, insurance records, and other sensitive data, employee information with IDs, SSNs, payroll reports, and other sensitive HR documents, company financial documents, legal documents, invoices, and tax documents.
How did this happen?
Your network is insecure and we were able to gain access and intercept your network traffic, leverage your personal email address, passwords, online accounts and other information to social engineer our way into [redacted] systems via your home network with the help of another employee. If you follow our instructions below, we will provide you with the exact details of how we gained access, and how to protect your home network and company from falling prey to this kind of attack in the future.
What do we want?
We require [redacted] in Bitcoin paid to the address below within 10 days of receipt of this letter. If you do as we say, we will permanently destroy all data in our possession and will send you a follow-up letter detailing exactly how we were able to access your system, after which you will never hear from us again.
If you do not comply, all of [redacted] sensitive data will be published to our TOR darknet sites, sent to all interested supervisory organizations and the media, distributed via email to all your investors, partners, customers, employees, and other relevant parties, and you can expect collective lawsuits as we will invite various law firms to take up a group case.”
The above letter is a match for those received by multiple businesses. Similarly, the Bitcoin payment address does not appear to be connected to the genuine BianLian group—just like several other examples highlighted online.
What you need to do
The FBI has issued the following advice, which is still applicable to this example of mail-based fraud:
Notify corporate executives and the organization of the scam for awareness.
Ensure employees are educated on what to do if they receive a ransom threat.
If you or your organization receive one of these letters, ensure your network defenses are up to date and that there are no active alerts regarding malicious activity.
If you discover you are a victim of BianLian ransomware, please visit [the FBI’s] Joint Cybersecurity Awareness Bulletin for recent tactics, techniques, and procedures and indicators of compromise to help organizations protect against ransomware.The FBI also requests that victims report any incident to their local FBI Field Office or the Internet Crime Complaint Center (IC3).
Additionally, Rapid7 recommends the following:
Do not scan any QR codes or go to any web links within the letter.
Do not pay any ransom.
Secure both the letter and envelope in a chain of custody evidence bag, or a ziplock if unavailable.
While ransomware actually was sent through the mail via infected USB sticks in 2022 by threat actor FIN7, that is not the case here. Recipients have not been compromised by BianLian despite what said letters claim. While your business is unlikely to receive one of these letters, other fraudsters may follow suit so a few moments spent warning of the dangers of this tactic may help to prevent an avoidable financial loss.
Modern CPUs all have multiple hardware vulnerabilities that the kernel needs to mitigate;
the 6.13 kernel has workarounds for 14 security-sensitive CPU bugs just on x86_64.
Several of those have multiple variants,
or multiple mitigations that apply on different microarchitectures. There are
different kernel command-line options for each of these mitigations, which leads
to a confusing situation for users trying to figure out how to configure their
systems. David Kaplan recently posted
a patch set that adds a single, unified command-line option for controlling
mitigations and
simplifies the logic for detecting, configuring, and
applying them as well.
If it is merged, the patch set could
make it much easier for users to navigate the complicated web of CPU
vulnerabilities and their mitigations.
Version 7.1
of PeerTube, a tool for
sharing videos online, has been released. Notable features in this
release include improved support for the Podcast 2.0 standard, better
playback stability, and a new view protocol enabled by default to
allow PeerTube to handle more simultaneous viewers. See the release
notes for more details.
/e/OS is a
privacy-centric, open-source mobile operating system that
has primarily been targeted at mobile phones, with only a few
community supported images available for tablet devices. In December, Murena—a company that sells devices with /e/OS
preinstalled—announced
that /e/OS now officially supports tablets as well, starting with the
Pixel tablet. The user experience is close enough to
mainstream alternatives to make it attractive, but there are some
under-the-hood problems that may give users pause.
A security company called Fenrisk has posted an overview of a pair
of claimed successful supply-chain attacks on the Fedora and openSUSE
distributions.
We successfully identified vulnerabilities in the Pagure, the Git
forge used by Fedora to store their package definitions. We also
compromised Open Build Service, the all-in-one toolchain used and
developed by the openSUSE project for compilation and packaging.
Their exploitation by malicious actors would have led to the
compromise of all the packages of the distributions Fedora and
openSUSE, as well as their downstream distributions, impacting
millions of Linux servers and desktops.
Security updates have been issued by Debian (tzdata), Fedora (expat and tigervnc), Red Hat (kernel, kernel-rt, thunderbird, and webkit2gtk3), SUSE (dcmtk), and Ubuntu (restrictedpython and uriparser).
Within the Cloudflare Application Security team, every machine learning model we use is underpinned by a rich set of static rules that serve as a ground truth and a baseline comparison for how our models are performing. These are called heuristics. Our Bot Management heuristics engine has served as an important part of eight global machine learning (ML) models, but we needed a more expressive engine to increase our accuracy. In this post, we’ll review how we solved this by moving our heuristics to the Cloudflare Ruleset Engine. Not only did this provide the platform we needed to write more nuanced rules, it made our platform simpler and safer, and provided Bot Management customers more flexibility and visibility into their bot traffic.
Bot detection via simple heuristics
In Cloudflare’s bot detection, we build heuristics from attributes like software library fingerprints, HTTP request characteristics, and internal threat intelligence. Heuristics serve three separate purposes for bot detection:
Bot identification: If traffic matches a heuristic, we can identify the traffic as definitely automated traffic (with a bot score of 1) without the need of a machine learning model.
Train ML models: When traffic matches our heuristics, we create labelled datasets of bot traffic to train new models. We’ll use many different sources of labelled bot traffic to train a new model, but our heuristics datasets are one of the highest confidence datasets available to us.
Validate models: We benchmark any new model candidate’s performance against our heuristic detections (among many other checks) to make sure it meets a required level of accuracy.
While the existing heuristics engine has worked very well for us, as bots evolved we needed the flexibility to write increasingly complex rules. Unfortunately, such rules were not easily supported in the old engine. Customers have also been asking for more details about which specific heuristic caught a request, and for the flexibility to enforce different policies per heuristic ID. We found that by building a new heuristics framework integrated into the Cloudflare Ruleset Engine, we could build a more flexible system to write rules and give Bot Management customers the granular explainability and control they were asking for.
The need for more efficient, precise rules
In our previous heuristics engine, we wrote rules in Lua as part of our openresty-based reverse proxy. The Lua-based engine was limited to a very small number of characteristics in a rule because of the high engineering cost we observed with adding more complexity.
With Lua, we would write fairly simple logic to match on specific characteristics of a request (i.e. user agent). Creating new heuristics of an existing class was fairly straight forward. All we’d need to do is define another instance of the existing class in our database. However, if we observed malicious traffic that required more than two characteristics (as a simple example, user-agent and ASN) to identify, we’d need to create bespoke logic for detections. Because our Lua heuristics engine was bundled with the code that ran ML models and other important logic, all changes had to go through the same review and release process. If we identified malicious traffic that needed a new heuristic class, and we were also blocked by pending changes in the codebase, we’d be forced to either wait or rollback the changes. If we’re writing a new rule for an “under attack” scenario, every extra minute it takes to deploy a new rule can mean an unacceptable impact to our customer’s business.
More critical than time to deploy is the complexity that the heuristics engine supports. The old heuristics engine only supported using specific request attributes when creating a new rule. As bots became more sophisticated, we found we had to reject an increasing number of new heuristic candidates because we weren’t able to write precise enough rules. For example, we found a Golang TLS fingerprint frequently used by bots and by a small number of corporate VPNs. We couldn’t block the bots without also stopping the legitimate VPN usage as well, because the old heuristics platform lacked the flexibility to quickly compile sufficiently nuanced rules. Luckily, we already had the perfect solution with Cloudflare Ruleset Engine.
Our new heuristics engine
The Ruleset Engine is familiar to anyone who has written a WAF rule, Load Balancing rule, or Transform rule, just to name a few. For Bot Management, the Wireshark-inspired syntax allows us to quickly write heuristics with much greater flexibility to vastly improve accuracy. We can write a rule in YAML that includes arbitrary sub-conditions and inherit the same framework the WAF team uses to both ensure any new rule undergoes a rigorous testing process with the ability to rapidly release new rules to stop attacks in real-time.
Writing heuristics on the Cloudflare Ruleset Engine allows our engineers and analysts to write new rules in an easy to understand YAML syntax. This is critical to supporting a rapid response in under attack scenarios, especially as we support greater rule complexity. Here’s a simple rule using the new engine, to detect empty user-agents restricted to a specific JA4 fingerprint (right), compared to the empty user-agent detection in the old Lua based system (left):
--- Adds heuristic to be used for inference in `detect` method
-- @param heuristic schema.Heuristic table
function EmptyUserAgentHeuristic:add(heuristic)
self.heuristic = heuristic
end
--- Detect runs empty user agent heuristic detection
-- @param ctx context of request
-- @return schema.Heuristic table on successful detection or nil otherwise
function EmptyUserAgentHeuristic:detect(ctx)
local ua = ctx.user_agent
if not ua or ua == '' then
return self.heuristic
end
end
return _M
ref: empty-user-agent
description: Empty or missing
User-Agent header
action: add_bot_detection
action_parameters:
active_mode: false
expression: http.user_agent eq
"" and cf.bot_management.ja4 = "t13d1516h2_8daaf6152771_b186095e22b6"
The Golang heuristic that captured corporate proxy traffic as well (mentioned above) was one of the first to migrate to the new Ruleset engine. Before the migration, traffic matching on this heuristic had a false positive rate of 0.01%. While that sounds like a very small number, this means for every million bots we block, 100 real users saw a Cloudflare challenge page unnecessarily. At Cloudflare scale, even small issues can have real, negative impact.
When we analyzed the traffic caught by this heuristic rule in depth, we saw the vast majority of attack traffic came from a small number of abusive networks. After narrowing the definition of the heuristic to flag the Golang fingerprint only when it’s sourced by the abusive networks, the rule now has a false positive rate of 0.0001% (One out of 1 million). Updating the heuristic to include the network context improved our accuracy, while still blocking millions of bots every week and giving us plenty of training data for our bot detection models. Because this heuristic is now more accurate, newer ML models make more accurate decisions on what’s a bot and what isn’t.
New visibility and flexibility for Bot Management customers
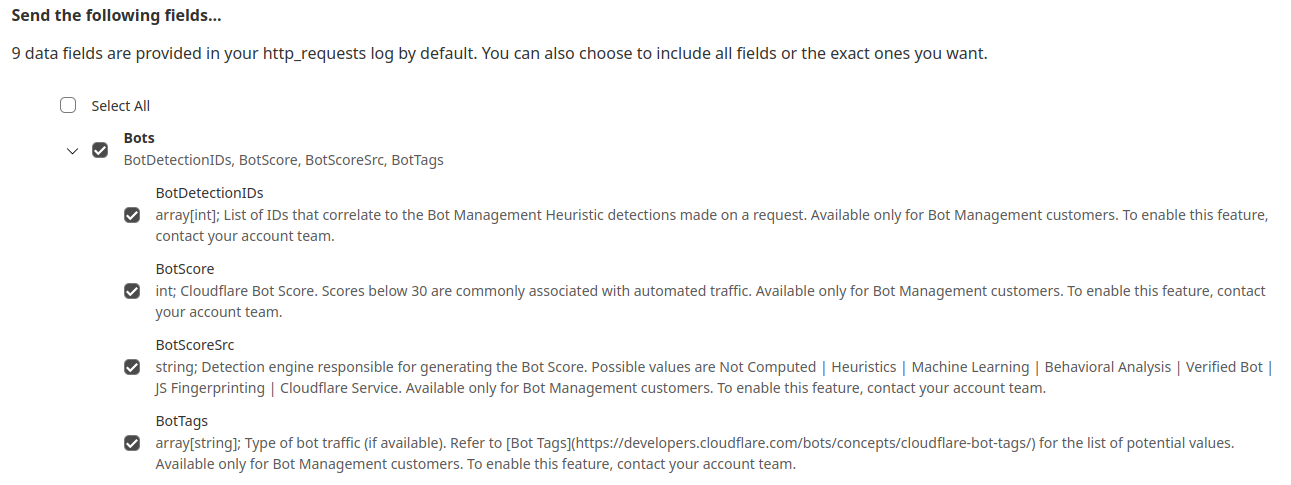
While the new heuristics engine provides more accurate detections for all customers and a better experience for our analysts, moving to the Cloudflare Ruleset Engine also allows us to deliver new functionality for Enterprise Bot Management customers, specifically by offering more visibility. This new visibility is via a new field for Bot Management customers called Bot Detection IDs. Every heuristic we use includes a unique Bot Detection ID. These are visible to Bot Management customers in analytics, logs, and firewall events, and they can be used in the firewall to write precise rules for individual bots.
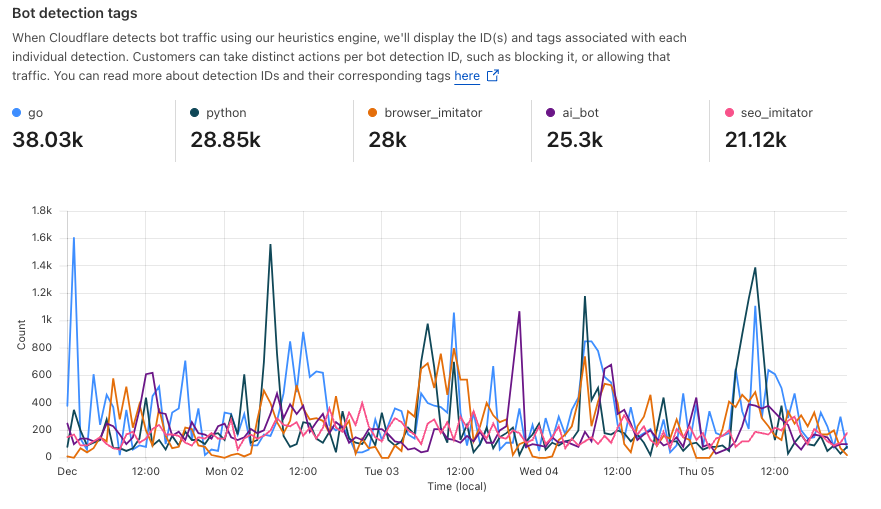
Detections also include a specific tag describing the class of heuristic. Customers see these plotted over time in their analytics.
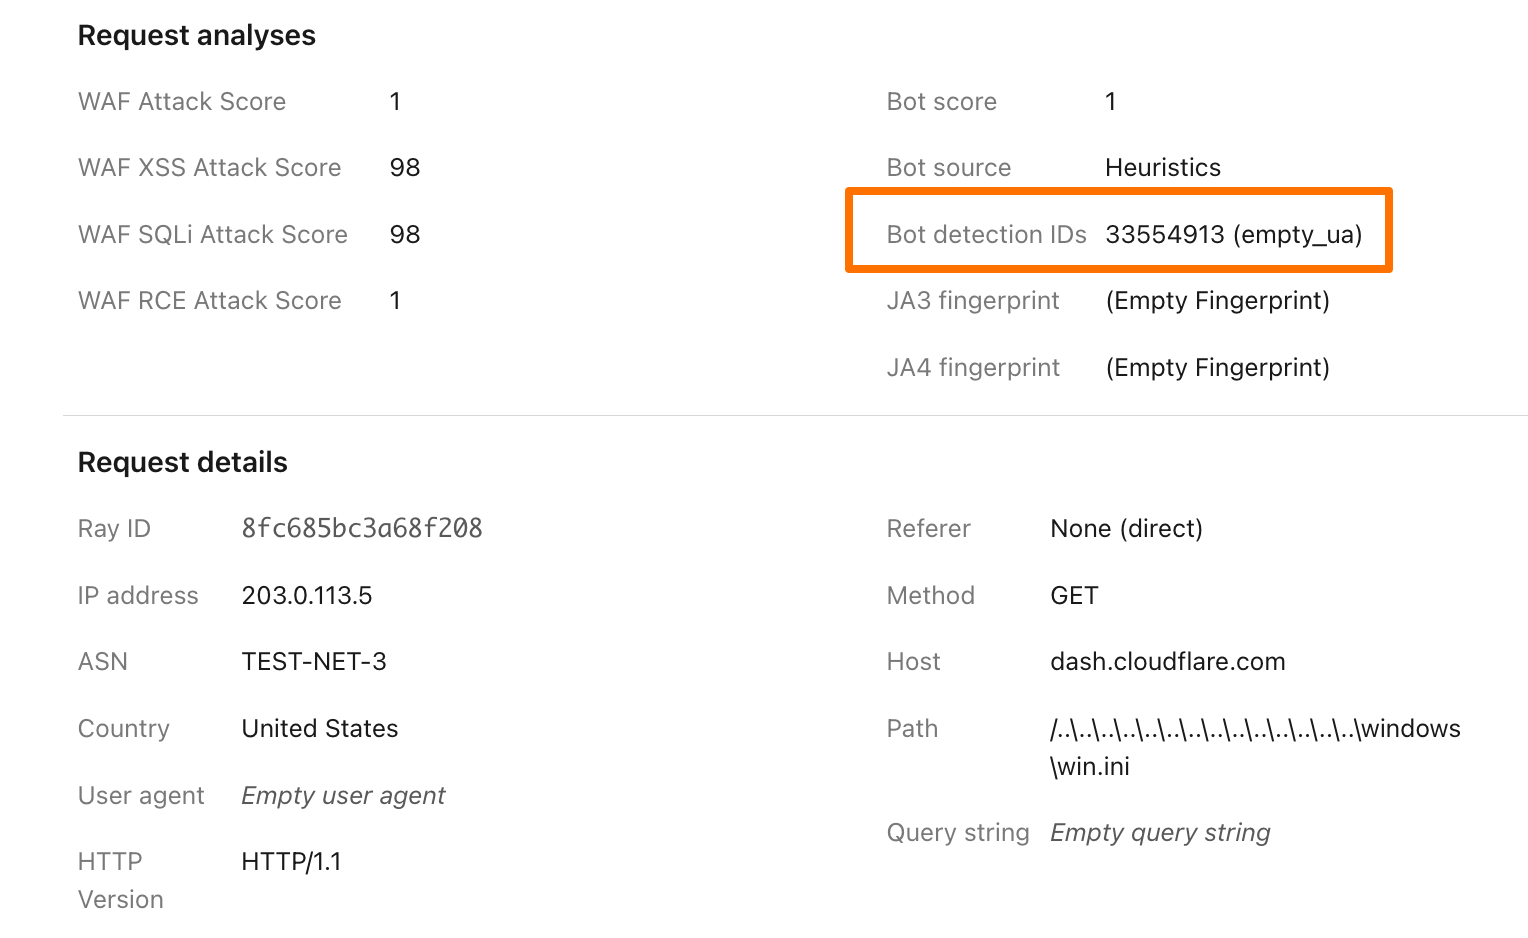
To illustrate how this data can help give customers visibility into why we blocked a request, here’s an example request flagged by Bot Management (with the IP address, ASN, and country changed):
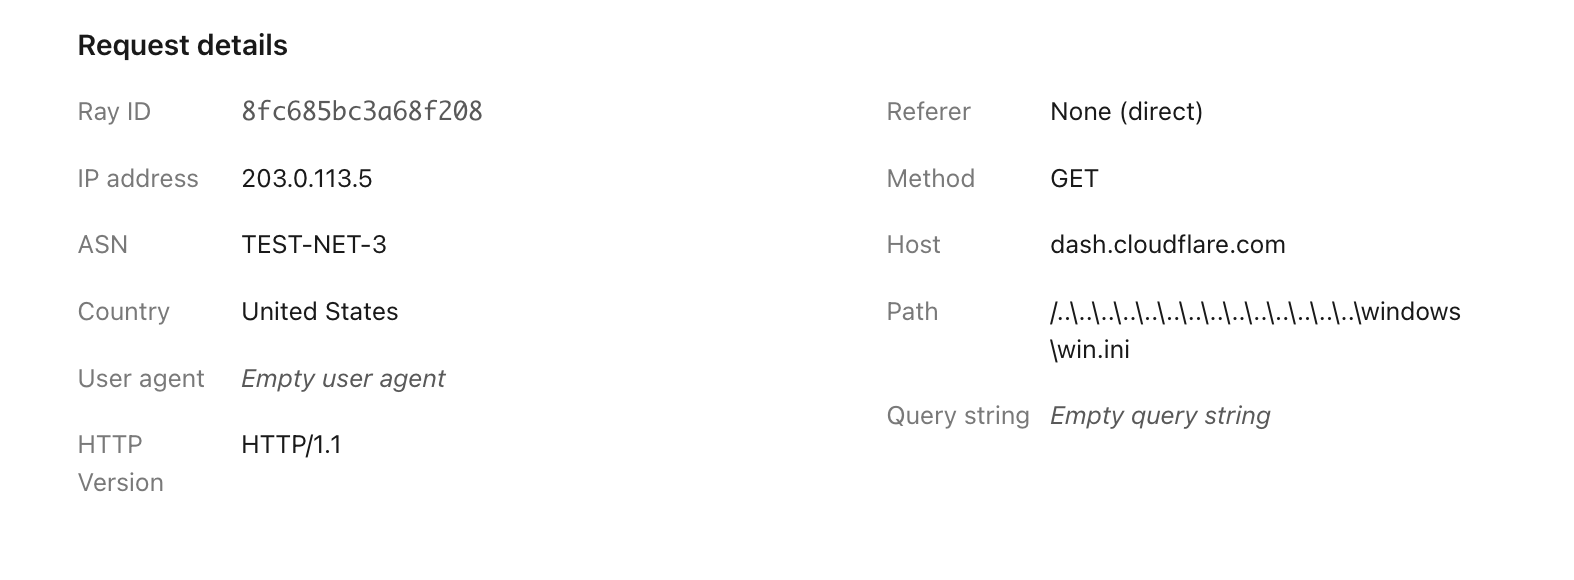
Before, just seeing that our heuristics gave the request a score of 1 was not very helpful in understanding why it was flagged as a bot. Adding our Detection IDs to Firewall Events helps to paint a better picture for customers that we’ve identified this request as a bot because that traffic used an empty user-agent.
In addition to Analytics and Firewall Events, Bot Detection IDs are now available for Bot Management customers to use in Custom Rules, Rate Limiting Rules, Transform Rules, and Workers.
Account takeover detection IDs
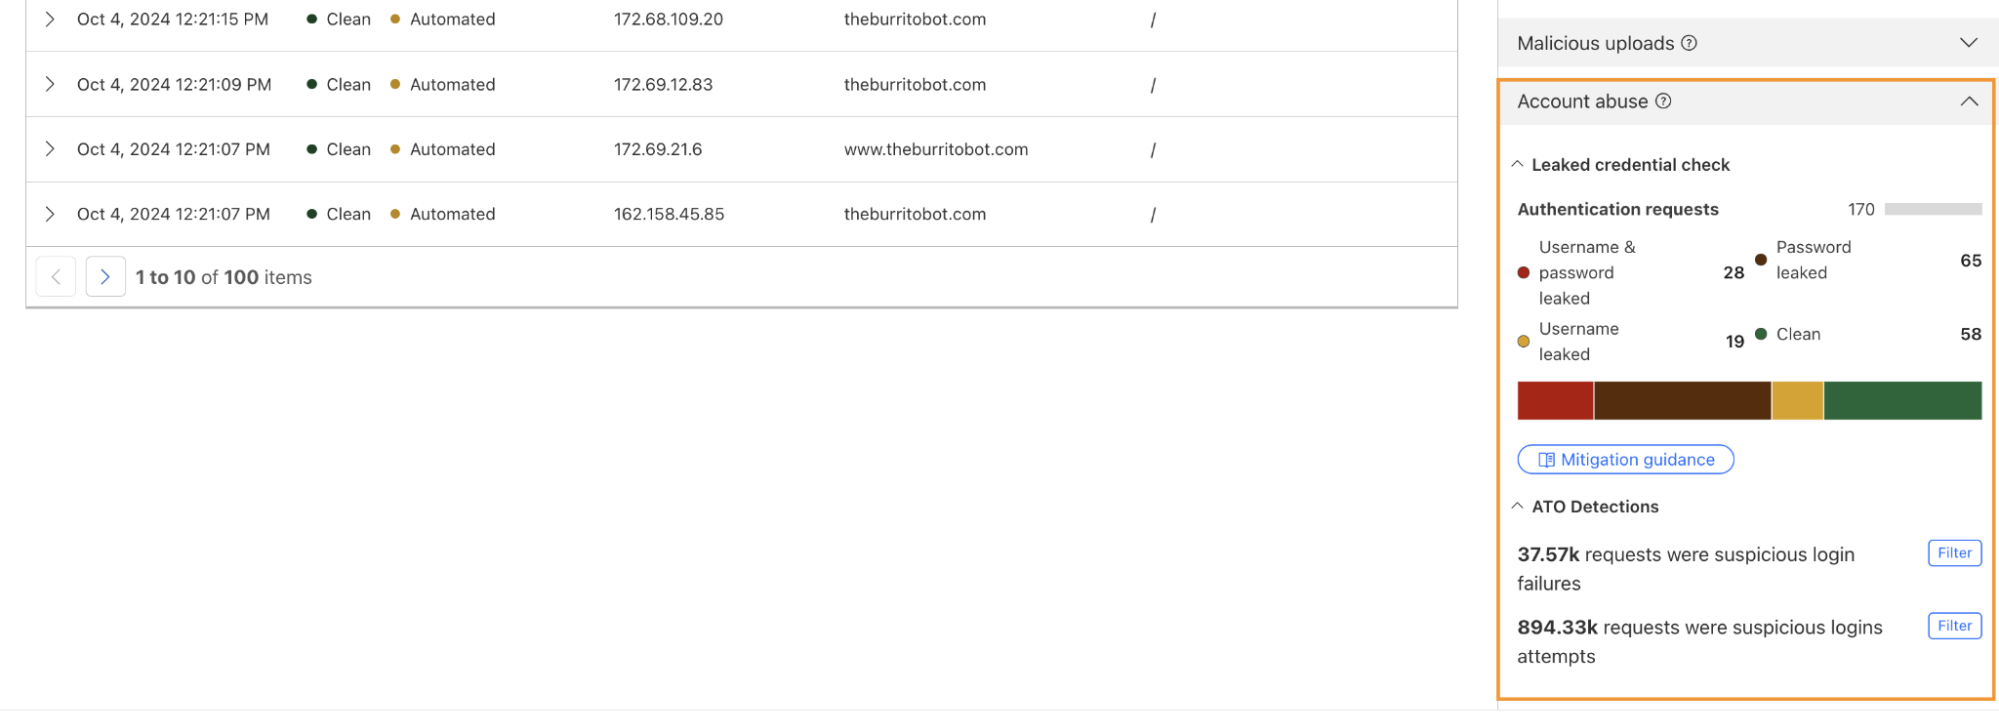
One way we’re focused on improving Bot Management for our customers is by surfacing more attack-specific detections. During Birthday Week, we launched Leaked Credentials Check for all customers so that security teams could help prevent account takeover (ATO) attacks by identifying accounts at risk due to leaked credentials. We’ve now added two more detections that can help Bot Management enterprise customers identify suspicious login activity via specific detection IDs that monitor login attempts and failures on the zone. These detection IDs are not currently affecting the bot score, but will begin to later in 2025. Already, they can help many customers detect more account takeover events now.
Detection ID 201326592 monitors traffic on a customer website and looks for an anomalous rise in login failures (usually associated with brute force attacks), and ID 201326593 looks for an anomalous rise in login attempts (usually associated with credential stuffing).
Protect your applications
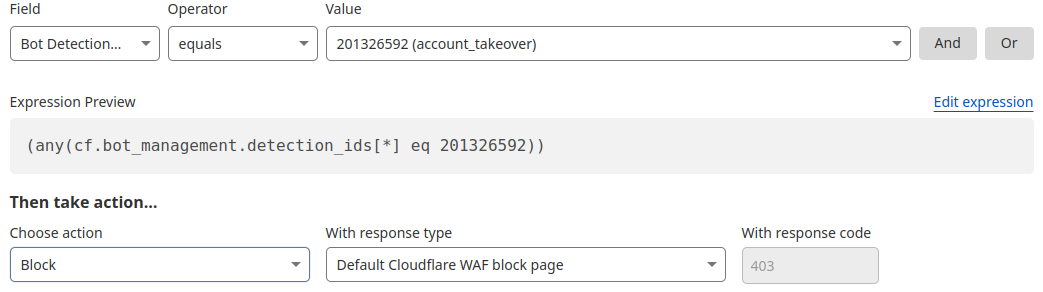
If you are a Bot Management customer, log in and head over to the Cloudflare dashboard and take a look in Security Analytics for bot detection IDs 201326592 and 201326593.
These will highlight ATO attempts targeting your site. If you spot anything suspicious, or would like to be protected against future attacks, create a rule that uses these detections to keep your application safe.
Imagine building an LLM-powered assistant trained on your developer documentation and some internal guides to quickly help customers, reduce support workload, and improve user experience. Sounds great, right? But what if sensitive data, such as employee details or internal discussions, is included in the data used to train the LLM? Attackers could manipulate the assistant into exposing sensitive data or exploit it for social engineering attacks, where they deceive individuals or systems into revealing confidential details, or use it for targeted phishing attacks. Suddenly, your helpful AI tool turns into a serious security liability.
Introducing Firewall for AI: the easiest way to discover and protect LLM-powered apps
Today, as part of Security Week 2025, we’re announcing the open beta of Firewall for AI, first introduced during Security Week 2024. After talking with customers interested in protecting their LLM apps, this first beta release is focused on discovery and PII detection, and more features will follow in the future.
If you are already using Cloudflare application security, your LLM-powered applications are automatically discovered and protected, with no complex setup, no maintenance, and no extra integration needed.
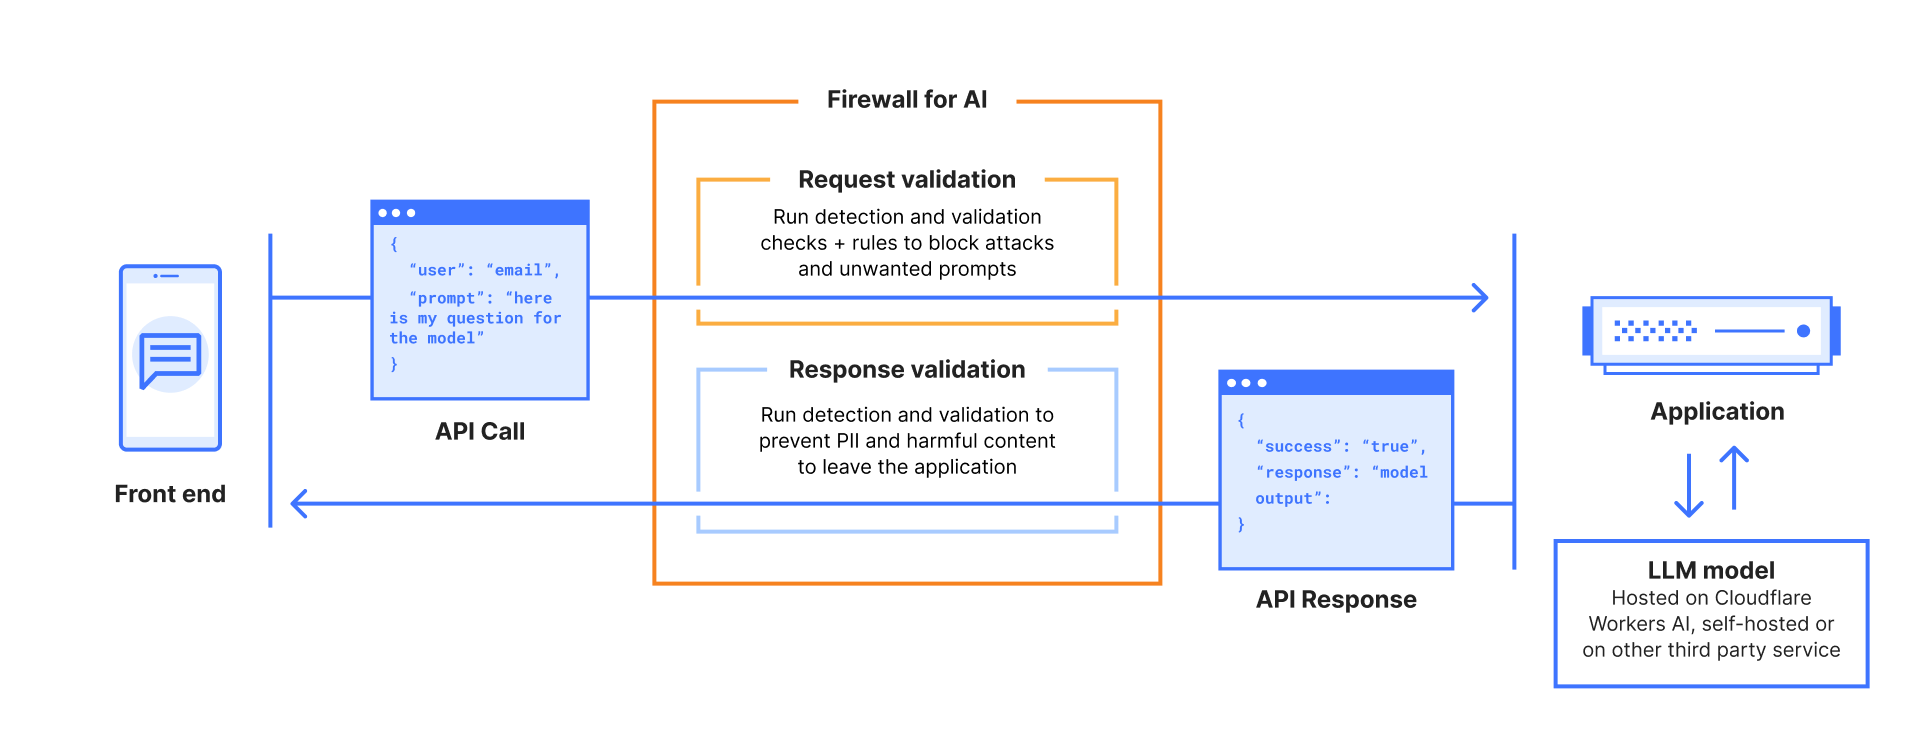
Firewall for AI is an inline security solution that protects user-facing LLM-powered applications from abuse and data leaks, integrating directly with Cloudflare’s Web Application Firewall (WAF) to provide instant protection with zero operational overhead. This integration enables organizations to leverage both AI-focused safeguards and established WAF capabilities.
Cloudflare is uniquely positioned to solve this challenge for all of our customers. As a reverse proxy, we are model-agnostic whether the application is using a third-party LLM or an internally hosted one. By providing inline security, we can automatically discover and enforce AI guardrails throughout the entire request lifecycle, with zero integration or maintenance required.
Firewall for AI beta overview
The beta release includes the following security capabilities:
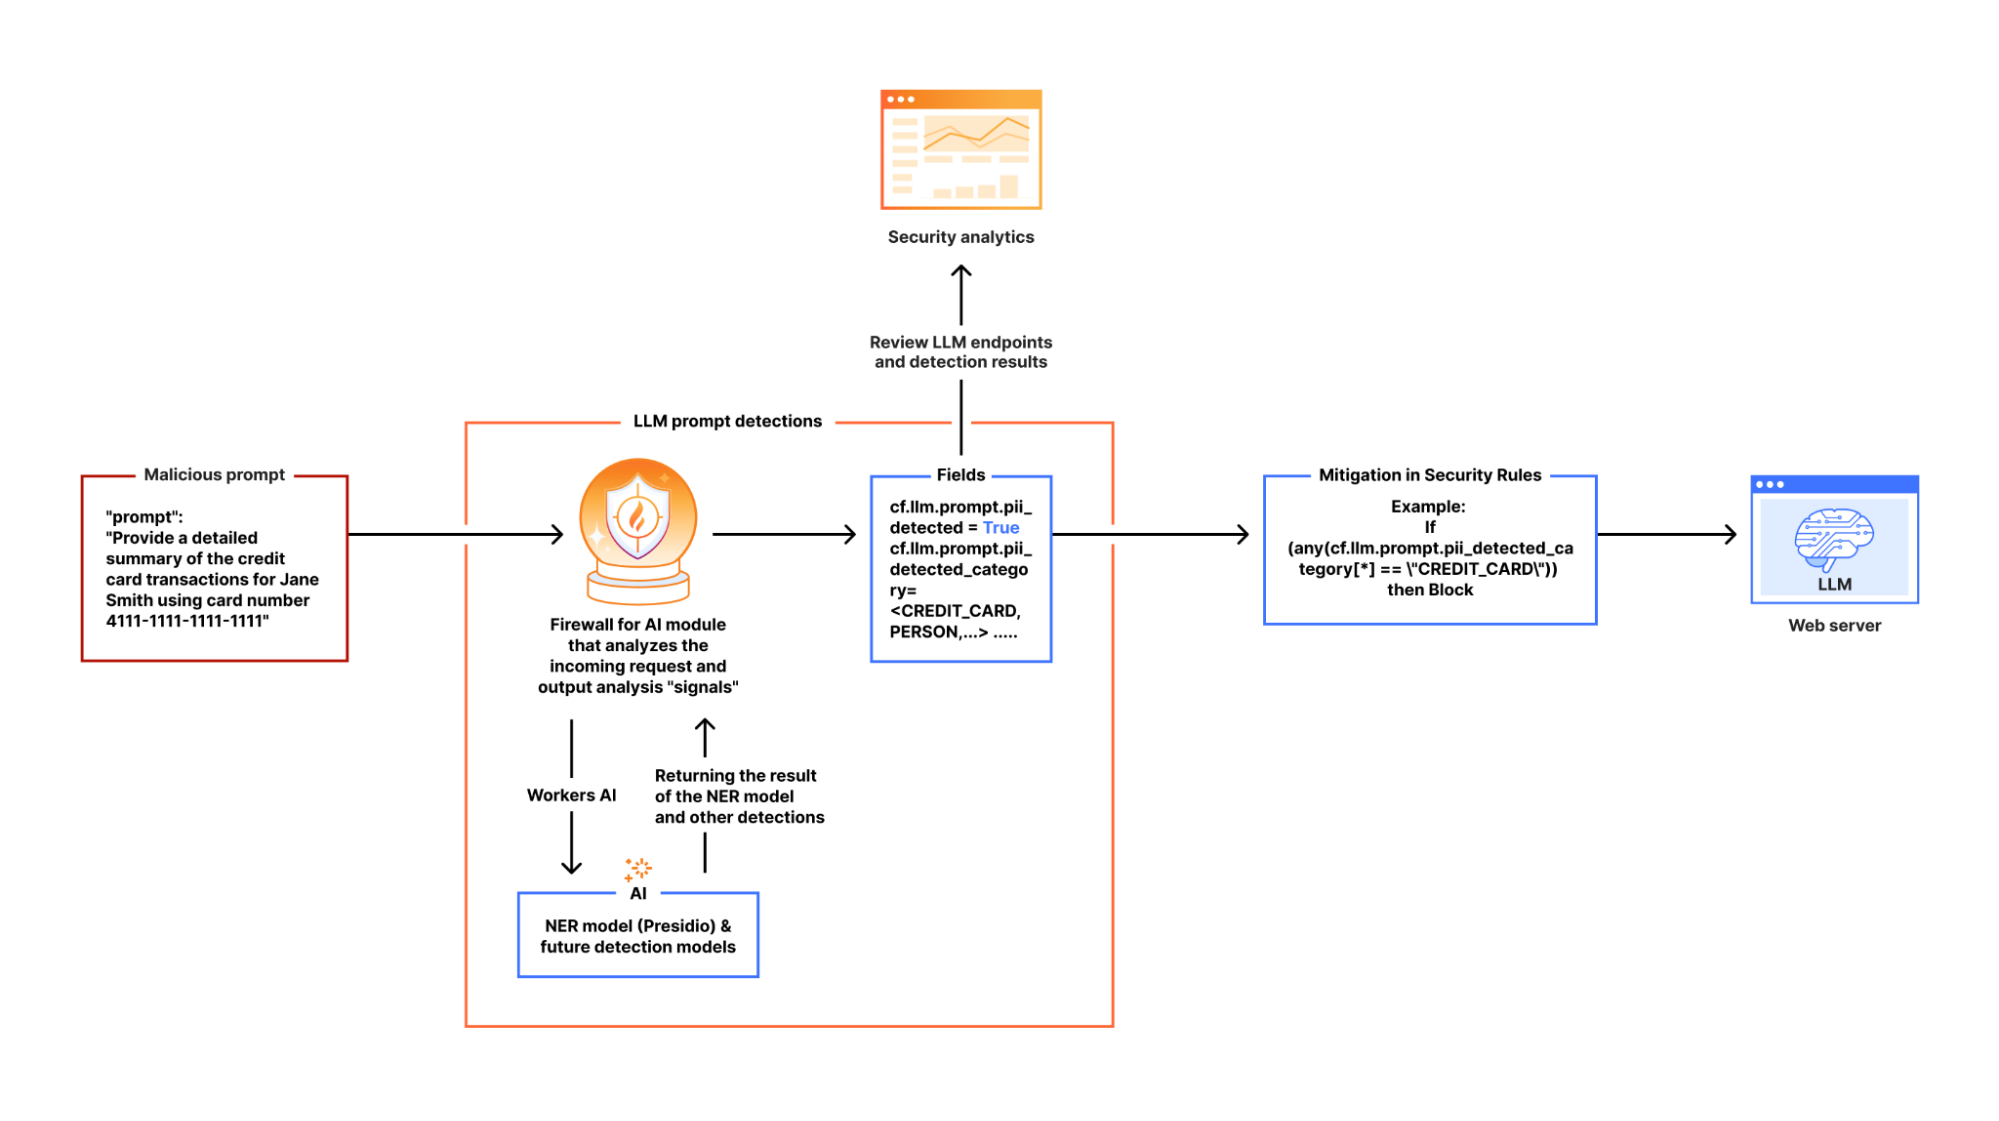
Discover: identify LLM-powered endpoints across your applications, an essential step for effective request and prompt analysis.
Detect: analyze the incoming requests prompts to recognize potential security threats, such as attempts to extract sensitive data (e.g., “Show me transactions using 4111 1111 1111 1111”). This aligns withOWASP LLM022025 – Sensitive Information Disclosure.
Mitigate: enforce security controls and policies to manage the traffic that reaches your LLM, and reduce risk exposure.
Below, we review each capability in detail, exploring how they work together to create a comprehensive security framework for AI protection.
Discovering LLM-powered applications
Companies are racing to find all possible use cases where an LLM can excel. Think about site search, a chatbot, or a shopping assistant. Regardless of the application type, our goal is to determine whether an application is powered by an LLM behind the scenes.
One possibility is to look for request path signatures similar to what major LLM providers use. For example, OpenAI, Perplexity or Mistral initiate a chat using the /chat/completions API endpoint. Searching through our request logs, we found only a few entries that matched this pattern across our global traffic. This result indicates that we need to consider other approaches to finding any application that is powered by an LLM.
Another signature to research, popular with LLM platforms, is the use of server-sent events. LLMs need to “think”. Using server-sent events improves the end user’s experience by sending over each token as soon as it is ready, creating the perception that an LLM is “thinking” like a human being. Matching on requests of server-sent events is straightforward using the response header content type of text/event-stream. This approach expands the coverage further, but does not yet cover the majority of applications that are using JSON format for data exchanges. Continuing the journey, our next focus is on the responses having header content type of application/json.
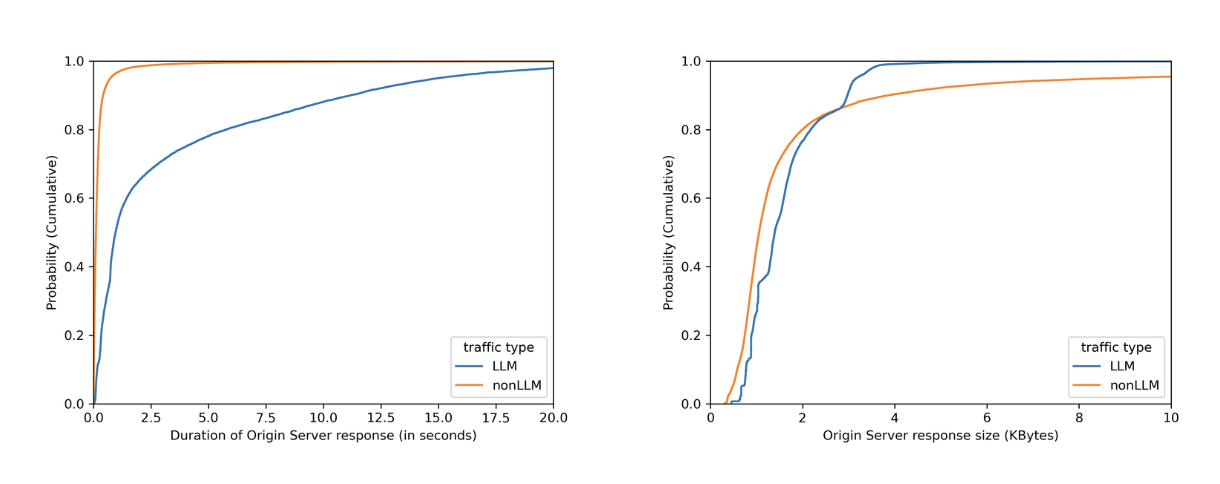
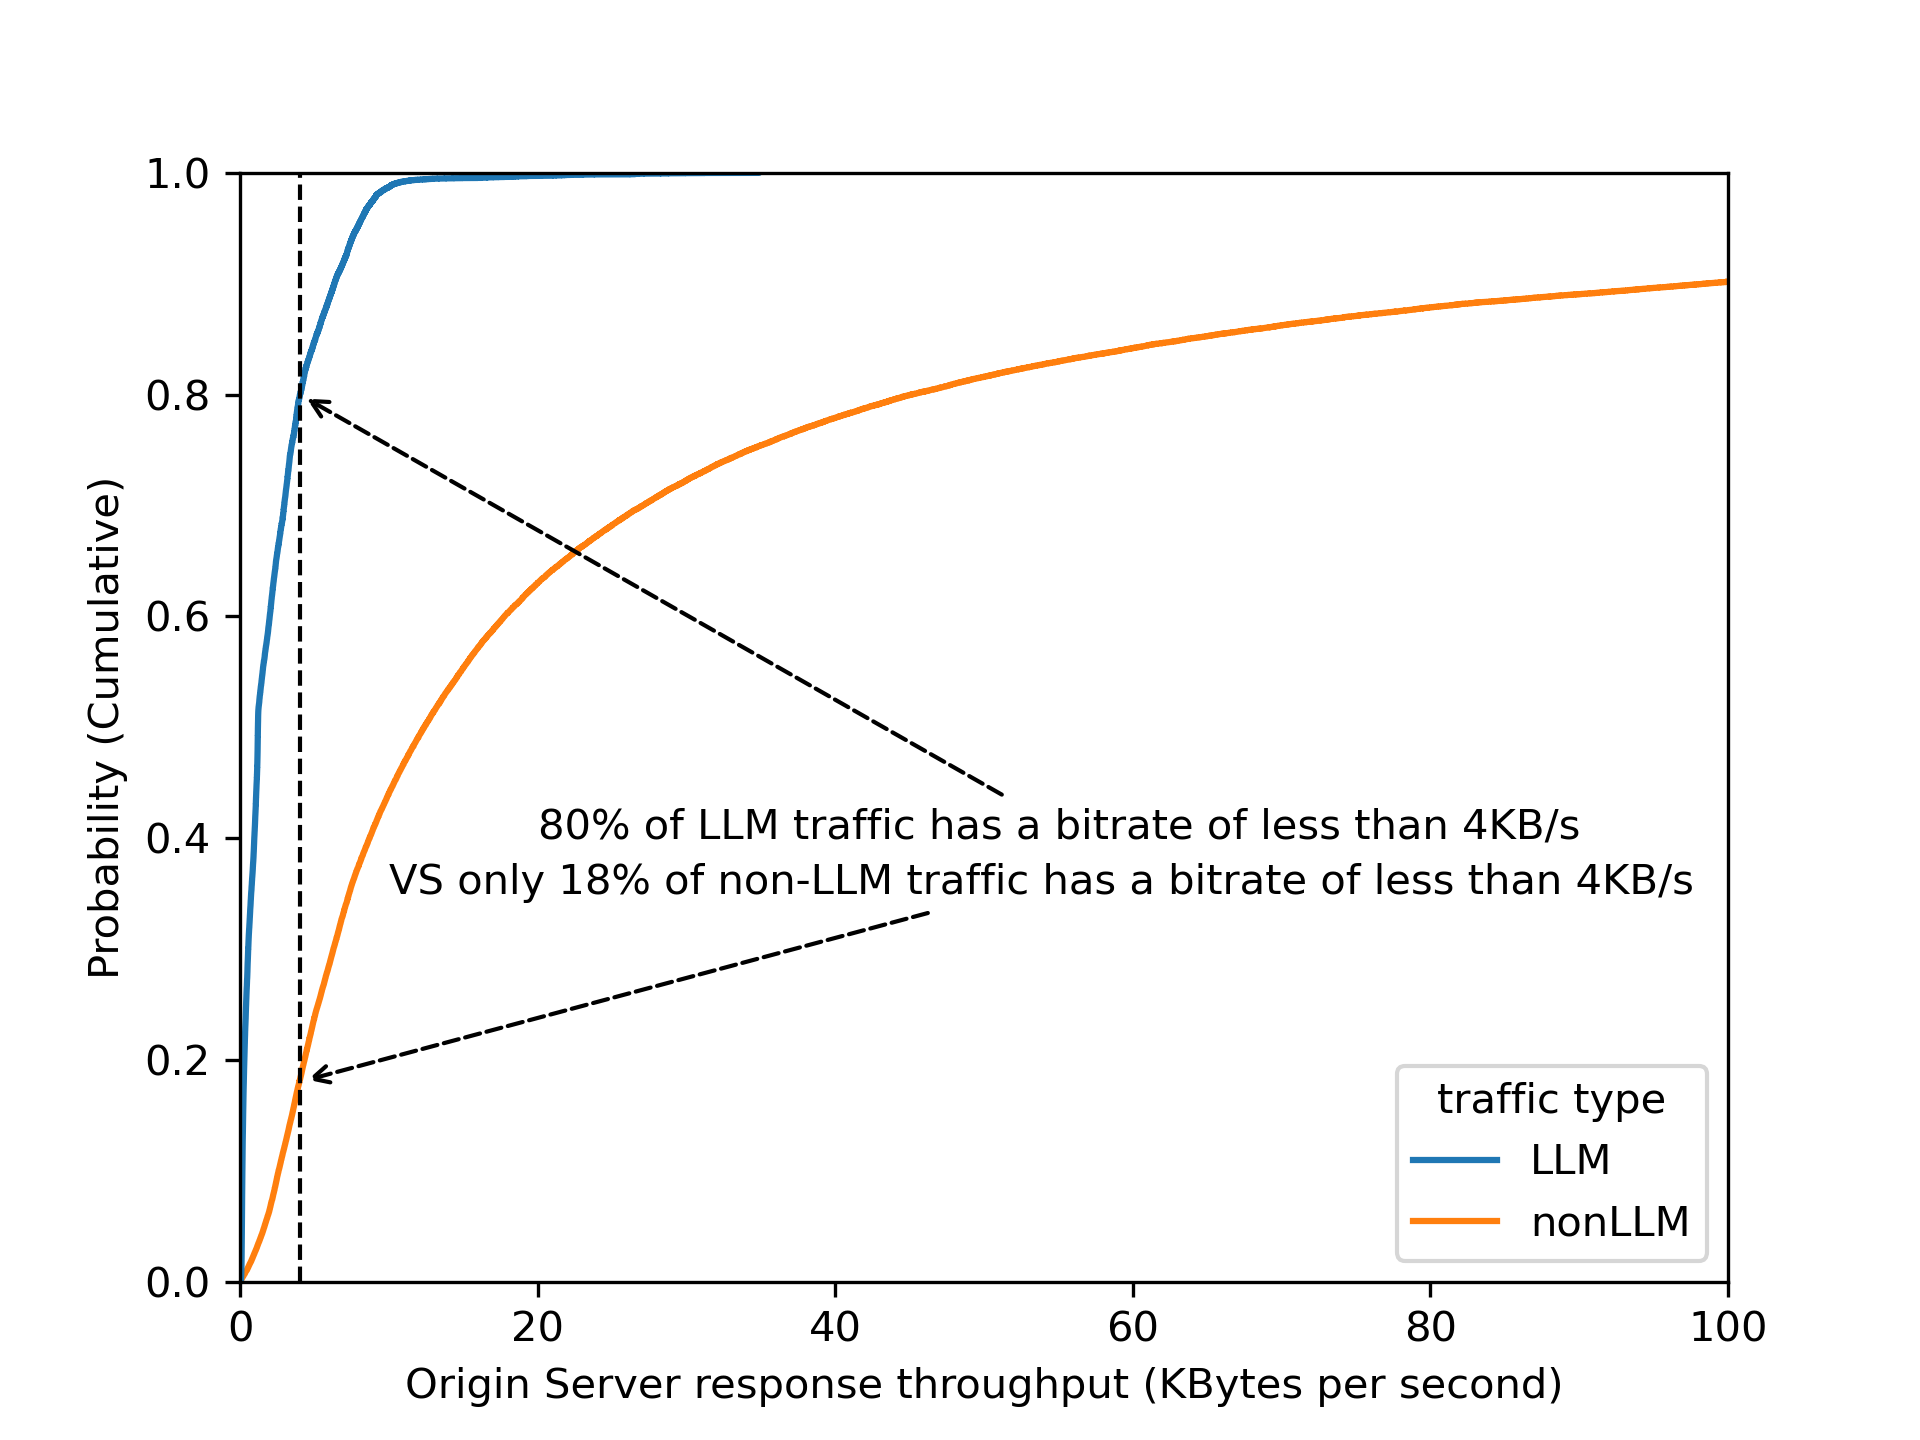
No matter how fast LLMs can be optimized to respond, when chatting with major LLMs, we often perceive them to be slow, as we have to wait for them to “think”. By plotting on how much time it takes for the origin server to respond over identified LLM endpoints (blue line) versus the rest (orange line), we can see in the left graph that origins serving LLM endpoints mostly need more than 1 second to respond, while the majority of the rest takes less than 1 second. Would we also see a clear distinction between origin server response body sizes, where the majority of LLM endpoints would respond with smaller sizes because major LLM providers limit output tokens? Unfortunately not. The right graph shows that LLM response size largely overlaps with non-LLM traffic.
By dividing origin response size over origin response duration to calculate an effective bitrate, the distinction is even clearer that 80% of LLM endpoints operate slower than 4 KB/s.
Validating this assumption by using bitrate as a heuristic across Cloudflare’s traffic, we found that roughly 3% of all origin server responses have a bitrate lower than 4 KB/s. Are these responses all powered by LLMs? Our gut feeling tells us that it is unlikely that 3% of origin responses are LLM-powered!
Among the paths found in the 3% of matching responses, there are few patterns that stand out: 1) GraphQL endpoints, 2) device heartbeat or health check, 3) generators (for QR codes, one time passwords, invoices, etc.). Noticing this gave us the idea to filter out endpoints that have a low variance of response size over time — for instance, invoice generation is mostly based on the same template, while conversations in the LLM context have a higher variance.
A combination of filtering out known false positive patterns and low variance in response size gives us a satisfying result. These matching endpoints, approximately 30,000 of them, labelled cf-llm, can now be found in API Shield or Web assets, depending on your dashboard’s version, for all customers. Now you can review your endpoints and decide how to best protect them.
Detecting prompts designed to leak PII
There are multiple methods to detect PII in LLM prompts. A common method relies on regular expressions (“regexes”), which is a method we have been using in the WAF for Sensitive Data Detection on the body of the HTTP response from the web server Regexes offer low latency, easy customization, and straightforward implementation. However, regexes alone have limitations when applied to LLM prompts. They require frequent updates to maintain accuracy, and may struggle with more complex or implicit PII, where the information is spread across text rather than a fixed format.
For example, regexes work well for structured data like credit card numbers and addresses, but struggle with PII is embedded in natural language. For instance, “I just booked a flight using my Chase card, ending in 1111” wouldn’t trigger a regex match as it lacks the expected pattern, even though it reveals a partial credit card number and financial institution.
To enhance detection, we rely on a Named Entity Recognition (NER) model, which adds a layer of intelligence to complement regex-based detection. NER models analyze text to identify contextual PII data types, such as names, phone numbers, email addresses, and credit card numbers, making detection more flexible and accurate. Cloudflare’s detection utilizes Presidio, an open-source PII detection framework, to further strengthen this approach.
Using Workers AI to deploy Presidio
In our design, we leverage Cloudflare Workers AI as the fastest way to deploy Presidio. This integration allows us to process LLM app requests inline, ensuring that sensitive data is flagged before it reaches the model.
Here’s how it works:
When Firewall for AI is enabled on an application and an end user sends a request to an LLM-powered application, we pass the request to Cloudflare Workers AI which runs the request through Presidio’s NER-based detection model to identify any potential PII from the available entities. The output includes metadata like “Was PII found?” and “What type of PII entity?”. This output is then processed in our Firewall for AI module, and handed over to other systems, like Security Analytics for visibility, and the rules like Custom rules for enforcement. Custom rules allow customers to take appropriate actions on the requests based on the provided metadata.
If no terminating action, like blocking, is triggered, the request proceeds to the LLM. Otherwise, it gets blocked or the appropriate action is applied before reaching the origin.
Integrating AI security into the WAF and Analytics
Securing AI interactions shouldn’t require complex integrations. Firewall for AI is seamlessly built into Cloudflare’s WAF, allowing customers to enforce security policies before prompts reach LLM endpoints. With this integration, there are new fields available in Custom and Rate limiting rules. The rules can be used to take immediate action, such as blocking or logging risky prompts in real time.
For example, security teams can filter LLM traffic to analyze requests containing PII-related prompts. Using Cloudflare’s WAF rules engine, they can create custom security policies tailored to their AI applications.
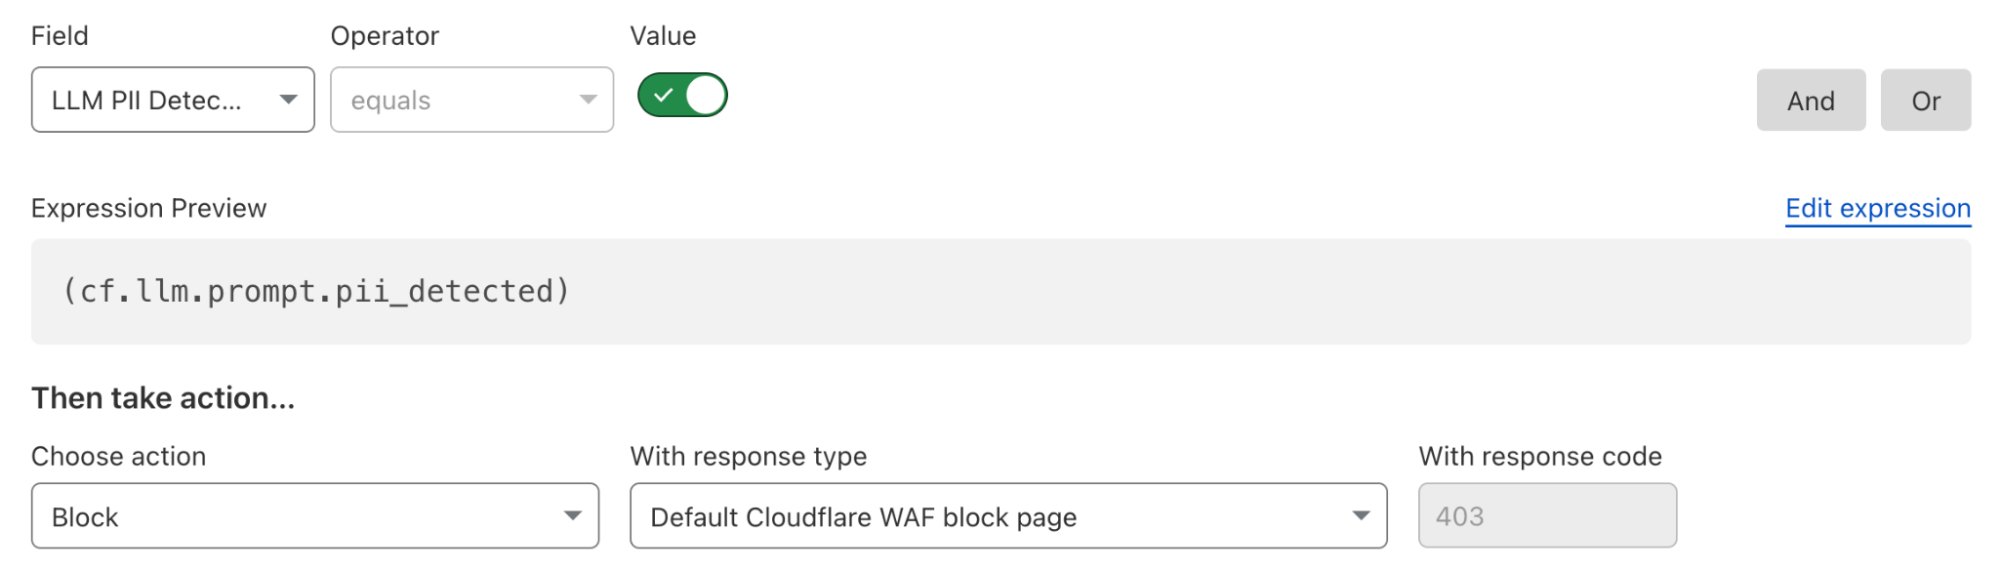
Here’s what a rule to block detected PII prompts looks like:
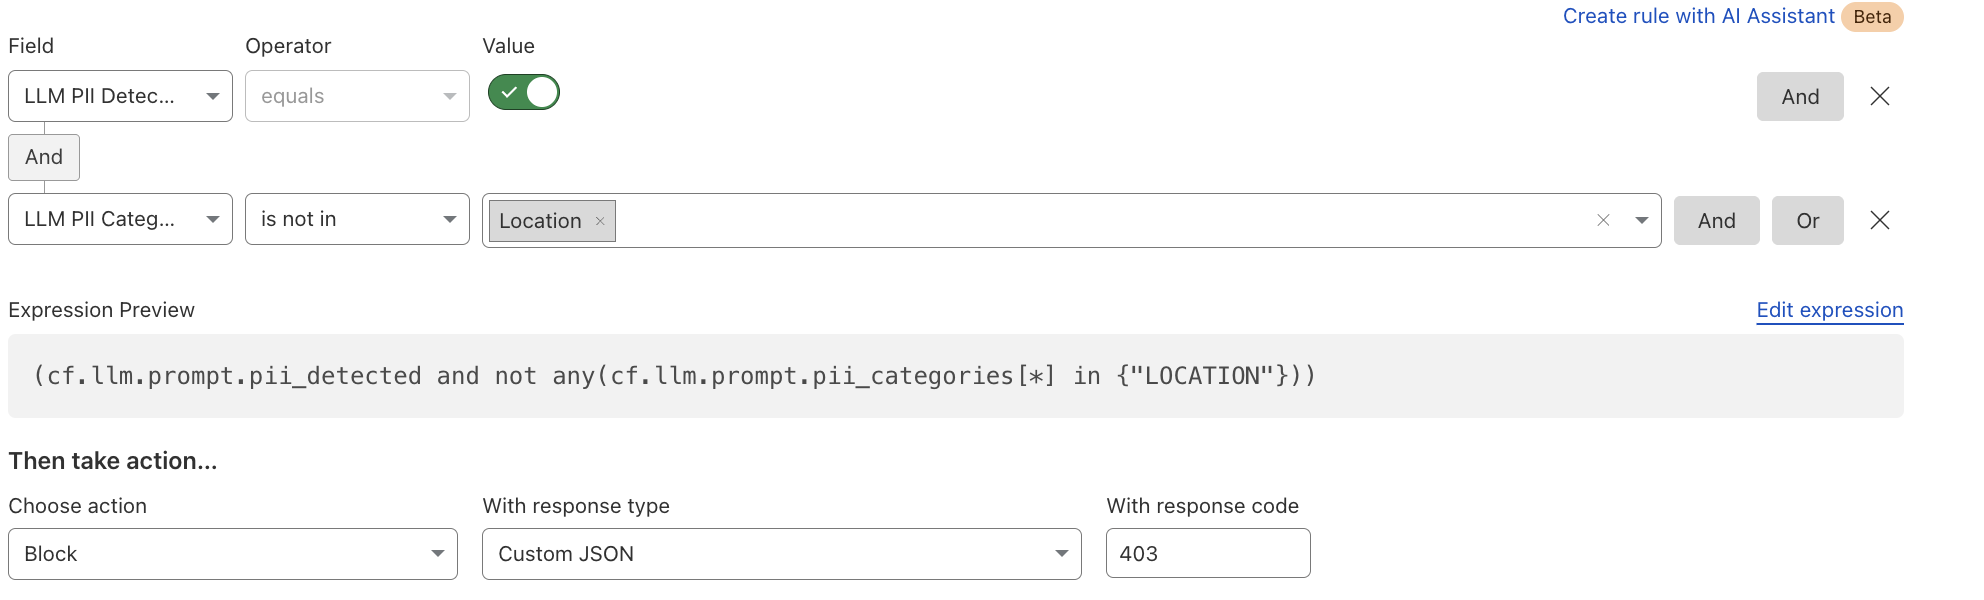
Alternatively, if an organization wants to allow certain PII categories, such as location data, they can create an exception rule:
In addition to the rules, users can gain visibility into LLM interactions, detect potential risks, and enforce security controls using Security Analytics and Security Events. You can find more details in our documentation.
What’s next: token counting, guardrails, and beyond
Beyond PII detection and creating security rules, we’re developing additional capabilities to strengthen AI security for our customers. The next feature we’ll release is token counting, which analyzes prompt structure and length. Customers can use the token count field in Rate Limiting and WAF Custom rules to prevent their users from sending very long prompts, which can impact third party model bills, or allow users to abuse the models. This will be followed by using AI to detect and allow content moderation, which will provide more flexibility in building guardrails in the rules.
If you’re an enterprise customer, join the Firewall for AI beta today! Contact your customer team to start monitoring traffic, building protection rules, and taking control of your LLM traffic.
While we are still early in what is likely going to be a substantial shift in how the world operates, two things are clear: the Internet, and how we interact with it, will change, and the boundaries of security and data privacy have never been more difficult to trace, making security an important topic in this shift.
At Cloudflare, we have a mission to help build a better Internet. And while we can only speculate on what AI will bring in the future, its success will rely on it being reliable and safe to use.
Today, we are introducing Cloudflare for AI: a suite of tools aimed at helping businesses, developers, and content creators adopt, deploy, and secure AI technologies at scale safely.
Cloudflare for AI is not just a grouping of tools and features, some of which are new, but also a commitment to focus our future development work with AI in mind.
Let’s jump in to see what Cloudflare for AI can deliver for developers, security teams, and content creators…
For developers
If you are building an AI application, whether a fully custom application or a vendor-provided hosted or SaaS application, Cloudflare can help you deploy, store, control/observe, and protect your AI application from threats.
Build & deploy: Workers AI and our new AI Agents SDK facilitates the scalable development & deployment of AI applications on Cloudflare’s network. Cloudflare’s network enhances user experience and efficiency by running AI closer to users, resulting in low-latency and high-performance AI applications. Customers are also using Cloudflare’s R2 to store their AI training data with zero egress fees, in order to develop the next-gen AI models.
We are continually investing in not only our serverless AI inference infrastructure across the globe, but also in making Cloudflare the best place to build AI Agents. Cloudflare’s composable AI architecture has all the primitives that enable AI applications to have real time communications, persist state, execute long-running tasks, and repeat them on a schedule.
Protect and control: Once your application is deployed, be it directly on Cloudflare, using Workers AI, or running on your own infrastructure (cloud or on premise), Cloudflare’s AI Gateway lets you gain visibility into the cost, usage, latency, and overall performance of the application.
Additionally, Firewall for AI lets you layer security on top by automatically ensuring every prompt is clean from injection, and that personally identifiable information (PII) is neither submitted to nor (coming soon) extracted from, the application.
For security teams
Security teams have a growing new challenge: ensure AI applications are used securely, both in regard to internal usage by employees, as well as by users of externally-facing AI applications the business is responsible for. Ensuring PII data is handled correctly is also a growing major concern for CISOs.
Discover applications: You can’t protect what you don’t know about. Firewall for AI’s discovery capability lets security teams find AI applications that are being used within the organization without the need to perform extensive surveys.
Control PII flow and access: Once discovered, via Firewall for AI or other means, security teams can leverage Zero Trust Network Access (ZTNA) to ensure only authorized employees are accessing the correct applications. Additionally, using Firewall for AI, they can ensure that, even if authorised, neither employees nor potentially external users, are submitting or extracting personally identifiable information (PII) to/from the application.
Protect against exploits: Malicious users are targeting AI applications with novel attack vectors, as these applications are often connected to internal data stores. With Firewall for AI and the broader Application Security portfolio, you can protect against a wide number of exploits highlighted in the OWASP Top 10 for LLM applications, including, but not limited to, prompt injection, sensitive information disclosure, and improper output handling.
Safeguarding conversations: With Llama Guard integrated into both AI Gateway and Firewall for AI, you can ensure both input and output of your AI application is not toxic, and follows topic and sentiment rules based on your internal business policies.
Observe who is accessing your content: With our AI Audit dashboard, you gain visibility (who, what, where and when) into the AI platforms crawling your site to retrieve content to use for AI training data. We are constantly classifying and adding new vendors as they create new crawlers.
Block access: If AI crawlers do not follow robots.txt or other relevant standards, or are potentially unwanted, you can block access outright. We’ve provided a simple “one click” button for customers using Cloudflare on our self-serve plans to protect their website. Larger organizations can build fine tune rules using our Bot Management solution allowing them to target individual bots and create custom filters with ease.
Cloudflare for AI: making AI security simple
If you are using Cloudflare already, or the deployment and security of AI applications is top of mind, reach out, and we can help guide you through our suite of AI tools to find the one that matches your needs.
Ensuring AI is scalable, safe and resilient, is a natural extension of Cloudflare’s mission, given so much of our success relies on a safe Internet.
The collective thoughts of the interwebz
Manage Consent
To provide the best experiences, we use technologies like cookies to store and/or access device information. Consenting to these technologies will allow us to process data such as browsing behavior or unique IDs on this site. Not consenting or withdrawing consent, may adversely affect certain features and functions.
Functional
Always active
The technical storage or access is strictly necessary for the legitimate purpose of enabling the use of a specific service explicitly requested by the subscriber or user, or for the sole purpose of carrying out the transmission of a communication over an electronic communications network.
Preferences
The technical storage or access is necessary for the legitimate purpose of storing preferences that are not requested by the subscriber or user.
Statistics
The technical storage or access that is used exclusively for statistical purposes.The technical storage or access that is used exclusively for anonymous statistical purposes. Without a subpoena, voluntary compliance on the part of your Internet Service Provider, or additional records from a third party, information stored or retrieved for this purpose alone cannot usually be used to identify you.
Marketing
The technical storage or access is required to create user profiles to send advertising, or to track the user on a website or across several websites for similar marketing purposes.