Post Syndicated from Cristiane de Melo original https://aws.amazon.com/blogs/big-data/extracting-key-insights-from-amazon-s3-access-logs-with-aws-glue-for-ray/
Customers of all sizes and industries use Amazon Simple Storage Service (Amazon S3) to store data globally for a variety of use cases. Customers want to know how their data is being accessed, when it is being accessed, and who is accessing it. With exponential growth in data volume, centralized monitoring becomes challenging. It is also crucial to audit granular data access for security and compliance needs.
This blog post presents an architecture solution that allows customers to extract key insights from Amazon S3 access logs at scale. We will partition and format the server access logs with Amazon Web Services (AWS) Glue, a serverless data integration service, to generate a catalog for access logs and create dashboards for insights.
Amazon S3 access logs
Amazon S3 access logs monitor and log Amazon S3 API requests made to your buckets. These logs can track activity, such as data access patterns, lifecycle and management activity, and security events. For example, server access logs could answer a financial organization’s question about how many requests are made and who is making what type of requests. Amazon S3 access logs provide object-level visibility and incur no additional cost besides storage of logs. They store attributes such as object size, total time, turn-around time, and HTTP referer for log records. For more details on the server access log file format, delivery, and schema, see Logging requests using server access logging and Amazon S3 server access log format.
Key considerations when using Amazon S3 access logs:
- Amazon S3 delivers server access log records on a best-effort basis. Amazon S3 does not guarantee the completeness and timeliness of them, although delivery of most log records is within a few hours of the recorded time.
- A log file delivered at a specific time can contain records written at any point before that time. A log file may not capture all log records for requests made up to that point.
- Amazon S3 access logs provide small unpartitioned files stored as space-separated, newline-delimited records. They can be queried using Amazon Athena, but this solution poses high latency and increased query cost for customers generating logs in petabyte scale. Top 10 Performance Tuning Tips for Amazon Athena include converting the data to a columnar format like Apache Parquet and partitioning the data in Amazon S3.
- Amazon S3 listing can become a bottleneck even if you use a prefix, particularly with billions of objects. Amazon S3 uses the following object key format for log files:
TargetPrefixYYYY-mm-DD-HH-MM-SS-UniqueString/
TargetPrefix is optional and makes it simpler for you to locate the log objects. We use the YYYY-mm-DD-HH format to generate a manifest of logs matching a specific prefix.
Architecture overview
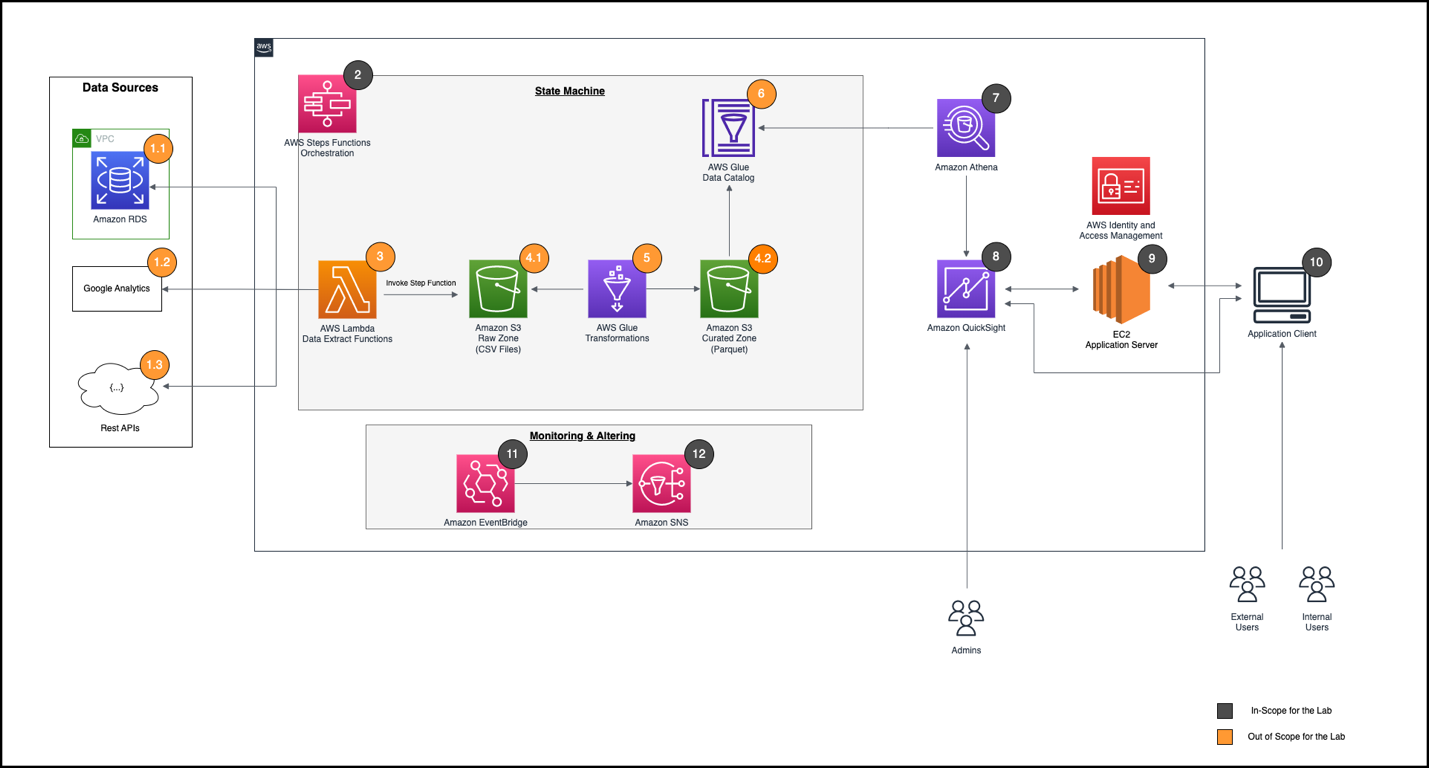
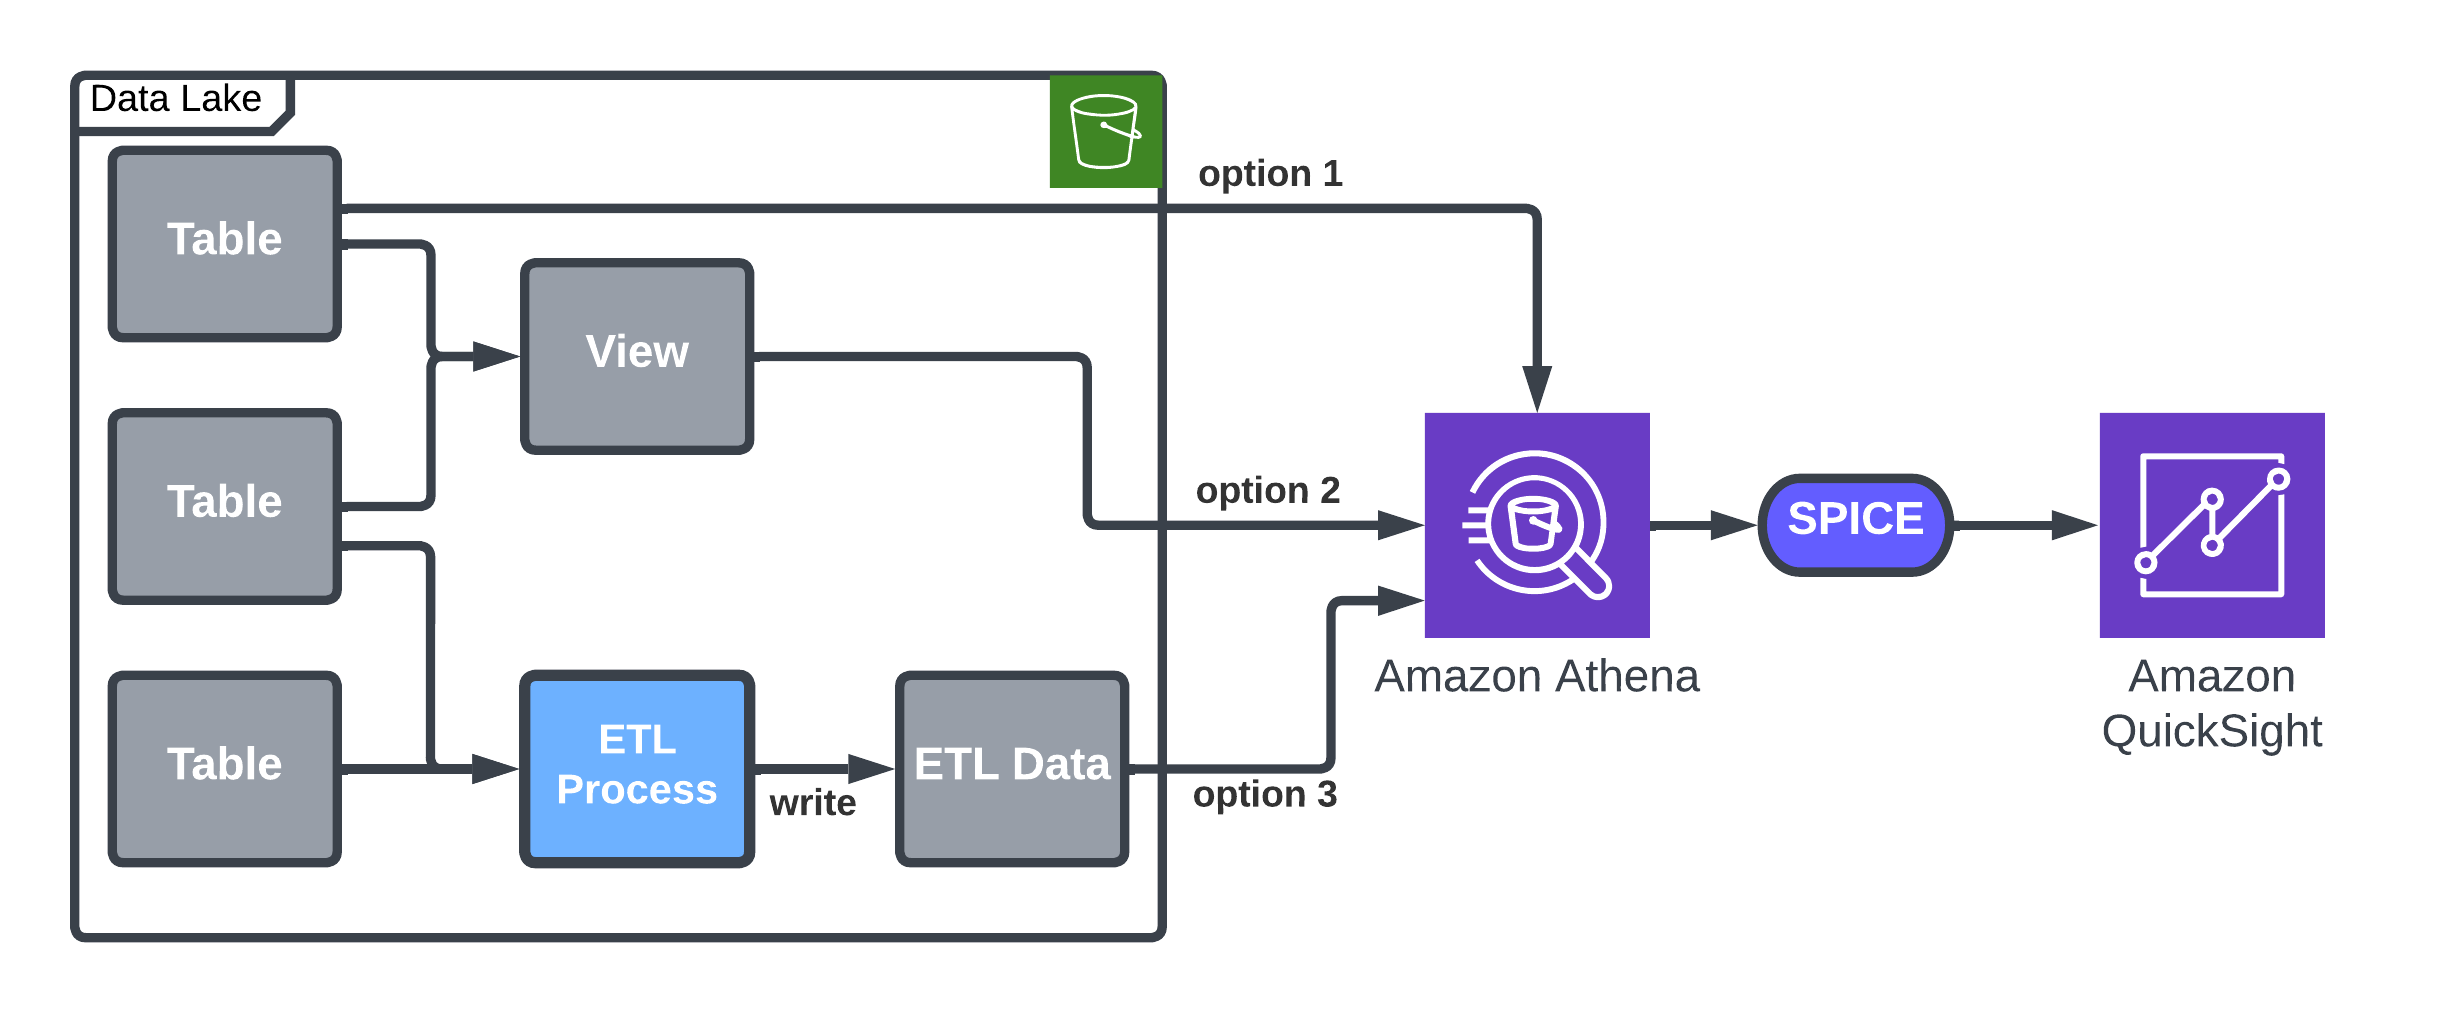
The following diagram illustrates the solution architecture. The solution uses AWS Serverless Analytics services such as AWS Glue to optimize data layout by partitioning and formatting the server access logs to be consumed by other services. We catalog the partitioned server access logs from multiple Regions. Using Amazon Athena and Amazon QuickSight, we query and create dashboards for insights.

As a first step, enable server access logging on S3 buckets. Amazon S3 recommends delivering logs to a separate bucket to avoid an infinite loop of logs. Both the user data and logs buckets must be in the same AWS Region and owned by the same account.
AWS Glue for Ray, a data integration engine option on AWS Glue, is now generally available. It combines AWS Glue’s serverless data integration with Ray (ray.io), a popular new open-source compute framework that helps you scale Python workloads. The Glue for Ray job will partition and store the logs in parquet format. The Ray script also contains checkpointing logic to avoid re-listing, duplicate processing, and missing logs. The job stores the partitioned logs in a separate bucket for simplicity and scalability.
The AWS Glue Data Catalog is a metastore of the location, schema, and runtime metrics of your data. AWS Glue Data Catalog stores information as metadata tables, where each table specifies a single data store. The AWS Glue crawler writes metadata to the Data Catalog by classifying the data to determine the format, schema, and associated properties of the data. Running the crawler on a schedule updates AWS Glue Data Catalog with new partitions and metadata.
Amazon Athena provides a simplified, flexible way to analyze petabytes of data where it lives. We can query partitioned logs directly in Amazon S3 using standard SQL. Athena uses AWS Glue Data Catalog metadata like databases, tables, partitions, and columns under the hood. AWS Glue Data Catalog is a cross-Region metadata store that helps Athena query logs across multiple Regions and provide consolidated results.
Amazon QuickSight enables organizations to build visualizations, perform case-by-case analysis, and quickly get business insights from their data anytime, on any device. You can use other business intelligence (BI) tools that integrate with Athena to build dashboards and share or publish them to provide timely insights.
Technical architecture implementation
This section explains how to process Amazon S3 access logs and visualize Amazon S3 metrics with QuickSight.
Before you begin
There are a few prerequisites before you get started:
- Create an IAM role to use with AWS Glue. For more information, see Create an IAM Role for AWS Glue in the AWS Glue documentation.
- Ensure that you have access to Athena from your account.
- Enable access logging on an S3 bucket. For more information, see How to Enable Server Access Logging in the Amazon S3 documentation.
Run AWS Glue for Ray job
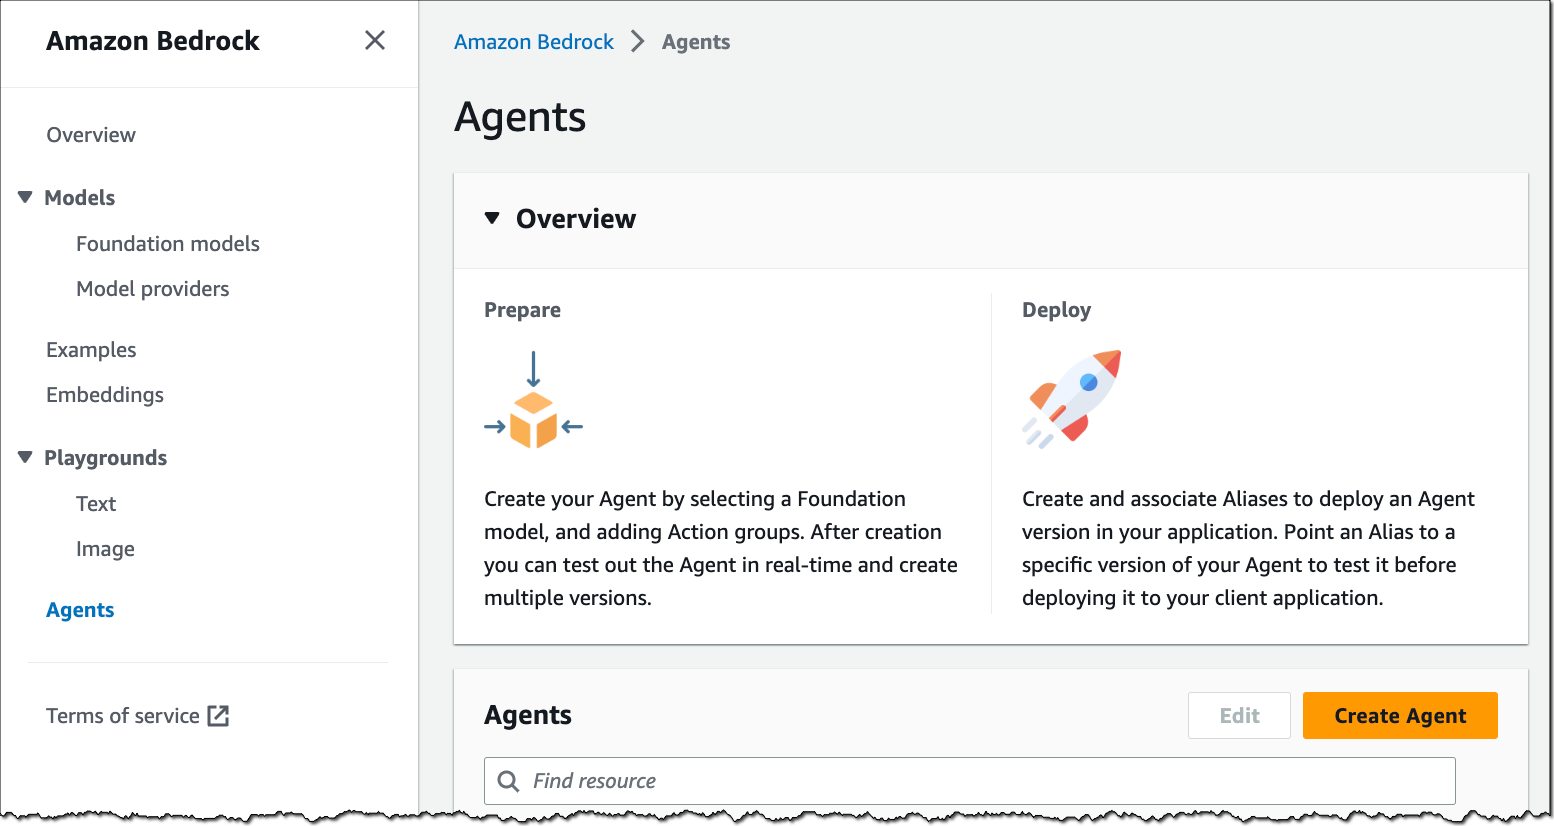
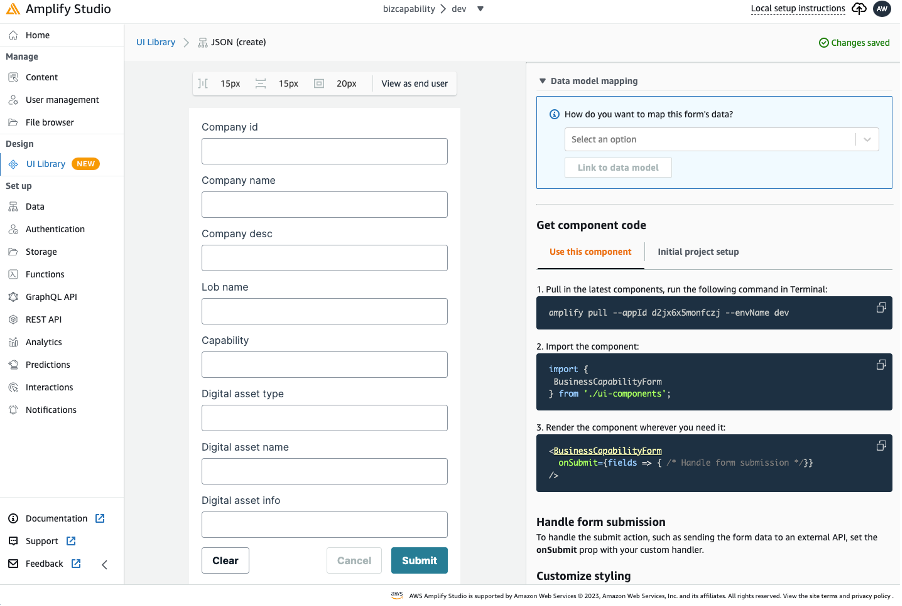
The following screenshots guide you through creating a Ray job on Glue console. Create an ETL job with Ray engine with the sample Ray script provided. In the Job details tab, select an IAM role.


Pass required arguments and any optional arguments with `--{arg}` in the job parameters.

Save and run the job. In the Runs tab, you can select the current execution and view the logs using the Log group name and Id (Job Run Id). You can also graph job run metrics from the CloudWatch metrics console.

Alternatively, you can select a frequency to schedule the job run.

Note: Schedule frequency depends on your data latency requirement.
On a successful run, the Ray job writes partitioned log files to the output Amazon S3 location. Now we run an AWS Glue crawler to catalog the partitioned files.
Create an AWS Glue crawler with the partitioned logs bucket as the data source and schedule it to capture the new partitions. Alternatively, you can configure the crawler to run based on Amazon S3 events. Using Amazon S3 events improves the re-crawl time to identify the changes between two crawls by listing all the files from a partition instead of listing the full S3 bucket.

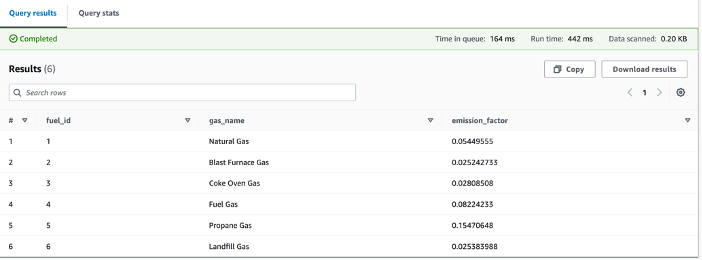
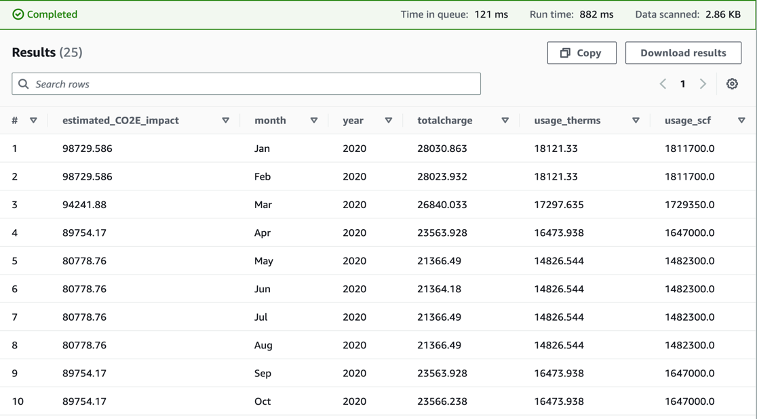
You can view the AWS Glue Data Catalog table via the Athena console and run queries using standard SQL. The Athena console displays the Run time and Data scanned metrics. In the following screenshots below, you will see how partitioning improves performance by reducing the amount of data scanned.
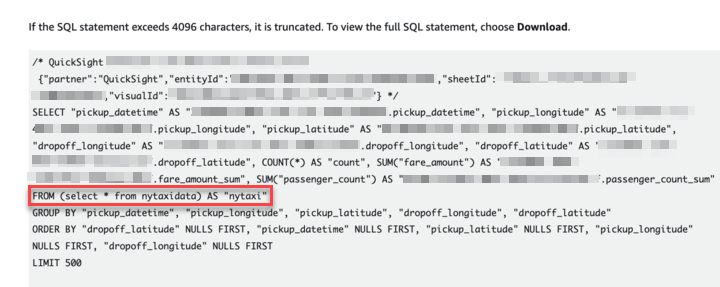
There are significant wins when we partition and format server access logs as parquet. Compared to the unpartitioned raw logs, the Athena queries 1/scanned 99.9 percent less data, and 2/ran 92 percent faster. This is evident from the following Athena SQL queries, which are similar but on unpartitioned and partitioned server access logs respectively.

Note: You can create a table schema on raw server access logs by following the directions at How do I analyze my Amazon S3 server access logs using Athena?

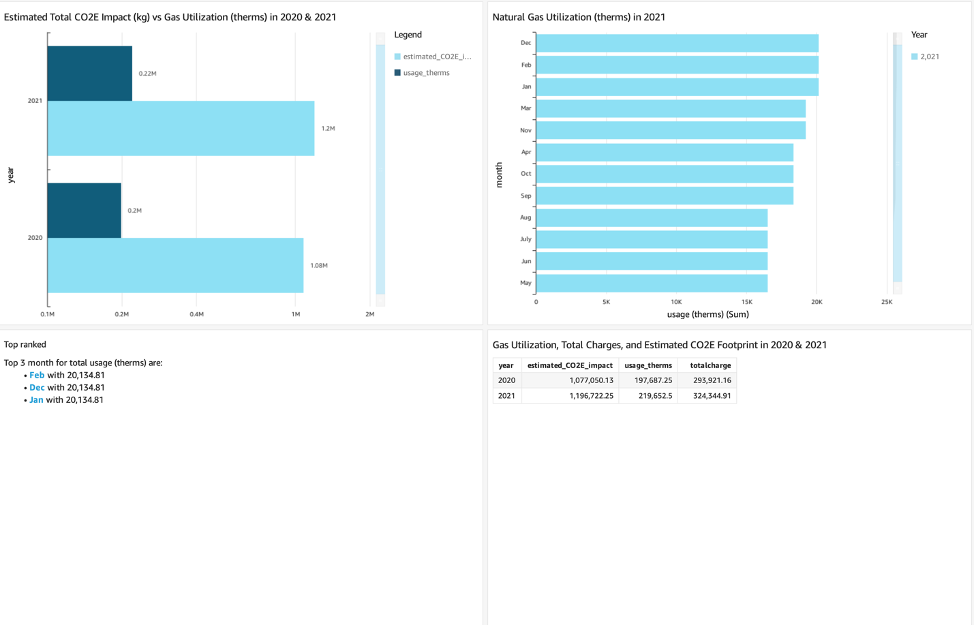
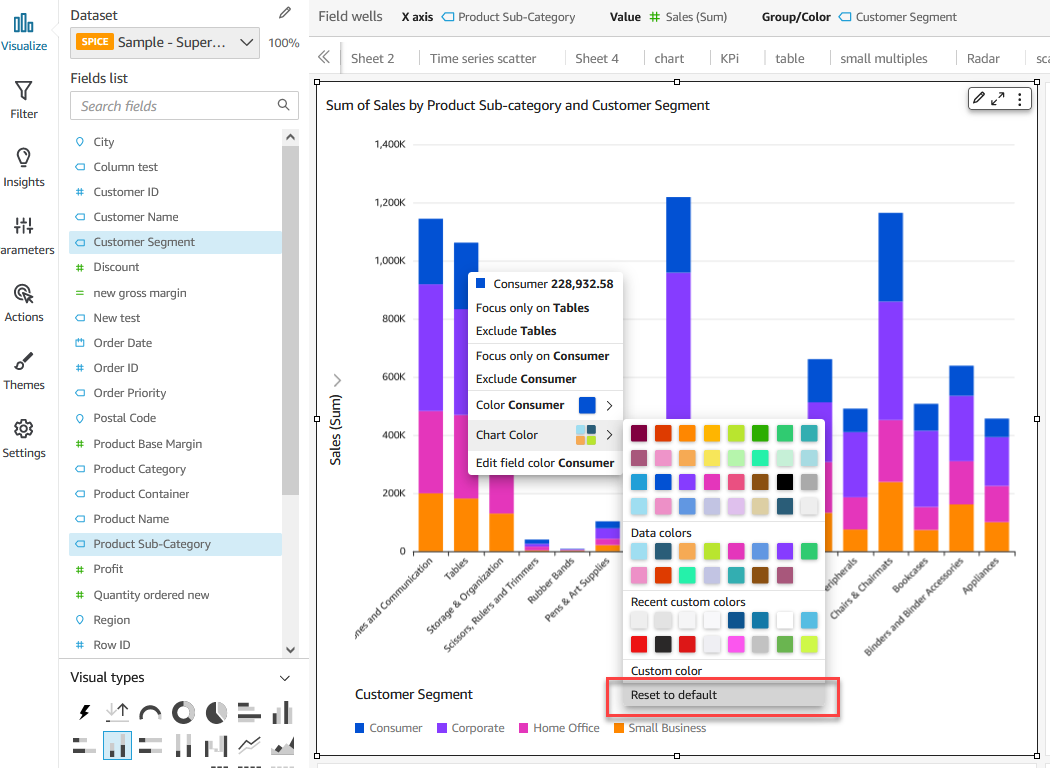
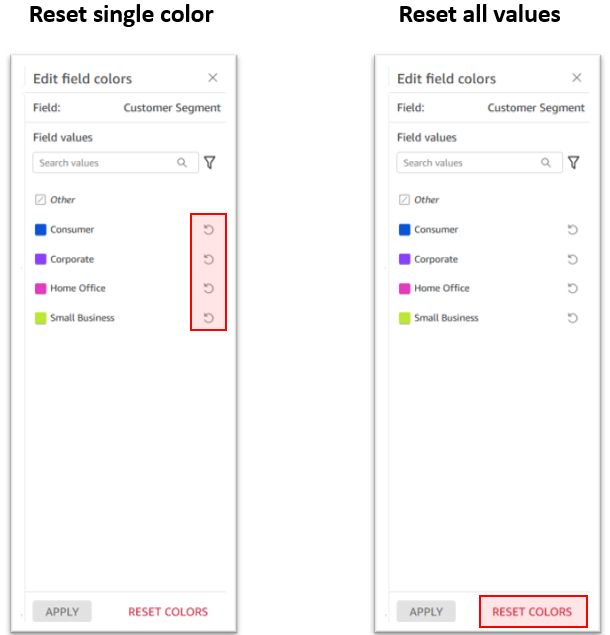
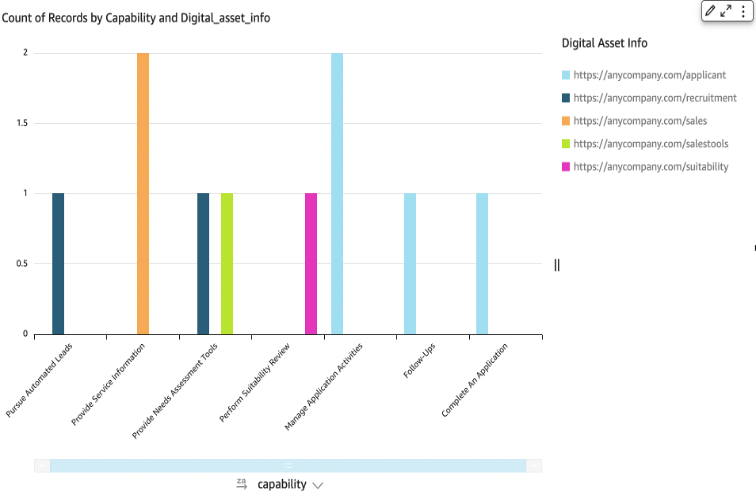
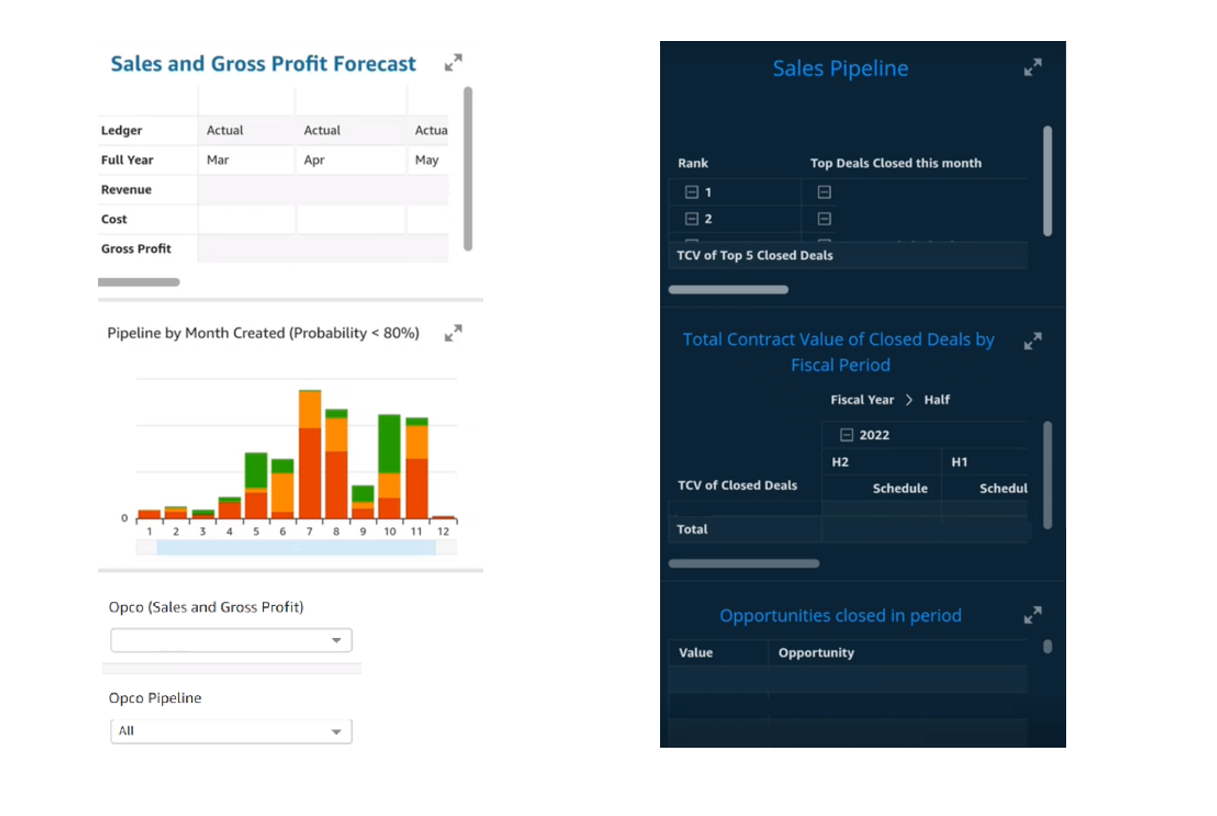
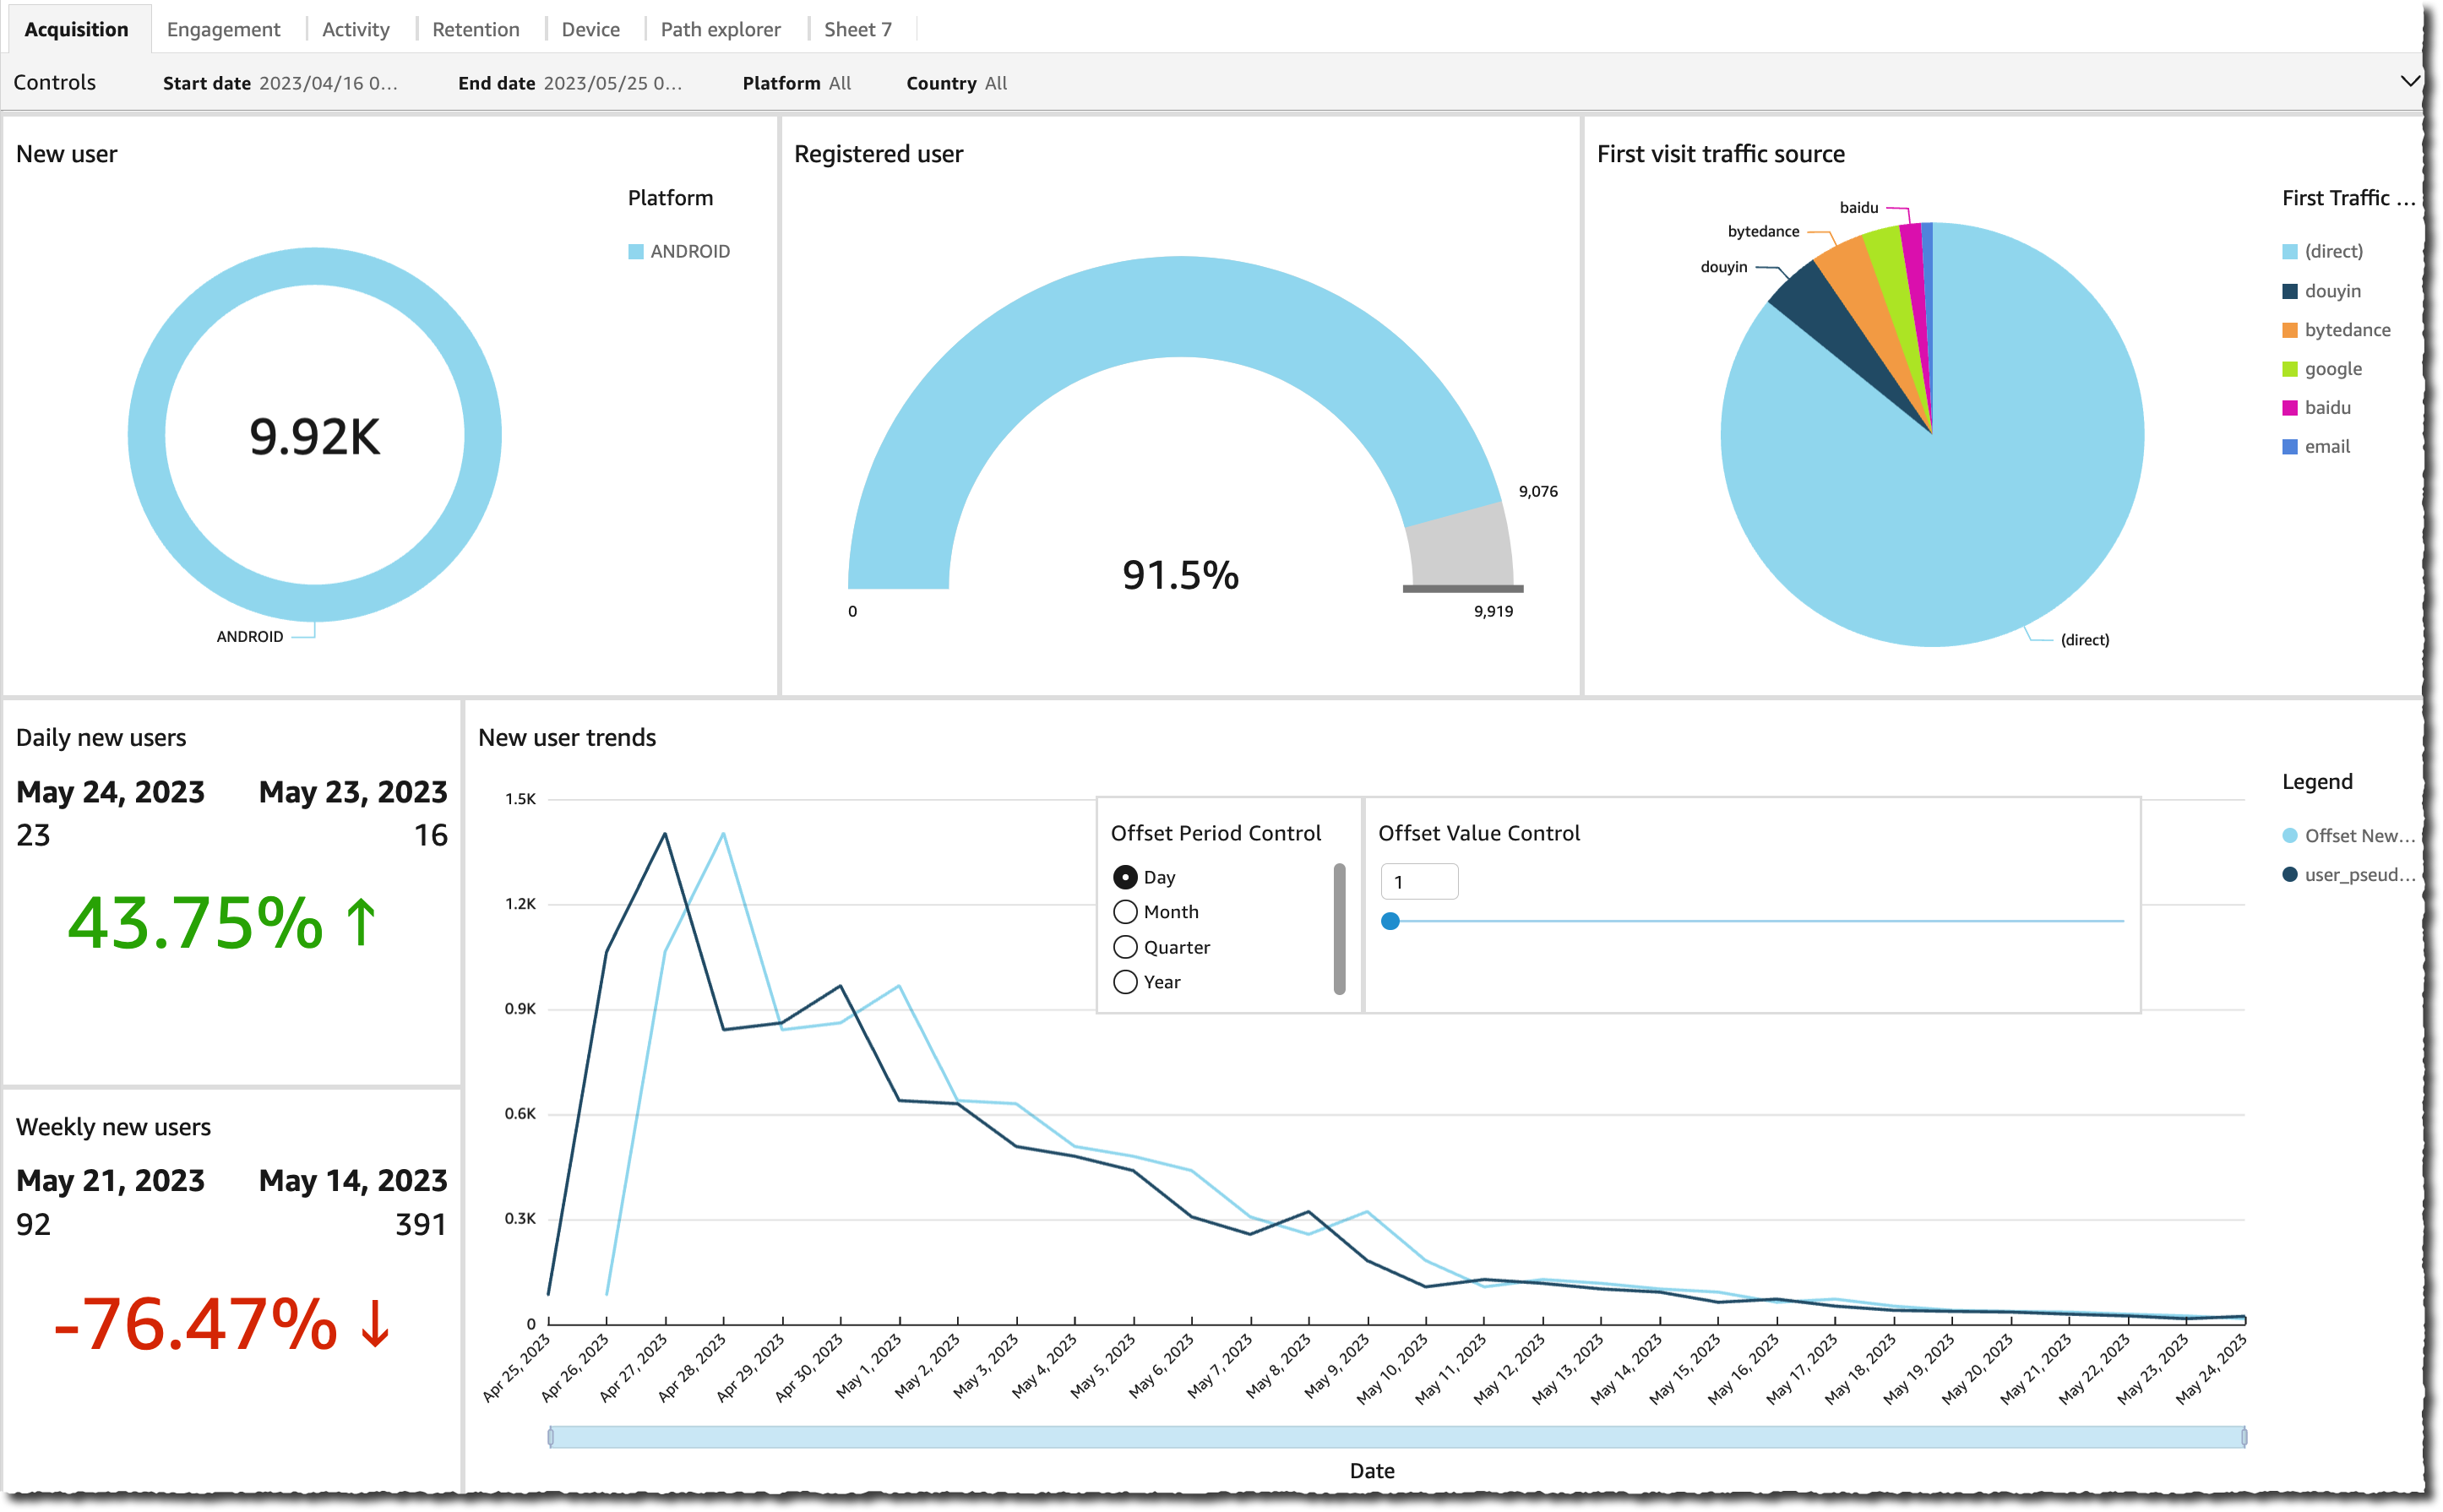
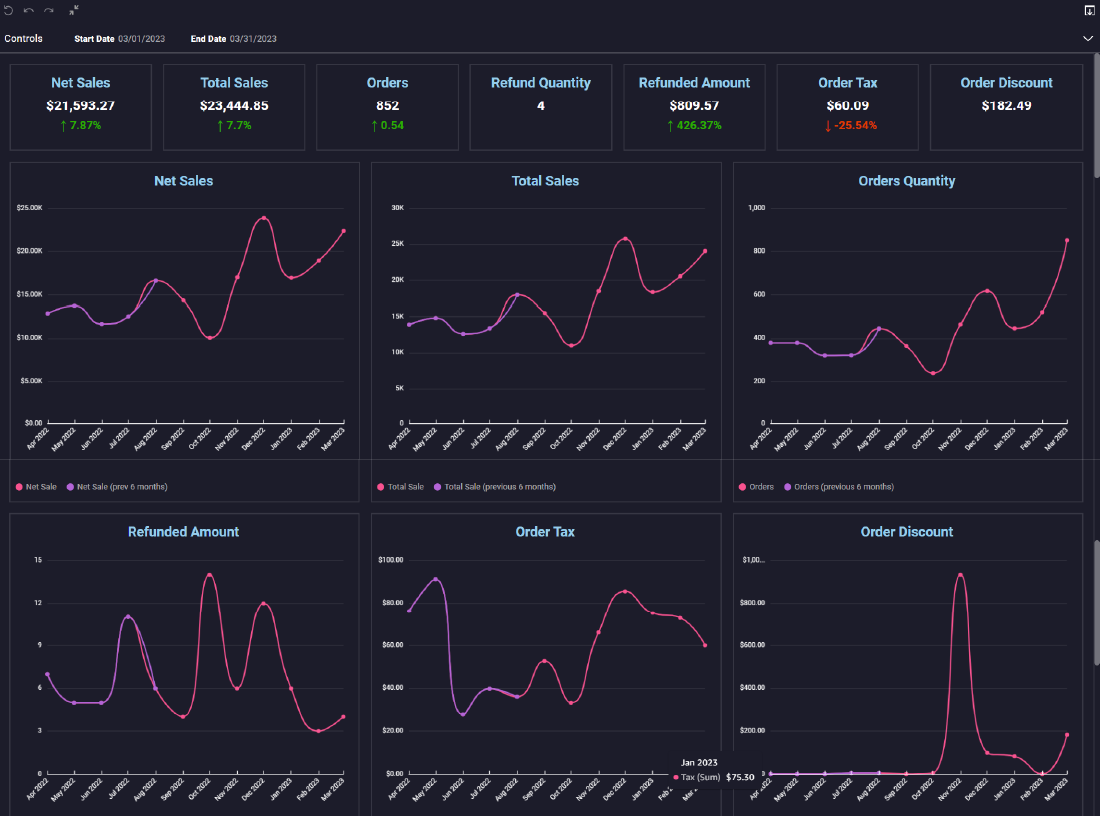
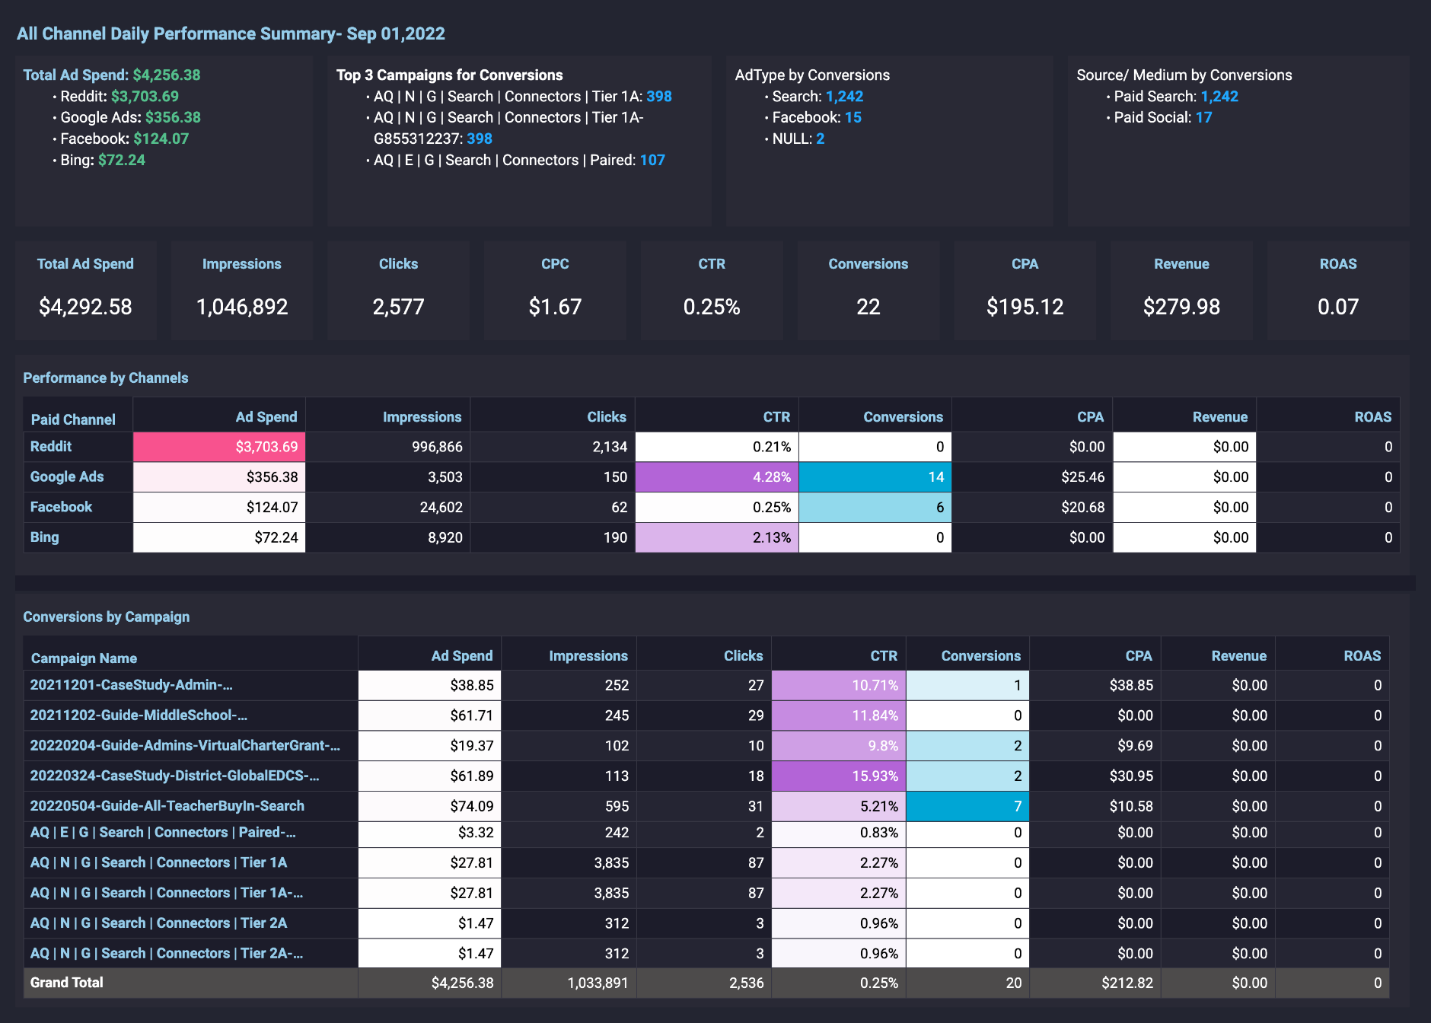
You can run queries on Athena or build dashboards with a BI tool that integrates with Athena. We built the following sample dashboard in Amazon QuickSight to provide insights from the Amazon S3 access logs. For additional information, see Visualize with QuickSight using Athena.

Clean up
Delete all the resources to avoid any unintended costs.
- Disable the access log on the source bucket.
- Disable the scheduled AWS Glue job run.
- Delete the AWS Glue Data Catalog tables and QuickSight dashboards.
Why we considered AWS Glue for Ray
AWS Glue for Ray offers scalable Python-native distributed compute framework combined with AWS Glue’s serverless data integration. The primary reason for using the Ray engine in this solution is its flexibility with task distribution. With the Amazon S3 access logs, the largest challenge in processing them at scale is the object count rather than the data volume. This is because they are stored in a single, flat prefix that can contain hundreds of millions of objects for larger customers. In this unusual edge case, the Amazon S3 listing in Spark takes most of the job’s runtime. The object count is also large enough that most Spark drivers will run out of memory during listing.
In our test bed with 470 GB (1,544,692 objects) of access logs, large Spark drivers using AWS Glue’s G.8X worker type (32 vCPU, 128 GB memory, and 512 GB disk) ran out of memory. Using Ray tasks to distribute Amazon S3 listing dramatically reduced the time to list the objects. It also kept the list in Ray’s distributed object store preventing out-of-memory failures when scaling. The distributed lister combined with Ray data and map_batches to apply a pandas function against each block of data resulted in a highly parallel and performant execution across all stages of the process. With Ray engine, we successfully processed the logs in ~9 minutes. Using Ray reduces the server access logs processing cost, adding to the reduced Athena query cost.
Ray job run details:


Please feel free to download the script and test this solution in your development environment. You can add additional transformations in Ray to better prepare your data for analysis.
Conclusion
In this blog post, we detailed a solution to visualize and monitor Amazon S3 access logs at scale using Athena and QuickSight. It highlights a way to scale the solution by partitioning and formatting the logs using AWS Glue for Ray. To learn how to work with Ray jobs in AWS Glue, see Working with Ray jobs in AWS Glue. To learn how to accelerate your Athena queries, see Reusing query results.
About the Authors
 Cristiane de Melo is a Solutions Architect Manager at AWS based in Bay Area, CA. She brings 25+ years of experience driving technical pre-sales engagements and is responsible for delivering results to customers. Cris is passionate about working with customers, solving technical and business challenges, thriving on building and establishing long-term, strategic relationships with customers and partners.
 Archana Inapudi is a Senior Solutions Architect at AWS supporting Strategic Customers. She has over a decade of experience helping customers design and build data analytics, and database solutions. She is passionate about using technology to provide value to customers and achieve business outcomes.
 Nikita Sur is a Solutions Architect at AWS supporting a Strategic Customer. She is curious to learn new technologies to solve customer problems. She has a Master’s degree in Information Systems – Big Data Analytics and her passion is databases and analytics.
 Zach Mitchell is a Sr. Big Data Architect. He works within the product team to enhance understanding between product engineers and their customers while guiding customers through their journey to develop their enterprise data architecture on AWS.


 Raj Ramasubbu is a Sr. Analytics Specialist Solutions Architect focused on big data and analytics and AI/ML with Amazon Web Services. He helps customers architect and build highly scalable, performant, and secure cloud-based solutions on AWS. Raj provided technical expertise and leadership in building data engineering, big data analytics, business intelligence, and data science solutions for over 18 years prior to joining AWS. He helped customers in various industry verticals like healthcare, medical devices, life science, retail, asset management, car insurance, residential REIT, agriculture, title insurance, supply chain, document management, and real estate.
 Rahul Sonawane is a Principal Analytics Solutions Architect at AWS with AI/ML and Analytics as his area of specialty.
 Sundeep Kumar is a Sr. Data Architect, Data Lake at AWS, helping customers build data lake and analytics platform and solutions. When not building and designing data lakes, Sundeep enjoys listening music and playing guitar.
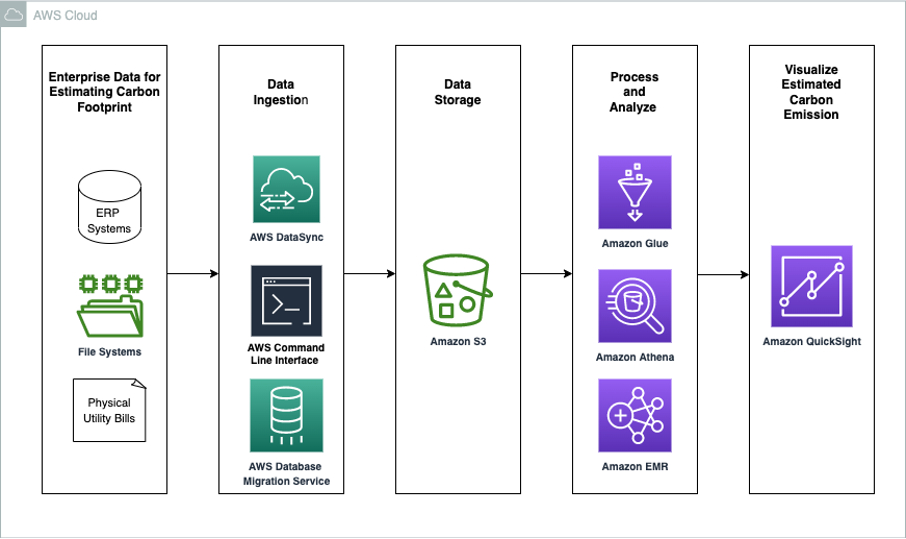

 Thomas Burns,
  Aileen Zheng is a Solutions Architect supporting US Federal Civilian Sciences customers at Amazon Web Services (AWS). She partners with customers to provide technical guidance on enterprise cloud adoption and strategy and helps with building well-architected solutions. She is also very passionate about data analytics and machine learning. In her free time, you’ll find Aileen doing pilates, taking her dog Mumu out for a hike, or hunting down another good spot for food! You’ll also see her contributing to projects to support diversity and women in technology.


 Bernard Verster is an experienced cloud engineer with years of exposure in creating scalable and efficient data models, defining data integration strategies, and ensuring data governance and security. He is passionate about using data to drive insights, while aligning with business requirements and objectives.
 Abhishek Pan is a WWSO Specialist SA-Analytics working with AWS India Public sector customers. He engages with customers to define data-driven strategy, provide deep dive sessions on analytics use cases, and design scalable and performant analytical applications. He has 12 years of experience and is passionate about databases, analytics, and AI/ML. He is an avid traveler and tries to capture the world through his camera lens.


 Bhupinder Chadha is a senior product manager for Amazon QuickSight focused on visualization and front end experiences. He is passionate about BI, data visualization and low-code/no-code experiences. Prior to QuickSight he was the lead product manager for Inforiver, responsible for building a enterprise BI product from ground up. Bhupinder started his career in presales, followed by a small gig in consulting and then PM for xViz, an add on visualization product.


 Abdul Qadir is an AWS Solutions Architect based in New Jersey. He works with independent software vendors in the Northeast and provides customer guidance to build well-architected solutions on the AWS cloud platform.
 Sharon Li is a solutions architect at AWS, based in the Boston, MA area. She works with enterprise customers, helping them solve difficult problems and build on AWS. Outside of work, she likes to spend time with her family and explore local restaurants.


 Yash Bindlish is a Enterprise Support Manager at Amazon Web Services. He has more than 17 years of industry experience including roles in cloud architecture, systems engineering, and infrastructure. He works with Global Enterprise customers and help them build, scalable, modern and cost effective solutions on their growth journey with AWS. He loves solving complex problems with his solution-oriented approach.
 Shivani Reddy is a Technical Account Manager (TAM) at AWS with over 12 years of IT experience. She has worked in a variety of roles, including application support engineer, Linux systems engineer, and administrator. In her current role, she works with global customers to help them build sustainable software solutions. She loves the customer management aspect of her job and enjoys working with customers to solve problems and find solutions that meet their specific needs.

 Jacques Steyn runs the Altron Data Analytics Professional Services. He has been leading the building of data warehouses and analytic solutions for the past 20 years. In his free time, he spends time with his family, whether it be on the golf , walking in the mountains, or camping in South Africa, Botswana, and Namibia.
 Jason Yung is a Principal Analytics Specialist with Amazon Web Services. Working with Senior Executives across the Europe and Asia-Pacific Regions, he helps customers become data-driven by understanding their use cases and articulating business value through Amazon mechanisms. In his free time, he spends time looking after a very active 1-year-old daughter, alongside juggling geeky activities with respectable hobbies such as cooking sub-par food.
 Michele Lamarca is a Senior Solutions Architect with Amazon Web Services. He helps architect and run Solutions Accelerators in Europe to enable customers to become hands-on with AWS services and build prototypes quickly to release the value of data in the organization. In his free time, he reads books and tries (hopelessly) to improve his jazz piano skills.
 Hamza is a Specialist Solutions Architect with Amazon Web Services. He runs Solutions Accelerators in EMEA regions to help customers accelerate their journey to move from an idea into a solution in production. In his free time, he spends time with his family, meets with friends, swims in the municipal swimming pool, and learns new skills.


 Kris Bliesner, CEO, Vega Cloud is a seasoned technology leader with over 25 years of experience in IT management, cloud computing, and consumer-based technology. As the co-founder and CEO of Vega Cloud, Kris continues to be at the forefront of revolutionizing cloud infrastructure optimization.
 Mike Brown, CTO, Vega Cloud is a highly-skilled technology leader and co-founder of Vega Cloud, where he currently serves as the Chief Technology Officer (CTO). With a proven track record in driving technological innovation, Mike has been instrumental in shaping the application architecture and solutions for the company.


 Gonzalo Lezma is the Mexico Finance Manager for the Amazon LATAM Finance Team. He is a lifelong learner, tech and data lover.


 Vinod Nambiar is the co-founder at Arena and Managing Director of Position2. An engineer with a passion for advertising, Vinod has been instrumental in designing all processes for delivery operations. His passion is to explore how the latest developments in technology can transform digital marketing. He is associated with various global forums in digital marketing and has been part of the faculty at leading marketing institutes in India like Northpoint and Mudra Institute of Communications. When not thinking digital, he can be found doing yoga and reading books ranging from spiritual to fiction. He lives with his wife and two children in Bangalore.


 Rajdip Chaudhuri is a Senior Solutions Architect with Amazon Web Services specializing in data and analytics. He enjoys working with AWS customers and partners on data and analytics requirements. In his spare time, he enjoys soccer and movies.
 Dhiraj Thakur is a Solutions Architect with Amazon Web Services. He works with AWS customers and partners to provide guidance on enterprise cloud adoption, migration, and strategy. He is passionate about technology and enjoys building and experimenting in the analytics and AI/ML space.
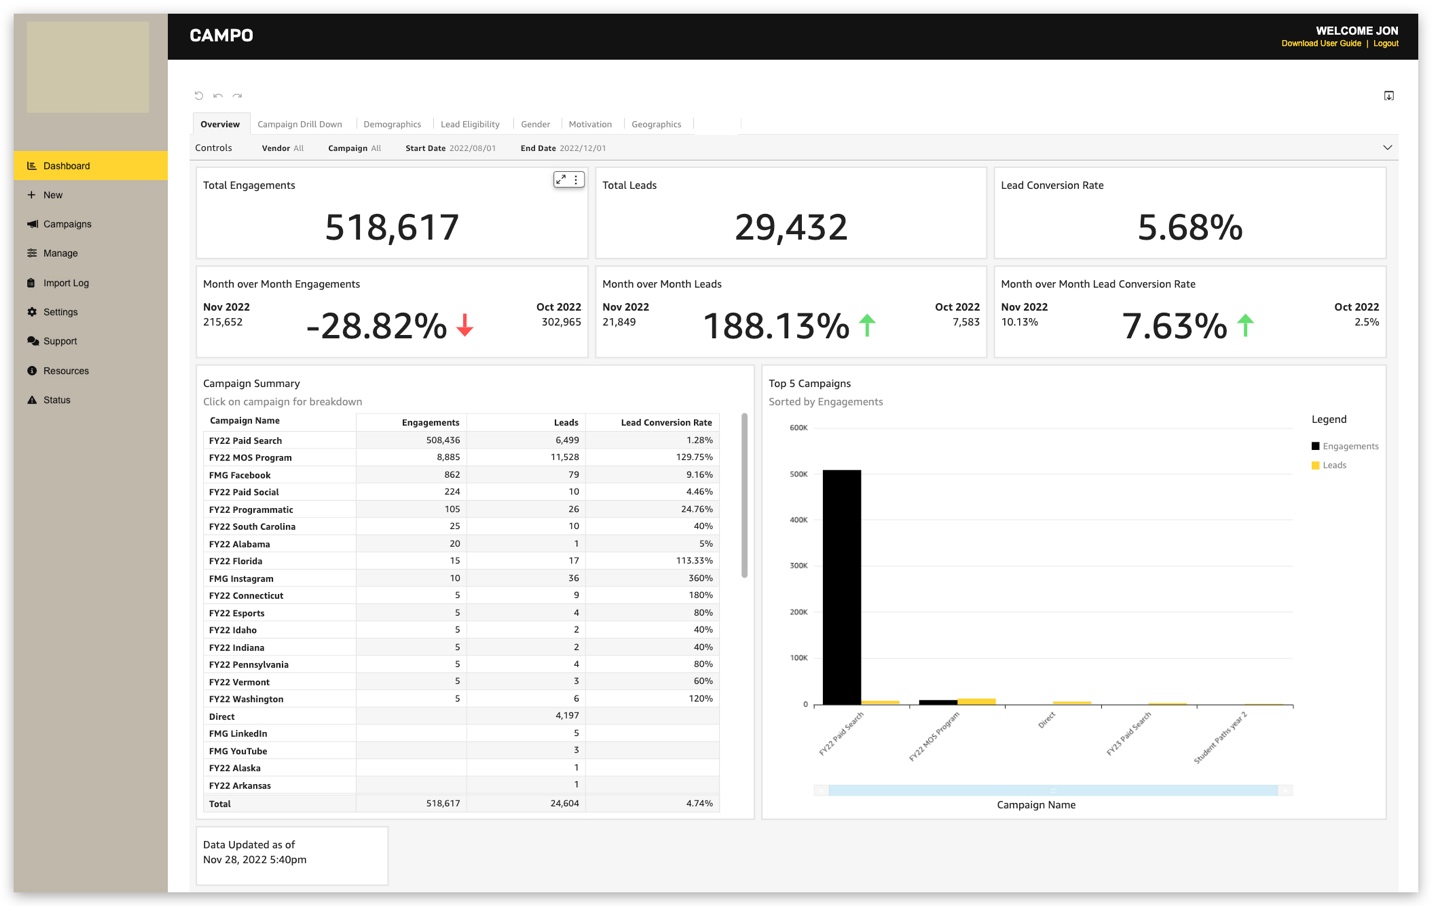
 Jon Walker, Senior Director of Engineering, is a native Nashvillian who has been in the technology field for over 19 years. He oversees enterprise-wide system engineering, development, and technology programs for large federal and DoD clients, as well as iostudio’s commercial clients.
 Ari Orlinsky, Director of Information Services, leads iostudio’s Information Systems Department, responsible for AWS Cloud, SaaS applications, on-premises technology, risk assessment, compliance, budgeting, and human resource management. With nearly 20 years’ experience in strategic IS and technology operations, Ari has developed a keen enthusiasm for emerging technologies, DOD security and compliance, large format interactive experiences, and customer service communication technologies. As iostudio’s Technical Product Owner across internal and client-facing applications including a cloud-based omni-channel contact center platform, he advocates for secure deployment of applicable technologies to the cloud while ensuring resilient on-premises data center solutions.
 Sumitha AP is a Sr. Solutions Architect at AWS. Sumitha works with SMB customers to help them design secure, scalable, reliable, and cost-effective solutions in the AWS Cloud. She has a focus on data and analytics and provides guidance on building analytics solutions on AWS.


 Anwar Ali is a Specialist Solutions Architect for Amazon QuickSight. Anwar has over 18 years of experience implementing enterprise business intelligence (BI), data analytics and database solutions . He specializes in integration of BI solutions with business applications, helping customers in BI architecture design patterns and best practices.
 Salim Khan is a Specialist Solutions Architect for Amazon QuickSight. Salim has over 16 years of experience implementing enterprise business intelligence (BI) solutions. Prior to AWS, Salim worked as a BI consultant catering to industry verticals like Automotive, Healthcare, Entertainment, Consumer, Publishing and Financial Services. He has delivered business intelligence, data warehousing, data integration and master data management solutions across enterprises.
 Gil Raviv is a Principal Product Manager for Amazon QuickSight, AWS’ cloud-native, fully managed SaaS BI service. As a thought-leader in BI, Gil accelerated the growth of global BI practices at AWS and Avanade, and has guided Fortune 1000 enterprises in their Data & AI journey. As a passionate evangelist, author and blogger of low-code/no-code data prep and analytic tools, Gil was awarded 5 times as a Microsoft MVP (Most Valuable Professional).


 Amy Laresch is a product manager for Amazon QuickSight Q. She is passionate about analytics and is focused on delivering the best experience for every QuickSight Q reader. Check out her videos on the @AmazonQuickSight YouTube channel for best practices and to see what’s new for QuickSight Q.