Post Syndicated from Grab Tech original https://engineering.grab.com/scalable-ads-server
Why ads?
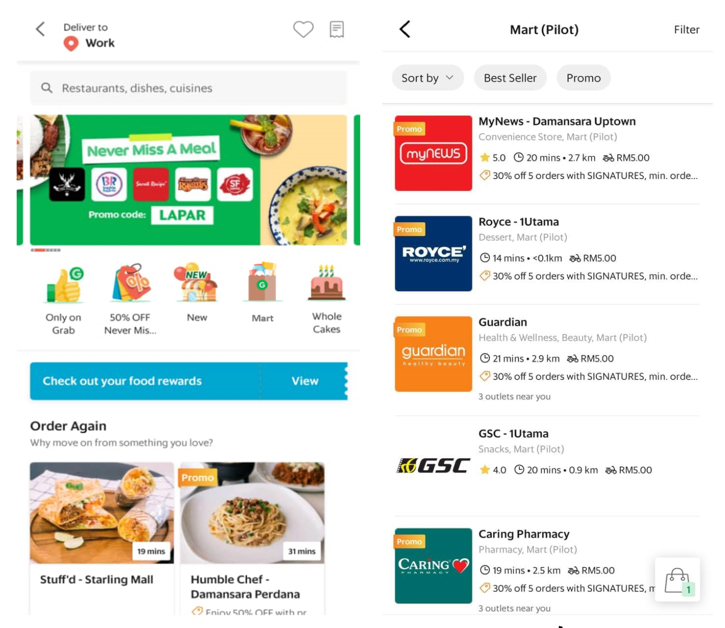
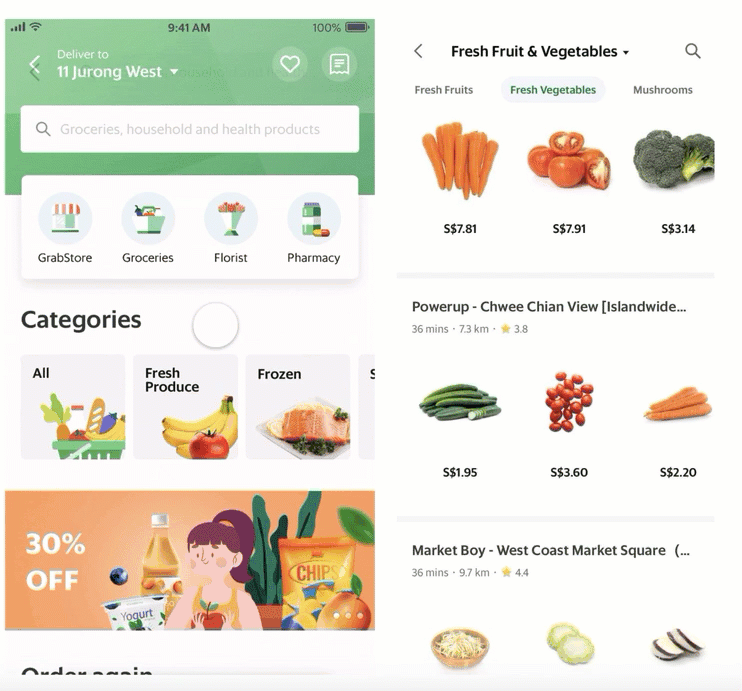
GrabAds is a service that provides businesses with an opportunity to market their products to Grab’s consumer base. During the pandemic, as the demand for food delivery grew, we realised that ads could be a service we offer to our small restaurant merchant-partners to expand their reach. This would allow them to not only mitigate the loss of in-person traffic but also grow by attracting more customers.
Many of these small merchant-partners had no experience with digital advertising and we provided an easy-to-use, scalable option that could match their business size. On the other side of the equation, our large network of merchant-partners provided consumers with more choices. For hungry consumers stuck at home, personalised ads and promotions helped them satisfy their cravings, thus fulfilling their intent of opening the Grab app in the first place!
Why build our own ad server?
Building an ad server is an ambitious undertaking and one might rightfully ask why we should invest the time and effort to build a technically complex distributed system when there are several reasonable off-the-shelf solutions available.
The answer is we didn’t, at least not at first. We used one of these off-the-shelf solutions to move fast and build a minimally viable product (MVP). The result of this experiment was a resounding success; we were providing clear value to our merchant-partners, our consumers and Grab’s overall business.
However, to take things to the next level meant scaling the ads business up exponentially. Apart from being one of the few companies with the user engagement to support an ads business at scale, we also have an ecosystem that combines our network of merchant-partners, an understanding of our consumers’ interactions across multiple services in the Grab superapp, and a payments solution, GrabPay, to close the loop. Furthermore, given the hyperlocal nature of our business, the in-app user experience is highly customised by location. In order to integrate seamlessly with this ecosystem, scale as Grab’s overall business grows and handle personalisation using machine learning (ML), we needed an in-house solution.
What we built
We designed and built a set of microservices, streams and pipelines which orchestrated the core ad serving functionality, as shown below.
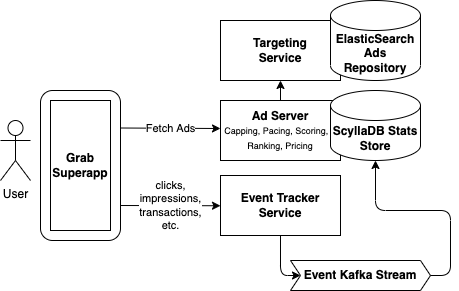
- Targeting – This is the first step in the ad serving flow. We fetch a set of candidate ads specifically targeted to the request based on keywords the user searched for, the user’s location, the time of day, and the data we have about the user’s preferences or other characteristics. We chose ElasticSearch as the data store for our ads repository as it allows us to query based on a disparate set of targeting criteria.
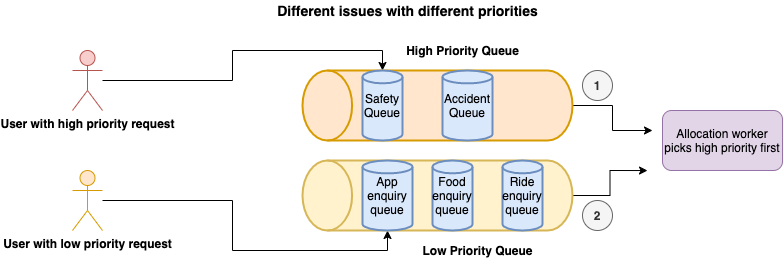
- Capping – In this step, we filter out candidate ads which have exceeded various caps. This includes cases where an advertising campaign has already reached its budget goal, as well as custom requirements about the frequency an ad is allowed to be shown to the same user. In order to make this decision, we need to know how much budget has already been spent and how many times an ad has already been shown. We chose ScyllaDB to store these “stats”, which is scalable, low-cost and can handle the large read and write requirements of this process (more on how this data gets written to ScyllaDB in the Tracking step).
- Pacing – In this step, we alter the probability that a matching ad candidate can be served, based on a specific campaign goal. For example, in some cases, it is desirable for an ad to be shown evenly throughout the day instead of exhausting the entire ad budget as soon as possible. Similar to Capping, we require access to information on how many times an ad has already been served and use the same ScyllaDB stats store for this.
- Scoring – In this step, we score each ad. There are a number of factors that can be used to calculate this score including predicted clickthrough rate (pCTR), predicted conversion rate (pCVR) and other heuristics that represent how relevant an ad is for a given user.
- Ranking – This is where we compare the scored candidate ads with each other and make the final decision on which candidate ads should be served. This can be done in several ways such as running a lottery or performing an auction. Having our own ad server allows us to customise the ranking algorithm in countless ways, including incorporating ML predictions for user behaviour. The team has a ton of exciting ideas on how to optimise this step and now that we have our own stack, we’re ready to execute on those ideas.
- Pricing – After choosing the winning ads, the final step before actually returning those ads in the API response is to determine what price we will charge the advertiser. In an auction, this is called the clearing price and can be thought of as the minimum bid price required to outbid all the other candidate ads. Depending on how the ad campaign is set up, the advertiser will pay this price if the ad is seen (i.e. an impression occurs), if the ad is clicked, or if the ad results in a purchase.
- Tracking – Here, we close the feedback loop and track what users do when they are shown an ad. This can include viewing an ad and ignoring it, watching a video ad, clicking on an ad, and more. The best outcome is for the ad to trigger a purchase on the Grab app. For example, placing a GrabFood order with a merchant-partner; providing that merchant-partner with a new consumer. We track these events using a series of API calls, Kafka streams and data pipelines. The data ultimately ends up in our ScyllaDB stats store and can then be used by the Capping and Pacing steps above.
Principles
In addition to all the usual distributed systems best practices, there are a few key principles that we focused on when building our system.
- Latency – Latency is important for ads. If the user scrolls faster than an ad can load, the ad won’t be seen. The longer an ad remains on the screen, the more likely the user will notice it, have their interest piqued and click on it. As such, we set strict limits on the latency of the ad serving flow. We spent a large amount of effort tuning ElasticSearch so that it could return targeted ads in the shortest amount of time possible. We parallelised parts of the serving flow wherever possible and we made sure to A/B test all changes both for business impact and to ensure they did not increase our API latency.
- Graceful fallbacks – We need user-specific information to make personalised decisions about which ads to show to a given user. This data could come in the form of segmentation of our users, attributes of a single user or scores derived from ML models. All of these require the ad server to make dependency calls that could add latency to the serving flow. We followed the principle of setting strict timeouts and having graceful fallbacks when we can’t fetch the data needed to return the most optimal result. This could be due to network failures or dependencies operating slower than usual. It’s often better to return a non-personalised result than no result at all.
- Global optimisation – Predicting supply (the amount of users viewing the app) and demand (the amount of advertisers wanting to show ads to those users) is difficult. As a superapp, we support multiple types of ads on various screens. For example, we have image ads, video ads, search ads, and rewarded ads. These ads could be shown on the home screen, when booking a ride, or when searching for food delivery. We intentionally decided to have a single ad server supporting all of these scenarios. This allows us to optimise across all users and app locations. This also ensures that engineering improvements we make in one place translate everywhere where ads or promoted content are shown.
What’s next?
Grab’s ads business is just getting started. As the number of users and use cases grow, ads will become a more important part of the mix. We can help our merchant-partners grow their own businesses while giving our users more options and a better experience.
Some of the big challenges ahead are:
- Optimising our real-time ad decisions, including exciting work on using ML for more personalised results. There are many factors that can be considered in ad personalisation such as past purchase history, the user’s location and in-app browsing behaviour. Another area of optimisation is improving our auction strategy to ensure we have the most efficient ad marketplace possible.
- Expanding the types of ads we support, including experimenting with new types of content, finding the best way to add value as Grab expands its breadth of services.
- Scaling our services so that we can match Grab’s velocity and handle growth while maintaining low latency and high reliability.
Join us
Grab is a leading superapp in Southeast Asia, providing everyday services that matter to consumers. More than just a ride-hailing and food delivery app, Grab offers a wide range of on-demand services in the region, including mobility, food, package and grocery delivery services, mobile payments, and financial services across over 400 cities in eight countries.
Powered by technology and driven by heart, our mission is to drive Southeast Asia forward by creating economic empowerment for everyone. If this mission speaks to you, join our team today!


 ; changes to increase your revenue, simplify the application verification process, and make it easier for everyone to build with GitHub.
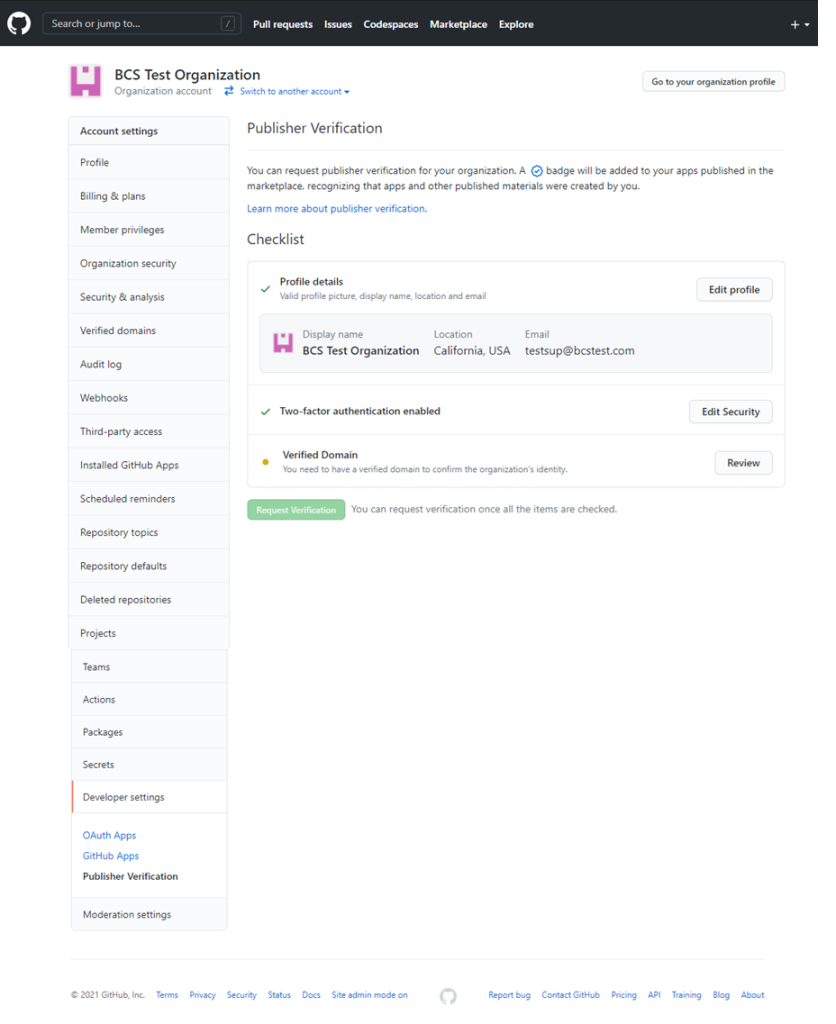
