When I started my first role as a software engineer, I remember taking about four days to set up my local development environment. I had so many issues with missing dependencies, incorrect versions, and failed installations. When I finally finished setting up all the tools and software I needed to be a productive member of the team, I cloned one of our repositories to my machine, set up my environment variables, ran npm run dev and received so many errors because I forgot to install the dependencies (and read the README) or switch to the right node version. Ugh! I can’t tell you how many times this happened to me in my first year!
Back then, I wished I had a way that was streamlined—something I set up only once, that just worked every time I accessed the repository. Although I did learn how to automate my computer setup with a Brewfile, I wish I could just get to coding in a repository without thinking about configuration.
When I think about how we work on projects in a repository, I realize that many of the processes we need to get started on that project can be automated with the help of dev containers, in this case, by using a devcontainer.json file and Codespaces.
Let’s take a look at how we can automate our dev environment by adding a dev container to this open source project—Tech is Hiring in GitHub Codespaces.
For a TLDR of this post, GitHub Codespaces enables you to start coding faster when coupled with dev containers. See image below for a summary of how:
Now, let’s get some definitions out of the way.
What is GitHub Codespaces?
GitHub Codespaces is a development environment in the cloud. It is hosted by GitHub in an isolated environment (Docker container) that runs on a virtual machine. If you’re not familiar with virtual machines or Docker containers, take a look at these videos: what is a virtual machine? and what are Docker containers?.
Currently, individual developers have 60 hours of free codespaces usage per month, so definitely take advantage of this awesomeness to build from anywhere.
What are dev containers?
Dev containers allow us to run our code in a preconfigured, isolated environment (container). It gives us the ability to predefine our dev environment in our repositories and use a consistent, reliable environment across the board without worrying about configuration files—since it’s all set up for us from the beginning with a devcontainer.json file.
What is the devcontainer.json file?
The devcontainer.json file is a document that defines how your project will build, display, and run. Simply put, it allows us to specify the behavior we want in our dev environment. For example, if we have a devcontainer.json file that includes installing the ESLint extension in VS Code, once we open up a workspace, ESLint will be automatically installed for us.
Automating your workflow with dev containers and GitHub Codespaces
To start using GitHub Codespaces, we don’t need to set up a devcontainer.json file. By default, GitHub Codespaces uses the universal dev container image, which caters to a vast array of languages and tools. This means, whenever you open up a new codespace without a devcontainer.json file your codespace will automagically load so you can code instantly. However, adding a devcontainer.json file gives us the ability to automate a lot of our dev environment workflows to our liking.
Okay, okay, that was a lot of chatter—let’s now get into what you really came here for!
Using the open source project, Tech is Hiring, let’s walk through how we typically work with a repository using our local dev environment.
What work typically looks like
At first glance, we see that this project uses Nextjs, Tailwind CSS, Chakra UI, TypeScript, Storybook, Vite, Cypress, Axios, and Reactjs as some of its dependencies. We’d need to install all these dependencies to our local machine to get this project running.
Let’s clone the repository, and cd into the project.
Then, let’s install dependencies to get the project running locally.
This project uses storybook, so let’s run both storybook and spin up the actual app locally.
The process is not so bad, but it took a bit of time. We also need to check to make sure we’re using the correct node version, check if we need any environment variables, and if there are any runtime errors to resolve. Thankfully, I didn’t encounter any errors while working on this, but it still took a bit of time.
Going faster with GitHub Codespaces and dev containers
Let’s make the process better by adding a devcontainer.json file to this project and opening it in GitHub Codespaces to see what happens.
We can either use the VS Code command palette to add a pre-existing dev container or we can write the configuration file ourselves (which we’ll do below).
Let’s first create a .devcontainer folder in the root of the project and a devcontainer.json file in the new folder.
Now, let’s automate installing dependencies, starting the dev server, opening a preview of our app on localhost:3000, and installing vscode extensions. Once we get everything configured, your json file should look like this:
{
  // image being used
   "image": "mcr.microsoft.com/devcontainers/universal:2",
  // set minimum cpu
   "hostRequirements": {
       "cpus": 4
   },
   // install dependencies and start app
   "updateContentCommand": "npm install",
   "postAttachCommand": "npm run dev",
   // open app.tsx once container is built
   "customizations": {
       "codespaces": {
           "openFiles": [
               "src/pages/_app.tsx"
           ]
       },
       // install some vscode extensions
       "vscode": {
           "extensions": [
               "dbaeumer.vscode-eslint",
               "github.vscode-pull-request-github",
               "eamodio.gitlens",
               "christian-kohler.npm-intellisense"
           ]
       }
   },
   // connect to remote server
   "forwardPorts": [3000],
   // give port a label and open a preview of the app
   "portsAttributes": {
      "3000": {
         "label": "Application",
         "onAutoForward": "openPreview"
       }
     }
}
Sidenote: I’ve broken down the purpose of the properties in this file for you by adding comments before each. To learn more about each property, continue reading at container.dev. I also installed a few extensions that are not needed, but I wanted to show you that you could automate installing extensions, too!
Let’s commit the file and merge it into the main branch, then open up the project in GitHub Codespaces.
When we open up the application in GitHub Codespaces, our dependencies will be installed, the server will start, and a preview will automatically open for us. If we needed environment variables to work on this repository, those would have already been configured for us as a repository secret on GitHub. We also didn’t need to install hefty node_modules to our machine.
I call this a win!
Comparing both ways
There’s plenty more that we can do with dev containers and GitHub Codespaces to automate our dev environment. But let’s summarize what we just did in GitHub Codespaces and with the help of dev containers:
We clicked the GitHub Codespaces button on the GitHub repository.
Everything was setup/installed for us (thanks json file!).
We got to work and started coding.
Now, isn’t that better?
Wrapping up
So, what’s the point of GitHub Codespaces and why should you care as a developer? Well, for one, you can automate most of the startup processes you need to access a repository. You can also do a lot more customizations to your dev environment with dev containers. Take a look at all the options you have—and watch out for my next blog post where I’ll go through the anatomy of a devcontainer.json file.
Secondly, you can code from anywhere. I hate it when I’m not able to access one of my side projects on a different machine because that one machine is configured perfectly to suit the project. With GitHub Codespaces, you can start coding at the click of a button and from any machine that supports a modern browser.
I encourage you to get started with GitHub Codespaces today and try adding a devcontainer.json file to one of your projects! I promise you won’t regret it.
Today, GitHub is releasing a public beta for all new, more powerful hosted macOS runners for GitHub Actions. Teams who are looking to speed up their macOS jobs now have new options to meet their needs.
Faster GitHub-hosted macOS runners
When developers use GitHub-hosted runners for GitHub Actions, GitHub is always working to give teams performance and flexibility to quickly build for different platforms. The new GitHub-hosted macOS runners are based on the most current x64 Apple hardware and reduce the time it takes to run your jobs. This means less time waiting on your CI and more time building and rapidly testing code.
In addition to the existing 3-core macOS hosted runners, we are also introducing a new “XL” size, 12-core macOS runner to allow you to pay for that extra performance when you need it. Increasing your runner size is as simple as changing a single line in your workflow file, making it super easy to speed up lagging builds, and with on-demand availability when you want it, you only pay for what you use.
PyTorch, the open source machine learning framework, has used the new runner to improve build times from 1.5 hours to 30 minutes!
If you’re already using the 3-core macOS runners, simply request to join the beta, and we’ll give you access to the hardware to our new fleet. To try the new 12-core runner runner, update the runs-on: key in your GitHub Actions workflow YAML to target the macos-12-xl or macos-latest-xl runner images once you’re in the beta.
The new macOS XL runner is always billed in both private and public repositories and so does not consume any of the free included GitHub Action minutes. To learn more about runner per job minute pricing, check out the docs.
Learn more and join the beta
To learn more about using the new macOS runner, check out the hosted runner docs.
We’ve started racking up and testing out Apple silicon-based machines in the hosted runner data centers. Follow this roadmap item to track progress. We hope to be offering a limited beta in CY2023 depending on hardware availability, but keep your eyes on the GitHub blog for more information.
In GitHub’s recent 2022 State of the Octoverse report, HashiCorp Configuration Language (HCL) was the fastest growing programming language on GitHub. HashiCorp is a leading provider of Infrastructure as Code (IaC) automation for cloud computing. HCL is HashiCorp’s configuration language used with tools like Terraform and Vault to deliver IaC capabilities in a human-readable configuration file across multi-cloud and on-premises environments.
HCL’s growth shows the importance of bringing together the worlds of infrastructure, operations, and developers. This was always the goal of DevOps. But in reality, these worlds remain siloed for many enterprises.
In this post we’ll look at the business and cultural influences that bring development and operations together, as well as security, governance, and networking teams. Then, we’ll explore how GitHub and HashiCorp can enable consistent workflows and guardrails throughout the entire CI/CD pipeline.
The traditional world of operations (Ops)
Armon Dadgar, co-founder of HashiCorp, uses the analogy of a tree to explain the traditional world of Ops. The trunk includes all of the shared and consistent services you need in an enterprise to get stuff done. Think of things like security requirements, Active Directory, and networking configurations. A branch represents the different lines of business within an enterprise, providing services and products internally or externally. The leaves represent the different environments and technologies where your software or services are deployed: cloud, on-premises, and container environment, among others.
In many enterprises, the communication channels and processes between these different business areas can be cumbersome and expensive. If there is a significant change to the infrastructure or architecture, multiple tickets are typically submitted to multiple teams for reviews and approvals across different parts of the enterprise. Change Advisory Boards are commonly used to protect the organization. The change is usually unable to proceed unless the documentation is complete. Commonly, there’s a set of governance logs and auditable artifacts which are required for future audits.
Wouldn’t it be more beneficial for companies if teams had an optimized, automated workflow that could be used to speed up delivery and empower teams to get the work done in a set of secure guardrails? This could result in significant time and cost savings, leading to added business value.
After all, a recent Forrester report found that over three years, using GitHub drove 433% ROI for a composite organization simply with the combined power of all GitHub’s enterprise products. Not to mention the potential for time savings and efficiency increase, along with other qualitative benefits that come with consistency and streamlining work.
Your products and services would be deployed through an optimized path with security and governance built-in, rather than a sluggish, manual and error-prone process. After all, isn’t that the dream of DevOps, GitOps, and Cloud Native?
Introducing IaC
Let’s use a different analogy. Think of IaC as the blueprint for resources (such as servers, databases, networking components, or PaaS services) that host our software and services.
If you were architecting a hospital or a school, you wouldn’t use the same overall blueprint for both scenarios as they serve entirely different purposes with significantly different requirements. But there are likely building blocks or foundations that can be reused across the two designs.
IaC solutions, such as HCL, allow us to define and reuse these building blocks, similarly to how we reuse methods, modules, and package libraries in software development. With it being IaC, we can start adopting the same recommended practices for infrastructure that we use when collaborating and deploying on applications.
After all, we know that teams that adopt DevOps methodologies will see improved productivity, cloud-enabled scalability, collaboration, and security.
A better way to deliver
With that context, let’s explore the tangible benefits that we gain in codifying our infrastructure and how they can help us transform our traditional Ops culture.
Storing code in repositories
Let’s start with the lowest-hanging fruit. With it being IaC, we can start storing infrastructure and architectural patterns in source code repositories such as GitHub. This gives us a single source of truth with a complete version history. This allows us to easily rollback changes if needed, or deploy a specific version of the truth from history.
Teams across the enterprise can collaborate in separate branches in a Git repository. Branches allow teams and individuals to be productive in “their own space” and not have to worry about negatively impacting the in-progress work of other teams, away from the “production” source of truth (typically, the main branch).
Terraform modules, the reusable building blocks mentioned in the last section, are also stored and versioned in Git repositories. From there, modules can be imported to the private registry in Terraform Cloud to make them easily discoverable by all teams. When a new release version is tagged in GitHub, it is automatically updated in the registry.
Collaborate early and often
As we discussed above, teams can make changes in separate branches to not impact the current state. But what happens when you want to bring those changes to the production codebase? If you’re unfamiliar with Git, then you may not have heard of a pull request before. As the name implies, we can “pull” changes from one branch into another.
Pull requests in GitHub are a great way to collaborate with other users in the team, being able to get peer reviews so feedback can be incorporated into your work. The pull request process is deliberately very social, to foster collaboration across the team.
In GitHub, you could consider setting branch protection rules so that direct changes to your main branch are not allowed. That way, all users must go through a pull request to get their code into production. You can even specify the minimum number of reviewers needed in branch protection rules.
Tip: you could use a special type of file, the CODEOWNERS file in GitHub, to automatically add reviewers to a pull request based on the files being edited. For example, all HCL files may need a review by the core infrastructure team. Or IaC configurations for line of business core banking systems might require review by a compliance team.
Unlike Change Advisory Boards, which typically take place on a specified cadence, pull requests become a natural part of the process to bring code into production. The quality of the decisions and discussions also evolves. Rather than being a “yes/no” decision with recommendations in an external system, the context and recommendations can be viewed directly in the pull request.
Collaboration is also critical in the provisioning process, and GitHub’s integrations with Terraform Cloud will help you scale these processes across multiple teams. Terraform Cloud offers workflow features like secure storage for your Terraform state and direct integration with your GitHub repositories for a turnkey experience around the pull request and merge lifecycle.
Bringing automated quality reviews into the process
Building on from the previous section, pull requests also allow us to automatically check the quality of the changes that are being proposed. It is common in software to check that the application still compiles correctly, that unit tests pass, that no security vulnerabilities are introduced, and more.
From an IaC perspective, we can bring similar automated checks into our process. This is achieved by using GitHub status checks and gives us a clear understanding of whether certain criteria has been met or not.
GitHub Actions are commonly used to execute some of these automated checks in pull requests on GitHub. To determine the quality of IaC, you could include checks such as:
Validating that the code is syntactically correct (for example, Terraform validate).
Linting the code to ensure a certain set of standards are being followed (for example, TFLint or Terraform format).
Static code analysis to identify any misconfigurations in your infrastructure at “design time” (for example, tfsec or terrascan).
Relevant unit or integration tests (using tools such as Terratest).
Deploying the infrastructure into a “smoke test”environment to verify that the infrastructure configuration (along with a known set of parameters) results deploy into a desired state.
We recently blogged about building compliance, security, and audit into your delivery pipelines and the benefits of this approach. When you add IaC to your existing development pipelines and workflows, you’ll have the ability to describe previously manual compliance testing and artifacts as code directly into your HCL configurations files.
A natural extension to IaC, policy as code allows your security and compliance teams to centralize the definitions of your organization’s requirements. Terraform Cloud’s built-in support for the HashiCorp Sentinel and Open Policy Agent (OPA) frameworks allows policy sets to be automatically ingested from GitHub repositories and applied consistently across all provisioning runs. This ensures policies are applied before misconfigurations have a chance to make it to production.
An added bonus mentioned in another recent blog is the ability to leverage AI-powered compliance solutions to optimize your delivery even more. Imagine a future where generative AI could create compliance-focused unit-tests across your entire development and infrastructure delivery pipeline with no manual effort.
With the checks complete, it’s now time for us to deploy our new infrastructure configuration! Branching and deployment strategies is beyond the scope of this post, so we’ll leave that for another discussion.
But you can take this even further! In Terraform, it is very common to use the command terraform plan to understand the impact of changes before you push them to production. terraform apply is then used to execute the changes.
Reviewing environment changes in a pull request
HashiCorp provides an example of automating Terraform with GitHub Actions. This example orchestrates a release through Terraform Cloud by using GitHub Actions. The example takes the output of the terraform plan command and copies the output into your pull request for approval (again, this depends on the development flow that you’ve chosen).
Reviewing environment changes using GitHub Actions environments
Let’s consider another example, based on the example from HashiCorp. GitHub Actions has a built-in concept of environments. Think of these environments as a logical mapping to a target deployment location. You can associate a protection rule with an environment so that an approval is given before deploying.
So, with that context, let’s create a GitHub Action workflow that has two environments—one which is used for planning purposes, and another which is used for deployment:
Before executing the workflow, we can create an environment in the GitHub repository and associate protection rules with the environment_a_deploy. This means that a review is required before a production deployment.
Ever feel like you’re coding on a plane mid-flight? When I first learned to code about five years ago, my laptop was painstakingly slow, but I couldn’t afford a better one. That’s why I relied on browser-based IDEs like jsbin.com to run my code.
Now fast forward to today, where GitHub Codespaces provides a fully-fledged, browser-based Integrated Development Environment (IDE) on a virtual machine. This means you can code without draining your local machine’s resources. Cloud-powered development is a game-changer for folks with less powerful machines, but that barely scratches the surface of GitHub Codespaces’ versatility.
In this blog post, we’ll discuss a few ways that you can get the most out of GitHub Codespaces!
Generate AI images
You can run Stable Diffusion with GitHub Codespaces. Like DALL-E and Midjourney, Stable Diffusion is one of many machine-learning models using deep learning to convert text into art.
Stable Diffusion takes the following steps to convert text into art:
AI receives an image
AI adds noise to the image until the image becomes completely unrecognizable. (Noise is another way of saying pixelated dots.)
AI removes the noise until it produces a clear, high-quality image
AI learns from a database called LAION-Aesthetics. The database has image-text pairs to learn to convert text into images.
This entire process is resource-intensive! Experts recommend using a computer with a powerful graphics processing unit (GPU) to run data-heavy tasks like Stable Diffusion. However, not everyone has a computer with that type of computing power (including me), so instead, I use GitHub Codespaces.
Since your codespace is hosted on a virtual machine, you can set the machine type from 2-core to 32-core. You can request access to a GPU-powered codespace if you need a more powerful machine. This means a machine learning engineer can use an iPad or Chromebook to perform data-heavy deep learning computations via GitHub Codespaces.
Check out my DEV post and repository to learn more about how I generated art inside my codespace.
Below you can see the code and AI image that GitHub Codespaces helped me produce:
from torch import autocast

# Change prompt for image here!
prompt = "a cartoon black girl with cotton candy hair and a pink dress standing in front of a pink sky with cotton candy clouds"
with autocast(device):
  image = pipe(prompt, height=768, width=768).images[0]
image
Manage GitHub Codespaces from the command line
Back in the 2000s, I would inadvertently close my documents, or my computer would suddenly shut down, and my work would be lost forever. Fortunately, it’s 2023, and many editors protect against that, including GitHub Codespaces. If you close a codespace, it will save your work even if you forget to commit your changes.
However, if you’re done with a codespace because you pushed your code to a repository, you can feel free to delete it. GitHub Codespace management is important for the following reasons:
You don’t want to get confused with all your GitHub Codespaces and accidentally delete the wrong one.
By default, inactive GitHub Codespaces automatically delete every 30 days.
You can manage your GitHub Codespaces through the GitHub UI or GitHub CLI. The GitHub CLI allows you to do things like:
This is not an exhaustive list of all ways you can manage GitHub Codespaces via the CLI. You learn more about managing your codespaces from the command line here!
Pair program with a teammate
Pair programming when you’re working remotely is challenging. It’s harder to share your screen and your code when you’re not sitting next to your teammate. However, it’s worthwhile when it works because it helps both parties improve their communication and technical skills. Installing the Live Share extension and forward ports can make remote pair programming easier with GitHub Codespaces.
Share your forwarded ports
You can share the URL of your locally hosted web app and make it available to your teammates or collaborators. If you right-click on the port you’d like to share, you’ll see the option to switch the port visibility from “Private” to “Public.” If you copy the value in the local address and share it with necessary collaborators, they can view, test, and debug your locally hosted web app even though they’re in a different room than you.
Live Share
The Live Share extension allows you and your teammate(s) to type in the same project simultaneously. It highlights your teammate’s cursor versus your cursor, so you can easily identify who is typing, and it’s completely secure!
Pair program with AI
Visual Studio Code’s marketplace offers a wide variety of extensions compatible with GitHub Codespaces, including GitHub Copilot. If you need to exchange ideas while you code, but there’s no one around, try installing the GitHub Copilot extension to pair program with AI. GitHub Copilot is an AI-powered code completion tool that helps you write code faster by suggesting code snippets and completing code for you.
Beyond productivity through code completion, GitHub Copilot empowers developers of varied backgrounds. One of my favorite GitHub Copilot tools is “Hey, GitHub,” a hands-free, voice-activated AI programmer. Check out the video below to learn how “Hey, GitHub” improves the developer experience for folks with limited physical dexterity or visual impairments.
Learn about more use cases for GitHub Copilot here.
Teach people to code
While educating people about coding via bootcamps, classrooms, meetups, and conferences, I’ve learned that teaching people how to code is hard. Sometimes in workshops, attendees spend most of the time trying to set up their environment so that they can follow along. However, teaching people to code or running a workshop in GitHub Codespaces creates a better experience for all participants. Instead of expecting beginner developers to understand how to clone repositories to work with a template, they can open up a codespace and work in a development environment you’ve configured. Now, you can have the peace of mind that everyone has the same environment as you and can easily follow along. This reduces tons of time, stress, and chaos.
We made GitHub Codespaces more accessible for teachers and students by offering 180 free hours of usage (equivalent to five assignments per month for a class of 50). Check out my tutorial on configuring GitHub Codespaces and leveraging extensions like CodeTour to run self-guided workshops.
Learn how CS50, Harvard’s largest class, uses GitHub Codespaces to teach students to code.
Learn a new framework
When you’re learning to code, it’s easy to over-invest your time into following tutorials. Learning is often more effective when you balance tutorial consumption with building projects. GitHub Codespaces’ quickstart templates are a speedy and efficient way to learn a framework.
Quickstart templates include boilerplate code, forwarded ports, and a configured development container for some of the most common application frameworks, including Next.js, React.js, Django, Express, Ruby on Rails, Preact, Flask, and Jupyter Notebook. Templates provide developers with a sandbox to build, test, and debug applications in a codespace. It only takes one click to open a template and experiment with a new framework.
Experimenting with a framework in a codespace can help developers better understand a framework’s structure and functionalities, leading to better retention and mastery. For example, I’m not familiar with Jupyter Notebook, but I’ve used a Jupyter Notebook template in GitHub Codespaces. The boilerplate code helped me to experiment with and better understand the structure of a Jupyter Notebook. I even built a small project with it!
Check out this blog post and template, where we use GitHub Codespaces to guide developers through writing their first lines of React.
Store environment variables
In the past, I’ve had multiple moments where I’ve accidentally shared or mishandled my environment variables. Here are a few cringe-worthy moments where I’ve mishandled environment variables:
I’ve shown them to an audience during a live demo.
I’ve pushed them to GitHub.
I couldn’t figure out a great way to share the values with teammates.
To avoid these moments, I could’ve used GitHub Codespaces secrets. You can store API Keys, environment variables, and secret credentials in your GitHub Codespaces secrets for each of your GitHub Codespaces.
After you store them in your GitHub Codespaces secrets, you can refer to the environment variables in your code as: process.env.{SUPER_SECRET_API_KEY}.
Check out this tutorial for more information on securely storing your environment variables with GitHub Codespaces
Onboard developers faster
Typically, software engineers are responsible for setting up their local environment when they join a team. Local environment setup can take a day or a week, depending on the quality of the documentation. Fortunately, organizations can automate the onboarding process using GitHub Codespaces to configure a custom environment. When a new engineer joins the team, they can open a codespace and skip the local environment setup because the required extensions, dependencies, and environment variables exist within the codespace.
In 2021, the GitHub Engineering Team migrated from our macOS model to GitHub Codespaces for the development of GitHub.com. After over 14 years, our repository accrued almost 13 GB on disk. It took approximately 45 minutes to clone, set up dependencies, and bootstrap our repository. After fully migrating to GitHub Codespaces, it only takes 10 seconds to launch GitHub.com in a preconfigured, reliable codespace.
However, you don’t have to take our word for it. Ketan Shah, Manager of Information Services at TELUS, a telecommunications company, attests, “GitHub shaves off entire days from the new employee onboarding process. New developers are up and running within minutes because everything is all in one place.”
Learn more about GitHub Codespaces can quickly onboard developers:
How your team can use GitHub Codespace to configure a positive onboarding experience with development containers
Conduct technical interviews
Take-home projects, technical screens, and live coding are often painful, but necessary parts of the interview experience for software developers, but using GitHub Codespaces can help ease some of the difficulties. By providing candidates with a well-configured and reliable environment, interviewers can help reduce anxiety and improve performance. With GitHub Codespaces, candidates no longer have to worry about setting up their environment. Interviewers can use GitHub codespaces to provide real-time feedback and collaborate using built-in tools like Visual Studio Code Live Share. Furthermore, GitHub Codespaces offers a secure and isolated environment for the interview process, ensuring that sensitive information and data remain protected.
I love Visual Studio Code; it’s my primary editor. However, depending on your role and other factors, you might have a different preference. GitHub Codespaces supports the following editors, in addition to Visual Studio Code:
Jupyter Notebook
IntelliJ IDEA
RubyMine
GoLand
PyCharm
PhpStorm
WebStorm
But, wait, there’s more!
GitHub Codespaces’ superpower is that you can code from any device and get a standardized environment as long as you have internet. However, it also includes features that make software development workflows easier. With 60 hours of free access per month for GitHub users and 90 hours per month for GitHub Pro users, there’s no reason not to try it out and experience its benefits for yourself. So why not give it a try today?
Geohash is an encoding system with a unique identifier for each region on the planet. Therefore, all geohash units can be associated with an individual set of digits and letters.
Geohash is a plugin built by Grab that is available in the Java OpenStreetMap Editor (JOSM) tool, which comes in handy for those who work on precise areas based on geohash units.
Background
Up until recently, users of the Geohash JOSM plugin were unable to stop the displaying of new geohashes with every zoom-in or zoom-out. This meant that every time they changed the zoom, new geohashes would be displayed, and this became bothersome for many users when it was unneeded. The previous behaviour of the plugin when zooming in and out is depicted in the following short video:
This led to the implementation of the zoom freeze feature, which helps users toggle between Enable zoom freeze and Disable zoom freeze, based on their needs.
Solution
As you can see in the following image, a new label was created with the purpose of freezing or unfreezing the display of new geohashes with each zoom change:
By default, this label says “Enable zoom freeze”, and when zoom freezing is enabled, the label changes to “Disable zoom freeze”.
In order to see how zoom freezing works, let’s consider the following example: a user wants to zoom inside the geohash with the code w886hu, without triggering the display of smaller geohashes inside of it. For this purpose, the user will enable the zoom freezing feature by clicking on the label, and then they will proceed with the zoom. The map will look like this:
It is apparent from the image that no new geohashes were created. Now, let’s say the user has finished what they wanted to do, and wants to go back to the “normal” geohash visualisation mode, which means disabling the zoom freeze option. After clicking on the label that now says ‘Disable zoom freeze’, new, smaller geohashes will be displayed, according to the current zoom level:
The functionality is illustrated in the following short video:
Another effect that enabling zoom freeze has is that it disables the ‘Display larger geohashes’ and ‘Display smaller geohashes’ options, since the geohashes are now fixed. The following images show how these options work before and after disabling zoom freeze:
To conclude, we believe that the release of this new feature will benefit users by making it more comfortable for them to zoom in and out of a map. By turning off the display of new geohashes when this is unwanted, map readability is improved, and this translates to a better user experience.
Impact/Limitations
In order to start using this new feature, users need to update the Geohash JOSM plugin.
Grab is the leading superapp platform in Southeast Asia, providing everyday services that matter to consumers. More than just a ride-hailing and food delivery app, Grab offers a wide range of on-demand services in the region, including mobility, food, package and grocery delivery services, mobile payments, and financial services across 428 cities in eight countries.
Powered by technology and driven by heart, our mission is to drive Southeast Asia forward by creating economic empowerment for everyone. If this mission speaks to you, join our team today!
Since the GitHub CLI 2.0 release, developers and organizations have customized their CLI experience by developing and installing extensions. Since then, the CLI team has been busy shipping several new features to further enhance the experience for both extension consumers and authors. Additionally, we’ve shipped go-gh 1.0 release, a Go library giving extension authors access to the same code that powers the GitHub CLI itself. Finally, the CLI team released the gh/pre-extension-precompile action, which automates the compilation and release of Go, Rust, or C++ extensions.
This blog post provides a tour of what’s new, including an in-depth look at writing a CLI extension with Go.
Introducing extension discovery
In the 2.20.0 release of the GitHub CLI, we shipped two new commands, including gh extension browse and gh extension search, to make discovery of extensions easier (all extension commands are aliased under gh ext, so the rest of this post will use that shortened version).
gh ext browse
gh ext browse is a new kind of command for the GitHub CLI: a fully interactive Terminal User Interface (TUI). It allows users to explore published extensions interactively right in the terminal.
Once gh ext browse has launched and loads extension data, you can browse through all of the GitHub CLI extensions available for installation sorted by star count by pressing the up and down arrows (or k and j).
Pressing / focuses the filter box, allowing you to trim the list down to a search term.
You can select any extension by highlighting it. The selected extension can be installed by pressing i or uninstalled by pressing r. Pressing w will open the currently highlighted extension’s repository page on GitHub in your web browser.
Our hope is that this is a more enjoyable and easy way to discover new extensions and we’d love to hear feedback on the approach we took with this command.
gh ext search
In tandem with gh ext browse we’ve shipped another new command intended for scripting and automation: gh ext search. This is a classic CLI command which, with no arguments, prints out the first 30 extensions available to install sorted by star count.
A green check mark on the left indicates that an extension is installed locally.
Any arguments provided narrow the search results:
Results can be further refined and processed with flags, like:
--limit, for fetching more results
--owner, for only returning extensions by a certain author
--sort, for example for sorting by updated
--license, to filter extensions by software license
--web, for opening search results in your web browser
--json, for returning results as JSON
This command is intended to be scripted and will produce composable output if piped. For example, you could install all of the extensions I have written with:
gh ext search --owner vilmibm | cut -f2 | while read -r extension; do gh ext install $extension; done
For more information about gh ext search and example usage, see gh help ext search.
Writing an extension with go-gh
The CLI team wanted to accelerate extension development by putting some of the GitHub CLI’s own code into an external library called go-gh for use by extension authors. The GitHub CLI itself is powered by go-gh, ensuring that it is held to a high standard of quality. This library is written in Go just like the CLI itself.
To demonstrate how to make use of this library, I’m going to walk through building an extension from the ground up. I’ll be developing a command called askfor quickly searching the threads in GitHub Discussions. The end result of this exercise lives on GitHub if you want to see the full example.
Getting started
First, I’ll run gh ext create to get started. I’ll fill in the prompts to name my command “ask” and request scaffolding for a Go project.
Before I edit anything, it would be nice to have this repository on GitHub. I’ll cd gh-ask and run gh repo create, selecting Push an existing local repository to GitHub, and follow the subsequent prompts. It’s okay to make this new repository private for now even if you intend to make it public later; private repositories can still be installed locally with gh ext install but will be unavailable to anyone without read access to that repository.
The initial code
Opening main.go in my editor, I’ll see the boilerplate that gh ext create made for us:
package main

import (
        "fmt"

        "github.com/cli/go-gh"
)

func main() {
        fmt.Println("hi world, this is the gh-ask extension!")
        client, err := gh.RESTClient(nil)
        if err != nil {
                fmt.Println(err)
                return
        }
        response := struct {Login string}{}
        err = client.Get("user", &response)
        if err != nil {
                fmt.Println(err)
                return
        }
        fmt.Printf("running as %s\n", response.Login)
}
go-gh has already been imported for us and there is an example of its RESTClient function being used.
Selecting a repository
The goal with this extension is to get a glimpse into threads in a GitHub repository’s discussion area that might be relevant to a particular question. It should work something like this:
$ gh ask actions
…a list of relevant threads from whatever repository you're in locally…

$ gh ask --repo cli/cli ansi
…a list of relevant threads from the cli/cli repository…
First, I’ll make sure that a repository can be selected. I’ll also remove stuff we don’t need right now from the initial boilerplate.
package main

import (
        "flag"
        "fmt"
        "os"

        "github.com/cli/go-gh"
        "github.com/cli/go-gh/pkg/repository"
)

func main() {
    if err := cli(); err != nil {
            fmt.Fprintf(os.Stderr, "gh-ask failed: %s\n", err.Error())
            os.Exit(1)
    }
}

func cli() {
        repoOverride := flag.String(
        "repo", "", "Specify a repository. If omitted, uses current repository")
        flag.Parse()

        var repo repository.Repository
        var err error

        if *repoOverride == "" {
                repo, err = gh.CurrentRepository()
        } else {
                repo, err = repository.Parse(*repoOverride)
        }
        if err != nil {
                return fmt.Errorf("could not determine what repo to use: %w", err.Error())

        }

        fmt.Printf(
       "Going to search discussions in %s/%s\n", repo.Owner(), repo.Name())

}
Running my code, I should see:
$ go run .
Going to search discussions in vilmibm/gh-ask
Adding our repository override flag:
$ go run . --repo cli/cli
Going to search discussions in cli/cli
Accepting an argument
Now that the extension can be told which repository to query I’ll next handle any arguments passed on the command line. These arguments will be our search term for the Discussions API. This new code replaces the fmt.Printf call.
    // fmt.Printf was here

        if len(flag.Args()) < 1 {
                return errors.New("search term required")
        }
        search := strings.Join(flag.Args(), " ")

        fmt.Printf(
                "Going to search discussions in '%s/%s' for '%s'\n",
            repo.Owner(), repo.Name(), search)

        }
With this change, the command will respect any arguments I pass.
$ go run .
Please specify a search term
exit status 2

$ go run . cats
Going to search discussions in 'vilmibm/gh-ask' for 'cats'

$ go run . fluffy cats
Going to search discussions in 'vilmibm/gh-ask' for 'fluffy cats'
Talking to the API
With search term and target repository in hand, I can now ask the GitHub API for some results. I’ll be using the GraphQL API via go-gh’s GQLClient. For now, I’m just printing some basic output. What follows is the new code at the end of the cli function. I’ll delete the call to fmt.Printf that was here for now.
        // fmt.Printf call was here

client, err := gh.GQLClient(nil)
        if err != nil {
                return fmt.Errorf("could not create a graphql client: %w", err)
        }

        query := fmt.Sprintf(`{
                        repository(owner: "%s", name: "%s") {
                                hasDiscussionsEnabled
                                discussions(first: 100) {
                                        edges { node {
                                                title
                                    body
                                    url

    }}}}}`, repo.Owner(), repo.Name())

        type Discussion struct {
                Title string
                URL   string `json:"url"`
                Body  string
        }

        response := struct {
                Repository struct {
                        Discussions struct {
                                Edges []struct {
                                        Node Discussion
                                }
                        }
                        HasDiscussionsEnabled bool
                }
        }{}

        err = client.Do(query, nil, &response)
        if err != nil {
                return fmt.Errorf("failed to talk to the GitHub API: %w", err)
        }

        if !response.Repository.HasDiscussionsEnabled {
                return fmt.Errorf("%s/%s does not have discussions enabled.", repo.Owner(), repo.Name())
        }

        matches := []Discussion{}

        for _, edge := range response.Repository.Discussions.Edges {
                if strings.Contains(edge.Node.Body+edge.Node.Title, search) {
                        matches = append(matches, edge.Node)
                }
        }

        if len(matches) == 0 {
                fmt.Fprintln(os.Stderr, "No matching discussion threads found :(")
            return nil
        }

        for _, d := range matches {
                fmt.Printf("%s %s\n", d.Title, d.URL)
        }
When I run this, my output looks like:
$ go run . --repo cli/cli actions
gh pr create don't trigger `pullrequest:` actions https://github.com/cli/cli/discussions/6575
GitHub CLI 2.19.0 https://github.com/cli/cli/discussions/6561
What permissions are needed to use OOTB GITHUB_TOKEN with gh pr merge --squash --auto https://github.com/cli/cli/discussions/6379
gh actions feedback https://github.com/cli/cli/discussions/3422
Pushing changes to an inbound pull request https://github.com/cli/cli/discussions/5262
getting workflow id and artifact id to reuse in github actions https://github.com/cli/cli/discussions/5735
This is pretty cool! Matching discussions are printed and we can click their URLs. However, I’d prefer the output to be tabular so it’s a little easier to read.
Formatting output
To make this output easier for humans to read and machines to parse, I’d like to print the title of a discussion in one column and then the URL in another.
I’ve replaced that final for loop with some new code that makes use of go-gh’s term and tableprinter packages.
        if len(matches) == 0 {
                fmt.Println("No matching discussion threads found :(")
        }

    // old for loop was here

        isTerminal := term.IsTerminal(os.Stdout)
        tp := tableprinter.New(os.Stdout, isTerminal, 100)


if isTerminal {
                fmt.Printf(
                        "Searching discussions in '%s/%s' for '%s'\n",
                        repo.Owner(), repo.Name(), search)
        }

        fmt.Println()
        for _, d := range matches {
                tp.AddField(d.Title)
                tp.AddField(d.URL)
                tp.EndRow()
        }

        err = tp.Render()
        if err != nil {
                return fmt.Errorf("could not render data: %w", err)
        }
The call to term.IsTerminal(os.Stdout) will return true when a human is sitting at a terminal running this extension. If a user invokes our extension from a script or pipes its output to another program, term.IsTerminal(os.Stdout) will return false. This value then informs the table printer how it should format its output. If the output is a terminal, tableprinter will respect a display width, apply colors if desired, and otherwise assume that a human will be reading what it prints. If the output is not a terminal, values are printed raw and with all color stripped.
Running the extension gives me this result now:
Note how the discussion titles are truncated.
If I pipe this elsewhere, I can use a command like cut to see the discussion titles in full:
Adding the tableprinter improved both human readability and scriptability of the extension.
Opening browsers
Sometimes, opening a browser can be helpful as not everything can be done in a terminal. go-gh has a function for this, which we’ll make use of in a new flag that mimics the “feeling lucky” button of a certain search engine. Specifying this flag means that we’ll open a browser with the first matching result to our search term.
I’ll add a new flag definition to the top of the main function:
func main() {
        lucky := flag.Bool("lucky", false, "Open the first matching result in a web browser")
    // rest of code below here
And, then add this before I set up the table printer:
        if len(matches) == 0 {
                fmt.Println("No matching discussion threads found :(")
        }

        if *lucky {
                b := browser.New("", os.Stdout, os.Stderr)
                b.Browse(matches[0].URL)
                return
        }

    // terminal and table printer code
JSON output
For extensions with more complex outputs, you could go even further in enabling scripting by exposing JSON output and supporting jq expressions. jq is a general purpose tool for interacting with JSON on the command line. go-gh has a library version of jq built directly in, allowing extension authors to offer their users the power of jq without them having to install it themselves.
I’m adding two new flags: --json and --jq. The first is a boolean and the second a string. They are now the first two lines in main:
func main() {
    jsonFlag := flag.Bool("json", false, "Output JSON")
    jqFlag := flag.String("jq", "", "Process JSON output with a jq expression")
After setting isTerminal, I’m adding this code block:
isTerminal := term.IsTerminal(os.Stdout)
        if *jsonFlag {
                output, err := json.Marshal(matches)
                if err != nil {
                        return fmt.Errorf("could not serialize JSON: %w", err)
                }

                if *jqFlag != "" {
                        return jq.Evaluate(bytes.NewBuffer(output), os.Stdout, *jqFlag)
                }

                return jsonpretty.Format(os.Stdout, bytes.NewBuffer(output), " ", isTerminal)
        }
Now, when I run my code with --json, I get nicely printed JSON output:
If I specify a jq expression I can process the data. For example, I can limit output to just titles like we did before with cut; this time, I’ll use the jq expression .[]|.Title instead.
Releasing your extension with cli/gh-extension-precompile
Now that I have a feature-filled extension, I’d like to make sure it’s easy to create releases for it so others can install it. At this point it’s uninstallable since I have not precompiled any of the Go code.
Before I worry about making a release, I have to make sure that my extension repository has the gh-extension tag. I can add that by running gh repo edit --add-tag gh-extension. Without this topic added to the repository, it won’t show up in commands like gh ext browse or gh ext search.
Since I started this extension by running gh ext create, I already have a GitHub Actions workflow defined for releasing. All that’s left before others can use my extension is pushing a tag to trigger a release. The workflow file contains:
The repository is public (assuming you want people to install this for themselves! You can keep it private and make releases just for yourself, if you prefer.).
You’ve pushed all the local work you want to see in the release.
To release:
Note that the workflow ran automatically. It looks for tags of the form vX.Y.Z and kicks off a build of your Go code. Once the release is done, I can check it to see that all my code compiled as expected:
Now, anyone can run gh ext install vilmibm/gh-ask and try out my extension! This is all the work of the gh-extension-precompile action. This action can be used to compile any language, but by default it only knows how to handle Go code.
By default, the action will compile executables for:
Linux (amd64, 386, arm, arm64)
Windows (amd64, 386, arm64)
MacOS (amd64, arm64)
FreeBSD (amd64, 386, arm64)
Android (amd64, arm64)
To build for a language other than Go, edit .github/workflows/release.yml to add a build_script_override configuration. For example, if my repository had a script at scripts/build.sh, my release.yml would look like:
The script specified as build_script_overridemust produce executables in a dist directory at the root of the extension repository with file names ending with: {os}-{arch}{ext}, where the extension is .exe on Windows and blank on other platforms. For example:
dist/gh-my-ext_v1.0.0_darwin-amd64
dist/gh-my-ext_v1.0.0_windows-386.exe
Executables in this directory will be uploaded as release assets on GitHub. For OS and architecture nomenclature, please refer to this list. We use this nomenclature when looking for executables from the GitHub CLI, so it needs to be respected even for non-Go extensions.
Future directions
The CLI team has some improvements on the horizon for the extensions system in the GitHub CLI. We’re planning a more accessible version of the extension browse command that renders a single column style interface suitable for screen readers. We intend to add support for nested extensions–in other words, an extension called as a subcommand of an existing gh command like gh pr my-extension–making third-party extensions fit more naturally into our command hierarchy. Finally, we’d like to improve the documentation and flexibility of the gh-extension-precompile action.
Are there features you’d like to see? We’d love to hear about it in a discussion or an issue in the cli/cli repository.
Wrap-up
It is our hope that the extensions system in the GitHub CLI inspire you to create features beyond our wildest imagination. Please go forth and make something you’re excited about, even if it’s just to make gh do fun things like run screensavers.
It’s that time of year where we’re all looking back at what we’ve accomplished and thinking ahead to goals and plans for the calendar year to come. As part of GitHub Universe, I shared some numbers that provided a window into the work our engineering and security teams drive each day on behalf of our community, customers, and Hubbers. As someone who loves data, it’s not just fun to see how we operate GitHub at scale, but it’s also rewarding to see how this work contributes to our vision to be the home for all developers–which includes our own engineering and security teams.
Over the course of the past year1, GitHub staff made millions of commits across all of our internal repositories. That’s a ton of branches, pull requests, Issues, and more. We processed billions of API requests daily. And we ran tens of thousands of production deployments across the internal apps that power GitHub’s services. If you do the math, that’s hundreds of deploys per day.
GitHub is big. But the reality is, no matter your size, your scale, or your stage, we’re all dealing with the same questions. Those questions boil down to how to optimize for productivity, collaboration, and, of course, security.
It’s a running joke internally that you have to type “GitHub” three times to get to the monolith. So, let’s take a look at how we at GitHub (1) use GitHub (2) to build the GitHub (3) you rely on.
Productivity
GitHub’s cloud-powered experiences, namely Codespaces and GitHub Copilot, have been two of the biggest game changers for us in the past few years.
Codespaces
It’s no secret that local development hasn’t evolved much in the past decade. The github/github repository, where much of what you experience on GitHub.com lives, is fairly large and took several minutes to clone even on a good network connection. Combine this with setting up dependencies and getting your environment the way you like it, spinning up a local environment used to take 45 minutes to go from checkout to a built local developer environment.
But now, with Codespaces, a few clicks and less than 60 seconds later, you’re in a working development environment that’s running on faster hardware than the MacBook I use daily.
Heating my home office in the chilly Midwest with my laptop doing a local build was nice, but it’s a thing of the past. Moving to Codespaces last year has truly impacted our day-to-day developer experience, and we’re not looking back.
GitHub Copilot
We’ve been using GitHub Copilot for more than a year internally, and it still feels like magic to me every day. We recently published a study that looked at GitHub Copilot performance across two groups of developers–one that used GitHub Copilot and one that didn’t. To no one’s surprise, the group that used GitHub Copilot was able to complete the same task 55% faster than the group that didn’t have GitHub Copilot.
Getting the job done faster is great, but the data also provided incredible insight into developer satisfaction. Almost three-quarters of the developers surveyed said that GitHub Copilot helped them stay in the flow and spend more time focusing on the fun parts of their jobs. When was the last time you adopted an experience that made you love your job more? It’s an incredible example of putting developers first that has completely changed how we build here at GitHub.
Collaboration
At GitHub, we’re remote-first and we have highly distributed teams, so we prioritize discoverability and how we keep teams up-to-date across our work. That’s where tools like Issues and projects come into play. They allow us to plan, track, and collaborate in a centralized place that’s right next to the code we’re working on.
Incorporating projects across our security team has made it easier for us to not only track our work, but also to help people understand how their work fits into the company’s broader mission and supports our customers.
Projects gives us a big picture view of our work, but what about the more tactical discovery of a file, function, or new feature another team is building? When you’re working on a massive 15-year-old codebase (looking at you, GitHub), sometimes you need to find code that was written well before you even joined the company, and that can feel like trying to find a needle in a haystack.
So, we’ve adopted the new code search and code view, which has helped our developers quickly find what they need without losing velocity. This improved discoverability, along with the enhanced organization offered by Issues and projects, has had huge implications for our teams in terms of how we’ve been able to collaborate across groups.
Shifting security left
Like we saw when we looked at local development environments, the security industry still struggles with the same issues that have plagued us for more than a decade. Exposed credentials, as an example, are still the root cause for more than half of all data breaches today2. Phishing is still the best, and cheapest, way for an adversary to get into organizations and wreak havoc. And we’re still pleading with organizations to implement multi-factor authentication to keep the most basic techniques from bad actors at bay.
It’s time to build security into everything we do across the developer lifecycle.
The software supply chain starts with the developer. Normalizing the use of strong authentication is one of the most important ways that we at GitHub, the home of open source, can help defend the entire ecosystem against supply chain attacks. We enforce multi-factor authentication with security keys for our internal developers, and we’re requiring that every developer who contributes software on GitHub.com enable 2FA by the end of next year. The closer we can bring our security and engineering teams together, the better the outcomes and security experiences we can create together.
Another way we do that is by scaling the knowledge of our security teams with tools like CodeQL to create checks that are deployed for all our developers, protecting all our users. And because the CodeQL queries are open source, the vulnerability patterns shared by security teams at GitHub or by our customers end up as CodeQL queries that are then available for everyone. This acts like a global force multiplier for security knowledge in the developer and security communities.
Security shouldn’t be gatekeeping your teams from shipping. It should be the process that enables them to ship quickly–remember our hundreds of production deployments per day?–and with confidence.
Big, small, or in-between
As you see, GitHub has the same priorities as any other development team out there.
It doesn’t matter if you’re processing billions of API requests a day, like we are, or if you’re just starting on that next idea that will be launched into the world.
These are just a few ways over the course of the last year that we’ve used GitHub to build our own platform securely and improve our own developer experiences, not only to be more productive, collaborative, and secure, but to be creative, to be happier, and to build the best work of our lives.
To learn more about how we use GitHub to build GitHub, and to see demos of the features highlighted here, take a look at this talk from GitHub Universe 2022.
Throughout the GitHub User Interface (UI), there are complex search inputs that allow you to narrow the results you see based on different filters. For example, for repositories with GitHub Discussions, you can narrow the results to only show open discussions that you created. This is completed with the search bar and the use of defined filters. The current implementation of this input has accessibility considerations that need to be examined at a deeper level, from the styled search input to the way items are grouped, that aren’t natively accessible, so we had to take some creative approaches. This led us to creating the QueryBuilder component, which is a fully accessible component designed for these types of situations.
As we rethought this core pattern within GitHub, we knew we needed to make search experiences accessible so everyone can successfully use them. GitHub is the home for all developers, including those with disabilities. We don’t want to stop at making GitHub accessible; we want to empower other developers to make a similar pattern accessible, which is why we’ll be open sourcing this component!
Process
GitHub is a very large organization with many moving pieces. Making sure that accessibility is considered in every step of the process is important. Our process looked a little something like this:
The first step was that we, the Accessibility Team at GitHub, worked closely with the designers and feature teams to design and build the QueryBuilder component. We wanted to understand the intent of the component and what the user should be able to accomplish. We used this information to help construct the product requirements.
Our designers and accessibility experts worked together on several iterations of what this experience would look like and annotated how it should function. Once everyone agreed on a path forward, it was time to build a proof of concept!
The proof of concept helped to work out some of the trickier parts of the implementation, which we will get to in the following Accessibility Considerations section. An accessibility expert review was conducted at multiple points throughout the process.
The Accessibility Team built the reusable component in collaboration with the Primer Team (GitHub’s Design System), and then collaborated with the GitHub Discussions Team on what it’d take to integrate the component. At this point in time, we have a fully accessible MVP component that can be seen on any GitHub.com Discussions landing page.
Introducing the QueryBuilder component
The main purpose of the QueryBuilder is to allow a user to enter a query that will narrow their results or complete a search. When a user types, a list of suggestions appears based on their input. This is a common pattern on web, which doesn’t sound too complicated, until you start to consider these desired features:
The input should contain visual styling that shows a user if they’ve typed valid input.
When a suggestion is selected, it can either take a user somewhere else (“Jump to”) or append the selection to the input (“Autocomplete”).
The set of suggestions should change based on the entered input.
There should be groups of suggestions within the suggestion box.
Okay, now we’re starting to get more complicated. Let’s break these features down from an accessibility perspective.
Accessibility considerations
Note: these considerations are not comprehensive to every accessibility requirement for the new component. We wanted to highlight the trickier-to-solve issues that may not have been addressed before.
Semantics
We talked about this component needing to take a user’s input and provide suggestions that a user can select from in a listbox. We are using the Combobox pattern, which does exactly this.
Styled input
Natively, HTML inputs do not allow specific styling for individual characters, unless you use contenteditable. We didn’t consider this to be an accessible pattern; even basic mark-up can disrupt the expected keyboard cursor movement and contenteditable’s support for ARIA attributes is widely inconsistent. To achieve the desired styling, we have a styled element – a <div aria-hidden="true"> with <span> elements inside—that is behind the real <input> element that a user interacts with. It is perfectly lined up visually so all of the keyboard functionality works as expected, the cursor position is retained, input text is duplicated inside, and we can individually style characters within the input. We also tested this at high Zoom levels to make sure that everything scaled correctly. color: transparent was added to the real input’s text, so sighted users will see the styled text from the <div>.
While the styled input adds some context for sighted users, we also explored whether we could make this apparent for people relying on a screen reader. Our research led us to create a proof of concept with live-region-based announcements as the cursor was moved through the text. However, based on testing, the screen reader feedback proved to be quite overwhelming and occasionally flaky, and it would be a large effort to accurately detect and manage the cursor position and keyboard functionality for all types of assistive technology users. Particularly when internationalization was taken into account, we decided that this would not be overly helpful or provide good return on investment.
Items with different actions
Typical listbox items in a combobox pattern only have one action–and that is to append the selected option’s value to the input. However, we needed something more. We wanted some selected option values to be appended to the input, but others to take you to a different page, such as search results.
For options that will append their values to the input when selected, there is no additional screen reader feedback since this is the default behavior of a listbox option. These options don’t have any visual indication (color, underline, etc.) that they will do anything other than append the selection to the input.
When an option will take a user to a new location, we’ve added an aria-label to that option explaining the behavior. For example, an option with the title README.md and description primer/react that takes you directly to https://github.com/primer/react/blob/main/README.md will have aria-label=”README.md, primer/react, jump to this file”. This explains the file (README.md), description/location of the file (primer/react), action (jump to), and type (this file). Since this is acting as a link, it will have visual text after the value stating the action. Since options may have two different actions, having a visual indicator is important so that a user knows what will happen when they make a selection.
Group support
Groups are fully supported in an accessible way. role="group" is not widely supported inside of listbox for all assistive technologies, so our approach conveys the intent of grouped items to each user, but in different ways.
For sighted users, there is a visual header and separator for each group of items. The header is not focusable, and it has role="presentation" so that it’s hidden from screen reader users because this information is presented in a different way to them (which is described later in this blog). The wrapping <ul> and <li> elements are also given role="presentation" since a listbox is traditionally a list of <li> items inside of one parent <ul>.
For screen reader users, the grouped options are denoted by an aria-label with the content of each list item and the addition of the type of list item. This is the same aria-label as described in the previous section about items with different actions. An example aria-label for a list item with the value primer/react that takes you to the Primer React repository when chosen is “primer/react, jump to this repository.” In this example, adding “repository” to the aria-label gives the context that the item is part of the “Repository” group, the same way the visual heading helps sighted users determine the groups. We chose to add the item type at the end of the aria-label so that screen reader users hear the name of the item first and can navigate through the suggestions quicker. Since the aria-label is different from the visible label, it has to contain the visible label’s text at the beginning for voice recognition software users.
Screen reader feedback
By default, there is no indication to a screen reader user how many suggestions are displayed or if the input is successfully cleared via the optional clear button.
To address this, we added an aria-live region that updates the text whenever the suggestions change or the input is cleared. A screen reader will receive feedback when they press the “Clear” button that the input has been cleared, focus is restored to the input, and how many suggestions are currently visible.
While testing the aria-live updates, we noticed something interesting; if the same number of results are displayed as a user continues typing, the aria-live region will not update. For example, if a user types “zzz” and there are 0 results, and then they add an additional “z” to their query (still 0 results), the screen reader will not re-read “0 results” since the aria-live API did not detect a change in the text. To address this, we are adding and removing a character if the previous aria-live message is the same as the new aria-live message. The will cause the aria-live API to detect a change and the screen reader will re-read the text without an audible indication that a space was added.
Recap
In conclusion, this was a tremendous effort with a lot of teams involved. Thank you to the many Hubbers who collaborated on this effort, and to our accessibility friends at Prime Access Consulting (PAC). We are excited for users to get their hands on this new experience and really accelerate their efficiency in complex searches. This component is currently in production in a repository with GitHub Discussions enabled, and it will be rolling out to more parts of the UI. Stay tuned for updates about the progress of the component being open sourced.
What’s next
We will integrate this component into additional parts of GitHub’s UI, such as the new global search experience so all users can benefit from this accessible, advanced searching capability. We will continue to add the component to other areas of the GitHub UI and address any bugs or feedback we receive.
As mentioned in the beginning of this post, it will be open sourced in Primer ViewComponents and Primer React along with clear guidelines on how to use this component. The base of the component is a Web Component which allows us to share the functionality between ViewComponents and React. This will allow developers to easily create an advanced, accessible, custom search component without spending time researching how to make this pattern accessible or functional, since we’ve already done that work! It can work with any source of data as long as it’s in the expected format.
Many teams throughout GitHub are constantly working on accessibility improvements to GitHub.com. For more on our vision for accessibility at GitHub, visit accessibility.github.com.
The cost of hardware is one of the most common objections to providing more powerful computing resources to development teams—and that’s regardless of whether you’re talking about physical hardware in racks, managed cloud providers, or a software-as-a-service based (SaaS) compute resource. Paying for compute resources is an easy cost to “feel” as a business, especially if it’s a recurring operating expense for a managed cloud provider or SaaS solution.
When you ask a developer whether they’d prefer more or less powerful hardware, the answer is almost always the same: they want more powerful hardware. That’s because more powerful hardware means less time waiting on builds—and that means more time to build the next feature or fix a bug.
But even if the upfront cost is higher for higher-powered hardware, what’s the actual cost when you consider the impact on developer productivity?
To find out, I set up an experiment using GitHub’s new, larger hosted runners, which offer powerful cloud-based compute resources, to execute a large build at each compute tier from 2 cores to 64 cores. I wanted to see what the cost of each build time would be, and then compare that with the average hourly cost of a United States-based developer to figure out the actual operational expense for a business.
The results might surprise you.
Testing build times vs. cost by core size on compute resources
For my experiment, I used my own personal project where I compile the Linux kernel (seriously!) for Fedora 35 and Fedora 36. For background, I need a non-standard patch to play video games on my personal desktop without having to deal with dual booting.
Beyond being a fun project, it’s also a perfect case study for this experiment. As a software build, it takes a long time to run—and it’s a great proxy for more intensive software builds developers often navigate at work.
Now comes the fun part: our experiment. Like I said above, I’m going to initiate builds of this project at each compute tier from 2 cores to 64 cores, and then determine how long each build takes and its cost on GitHub’s larger runners. Last but not least: I’ll compare how much time we save during the build cycle and square that with how much more time developers would have to be productive to find the true business cost.
The logic here is that developers could either be waiting the entire time a build runs or end up context-switching to work on something else while a build runs. Both of these impact overall productivity (more on this below).
To simplify my calculations, I took the average runtimes of two builds per compute tier.
Pro tip: You can find my full spreadsheet for these calculations here if you want to copy it and play with the numbers yourself using other costs, times for builds, developer salaries, etc.
How much slow build times cost companies
In scenario number one of our experiment, we’ll assume that developers may just wait for a build to run and do nothing else during that time frame. That’s not a great outcome, but it happens.
So, what does this cost a business? According to StackOverflow’s 2022 Developer Survey, the average annual cost of a developer in the United States is approximately $150,000 per year including fringe benefits, taxes, and so on. That breaks down to around $75 (USD) an hour. In short, if a developer is waiting on a build to run for one hour and doing nothing in that timeframe, the business is still spending $75 on average for that developer’s time—and potentially losing out on time that developer could be focusing on building more code.
Now for the fun part: calculating the runtimes and cost to execute a build using each tier of compute power, plus the cost of a developer’s time spent waiting on the build. (And remember, I ran each of these twice at each tier and then averaged the results together.)
You end up with something like this:
Compute power
Fedora 35 build
Fedora 36 build
Average time
(minutes)
Cost/minute for compute
Total cost of 1 build
Developer cost
(1 dev)
Developer cost
(5 devs)
2 core
5:24:27
4:54:02
310
$0.008
$2.48
$389.98
$1,939.98
4 core
2:46:33
2:57:47
173
$0.016
$2.77
$219.02
$1,084.02
8 core
1:32:13
1:30:41
92
$0.032
$2.94
$117.94
$577.94
16 core
0:54:31
0:54:14
55
$0.064
$3.52
$72.27
$347.27
32 core
0:36:21
0:32:21
35
$0.128
$4.48
$48.23
$223.23
64 core
0:29:25
0:24:24
27
$0.256
$6.91
$40.66
$175.66
You can immediately see how much faster each build completes on more powerful hardware—and that’s hardly surprising. But it’s striking how much money, on average, a business would be paying their developers in the time it takes for a build to run.
When you plot this out, you end up with a pretty compelling case for spending more money on stronger hardware.
A chart showing the cost of a build on servers of varying CPU power.
The bottom line: The cost of hardware is much, much less than the total cost for developers, and giving your engineering teams more CPU power means they have more time to develop software instead of waiting on builds to complete. And the bigger the team you have in a given organization, the more upside you have to invest in more capable compute resources.
How much context switching costs companies
Now let’s change the scenario in our experiment: Instead of assuming that developers are sitting idly while waiting for a build to finish, let’s consider they instead start working on another task while a build runs.
This is a classic example of context switching, and it comes with a cost, too. Research has found that context switching is both distracting and an impediment to focused and productive work. In fact, Gloria Mark, a professor of informatics at the University of California, Irvine, has found it takes about 23 minutes for someone to get back to their original task after context switching—and that isn’t even specific to development work, which often entails deeply involved work.
Based on my own experience, switching from one focused task to another takes at least an hour so that’s what I used to run the numbers against. Now, let’s break down the data again:
Compute power
Minutes
Cost of 1 build
Partial developer cost
(1 dev)
Partial developer cost
(5 devs)
2 core
310
$2.48
$77.48
$377.48
4 core
173
$2.77
$77.77
$377.77
8 core
92
$2.94
$77.94
$377.94
16 core
55
$3.52
$78.52
$378.52
32 core
35
$4.48
$79.48
$379.48
64 core
27
$6.91
$81.91
$381.91
Here, the numbers tell a different story—that is, if you’re going to switch tasks anyways, the speed of build runs doesn’t significantly matter. Labor is much, much more expensive than compute resources. And that means spending a few more dollars to speed up the build is inconsequential in the long run.
Of course, this assumes it will take an hour for developers to get back on track after context switching. But according to the research we cited above, some people can get back on track in 23 minutes (and, additional research from Cornell found that it sometimes takes as little as 10 minutes).
To account for this, let’s try shortening the time frames to 30 minutes and 15 minutes:
Compute power
Minutes
Cost of 1 build
Partial dev cost
(1 dev, 30 mins)
Partial dev cost
(5 devs, 30 mins)
Partial dev cost
(1 dev, 15 mins)
Partial dev cost
(5 devs, 15 mins)
2 core
310
$2.48
$39.98
$189.98
$21.23
$96.23
4 core
173
$2.77
$40.27
$190.27
$21.52
$96.52
8 core
92
$2.94
$40.44
$190.44
$21.69
$96.69
16 core
55
$3.52
$41.02
$191.02
$22.27
$97.27
32 core
35
$4.48
$41.98
$191.98
$23.23
$98.23
64 core
27
$6.91
$44.41
$194.41
$25.66
$100.66
And when you visualize this data on a graph, the cost for a single developer waiting on a build or switching tasks looks like this:
A chart showing how much it costs for developers to wait for a build to execute.
When you assume the average hourly rate of a developer is $75 (USD), the graph above shows that it almost always makes sense to pay more for more compute power so your developers aren’t left waiting or context switching. Even the most expensive compute option—$15 an hour for 64 cores and 256GB of RAM—only accounts for a fifth of the hourly cost of a single developer’s time. As developer salaries increase, the cost of hardware decreases, or the time the job takes to run decreases—and this inverse ratio bolsters the case for buying better equipment.
That’s something to consider.
The bottom line
It’s cheaper—and less frustrating for your developers—to pay more for better hardware to keep your team on track.
In this case, spending an extra $4-5 on build compute saves about $40 per build for an individual developer, or a little over $200 per build for a team of five, and the frustration of switching tasks with a productivity cost of about an hour. That’s not nothing. Of course, spending that extra $4-5 at scale can quickly compound—but so can the cost of sunk productivity.
Even though we used GitHub’s larger runners as an example here, these findings are applicable to any type of hardware—whether self-hosted or in the cloud. So remember: The upfront cost for more CPU power pays off over time. And your developers will thank you (trust us).
The foundation for making any map is in imagery, but due to the complexity and dynamism of the real world, it is difficult for companies to collect high-quality, fresh images in an efficient yet low-cost manner. This is the case for Grab’s Geo team as well.
Traditional map-making methods rely on professional-grade cameras that provide high resolution images to collect mapping imagery. These images are rich in content and detail, providing a good snapshot of the real world. However, we see two major challenges with this approach.
The first is high cost. Professional cameras are too expensive to use at scale, especially in an emerging region like Southeast Asia. Apart from high equipment cost, operational cost is also high as local operation teams need professional training before collecting imagery.
The other major challenge, related to the first, is that imagery will not be refreshed in a timely manner because of the high cost and operational effort required. It typically takes months or years before imagery is refreshed, which means maps get outdated easily.
Compared to traditional collection methods, there are more affordable alternatives that some emerging map providers are using, such as crowdsourced collection done with smartphones or other consumer-grade action cameras. This allows more timely imagery refresh at a much lower cost.
That said, there are several challenges with crowdsourcing imagery, such as:
Inconsistent quality in collected images.
Low operational efficiency as cameras and smartphones are not optimised for mapping.
Unreliable location accuracy.
In order to solve the challenges above, we started building our own artificial intelligence (AI) camera called KartaCam.
What is KartaCam?
Designed specifically for map-making, KartaCam is a lightweight camera that is easy to operate. It is everything you need for accurate and efficient image collection. KartaCam is powered by edge AI, and mainly comprises a camera module, a dual-band Global Navigation Satellite System (GNSS) module, and a built-in 4G Long-Term Evolution (LTE) module.
KartaCam
Camera module
The camera module or optical design of KartaCam focuses on several key features:
Wide field of vision (FOV): A wide FOV to capture as many scenes and details as possible without requiring additional trips. A single KartaCam has a wide lens FOV of >150° and when we use four KartaCams together, each facing a different direction, we increase the FOV to 360°.
High image quality: A combination of high-definition optical lens and a high-resolution pixel image sensor can help to achieve better image quality. KartaCam uses a high-quality 12MP image sensor.
Ease of use: Portable and easy to start using for people with little to no photography training. At Grab, we can easily deploy KartaCam to our fleet of driver-partners to map our region as they regularly travel these roads while ferrying passengers or making deliveries.
Edge AI for smart capturing on edge
Each KartaCam device is also equipped with edge AI, which enables AI computations to operate closer to the actual data – in our case, imagery collection. With edge AI, we can make decisions about imagery collection (i.e. upload, delete or recapture) at the device-level.
To help with these decisions, we use a series of edge AI models and algorithms that are executed immediately after each image capture such as:
Scene recognition model: For efficient map-making, we ensure that we make the right screen verdicts, meaning we only upload and process the right scene images. Unqualified images such as indoor, raining, and cloudy images are deleted directly on the KartaCam device. Joint detection algorithms are deployed in some instances to improve the accuracy of scene verdicts. For example, to detect indoor recording we look at a combination of driver moving speed, Inertial Measurement Units (IMU) data and edge AI image detection.
Image quality (IQ) checking AI model: The quality of the images collected is paramount for map-making. Only qualified images judged by our IQ classification algorithm will be uploaded while those that are blurry or considered low-quality will be deleted. Once an unqualified image is detected (usually within the next second), a new image is captured, improving the success rate of collection.
Object detection AI model: Only roadside images that contain relevant map-making content such as traffic signs, lights, and Point of Interest (POI) text are uploaded.
Privacy information detection: Edge AI also helps protect privacy when collecting street images for map-making. It automatically blurs private information such as pedestrians’ faces and car plate numbers before uploading, ensuring adequate privacy protection.
Better positioning with a dual-band GNSS module
The Global Positioning System (GPS) mainly uses two frequency bands: L1 and L5. Most traditional phone or GPS modules only support the legacy GPS L1 band, while modern GPS modules support both L1 and L5. KartaCam leverages the L5 band which provides improved signal structure, transmission capabilities, and a wider bandwidth that can reduce multipath error, interference, and noise impacts. In addition, KartaCam uses a fine-tuned high-quality ceramic antenna that, together with the dual frequency band GPS module, greatly improves positioning accuracy.
Keeping KartaCam connected
KartaCam has a built-in 4G LTE module that ensures it is always connected and can be remotely managed. The KartaCam management portal can monitor camera settings like resolution and capturing intervals, even in edge AI machine learning models. This makes it easy for Grab’s map ops team and drivers to configure their cameras and upload captured images in a timely manner.
Enhancing KartaCam
KartaCam 360: Capturing a panorama view
To improve single collection trip efficiency, we group four KartaCams together to collect 360° images. The four cameras can be synchronised within milliseconds and the collected images are stitched together in a panoramic view.
With KartaCam 360, we can increase the number of images collected in a single trip. According to Grab’s benchmark testing in Singapore and Jakarta, the POI information collected by KartaCam 360 is comparable to that of professional cameras, which cost about 20x more.
KartaCam 360 & Scooter mount
Image sample from KartaCam 360
KartaCam and the image collection workflow
KartaCam, together with other GrabMaps imagery tools, provides a highly efficient, end-to-end, low-cost, and edge AI-powered smart solution to map the region. KartaCam is fully integrated as part of our map-making workflow.
Our map-making solution includes the following components:
Collection management tool – Platform that defines map collection tasks for our driver-partners.
KartaView application – Mobile application provides map collection tasks and handles crowdsourced imagery collection.
KartaCam – Camera device connected to KartaView via Bluetooth and equipped with edge automatic processing for imagery capturing according to the task accepted.
Camera management tool – Handles camera parameters and settings for all KartaCam devices and can remotely control the KartaCam.
Automatic processing – Collected images are processed for quality check, stitching, and personal identification information (PII) blurring.
KartaView imagery platform – Processed images are then uploaded and the driver-partner receives payment.
In a future article, we will dive deeper into the technology behind KartaView and its role in GrabMaps.
Impact
At the moment, Grab is rolling out thousands of KartaCams to all locations across Southeast Asia where Grab operates. This saves operational costs while improving the efficiency and quality of our data collection.
Better data quality and more map attributes
Due to the excellent image quality, wide FOV coverage, accurate GPS positioning, and sensor data, the 360° images captured by KartaCam 360 also register detailed map attributes like POIs, traffic signs, and address plates. This will help us build a high quality map with rich and accurate content.
Reducing operational costs
Based on our research, the hardware cost for KartaCam 360 is significantly lower compared to similar professional cameras in the market. This makes it a more feasible option to scale up in Southeast Asia as the preferred tool for crowdsourcing imagery collection.
With image quality checks and detection conducted at the edge, we can avoid re-collections and also ensure that only qualified images are uploaded. These result in saving time as well as operational and upload costs.
Upholding privacy standards
KartaCam automatically blurs captured images that contain PII, like faces and licence plates directly from the edge devices. This means that all sensitive information is removed at this stage and is never uploaded to Grab servers.
On-the-edge blurring example
What’s next?
Moving forward, Grab will continue to enhance KartaCam’s performance in the following aspects:
Further improve image quality with better image sensors, unique optical components, and state-of-art Image Signal Processor (ISP).
Make KartaCam compatible with Light Detection And Ranging (LIDAR) for high-definition collection and indoor use cases.
Improve GNSS module performance with higher sampling frequency and accuracy, and integrate new technology like Real-Time Kinematic (RTK) and Precise Point Positioning (PPP) solutions to further improve the positioning accuracy. When combined with sensor fusion from IMU sensors, we can improve positioning accuracy for map-making further.
Improve usability, integration, and enhance imagery collection and portability for KartaCam so driver-partners can easily capture mapping data.
Explore new product concepts for future passive street imagery collection.
To find out more about how KartaCam delivers comprehensive cost-effective mapping data, check out this article.
Join us
Grab is the leading superapp platform in Southeast Asia, providing everyday services that matter to consumers. More than just a ride-hailing and food delivery app, Grab offers a wide range of on-demand services in the region, including mobility, food, package and grocery delivery services, mobile payments, and financial services across 428 cities in eight countries.
Powered by technology and driven by heart, our mission is to drive Southeast Asia forward by creating economic empowerment for everyone. If this mission speaks to you, join our team today!
Millions of developers rely on the GitHub API every day—whether they’ve built their own bespoke integration or are using a third-party app from the GitHub Marketplace.
We know that it’s absolutely crucial to provide a stable, consistent API experience. We can’t—and don’t—expect integrators to constantly update their integrations as we tweak our API.
At the same time, it’s crucial that we’re able to evolve the API over time. If the API had to stay the same forever, then we couldn’t bring the latest and greatest product features to API users, fix bugs, or improve the developer experience.
We can make most changes (for example, introduce a new endpoint) without having a negative impact on existing integrations. We call these non-breaking changes, and we make them every single day.
But sometimes, we need to make breaking changes, like deleting a response field, making an optional parameter required, or deleting an endpoint entirely.
We launched version 3 (“V3”) of our API more than a decade ago. It has served us well, but we haven’t had the right tools and processes in place to make occasional breaking changes AND give existing users a smooth migration path and plenty of time to upgrade their integrations.
To enable us to continue evolving the API for the next decade (and beyond!), we’re introducing calendar-based versioning for the REST API.
This post will show you how the new API versioning system will work and what will happen next.
How it works—a 60‐second summary
Whenever we need to make breaking changes to the REST API, we’ll release a new version. Head over to our documentation to learn about the kinds of changes that we consider to be breaking and non-breaking.
Versions will be named based on the date when they were released. For example, if we release a new version on December 25, 2025, we would call that version 2025-12-25.
When we release a new version, the previous version(s) will still be available, so you won’t be forced to upgrade right away.
Picking what version you want to use is easy. You just specify the version you want to use on a request-by-request basis using the X-GitHub-Api-Version header.
In our API documentation, you can pick which version of the docs you want to view using the version picker.
We’ll only use versioning for breaking changes. Non-breaking changes will continue to be available across all API versions.
Note: calendar-based API versioning only applies to our REST API. It does not apply to our GraphQL API or webhooks.
How often will you release new versions, and how long will they last?
We’ll release a new version when we want to make breaking changes to the API.
We recommend that new integrations should use the latest API version and existing integrators should keep their integrations up to date, but we won’t frequently retire old versions or force users to upgrade.
When a new REST API version is released, we’re committed to supporting the previous version for at least two years (24 months).
After two years, we reserve the right to retire a version, but in practice, we expect to support historic versions for significantly longer than this. When we do decide to end support for an old version, we’ll announce that on our blog and via email.
I have an existing integration with the REST API. What does this mean for me?
You don’t need to do anything right now.
We’ve taken the existing state of the GitHub API—what you’re already using—and called it version 2022-11-28.
We encourage integrators to update their integration to send the new X-GitHub-Api-Version: 2022-11-28 header. Version 2022-11-28 is exactly the same as the API before we launched versioning, so you won’t need to make any changes to your integration.
In the next few months, we’ll release another version with breaking changes included. To move to that version, you will need to point the X-GitHub-Api-Version header to that new version and make sure that your integration works with the changes introduced in that version. Of course, we’ll provide a full changelog and instructions on how to upgrade.
Next steps—and what you can do today
If you have an integration with the REST API, you should update it now to start sending the X-GitHub-Api-Version header.
Soon, we’ll release a dated version of the API with breaking changes. Then, and whenever we release a new API version, we’ll:
Publish the documentation, information about the changes, and an upgrade guide in the GitHub REST API docs.
Email active GitHub.com developers to let them know about the new release.
Include a note providing details of the API changes in the release notes for GitHub Enterprise Server and GitHub AE.
We’ll also launch tools to help organization and enterprise administrators track their integrations and the API versions in use, making it easy to manage the upgrade process across an organization.
Similar to other AI pair programming tools, GitHub Copilot is changing the game of software development. GitHub Copilot is an AI pair programmer that helps you write code faster with less work. We use the terms “AI pair programmer” and “Copilot” to imply that this tool cannot work without you–the developer! It’s not magic. It cannot read minds, although it sometimes feels like it can. However, by sharing code completion suggestions based on my project’s context and style conventions, GitHub Copilot increased my velocity and confidence as a programmer.
The best part is you can use GitHub Copilot to increase your velocity and confidence as you code, too! In June 2022, we made GitHub Copilot available to all individual developers. You can learn how to get started with GitHub Copilot here.
If it’s not reading minds and it’s not magic, then how does it work?
Open AI Codex, a machine learning model that translates natural language into code, powers GitHub Copilot to draw context from comments and code to suggest individual lines and whole functions as you type. Codex is a version of GPT-3 (Generative Pre-trained Transformer 3) fine-tuned for programming tasks. Some of your favorite applications, like Duolingo, use GPT-3 for grammar correction.
For more information on how GitHub Copilot works and its effectiveness, check out the following resources:
Once installed, the extension will suggest code as you type, but what next? How can you optimally benefit from the GitHub Copilot extension?
First, I recommend writing clear, understandable comments to help your AI pair programmer generate desired solutions, but if you’re interested in exploring how to use GitHub Copilot in ways you might not be thinking of, we compiled some fun and valuable use cases we’ve seen in talking with developers. I hope that the following examples inspire you!
1. Assisting non-native English speakers
GitHub Copilot can understand other languages beyond English! This is helpful for developers of all backgrounds because programming languages are based on American English. For example, the CSS property color is based on American English, so it is unfamiliar for native British-English or Canadian-English speakers who use the spelling ‘colour’. Forgetting the correct spelling and syntax can often result in typos, unexpected errors, and lost time.
In the GIF below, I wrote a comment in Spanish that says, “importar,” which translates to “import.” GitHub Copilot quickly completed my comment in Spanish and imported the necessary libraries as the comment described.
Additionally, GitHub Copilot helps translate words from English to other languages. MilMikDev on Twitter used GitHub Copilot to translate an array of words ‘answer’, ‘question,’ and ‘date’ to various languages.
2. Creating dictionaries with lookup data
Martin Woodward, Vice President of Developer Relations at GitHub, shared this tip with us! GitHub Copilot is great at creating dictionaries of lookup data. Try it out by writing a comment instructing GitHub Copilot to create a dictionary of two-letter ISO country codes and their contributing country name. Writing a comment and the first few lines of code should help GitHub Copilot generated the desired results. See the GIF below for visual representation!
3. Testing your code
Writing tests is a vital yet sometimes tedious step in the software development lifecycle. Because GitHub Copilot excels in pattern recognition and pattern completion, it can speed up the process of writing unit tests, visual regression tests, and more.
Check out these resources to learn more about using GitHub Copilot for testing:
With GitHub Copilot, you can spend less time fiddling in a Regex playground or combing through StackOverflow to match character combinations in strings. Instead, you can write a comment or a function name to trigger GitHub Copilot’s suggestions.
I used Copilot to help me validate a phone number!
GitHub Copilot can help you remove white space from a string!
5. Preparing for technical interviews
While this may sound unorthodox, developers, including myself, use GitHub Copilot to study for interviews.
Here’s the strategy:
First, I try to solve the problem without GitHub Copilot.
If I’m feeling extremely stuck and disheartened while solving the problem, I’ll activate GitHub Copilot and use it to generate ideas on how to solve the problem better.
Subsequently, I’ll delete the code GitHub Copilot generated, deactivate GitHub Copilot, and make another attempt at finding a solution with the new information in mind.
By adopting this method, I maintain momentum when tempted to quit. Instead of giving up, I gain new perspectives even when I don’t have a mentor or peer to guide me. GitHub Copilot becomes my digital mentor. But, note, that I highly discourage activating GitHub Copilot during an interview (that’s cheating!).
Interestingly, chess players take a similar approach when preparing for matches. It’s common for chess players to practice against AI engines to advance their skills. In the publication, Towards Data Science, Bharath K writes, “Artificial Intelligence has influenced the way in which chess games are played at the top level. Most of the Grandmasters and Super Grandmasters (rated at a FIDE above 2700) utilize these modern AI chess engines to analyze their games and the games of their competitors.” Learn more about the influence of AI chess engines here.
If AI is helping chess players advance their skills, perhaps it can positively impact developers’ problem-solving skills by challenging them to think differently about solving a problem.
You can learn more about leveraging GitHub Copilot to solve algorithmic problems here. In the example below, I wrote a comment that says, “write a binary search algorithm,” and the first line of my function. GitHub Copilot correctly completed the function.
6. Sending tweets
Of course, you can simply use the Twitter application to send a Tweet, but it’s more fun to send a Tweet via your IDE! As a Developer Advocate, part of my job is to create demos. In a recent livestream, I had to demonstrate using Twitter API v2 with GitHub Copilot in Python, a language that I rarely use. GitHub Copilot saved the day and generated the code I needed after I wrote a few comments. Read my DEV post if you want to try sending a tweet with GitHub Copilot, too!
7. Exiting Vim
Developers who are new to Vim frequently wonder how to exit the editor. Struggling to exit vim is so common that it’s a meme on the internet! Since GitHub Copilot is available in Visual Studio Code, JetBrains, and Neovim, a forked version of Vim with additional features, you can exit NeoVim using GitHub Copilot. In the video below, Brian Douglas uses GitHub Copilot to exit NeoVim, by writing a comment that says, “How do I exit vim?”
8. Navigating a new codebase with Copilot Labs
GitHub Copilot Labs is a complementary extension that comes with GitHub Copilot access. The GitHub Next team developed GitHub Copilot Labs, an experimental sidebar, to help developers translate code from one programming language to another and get a step-by-step explanation of code snippets.
There’s no easy method for building a mental model of a new codebase, but these two features within GitHub Copilot Labs can help. By translating code snippets to languages they’re more familiar with and using the ‘Explain’ feature to gain an understanding of the code, developers can better comprehend complex blocks of code.
Wrap-up
As you’ve seen in the examples above, GitHub Copilot can help you be more productive in so many ways day to day (a lot of which we’re still discovering!), and I want to kindly remind you that GitHub Copilot is an AI pair programmer, so just as you would with your coworkers’ code or even your own, review the generated code before pushing it to production! While GitHub Copilot is powerful, sometimes it makes mistakes or refers to an outdated version of an API. Nevertheless, the team at GitHub continues to work hard and learn from our users to develop a better experience and generate better results with GitHub Copilot. I’m excited to witness and experience the evolution of AI pair programming tools. If you’re just as eager as me, sign up for GitHub Copilot today!
The JavaScript community downloads over 5 billion packages from npm a day, and we at GitHub recognize how important it is that developers can do so with confidence. As stewards of the npm registry, it’s important that we continue to invest in improvements that increase developer trust and the overall security of the registry itself.
Today, we are announcing the general availability of an enhanced 2FA experience on npm, as well as sharing additional investments we’ve made to the verification process of accounts and packages.
The following improvements to npm are available today, including:
A streamlined login and publishing experience with the npm CLI.
The ability to connect GitHub and Twitter accounts to npm.
All packages on npm have been re-signed and we’ve added a new npm CLI command to audit package integrity.
Streamlined login and publishing experience
Account security is significantly improved by adopting 2FA, but if the experience adds too much friction, we can’t expect customers to adopt it. We recently announced a variety of enhancements to the npm registry to make 2FA adoption easier for developers—in a public beta release. Early adopters of our new 2FA experience shared feedback around the process of logging in and publishing with the npm CLI, and we recognized there was room for improvement. Our initial design was created to be backwards compatible with npm 6 and other clients; in fact the Yarn project was able to backport support for our new experience to Yarn 1 in less than 10 lines of code!
We’ve been hard at work making the CLI experience better than ever based on this feedback, and the improved login and publish experience is now available in npm 8.15.0 today. With the new experience, users will benefit from:
Login and publish authentication are managed in the browser.
Login can use an existing session only prompting for your second factor or email verification OTP to create a new session.
Publish now supports “remember me for 5 minutes” and allows for subsequent publishes from the same IP + access token to avoid the 2FA prompt for a 5-minute period. This is especially useful when publishing from a npm workspace.
It is currently opt-in with the --auth-type=web flag and will be the default experience in npm 9.
These improved experiences will make it easier for users to secure their accounts. A secure account is the beginning of a secure ecosystem. Check out our documentation to learn more about 2FA in npm.
Connecting GitHub and Twitter Accounts to npm
Developers have been able to include their GitHub and Twitter handles on their npm profiles for almost as long as npm accounts have been available. This data has been helpful to connect the identity of an account on npm to an identity on other platforms; however this data has historically been a free-form text field that wasn’t validated or verified.
That’s why today we are launching the ability to link your npm account to your GitHub and Twitter accounts. Linking of these accounts is performed via official integrations with both GitHub and Twitter and ensures that verified account data are included on npm profiles moving forward. We will no longer be showing the previously unverified GitHub or Twitter data on public user profiles, making it possible for developers to audit identities and trust that an account is who they say they are.
Having a verified link between your identities across platforms significantly improves our ability to do account recovery. This new verified data lays the foundation for automating identity verification as part of account recovery. Over time, we will deprecate this legacy data, but we will continue to honor it for now to ensure that customers do not get locked out of their accounts.
You can verify your packages locally with npm audit signatures
Until today npm users have had to rely on a multi-step process to validate the signature of npm packages. This PGP based process was both complex and required users to have knowledge on cryptographic tools which provided a poor developer experience. Developers relying on this existing process should soon start using the new “audit signatures” command. The PGP keys are set to expire early next year with more details to follow.
Recently, we began work to re-sign all npm packages with new signatures relying on the secure ECDSA algorithm and using an HSM for key management, and you can now rely on this signature to verify the integrity of the packages you install from npm.
We have introduced a new audit signatures command in npm CLI version 8.13.0 and above.
Example of a successful audit signature verification
The below sample GitHub Actions workflow with audit signature in action.
Our primary goal continues to be protecting the npm registry, and our next major milestone will be enforcing 2FA for all high-impact accounts, those that manage packages with more than 1 million weekly downloads or 500 dependents, tripling the number of accounts we will require to adopt a second factor. Prior to this enforcement we will be making even more improvements to our account recovery process, including introducing additional forms of identity verification and automating as much of the process as possible.
Learn more about these features by visiting our documentation:
We’re excited to announce that the ability to prebuild codespaces is now generally available. As a quick recap, a prebuilt codespace serves as a “ready-to-go” template where your source code, editor extensions, project dependencies, commands, and configurations have already been downloaded, installed, and applied, so that you don’t have to wait for these tasks to finish each time you create a new codespace. This helps significantly speed up codespace creations–especially for complex or large codebases.
Codespaces prebuilds entered public beta earlier this year, and we received a ton of feedback around experiences you loved, as well as areas we could improve on. We’re excited to share those with you today.
How Vanta doubled its engineering team with Codespaces
With Codespaces prebuilds, Vanta was able to significantly reduce the time it takes for a developer to onboard. This was important, because Vanta’s Engineering Team doubled in size in the last few months. When a new developer joined the company, they would need to manually set up their dev environment; and once it was stable, it would diverge within weeks, often making testing difficult.
“Before Codespaces, the onboarding process was tedious. Instead of taking two days, now it only takes a minute for a developer to access a pristine, steady-state environment, thanks to prebuilds,” said Robbie Ostrow, Software Engineering Manager at Vanta. “Now, our dev environments are ephemeral, always updated and ready to go.”
Scheduled prebuilds to manage GitHub Actions usage
Repository admins can now decide how and when they want to update prebuild configurations based on their team’s needs. While creating or updating prebuilds for a given repository and branch, admins can choose from three available triggers to initiate a prebuild refresh:
Every push (default): Prebuild configurations are updated on every push made to the given branch. This ensures that new Codespaces always contain the latest configuration, including any recently added or updated dependencies.
On configuration change: Prebuild configurations are updated every time configuration files change. This ensures that the latest configuration changes appear in new Codespaces. The Actions workflow that generates the prebuild template will run less often, so this option will use fewer Actions minutes.
Scheduled: With this setting, you can have your prebuild configurations update on a custom schedule. This can help further reduce the consumption of Actions minutes.
With increased control, repository admins can make more nuanced trade-offs between “environment freshness” and Actions usage. For example, an admin working in a large organization may decide to update their prebuild configuration every hour rather than on every push to get the most economy and efficiency out of their Actions usage.
Failure notifications for efficient monitoring
Many of you shared with us the need to be notified when a prebuild workflow fails, primarily to be able to watch and fix issues if and when they arise. We heard you loud and clear and have added support for failure notifications within prebuilds. With this, repository admins can specify a set of individuals or teams to be informed via email in case a workflow associated with that prebuild configuration fails. This will enable team leads or developers in charge of managing prebuilds for their repository to stay up to date on any failures without having to manually monitor them. This will also enable them to make fixes faster, thus ensuring developers working on the project continue getting prebuilt codespaces.
To help with investigating failures, we’ve also added the ability to disable a prebuild configuration in the instance repository admins would like to temporarily pause the update of a prebuild template while fixing an underlying issue.
Improved ‘prebuild readiness’ indicators
Lastly, to help you identify prebuild-enabled machine types to avail fast creations, we have introduced a ‘prebuild in progress’ label in addition to the ‘prebuild ready’ label in cases where a prebuild template creation for a given branch is in progress.
Billing for prebuilds
With general availability, organizations will be billed for Actions minutes required to run prebuild associated workflows and storage of templates associated with each prebuild configuration for a given repository and region. As an admin, you can download the usage report for your organization to get a detailed view of prebuild-associated Actions and storage costs for your organization-owned repositories to help you manage usage.
Alongside enabling billing, we’ve also added a functionality to help manage prebuild-associated storage costs based on the valuable feedback that you shared with us.
Template retention to manage storage costs
Repository administrators can now specify the number of prebuild template versions to be retained with a default template retention setting of two. A default of two means that the codespace service will retain the latest and one previous prebuild template version by default, thus helping you save on storage for older versions.
How to get started
Prebuilds are generally available for the GitHub Enterprise Cloud and GitHub Team plans as of today.
As an organization or repository admin, you can head over to your repository’s settings page and create prebuild configurations under the “Codespaces” tab. As a developer, you can create a prebuilt codespace by heading over to a prebuild-enabled branch in your repository and selecting a machine type that has the “prebuild ready” label on it.
Post general availability, we’ll continue working on functionalities to enable prebuilds on monorepos and multi-repository scenarios based on your feedback. If you have any feedback to help improve this experience, be sure to post it on our GitHub Discussions forum.
When we formally introduced Atom in 2014, we set out to give developers a text editor that was deeply customizable but also easy to use—one that made it possible for more people to build software. While that goal of growing the software creator community remains, we’ve decided to retire Atom in order to further our commitment to bringing fast and reliable software development to the cloud via Microsoft Visual Studio Code and GitHub Codespaces.
Today, we’re announcing that we are sunsetting Atom and will archive all projects under the organization on December 15, 2022.
Why are we doing this now?
Atom has not had significant feature development for the past several years, though we’ve conducted maintenance and security updates during this period to ensure we’re being good stewards of the project and product. As new cloud-based tools have emerged and evolved over the years, Atom community involvement has declined significantly. As a result, we’ve decided to sunset Atom so we can focus on enhancing the developer experience in the cloud with GitHub Codespaces.
This is a tough goodbye. It’s worth reflecting that Atom has served as the foundation for the Electron framework, which paved the way for the creation of thousands of apps, including Microsoft Visual Studio Code, Slack, and our very own GitHub Desktop. However, reliability, security, and performance are core to GitHub, and in order to best serve the developer community, we are archiving Atom to prioritize technologies that enable the future of software development.
What happens next?
We recognize that Atom is still used by the community and want to acknowledge that migrating to an alternative solution takes time and energy. We are committed to helping users and contributors plan for their migration.
Today, we’re announcing the sunset date six months out.
Over the next six months, we’ll continue to inform Atom users of the sunset in the product and on atom.io.
On December 15, 2022, we will archive the atom/atom repository and all other repositories remaining in the Atom organization.
Thank you
GitHub and our community have benefited tremendously from those who have filed issues, created extensions, fixed bugs, and built new features on Atom. Atom played an integral part in many developers’ journeys, and we look forward to building and shaping the next chapter of software development together.
Due to the updated format of GitHub authentication tokens, GitHub Connect will no longer support instances running GitHub Enterprise Server (GHES) 3.1 or older after June 3, 2022. To continue using GitHub Connect, an upgrade to GHES 3.2 or newer will be required by June 3. GitHub Connect is necessary in order to use the latest features, such as Dependabot updates, license sync, GitHub.com Actions synchronization, and unified contributions.
In this post, I’m going to share how we’ve been utilizing the new projects experience across our team (from an engineer like myself all the way to our VPs and team leads). We love working so closely with developers to ship requested features and updates (all of which roll up into the Changelogs you see), and using the new projects helps us stay consistent in our shipping cadence.
How we think about shipping
Our core team consists of members of the product, engineering, design, and user research teams. We recognize that good ideas can come from anywhere. Our process is designed to inspire, surface, and implement those ideas, whether they come from users, individual contributors, managers, directors, or VPs. To get the proper alignment for this group, we’ve agreed on a few guiding principles that drive what our roadmap will look like:
The pitch: When it comes to what we’re going to work on (outside of the big pieces of work on our roadmap) people within our team can pitch ideas in our team’s repository for upcoming cycles (which we define as 6-8 weeks of work, inclusive of planning, engineering work, and an unstructured passion project week); these can be features, fixes, or even maintenance work. Every pitch must clearly state the problem it’s solving and why it’s important for us to prioritize. Some features that have come from this process include live updates, burn up charts for insights, and more. Note: these are all the changes you see as a developer, but we also have a lot of pitches come in from my fellow engineers focused around the developer experience. For example, a couple successful pitches have included reducing our CI time to 10 minutes, and streamlining our release process by switching to a ring deployment model and adding ChatOps.
In addition to using issues to propose and converse on pitches from the team, we use the new projects experience to track and manage all the pitches from the team so we can see them in an all-up table or board view.
Keep it small: We knew for ourselves, and for developers, that we didn’t want to lock them into a specific planning methodology and over-complicate a team’s planning and tracking process. For us, we wanted to plan shorter cycles for our team to increase our tempo and focus, so we opted for six-week cycles to break up and build features. Check out how we recommend getting started with this approach in a recent blog post.
Ship to learn: Similar to how we ship a lot of our products, we knew developers and customers were going to be heavily intertwined with each and every ship, giving us immediate feedback in both the private and public beta. Their feedback both influenced what we built and then how we iterated and continued to better the experience once something did ship. While there are so many people to thank, we’re extremely grateful for all our customers along the way for being our partners in building GitHub Issues into the place for developers to project plan.
How we used projects to do it
We love that the product we’re building doesn’t tool a specific project management methodology, but equips users with powerful primitives that they can compose into their preferred experiences and workflows. This allows for many people (not just us engineers) involved in building and developing products at GitHub (team leads, marketing, design, sales, etc.) the ability to use the product in a way that makes sense for them.
With the above principles in mind, once a pitch has been agreed upon to move forward on building, that pitch issue becomes a tracking issue in a project table or board that we convert into pieces of work that fit into an upcoming cycle. A great example of this was when we updated the GitHub Issues icons to lessen confusion among developers. This came in as a pitch from a designer on the team, and was soon accepted and moved into epic planning in which the team responsible began to track the individual pieces of work needed to make this happen.
IC approach
Let’s start with how my fellow engineers, individual contributors and I use projects for day-to-day development within cycles. From our perspective on any given day, we’re hyper-focused on tackling what issues and pull requests are assigned to us (fun fact: we recently added the assignee:me filter to make this even easier) in a given cycle, so we work from more individually scoped project tables or boards that stem from the larger epic and iteration tracking. Because of this, we can easily zoom out from our individual tasks to see how our work fits into a given cycle, and then even zoom out more into how it fits into larger initiatives.
In addition to scoping more specifically a given table or board, engineers across our organization utilize a personal project table or board to track all the things specific to themselves like what issues are assigned to them—even work not connected to a given cycle, like open source work.
EM approach
If we pull back to engineering managers overseeing those smaller cycles, they’re focused on kicking off an accepted pitch’s work, breaking it first into cycles and then into smaller iterations in which they can assign out work. A given cycle’s table or board view allows the managers to have a whole look at all members of their team and look specifically at things that are important to them, like all the pull requests that are open and quickly seeing which engineers are assigned, what pull requests have been merged, deployed, etc.
Check out what this looks like in our team board.
Team lead approach
Now, if we put ourselves in the shoes of our team leads and Directors/VPs, we see that they’re using the new projects experience to primarily get the full picture of where product and feature development currently sit. They told me the main team roadmap and backlog is where they can get questions answered like:
Which projects do we have in flight in which product area right now?
Who’s the key decision maker for this project?
Which engineers are working on which projects?
Which projects are at risk and need help (progress/status)?
What’s great about this is that they can quickly glance at what’s in motion and then click into any cycles or status to get more context on open issues, pull requests, and how everything is connected.
Outside of being able to check in on what’s being worked on and where the organization’s current focus is, our leads have found additional use cases that may not be applicable for an engineer like me. They use private projects for more sensitive tasks, like managing our team’s hiring, tracking upcoming start dates, making sure they’re staying on top of career development, organizational change management, and more.
Wrap-up
This is how we as the planning and tracking team at GitHub are using the very product we’re building for you to build the new projects experience. There are many other teams across GitHub that utilize the new project tables and boards, but we hope this gives you a little bit of inspiration about how to think about project planning on GitHub and how to optimize for all the stakeholders involved in building and shipping products.
What’s great about project planning on GitHub is that our focus on powerful primitives approach to project management means that there is an unlimited amount of flexibility for you and your team to play around with, and likely many, many ways we haven’t even thought about how to use the product. So, please let us know how you’re using it and how we can improve the experience!
Understanding your supply chain is critical to maintaining the security of your software. Dependabot already alerts you when vulnerabilities are found in your existing dependencies, but what if you add a new dependency with a vulnerability? With the dependency review action, you can proactively block pull requests that introduce dependencies with known vulnerabilities.
How it works
The GitHub Action automates finding and blocking vulnerabilities that are currently only displayed in the rich diff of a pull request. When you add the dependency review action to your repository, it will scan your pull requests for dependency changes. Then, it will check the GitHub Advisory Database to see if any of the new dependencies have existing vulnerabilities. If they do, the action will raise an error so that you can see which dependency has a vulnerability and implement the fix with the contextual intelligence provided. The action is supported by a new API endpoint that diffs the dependencies between any two revisions.
The action can be found on GitHub Marketplace and in your repository’s Actions tab under the Security heading. It is available for all public repositories, as well as private repositories that have Github Advanced Security licensed.
We’re continuously improving the experience
While we’re currently in public beta, we’ll be adding functionality for you to have more control over what causes the action to fail and can set criteria on the vulnerability severity, license type, or other factors We’re also improving how failed action runs are surfaced in the UI and increasing flexibility around when it’s executed.
If you have feedback or questions
We’re very keen to hear any and all feedback! Pop into the feedback discussion, and let us know how the new action is working for you, and how you’d like to see it grow.
Even before we officially released GitHub Actions in 2018, we were already using it to automate all kinds of things behind the scenes at GitHub. If you don’t already know, GitHub Actions brings platform-native automation and CI/CD that responds to any webhook event on GitHub (you can learn more in this article). We’ve seen some incredible GitHub Actions from open source communities and enterprise companies alike with more than 12,000 community-built actions in the GitHub Marketplace.
Now, we want to share a few ways we use GitHub Actions to build GitHub. Let’s dive in.
In short, it’s fair to say our Security Lab team is busy. And it shouldn’t surprise you to know that they’re using GitHub Actions to automate their workflows, tests, and project management processes.
One particularly interesting way our Security Lab team uses GitHub Actions is to automate a number of processes related to reporting vulnerabilities to open source projects. They also use actions to automate processes related to the CodeQL bug bounty program, but I’ll focus on the vulnerability reporting here.
Any GitHub employee who discovers a vulnerability in an open source project can report it via the Security Lab. We help them to create a vulnerability report, take care of reporting it to the project maintainer, and track the fix and the disclosure.
To start this process, we created an issue form template that GitHub employees can use to report a vulnerability:
A screenshot of an Issue template GitHub employees use to report vulnerabilities.
The issue form triggers an action that automatically generates a report template (with details such as the reporter’s name that is filled out automatically). We ask the vulnerability reporter to enter the URL of a private repository, which is where the report template will be created (as an issue), so that the details of the vulnerability can be discussed confidentially.
Every vulnerability report is assigned a unique ID, such as GHSL-2021-1001. The action generates these unique IDs automatically and adds them to the report template. We generate the unique IDs by creating empty issues in a special-purpose repository and use the issue numbers as the IDs. This is a great improvement over our previous system, which involved using a shared spreadsheet to generate GHSL IDs and introduced a lot more potential for error due to having to manually fill out the template.
For most people, reporting a vulnerability is not something that they do every day. The issue form and automatically-generated report template help to guide the reporter, so that they give the Security Lab all the information they need when they report the issue to the maintainer.
2. Automating large-scale regression testing of CodeQL implementation changes
CodeQL plays a big part in keeping the software ecosystem secure—both as a tool we use internally to bolster our own platform security and as a freely available tool for open source communities, companies, and developers to use.
If you’re not familiar, CodeQL is a semantic code analysis engine that enables developers to query code as if it were data. This makes it easier to find vulnerabilities across a codebase and create reusable queries (or leverage queries that others have developed).
The CodeQL Team at GitHub leverages a lot of automation in their day-to-day workflows. Yet one of the most interesting applications they use GitHub Actions for is large-scale regression testing of CodeQL implementation changes. In addition to recurring nightly experiments, most CodeQL pull requests also use custom experiments for investigating the CodeQL performance and output changes a merge would result in.
The typical experiment runs the standard github/codeql-action queries on a curated set of open source projects, recording performance and output metrics to perform comparisons that answers questions such as “how much faster does my optimization make the queries?” and “does my query improvement produce new security alerts?”
Let me repeat that for emphasis: They’ve built an entire regression testing system on GitHub Actions. To do this, they use two kinds of GitHub Actions workflows:
One-off, dynamically-generated workflows that run the github/codeql-action on individual open source projects. These workflows are similar to what codeql-action users would write manually, but also contain additional code that collects data for the experiments.
Periodically run workflows that generate and trigger the above workflows for any ongoing experiments and later compose the resulting data into digestible reports.
The elasticity of GitHub Actions is crucial for making the entire system work, both in terms of compute and storage. Experiments on hundreds of projects trivially parallelize to hundreds of on-demand action runners, causing even large experiments to finish quickly, while the storage of large experiment outputs is handled transparently through workflow artifacts.
Several other GitHub features are used to make the experiments accessible to the engineers through a single platform with the two most visible being:
Issues: The status of every experiment is tracked through an ordinary GitHub issue that is updated automatically by a workflow. Upon completion of the experiment, the relevant engineers are notified. This enables easy discussions of experiment outcomes, and also enables cross-referencing experiments and any associated pull requests.
Rich content: Detailed reports for the changes observed in an experiment are presented as ordinary markdown files in a GitHub repository that can easily be viewed through a browser.
And while this isn’t exactly a typical use case for GitHub Actions, it illustrates how flexible it is—and how much you can do with it. After all, most organizations have dedicated infrastructure to perform regression testing at the scale we do. At GitHub, we’re able to use our own products to solve the problem in a non-standard way.
3. Bringing CI/CD to the GitHub Mobile Team
Every week, the GitHub Mobile Team updates our mobile app with new features, bug fixes, and improvements. Additionally, GitHub Actions plays an integral role in their release process, helping to deliver release candidates to our more than 8,000 beta testers.
Our Mobile team is comparatively small compared to other teams at GitHub, so automating any number of processes is incredibly impactful. It lets them focus more on building code and new features, and removes repetitive tasks that otherwise would take hours to manually process each week.
That means they’ve thought a good deal about how to best leverage GitHub Actions to save the most amount of time possible when building and releasing GitHub Mobile updates.
This chart below shows all the steps included in building and delivering a mobile app update. The gray steps are automated, while the blue steps are manually orchestrated. The automated steps include running a shell command, creating a branch, opening a pull request, creating an issue and GitHub release, and assigning a developer.
A workflow diagram of GitHub’s release process with automated steps represented in gray and manual steps represented in green.
Another thing our team focused on was to make it possible for anyone to be a release captain. By making a computer do things that a human might have to learn or be trained on, makes it easier for any of our engineers to know what to do to get a new version of GitHub Mobile out to users.
This is a great example of CI/CD in action at GitHub. It also shows firsthand what GitHub Actions does best: automating workflows to let developers focus more on coding and less on repetitive tasks.
Of course, we also use GitHub Actions to automate a bunch of non-technical tasks, like spinning up status updates and sending automated notifications on chat applications.
After talking with some of our internal teams, I wanted to showcase some of my favorite internal examples I’ve seen of Hubbers using GitHub Actions to streamline their workflows (and have a bit of fun, too).
Share company updates to GitHub’s intranet
Our Intranet team uses GitHub Actions to add updates to our intranet whenever changes are made to a specified directory. In practice, this means that anyone at GitHub with the right permissions can share messages with the company by adding a file to a repository. This then triggers a GitHub Actions workflow that turns that file into a public-facing message that’s shared to our intranet and automatically to a Slack channel.
Create weekly reports on program status updates
At GitHub, we have technical program management teams that are responsible for making sure the trains arrive on time and things get built and shipped. Part of their job includes building out weekly status reports for visibility into development projects, including progress, anticipated timelines, and potential blockers. To speed up this process, our technical program teams use GitHub Actions to automate the compilation of all of their individual reports into an all-up program status dashboard.
Turn weekly team photos into GIFs and upload to README
Here’s a fun one for you: Our Ecosystem Applications team built a custom GitHub Actions workflow that combines team photos they take at their weekly meetings and turns it into a GIF. And if that wasn’t enough, that same workflow also automatically uploads that GIF to their team README. In the words of our Senior Engineer, Jake Wilkins, “I’m not sure when or why we started taking team photos, but when we got access to GitHub Actions it was an obvious thing to do.”
Start automating your workflows with GitHub Actions
Today, the ability to prebuild codespaces is entering public beta. Prebuilding a codespace enables fast environment creation times, regardless of the size or complexity of your repositories. A prebuilt codespace will serve as a “ready-to-go” template where your source code, editor extensions, project dependencies, commands, and configurations have already been downloaded, installed, and applied so that you don’t have to wait for these tasks to finish each time you create a new codespace.
Getting to public beta
Our primary goal with Codespaces is to provide a one-click onboarding solution that enables developers to get started on a project quickly without performing any manual setup. However, because a codespace needs to clone your repository and (optionally) build a custom Dockerfile, install project dependencies and editor extensions, initialize scripts, and so on in order to bootstrap the development environment, there can be significant variability in the startup times that developers actually experience. A lot of this depends on the repository size and the complexity of a configuration.
Prebuilds were a huge part of how we meaningfully reduced the time-to-bootstrap in Codespaces for our core GitHub.com codebase. With that, our next mission was to replicate this success and enable the experience for our customers. Over the past few months, we ran a private preview for prebuilds with approximately 50 organizations. Overall, we received positive feedback on the ability of prebuilds to improve productivity for teams working on complex projects. At the same time, we also received a ton of valuable feedback around the configuration and management of prebuilds, and we’re excited to share those improvements with you today:
You can now identify and quickly get started with a fast create experience by selecting machine types that have a “prebuild ready” tag.
A seamless configuration experience helps repository admins easily set up and manage prebuild configurations for different branches and regions.
To reduce the burden on repository admins around managing Action version updates for each prebuilt branch, we introduced support for GitHub Actions workflows that will be managed by the Codespaces service.
Prebuild configurations are now built on GitHub Actions virtual machines. This enables faster prebuild template creations for each push made to your repository, and also provides repository admins with access to a rich set of logs to help with efficient debugging in case failures occur.
Our goal is to keep iterating on this experience based on the feedback captured during public beta and to continue our mission of enabling a seamless developer onboarding experience.
So how do prebuilds work?
During public beta, repository admins will be able to create prebuild configurations for specific branches and region(s) in their repository.
Prebuild configurations will automatically trigger an associated GitHub Actions workflow, managed by the Codespaces service, that will take care of prebuilding the devcontainer configuration and any subsequent commits for that branch. Associated prebuild templates will be stored in blob storage for each of the selected regions.
Each workflow will provide a rich set of logs to help with debugging in case failures occur.
Every time you request a prebuilt codespace, the service will fetch a prebuilt template and attach it to an existing virtual machine, thus significantly reducing your codespace creation time. To request changes to the prebuild configuration for your branch as per your needs, you can always update its associated devcontainer configuration with a pull request, specifically using the onCreateCommand or updateContentCommand lifecycle scripts.
How to get started
Prebuilds are available to try in public beta for all organizations that are a part of GitHub Enterprise Cloud and Team plans. As an organization or repository admin, you can head over to your repository’s settings page and create prebuild configurations under the “Codespaces” tab. As a developer, you can create a prebuilt codespace by heading over to a prebuild-enabled branch in your repository and selecting a machine type that has the “prebuild ready” label on it.
If you have any feedback to help improve this experience, be sure to post it on our discussions forum.
The collective thoughts of the interwebz
Manage Consent
To provide the best experiences, we use technologies like cookies to store and/or access device information. Consenting to these technologies will allow us to process data such as browsing behavior or unique IDs on this site. Not consenting or withdrawing consent, may adversely affect certain features and functions.
Functional
Always active
The technical storage or access is strictly necessary for the legitimate purpose of enabling the use of a specific service explicitly requested by the subscriber or user, or for the sole purpose of carrying out the transmission of a communication over an electronic communications network.
Preferences
The technical storage or access is necessary for the legitimate purpose of storing preferences that are not requested by the subscriber or user.
Statistics
The technical storage or access that is used exclusively for statistical purposes.The technical storage or access that is used exclusively for anonymous statistical purposes. Without a subpoena, voluntary compliance on the part of your Internet Service Provider, or additional records from a third party, information stored or retrieved for this purpose alone cannot usually be used to identify you.
Marketing
The technical storage or access is required to create user profiles to send advertising, or to track the user on a website or across several websites for similar marketing purposes.

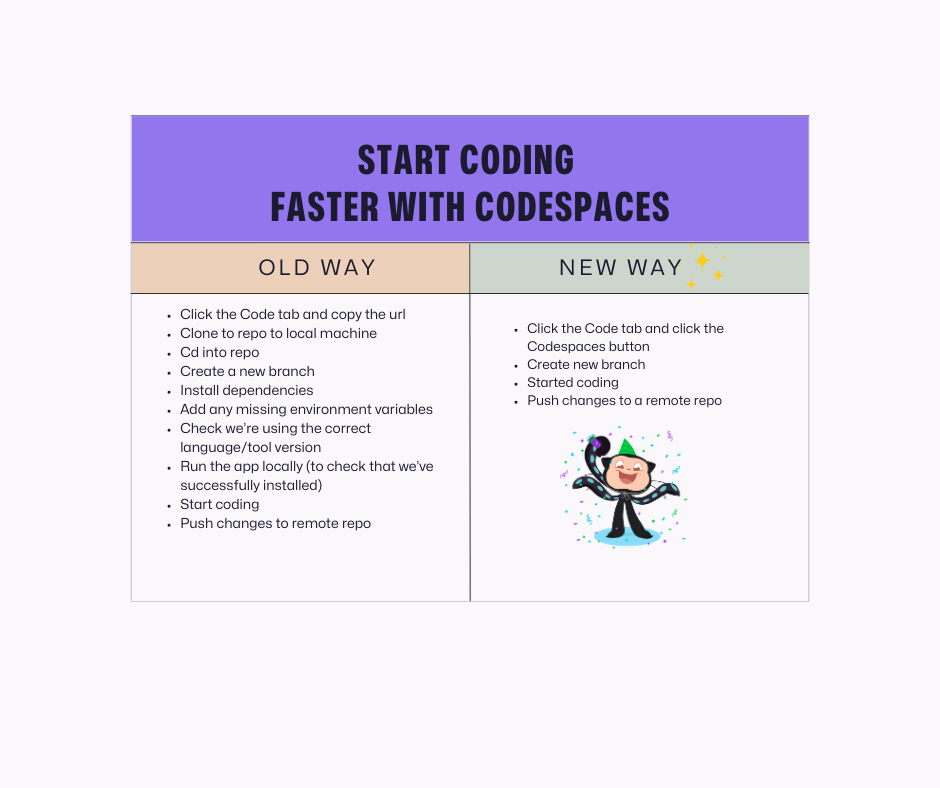


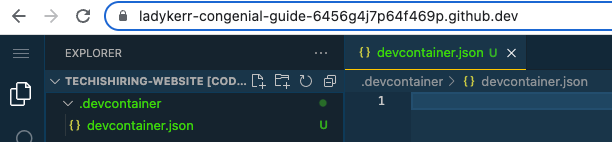
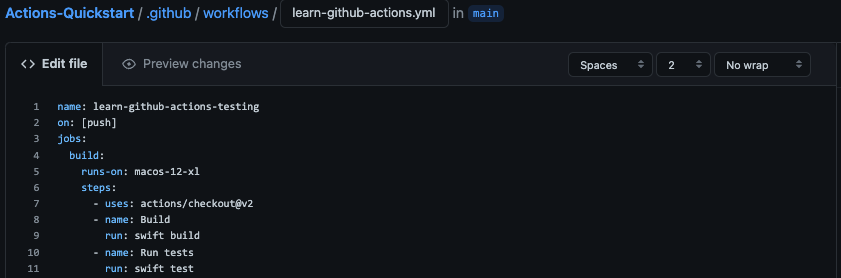


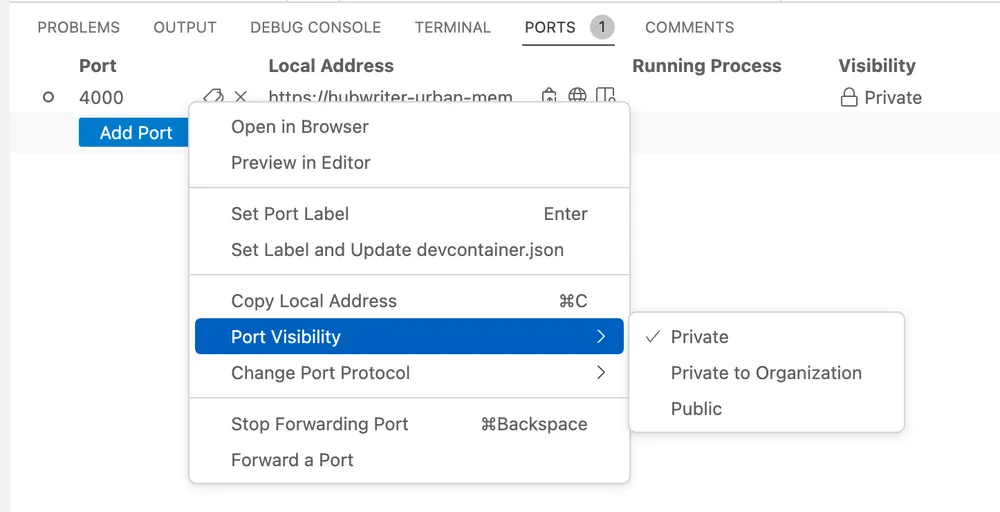
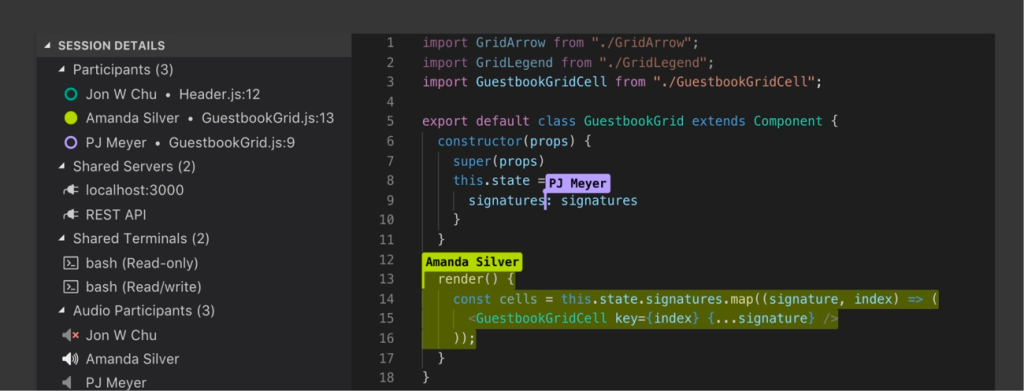


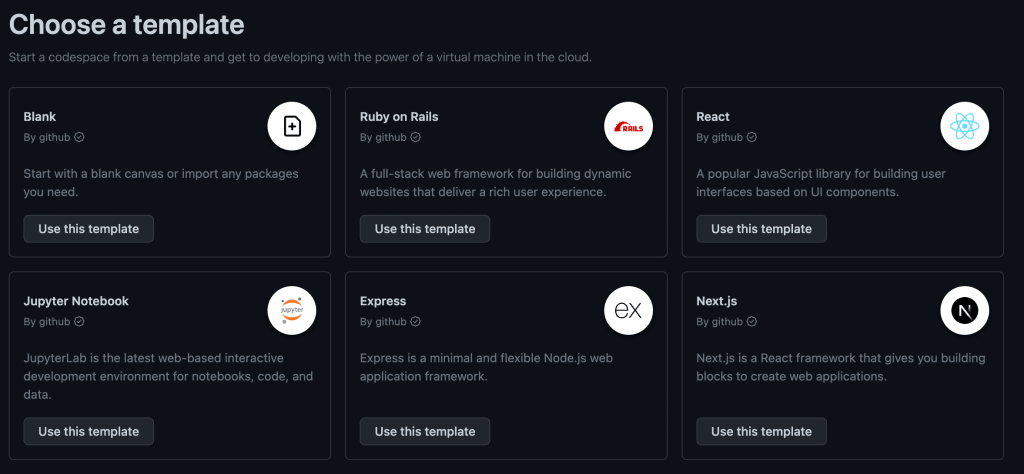

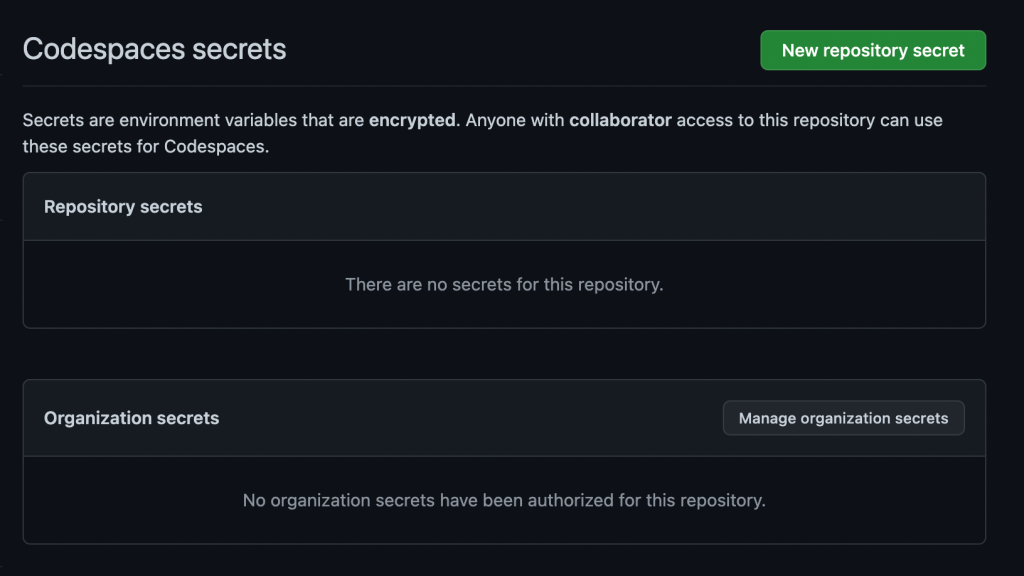


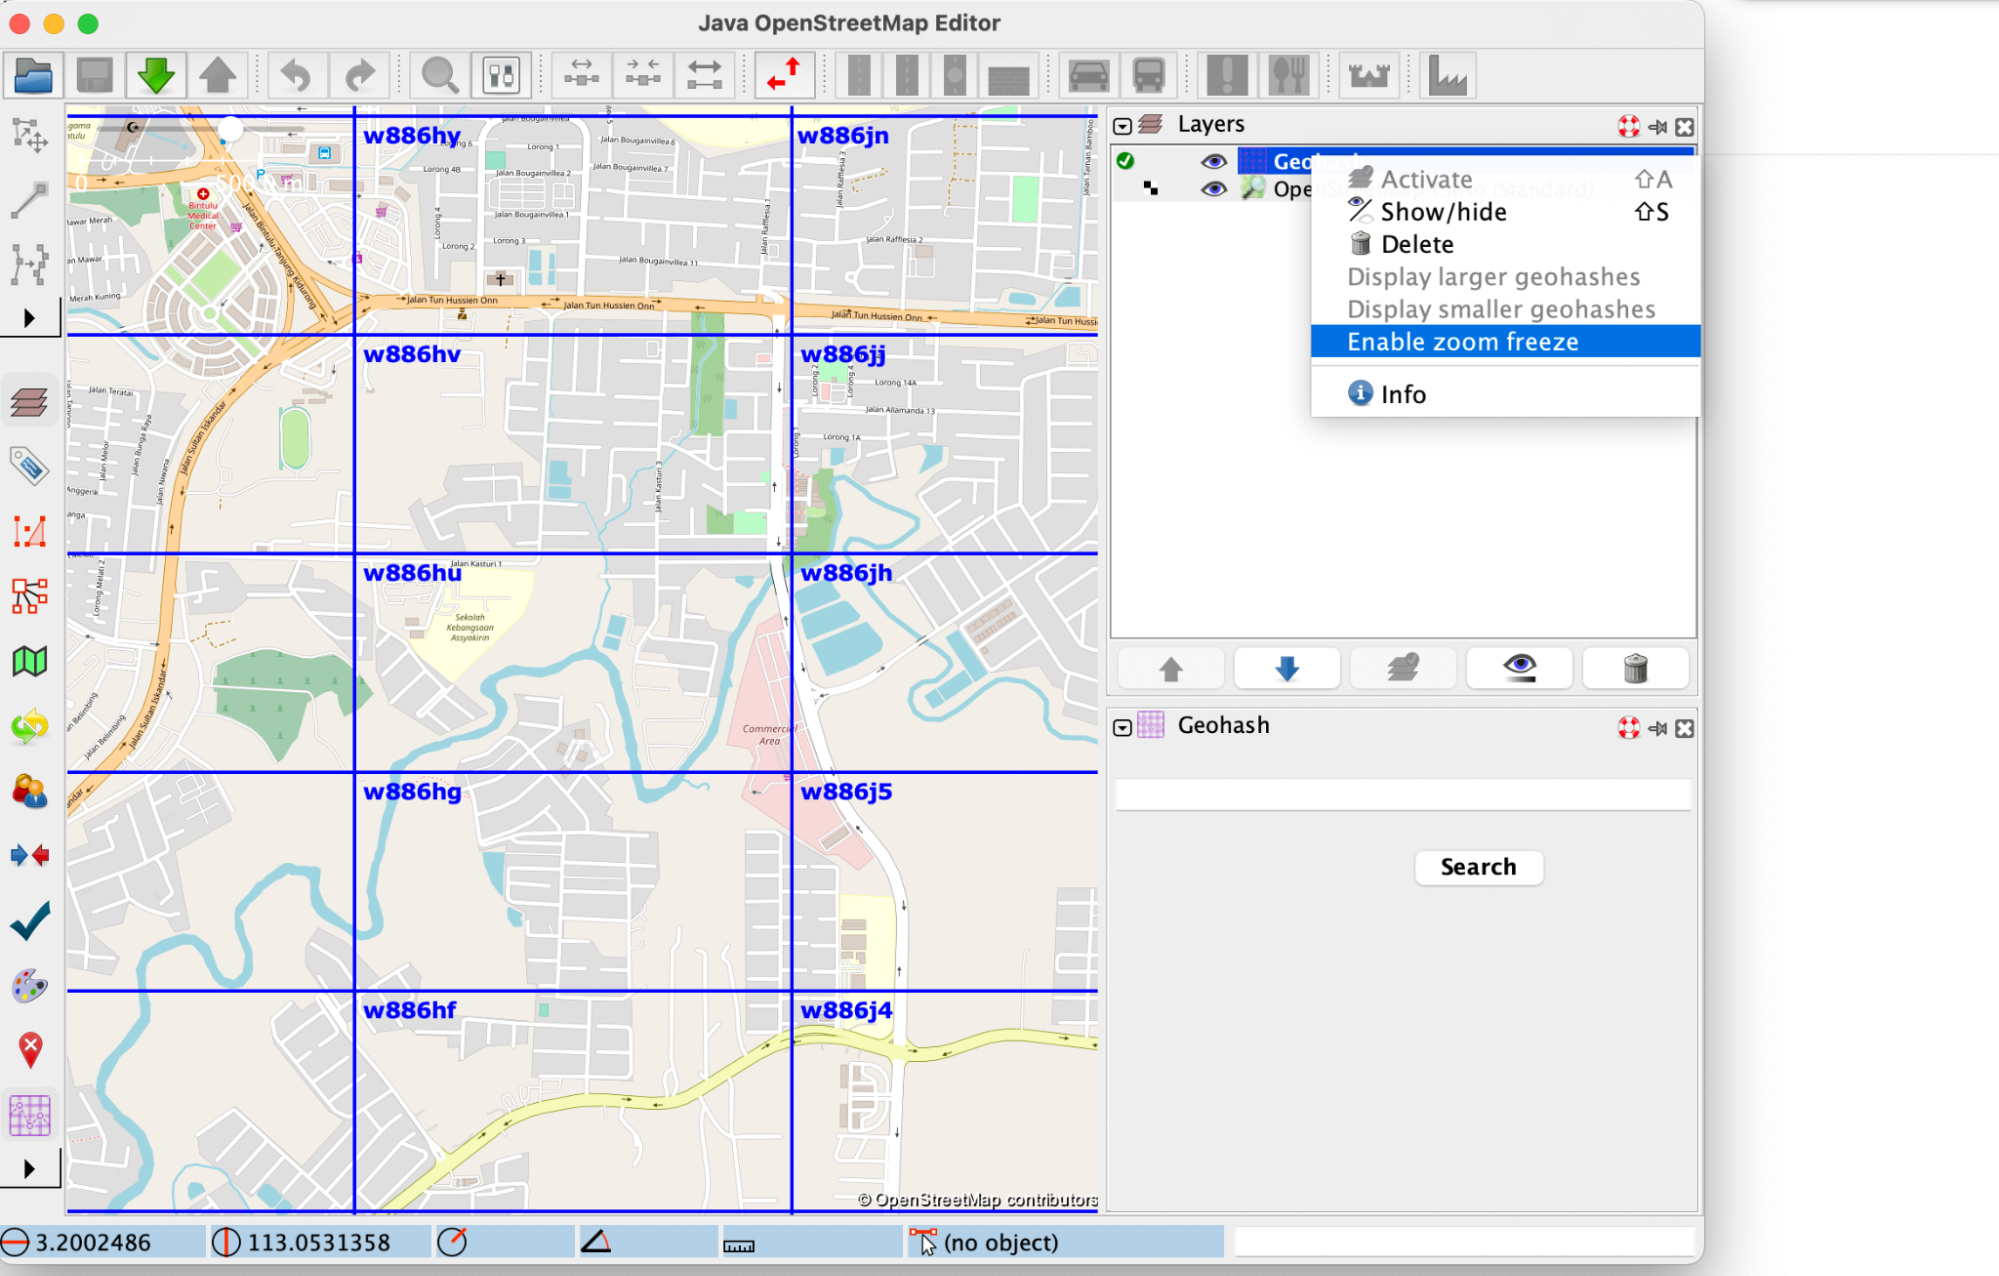
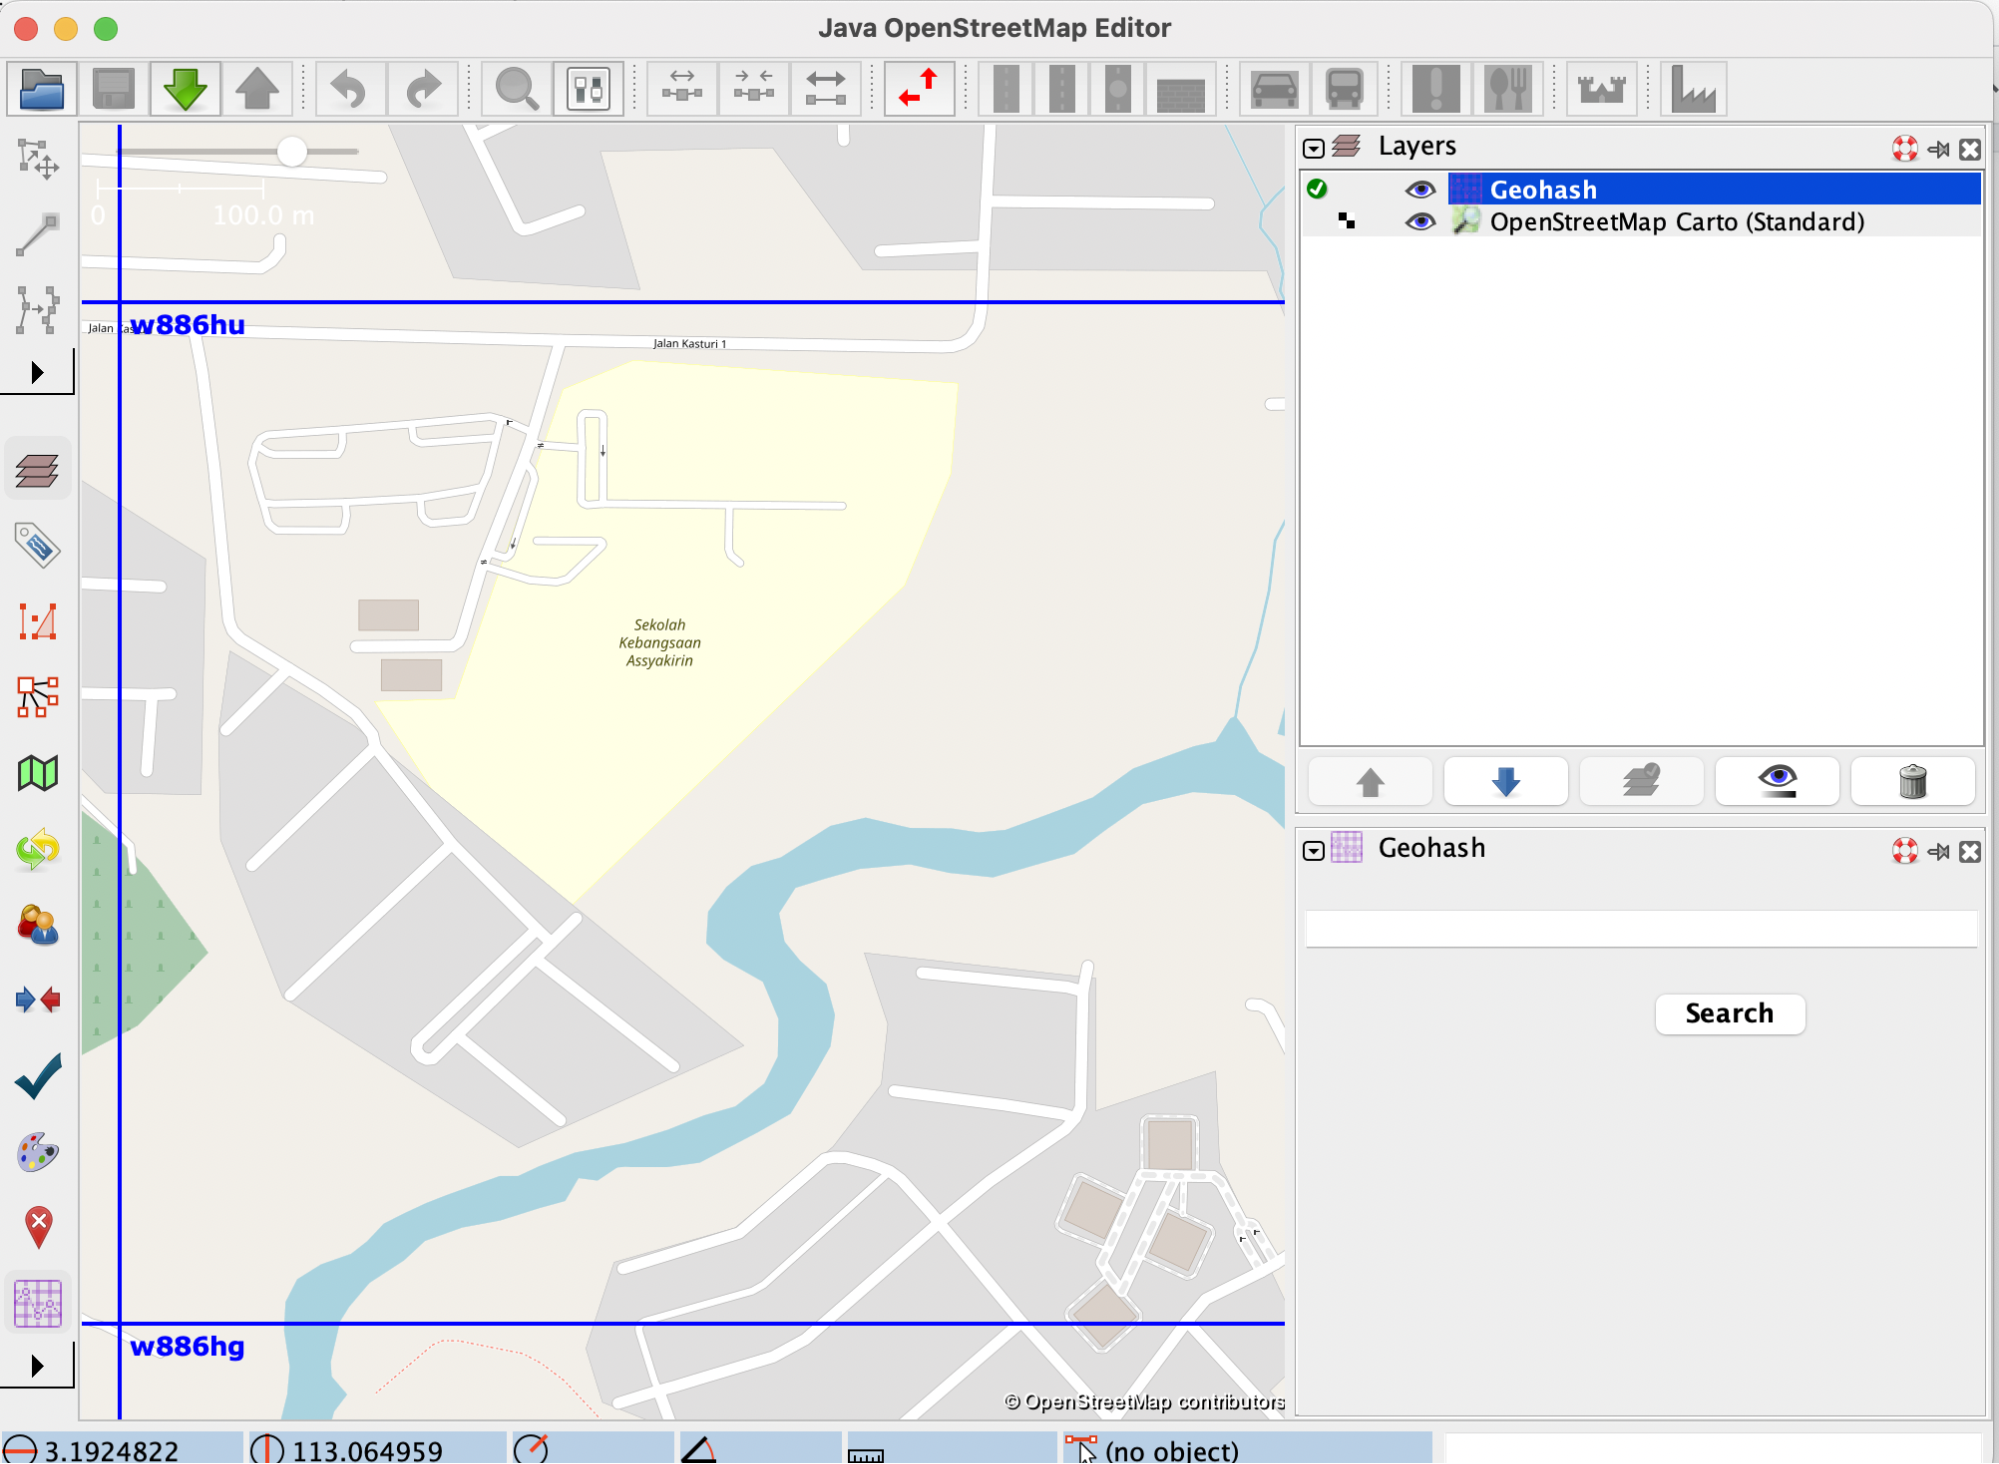
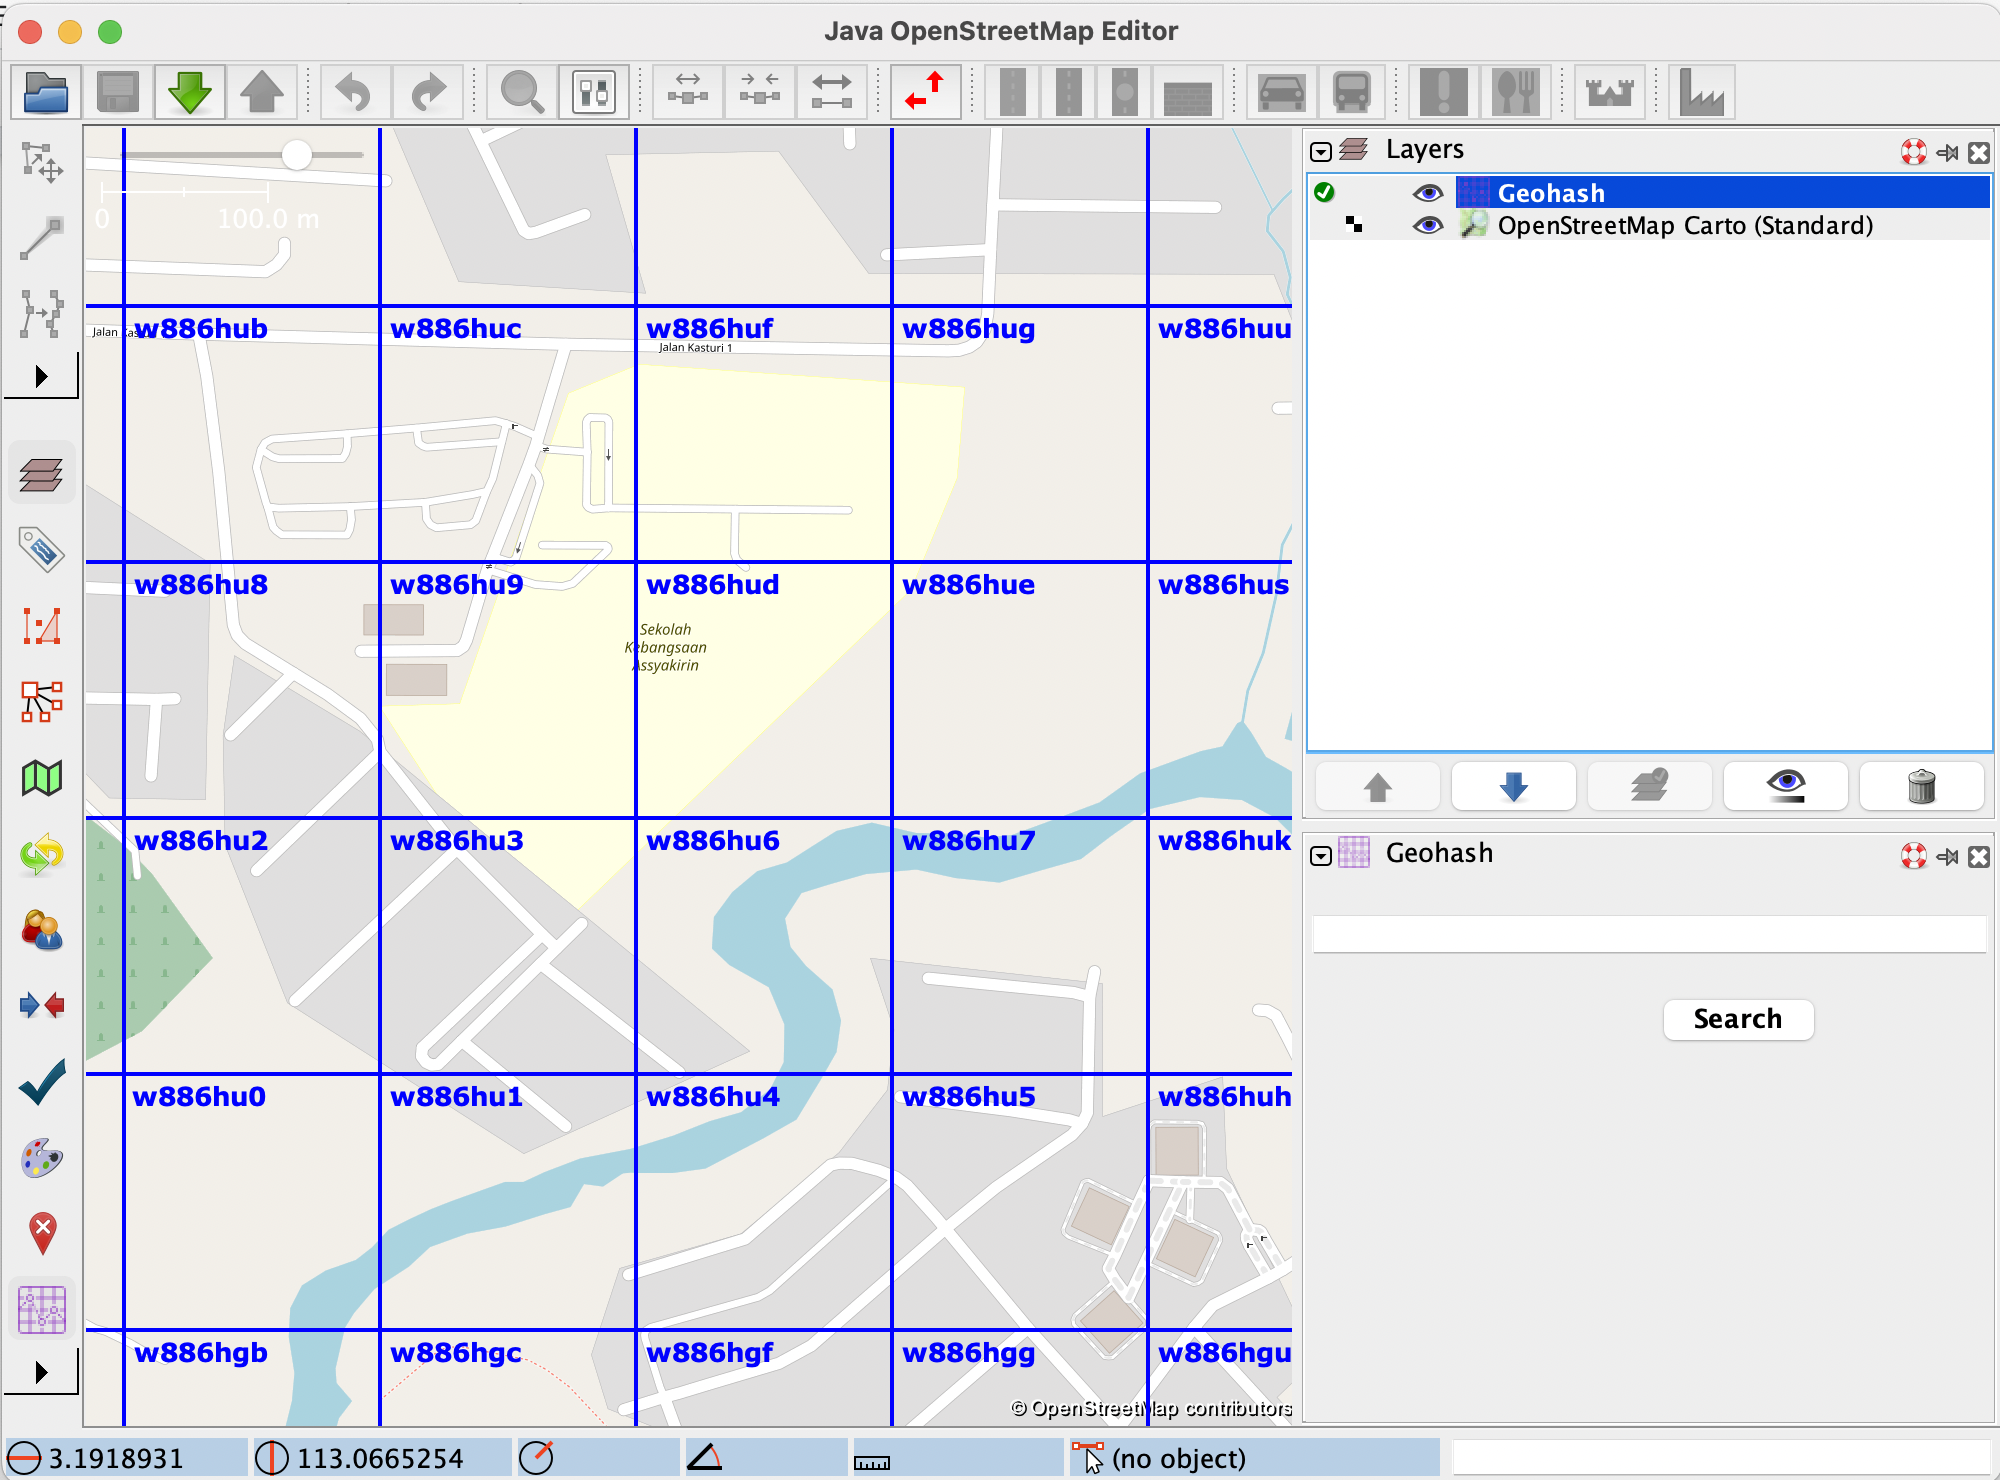
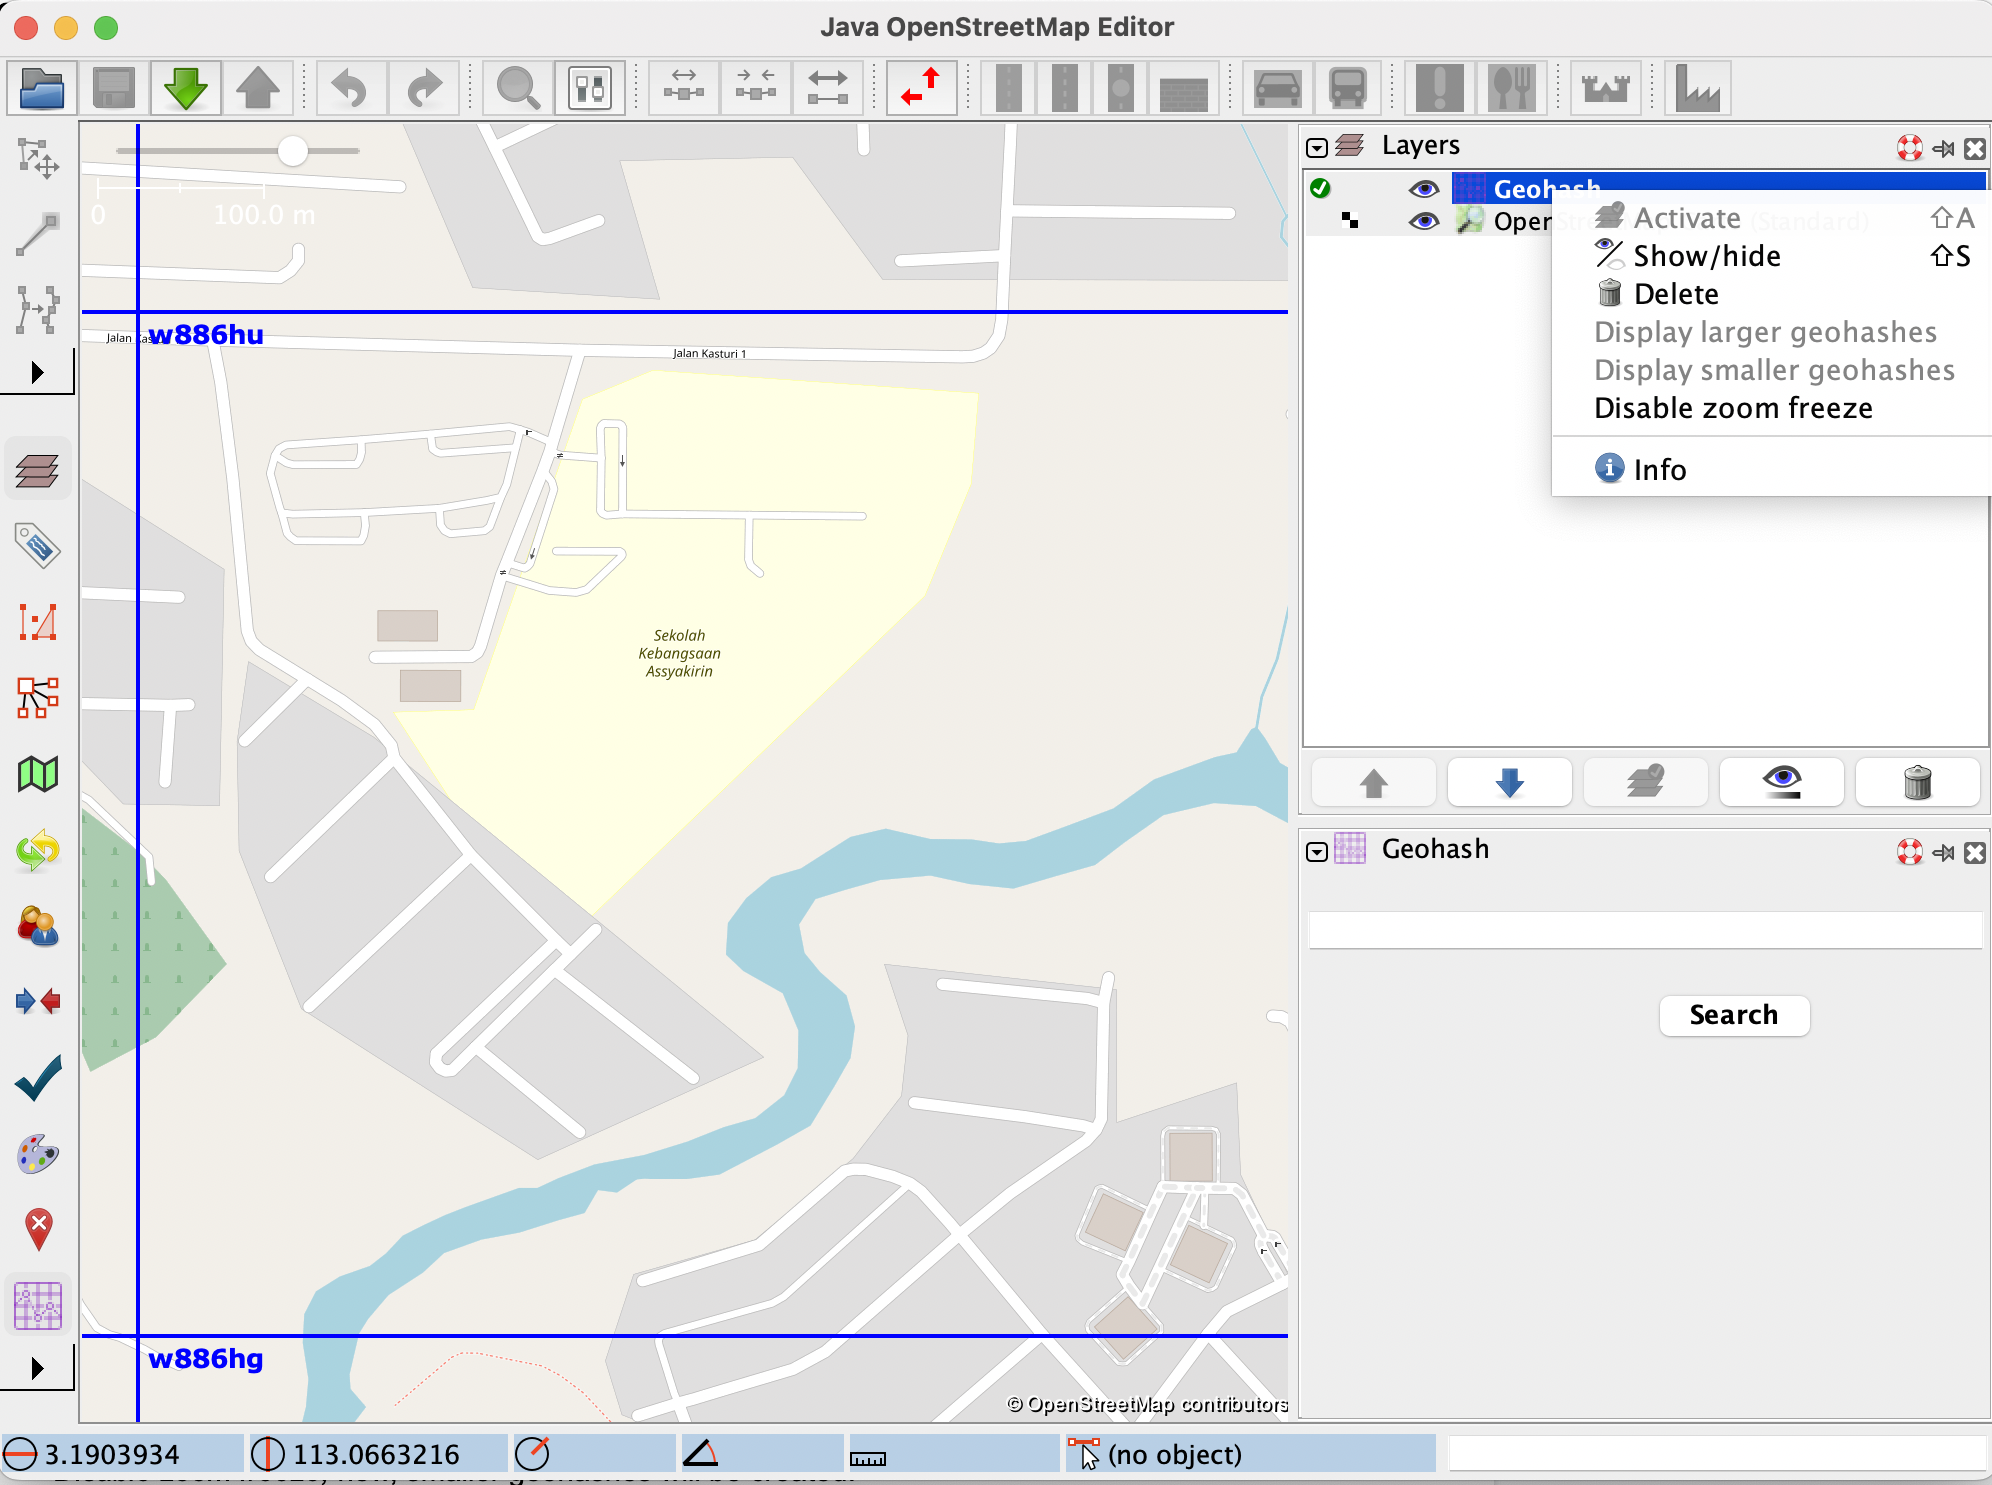
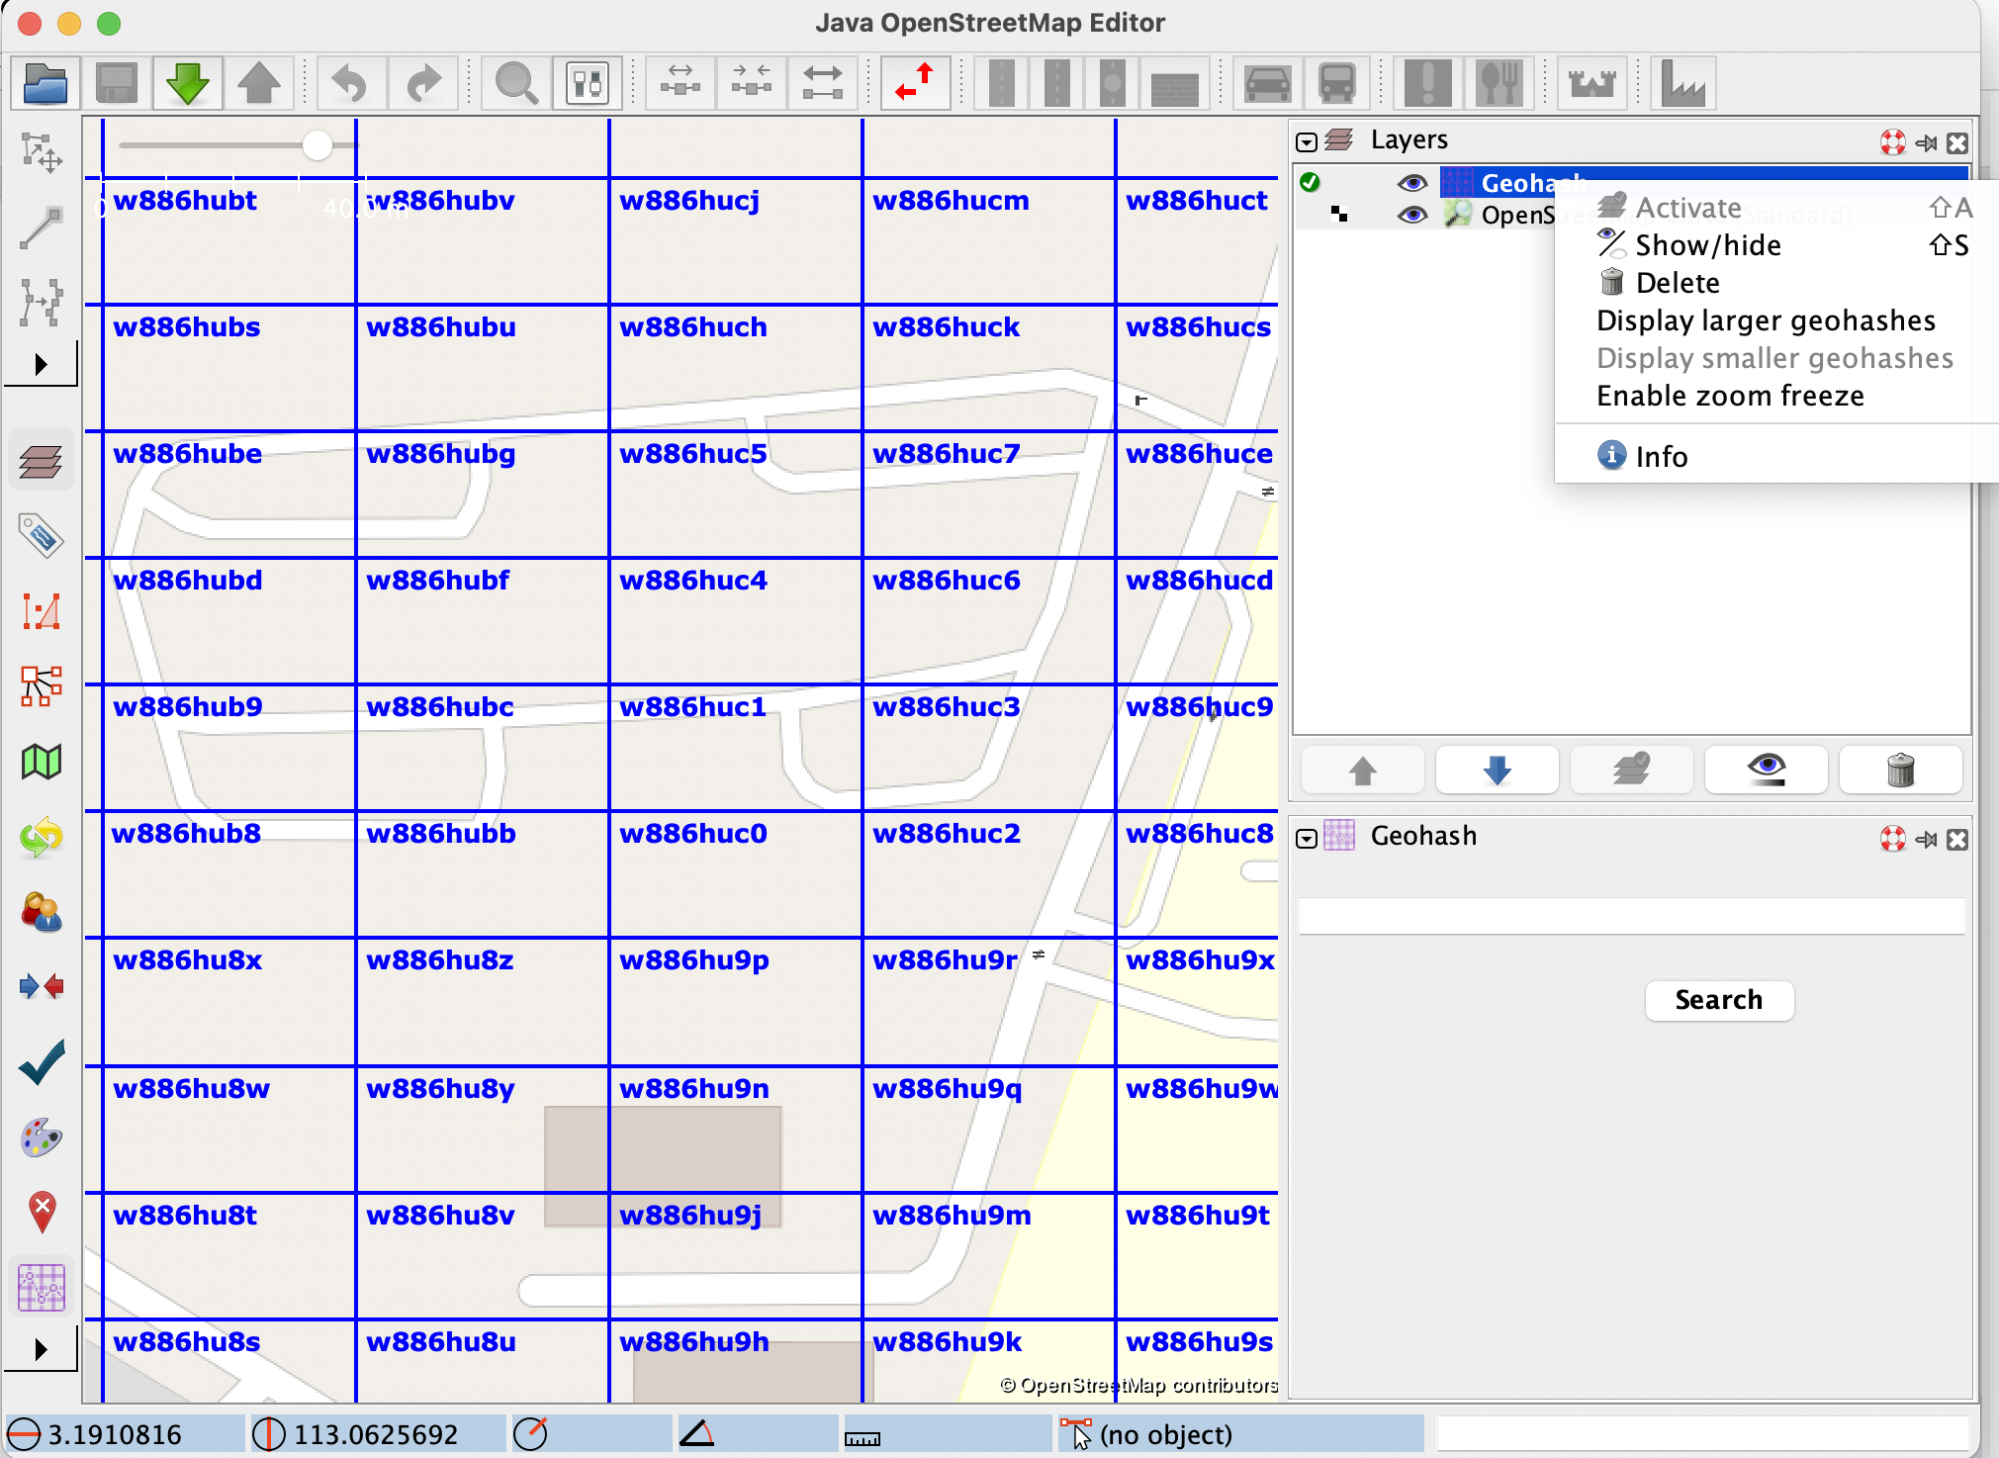
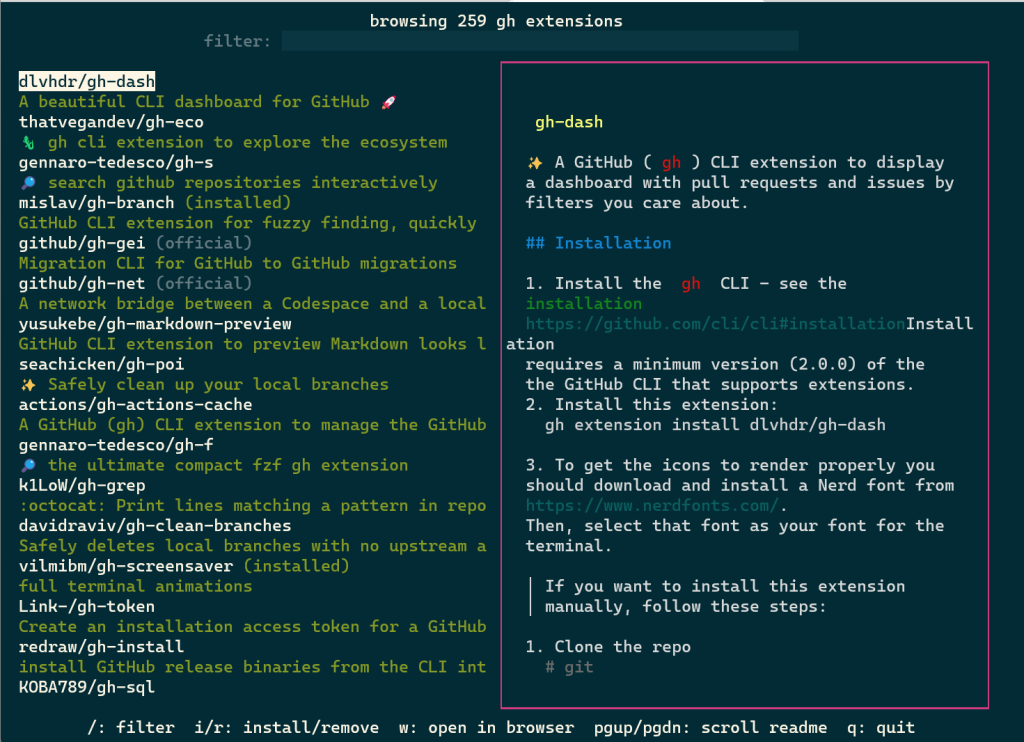
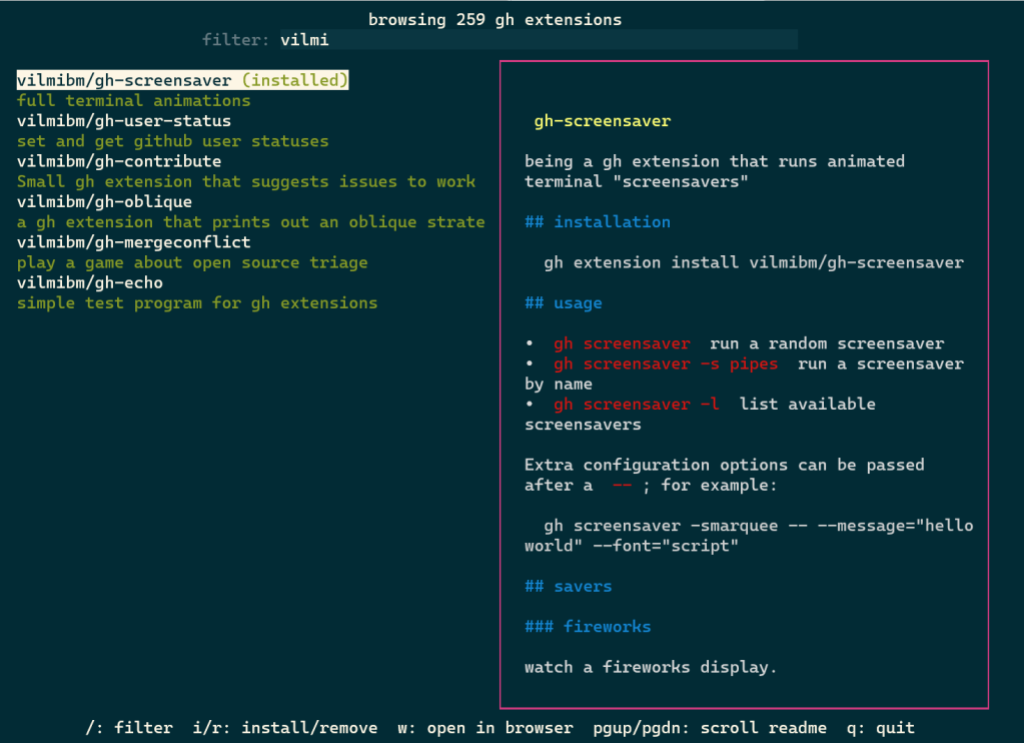
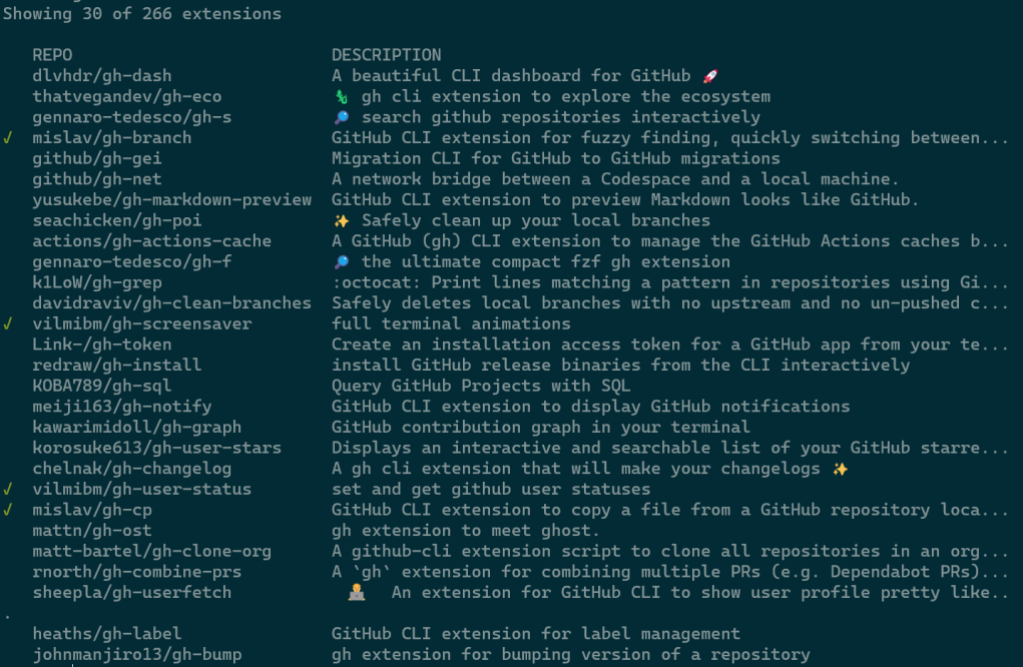
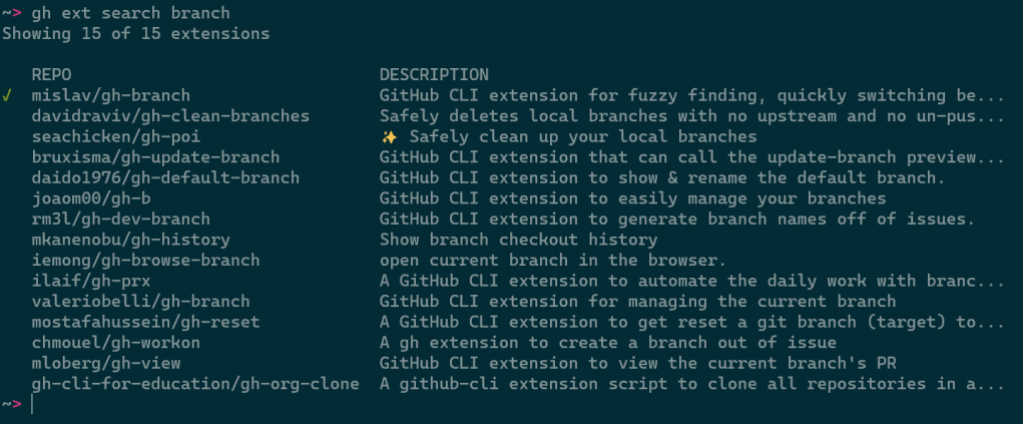
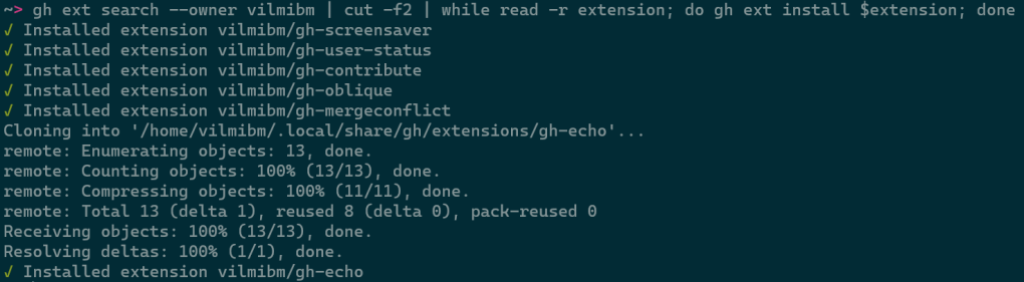

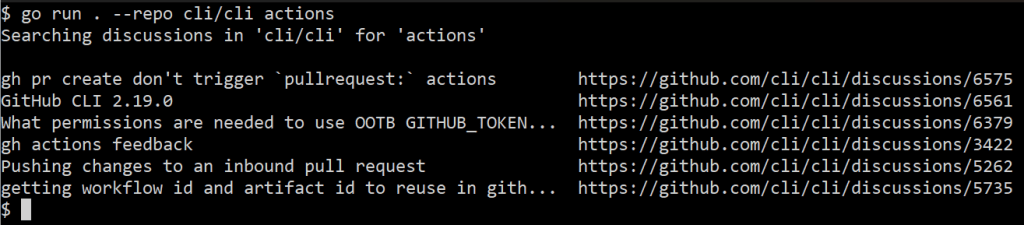
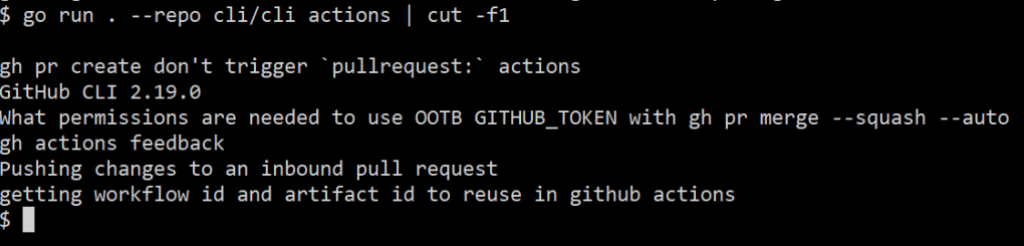
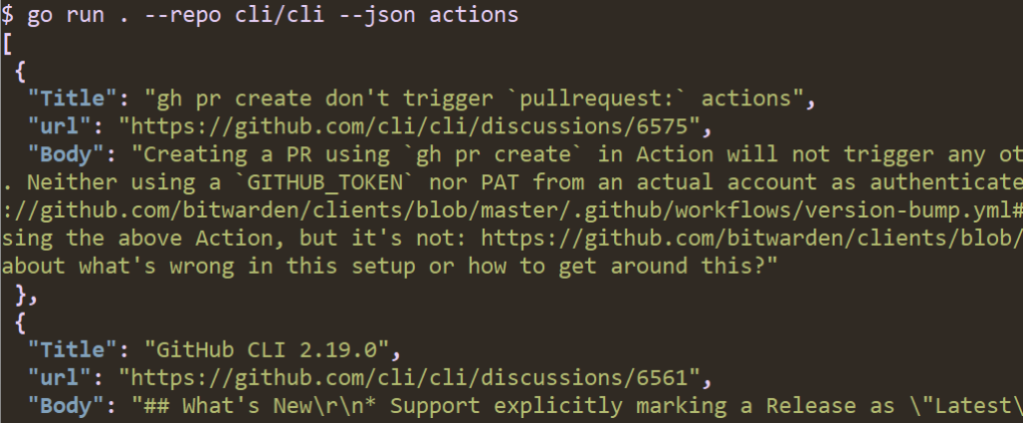
![A screenshot of running "go run . --repo cli/cli --json --jq '.[]|.Title' actions" in a terminal. The output is a list of discussion thread titles.](https://github.blog/wp-content/uploads/2023/01/image6.png?w=1024&resize=1024%2C212)
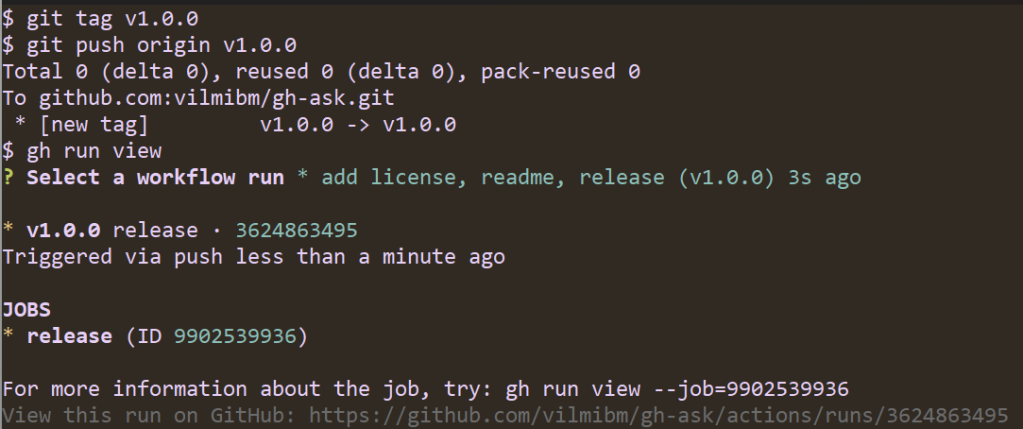
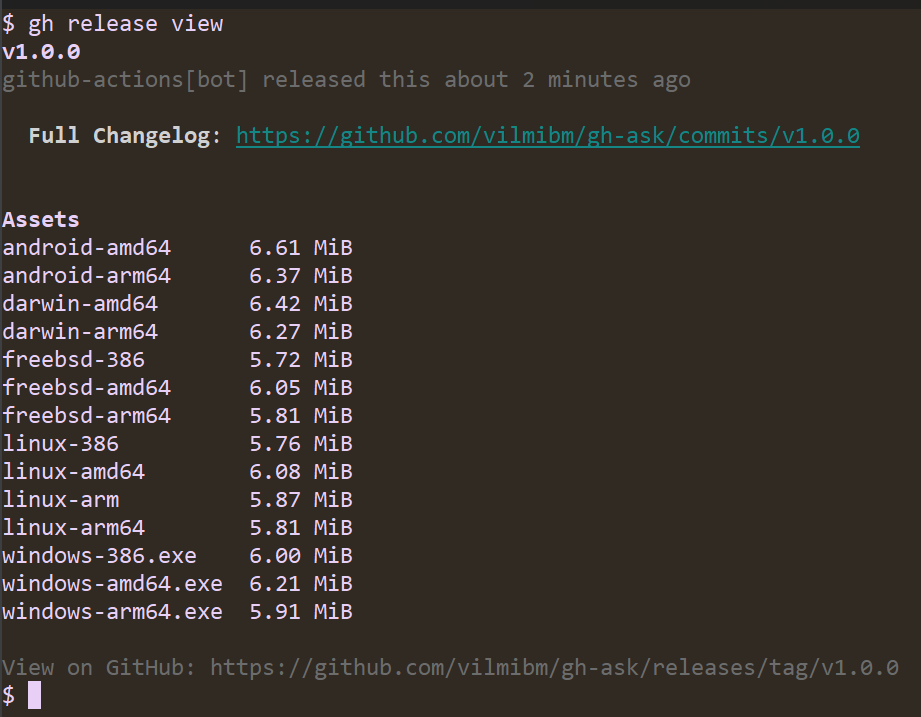
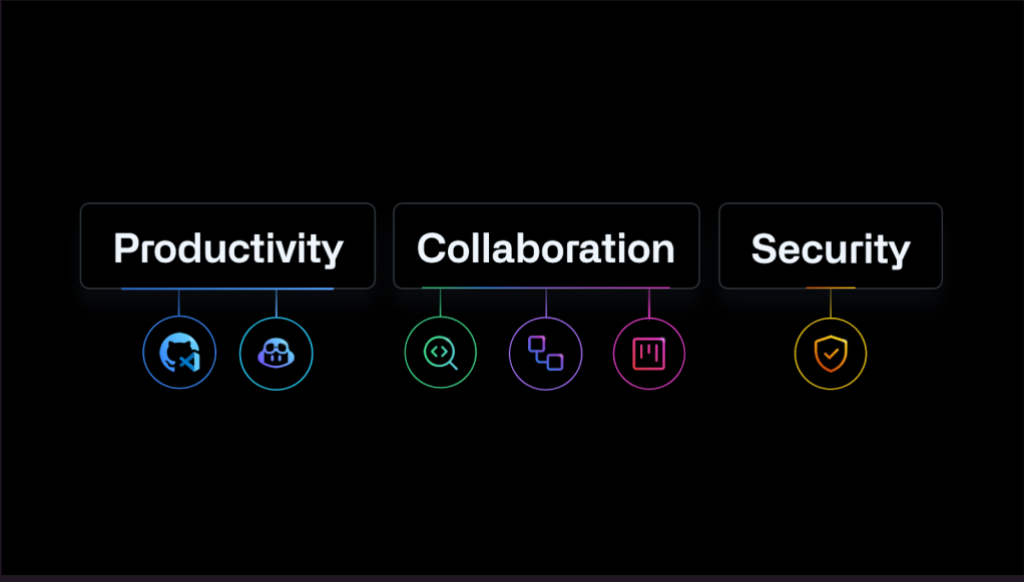
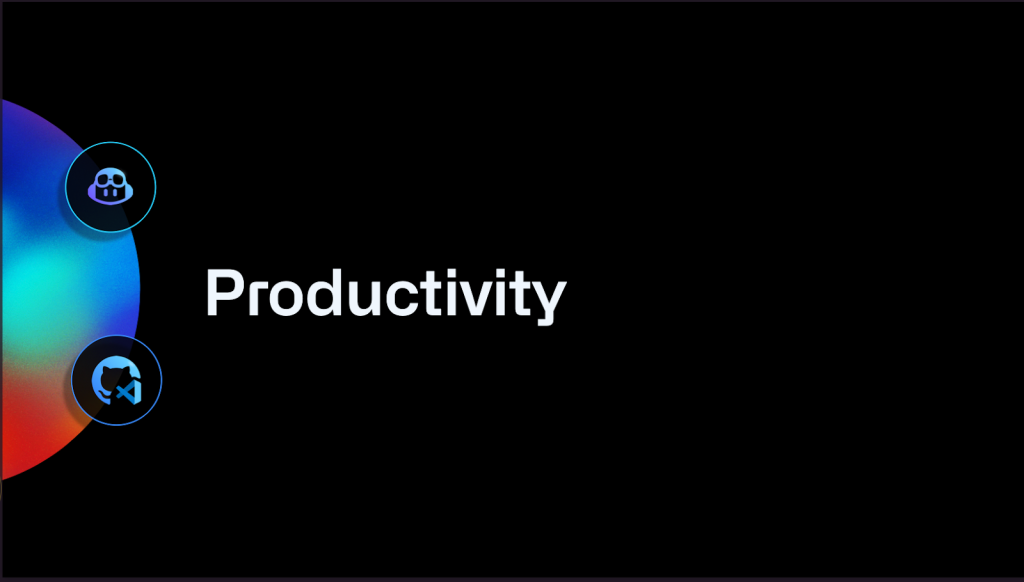
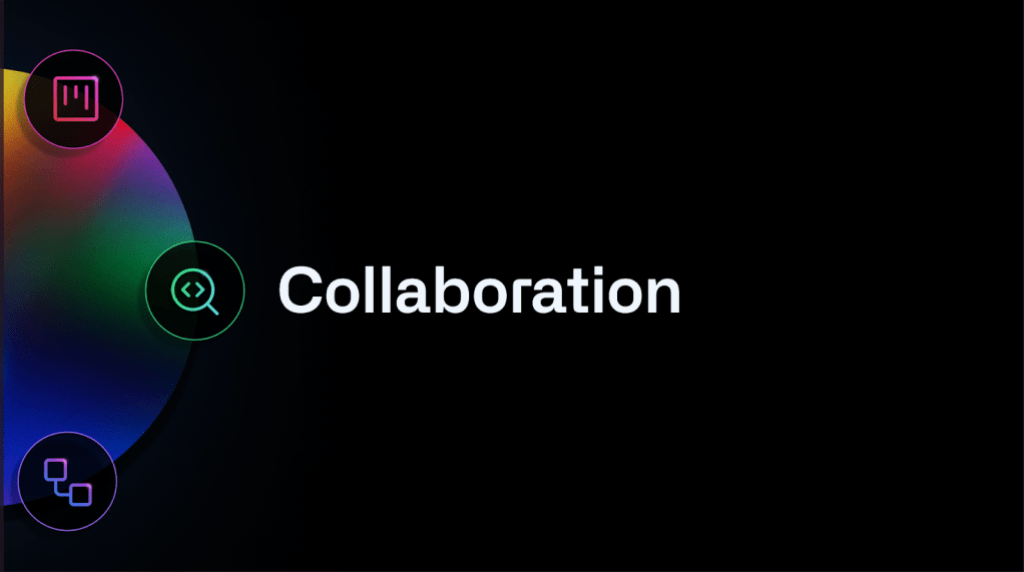

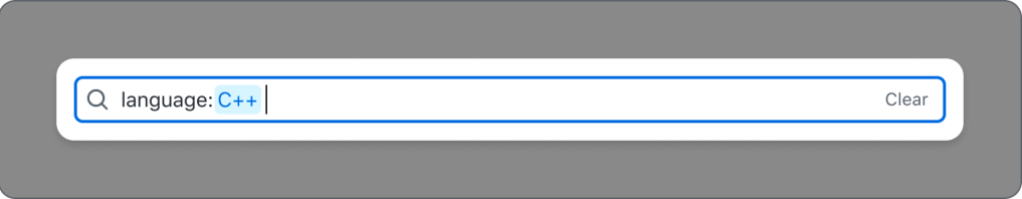
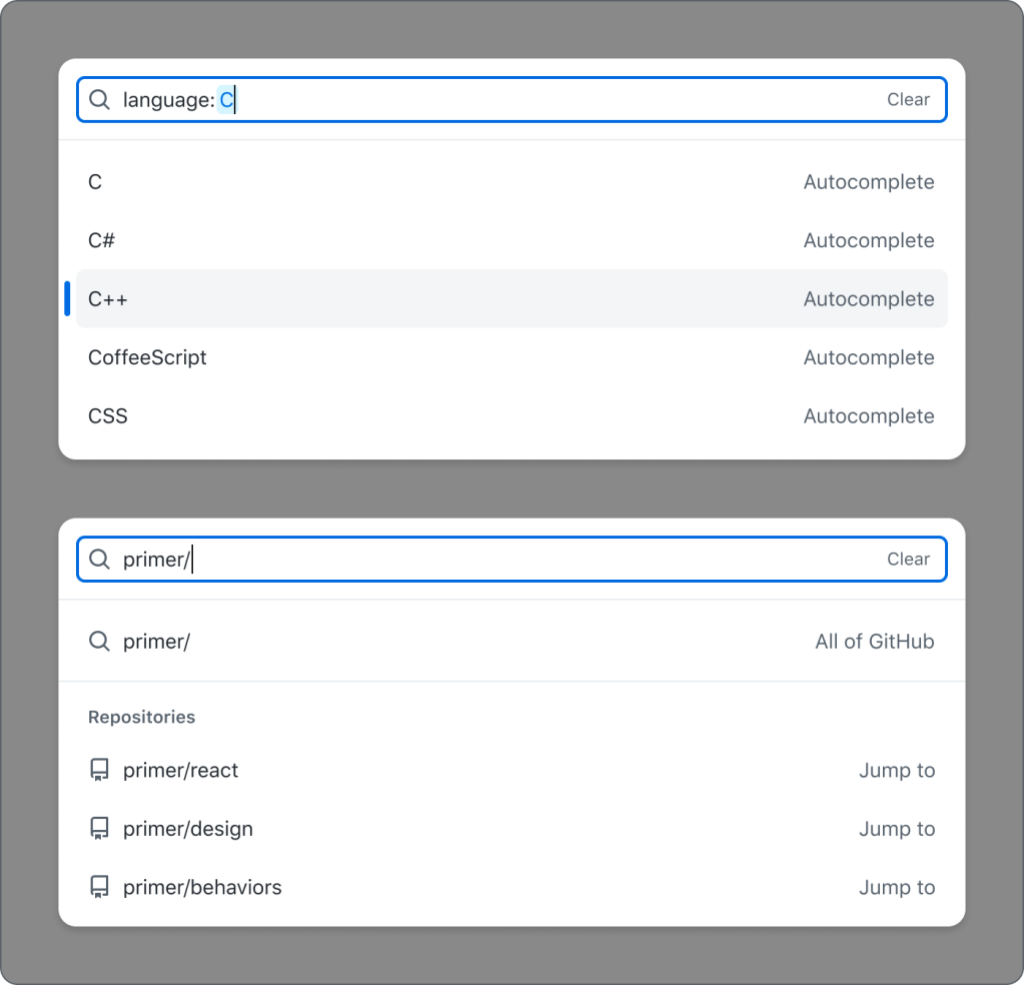
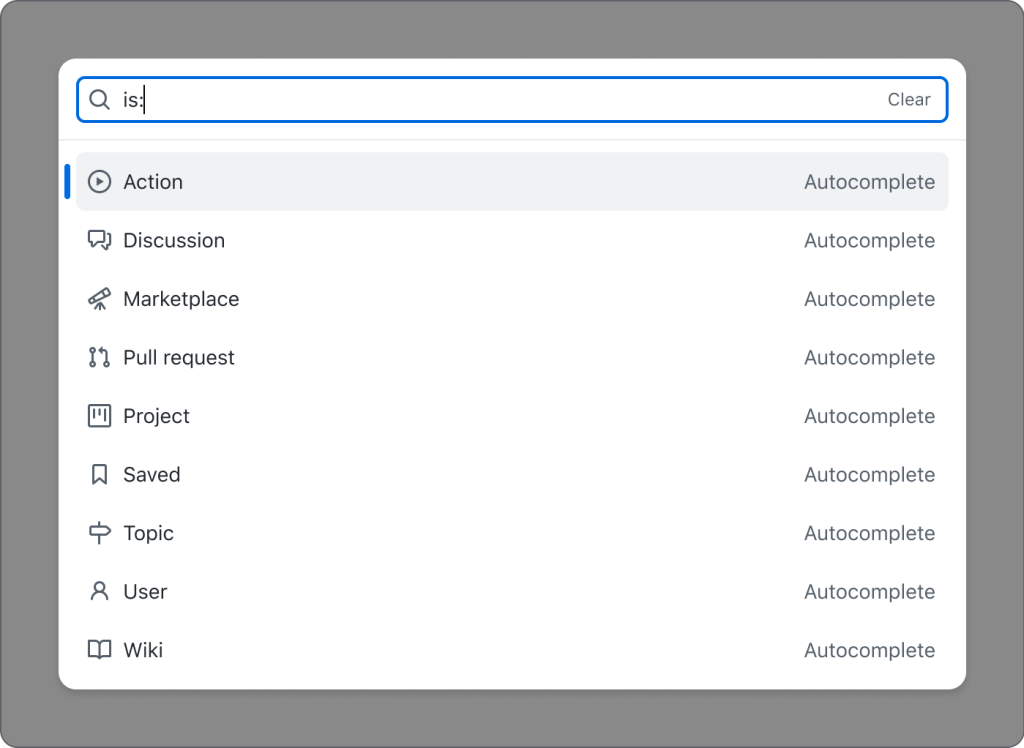
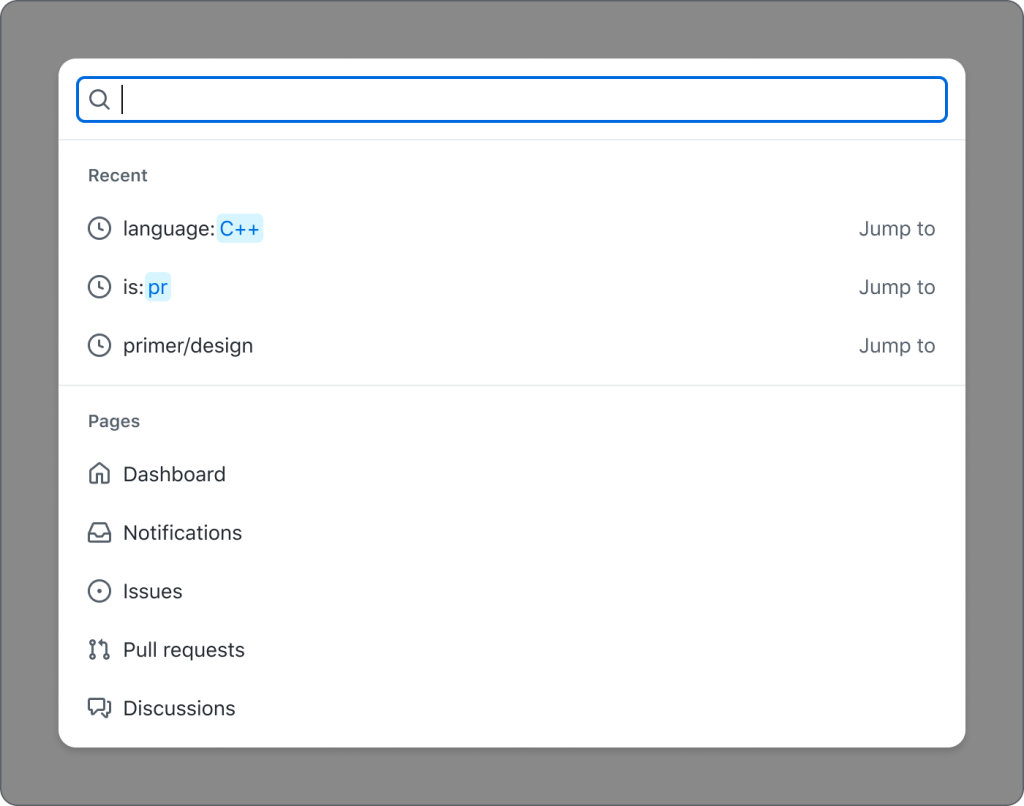
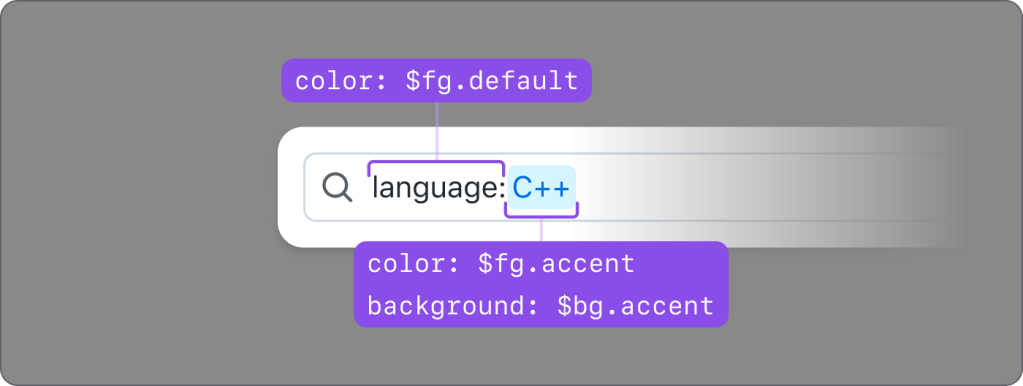
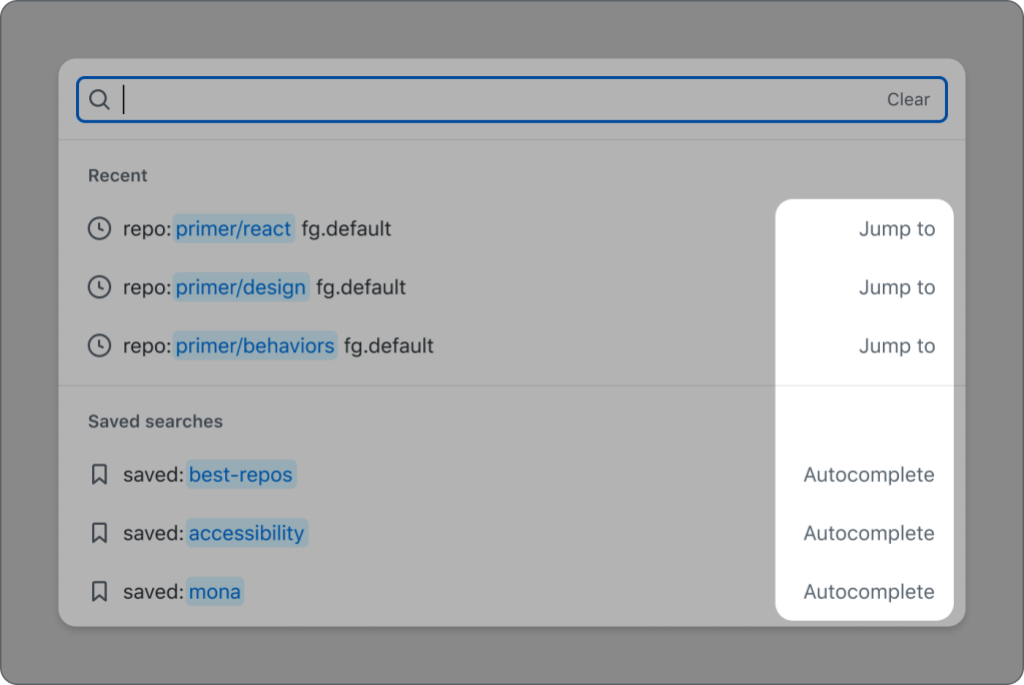
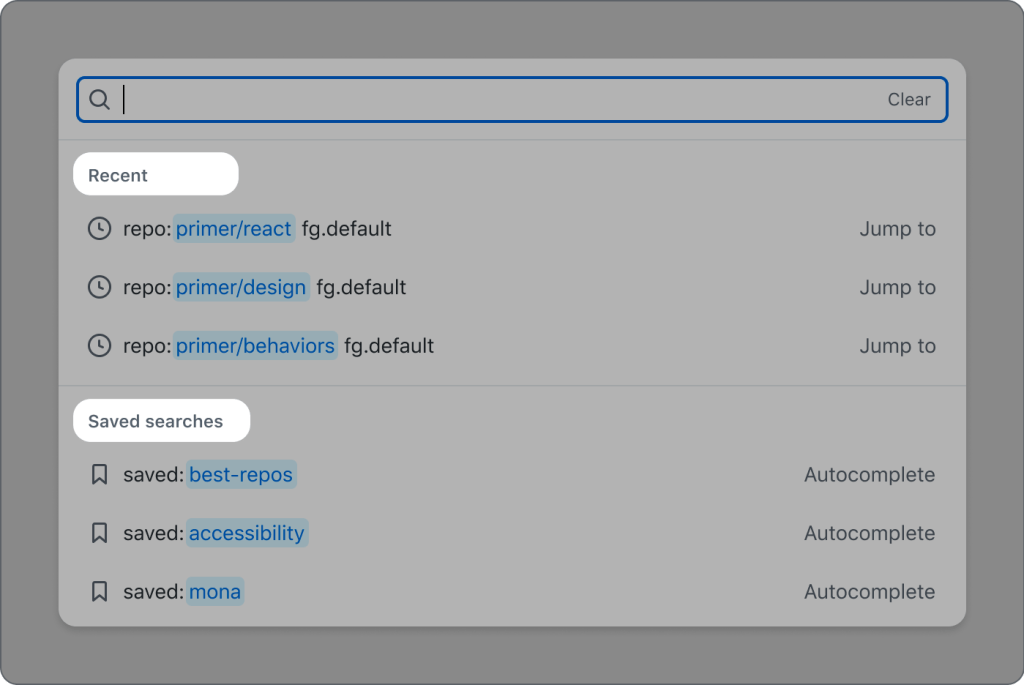
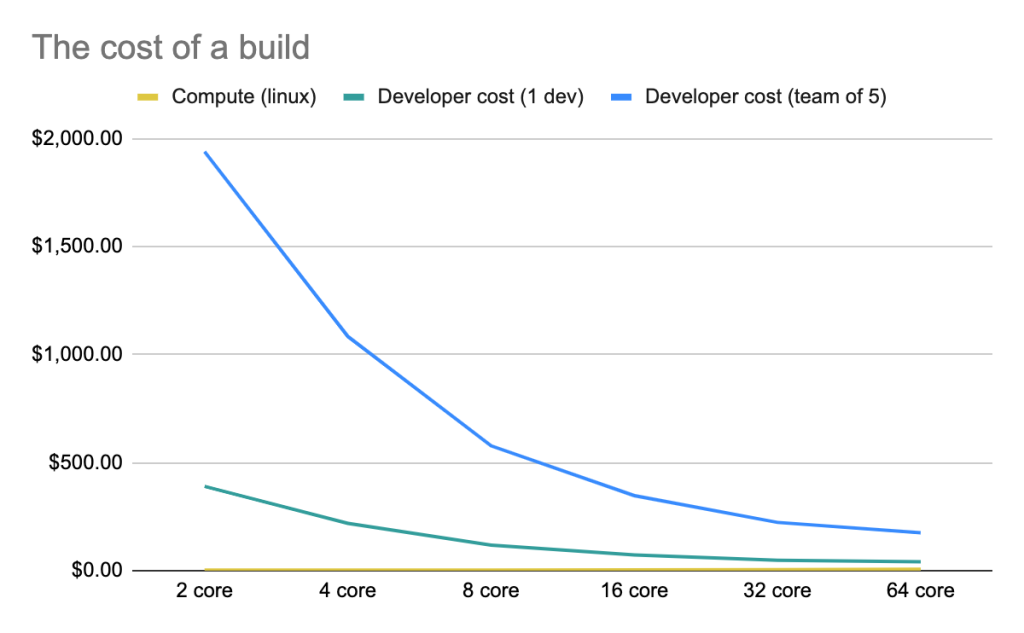
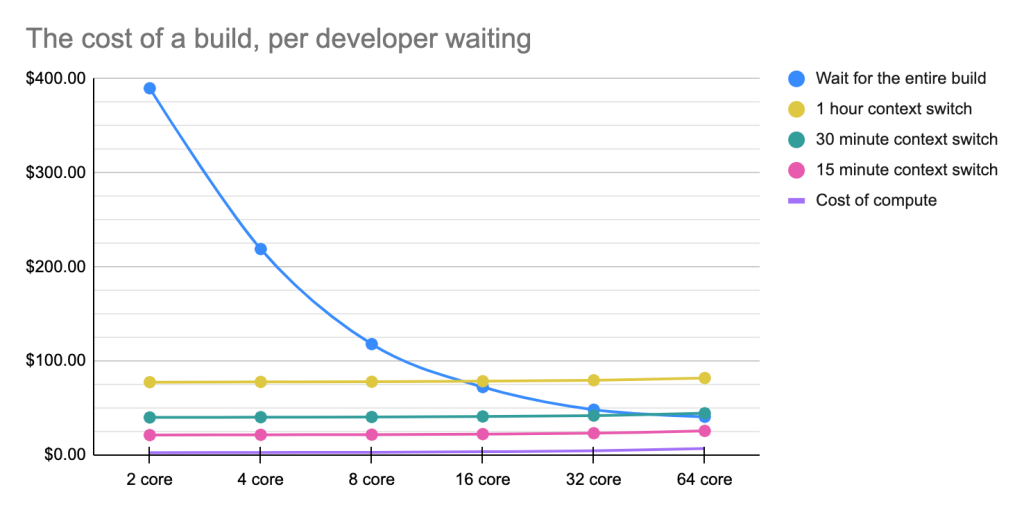

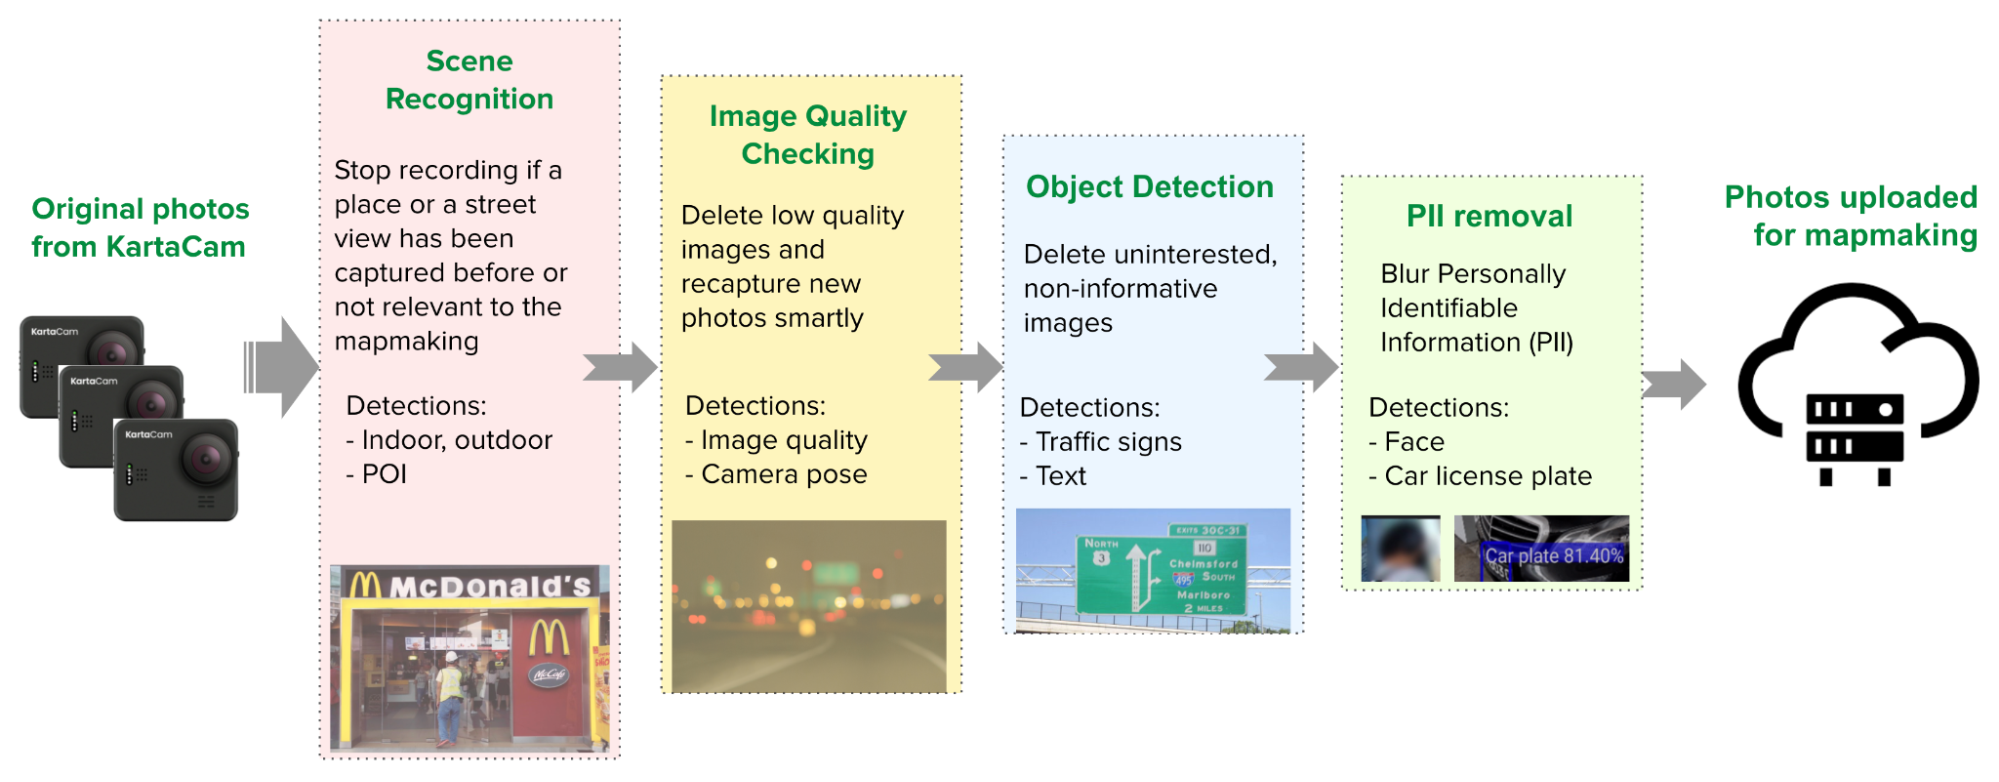


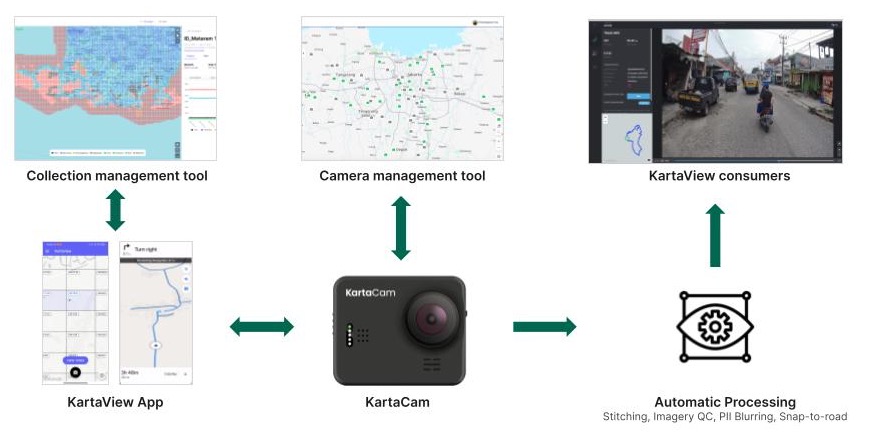


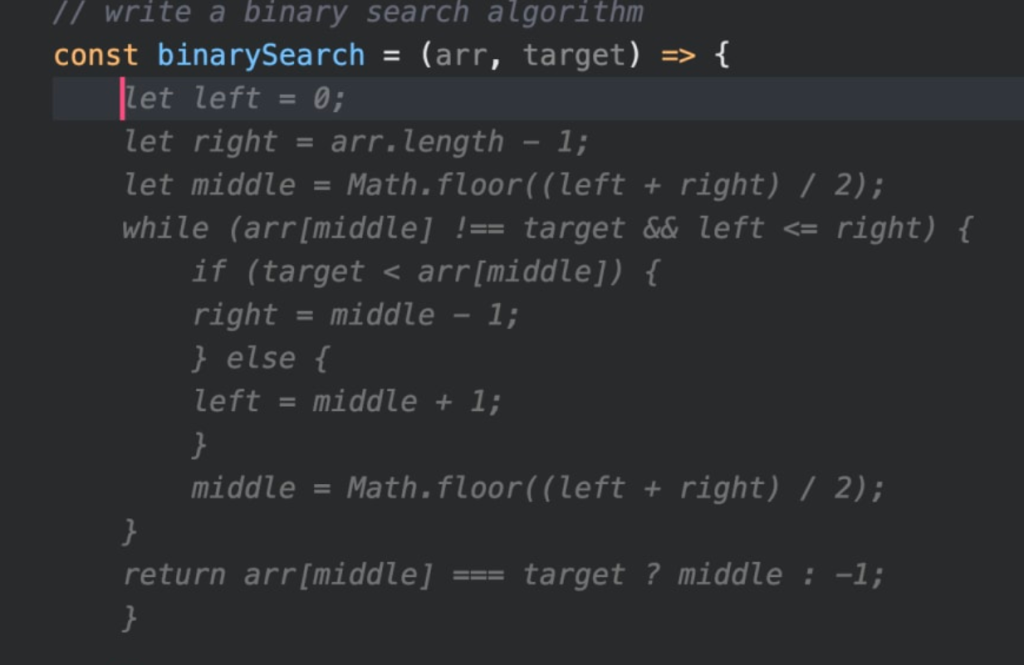

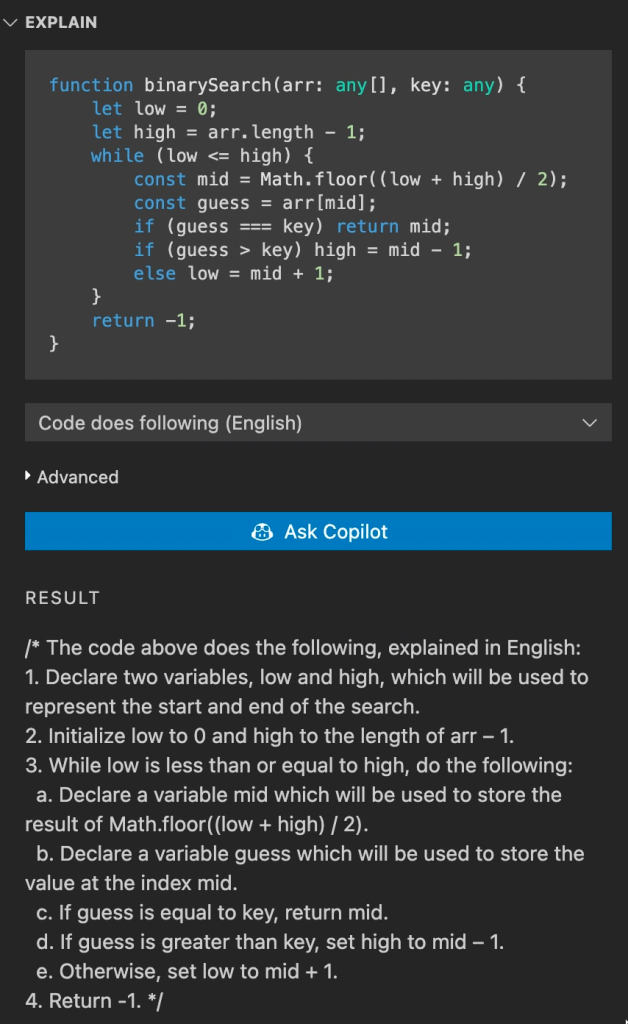

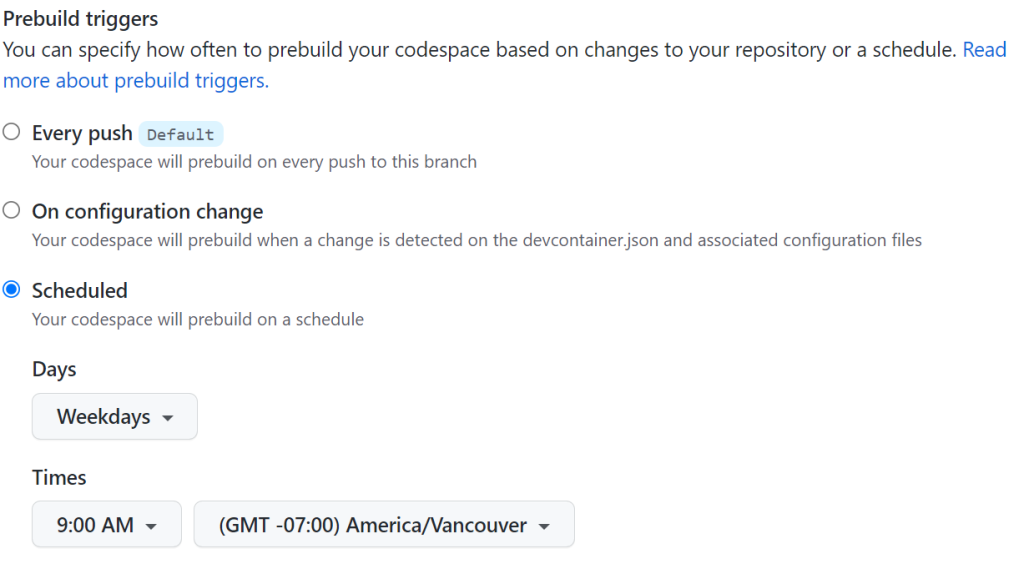
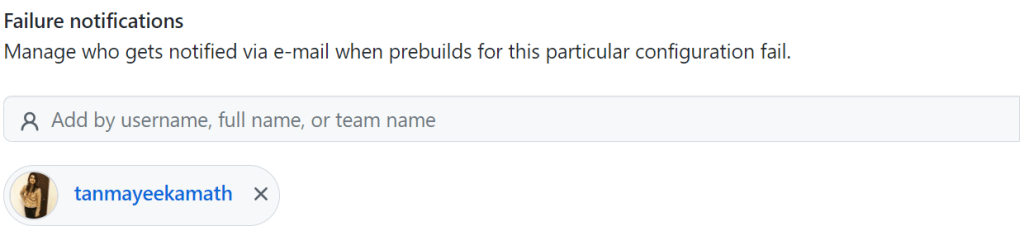

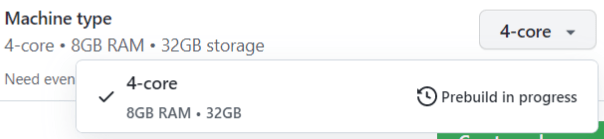

 The pitch: When it comes to what we’re going to work on (outside of the big pieces of work on
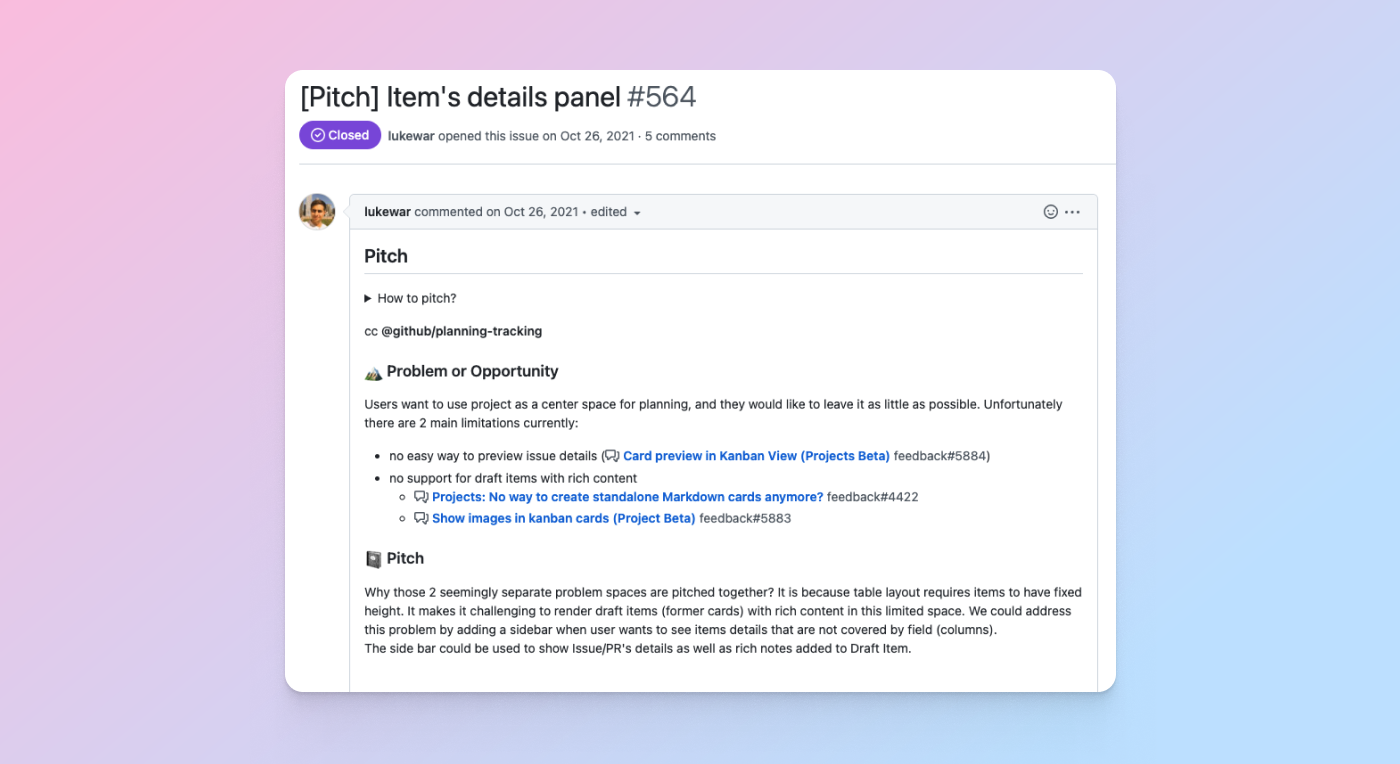
 In addition to using issues to propose and converse on pitches from the team, we use the new projects experience to track and manage all the pitches from the team so we can see them in an all-up table or board view.
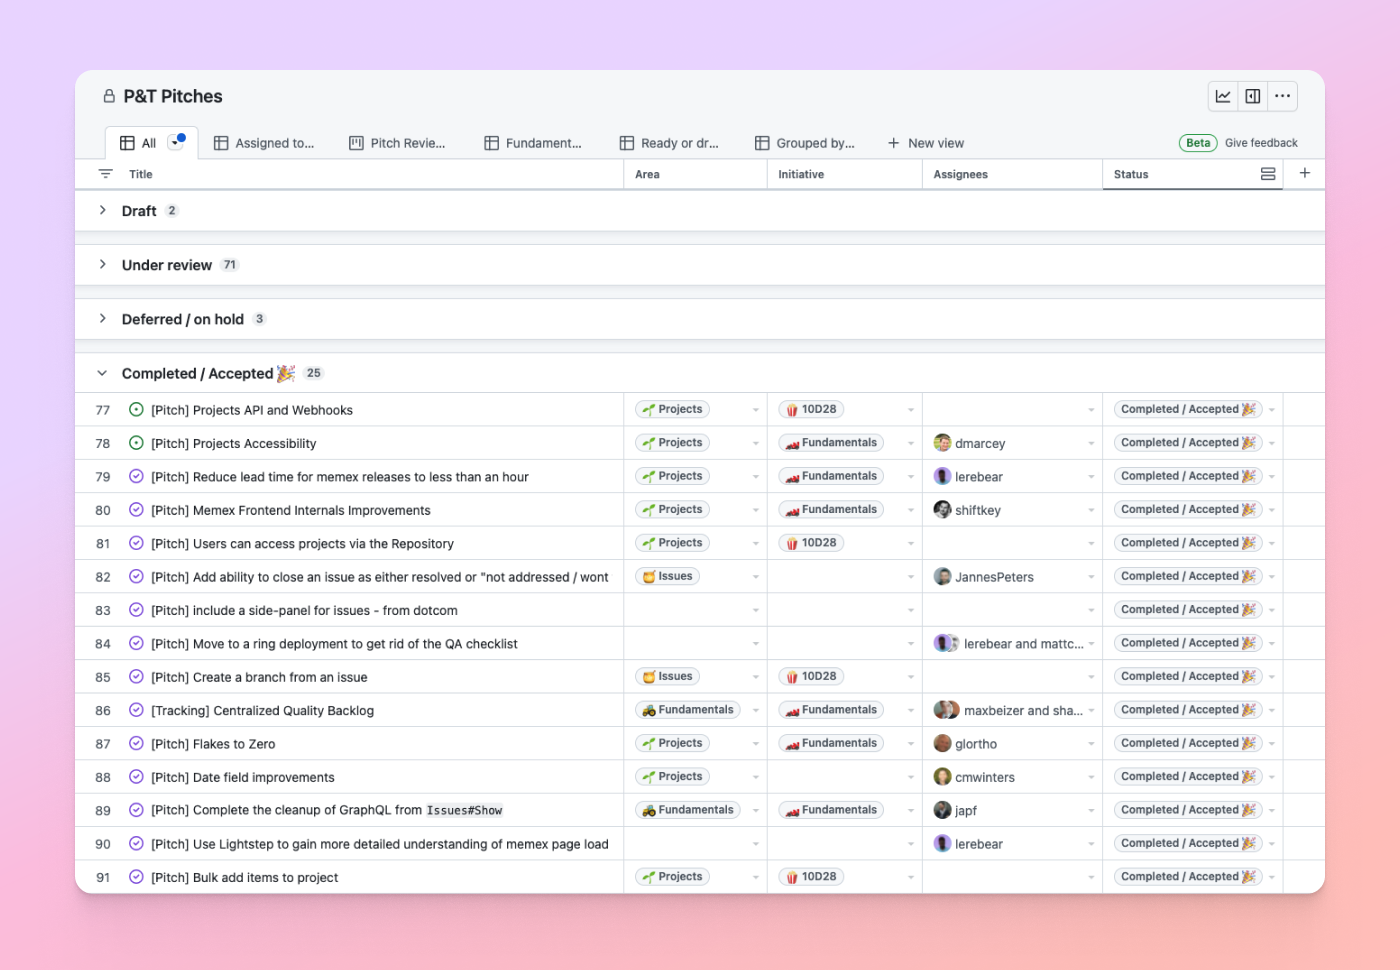
 Keep it small: We knew for ourselves, and for developers, that we didn’t want to lock them into a specific planning methodology and over-complicate a team’s planning and tracking process. For us, we wanted to plan shorter cycles for our team to increase our tempo and focus, so we opted for six-week cycles to break up and build features. Check out how we recommend getting started with this approach in a
  Ship to learn: Similar to how we ship a lot of our products, we knew developers and customers were going to be heavily intertwined with each and every ship, giving us immediate feedback in both the private and public beta. Their

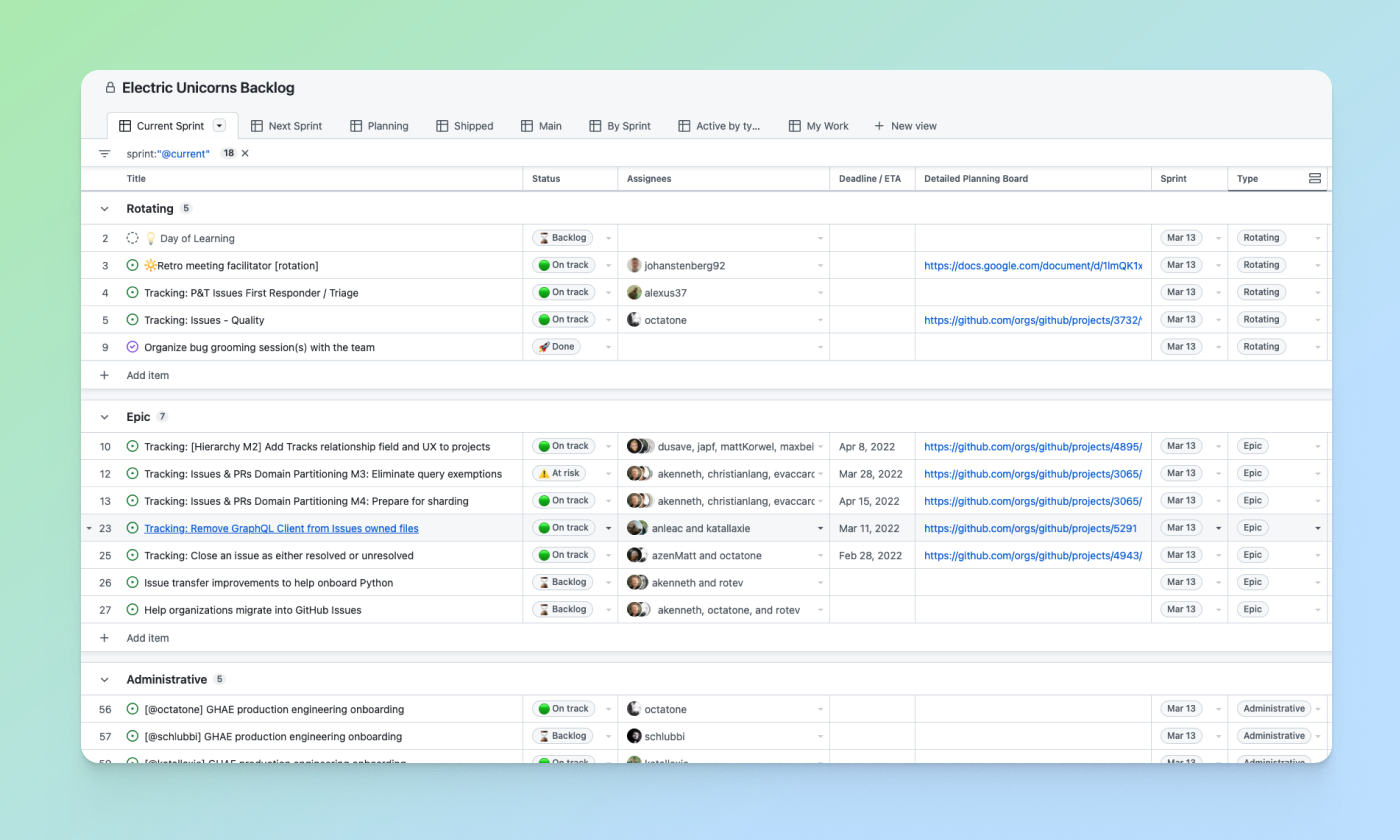

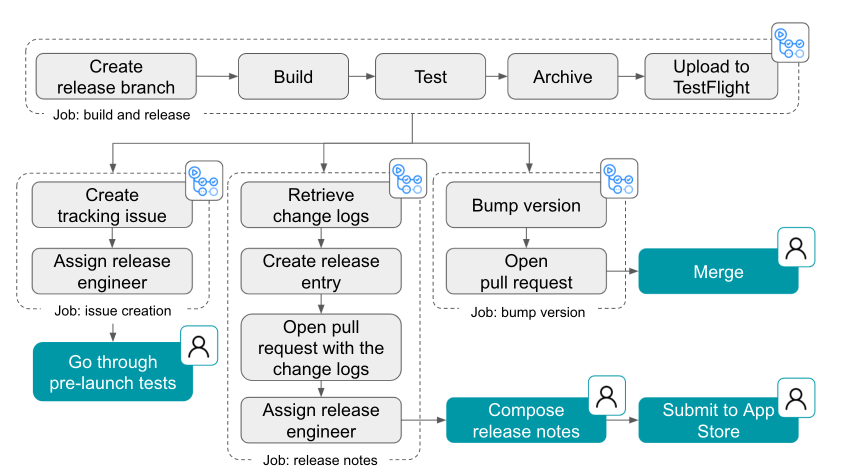
 Share company updates to GitHub’s intranet
 Create weekly reports on program status updates
 Turn weekly team photos into GIFs and upload to README
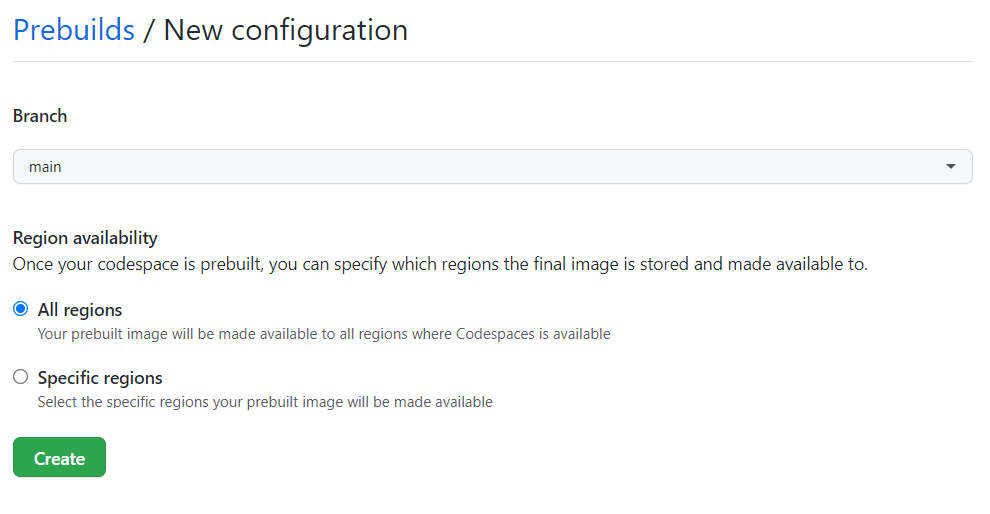
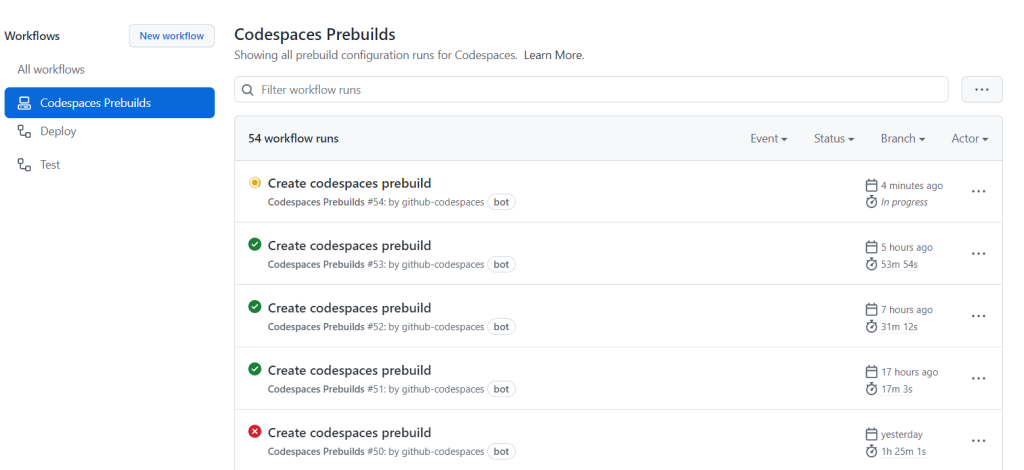
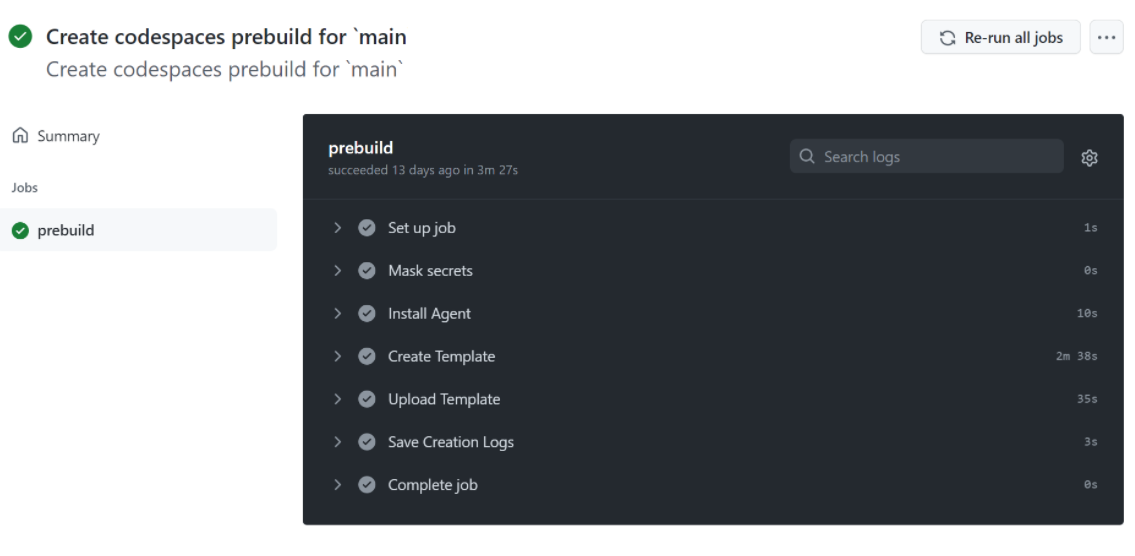
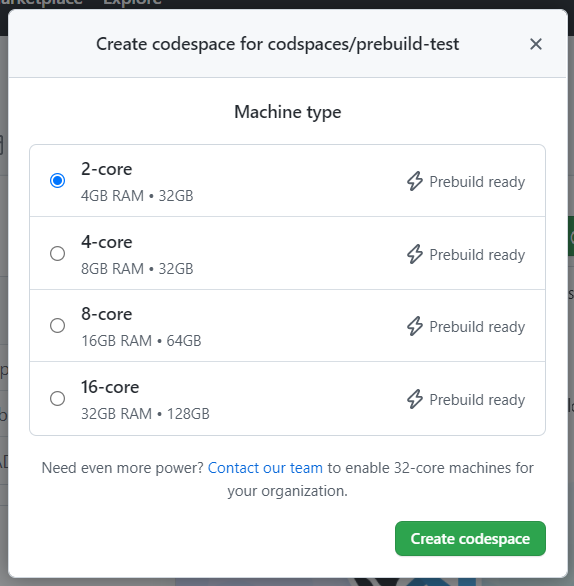