Post Syndicated from Talks at Google original https://www.youtube.com/watch?v=wuuQjleI5TE
Yearly Archives: 2024
Unlocking the power of unstructured data with RAG
Post Syndicated from Nicole Choi original https://github.blog/2024-06-13-unlocking-the-power-of-unstructured-data-with-rag/
Whether they’re building a new product or improving a process or feature, developers and IT leaders need data and insights to make informed decisions.
When it comes to software development, this data exists in two ways: unstructured and structured. While structured data follows a specific and predefined format, unstructured data—like email, an audio or visual file, code comment, or commit message—doesn’t. This makes unstructured data hard to organize and interpret, which means teams can miss out on potentially valuable insights.
To make the most of their unstructured data, development teams are turning to retrieval-augmented generation, or RAG, a method for customizing large language models (LLMs). They can use RAG to keep LLMs up to date with organizational knowledge and the latest information available on the web. They can also use RAG and LLMs to surface and extract insights from unstructured data.
GitHub data scientists, Pam Moriarty and Jessica Guo, explain unstructured data’s unique value in software development, and how developers and organizations can use RAG to create greater efficiency and value in the development process.
Unstructured data in software development
When it comes to software development, unstructured data includes source code and the context surrounding it, as these sources of information don’t follow a predefined format.
Here are some examples of unstructured data on GitHub:
- README files describe in text the purpose behind project source code, and include instructions for source code use, how to contribute, and other details that developers decide is important to include. While they’re usually written in Markdown, README files don’t follow a predefined structure.
- Code files are more orderly than README files in that they follow the syntax of a programming language. But not all code files have the exact same fields nor are they all written in the same format. Additionally, some parts of the file, like coding logic and variable names, are decided by individual developers.
- Package documentation explains how the software works and how to use it. Documentation, written in natural language, can include installation instructions, troubleshooting tips, a description of the package’s API, and a list of any dependencies required to use the package. It can also include code snippets that highlight the package’s features.
- Code comments explain the function behind certain code blocks in a code file. They’re text comments written in natural language and make the source code easier to understand by other developers.
- Wiki pages, while not limited to unstructured data, can contain helpful text documentation about installation instructions, API references, and other information.
- Commit messages describe in natural language text the changes a developer made to a codebase and why.
- Issue and pull request descriptions are written in natural language and in a text field. They can contain any kind of information a developer chooses to include about a bug, feature request, or general task in a project.
- Discussions contain a wealth and variety of information, from developer and end- user feedback to open-ended conversations about a topic. As long as a repository enables discussions, anyone with a GitHub account can start a discussion.
- Review comments are where developers can discuss changes before they’re merged into a codebase. Consequently, they contain information in natural language about code quality, context behind certain decisions, and concerns about potential bugs.
The value of unstructured data
The same features that make unstructured data valuable also make it hard to analyze.
Unstructured data lacks inherent organization, as it often consists of free-form text, images, or multimedia content.
“Without clear boundaries or predefined formats, extracting meaningful information from unstructured data becomes very challenging,” Guo says.
But LLMs can help to identify complex patterns in unstructured data—especially text. Though not all unstructured data is text, a lot of text is unstructured. And LLMs can help you to analyze it.
“When dealing with ambiguous, semi-structured or unstructured data, LLMs dramatically excel at identifying patterns, sentiments, entities, and topics within text data and uncover valuable insights that might otherwise remain hidden,” Guo explains.
| Need a refresher on LLMs? Check out our AI explainers, guides, and best practices > |
Here are a few reasons why developers and IT leaders might consider using RAG-powered LLMs to leverage unstructured data:
- Surface organizational best practices and establish consistency. Through RAG, an LLM can receive a prompt with additional context pulled from an organization’s repositories and documents. So, instead of sifting through and piece-mealing documents, developers can quickly receive answers from an LLM that align with their organization’s knowledge and best practices.
-
Accelerate and deepen understanding of an existing codebase—including its conventions, functions, common issues, and bugs. Understanding and familiarizing yourself with code written by another developer is a persisting challenge for several reasons, including but not limited to: code complexity, use of different coding styles, a lack of documentation, use of legacy code or deprecated libraries and APIs, and the buildup of technical debt from quick fixes and workarounds.
RAG can help to mediate these pain points by enabling developers to ask and receive answers in natural language about a specific codebase. It can also guide developers to relevant documentation or existing solutions.
Accelerated and deepened understanding of a codebase enables junior developers to contribute their first pull request with less onboarding time and senior developers to mitigate live site incidents, even when they’re unfamiliar with the service that’s failing. It also means that legacy code suffering from “code rot” and natural aging can be more quickly modernized and easily maintained.
Unstructured data doesn’t just help to improve development processes. It can also improve product decisions by surfacing user pain points.
Moriarty says, “Structured data might show a user’s decision to upgrade or renew a subscription, or how frequently they use a product or not. While those decisions represent the user’s attitude and feelings toward the product, it’s not a complete representation. Unstructured data allows for more nuanced and qualitative feedback, making for a more complete picture.”
A lot of information and feedback is shared during informal discussions, whether those discussions happen on a call, over email, on social platforms, or in an instant message. From these discussions, decision makers and builders can find helpful feedback to improve a service or product, and understand general public and user sentiment.
What about structured data?
Contrary to unstructured data, structured data—like relational databases, Protobuf files, and configuration files—follows a specific and predefined format.
We’re not saying unstructured data is more valuable than structured. But the processes for analyzing structured data are more straightforward: you can use SQL functions to modify the data and traditional statistical methods to understand the relationship between different variables.
That’s not to say AI isn’t used for structured data analysis. “There’s a reason that machine learning, given its predictive power, is and continues to be widespread across industries that use data,” according to Moriarty.
However, “Structured data is often numeric, and numbers are simply easier to analyze for patterns than words are,” Moriarty says. Not to mention that methods for analyzing structured data have been around longer** **than those for analyzing unstructured data: “A longer history with more focus just means there are more established approaches, and more people are familiar with it,” she explains.
That’s why the demand to enhance structured data might seem less urgent, according to Guo. “The potential for transformative impact is significantly greater when applied to unstructured data,” she says.
How does RAG extract value from unstructured data?
With RAG, an LLM can use data sources beyond its training data to generate an output.
RAG is a prompting method that uses retrieval—a process for searching for and accessing information—to add more context to a prompt that generates an LLM response.
This method is designed to improve the quality and relevance of an LLM’s outputs. Additional data sources include a vector database, traditional database, or search engine. So, developers who use an enterprise AI tool equipped with RAG can receive AI outputs customized to their organization’s best practices and knowledge, and proprietary data.
We break down these data sources in our RAG explainer, but here’s a quick summary:
- Vector databases. While you code in your IDE, algorithms create embeddings for your code snippets, which are stored in a vector database. An AI coding tool can search that database to find snippets from across your codebase that are similar to the code you’re currently writing and generate a suggestion.
And when you’re engaging with GitHub Copilot Chat on GitHub.com or in the IDE, your query or code is transformed into an embedding. Our retrieval service then fetches relevant embeddings from the vector database for the repository you’ve indexed. These embeddings are turned back into text and code when they’re added to the prompt as additional context for the LLM. This entire process leverages unstructured data, even though the retrieval system uses embeddings internally.
- General text search. When developers engage with GitHub Copilot Chat under a GitHub Copilot Enterprise plan, they can index repositories—specifically code and documentation. So, when a developer on GitHub.com or in the IDE asks GitHub Copilot Chat a question about an indexed repository, the AI coding tool can retrieve data from all of those indexed, unstructured data sources. And on GitHub.com, GitHub Copilot Chat can tap into a collection of unstructured data in Markdown files from across repositories, which we call knowledge bases.
Learn about GitHub Copilot Enterprise features >
But wait, why is Markdown considered unstructured data? Though you can use Markdown to format a file, the file itself can contain essentially any kind of data. Think about it this way: how would you put the contents of a Markdown file in a table?
- External or internal search engine. The retrieval method searches and pulls information from a wide range of sources from the public web or your internal platforms and websites. That information is used for RAG, which means the AI model now has data from additional files—like text, image, video, and audio—to answer your questions.
Retrieval also taps into internal search engines. So, if a developer wants to ask a question about a specific repository, they can index the repository and then send their question to GitHub Copilot Chat on GitHub.com. Retrieval uses our internal search engine to find relevant code or text from the indexed files, which are then used by RAG to prompt the LLM for a contextually relevant response.
Stay smart: LLMs can do things they weren’t trained to do, so it’s important to always evaluate and verify their outputs.
Use RAG to unlock insights from unstructured data
As developers improve their productivity and write more code with AI tools like GitHub Copilot, there’ll be even more unstructured data. Not just in the code itself, but also the information used to build, contextualize, maintain, and improve that code.
That means even more data containing rich insights that organizations can surface and leverage, or let sink and disappear.
Developers and IT leaders can use RAG as a tool to help improve their productivity, produce high-quality and consistent code at greater speed, preserve and share information, and increase their understanding of existing codebases, which can impact reduced onboarding time.
With a RAG-powered AI tool, developers and IT leaders can quickly discover, analyze, and evaluate a wealth of unstructured data—simply by asking a question.
A RAG reading list 📚
- What is retrieval-augmented generation, and what does it do for generative AI?
- Customizing and fine-tuning LLMs: What you need to know
- How we’re experimenting with LLMs to evolve GitHub Copilot
- How GitHub Copilot is getting better at understanding your code
The post Unlocking the power of unstructured data with RAG appeared first on The GitHub Blog.
UniFi Basics: Start the Right Way Without Breaking the Bank!
Post Syndicated from Crosstalk Solutions original https://www.youtube.com/watch?v=eVlavqMN9vI
Rust 1.79.0 released
Post Syndicated from corbet original https://lwn.net/Articles/978323/
Version
1.79.0 of the Rust language has been released. Changes this time
include inline const expressions, the “associated item bounds
syntax”, and more.
Security updates for Thursday
Post Syndicated from jake original https://lwn.net/Articles/978291/
Security updates have been issued by Debian (firefox-esr), Fedora (nginx-mod-modsecurity, php, and tomcat), Mageia (strongswan), Oracle (389-ds-base, buildah, c-ares, cockpit, containernetworking-plugins, fence-agents, firefox, gdk-pixbuf2, idm:DL1, ipa, kernel, libreoffice, podman, rpm-ostree, and thunderbird), Red Hat (dnsmasq and nghttp2), Slackware (mozilla), SUSE (curl, firefox, kernel, kernel-firmware-nvidia-gspx-G06, nvidia-open- driver-G06-signed, openssl-3, and python-Pillow), and Ubuntu (libmatio, libndp, linux, linux-aws, linux-aws-5.4, linux-azure, linux-azure-5.4, linux-gcp,
linux-gcp-5.4, linux-gkeop, linux-hwe-5.4, linux-ibm, linux-ibm-5.4,
linux-kvm, linux-oracle, linux-oracle-5.4, linux-raspi, linux-raspi-5.4,
linux-xilinx-zynqmp, linux-oem-6.5, and virtuoso-opensource).
The Gulag Uprising of 1954
Post Syndicated from The History Guy: History Deserves to Be Remembered original https://www.youtube.com/watch?v=XRlZQHoOFUk
Rapid7 Infuses Generative AI into the InsightPlatform to Supercharge SecOps and Augment MDR Services
Post Syndicated from Laura Ellis original https://blog.rapid7.com/2024/06/13/rapid7-infuses-generative-ai-into-the-insightplatform-to-supercharge-secops-and-augment-mdr-services/

In the ever-evolving landscape of cybersecurity, staying ahead of threats is not just a goal—it’s a necessity. At Rapid7, we are pioneering the infusion of artificial intelligence (AI) into our platform and service offerings, transforming the way security operations centers (SOCs) around the globe operate. We’ve been utilizing AI in our technologies for decades, establishing patented models to better and more efficiently solve customer challenges. Furthering this endeavor, we’re excited to announce we’ve extended the Rapid7 AI Engine to include new Generative AI capabilities being used by our internal SOC teams, transforming the way we deliver our MDR services.
A Thoughtful, Deliberate Approach to AI Model Deployment
At Rapid7, one of our core philosophical beliefs is that vendors – like ourselves – should not lean on customers to tune our models. This belief is showcased by our approach to deploying AI models, with a process that entails initially releasing them to our internal SOC teams to be trained and battle-tested before being released to customers via in-product experiences.
Another core pillar of our AI development principles is that human supervision is essential and can’t be completely removed from the process. We believe wholeheartedly in the efficacy of our models, but the reality is that AI is not immune from making mistakes. At Rapid7, we have the advantage of working in lockstep with one of the world’s leading SOC teams. With a continuous feedback loop in place between our frontline analysts and our AI and data science team, we’re constantly fine-tuning our models, and MDR customers benefit from knowing our teams are validating any AI-generated output for accuracy.
Intelligent Threat Detection and Continuous Alert Triage Validation
The first line of defense in any cybersecurity strategy is the ability to detect threats accurately and efficiently. The Rapid7 AI Engine leverages the massive volume of high-fidelity risk and threat data to enhance alert triage by accurately distinguishing between malicious and benign alerts, ensuring analysts can focus on only the alerts that are truly malicious. The engine has also been extended to include a combination of both traditional machine learning (ML) and Generative AI models to ensure new security alerts are accurately labeled as malicious or benign. This work boosts the signal to noise ratio, thereby enabling Rapid7 analysts to spend more time investigating the security signals that matter to our customers.
Introducing Our AI-Powered SOC Assistant
Generative AI is not just a tool; it’s a game-changer for SOC efficiency. Our AI-native SOC assistant empowers MDR analysts to quickly respond to security threats and proactively mitigate risks on behalf of our customers. Because we fundamentally believe AI should be trained by the knowledge of our teams and vetted processes, our SOC assistant utilizes our vast internal knowledge bases. Sources like the Rapid7 MDR Handbook – a resource amassed over decades of experience cultivated by our elite SOC team – enable the assistant to guide analysts through complex investigations and streamline response workflows, keeping our analysts a step ahead.
Rapid7 is further using generative AI to carefully automate the drafting of security reports for SOC analysts, typically a manual and time-intensive process. With more than 11,000 customers globally, the Rapid7 SOC triages a huge volume of activity each month, with summaries that are critical for keeping customers fully updated on what’s happening in their environment and actions performed on their behalf. While AI is a key tool to streamline report building and delivery, every report that is generated by the Rapid7 AI Engine is augmented and enhanced by our SOC teams, making certain every data point is accurate and actionable. Beyond providing expert guidance, the AI assistant also has the ability to automatically generate incident reports once investigations are closed out, streamlining the process and ensuring we can communicate updates with customers in a timely manner.
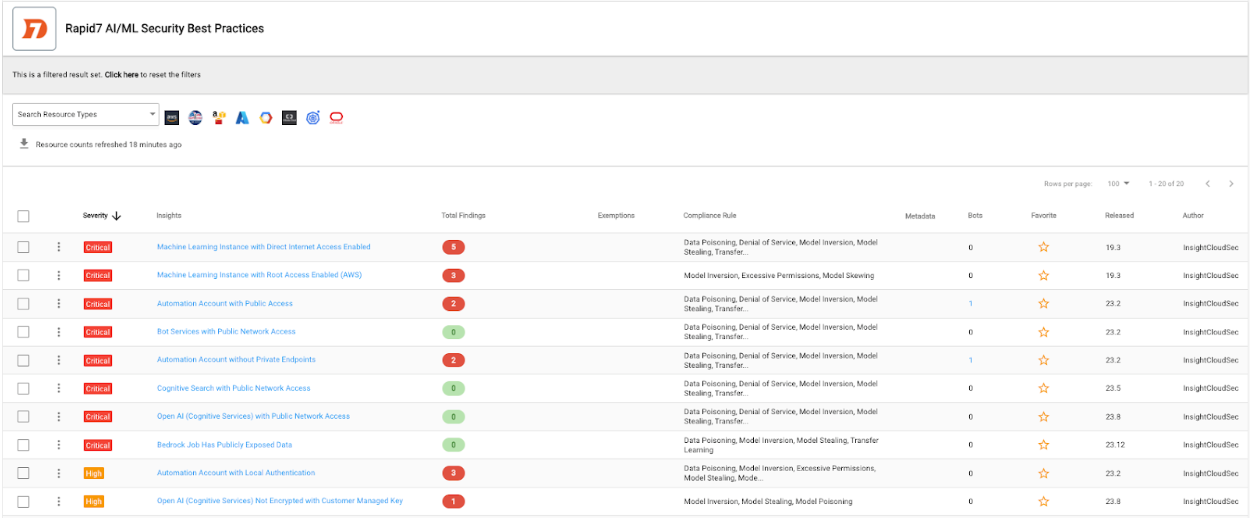
An Enabler for Secure AI/ML Application Development
We know we’re not alone in developing Generative AI solutions, and as such we’re also focused on delivering capabilities that allow our customers to implement and adhere to AI/ML development best practices. We continue to expand our support for Generative AI services from major cloud service providers (CSPs), including AWS Bedrock, Azure OpenAI service and GCP Vertex. These services can be continuously audited against best practices outlined in the Rapid7 AI/ML Security Best Practices compliance pack, which includes the mitigations outlined in the OWASP Top 10 for ML and large language models (LLMs). Our continuous auditing process, enriched by InsightCloudSec’s Layered Context, offers a comprehensive view of AI-related cloud risks, ensuring that our customers’ AI-powered assets are secure.
The Future of MDR Services is Powered by AI
The integration of Generative AI into the Insight Platform is not just about helping our teams keep pace – it’s about setting the pace. With unparalleled scalability and adaptability, Rapid7 is committed to maintaining a competitive edge in the market, particularly as it relates to leveraging AI to transform security operations. Our focus on operational efficiencies, cost reduction, and improved quality of service is unwavering. We’re not just responding to the changing threat landscape – we’re reshaping it.
The future of MDR services is here, and it’s powered by the Rapid7 AI Engine.
Deep-Sea Mining: Last Week Tonight with John Oliver (HBO)
Post Syndicated from LastWeekTonight original https://www.youtube.com/watch?v=qW7CGTK-1vA
На второ четене: „Изобретяване на самотата“
Post Syndicated from original https://www.toest.bg/na-vtoro-chetene-izobretyavane-na-samotata/
„Изобретяване на самотата“ от Пол Остър

превод от английски Иглика Василева, изд. „Колибри“, 2022
Беше. Вече никога няма да бъде. Помни.
С тези думи и с пророчески сън за собствената си смърт (станала тъжен факт тази година) завършва книгата на Пол Остър „Изобретяване на самотата“, която започва със смъртта на бащата на писателя. (Казвам пророчески, доколкото знанието, че всички неизбежно умираме, може да се счита за такова.) Остър започва да я пише непосредствено след като губи баща си, а само месеци по-късно се развежда с не по-малко известната си съпруга, американската писателка Лидия Дейвис, при която остава малкият му син Даниел.
И тъй като книгата е изцяло биографична и болезнено лична, прочитът ѝ сега е още по-зловещ на фона на фактите, които писателят е нямало как да знае тогава и които по онова време са били още в далечното бъдеще. А те са, че сънят на Остър вече се е сбъднал – две години преди писателят да почине, от свръхдоза си отива синът му Даниел, след като самият той е загубил бебето си, погълнало наркотици. Като че ли е оставено единствено на читателя да вижда надвисващата сянка на тази семейна трагедия, защото по времето на написването на романа Даниел е все още крехкият носител на бъдещето, на смисъла да продължиш, на надеждата за живот, която упорито поддържаме въпреки знанието за неизбежността на смъртта.
Преди да настъпи смъртта, винаги съществува възможност тя да не се състои, и на тази надежда, колкото и да е малка, трябва да ѝ се даде шанс.
Има нещо почти литературно нагласено в тази огледална поредица от кончини, която принадлежи на външния за романа свят – идея, която Остър също ще развие и която ще спомена по-късно. Държейки я сега в ума си, този мрачен мемоар отеква още по-съдбовно, отчетливо, пронизително. Той е едновременно и реминисценция на няколко живота, и своеобразен философски опит върху базови теми като бащинството, връзката между баща и син, самотата, случайността, паметта, езикът, възможността да бъде разказан светът, и животът, живян в условното (но и буквално) пространство на една стая. Ето едно съвпадение (каквито Остър изследва във втората част) – самият той пише там за поредица от известни личности, загубили децата си, без да знае, че същото ще сполети и него.

В първата част на романа Пол Остър ни пренася без никаква прелюдия в дните след напълно неочакваната и внезапна смърт на собствения си баща, увличайки ни в реминисценции за своето детство с него, в семейни разкази, в истории, илюстриращи характера на баща му, и в лутането из вещите на обитаваната до последно от родителя му семейна къща.
Ако не действам бързо, целият му живот ще изчезне заедно с него,
дава си сметка писателят, залавяйки се буквално веднага да пише. И то със съзнанието, че баща му не е оставил след себе си никакви следи.
Остър ще открие, че вместо да лекува, актът на писане продължава да държи раната отворена.
Че вместо думите да погребат баща му, те продължават да го пазят жив. И че едва когато разказът премине в тишината, която ужасява писателя, това ще означава, че се е простил с баща си завинаги.
Първата част на тази книга представлява далеч по-подреден, макар и фрагментарен разказ за отсъствието и самотата като начин на съществуване. Тя е и история за невъзможния баща, бащата, който не може да бъде открит и достигнат. Неслучайно, вече във втората част, Остър ще анализира по аналогия и разказа на Колоди за Пинокио и неговия баща Джепето – и по-специално опита на дървената кукла да открие и спаси своя създател, спускайки се в мрачния търбух на акулата, където му се струва,
че е паднал с главата надолу в мастилница.
Именно в този буквален мрак на писането, на впускането в себе си, Остър ще потърси посмъртно баща си – човека, за когото е мечтал цял живот, от когото винаги е очаквал да бъде видян като нещо повече от мъглявина („аз копнеех точно за това – да бъда забелязан [от него]“). Защото, както писателят ще осъзнае, човек на всяка възраст копнее за любовта на баща си, но в същото време за него е невъзможно да прекрачи в самотата на друг човек.
Именно самотата и самоизключването от света дефинират образа на бащата. Невъзможността да го открие приживе кара Остър след смъртта му още по-силно да усеща нуждата да навлезе в това „парче непристъпно пространство под формата на мъж“.
И пред нас се показва – без нито за миг да се разкрива – един вечен аутсайдер, турист в собствения си живот, човек, гастролиращ през света, който никого не допуска в себе си. Мъж, който неизбежно е създал свой сурогатен Аз, изкуствен образ, съчинител, принуден да измисля или да прибягва до готови клишета в думите и действията си, за да не разкрие себе си. Мъж, скрит изцяло в работата си, заможен, но стиснат до безсмислие. Мъж, за когото парите не са успех, нито са опит да си купиш щастие, а само възможност да избягаш от нещастието. Мъж, отказващ да види не само психическите проблеми на собствената си дъщеря, но и изобщо света.
И все пак човек точен, изпълнителен, отдаден на братята си, останал до последно с майка си, помагащ на роднините и дори на непознатите си наематели. Образ, в който всеки факт бива отричан от следващия, и е невъзможно да кажеш каквото и да било, защото и всичко останало ще е вярно.
… през цялото време имам чувството, че пиша за трима или четирима различни мъже, всеки ясно очертан, всеки пълна противоположност на останалите.
В крайна сметка Остър подхожда към този така и неслучил се, винаги липсвал негов баща без осъдителност, без жалване, без укор. А когато чуваме семейната история за баба му от бащина страна, убила собствения си съпруг, оправдана и властвала над петте си деца, вече напълно сме готови да загърбим своята неприязън и да изпитаме най-малкото хладна емпатия, човешко съчувствие към този човек, за когото смъртта, изглежда, е била единственият „изход, единственото легитимно бягство“.
Къщата, която Остър трябва да разчисти и освободи (колко точен глагол) след смъртта, се превръща и в метафора за живота на родителя му, и в прелюдия към разсъжденията му за живота в рамките на една стая (за това – по-късно). Тази къща е окупирана от вещите на самотата, превърнала се е във вехтошарски музей на отсъствието („както чужд човек би живял в нея“).
Остър пише за начина, по който вещите се променят, след като животът, към който са имали отношение, си отиде.
Как нещата изобщо – включително и спомените – се изменят, докато привидно остават същите, преди да загубят всякакъв смисъл. Ненужните предмети, на които се натъква, вече не са предмети, а „остатъци от мисли, от съзнание, символи на [нечия] самота“ и да ровиш в тях е като да ровиш в тайните кътчета на нечий ум. Не задълго обаче.
И къщата, и човекът, окупирал се в нея, отвън изглеждат стабилни и спокойни, докато вътрешно се разпадат в хаос. Нужно ли ни е повече от едно такова пространство обаче? Във втората, далеч по-хаотична и фрагментарна част на книгата Остър ще си задава този въпрос заедно с много други, изследващи редица теми, които не са свързани с първата част.
Заварваме го затворен в клаустрофобична стая под наем в Ню Йорк, изолирал се там в дните след раздялата с жена си и сина им. За да може да се види… в тази част той ще пише за себе си в трето лице. По същото време ще трябва да се прости и с дядо си, за когото също ни разказва. Вече се е случило обаче: синът е заел стаята на бащата, превърнал се е в него.
Убежище или затвор? Празнота или самодостатъчност? Начин да полудееш или да възвърнеш живота си? Отговорите за стаята може да са различни – Остър ги търси къде ли не. Микроскопичната и препълнена с вещи стая на своя приятел С. през парижките дни на писателя. Кулата на Хьолдерлин. Стаята на Ане Франк. Декарт в стаята си наблизо. Паскал в стаята си. Жените в стаите на Вермеер и стаята на Ван Гог. Йона в корема на кита – една библейска история, която писателят ще разгърне пред нас с ново, проникновено тълкувание.
Именно от тази своя квартира Остър се опитва да напише Книгата на паметта, изследвайки както нея, така и природата на случайността и на самотата.
Защото стаята е и пространството на паметта – „миниатюрна космология, която съдържа в себе си всичко“, дори и спомена за неслучилото се.
А паметта е още много неща според Остър: виждане, превод, възможност за дълготрайност на преходното и краткото, както и самият акт на писане. Разказването е деликатната работа да се опитваш да си спомниш онова, което вече е запаметено.
Историята в книгата започва с края, но завършва със спомените на автора за най-ранното му детство. Те се редуват и могат да се леят сякаш до безкрай – фрагменти, бегли сцени, мигове, – защото, „докато продължаваш да говориш, няма да умреш“ (Остър разсъждава и върху историята за Шехерезада и смисъла на продължаващия наратив). И в същото време, парадоксално,
писаното слово освобождава човека от необходимостта да помни повечето неща от света, тъй като спомените са складирани в думите.
Така че прекрачвайки в пространството на паметта, влизаме в света. Свят, който, уви, ще бъде изгубен завинаги.
Защото, ако думите са начин да съществуваш в света, помисли си той, тогава, дори да няма свят, в който да влезеш, света вече го има там, в тази стая, което означава, че именно стаята присъства в стихотворенията, а не обратното.
В тази част Остър изследва и много съвпадения, случки, които се оказват плод на изумителна случайност. И пише за граматика на съществуването и римуването на събитията в живота така, че римата, която те създават заедно, да промени реалността на всяко от тях. И въпреки че
измислената история се състои изцяло от съзнателни внушения, докато фактическата история е лишена от каквото и да било внушение освен очевидното,
всеки път, когато открива връзка между два житейски фрагмента, съзнанието се изкушава да потърси някакво значение в тази връзка, да ѝ придаде смисъл отвъд голите факти. Това е и усещането, че
каквото и да попадне пред погледа му, отразява единствено онова, което е вътре в него.
Изкушението е и в двете посоки: да погледнеш на изкуството като на реалния живот, но и на света, сякаш е продължение на въображаемото. Дори последното да е равносилно на това да построиш въображаем свят вътре в реалния, който ще е без устои.
Всяка книга, пише Остър, представлява образ на самотата – защото зад всяка нейна дума стоят месеци на нечия (на твореца) самота, в която сега ние влизаме, за да стане наша. Затова е възможно да си сам и да не си сам в един и същ момент. Това важи и за пребиваването му в квартирата, осъзнава той. Там в момента, в който е понечил да говори за тази самота, той вече е станал не само себе си. Превърнал се е в Робинзон Крузо (корабокрушенец в сърцето на града).
В същата част – зловещо пророчески – Остър ще разгледа и много случаи на бащи, губещи децата си. Рембранд и Тит. Цветаева и синът ѝ Мур. С. и неговите синове. Уолтър Рали и неговия Уот. Маларме и фрагментите, които пише до леглото на умиращия си син Анатол. Самият Остър, който в тази част вече сам изследва своето бащинство, за малко не изгубва буквално, заради пневмония, вече отнетия му приживе син по силата на развода. Писателят ще достигне до прозрението, че именно в мига на този страх в спешното отделение на болницата той е станал –
веднъж и завинаги – баща на сина си.
И ето. Тази книга ни оставя с повече мисли и въпроси, отколкото с една приключила история. Какво остава освен паметта – (единственото) пространство, „в което едно нещо се случва за втори път“, макар и може би по напълно различен начин? Има ли опасност да откриеш настояще, което ще опровергае миналото и по този начин ще го промени, а това на свой ред ще заличи онзи спомен за миналото, който искаш да запазиш?
Възможен ли е отговорът на въпроса как може да се живее живот в неприсъствие, в отсъствие, в изолираща всичко останало самота?
Не е ясно дали има отговор или дори отговори. Болезнено и мрачно удоволствие е обаче да преминем през всички тези възможни и невъзможни, логични и противоречащи си, заключващи и отварящи нови пространства за отключване въпроси заедно с писател от ранга на Пол Остър. Там, в пространството на паметта, където „всичко е едновременно себе си и нещо друго“. В паметта като книга, която никога не може да бъде завършена от един човек приживе.
Активните дарители на „Тоест“ получават постоянна отстъпка в размер на 20% от коричната цена на всички заглавия от каталога на издателство „Колибри“, както и на няколко други български издателства в рамките на партньорската програма Читателски клуб „Тоест“. За повече информация прочетете на toest.bg/club.
Никой от нас не чете единствено най-новите книги. Тогава защо само за тях се пише? „На второ четене“ е рубрика, в която отваряме списъците с книги, публикувани преди поне година, четем ги и препоръчваме любимите си от тях. Рубриката е част от партньорската програма Читателски клуб „Тоест“. Изборът на заглавия обаче е единствено на авторите – Стефан Иванов и Антония Апостолова, които биха ви препоръчали тези книги и ако имаше как веднъж на две седмици да се разходите с тях в книжарницата.
Сънуват ли джихадистите девици? (продължение)
Post Syndicated from Атанас Шиников original https://www.toest.bg/sanuvat-li-dzhihadistite-devici-2/
<< Към първа част
Да се върнем към заглавието на този текст и да си зададем въпроса какво ли сънуват джихадистите на съвремието.

Ясно е, че имат всички религиозни основания да сънуват. И да употребяват сънуваното инструментално. Но какво ли сънуват? Девици, може би онези от Корана,
съпруги хубавици с големи очи (52:20),
недокоснати нито от човек преди тях, нито от джин (55:56),
с напъпили гърди девствени връстнички (78:33)?
Оказва се, че архизлодеят на терористичните атентати от 11 септември 2001 г. –
Осама бен Ладен – също е активно сънуващ.
В периода 2015–2017 г. Дирекцията за национално разузнаване (ODNI, Office of the Director of National Intelligence) на САЩ и ЦРУ постепенно публикуват серия от документи, открити в убежището на Бен Ладен в Аботабад, Пакистан, към момента на неговото ликвидиране през 2011 г. И там, наред с всички останали четива (а той, оказва се, чете и пише всякакви неща), е запазен и личният му дневник. ЦРУ се грижи за публиката си – имайте предвид, предупреждават те, че част от съдържанието може да бъде обидно или емоционално смущаващо, не е подходящо за всякаква публика и тъй като все пак е събрано от терористична организация, колкото и да се стараем да премахнем всички следи от злонамерен софтуер, това не е напълно гарантирано.
А Бен Ладен, когото вълнуват теми като Съдния ден, края на времето, Лъжемесията в исляма (Ад-Даджжал) и „Месията“ (Ал-Махди), не сънува девици. Сънува злободневно, войнствено и политически (не напомня ли това някак на сънищата на самия Пророк и по-късните богослови, засвидетелствани например в дневника на Ибн ал-Банна?). И записва не само своите сънища, а и тези на сина си Халид:
Видях муджахидините на една страна, а на друга – настъпващите американски танкове.
Но накрая
възлязох и не намерих нито американци, нито танкове, пречист да бъдеш Ти [Аллах], слава Тебе!
В друг сън Бен Ладен вижда Найеф бин Абдулазиз, починалия през 2012 г. престолонаследник и министър на вътрешните работи на Саудитска Арабия. В съня му обаче министърът се появява във военна униформа, но не като враг, а като приятел. Бен Ладен отбелязва и тълкуванието на съня – явно „Родът на Сауд (саудитската династия) е по-бърз от нас в приближаването си към муджахидините и благочестивата младеж“.
Свидетелства за ролята на сънищата в легитимирането на дейността на „Ал-Кайда“ съществуват и преди дневника на Бен Ладен.
Терористичните атаки от 11 септември, оказва се, също са „предсказани“ чрез сънища на мюсюлмани. Това разкрива записът на разговор, подслушан от американското разузнаване и публикуван навремето от Министерството на отбраната на САЩ. Транскрипцията, понастоящем частично достъпна в статия на Тамара Албертини¹, отдавна вече не е налична в посочените от авторката източници онлайн. Но запазеното копие говори за т.нар. срещи от Кандахар в Афганистан. По време на събранията глас, за който се предполага, че принадлежи на Бен Ладен, наред с шейха домакин, както и други неидентифицирани персонажи споменават за общо седем видения по време на сън. Те разкриват, че на 11 септември 2001 г. ще има терористичен атентат.
Самият Бен Ладен споделя, че негов съратник (вероятно Ал-Масри, лидер на „Ал-Кайда“ от Египет) му казал преди година:
Видях в сън, че играем футбол срещу американците. Когато отборът ни се появи на игрището, всички те бяха пилоти! Тъй че се зачудих дали това е игра на футбол, или пилотска игра? Нашите играчи бяха пилоти.
А той – Абу ал-Хасан ал-Масри, – потвърждава самият Бен Ладен в записа, не знаел нищо за операцията, докато не чул за нея по радиото.
Да, Абд ар-Рахман ал-Гамри твърди, че преди операцията видял във видение насън как самолет се блъска във висока сграда, без да знае –
потвърждава непознат глас. Шейхът на свой ред казва, че различни благочестиви хора споделят с него как насън виждат, че носят огромен самолет на рамене и го влачат през пустинята, както и че хора, тръгнали на джихад, стигат до Ню Йорк и Вашингтон. В този момент самият Бен Ладен предупреждава, че започва да се безпокои да не би тайният заговор за терористичната операция да бъде разкрит, ако всички започнат да я сънуват².
Но да не си помислихте, че е само Бен Ладен? Според Иън Р. Едгар от Университета в Дърам, Великобритания³,
джихадистите, включително и отгледаните на местна почва, доста настойчиво сънуват, за да легитимират дейността си.
А на сънищата на едноокия Молла Омар, дългогодишен лидер на талибаните в Афганистан, може да се посвети отделен научен труд. Рахимуллах Юсуфзай, кореспондент на Би Би Си в Пешавар, успява да се срещне за около дванайсет интервюта с талибанския лидер и засвидетелства многократно позоваването на сънищата в „кариерата“ на Молла Омар. Ръководството му на ислямското фундаменталистко движение изглежда белязано от многобройни сънища. Чичото на жена му разказвал, че „преди да нападне дадено място, сънувал. И след това на сутринта издавал заповед на някой командир да атакува“.
Например на 20 ноември 2001 г., по време на войната в Афганистан, се оказва, че мирното предаване на Кандахар е осуетено, след като едноокият талибански водач вижда сън. Самото му възкачване на лидерската позиция е бетонирано от сънища, а съратниците му успяват да бъдат убедени, че предводителят им е човек, който се ръководи от сънища, дадени от Аллах. Подобно на съратниците на Бен Ладен, младият му брат сънува преди 11 септември, че „някъде един бял палат гори“⁴.
Нека сега да направим пълен кръг и да се върнем към началото на този текст.
Онзи ден потърсих популярни български съновници онлайн. Преживяването да ги четеш е почти като да надзърнеш в „тъмната мрежа“. Знаеш, че съществува, но предпочиташ да не го заглеждаш. Но ето, всички, на които се натъкнах, казват, че да сънуваш „ходжа“ (дано да не са тия, описвани от поп Минчо Кънчев) имало особено значение и ще се разкайваш за глупави постъпки или необмислени думи. Добре, хайде да се опитам да хакна наум сънувателната матрица.
Ами ако самият ти насън си ходжа?
Това значи, че някой се страхува от теб. Машаллах!, бих отвърнал аз с класическото арабско възклицание. Със сигурност това тълкувание днес при нас се е промъкнало под влиянието на мюсюлманската традиция. Няма как да сънуваш ходжа, ако не знаеш какво е. Идва от турската дума за „учител“ и се е превърнало в почетно обръщение към по-старшите, включително и към религиозните авторитети.
А пък аз съм сънувал, че говоря на арабски в иракски казарми от времето на Саддам Хюсеин. Че карам трактор. Че съм вампир с кожени крила, кацнал на тераса в постапокалиптична тропическа панелна София. Че компаниите и екипите, които одитирам в моята работа за ИТ индустрията, се бавят и манипулират документални доказателства.
Но да сънувате ходжа? Не ми се вижда много вероятно да сънувате ходжа. На фона на всичко по-горе, е по-вероятно ходжата да сънува вас.
1 Albertini, Tamara. “Dreams, Visions, & Nightmares: From the Prophet Muhammad to the Fundamentalist Mindset” In Dreams and Visions, ed. by Nancy van Deusen, Leiden: Brill, 2010, p. 167–182.
2 Ibid., p. 168–169.
3 Edgar, Iain R. The Dream in Islam: From Qur’anic Tradition to Jihadist Inspiration, Berghahn Books, New York, Oxford, 2016.
4 Ibid., р. 80–83.
В рубриката „Ориент кафе“ Атанас Шиников поднася любопитни теми, свързани не толкова с горещата политика, колкото с историята и културата на Близкия изток. А той, древен и днешен, е по-близко до нас и съвремието ни, отколкото си представяме.
Zabbix 7.0 Proxy Load Balancing
Post Syndicated from Markku Leiniö original https://blog.zabbix.com/zabbix-7-0-proxy-load-balancing/28173/
One of the new features in Zabbix 7.0 LTS is proxy load balancing. As the documentation says:
Proxy load balancing allows monitoring hosts by a proxy group with automated distribution of hosts between proxies and high proxy availability.
If one proxy from the proxy group goes offline, its hosts will be immediately distributed among other proxies having the least assigned hosts in the group.
Table of Contents
Proxy group is the new construct that enables Zabbix server to make dynamic decisions about the monitoring responsibilities within the group(s) of proxies. As you can see in the documentation, the proxy group has only a minimal set of configurable settings.
One important background information to understand is that Zabbix server always knows (within reasonable timeframe) which proxies in the proxy groups are online and which are not. That’s because all active proxies connect to the Zabbix server every 1 second by default (DataSenderFrequency setting in the proxy), and Zabbix server connects to the passive proxies also every 1 second by default (ProxyDataFrequency setting in the server), so if those connections are not happening anymore, then something is wrong with using the proxy.
Initially Zabbix server will balance the hosts between the proxies in the proxy group. It can also rebalance the hosts later if needed, the algorithm is described in the documentation. That’s something we don’t need to configure (that’s the “automated distribution of hosts” mentioned above). The idea is that, at any given time, any host configured to be monitored by the proxy group is monitored by one proxy only.
Now let’s see how the actual connections work with active and passive Zabbix agents. The active/passive modes of the proxies (with the Zabbix server connectivity) don’t matter in this context, but I’m using active proxies in my tests for simplicity.
Disclaimer: These are my own observations from my own Zabbix setup using 7.0.0, and they are not necessarily based on any official Zabbix documentation. I’m open for any comments or corrections in any case.
At the very end of this post I have included samples of captured agent traffic for each of the cases mentioned below.
Passive agents monitored by a proxy group
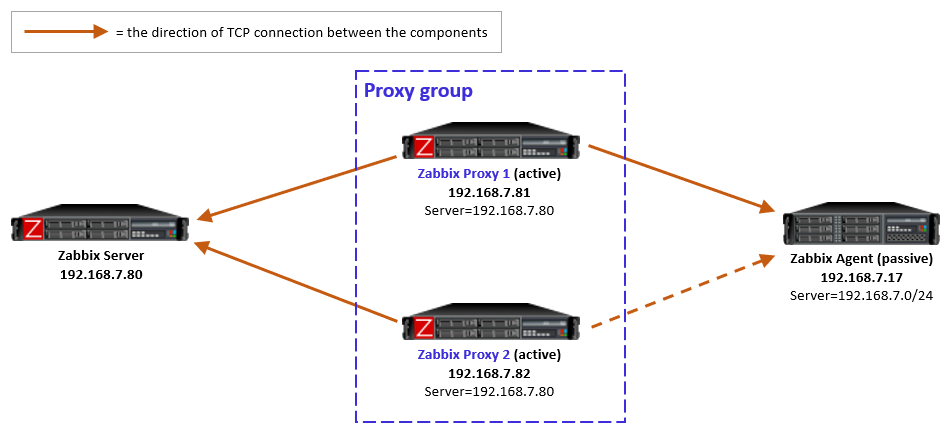
For passive agents the proxy load balancing really is this simple: Whenever a proxy goes down in a proxy group, all the hosts that were previously monitored by that proxy will then be monitored by the other available proxies in the same proxy group.
There is nothing new to configure in the passive agents, only the usual Server directive to allow specific proxies (IP addresses, DNS names, subnets) to communicate with the agent.
As a reminder, a passive agent means that it listens to incoming requests from Zabbix proxies (or the Zabbix server), and then collects and returns the requested data. All relevant firewalls also need to be configured to allow the connections from the Zabbix proxies to the agent TCP port 10050.
As yet another reminder, each agent (or monitored host) can have both passive and active items configured, which means that it will both listen to incoming Zabbix requests but also actively request any active tasks from Zabbix proxies or servers. But again, this is long-existing functionality, nothing new in Zabbix 7.0.
Active agents monitored by a proxy group
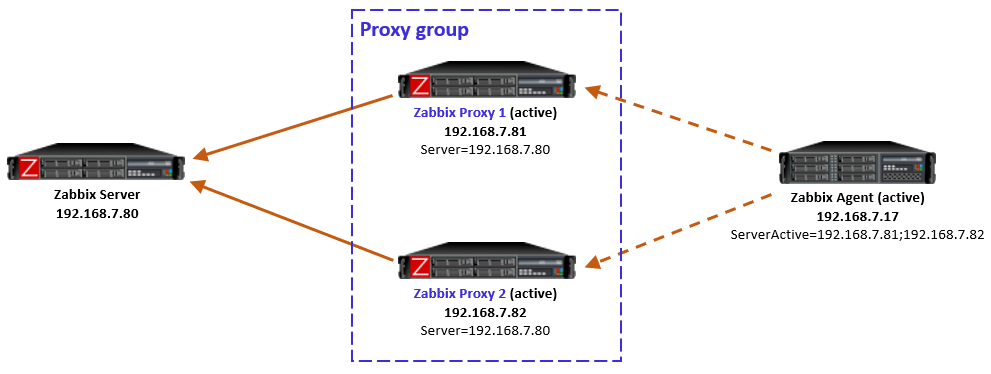
For active agents the proxy load balancing needs a bit new tweaking in the agent side.
By definition, an active agent is the party that initiates the connection to the Zabbix proxy (or server), to TCP port 10051 by default. The configuration happens with the ServerActive directive in the agent configuration. According to the official documentation, providing multiple comma-separated addresses in the ServerActive directive has been possible for ages, but it is for the purpose of providing data to multiple independent Zabbix installations at the same time. (Think about a Zabbix agent on a monitored host, being monitored by both a service provider and the inhouse IT department.)
Using semicolon-separated server addresses in ServerActive directive has been possible since Zabbix 6.0 when Zabbix servers are configured in high-availability cluster. That requires specific Zabbix server database implementation so that all the cluster nodes use the same database, and some other shared configurations.
Now in Zabbix 7.0 this same configuration style can be used for the agent to connect to all proxies in the proxy group, by entering all the proxy addresses in the ServerActive configuration, semicolon-separated. However, to be exact, this is not described in the ServerActive documentation as of this writing. Rather, it specifically says “More than one Zabbix proxy should not be specified from each Zabbix server/cluster.” But it works, let’s see how.
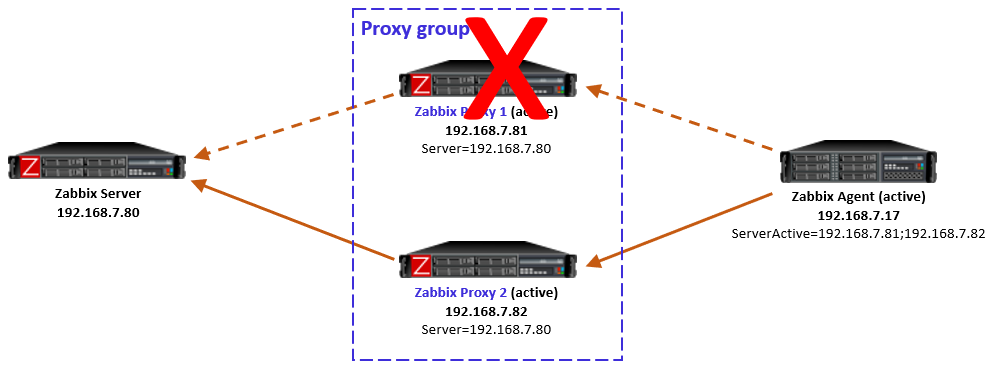
Using multiple semicolon-separated proxy addresses works because of the new redirection functionality in the proxy-agent communication: Whenever an active agent sends a message to a proxy, the proxy tells the agent to connect to another proxy, if the agent is currently assigned to some other proxy. The agent then ceases connecting to that previous proxy, and starts using the proxy address provided in the redirection instead. Thus the agent converges to using only that one designated proxy address.
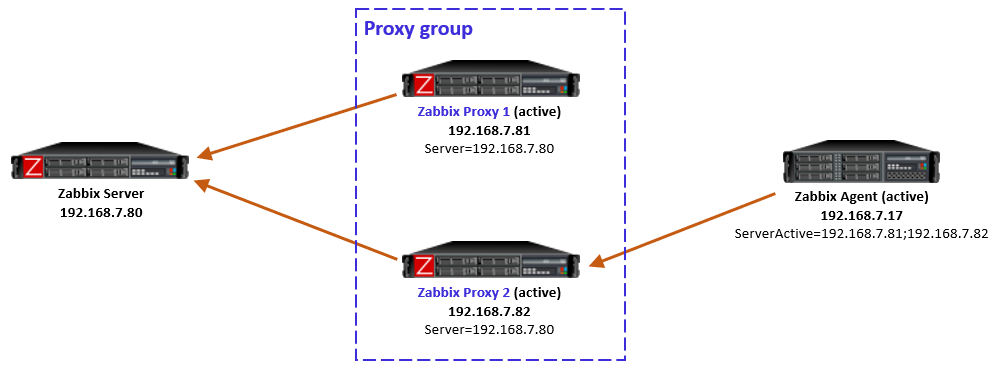
In this simple example the Zabbix server determined that the agent should be monitored by Proxy 1, so when the agent initially contacted Proxy 1 (because its IP address is first in the ServerActive list), the proxy responded normally and agent was happy with that.
In case the Zabbix server had for any reason determined that the agent should be monitored by Proxy 2, then Proxy 1 would have responded with a redirection, and agent would have followed that. (There will be examples of redirections in the capture files below.)
To be clear, this agent redirection from the proxy group works only with Zabbix 7.0 agents as of this writing.
Note: In the initial version of this post I used comma-separated proxy addresses in ServerActive (instead of semicolon-separated), and that caused duplicate connections from the agent to the designated proxy (because the agent is not equipped to recognize that it connects to the same proxy twice), eventually causing data duplication in Zabbix database. Using comma-separated proxy addresses is thus not a working solution for proxy load balancing usage.
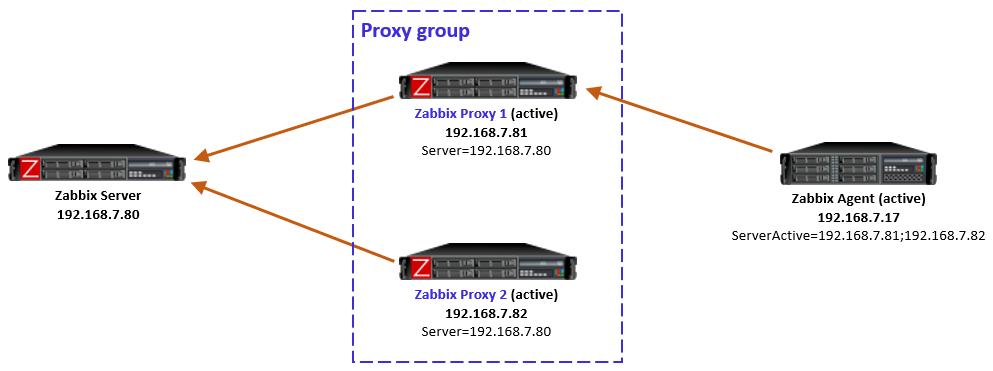
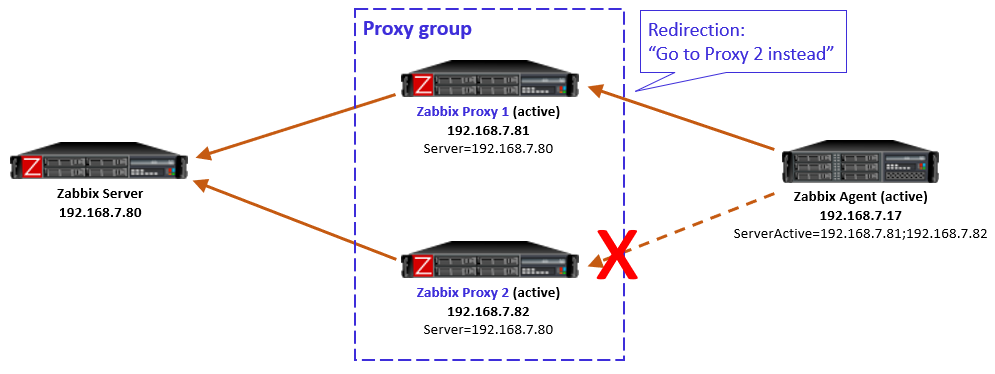
If the host-proxy assignments are changed by the Zabbix server for balancing the load between the proxies, the previously designated proxy will redirect the agent to the correct proxy address, and the situation is optimized again.
Side note: When configuring the proxies in Zabbix UI, there is a new Address for active agents field. That is the address value that is used by the proxies when responding with redirection messages to agents.
Proxy group failure scenarios with active agents
Proxy goes down
If the designated proxy of an active agent goes offline so that it doesn’t respond to the agent anymore, agent realizes the situation, discards the redirection information it had, and reverts to using the proxy addresses from ServerActive directive again.
Now, this is an interesting case because of some timing dependencies. In the proxy group configuration there is the Failover period configuration that controls the Zabbix server’s sensitivity to proxy availability in regards to agent rebalancing within the proxy group. Thus, if the agent reverts to using the other proxies faster than Zabbix server recognizes the situation and notifies the other proxies in the proxy group, the agent will get redirection responses from the other proxies, telling it to use the currently offline proxy. And the same happens again: agent fails to connect to the redirected proxy, and reverts to using the other locally configured proxies, and so on.
In my tests this looping was not very intense, only two rounds every second, so it was not very significant network-wise, and the situation will converge automatically when the Zabbix server has notified the proxies about the host rebalancing.
So this temporary looping is not a big deal. The takeaway is that the whole system converges automatically from a failed proxy.

After the failed proxy has recovered to online mode, the agents stay with their designated proxies in the proxy group.
As mentioned in the beginning, Zabbix server will automatically rebalance the hosts again after some time if needed.
Proxy is online but unreachable from the active agent
Another interesting case is one where the proxy itself is running and communicating with Zabbix server, thus being in online mode in the proxy group, but the active agent is not able to reach it, while still being able to connect to the other proxies in the group. This can happen due to various Internet-related routing issues for example, if the proxies are geographically distributed and far away from the agent.
Let’s start with the situation where the agent is currently monitored by Proxy 2 (as per the last picture above). When the failure starts and agent realizes that the connections to Proxy 2 are not succeeding anymore, the agent reverts to using the configured proxies in ServerActive, connecting to Proxy 1.
But, Proxy 1 knows (by the information given by Zabbix server) that Proxy 2 is still online and that the agent should be monitored by Proxy 2, so Proxy 1 responds to the agent with a redirection.
Obviously that won’t work for the agent as it doesn’t have connectivity to Proxy 2 anymore.
This is a non-recoverable situation (at least with the current Zabbix 7.0.0) while the reachability issue persists: The agent keeps on contacting Proxy 1, keeps receiving the redirection, and the same repeats over and over again.
Note that it does not matter if the agent is now locally reconfigured to only use Proxy 1 in this situation, because the load balancing of the hosts in the proxy group is not controlled by any of the agent-local configuration. The proxy group (led by Zabbix server) has the only authority to assign the hosts to the proxies.
One way to escape from this situation is to stop the unreachable Proxy 2. That way the Zabbix server will eventually notice that Proxy 2 is offline, and the hosts will be automatically rebalanced to other proxies in the group, thus removing the agent-side redirection to the unreachable proxy.
Keep this potential scenario in mind when planning proxy groups with proxy location diversity.
This is also something to think about if your Zabbix proxies have multiple network interfaces, where Zabbix server connectivity is using different interface from the agent connectivity. In that case the same problem can occur due to your own configurations.
Closing words
All in all, proxy load balancing looks very promising feature as it does not require any network-level tricks to achieve load balancing and high availability. In Zabbix 7.0 this is a new feature, so we can expect some further development for the details and behavior in the upcoming releases.
Appendix: Sample capture files
Ideally these capture files should be viewed with Wireshark version 4.3.0rc1 or newer because only the latest Wireshark builds include support for latest Zabbix protocol features. Wireshark 4.2.x should also show most of the Zabbix packet fields. Use display filter “zabbix” to see only the Zabbix protocol packets, but when examining cases more carefully you should also check the plain TCP packets (without any display filter) to get more understanding about the cases.
These samples are taken with Zabbix components version 7.0.0, using default timers in the Zabbix process configurations, and 20 seconds as the proxy group failover period.
Passive agent, with proxy failover
-
- After frame #50 Proxy 1 was stopped and Proxy 2 eventually took over the monitoring
Active agent, with proxy failover
-
- The agent initially communicates with Proxy 1
- Proxy 1 was stopped before frame #425
- Agent connected to Proxy 2, but Proxy 2 keeps sending redirects
- Proxy 2 was assigned the agent before frame #1074, so it took over the monitoring and accepted the agent connections
- Proxy 1 was later restarted (but agent didn’t try to connect to it yet)
- The agent was manually restarted before frame #1498 and it connected to Proxy 1 again, was given a redirection to Proxy 2, and continued with Proxy 2 again
Active agent, with proxy unreachable
-
- Started with Proxy 2 monitoring the agent normally
- Network started dropping all packets from the agent to Proxy 2 before frame #179, agent started connecting to Proxy 1 almost immediately
- From frame #181 on Proxy 1 responds with redirection to Proxy 2 (which is not working)
- Proxy 2 was eventually stopped manually
- Redirections continue until frame #781 when Proxy 1 is assigned the monitoring of the agent, and Proxy 1 starts accepting the agent requests
This post was originally published on the author’s blog.
The post Zabbix 7.0 Proxy Load Balancing appeared first on Zabbix Blog.
AI and the Indian Election
Post Syndicated from Bruce Schneier original https://www.schneier.com/blog/archives/2024/06/ai-and-the-indian-election.html
As India concluded the world’s largest election on June 5, 2024, with over 640 million votes counted, observers could assess how the various parties and factions used artificial intelligence technologies—and what lessons that holds for the rest of the world.
The campaigns made extensive use of AI, including deepfake impersonations of candidates, celebrities and dead politicians. By some estimates, millions of Indian voters viewed deepfakes.
But, despite fears of widespread disinformation, for the most part the campaigns, candidates and activists used AI constructively in the election. They used AI for typical political activities, including mudslinging, but primarily to better connect with voters.
Deepfakes without the deception
Political parties in India spent an estimated US$50 million on authorized AI-generated content for targeted communication with their constituencies this election cycle. And it was largely successful.
Indian political strategists have long recognized the influence of personality and emotion on their constituents, and they started using AI to bolster their messaging. Young and upcoming AI companies like The Indian Deepfaker, which started out serving the entertainment industry, quickly responded to this growing demand for AI-generated campaign material.
In January, Muthuvel Karunanidhi, former chief minister of the southern state of Tamil Nadu for two decades, appeared via video at his party’s youth wing conference. He wore his signature yellow scarf, white shirt, dark glasses and had his familiar stance—head slightly bent sideways. But Karunanidhi died in 2018. His party authorized the deepfake.
In February, the All-India Anna Dravidian Progressive Federation party’s official X account posted an audio clip of Jayaram Jayalalithaa, the iconic superstar of Tamil politics colloquially called “Amma” or “Mother.” Jayalalithaa died in 2016.
Meanwhile, voters received calls from their local representatives to discuss local issues—except the leader on the other end of the phone was an AI impersonation. Bhartiya Janta Party (BJP) workers like Shakti Singh Rathore have been frequenting AI startups to send personalized videos to specific voters about the government benefits they received and asking for their vote over WhatsApp.
Multilingual boost
Deepfakes were not the only manifestation of AI in the Indian elections. Long before the election began, Indian Prime Minister Narendra Modi addressed a tightly packed crowd celebrating links between the state of Tamil Nadu in the south of India and the city of Varanasi in the northern state of Uttar Pradesh. Instructing his audience to put on earphones, Modi proudly announced the launch of his “new AI technology” as his Hindi speech was translated to Tamil in real time.
In a country with 22 official languages and almost 780 unofficial recorded languages, the BJP adopted AI tools to make Modi’s personality accessible to voters in regions where Hindi is not easily understood. Since 2022, Modi and his BJP have been using the AI-powered tool Bhashini, embedded in the NaMo mobile app, to translate Modi’s speeches with voiceovers in Telugu, Tamil, Malayalam, Kannada, Odia, Bengali, Marathi and Punjabi.
As part of their demos, some AI companies circulated their own viral versions of Modi’s famous monthly radio show “Mann Ki Baat,” which loosely translates to “From the Heart,” which they voice cloned to regional languages.
Adversarial uses
Indian political parties doubled down on online trolling, using AI to augment their ongoing meme wars. Early in the election season, the Indian National Congress released a short clip to its 6 million followers on Instagram, taking the title track from a new Hindi music album named “Chor” (thief). The video grafted Modi’s digital likeness onto the lead singer and cloned his voice with reworked lyrics critiquing his close ties to Indian business tycoons.
The BJP retaliated with its own video, on its 7-million-follower Instagram account, featuring a supercut of Modi campaigning on the streets, mixed with clips of his supporters but set to unique music. It was an old patriotic Hindi song sung by famous singer Mahendra Kapoor, who passed away in 2008 but was resurrected with AI voice cloning.
Modi himself quote-tweeted an AI-created video of him dancing—a common meme that alters footage of rapper Lil Yachty on stage—commenting “such creativity in peak poll season is truly a delight.”
In some cases, the violent rhetoric in Modi’s campaign that put Muslims at risk and incited violence was conveyed using generative AI tools, but the harm can be traced back to the hateful rhetoric itself and not necessarily the AI tools used to spread it.
The Indian experience
India is an early adopter, and the country’s experiments with AI serve as an illustration of what the rest of the world can expect in future elections. The technology’s ability to produce nonconsensual deepfakes of anyone can make it harder to tell truth from fiction, but its consensual uses are likely to make democracy more accessible.
The Indian election’s embrace of AI that began with entertainment, political meme wars, emotional appeals to people, resurrected politicians and persuasion through personalized phone calls to voters has opened a pathway for the role of AI in participatory democracy.
The surprise outcome of the election, with the BJP’s failure to win its predicted parliamentary majority, and India’s return to a deeply competitive political system especially highlights the possibility for AI to have a positive role in deliberative democracy and representative governance.
Lessons for the world’s democracies
It’s a goal of any political party or candidate in a democracy to have more targeted touch points with their constituents. The Indian elections have shown a unique attempt at using AI for more individualized communication across linguistically and ethnically diverse constituencies, and making their messages more accessible, especially to rural, low-income populations.
AI and the future of participatory democracy could make constituent communication not just personalized but also a dialogue, so voters can share their demands and experiences directly with their representatives—at speed and scale.
India can be an example of taking its recent fluency in AI-assisted party-to-people communications and moving it beyond politics. The government is already using these platforms to provide government services to citizens in their native languages.
If used safely and ethically, this technology could be an opportunity for a new era in representative governance, especially for the needs and experiences of people in rural areas to reach Parliament.
This essay was written with Vandinika Shukla and previously appeared in The Conversation.
[$] LWN.net Weekly Edition for June 13, 2024
Post Syndicated from corbet original https://lwn.net/Articles/977365/
The LWN.net Weekly Edition for June 13, 2024 is available.
The Great Wine Blight – saving the grapes
Post Syndicated from The History Guy: History Deserves to Be Remembered original https://www.youtube.com/watch?v=G5WHdD9bIc0
ESPHome Summer Release Party
Post Syndicated from Home Assistant original https://www.youtube.com/watch?v=hbcGz3ZlUX4
New York Times bestselling author on the relationship between cognitive biases and decision making
Post Syndicated from Talks at Google original https://www.youtube.com/watch?v=1KAmW80CL44
Accelerate your Automation for SAP on AWS Operations using Amazon Q Developer
Post Syndicated from Bidwan Baruah original https://aws.amazon.com/blogs/devops/accelerate-your-automation-for-sap-on-aws-operations-using-amazon-q-developer/
Based on discussions with several SAP on AWS customers, we have discovered that the number of SAP administration or operational task requirements often exceed the capacity of the available team. Due to lack of time, resources, and heavy focus on operations, strategic initiatives like digital transformations often remain unaddressed. Although 1P and 3P automation solutions are available, many organizations do not adopt them, due to cost, internal processes, complexities associated with managing multiple-vendor tooling, etc. While some SAP BASIS teams have successfully automated some tasks, the level of effort and skill set to develop custom scripts is not widely available, in some cases due to a skills gap or insufficient knowledge in scripting. In this blog post we will use Amazon Q Developer, a generative AI coding assistant, and use natural language to create SAP operational automation in a more productive fashion.
Walkthrough
Amazon Q Developer acts as a bridge between logical comprehension and practical coding implementation. It enables SAP BASIS administrators to translate their operational understanding into code by interpreting their logic, articulated in natural language. This approach allows us to accelerate the development process of automation scripts, democratizing script development to a broader base of infrastructure and application administrators. In this case, Amazon Q provides coding suggestions by converting natural English language explanations of logic into operational code, such as an automation script for the operational activity (e.g., Start and Stop of SAP).
The solution is orchestrated in two stages:
- Administrators use Q Developer using natural language to formulate a shell script to perform start and stop operations on a single Amazon EC2 instance.
- Q Developer validates inputs, assessment of system installation, and execution of start/stop commands.
Prerequisites
For the walkthrough, we are using VS Codium for our integrated development environment (IDE) with the latest Amazon Q Developer extension installed. However, you may use any of the supported IDEs.
Prior to starting, it may be important to model the entire workflow. For example, the script may need a number of conditions, checks, and logical considerations. However, for the purposes of our scenario, we focus on three specific conditions, checks, and logical processes. For your specific use case, we recommend incorporating additional logical steps, if needed.
The script we will write has 3 arguments in order to Start/Stop the SAP System.
- The SAP System ID (SID)
- The SAP Instance Number
- The command ‘start’ or ‘stop’ – will start or stop the SAP system.
To run the script the command should look like the example below:
scriptname.sh <SID> <InstanceNumber> <start/stop>
There are also four conditions, checks, and logic blocks in the script,
- First, check if the command has 3 arguments. If any are missing, the system will not be able to perform the intended action.
- Second, check if the SAP system (SID) we are trying to manage is available in the current EC2 instance.
- Third, the SAP Instance Number is checked in the current EC2 instance.
- Lastly, the script needs to tell the system which command to run, based on the third argument (e.g., start or stop).
Important: Comments in Shell scripts start with a ‘#’ sign, and the arguments are indicated by a ‘$<n>’ format; n being the sequence number of the argument. So, in our case:
<SID> : $1
<InstanceNumber> : $2
<start/stop> : $3
Now that we have established the structure of how to call the script and what arguments we are going to pass, lets write the comments in English to get code recommendations from Amazon Q.
Getting Started
1. In VS Codium, create a ‘New File’ for our script. Assign a file name and make sure the file extension ends with a ‘.sh’ (e.g., startstopsap.sh).
Below is an example of the comments we used for our logic. Copy paste this into the file.
Info: The first line #!/bin/bash tells the system to execute the script using the Bash shell. The rest of the lines tell what the script needs to check, the logic it needs to follow and the commands it needs to run.
#!/bin/bash
#This is a script that is going to start and stop an SAP instance based on the given inputs to the script
#The script will receive 3 inputs. <SID> <InstanceNumber> <start/stop>
#If the script did not get 3 inputs, the script will fail with showing the usage guidance.
#Check if the file "/usr/sap/sapservices" exists. If not, fail.
#We will check if the given SID is installed in this server by searching the SID in the file "/usr/sap/sapservices"  If it does not exist, fail, otherwise continue.
#Then we will check if the given instance number is installed in this server by searching the Instance Number in the file "/usr/sap/sapservices”. If it does not exist, fail, otherwise continue.
#If all conditions met, check the third output and if it's start, start the sap system using "sapcontrol -nr InstanceNumber -function Start"
#If all conditions met, see the third output and if it's stop, stop the sap system using "sapcontrol -nr InstanceNumber -function Stop"
#Then wait for 2 minutes for the stop command to complete (if stop)
#Remove the ipcs (if stop) by the command “cleanipc InstanceNumber remove”
#If the third input is not start or stop, fail.
#End the script.
2. Type #Check Input and press Enter, Q will start making code suggestions. If it does not, you can manually invoke suggestions with ‘Option+C’ on Mac or ‘Alt+C’ on Windows.

Figure 1 – Amazon Q Developer Suggestions
3. To accept suggested code, either press ‘Tab’ or click on ‘Accept’.
The ‘< 1/2 >’ means that there are two suggestions and you may accept the one that is most appropriate for the scenario. Toggle between the suggestions using right and left arrows on your keyboard.
We will accept the code and then press Enter to move to the next line. As soon as you press the Enter key, the next line of code will be suggested.
Important: Amazon Q Developer is non-deterministic, which means that code suggestions produced may be different from what is shown in the blog. If the suggestions look different for you, you can use the arrows on your keyboard to toggle between recommendations, as shown below.
4. Accept the next block of code and eventually close the IF loop. Press Enter.
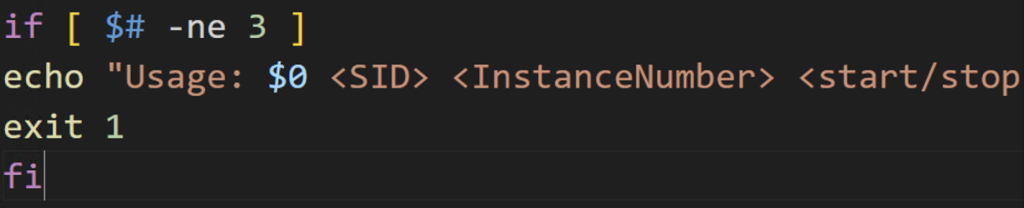
Figure 2 – Reviewing Suggestions
5. Based on comments in the file, Q should should have enough context to suggest what needs to be done next. The script should check if the /usr/sap/sapservices file exists.
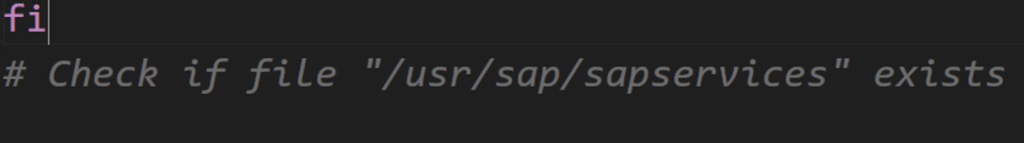
Figure 3 – Checking dependencies
6. Once you accept the code, Q will propose the next lines. Keep accepting the appropriate lines of code until all required sections are completed. Once the script is ready, it should look similar to what is depicted below. Save the script.
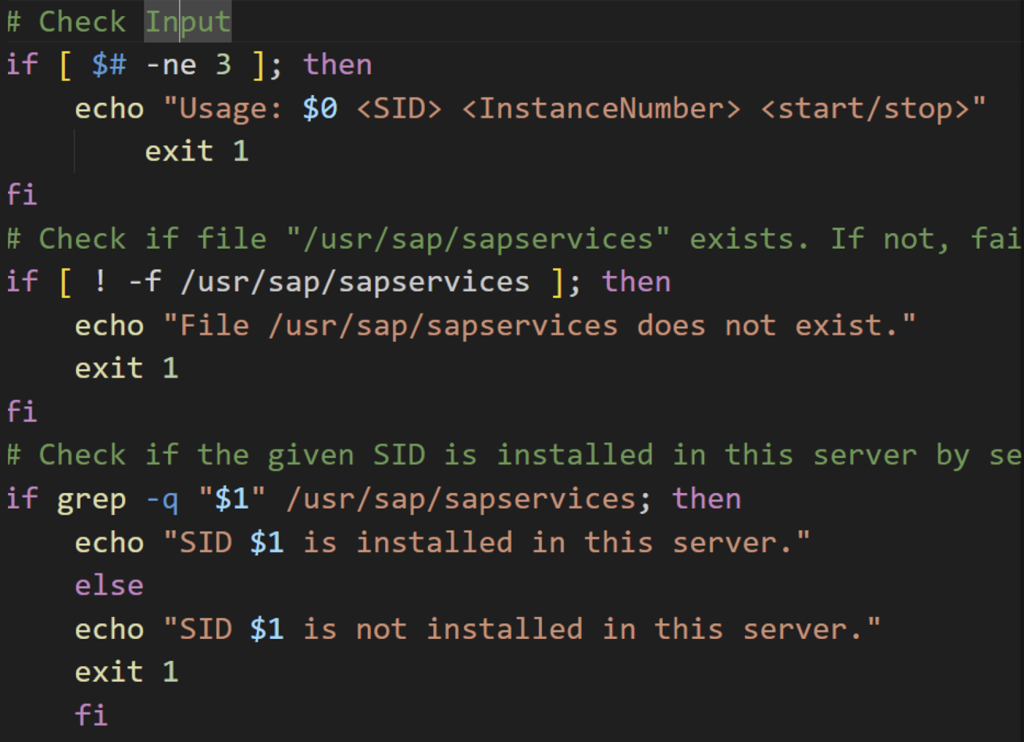
Figure 4 – First part of the script
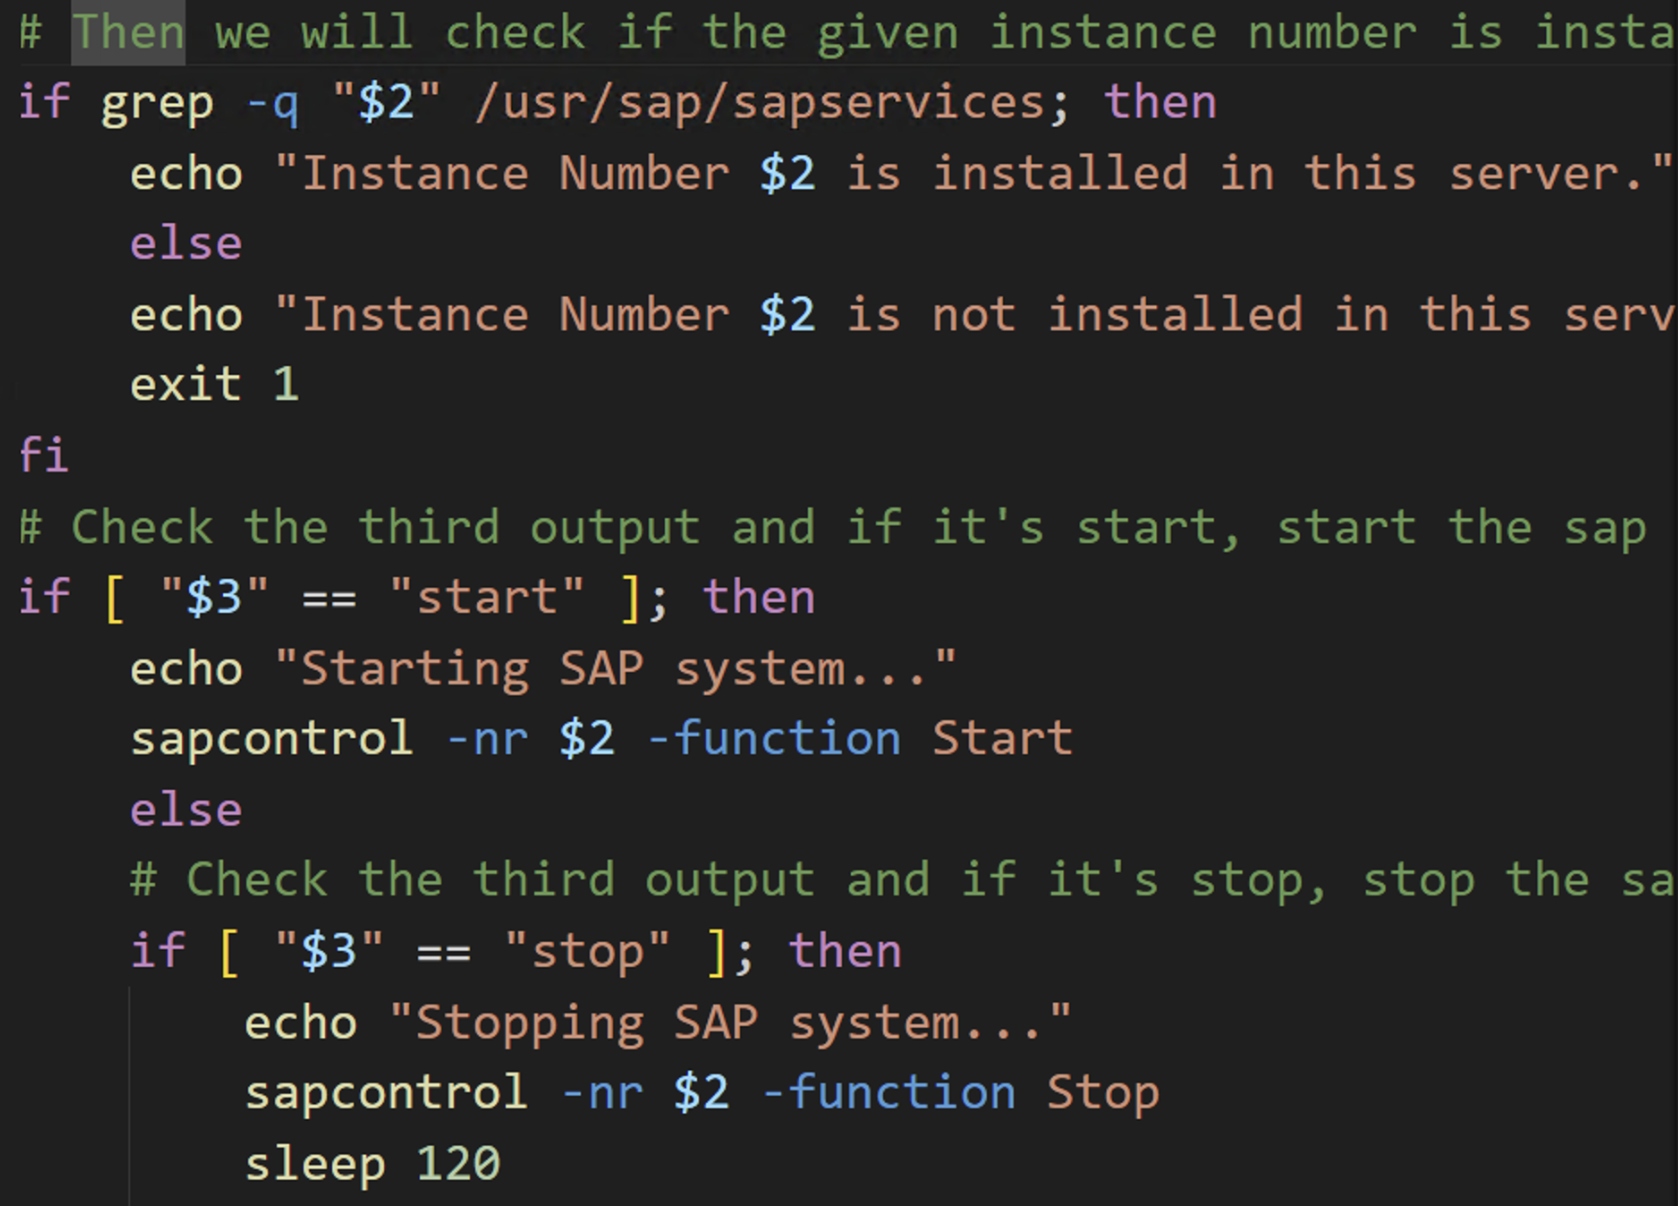
Figure 5 – Second part of the script
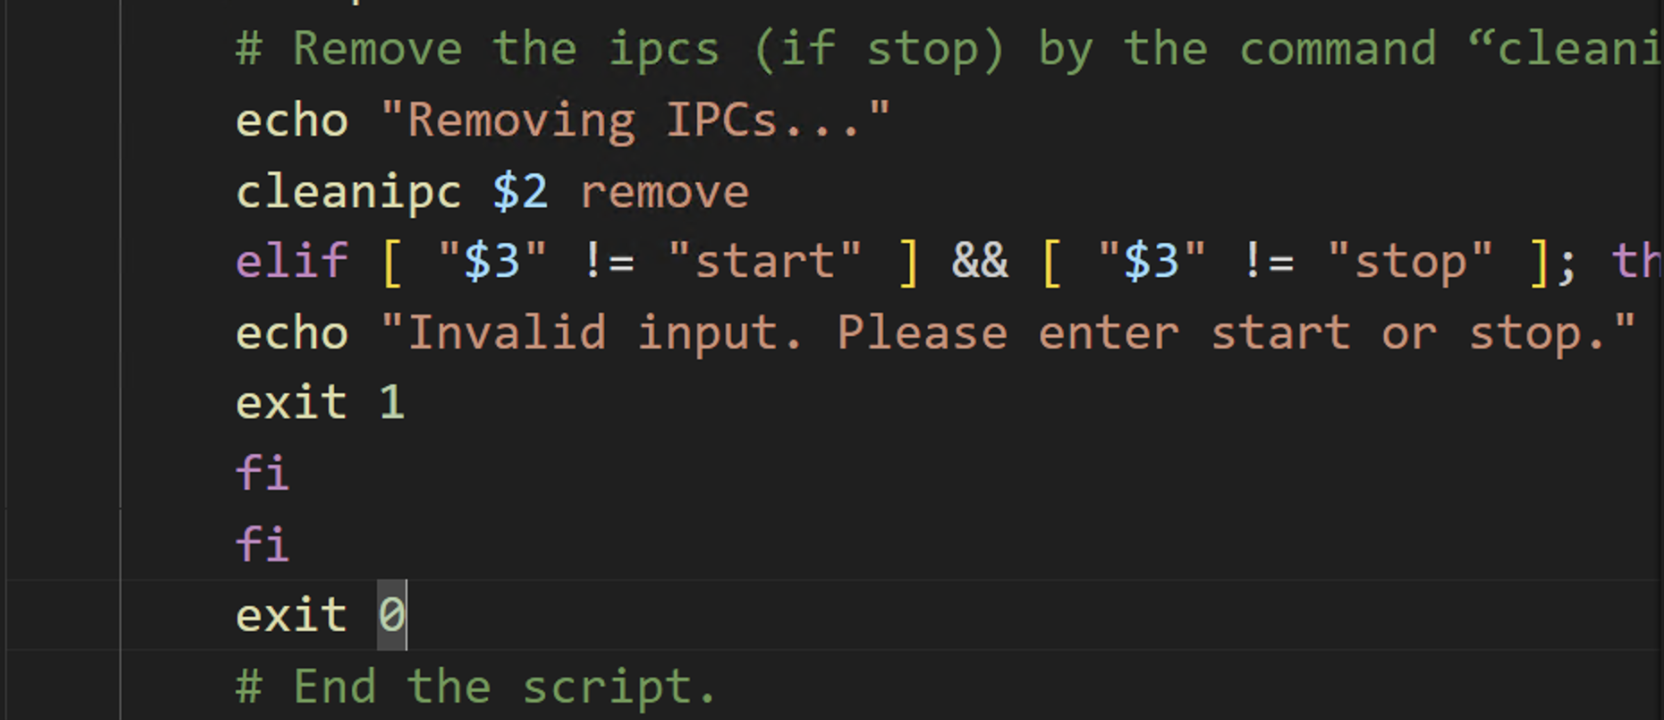
Figure 6 – Third part of the script
7. Go to the EC2 instance hosting SAP and use your local text editor (e.g., vi) to create a file with the “.sh” file extension. Let’s say the file is named SAPStopStart.sh
8. Paste the contents of the code from your file in the IDE.
9. Save the file and add execute permissions to the file by running chmod +x SAPStopStart.sh
10. To run the script, use the appropriate arguments as shown below.
SAPStopStart.sh <SID> <InstanceNumber> <start/stop>
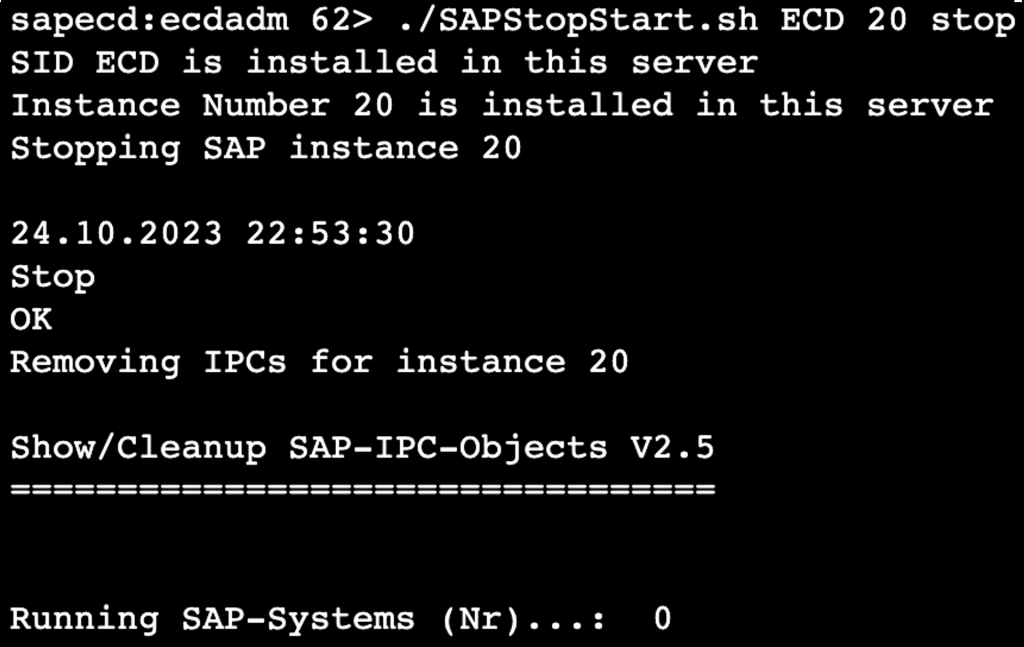
Figure 7 – Running the script
Conclusion
Although in this blog post we used a simple example of starting and stopping an SAP system, Amazon Q Developer can be extended to a broader spectrum of SAP operational scenarios. Q Developer’s capabilities can be used to harness a broad range of SAP-related use cases, such as kernel patching, database patching, and beyond. In addition to code suggestions, Q Developer offers a security scanning feature, which can be used for fortifying application security. Amazon Q Developer is available in Pro and Free Tiers and does not require an AWS Account to get started. For the purpose of this blog, we used the Amazon Q Developer Free Tier. To learn more about Amazon Q Developer, click to go to its product page.
GitHub Availability Report: May 2024
Post Syndicated from Jakub Oleksy original https://github.blog/2024-06-12-github-availability-report-may-2024/
In May, we experienced one incident that resulted in significant degraded performance across GitHub services.
May 21 11:40 UTC (lasting 7 hours 26 minutes)
On May 21, various GitHub services experienced latency due to a configuration change in an upstream cloud provider. GitHub Copilot Chat experienced p50 latency of up to 2.5s and p95 latency of up to 6s, GitHub Actions was degraded with 20 60 minute delays for workflow run updates, and GitHub Enterprise Importer customers experienced longer migration run times due to Actions delays.
Actions users experienced their runs stuck in stale states for some time even if the underlying runner was completed successfully, and Copilot Chat users experienced delays in receiving responses to their requests. Billing related metrics for budget notifications and UI reporting were also delayed, leading to outdated billing details. No data was lost and reporting was restored after mitigation.
We determined that the issue was caused by a scheduled operating system upgrade that resulted in unintended and uneven distribution of traffic within the cluster. A short- term strategy of increasing the number of network routes between our data centers and cloud provider helped mitigate the incident.
To prevent recurrence of the incidents, we have identified and are fixing gaps in our monitoring and alerting for load thresholds to improve both detection and mitigation time.
Please follow our status page for real-time updates on status changes and post-incident recaps. To learn more about what we’re working on, check out the GitHub Engineering Blog.
The post GitHub Availability Report: May 2024 appeared first on The GitHub Blog.
Cockpit project releases Cockpit Files plugin
Post Syndicated from jzb original https://lwn.net/Articles/978156/
The Cockpit project has
announced
the first release of Cockpit
Files, a plugin for Cockpit that allows file management on your server
via a web browser:
Cockpit Files was initially started by Google Summer of Code (GSoC)
student Mahmoud Hamdy
and is now under active development by the Cockpit team. The goal is
to replace the functionality of the cockpit-navigator
plugin from 45Drives and include automated testing per commit, a
standard PatternFly-based interface, and consistency with the rest of
Cockpit.
Development builds for Fedora are available via a
Copr repository, and packages are expected for Arch, Debian, and
Fedora. LWN covered the
Cockpit project in March.
Ingest and analyze your data using Amazon OpenSearch Service with Amazon OpenSearch Ingestion
Post Syndicated from Sharmila Shanmugam original https://aws.amazon.com/blogs/big-data/ingest-and-analyze-your-data-using-amazon-opensearch-service-with-amazon-opensearch-ingestion/
In today’s data-driven world, organizations are continually confronted with the task of managing extensive volumes of data securely and efficiently. Whether it’s customer information, sales records, or sensor data from Internet of Things (IoT) devices, the importance of handling and storing data at scale with ease of use is paramount.
A common use case that we see amongst customers is to search and visualize data. In this post, we show how to ingest CSV files from Amazon Simple Storage Service (Amazon S3) into Amazon OpenSearch Service using the Amazon OpenSearch Ingestion feature and visualize the ingested data using OpenSearch Dashboards.
OpenSearch Service is a fully managed, open source search and analytics engine that helps you with ingesting, searching, and analyzing large datasets quickly and efficiently. OpenSearch Service enables you to quickly deploy, operate, and scale OpenSearch clusters. It continues to be a tool of choice for a wide variety of use cases such as log analytics, real-time application monitoring, clickstream analysis, website search, and more.
OpenSearch Dashboards is a visualization and exploration tool that allows you to create, manage, and interact with visuals, dashboards, and reports based on the data indexed in your OpenSearch cluster.
Visualize data in OpenSearch Dashboards
Visualizing the data in OpenSearch Dashboards involves the following steps:
- Ingest data – Before you can visualize data, you need to ingest the data into an OpenSearch Service index in an OpenSearch Service domain or Amazon OpenSearch Serverless collection and define the mapping for the index. You can specify the data types of fields and how they should be analyzed; if nothing is specified, OpenSearch Service automatically detects the data type of each field and creates a dynamic mapping for your index by default.
- Create an index pattern – After you index the data into your OpenSearch Service domain, you need to create an index pattern that enables OpenSearch Dashboards to read the data stored in the domain. This pattern can be based on index names, aliases, or wildcard expressions. You can configure the index pattern by specifying the timestamp field (if applicable) and other settings that are relevant to your data.
- Create visualizations – You can create visuals that represent your data in meaningful ways. Common types of visuals include line charts, bar charts, pie charts, maps, and tables. You can also create more complex visualizations like heatmaps and geospatial representations.
Ingest data with OpenSearch Ingestion
Ingesting data into OpenSearch Service can be challenging because it involves a number of steps, including collecting, converting, mapping, and loading data from different data sources into your OpenSearch Service index. Traditionally, this data was ingested using integrations with Amazon Data Firehose, Logstash, Data Prepper, Amazon CloudWatch, or AWS IoT.
The OpenSearch Ingestion feature of OpenSearch Service introduced in April 2023 makes ingesting and processing petabyte-scale data into OpenSearch Service straightforward. OpenSearch Ingestion is a fully managed, serverless data collector that allows you to ingest, filter, enrich, and route data to an OpenSearch Service domain or OpenSearch Serverless collection. You configure your data producers to send data to OpenSearch Ingestion, which automatically delivers the data to the domain or collection that you specify. You can configure OpenSearch Ingestion to transform your data before delivering it.
OpenSearch Ingestion scales automatically to meet the requirements of your most demanding workloads, helping you focus on your business logic while abstracting away the complexity of managing complex data pipelines. It’s powered by Data Prepper, an open source streaming Extract, Transform, Load (ETL) tool that can filter, enrich, transform, normalize, and aggregate data for downstream analysis and visualization.
OpenSearch Ingestion uses pipelines as a mechanism that consists of three major components:
- Source – The input component of a pipeline. It defines the mechanism through which a pipeline consumes records.
- Processors – The intermediate processing units that can filter, transform, and enrich records into a desired format before publishing them to the sink. The processor is an optional component of a pipeline.
- Sink – The output component of a pipeline. It defines one or more destinations to which a pipeline publishes records. A sink can also be another pipeline, which allows you to chain multiple pipelines together.
You can process data files written in S3 buckets in two ways: by processing the files written to Amazon S3 in near real time using Amazon Simple Queue Service (Amazon SQS), or with the scheduled scans approach, in which you process the data files in batches using one-time or recurring scheduled scan configurations.
In the following section, we provide an overview of the solution and guide you through the steps to ingest CSV files from Amazon S3 into OpenSearch Service using the S3-SQS approach in OpenSearch Ingestion. Additionally, we demonstrate how to visualize the ingested data using OpenSearch Dashboards.
Solution overview
The following diagram outlines the workflow of ingesting CSV files from Amazon S3 into OpenSearch Service.

The workflow comprises the following steps:
- The user uploads CSV files into Amazon S3 using techniques such as direct upload on the AWS Management Console or AWS Command Line Interface (AWS CLI), or through the Amazon S3 SDK.
- Amazon SQS receives an Amazon S3 event notification as a JSON file with metadata such as the S3 bucket name, object key, and timestamp.
- The OpenSearch Ingestion pipeline receives the message from Amazon SQS, loads the files from Amazon S3, and parses the CSV data from the message into columns. It then creates an index in the OpenSearch Service domain and adds the data to the index.
- Lastly, you create an index pattern and visualize the ingested data using OpenSearch Dashboards.
OpenSearch Ingestion provides a serverless ingestion framework to effortlessly ingest data into OpenSearch Service with just a few clicks.
Prerequisites
Make sure you meet the following prerequisites:
- You must have access to the AWS account in which you wish to set up this solution.
- You must have created an OpenSearch Service domain. For instructions, refer to Creating and managing Amazon OpenSearch Service domains.
Create an SQS queue
Amazon SQS offers a secure, durable, and available hosted queue that lets you integrate and decouple distributed software systems and components. Create a standard SQS queue and provide a descriptive name for the queue, then update the access policy by navigating to the Amazon SQS console, opening the details of your queue, and editing the policy on the Advanced tab.
The following is a sample access policy you could use for reference to update the access policy:
SQS FIFO (First-In-First-Out) queues aren’t supported as an Amazon S3 event notification destination. To send a notification for an Amazon S3 event to an SQS FIFO queue, you can use Amazon EventBridge.

Create an S3 bucket and enable Amazon S3 event notification
Create an S3 bucket that will be the source for CSV files and enable Amazon S3 notifications. The Amazon S3 notification invokes an action in response to a specific event in the bucket. In this workflow, whenever there in an event of type S3:ObjectCreated:*, the event sends an Amazon S3 notification to the SQS queue created in the previous step. Refer to Walkthrough: Configuring a bucket for notifications (SNS topic or SQS queue) to configure the Amazon S3 notification in your S3 bucket.

Create an IAM policy for the OpenSearch Ingest pipeline
Create an AWS Identity and Access Management (IAM) policy for the OpenSearch pipeline with the following permissions:
- Read and delete rights on Amazon SQS
GetObjectrights on Amazon S3- Describe domain and
ESHttprights on your OpenSearch Service domain
The following is an example policy:

Create an IAM role and attach the IAM policy
A trust relationship defines which entities (such as AWS accounts, IAM users, roles, or services) are allowed to assume a particular IAM role. Create an IAM role for the OpenSearch Ingestion pipeline (osis-pipelines.amazonaws.com), attach the IAM policy created in the previous step, and add the trust relationship to allow OpenSearch Ingestion pipelines to write to domains.

Configure an OpenSearch Ingestion pipeline
A pipeline is the mechanism that OpenSearch Ingestion uses to move data from its source (where the data comes from) to its sink (where the data goes). OpenSearch Ingestion provides out-of-the-box configuration blueprints to help you quickly set up pipelines without having to author a configuration from scratch. Set up the S3 bucket as the source and OpenSearch Service domain as the sink in the OpenSearch Ingestion pipeline with the following blueprint:
On the OpenSearch Service console, create a pipeline with the name my-pipeline. Keep the default capacity settings and enter the preceding pipeline configuration in the Pipeline configuration section.
Update the configuration setting with the previously created IAM roles to read from Amazon S3 and write into OpenSearch Service, the SQS queue URL, and the OpenSearch Service domain endpoint.

Validate the solution
To validate this solution, you can use the dataset SaaS-Sales.csv. This dataset contains transaction data from a software as a service (SaaS) company selling sales and marketing software to other companies (B2B). You can initiate this workflow by uploading the SaaS-Sales.csv file to the S3 bucket. This invokes the pipeline and creates an index in the OpenSearch Service domain you created earlier.
Follow these steps to validate the data using OpenSearch Dashboards.
First, you create an index pattern. An index pattern is a way to define a logical grouping of indexes that share a common naming convention. This allows you to search and analyze data across all matching indexes using a single query or visualization. For example, if you named your indexes csv-ingest-index-2024-01-01 and csv-ingest-index-2024-01-02 while ingesting the monthly sales data, you can define an index pattern as csv-* to encompass all these indexes.

Next, you create a visualization. Visualizations are powerful tools to explore and analyze data stored in OpenSearch indexes. You can gather these visualizations into a real time OpenSearch dashboard. An OpenSearch dashboard provides a user-friendly interface for creating various types of visualizations such as charts, graphs, maps, and dashboards to gain insights from data.
You can visualize the sales data by industry with a pie chart with the index pattern created in the previous step. To create a pie chart, update the metrics details as follows on the Data tab:
- Set Metrics to Slice
- Set Aggregation to Sum
- Set Field to sales

To view the industry-wise sales details in the pie chart, add a new bucket on the Data tab as follows:
- Set Buckets to Split Slices
- Set Aggregation to Terms
- Set Field to
industry.keyword

You can visualize the data by creating more visuals in the OpenSearch dashboard.

Clean up
When you’re done exploring OpenSearch Ingestion and OpenSearch Dashboards, you can delete the resources you created to avoid incurring further costs.
Conclusion
In this post, you learned how to ingest CSV files efficiently from S3 buckets into OpenSearch Service with the OpenSearch Ingestion feature in a serverless way without requiring a third-party agent. You also learned how to analyze the ingested data using OpenSearch dashboard visualizations. You can now explore extending this solution to build OpenSearch Ingestion pipelines to load your data and derive insights with OpenSearch Dashboards.
About the Authors
 Sharmila Shanmugam is a Solutions Architect at Amazon Web Services. She is passionate about solving the customers’ business challenges with technology and automation and reduce the operational overhead. In her current role, she helps customers across industries in their digital transformation journey and build secure, scalable, performant and optimized workloads on AWS.
 Harsh Bansal is an Analytics Solutions Architect with Amazon Web Services. In his role, he collaborates closely with clients, assisting in their migration to cloud platforms and optimizing cluster setups to enhance performance and reduce costs. Before joining AWS, he supported clients in leveraging OpenSearch and Elasticsearch for diverse search and log analytics requirements.
 Rohit Kumar works as a Cloud Support Engineer in the Support Engineering team at Amazon Web Services. He focuses on Amazon OpenSearch Service, offering guidance and technical help to customers, helping them create scalable, highly available, and secure solutions on AWS Cloud. Outside of work, Rohit enjoys watching or playing cricket. He also loves traveling and discovering new places. Essentially, his routine revolves around eating, traveling, cricket, and repeating the cycle.