Linux Boot Partitions

Post Syndicated from original https://0pointer.net/blog/linux-boot-partitions.html

💽 Linux Boot Partitions and How to Set Them Up 🚀

Let’s have a look how traditional Linux distributions set up
/boot/ and the ESP, and how this could be improved.

How Linux distributions traditionally have been setting up their
“boot” file systems has been varying to some degree, but the most
common choice has been to have a separate partition mounted to
/boot/. Usually the partition is formatted as a Linux file system
such as ext2/ext3/ext4. The partition contains the kernel images, the
initrd and various boot loader resources. Some distributions, like
Debian and Ubuntu, also store ancillary files associated with the
kernel here, such as kconfig or System.map. Such a traditional
boot partition is only defined within the context of the distribution,
and typically not immediately recognizable as such when looking just
at the partition table (i.e. it uses the generic Linux partition type
UUID).

With the arrival of UEFI a new partition relevant for boot appeared,
the EFI System Partition (ESP). This partition is defined by the
firmware environment, but typically accessed by Linux to install or
update boot loaders. The choice of file system is not up to Linux, but
effectively mandated by the UEFI specifications: vFAT. In theory it
could be formatted as other file systems too. However, this would
require the firmware to support file systems other than vFAT. This is
rare and firmware specific though, as vFAT is the only file system
mandated by the UEFI specification. In other words, vFAT is the only
file system which is guaranteed to be universally supported.

There’s a major overlap of the type of the data typically stored in
the ESP and in the traditional boot partition mentioned earlier: a
variety of boot loader resources as well as kernels/initrds.

Unlike the traditional boot partition, the ESP is easily recognizable
in the partition table via its GPT partition type UUID. The ESP is
also a shared resource: all OSes installed on the same disk will
share it and put their boot resources into them (as opposed to the
traditional boot partition, of which there is one per installed Linux
OS, and only that one will put resources there).

To summarize, the most common setup on typical Linux distributions is
something like this:

Type Linux Mount Point File System Choice
Linux “Boot” Partition /boot/ Any Linux File System, typically ext2/ext3/ext4
ESP /boot/efi/ vFAT

As mentioned, not all distributions or local installations agree on
this. For example, it’s probably worth mentioning that some
distributions decided to put kernels onto the root file system of the
OS itself. For this setup to work the boot loader itself [sic!] must
implement a non-trivial part of the storage stack. This may have to
include RAID, storage drivers, networked storage, volume management,
disk encryption, and Linux file systems. Leaving aside the conceptual
argument that complex storage stacks don’t belong in boot loaders
there are very practical problems with this approach. Reimplementing
the Linux storage stack in all its combinations is a massive amount of
work. It took decades to implement what we have on Linux now, and it
will take a similar amount of work to catch up in the boot loader’s
reimplementation. Moreover, there’s a political complication: some
Linux file system communities made clear they have no interest in
supporting a second file system implementation that is not maintained
as part of the Linux kernel.

What’s interesting is that the /boot/efi/ mount point is nested
below the /boot/ mount point. This effectively means that to access
the ESP the Boot partition must exist and be mounted first. A system
with just an ESP and without a Boot partition hence doesn’t fit well
into the current model. The Boot partition will also have to carry an
empty “efi” directory that can be used as the inner mount point, and
serves no other purpose.

Given that the traditional boot partition and the ESP may carry
similar data (i.e. boot loader resources, kernels, initrds) one may
wonder why they are separate concepts. Historically, this was the
easiest way to make the pre-UEFI way how Linux systems were booted
compatible with UEFI: conceptually, the ESP can be seen as just a
minor addition to the status quo ante that way. Today, primarily two
reasons remained:

  • Some distributions see a benefit in support for complex Linux file
    system concepts such as hardlinks, symlinks, SELinux labels/extended
    attributes and so on when storing boot loader resources. – I
    personally believe that making use of features in the boot file
    systems that the firmware environment cannot really make sense of is
    very clearly not advisable. The UEFI file system APIs know no
    symlinks, and what is SELinux to UEFI anyway? Moreover, putting more
    than the absolute minimum of simple data files into such file
    systems immediately raises questions about how to authenticate them
    comprehensively (including all fancy metadata) cryptographically on
    use (see below).

  • On real-life systems that ship with non-Linux OSes the ESP often
    comes pre-installed with a size too small to carry multiple Linux
    kernels and initrds. As growing the size of an existing ESP is
    problematic (for example, because there’s no space available
    immediately after the ESP, or because some low-quality firmware
    reacts badly to the ESP changing size) placing the kernel in a
    separate, secondary partition (i.e. the boot partition) circumvents
    these space issues.

File System Choices

We already mentioned that the ESP effectively has to be vFAT, as that
is what UEFI (more or less) guarantees. The file system choice for the
boot partition is not quite as restricted, but using arbitrary Linux
file systems is not really an option either. The file system must be
accessible by both the boot loader and the Linux OS. Hence only file
systems that are available in both can be used. Note that such
secondary implementations of Linux file systems in the boot
environment – limited as they may be – are not typically welcomed
or supported by the maintainers of the canonical file system
implementation in the upstream Linux kernel. Modern file systems are
notoriously complicated and delicate and simply don’t belong in boot
loaders.

In a trusted boot world, the two file systems for the ESP and the
/boot/ partition should be considered untrusted: any code or
essential data read from them must be authenticated cryptographically
before use. And even more, the file system structures themselves are
also untrusted. The file system driver reading them must be careful
not to be exploitable by a rogue file system image. Effectively this
means a simple file system (for which a driver can be more easily
validated and reviewed) is generally a better choice than a complex
file system (Linux file system communities made it pretty clear that
robustness against rogue file system images is outside of their scope
and not what is being tested for.).

Some approaches tried to address the fact that boot partitions are
untrusted territory by encrypting them via a mechanism compatible to
LUKS, and adding decryption capabilities to the boot loader so it can
access it. This misses the point though, as encryption does not imply
authentication, and only authentication is typically desired. The boot
loader and kernel code are typically Open Source anyway, and hence
there’s little value in attempting to keep secret what is already
public knowledge. Moreover, encryption implies the existence of an
encryption key. Physically typing in the decryption key on a keyboard
might still be acceptable on desktop systems with a single human user
in front, but outside of that scenario unlock via TPM, PKCS#11 or
network services are typically required. And even on the desktop FIDO2
unlocking is probably the future. Implementing all the technologies
these unlocking mechanisms require in the boot loader is not
realistic, unless the boot loader shall become a full OS on its own as
it would require subsystems for FIDO2, PKCS#11, USB, Bluetooth
network, smart card access, and so on.

File System Access Patterns

Note that traditionally both mentioned partitions were read-only
during most parts of the boot. Only later, once the OS is up, write
access was required to implement OS or boot loader updates. In today’s
world things have become a bit more complicated. A modern OS might
want to require some limited write access already in the boot loader,
to implement boot counting/boot assessment/automatic fallback (e.g.,
if the same kernel fails to boot 3 times, automatically revert to
older kernel), or to maintain an early storage-based random seed. This
means that even though the file system is mostly read-only, we need
limited write access after all.

vFAT cannot compete with modern Linux file systems such as btrfs
when it comes to data safety guarantees. It’s not a journaled file
system, does not use CoW or any form of checksumming. This means when
used for the system boot process we need to be particularly careful
when accessing it, and in particular when making changes to it (i.e.,
trying to keep changes local to single sectors). It is essential to
use write patterns that minimize the chance of file system
corruption. Checking the file system (“fsck”) before modification
(and probably also reading) is important, as is ensuring the file
system is put into a “clean” state as quickly as possible after each
modification.

Code quality of the firmware in typical systems is known to not always
be great. When relying on the file system driver included in the
firmware it’s hence a good idea to limit use to operations that have a
better chance to be correctly implemented. For example, when writing
from the UEFI environment it might be wise to avoid any operation that
requires allocation algorithms, but instead focus on access patterns
that only override already written data, and do not require allocation
of new space for the data.

Besides write access from the boot loader code (as described above)
these file systems will require write access from the OS, to
facilitate boot loader and kernel/initrd updates. These types of
accesses are generally not fully random accesses (i.e., never partial
file updates) but usually mean adding new files as whole, and removing
old files as a whole. Existing files are typically not modified once
created, though they might be replaced wholly by newer versions.

Boot Loader Updates

Note that the update cycle frequencies for boot loaders and for
kernels/initrds are probably similar these days. While kernels are
still vastly more complex than boot loaders, security issues are
regularly found in both. In particular, as boot loaders (through
“shim” and similar components) carry certificate/keyring and denylist
information, which typically require frequent updates. Update cycles
hence have to be expected regularly.

Boot Partition Discovery

The traditional boot partition was not recognizable by looking just at
the partition table. On MBR systems it was directly referenced from
the boot sector of the disk, and on EFI systems from information
stored in the ESP. This is less than ideal since by losing this
entrypoint information the system becomes unbootable. It’s typically a
better, more robust idea to make boot partitions recognizable as such
in the partition table directly. This is done for the ESP via the GPT
partition type UUID. For traditional boot partitions this was not done
though.

Current Situation Summary

Let’s try to summarize the above:

  • Currently, typical deployments use two distinct boot partitions,
    often using two distinct file system implementations

  • Firmware effectively dictates existence of the ESP, and the use of
    vFAT

  • In userspace view: the ESP mount is nested below the general
    Boot partition mount

  • Resources stored in both partitions are primarily kernel/initrd, and
    boot loader resources

  • The mandatory use of vFAT brings certain data safety challenges,
    as does quality of firmware file system driver code

  • During boot limited write access is needed, during OS runtime
    more comprehensive write access is needed (though still not fully
    random).

  • Less restricted but still limited write patterns from OS
    environment
    (only full file additions/updates/removals, during
    OS/boot loader updates)

  • Boot loaders should not implement complex storage stacks.

  • ESP can be auto-discovered from the partition table, traditional
    boot partition cannot.

  • ESP and the traditional boot partition are not protected
    cryptographically neither in structure nor contents. It is expected
    that loaded files are individually authenticated after being read.

  • The ESP is a shared resource — the traditional boot partition a
    resource specific to each installed Linux OS on the same disk.

How to Do it Better

Now that we have discussed many of the issues with the status quo ante, let’s see how we can do things better:

  • Two partitions for essentially the same data is a bad idea. Given
    they carry data very similar or identical in nature, the common case
    should be to have only one (but see below).

  • Two file system implementations are worse than one. Given that vFAT
    is more or less mandated by UEFI and the only format universally
    understood by all players, and thus has to be used anyway, it might
    as well be the only file system that is used.

  • Data safety is unnecessarily bad so far: both ESP and boot partition
    are continuously mounted from the OS, even though access is pretty
    restricted: outside of update cycles access is typically not
    required.

  • All partitions should be auto-discoverable/self-descriptive

  • The two partitions should not be exposed as nested mounts to userspace

To be more specific, here’s how I think a better way to set this all up would look like:

  • Whenever possible, only have one boot partition, not two. On EFI
    systems, make it the ESP. On non-EFI systems use an XBOOTLDR
    partition instead (see below). Only have both in the case where a
    Linux OS is installed on a system that already contains an OS with
    an ESP that is too small to carry sufficient kernels/initrds. When a
    system contains a XBOOTLDR partition put kernels/initrd on that,
    otherwise the ESP.

  • Instead of the vaguely defined, traditional Linux “boot” partition
    use the XBOOTLDR partition type as defined by the Discoverable
    Partitions
    Specification
    . This
    ensures the partition is discoverable, and can be automatically
    mounted by things like
    systemd-gpt-auto-generator. Use
    XBOOTLDR only if you have to, i.e., when dealing with systems that
    lack UEFI (and where the ESP hence has no value) or to address the
    mentioned size issues with the ESP. Note that unlike the traditional
    boot partition the XBOOTLDR partition is a shared resource, i.e.,
    shared between multiple parallel Linux OS installations on the same
    disk. Because of this it is typically wise to place a per-OS
    directory at the top of the XBOOTLDR file system to avoid conflicts.

  • Use vFAT for both partitions, it’s the only thing
    universally understood among relevant firmwares and Linux. It’s
    simple enough to be useful for untrusted storage. Or to say this
    differently: writing a file system driver that is not easily
    vulnerable to rogue disk images is much easier for vFAT than for
    let’s say btrfs. – But the choice of vFAT implies some care needs to
    be taken to address the data safety issues it brings, see below.

  • Mount the two partitions via the “automount
    logic. For example, via systemd’s
    automount
    units, with a very short idle time-out (one second or so). This
    improves data safety immensely, as the file systems will remain
    mounted (and thus possibly in a “dirty” state) only for very short
    periods of time, when they are actually accessed – and all that
    while the fact that they are not mounted continuously is mostly not
    noticeable for applications as the file system paths remain
    continuously around. Given that the backing file system (vFAT) has
    poor data safety properties, it is essential to shorten the access
    for unclean file system state as much as possible. In fact, this is
    what the aforementioned systemd-gpt-auto-generator
    logic actually does by default.

  • Whenever mounting one of the two partitions, do a file system check
    (fsck; in fact this is also what
    systemd-gpt-auto-generatordoes by default, hooked into
    the automount logic, to run on first access). This ensures that even
    if the file system is in an unclean state it is restored to be clean
    when needed, i.e., on first access.

  • Do not mount the two partitions nested, i.e., no
    more /boot/efi/. First of all, as mentioned above, it
    should be possible (and is desirable) to only have one of the
    two. Hence it is simply a bad idea to require the other as well,
    just to be able to mount it. More importantly though, by nesting
    them, automounting is complicated, as it is necessary to trigger the
    first automount to establish the second automount, which defeats the
    point of automounting them in the first place. Use the two distinct
    mount points /efi/ (for the ESP) and
    /boot/ (for XBOOTLDR) instead. You might have guessed,
    but that too is what systemd-gpt-auto-generator does by
    default.

  • When making additions or updates to ESP/XBOOTLDR from the OS make
    sure to create a file and write it in full, then
    syncfs() the whole file system, then rename to give it
    its final name, and syncfs() again. Similar when
    removing files.

  • When writing from the boot loader environment/UEFI to ESP/XBOOTLDR,
    do not append to files or create new files. Instead overwrite
    already allocated file contents (for example to maintain a random
    seed file) or rename already allocated files to include information
    in the file name (and ideally do not increase the file name in
    length; for example to maintain boot counters).

  • Consider adopting
    UKIs,
    which minimize the number of files that need to be updated on the
    ESP/XBOOTLDR during OS/kernel updates (ideally down to 1)

  • Consider adopting
    systemd-boot,
    which minimizes the number of files that need to be updated on boot
    loader updates (ideally down to 1)

  • Consider removing any mention of ESP/XBOOTLDR from
    /etc/fstab, and just let
    systemd-gpt-auto-generator do its thing.

  • Stop implementing file systems, complex storage, disk encryption, …
    in your boot loader.

Implementing things like that you gain:

  • Simplicity: only one file system implementation, typically only
    one partition and mount point

  • Robust auto-discovery of all partitions, no need to even
    configure /etc/fstab

  • Data safety guarantees as good as possible, given the
    circumstances

To summarize this in a table:

Type Linux Mount Point File System Choice Automount
ESP /efi/ vFAT yes
XBOOTLDR /boot/ vFAT yes

A note regarding modern boot loaders that implement the Boot Loader
Specification
:
both partitions are explicitly listed in the specification as sources
for both Type #1 and Type #2 boot menu entries. Hence, if you use such
a modern boot loader (e.g. systemd-boot) these two partitions are the
preferred location for boot loader resources, kernels and initrds
anyway.

Addendum: You got RAID?

You might wonder, what about RAID setups and the ESP? This comes up
regularly in discussions: how to set up the ESP so that (software)
RAID1 (mirroring) can be done on the ESP. Long story short: I’d
strongly advise against using RAID on the ESP. Firmware typically
doesn’t have native RAID support, and given that firmware and boot
loader can write to the file systems involved, any attempt to use
software RAID on them will mean that a boot cycle might corrupt the
RAID sync, and immediately requires a re-synchronization after
boot. If RAID1 backing for the ESP is really necessary, the only way
to implement that safely would be to implement this as a driver for
UEFI – but that creates certain bootstrapping issues (i.e., where to
place the driver if not the ESP, a file system the driver is supposed
to be used for), and also reimplements a considerable component of the
OS storage stack in firmware mode, which seems problematic.

So what to do instead? My recommendation would be to solve this via
userspace tooling. If redundant disk support shall be implemented for
the ESP, then create separate ESPs on all disks, and synchronize them
on the file system level instead of the block level. Or in other
words, the tools that install/update/manage kernels or boot loaders
should be taught to maintain multiple ESPs instead of one. Copy the
kernels/boot loader files to all of them, and remove them from all of
them. Under the assumption that the goal of RAID is a more reliable
system this should be the best way to achieve that, as it doesn’t
pretend the firmware could do things it actually cannot do. Moreover
it minimizes the complexity of the boot loader, shifting the syncing
logic to userspace, where it’s typically easier to get right.

Addendum: Networked Boot

The discussion above focuses on booting up from a local disk. When
thinking about networked boot I think two scenarios are particularly
relevant:

  1. PXE-style network booting. I think in this mode of operation focus
    should be on directly booting a single UKI image instead of a boot
    loader. This sidesteps the whole issue of maintaining any boot
    partition at all, and simplifies the boot process greatly. In
    scenarios where this is not sufficient, and an interactive boot
    menu or other boot loader features are desired, it might be a good
    idea to take inspiration from the UKI concept, and build a single
    boot loader EFI binary (such as systemd-boot), and include the UKIs
    for the boot menu items and other resources inside it via PE
    sections. Or in other words, build a single boot loader binary that
    is “supercharged” and contains all auxiliary resources in its own
    PE sections. (Note: this does not exist, it’s an idea I intend to
    explore with systemd-boot). Benefit: a single file has to be
    downloaded via PXE/TFTP, not more. Disadvantage: unused resources
    are downloaded unnecessarily. Either way: in this context there is
    no local storage, and the ESP/XBOOTLDR discussion above is without
    relevance.

  2. Initrd-style network booting. In this scenario the boot loader and
    kernel/initrd (better: UKI) are available on a local disk. The
    initrd then configures the network and transitions to a network
    share or file system on a network block device for the root file
    system. In this case the discussion above applies, and in fact the
    ESP or XBOOTLDR partition would be the only partition available
    locally on disk.

And this is all I have for today.

See yourself in cyber: Highlights from Cybersecurity Awareness Month

Post Syndicated from CJ Moses original https://aws.amazon.com/blogs/security/see-yourself-in-cyber-highlights-from-cybersecurity-awareness-month/

As Cybersecurity Awareness Month comes to a close, we want to share some of the work we’ve done and made available to you throughout October. Over the last four weeks, we have shared insights and resources aligned with this year’s theme—”See Yourself in Cyber”—to help advance awareness training, and inspire people to join the rapidly growing security industry. Here are a few highlights.

Roundtable with the Cybersecurity and Infrastructure Security Agency (CISA): Amazon Chief Security Officer Steve Schmidt hosted CISA director Jen Easterly in Seattle for a roundtable with leaders across higher education, state and local government, and private industry to discuss ways to develop the cybersecurity workforce through skills training, partnerships between government and industry, and creating pathways to cybersecurity careers.

How AWS, Cisco, Netflix & SAP Are Approaching Cybersecurity Awareness Month. I joined Cisco Chief Security and Trust Officer Brad Arkin, Netflix Head of Cloud Security Srinath Kuruvardi, and SAP Chief Trust Officer Elena Kvochko to describe how AWS, Cisco, Netflix, and SAP are instilling strong cybersecurity training and practices within our organizations, with the goal of inspiring other organizations to do the same.

Cybersecurity Awareness Month 2022 Briefing. Amazon Security Director Jenny Brinkley—who leads Amazon’s internal and external awareness training activities—participated in a Cybersecurity Awareness Month panel discussion hosted by the National Cybersecurity Alliance. Jenny met with executives from KnowBe4, Google, NortonLifeLock, and Dell and chatted about how the cybersecurity landscape has changed over the past few years, and how those changes have impacted the perception of security as a part of daily life.

Making Cybersecurity Relevant for Consumers: The Case for Personal Agency. In addition to the briefing, Jenny spoke to the National Cybersecurity Alliance about staying safe online. She highlighted simple steps that everyone can take to be safer online, including staying consistent on software updates for connected devices, using strong passwords, activating multi-factor authentication (MFA) on accounts when possible, and being on the lookout for phishing attempts.

National Cybersecurity Alliance and Nasdaq Cybersecurity Summit. Jenny and Amazon Head of Global Security Training Jyllian Clarke also joined the National Cybersecurity Alliance, Nasdaq, and public and private sector security leaders in New York City for a cybersecurity summit and got to ring the opening bell.

Resources

AWS offers free Cybersecurity Awareness Training to individuals and businesses around the world, and we’re providing complimentary MFA security keys to AWS account owners in the United States. More than 40 security-focused courses are available through AWS Skill Builder, ranging from foundational to advanced content. By subscribing to AWS Skill Builder, you gain access to security-related interactive challenges with AWS Jam, which guides you through solving real-world problems.

Additionally, Amazon and the National Cybersecurity Alliance launched a cybersecurity awareness campaign called Protect & Connect. The campaign includes a public service announcement featuring Prime Video actor Michael B. Jordan and actress-producer Tessa Thompson as “internet bodyguards,” as well as a Protect & Connect microsite for consumers, featuring additional videos on topics such as MFA and how to identify and avoid phishing attempts.

Humanizing security

Cybersecurity can seem like a complex subject but ultimately, it’s all about people. Most of today’s threats need people to activate them, so you need to train people to develop intuition, which is something that can’t be automated. By meeting employees where they are with an engaging approach to awareness training that moves security to the forefront of everything they do, you can promote positive behavioral change, and start building a security-first culture.

If you have feedback about this post, submit comments in the Comments section below.

Want more AWS Security news? Follow us on Twitter.

CJ Moses

CJ Moses

CJ is the Chief Information Security Officer (CISO) at AWS, where he leads product design and security engineering. His mission is to deliver the economic and security benefits of cloud computing to business and government customers. Previously, CJ led the technical analysis of computer and network intrusion efforts at the U.S. Federal Bureau of Investigation Cyber Division. He also served as a Special Agent with the U.S. Air Force Office of Special Investigations (AFOSI). CJ led several computer intrusion investigations seen as foundational to the information security industry today.

[$] Modernizing Fedora’s C code

Post Syndicated from original https://lwn.net/Articles/913505/

It is not often that you see a Fedora change proposal for a version of the
distribution that will not be available for 18 months or so, but that
is exactly what was recently posted to the mailing list.
The change targets the C source code in the myriad of packages that the
distribution ships; it would fix code that uses some ancient compatibility
features that were removed by the C99 standard but are still supported by
GCC. As might be guessed from the
long runway proposed, there is quite a bit of work to do to get there.

A new crop of malicious modules found on PyPI

Post Syndicated from original https://lwn.net/Articles/913555/

Phylum has posted an
article
with a detailed look at a set of malicious packages discovered
by an automated system they have developed.

Similar to this attacker’s previous attempts, this particular
attack starts by copying existing popular libraries and simply
injecting a malicious __import__ statement into an otherwise
healthy codebase. The benefit this attacker gained from copying an
existing legitimate package, is that because the PyPI landing page
for the package is generated from the setup.py and the README.md,
they immediately have a real looking landing page with mostly
working links and the whole bit. Unless thoroughly inspected, a
brief glance might lead one to believe this is also a legitimate
package.

How to control non-HTTP and non-HTTPS traffic to a DNS domain with AWS Network Firewall and AWS Lambda

Post Syndicated from Tyler Applebaum original https://aws.amazon.com/blogs/security/how-to-control-non-http-and-non-https-traffic-to-a-dns-domain-with-aws-network-firewall-and-aws-lambda/

Security and network administrators can control outbound access from a virtual private cloud (VPC) to specific destinations by using a service like AWS Network Firewall. You can use stateful rule groups to control outbound access to domains for HTTP and HTTPS by default in Network Firewall. In this post, we’ll walk you through how to accomplish this access control for non-HTTP and non-HTTPS traffic, such as SSH (Secure Shell). This solution is extensible to other protocols with static port assignments.

In the example scenario in this post, the network administrator needs to permit outbound SSH access on port 22/tcp to a third-party domain, example.org, from a group of Amazon Elastic Compute Cloud (Amazon EC2) instances that sits inside of a protected VPC that restricts outbound SSH traffic with Network Firewall. Non-HTTP traffic can’t currently be controlled with a domain rule in Network Firewall.

This solution allows administrators to control outbound access to a given domain in a granular way, by resolving the domain name inside of an AWS Lambda function, and updating a Network Firewall rule variable with the results of the DNS query. This solution further restricts specific non-HTTP and non-HTTPS traffic to those allowed domains to only what is explicitly specified by the administrator.

Solution overview

Figure 1 provides an overview of the solution and the resulting traffic flow.

Figure 1: Overview of the solution and the resulting traffic flow

Figure 1: Overview of the solution and the resulting traffic flow

The solution workflow is as follows:

  1. An Amazon EventBridge rule invokes the Lambda function every 10 minutes. You can modify this frequency to meet your needs. You should consider the time-to-live (TTL) record of the DNS record that you are configuring when choosing this interval.
  2. The Lambda function performs the DNS lookup for the provided domain, and updates a variable in an existing Network Firewall rule group. The rule group changes take a few seconds to fully apply to the nodes in your Network Firewall deployment.
  3. The newly created Network Firewall rule group is associated with the Network Firewall policy to control traffic.
  4. Traffic from the instances in your VPC flows through the Network Firewall endpoint, and if allowed, is routed through an internet gateway to the target server.

Prerequisites

This solution has the following prerequisites:

  1. An AWS account. If you don’t have an AWS account, create and activate one.
  2. An existing VPC with default routing to an internet gateway through a network firewall that has a firewall policy attached to it. The example rule included in the solution’s AWS CloudFormation template expects the firewall policy to use the default action order for stateful rule groups. If you don’t have an existing network firewall associated with your VPC, see the AWS Network Firewall Developer Guide to get started. For a walkthrough of the Network Firewall configuration and rules engine, see the blog post Hands-on walkthrough of the AWS Network Firewall flexible rules engine – Part 1.
  3. A DNS domain that you provide, which allows traffic for the protocol and port (or ports) that you plan to allow traffic to. This DNS domain needs to resolve to an IPv4 address or set of addresses; IPv6 is not supported, at this point.

Deploy the solution

We’ve provided a CloudFormation template to deploy this solution, which is located in the GitHub repository that accompanies this blog post.

To deploy the solution

  1. Download the CloudFormation template from our GitHub repository.
  2. Sign in to your AWS account and select the AWS Region where your Network Firewall is deployed.
  3. Navigate to the CloudFormation service.
  4. Choose Stacks > Create Stack > With new resources (standard).
  5. In the Specify template section, choose Upload a template file.
  6. Choose Choose file, navigate to where you saved the CloudFormation template, and upload it. Then choose Next.
  7. Specify a stack name for your CloudFormation stack.
  8. In the Parameters section, for the Domain parameter, specify the name of the domain to which you will control access. The default value is set to example.org; however, note that the actual example.org doesn’t allow SSH traffic.
  9. The remaining parameters have defaults to allow outbound SSH traffic to the specified domain. Adjust the LambdaJobFrequency variable so that it corresponds with the TTL of the DNS record that it will resolve. This allows the Lambda function to keep the IP address of the DNS record up to date, in the event that it changes. After you’ve configured the parameters, choose Next.
    Figure 2: CloudFormation stack parameters

    Figure 2: CloudFormation stack parameters

  10. On the Configure stack options page, specify any further options needed or keep the default options, and then choose Next.
  11. On the Review page, review the stack and parameters and select the check box to acknowledge that this template will create IAM resources. Choose Create Stack.
  12. Check the stack creation status. Upon successful completion, the status shows CREATE_COMPLETE.
    Figure 3: The successful creation of the CloudFormation stack

    Figure 3: The successful creation of the CloudFormation stack

Test the solution

Before you test the newly created rule, make sure that the Lambda function has been invoked at least once from the EventBridge rule.

To verify the Lambda function results

  1. In the AWS Management Console, navigate to the Lambda function Network-Firewall-Resolver-Function, and on the Monitor tab, choose View logs in CloudWatch.
    Figure 4: Navigating to view logs in CloudWatch

    Figure 4: Navigating to view logs in CloudWatch

  2. Select the most recent log stream.
  3. Verify that that a log line contains the entry StatefulRuleGroup updated successfully.
    Figure 5: Examining the CloudWatch logs to verify that the Lambda function ran successfully

    Figure 5: Examining the CloudWatch logs to verify that the Lambda function ran successfully

  4. Associate the stateful rule group that was created by the stack, Lambda-Managed-Stateful-Rule with the existing Network Firewall policy that is attached to your VPC. To do this:
    1. Navigate to VPC > Network Firewall > Firewall Policies and select your existing firewall policy.
    2. In the Stateful rule groups section, for Actions, choose Add unmanaged stateful rule groups.
  5. Select the check box for Lambda-Managed-Stateful-Rule, and then choose Add stateful rule group.
  6. When the newly provisioned Lambda function runs successfully, it will resolve the IPv4 address for the domain (example.org) and associate the address with the stateful rule variable IP_NET. To validate that this has happened, do the following:
    1. Navigate to VPC > Network Firewall > Network Firewall rule groups.
    2. Choose the Lambda-Managed-Stateful-Rule rule group.
    3. Navigate to the rule variable section, and choose IP_NET. If the Lambda function successfully resolved the provided domain name, the variable will contain the IPv4 addresses for the domain you provided, as shown in Figure 6.
      Figure 6: Validating the rule variable details

      Figure 6: Validating the rule variable details

  7. Test the rule by attempting to connect to the domain that you specified in the CloudFormation template. Use an EC2 instance within the VPC that the network firewall rule is associated with, and attempt to establish an SSH connection to the domain that you specified. As shown by the SSH key negotiation in Figure 7, traffic is allowed through the network firewall, as intended.
    Figure 7: SSH connectivity to the domain was successful

    Figure 7: SSH connectivity to the domain was successful

    You can also configure the rule to drop the SSH connection, rather than permit it. To do this:

    1. Navigate to VPC > Network Firewall > Network Firewall rule groups.
    2. Choose the Lambda-Managed-Stateful-Rule rule group. In the Rules section, choose Edit Rules.
    3. Modify the rule to take the Drop action, and save the rule group.

    As shown by the lack of response from the host in Figure 8, the SSH connection cannot be established anymore.

    Figure 8: An SSH connection cannot be established, due to the connection timing out

    Figure 8: An SSH connection cannot be established, due to the connection timing out

Cleanup

Follow the steps in this section to remove the resources created by this solution.

To remove the resources

  1. Sign in to your AWS account where you deployed the CloudFormation stack and navigate to the Network Firewall console.
  2. In the Stateful rule groups section, select the check box for Lambda-Managed-Stateful-Rule. For Actions, choose Disassociate from policy.
    Figure 9: Disassociating the stateful rule from the existing policy

    Figure 9: Disassociating the stateful rule from the existing policy

  3. Navigate to the CloudFormation console, select the stack that you created, and then choose Delete. Upon successful deletion, the resources created by the stack will be deleted.

Conclusion

In this post, we’ve demonstrated how security and network administrators have the ability to permit or restrict non-HTTP and non-HTTPS traffic to a given domain by using Network Firewall. With this solution, administrators can enforce granular port- and protocol-level control to third-party domains. To learn more about rule group configuration in AWS Network Firewall, see Managing your own rule groups in the Developer Guide.

 
If you have feedback about this post, submit comments in the Comments section below. If you have questions about this post, contact AWS Support. You can also start a new thread on AWS Network Firewall re:Post to get answers from the community.

Want more AWS Security news? Follow us on Twitter.

Tyler Applebaum

Tyler Applebaum

Tyler is a Sr. Solutions Architect in the Charlotte, NC area helping customers migrate to AWS and modernize their applications. He has previous experience as a network engineer working in healthcare and finance.

Bhavin Lakhani

Bhavin is a Technical Account Manager in the US West, Northern California, helping customers with their AWS Enterprise Support, Operational, and Architectural needs. He has cloud infrastructure and database platform leadership experience in his previous roles. He loves soccer and is an ardent “Arsenal” fan.

Amazon Simple Email Service (SES) helps improve inbox deliverability with new features

Post Syndicated from Lauren Cudney original https://aws.amazon.com/blogs/messaging-and-targeting/amazon-simple-email-service-ses-helps-improve-inbox-deliverability-with-new-features/

Email remains the core of any company’s communication stack, but emails cannot deliver maximum ROI unless they land in recipients’ inboxes. Email deliverability, or ensuring emails land in the inbox instead of spam, challenges senders because deliverability can be impacted by a number of variables, like sending identity, campaign setup, or email configuration. Today, email senders rely on dashboard metrics or deliverability consultants to optimize the inbox placement of their messages. However, the deliverability dashboards available today do not provide specific recommendations to improve deliverability. Consultants provide bespoke solutions, but can cost hundreds of dollars per hour and are not scalable.


That’s why, today, we’re proud to announce virtual deliverability manager, a suite of new deliverability features in Amazon Simple Email Service (SES) that improve deliverability insights and recommendations. A new deliverability dashboard gives email senders more insights through a detailed dashboard of metrics on email deliverability. The “advisor” feature provides configuration recommendations to help improve inbox placement. SES’ “Guardian” can implement changes to email sending to help increase the percent of messages that land in the inbox. Deliverability metrics and recommendations are generated in real-time through Amazon SES, without the need for a human consultant or agency.

AWS Simple Email Service deliverability insights dashboard

The new SES feature reports email insights at-a-glance with metrics like open and click rate, but can also give deeper insights into individual ISP and configuration performance. SES will deliver specific configuration recommendations to improve deliverability based on a specific campaign’s setup, like DMARC (Domain-based Message Authentication Reporting and Conformance) or DKIM (DomainKeys Identified Mail) for a specific domain. Senders can turn on automatic implementation, which allows SES to intelligently adjust email sending configuration to maximize inbox placement.

AWS Simple Email Service deliverability recommendations to improve email sending
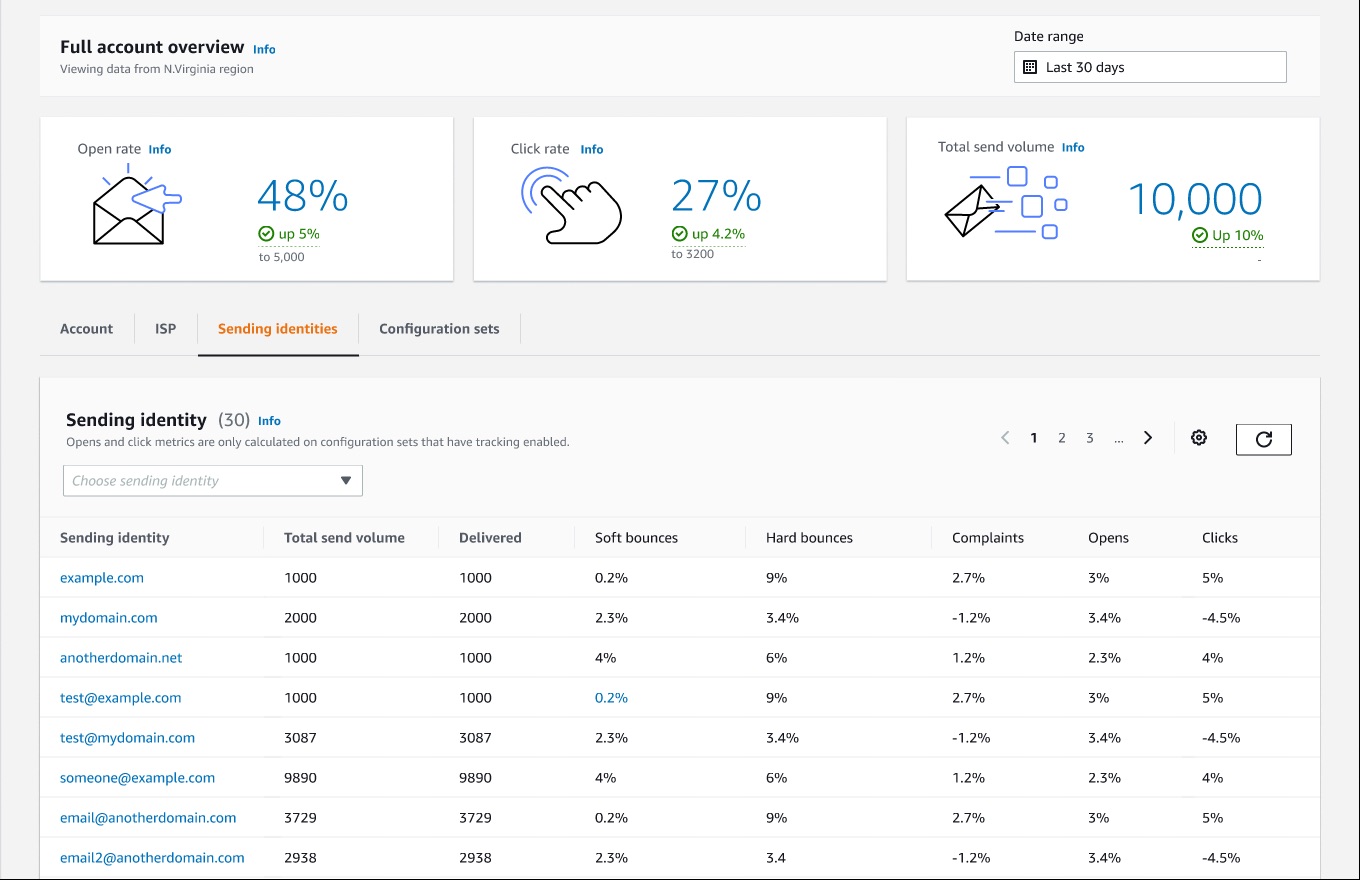
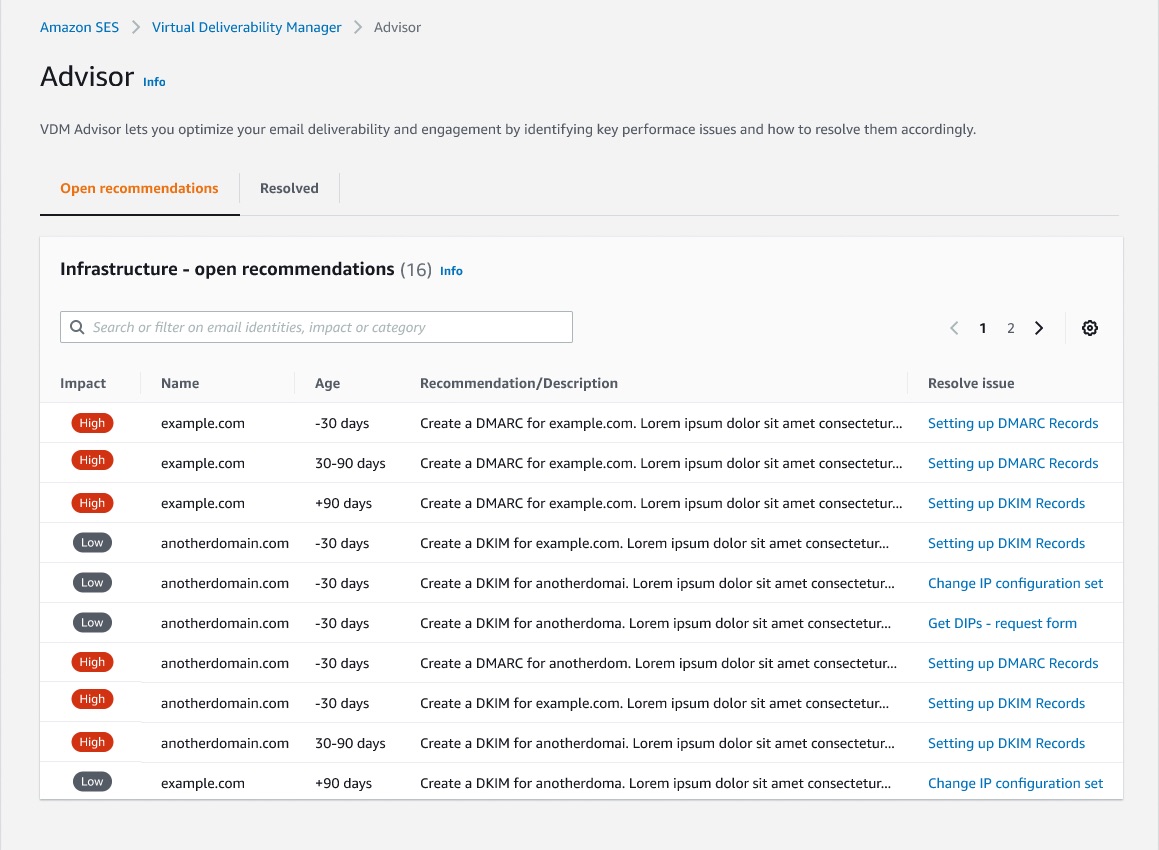
Applying new deliverability features is simple in the AWS console. Senders can log into their SES account dashboard to enable the virtual deliverability manager features. The features are billed as monthly subscription and can be turned on or off at any time. Once the features are activated, SES provides deliverability insights and recommendations in real time, allowing senders to improve performance of future sending batches or campaigns. Senders using Simple Email Service (SES) get reliable, scalable email at the lowest industry prices. SES is backed by AWS’ data security, and email through SES supports  compliance with HIPAA-eligible, FedRAMP-, GDPR-, and ISO-certified options.

To learn more about virtual deliverability manager, visit https://aws.amazon.com/ses

California State University Chancellor’s Office reduces cost and improves efficiency using Amazon QuickSight for streamlined HR reporting in higher education

Post Syndicated from Madi Hsieh original https://aws.amazon.com/blogs/big-data/california-state-university-chancellors-office-reduces-cost-and-improves-efficiency-using-amazon-quicksight-for-streamlined-hr-reporting-in-higher-education/

The California State University Chancellor’s Office (CSUCO) sits at the center of America’s most significant and diverse 4-year universities. The California State University (CSU) serves approximately 477,000 students and employs more than 55,000 staff and faculty members across 23 universities and 7 off-campus centers. The CSU provides students with opportunities to develop intellectually and personally, and to contribute back to the communities throughout California. For this large organization, managing a wide system of campuses while maintaining the decentralized autonomy of each is crucial. In 2019, they needed a highly secure tool to streamline the process of pulling HR data. The CSU had been using a legacy central data warehouse based on data from their financial system, but it lacked the robustness to keep up with modern technology. This wasn’t going to work for their HR reporting needs.

Looking for a tool to match the cloud-based infrastructure of their other operations, the Business Intelligence and Data Operations (BI/DO) team within the Chancellor’s Office chose Amazon QuickSight, a fast, easy-to-use, cloud-powered business analytics service that makes it easy for all employees within an organization to build visualizations, perform ad hoc analysis, and quickly get business insights from their data, any time, on any device. The team uses QuickSight to organize HR information across the CSU, implementing a centralized security system.

“It’s easy to use, very straightforward, and relatively intuitive. When you couple the experience of using QuickSight, with a huge cost difference to [the BI platform we had been using], to me, it’s a simple choice,”

– Andy Sydnor, Director Business Intelligence and Data Operations at the CSUCO.

With QuickSight, the team has the capability to harness security measures and deliver data insights efficiently across their campuses.

In this post, we share how the CSUCO uses QuickSight to reduce cost and improve efficiency in their HR reporting.

Delivering BI insights across the CSU’s 23 universities

The CSUCO serves the university system’s faculty, students, and staff by overseeing operations in several areas, including finance, HR, student information, and space and facilities. Since migrating to QuickSight in 2019, the team has built dashboards to support these operations. Dashboards include COVID-related leaves of absence, historical financial reports, and employee training data, along with a large selection of dashboards to track employee data at an individual campus level or from a system-wide perspective.

The team created a process for reading security roles from the ERP system and then translating them using QuickSight groups for internal HR reporting. QuickSight allowed them to match security measures with the benefits of low maintenance and familiarity to their end-users.

With QuickSight, the CSUCO is able to run a decentralized security process where campus security teams can provision access directly and users can get to their data faster. Before transitioning to QuickSight, the BI/DO team spent hours trying to get to specific individual-level data, but with QuickSight, the retrieval time was shortened to just minutes. For the first time, Sydnor and his team were able to pinpoint a specific employee’s work history without having to take additional actions to find the exact data they needed.

Cost savings compared to other BI tools

Sydnor shares that, for a public organization, one of the most attractive qualities of QuickSight is the immense cost savings. The BI/DO team at the Chancellor’s Office estimates that they’re saving roughly 40% on costs since switching from their previous BI platform, which is a huge benefit for a public organization of this scale. Their previous BI tool was costing them extensive amounts of money on licensing for features they didn’t require; the CSUCO felt they weren’t getting the best use of their investment.

The functionality of QuickSight to meet their reporting needs at an affordable price point is what makes QuickSight the CSUCO’s preferred BI reporting tool. Sydnor likes that with QuickSight, “we don’t have to go out and buy a subscription or a license for somebody, we can just provision access. It’s much easier to distribute the product.” QuickSight allows the CSUCO to focus their budget in other areas rather than having to pay for charges by infrequent users.

Simple and intuitive interface

Getting started in QuickSight was a no-brainer for Sydnor and his team. As a public organization, the procurement process can be cumbersome, thereby slowing down valuable time for putting their data to action. As an existing AWS customer, the CSUCO could seamlessly integrate QuickSight into their package of AWS services. An issue they were running into with other BI tools was encountering roadblocks to setting up the system, which wasn’t an issue with QuickSight, because it’s a fully managed service that doesn’t require deploying any servers.

The following screenshot shows an example of the CSUCO security audit dashboard.

example of the CSUCO security audit dashboard.

Sydnor tells us, “Our previous BI tool had a huge library of visualization, but we don’t need 95% of those. Our presentations look great with the breadth of visuals QuickSight provides. Most people just want the data and ultimately, need a robust vehicle to get data out of a database and onto a table or visualization.”

Converting from their original BI tool to QuickSight was painless for his team. Sydnor tells us that he has “yet to see something we can’t do with QuickSight.” One of Sydnor’s employees who was a user of the previous tool learned QuickSight in just 30 minutes. Now, they conduct QuickSight demos all the time.

Looking to the future: Expanding BI integration and adopting Amazon QuickSight Q

With QuickSight, the Chancellor’s Office aims to roll out more HR dashboards across its campuses and extend the tool for faculty use in the classroom. In the upcoming year, two campuses are joining CSUCO in building their own HR reporting dashboards through QuickSight. The organization is also making plans to use QuickSight to report on student data and implement external-facing dashboards. Some of the data points they’re excited to explore are insights into at-risk students and classroom scheduling on campus.

Thinking ahead, CSUCO is considering Amazon QuickSight Q, a machine learning-powered natural language capability that gives anyone in an organization the ability to ask business questions in natural language and receive accurate answers with relevant visualizations. Sydnor says, “How cool would that be if professors could go in and ask simple, straightforward questions like, ‘How many of my department’s students are taking full course loads this semester?’ It has a lot of potential.”

Summary

The CSUCO is excited to be a champion of QuickSight in the CSU, and are looking for ways to increase its implementation across their organization in the future.

To learn more, visit the website for the California State University Chancellor’s Office. For more on QuickSight, visit the Amazon QuickSight product page, or browse other Big Data Blog posts featuring QuickSight.


About the authors

Madi Hsieh, AWS 2022 Summer Intern, UCLA.

Tina Kelleher, Program Manager at AWS.

Microservice observability with Amazon OpenSearch Service part 2: Create an operational panel and incident report

Post Syndicated from Marvin Gersho original https://aws.amazon.com/blogs/big-data/microservice-observability-with-amazon-opensearch-service-part-2-create-an-operational-panel-and-incident-report/

In the first post in our series , we discussed setting up a microservice observability architecture and application troubleshooting steps using log and trace correlation with Amazon OpenSearch Service. In this post, we discuss using PPL to create visualizations in operational panels, and creating a simple incident report using notebooks.

To try out the solution yourself, start from part 1 of the series.

Microservice observability with Amazon OpenSearch Service

Piped Processing Language (PPL)

PPL is a new query language for OpenSearch. It’s simpler and more straightforward to use than query DSL (Domain Specific Language), and a better fit for DevOps than ODFE SQL. PPL handles semi-structured data and uses a sequence of commands delimited by pipes (|). For more information about PPL, refer to Using pipes to explore, discover and find data in Amazon OpenSearch Service with Piped Processing Language.

The following PPL query retrieves the same record as our search on the Discover page in our previous post. If you’re following along, use your trace ID in place of <Trace-ID>:

source = sample_app_logs | where stream = 'stderr' and locate(‘<Trace-ID>’,`log`) > 0

The query has the following components:

  • | separates commands in the statement.
  • Source=sample_app_logs means that we’re searching sample_app_logs.
  • where stream = ‘stderr’, stream is a field in sample_app_logs. We’re matching the value to stderr.
  • The locate function allows us to search for a string in a field. For our query, we search for the trace_id in the log field. The locate function returns 0 if the string is not found, otherwise the character number where it is found. We’re testing that trace_id is in the log field. This lets us find the entry that has the payment trace_id with the error.

Note that log is PPL keyword, but also a field in our log file. We put backquotes around a field name if it’s also a keyword if we need to reference it in a PPL statement.

To start using PPL, complete the following steps:

  1. On OpenSearch Dashboards, choose Observability in the navigation pane.
  2. Choose Event analytics.
  3. Choose the calendar icon, then choose the time period you want for your query (for this post, Year to date).
  4. Enter your PPL statement.

Note that results are shown in table format by default, but you can also choose to view them in JSON format.

Monitor your services using visualizations

We can use the PPL on the Event analytics page to create real-time visualizations. We now use these visualizations to create a dashboard for real-time monitoring of our microservices on the Operational panels page.

Event analytics has two modes: events and visualizations. With events, we’re looking at the query results as a table or JSON. With visualizations, the results are shown as a graph. For this post, we create a PPL query that monitors a value over time, and see the results in a graph. We can then save the graph to use in our dashboard. See the following code:

source = sample_app_logs | where stream = 'stderr' and locate('payment',`log`) > 0 | stats count() by span(time, 5m)

This code is similar to the PPL we used earlier, with two key differences:

  • We specify the name of our service in the log field (for this post, payment).
  • We use the aggregation function stats count() by span(time, 5m). We take the count of matches in the log field and aggregate by 5-minute intervals.

The following screenshot shows the visualization.

OpenSearch Service offers a choice of several different visualizations, such as line, bar, and pie charts.

We now save the results as a visualization, giving it the name Payment Service Errors.

We want to create and save a visualization for each of the five services. To create a new visualization, choose Add new, then modify the query by changing the service name.

We save this one and repeat the process by choosing Add new again for each of the five micro-services. Each microservice is now available on its own tab.

Create an operational panel

Operational panels in OpenSearch Dashboards are collections of visualizations created using PPL queries. Now that we have created the visualizations in the Event analytics dashboard, we can create a new operational panel.

  1. On the Operational panel page, choose Create panel.
  2. For Name, enter e-Commerce Error Monitoring.
  3. Open that panel and choose Add Visualization.
  4. Choose Payment Service Errors.

The following screenshot shows our visualization.

We now repeat the process for our other four services. However, the layout isn’t good. The graphs are too big, and laid out vertically, so they can’t all be seen at once.

We can choose Edit to adjust the size of each visualization and move them around. We end up with the layout in the following screenshot.

We can now monitor errors over time for all of our services. Notice that the y axis of each service visualization adjusts based on the error count.

This will be a useful tool for monitoring our services in the future.

Next, we create an incident report on the error that we found.

Create an OpenSearch incident report

The e-Commerce Error Monitoring panel can help us monitor our application in the future. However, we want to send out an incident report to our developers about our current findings. We do this by using OpenSearch PPL and Notebooks features introduced in OpenSearch Service 1.3 to create an incident report. A notebook can be downloaded as a PDF. An incident report is useful to share our findings with others.

First, we need to create a new notebook.

  1. Under Observability in the navigation pane, choose Notebooks.
  2. Choose Create notebook.
  3. For Name, enter e-Commerce Error Report.
  4. Choose Create.

    The following screenshot shows our new notebook page.

    A notebook consists of code blocks: narrative, PPL, and SQL, and visualizations created on the Event analytics page with PPL.
  5. Choose Add code block.
    We can now write a new code block.

    We can use %md, %sql, or %ppl to add code. In this first block, we just enter text.
  6. Use %md to add narrative text.
  7. Choose Run to see the output.

    The following screenshot shows our code block.

    Now we want to add our PPL query to show the error we found earlier.
  8. On the Add paragraph menu, choose Code block.
  9. Enter our PPL query, then choose Run.

    The following screenshot shows our output.

    Let’s drill down on the log field to get details of the error.
    We could have many narrative and code blocks, as well as visualizations of PPL queries. Let’s add a visualization.
  10. On the Add paragraph menu, choose Visualization.
  11. Choose Payment Service Errors to view the report we created earlier.

    This visualization shows a pattern of payment service errors this afternoon. Note that we chose a date range because we’re focusing on today’s errors to communicate with the development team.

    Notebook visualizations can be refreshed to provide updated information. The following screenshot shows our visualization an hour later.
    We’re now going to take our completed notebook and export it as a PDF report to share with other teams.
  12. Choose Output only to make the view cleaner to share.
  13. On the Reporting actions menu, choose Download PDF.

We can send this PDF report to the developers supporting the payment service.

Summary

In this post, we used OpenSearch Service v1.3 to create a dashboard to monitor errors in our microservices application. We then created a notebook to use a PPL query on a specific trace ID for a payment service error to provide details, and a graph of payment service errors to visualize the pattern of errors. Finally, we saved our notebook as a PDF to share with the payment service development team. If you would like to explore these features further check out the latest Amazon OpenSearch Observability documentation or, for open source, OpenSearch Observability latest open source documentation. You can also contact your AWS Solutions Architects, who can be of assistance alongside your innovation journey.


About the Authors

Marvin Gersho is a Senior Solutions Architect at AWS based in New York City. He works with a wide range of startup customers. He previously worked for many years in engineering leadership and hands-on application development, and now focuses on helping customers architect secure and scalable workloads on AWS with a minimum of operational overhead. In his free time, Marvin enjoys cycling and strategy board games.

Subham Rakshit is a Streaming Specialist Solutions Architect for Analytics at AWS based in the UK. He works with customers to design and build search and streaming data platforms that help them achieve their business objective. Outside of work, he enjoys spending time solving jigsaw puzzles with his daughter.

Rafael Gumiero is a Senior Analytics Specialist Solutions Architect at AWS. An open-source and distributed systems enthusiast, he provides guidance to customers who develop their solutions with AWS Analytics services, helping them optimize the value of their solutions.

Build the next generation, cross-account, event-driven data pipeline orchestration product

Post Syndicated from Maria Guerra original https://aws.amazon.com/blogs/big-data/build-the-next-generation-cross-account-event-driven-data-pipeline-orchestration-product/

This is a guest post by Mehdi Bendriss, Mohamad Shaker, and Arvid Reiche from Scout24.

At Scout24 SE, we love data pipelines, with over 700 pipelines running daily in production, spread across over 100 AWS accounts. As we democratize data and our data platform tooling, each team can create, maintain, and run their own data pipelines in their own AWS account. This freedom and flexibility is required to build scalable organizations. However, it’s full of pitfalls. With no rules in place, chaos is inevitable.

We took a long road to get here. We’ve been developing our own custom data platform since 2015, developing most tools ourselves. Since 2016, we have our self-developed legacy data pipeline orchestration tool.

The motivation to invest a year of work into a new solution was driven by two factors:

  • Lack of transparency on data lineage, especially dependency and availability of data
  • Little room to implement governance

As a technical platform, our target user base for our tooling includes data engineers, data analysts, data scientists, and software engineers. We share the vision that anyone with relevant business context and minimal technical skills can create, deploy, and maintain a data pipeline.

In this context, in 2015 we created the predecessor of our new tool, which allows users to describe their pipeline in a YAML file as a list of steps. It worked well for a while, but we faced many problems along the way, notably:

  • Our product didn’t support pipelines to be triggered by the status of other pipelines, but based on the presence of _SUCCESS files in Amazon Simple Storage Service (Amazon S3). Here we relied on periodic pulls. In complex organizations, data jobs often have strong dependencies to other work streams.
  • Given the previous point, most pipelines could only be scheduled based on a rough estimate of when their parent pipelines might finish. This led to cascaded failures when the parents failed or didn’t finish on time.
  • When a pipeline fails and gets fixed, then manually redeployed, all its dependent pipelines must be rerun manually. This means that the data producer bears the responsibility of notifying every single team downstream.

Having data and tooling democratized without the ability to provide insights into which jobs, data, and dependencies exist diminishes synergies within the company, leading to silos and problems in resource allocation. It became clear that we needed a successor for this product that would give more flexibility to the end-user, less computing costs, and no infrastructure management overhead.

In this post, we describe, through a hypothetical case study, the constraints under which the new solution should perform, the end-user experience, and the detailed architecture of the solution.

Case study

Our case study looks at the following teams:

  • The core-data-availability team has a data pipeline named listings that runs every day at 3:00 AM on the AWS account Account A, and produces on Amazon S3 an aggregate of the listings events published on the platform on the previous day.
  • The search team has a data pipeline named searches that runs every day at 5:00 AM on the AWS account Account B, and exports to Amazon S3 the list of search events that happened on the previous day.
  • The rent-journey team wants to measure a metric referred to as X; they create a pipeline named pipeline-X that runs daily on the AWS account Account C, and relies on the data of both previous pipelines. pipeline-X should only run daily, and only after both the listings and searches pipelines succeed.

User experience

We provide users with a CLI tool that we call DataMario (relating to its predecessor DataWario), and which allows users to do the following:

  • Set up their AWS account with the necessary infrastructure needed to run our solution
  • Bootstrap and manage their data pipeline projects (creating, deploying, deleting, and so on)

When creating a new project with the CLI, we generate (and require) every project to have a pipeline.yaml file. This file describes the pipeline steps and the way they should be triggered, alerting, type of instances and clusters in which the pipeline will be running, and more.

In addition to the pipeline.yaml file, we allow advanced users with very niche and custom needs to create their pipeline definition entirely using a TypeScript API we provide them, which allows them to use the whole collection of constructs in the AWS Cloud Development Kit (AWS CDK) library.

For the sake of simplicity, we focus on the triggering of pipelines and the alerting in this post, along with the definition of pipelines through pipeline.yaml.

The listings and searches pipelines are triggered as per a scheduling rule, which the team defines in the pipeline.yaml file as follows:

trigger: 
    schedule: 
        hour: 3

pipeline-x is triggered depending on the success of both the listings and searches pipelines. The team defines this dependency relationship in the project’s pipeline.yaml file as follows:

trigger: 
    executions: 
        allOf: 
            - name: listings 
              account: Account_A_ID 
              status: 
                  - SUCCESS 
            - name: searches 
              account: Account_B_ID 
              status: 
                  - SUCCESS

The executions block can define a complex set of relationships by combining the allOf and anyOf blocks, along with a logical operator operator: OR / AND, which allows mixing the allOf and anyOf blocks. We focus on the most basic use case in this post.

Accounts setup

To support alerting, logging, and dependencies management, our solution has components that must be pre-deployed in two types of accounts:

  • A central AWS account – This is managed by the Data Platform team and contains the following:
    • A central data pipeline Amazon EventBridge bus receiving all the run status changes of AWS Step Functions workflows running in user accounts
    • An AWS Lambda function logging the Step Functions workflow run changes in an Amazon DynamoDB table to verify if any downstream pipelines should be triggered based on the current event and previous run status changes log
    • A Slack alerting service to send alerts to the Slack channels specified by users
    • A trigger management service that broadcasts triggering events to the downstream buses in the user accounts
  • All AWS user accounts using the service – These accounts contain the following:
    • A data pipeline EventBridge bus that receives Step Functions workflow run status changes forwarded from the central EventBridge bus
    • An S3 bucket to store data pipelines artifacts, along their logs
    • Resources needed to run Amazon EMR clusters, like security groups, AWS Identity and Access Management (IAM) roles, and more

With the provided CLI, users can set up their account by running the following code:

$ dpc setup-user-account

Solution overview

The following diagram illustrates the architecture of the cross-account, event-driven pipeline orchestration product.

In this post, we refer to the different colored and numbered squares to reference a component in the architecture diagram. For example, the green square with label 3 refers to the EventBridge bus default component.

Deployment flow

This section is illustrated with the orange squares in the architecture diagram.

A user can create a project consisting of a data pipeline or more using our CLI tool as follows:

$ dpc create-project -n 'project-name'

The created project contains several components that allow the user to create and deploy data pipelines, which are defined in .yaml files (as explained earlier in the User experience section).

The workflow of deploying a data pipeline such as listings in Account A is as follows:

  • Deploy listings by running the command dpc deploy in the root folder of the project. An AWS CDK stack with all required resources is automatically generated.
  • The previous stack is deployed as an AWS CloudFormation template.
  • The stack uses custom resources to perform some actions, such as storing information needed for alerting and pipeline dependency management.
  • Two Lambda functions are triggered, one to store the mapping pipeline-X/slack-channels used for alerting in a DynamoDB table, and another one to store the mapping between the deployed pipeline and its triggers (other pipelines that should result in triggering the current one).
  • To decouple alerting and dependency management services from the other components of the solution, we use Amazon API Gateway for two components:
    • The Slack API.
    • The dependency management API.
  • All calls for both APIs are traced in Amazon CloudWatch log groups and two Lambda functions:
    • The Slack channel publisher Lambda function, used to store the mapping pipeline_name/slack_channels in a DynamoDB table.
    • The dependencies publisher Lambda function, used to store the pipelines dependencies (the mapping pipeline_name/parents) in a DynamoDB table.

Pipeline trigger flow

This is an event-driven mechanism that ensures that data pipelines are triggered as requested by the user, either following a schedule or a list of fulfilled upstream conditions, such as a group of pipelines succeeding or failing.

This flow relies heavily on EventBridge buses and rules, specifically two types of rules:

  • Scheduling rules.
  • Step Functions event-based rules, with a payload matching the set of statuses of all the parents of a given pipeline. The rules indicate for which set of statuses all the parents of pipeline-X should be triggered.

Scheduling

This section is illustrated with the black squares in the architecture diagram.

The listings pipeline running on Account A is set to run every day at 3:00 AM. The deployment of this pipeline creates an EventBridge rule and a Step Functions workflow for running the pipeline:

  • The EventBridge rule is of type schedule and is created on the default bus (this is the EventBridge bus responsible for listening to native AWS events—this distinction is important to avoid confusion when introducing the other buses). This rule has two main components:
    • A cron-like notation to describe the frequency at which it runs: 0 3 * * ? *.
    • The target, which is the Step Functions workflow describing the workflow of the listings pipeline.
  • The listings Step Function workflow describes and runs immediately when the rule gets triggered. (The same happens to the searches pipeline.)

Each user account has a default EventBridge bus, which listens to the default AWS events (such as the run of any Lambda function) and scheduled rules.

Dependency management

This section is illustrated with the green squares in the architecture diagram. The current flow starts after the Step Functions workflow (black square 2) starts, as explained in the previous section.

As a reminder, pipeline-X is triggered when both the listings and searches pipelines are successful. We focus on the listings pipeline for this post, but the same applies to the searches pipeline.

The overall idea is to notify all downstream pipelines that depend on it, in every AWS account, passing by and going through the central orchestration account, of the change of status of the listings pipeline.

It’s then logical that the following flow gets triggered multiple times per pipeline (Step Functions workflow) run as its status changes from RUNNING to either SUCCEEDED, FAILED, TIMED_OUT, or ABORTED. The reason being that there could be pipelines downstream potentially listening on any of those status change events. The steps are as follows:

  • The event of the Step Functions workflow starting is listened to by the default bus of Account A.
  • The rule export-events-to-central-bus, which specifically listens to the Step Function workflow run status change events, is then triggered.
  • The rule forwards the event to the central bus on the central account.
  • The event is then caught by the rule trigger-events-manager.
  • This rule triggers a Lambda function.
  • The function gets the list of all children pipelines that depend on the current run status of listings.
  • The current run is inserted in the run log Amazon Relational Database Service (Amazon RDS) table, following the schema sfn-listings, time (timestamp), status (SUCCEEDED, FAILED, and so on). You can query the run log RDS table to evaluate the running preconditions of all children pipelines and get all those that qualify for triggering.
  • A triggering event is broadcast in the central bus for each of those eligible children.
  • Those events get broadcast to all accounts through the export rules—including Account C, which is of interest in our case.
  • The default EventBridge bus on Account C receives the broadcasted event.
  • The EventBridge rule gets triggered if the event content matches the expected payload of the rule (notably that both pipelines have a SUCCEEDED status).
  • If the payload is valid, the rule triggers the Step Functions workflow pipeline-X and triggers the workflow to provision resources (which we discuss later in this post).

Alerting

This section is illustrated with the gray squares in the architecture diagram.

Many teams handle alerting differently across the organization, such as Slack alerting messages, email alerts, and OpsGenie alerts.

We decided to allow users to choose their preferred methods of alerting, giving them the flexibility to choose what kind of alerts to receive:

  • At the step level – Tracking the entire run of the pipeline
  • At the pipeline level – When it fails, or when it finishes with a SUCCESS or FAILED status

During the deployment of the pipeline, a new Amazon Simple Notification Service (Amazon SNS) topic gets created with the subscriptions matching the targets specified by the user (URL for OpsGenie, Lambda for Slack or email).

The following code is an example of what it looks like in the user’s pipeline.yaml:

notifications:
    type: FULL_EXECUTION
    targets:
        - channel: SLACK
          addresses:
               - data-pipeline-alerts
        - channel: EMAIL
          addresses:
               - [email protected]

The alerting flow includes the following steps:

  1. As the pipeline (Step Functions workflow) starts (black square 2 in the diagram), the run gets logged into CloudWatch Logs in a log group corresponding to the name of the pipeline (for example, listings).
  2. Depending on the user preference, all the run steps or events may get logged or not thanks to a subscription filter whose target is the execution-tracker-lambda Lambda function. The function gets called anytime a new event gets published in CloudWatch.
  3. This Lambda function parses and formats the message, then publishes it to the SNS topic.
  4. For the email and OpsGenie flows, the flow stops here. For posting the alert message on Slack, the Slack API caller Lambda function gets called with the formatted event payload.
  5. The function then publishes the message to the /messages endpoint of the Slack API Gateway.
  6. The Lambda function behind this endpoint runs, and posts the message in the corresponding Slack channel and under the right Slack thread (if applicable).
  7. The function retrieves the secret Slack REST API key from AWS Secrets Manager.
  8. It retrieves the Slack channels in which the alert should be posted.
  9. It retrieves the root message of the run, if any, so that subsequent messages get posted under the current run thread on Slack.
  10. It posts the message on Slack.
  11. If this is the first message for this run, it stores the mapping with the DB schema execution/slack_message_id to initiate a thread for future messages related to the same run.

Resource provisioning

This section is illustrated with the light blue squares in the architecture diagram.

To run a data pipeline, we need to provision an EMR cluster, which in turn requires some information like Hive metastore credentials, as shown in the workflow. The workflow steps are as follows:

  • Trigger the Step Functions workflow listings on schedule.
  • Run the listings workflow.
  • Provision an EMR cluster.
  • Use a custom resource to decrypt the Hive metastore password to be used in Spark jobs relying on central Hive tables or views.

End-user experience

After all preconditions are fulfilled (both the listings and searches pipelines succeeded), the pipeline-X workflow runs as shown in the following diagram.

As shown in the diagram, the pipeline description (as a sequence of steps) defined by the user in the pipeline.yaml is represented by the orange block.

The steps before and after this orange section are automatically generated by our product, so users don’t have to take care of provisioning and freeing compute resources. In short, the CLI tool we provide our users synthesizes the user’s pipeline definition in the pipeline.yaml and generates the corresponding DAG.

Additional considerations and next steps

We tried to stay consistent and stick to one programming language for the creation of this product. We chose TypeScript, which played well with AWS CDK, the infrastructure as code (IaC) framework that we used to build the infrastructure of the product.

Similarly, we chose TypeScript for building the business logic of our Lambda functions, and of the CLI tool (using Oclif) we provide for our users.

As demonstrated in this post, EventBridge is a powerful service for event-driven architectures, and it plays a central and important role in our products. As for its limitations, we found that pairing Lambda and EventBridge could fulfill all our current needs and granted a high level of customization that allowed us to be creative in the features we wanted to serve our users.

Needless to say, we plan to keep developing the product, and have a multitude of ideas, notably:

  • Extend the list of core resources on which workloads run (currently only Amazon EMR) by adding other compute services, such Amazon Elastic Compute Cloud (Amazon EC2)
  • Use the Constructs Hub to allow users in the organization to develop custom steps to be used in all data pipelines (we currently only offer Spark and shell steps, which suffice in most cases)
  • Use the stored metadata regarding pipeline dependencies for data lineage, to have an overview of the overall health of the data pipelines in the organization, and more

Conclusion

This architecture and product brought many benefits. It allows us to:

  • Have a more robust and clear dependency management of data pipelines at Scout24.
  • Save on compute costs by avoiding scheduling pipelines based approximately on when its predecessors are usually triggered. By shifting to an event-driven paradigm, no pipeline gets started unless all its prerequisites are fulfilled.
  • Track our pipelines granularly and in real time on a step level.
  • Provide more flexible and alternative business logic by exposing multiple event types that downstream pipelines can listen to. For example, a fallback downstream pipeline might be run in case of a parent pipeline failure.
  • Reduce the cross-team communication overhead in case of failures or stopped runs by increasing the transparency of the whole pipelines’ dependency landscape.
  • Avoid manually restarting pipelines after an upstream pipeline is fixed.
  • Have an overview of all jobs that run.
  • Support the creation of a performance culture characterized by accountability.

We have big plans for this product. We will use DataMario to implement granular data lineage, observability, and governance. It’s a key piece of infrastructure in our strategy to scale data engineering and analytics at Scout24.

We will make DataMario open source towards the end of 2022. This is in line with our strategy to promote our approach to a solution on a self-built, scalable data platform. And with our next steps, we hope to extend this list of benefits and ease the pain in other companies solving similar challenges.

Thank you for reading.


About the authors

Mehdi Bendriss is a Senior Data / Data Platform Engineer, MSc in Computer Science and over 9 years of experience in software, ML, and data and data platform engineering, designing and building large-scale data and data platform products.

Mohamad Shaker is a Senior Data / Data Platform Engineer, with over 9 years of experience in software and data engineering, designing and building large-scale data and data platform products that enable users to access, explore, and utilize their data to build great data products.

Arvid Reiche is a Data Platform Leader, with over 9 years of experience in data, building a data platform that scales and serves the needs of the users.

Marco Salazar is a Solutions Architect working with Digital Native customers in the DACH region with over 5 years of experience building and delivering end-to-end, high-impact, cloud native solutions on AWS for Enterprise and Sports customers across EMEA. He currently focuses on enabling customers to define technology strategies on AWS for the short- and long-term that allow them achieve their desired business objectives, specializing on Data and Analytics engagements. In his free time, Marco enjoys building side-projects involving mobile/web apps, microcontrollers & IoT, and most recently wearable technologies.

GitHub Availability Report: October 2022

Post Syndicated from Jakub Oleksy original https://github.blog/2022-11-02-github-availability-report-october-2022/

In October, we experienced four incidents that resulted in significant impact and degraded state of availability to multiple GitHub services. This report also sheds light into an incident that impacted Codespaces in September.

October 26 00:47 UTC (lasting 3 hours and 47 minutes)

Our alerting systems detected an incident that impacted most Codespaces customers. Due to the recency of this incident, we are still investigating the contributing factors and will provide a more detailed update on cause and remediation in the November Availability Report, which we will publish the first Wednesday of December.

October 13 20:43 UTC (lasting 48 minutes)

On October 13, 2022 at 20:43 UTC, our alerting systems detected an increase in the Projects API error response rate. Due to the significant customer impact, we went to status red for Issues at 20:47 UTC. Within 10 minutes of the alert, we traced the cause to a recently-deployed change.

This change introduced a database validation that required a certain value to be present. However, it did not correctly set a default value in every scenario. This resulted in the population of null values in some cases, which produced an error when pulling certain records from the database.

We initiated a roll back of the change at 21:08 UTC. At 21:13 UTC, we began to see a steady decrease in the number of error responses from our APIs back to normal levels, changed the status of Issues to yellow at 21:24 UTC, and changed the status of Issues to green at 21:31 UTC once all metrics were healthy.

Following this incident, we have added mitigations to protect against missing values in the future, and we have improved testing around this particular area. We have also fixed our deployment dashboards, which contained some inaccurate data for pre-production errors. This will ensure that errors are more visible during the deploy process to help us prevent these issues from reaching production.

October 12 23:27 UTC (lasting 3 hours and 31 minutes)

On October 12, 2022 at 22:30 UTC, we rolled out a global configuration change for Codespaces. At 23:15 UTC, after the change had propagated to a variety of regions, we noticed new Codespace creation starting to trend downward and were alerted to issues from our monitors. At 23:27 UTC, we deemed the impact significant enough to status Codespaces yellow, and eventually red, based on continued degradation.

During the incident, it was discovered that one of the older components of the backend system did not cope well with the configuration change, causing a schema conflict. This was not properly tested prior to the rollout. Additionally, this component version does not support gradual exposure across regions—so many regions were impacted at once. Once we detected the issue and determined the configuration change was the cause, we worked to carefully roll back the large schema change. Due to the complexity of the rollback, the procedure took an extended period of time. Once the rollback was complete and metrics tracking new Codespaces creations were healthy, we changed the status of the service back to green at 02:58 UTC.

After analyzing this incident, we determined we can eliminate our dependency on this older configuration type and have repair work in progress to eliminate this type of configuration from Codespaces entirely. We have also verified that all future changes to any component will follow safe deployment practices (one test region followed by individual region rollouts) to avoid global impact in the future.

October 5 06:30 UTC (lasting 31 minutes)

On October 5, 2022 at 06:30 UTC, webhooks experienced a significant backlog of events caused by a high volume of automated user activity causing a rapid series of create and delete operations. This activity triggered a large influx of webhook events. However, many of these events caused exceptions in our webhook delivery worker because data needed to generate their webhook payloads had been deleted from the database. Attempting to retry these failed jobs tied up our worker and it was unable to process new incoming events, resulting in a severe backlog in our queues. Downstream services that rely on webhooks to receive their events were unable to receive them, which resulted in service degradation. We updated GitHub Actions to status red because the webhooks delay caused new job execution to be severely delayed.

Investigation into the source of the automated activity led us to find that there was automation creating and deleting many repositories in quick succession. As a mitigation, we disabled the automated accounts that were causing this activity in order to give us time to find a longer term solution for such activity.

Once the automated accounts were disabled, it brought the webhook deliveries back to normal and the backlog got mitigated at 07:01 UTC. We also updated our webhook delivery workers to not retry any jobs for which it was determined that the data did not exist in the database. Once the fix was put in place, the accounts were re-enabled and no further problems were encountered with our worker. We recognize that our services must be resilient to spikes in load and will make improvements based on what we’ve learned in this incident.

September 28 03:53 UTC (lasting 1 hour and 16 minutes)

On September 27, 2022 at 23:14 UTC, we performed a routine secret rotation procedure on Codespaces. On September 28, 2022 at 03:21 UTC, we received an internal report stating that port forwarding was not working on the Codespaces web client and began investigating. At 03:53 UTC. we statused yellow due to the broad user impact we were observing. Upon investigation, we found that we missed a step in the secret rotation checklist a few hours earlier, which caused some downstream components to fail to pick up the new secret. This resulted in some traffic not reaching backend services as expected. At 04:29 UTC, we ran the missed rotation step, after which we quickly saw the port forwarding feature returning to a healthy state. At this moment, we considered the incident to be mitigated. We investigated why we did not receive automated alerts about this issue and found that our alerts were monitoring error rates but did not alert for lack of overall traffic to the port forwarding backend. We have since improved our monitoring to include anomalies in traffic levels that cover this failure mode.

Several hours later, at 17:18 UTC, our monitors alerted us of an issue in a separate downstream component, which was similarly caused by the previous missed secret rotation step. We could see Codespaces creation and start failures increasing in all regions. The effect from the earlier secret rotation was not immediate because this secret is used in exchange for a token, which is cached for up to 24 hours. Our understanding was that the system would pick up the new secret without intervention, but in reality this secret was picked up only if the process was restarted. At 18:27 UTC, we restarted the service in all regions and could see that the VM pools, which were heavily drained before, started to slowly recover. To accelerate the draining of the backlog of queued jobs we increased the pool size at 18:45 UTC. This helped all but two pools in West Europe, which were still not recovering. At 19:44 UTC, we identified an instance of the service in West Europe that was not rotated along the rest. We rotated that instance and quickly saw a recovery in the affected pools.

After the incident, we identified why multiple downstream components failed to pick up the rotated secret. We then added additional monitoring to identify which secret versions are in use across all components in the service to more easily track and verify secret rotations. To address this short term, we have updated our secret rotation checklist to include the missing steps and added additional verification steps to ensure the new secrets are picked up everywhere. Longer term, we are automating most of our secret rotation processes to avoid human error.

In summary

Please follow our status page for real-time updates on status changes. To learn more about what we’re working on, check out the GitHub Engineering Blog.

Common questions when evolving your VM program

Post Syndicated from Rapid7 original https://blog.rapid7.com/2022/11/02/common-questions-when-evolving-your-vm-program/

Common questions when evolving your VM program

Authored by Natalie Hurd

Perhaps your organization is in the beginning stages of planning a digital transformation, and it’s time to start considering how the security team will adapt. Or maybe your digital transformation is well underway, and the security team is struggling to keep up with the pace of change. Either way, you’ve likely realized that the approach you’ve used with traditional infrastructure will need to evolve as you think about managing risk in your modern ecosystem. After all, a cloud instance running Kubernetes clusters to support application development is quite different from an on-premise Exchange server!

A recent webinar led by two of Rapid7’s leaders, Peter Scott (VP, Product Marketing) and Cindy Stanton (SVP, Product and Customer Marketing), explored the specific challenges of managing the evolution of risk across traditional and cloud environments. The challenges may be plentiful, but the strategies for success are just as numerous!

Over the course of several years, Rapid7 has helped many customers evolve their security programs in order to keep pace with the evolution of technology, and Peter and Cindy have noticed some themes of what tends to make these organizations successful. They advise working with your team & other stakeholders to find answers to the following questions:

  • What sorts of resources does your organization run in the cloud, and who owns them?
  • What does “good” look like when securing your cloud assets, and how will you measure success?
  • Which standards and frameworks is your company subject to, compliance or otherwise?

Gathering answers to these questions as early as possible will not only aid in the efficacy of your security program, it will also help to establish strong relationships & understanding amongst key stakeholders.

Establishing Ownership


Common questions when evolving your VM program

Proactively identifying teams and individuals that own the assets in your environment will go a long way towards ensuring speed of resolution when risk is present. Peter strongly suggests working with your organization’s Product or Project Development teams to figure out who owns what and get it documented. This way, when you see a misconfiguration, vulnerability or threat that needs to be dealt with, you know exactly who to talk to to get it resolved, saving important time.

The owners that you identify will not only have a hand to play in fixing problems, they can help make the necessary changes to “shift left” and prevent problems in the first place. The sooner you can identify these stakeholders and build relationships with them, the more successful you’ll be in the long run.

Defining “Good” and Tracking Achievement


Common questions when evolving your VM program

Since we’ve established that securing traditional environments is not the same as securing modern environments, we can also agree that the definition of success may not be the same either! After you’ve established ownership, Cindy notes that it’s also important to define what “good” looks like, and how you plan to measure & report on it. Once you’ve created a definition of “good” within your immediate team, it’s also important to socialize that with stakeholders across your organization and track progress towards achieving that state. Tracking & sharing progress is valuable whether your organization meets, exceeds or falls short of your goals; celebrating the wins is just as important as seeking to understand the losses!

Aligning to Standards and Frameworks


Common questions when evolving your VM program

Every industry comes with its own set of compliance and regulatory standards that must be adhered to, and it’s important to understand how security fits in. Your team can use these frameworks as a North Star of sorts when considering how to secure your environment, and the cloud aspects of your environment are no exception. Ben Austin, the moderator of the webinar, provides some perspective on the utility of compliance as a method for demonstrating progress in risk reduction. If your assets are more compliant today than they were 3 months ago, that’s a win for every stakeholder involved. If assets are getting less compliant, then you can work with your already-identified asset owners to make a plan to turn the ship around, and contextualize the importance of remaining compliant with them.

Check out our two previous blogs in the series to learn more about Addressing the Evolving Attack Surface and Adapting your VM Program to Regain Control, and watch the full webinar replay any time!

Security updates for Wednesday

Post Syndicated from original https://lwn.net/Articles/913504/

Security updates have been issued by Debian (ffmpeg and linux-5.10), Fedora (libksba, openssl, and php), Gentoo (openssl), Mageia (curl, gdk-pixbuf2.0, libksba, nbd, php, and virglrenderer), Red Hat (kernel, kernel-rt, libksba, and openssl), SUSE (gnome-desktop, hdf5, hsqldb, kernel, nodejs10, openssl-3, php7, podofo, python-Flask-Security, python-lxml, and xorg-x11-server), and Ubuntu (backport-iwlwifi-dkms, firefox, ntfs-3g, and openssl).

Cloudflare is not affected by the OpenSSL vulnerabilities CVE-2022-3602 and CVE-2022-37

Post Syndicated from Evan Johnson original https://blog.cloudflare.com/cloudflare-is-not-affected-by-the-openssl-vulnerabilities-cve-2022-3602-and-cve-2022-37/

Cloudflare is not affected by the OpenSSL vulnerabilities CVE-2022-3602 and CVE-2022-37

Cloudflare is not affected by the OpenSSL vulnerabilities CVE-2022-3602 and CVE-2022-37

Yesterday, November 1, 2022, OpenSSL released version 3.0.7 to patch CVE-2022-3602 and CVE-2022-3786, two HIGH risk vulnerabilities in the OpenSSL 3.0.x cryptographic library. Cloudflare is not affected by these vulnerabilities because we use BoringSSL in our products.

These vulnerabilities are memory corruption issues, in which attackers may be able to execute arbitrary code on a victim’s machine. CVE-2022-3602 was initially announced as a CRITICAL severity vulnerability, but it was downgraded to HIGH because it was deemed difficult to exploit with remote code execution (RCE). Unlike previous situations where users of OpenSSL were almost universally vulnerable, software that is using other versions of OpenSSL (like 1.1.1) are not vulnerable to this attack.

How do these issues affect clients and servers?

These vulnerabilities reside in the code responsible for X.509 certificate verification – most often executed on the client side to authenticate the server and the certificate presented. In order to be impacted by this vulnerability the victim (client or server) needs a few conditions to be true:

  • A malicious certificate needs to be signed by a Certificate Authority that the victim trusts.
  • The victim needs to validate the malicious certificate or ignore a series of warnings from the browser.
  • The victim needs to be running OpenSSL 3.0.x before 3.0.7.

For a client to be affected by this vulnerability, they would have to visit a malicious site that presents a certificate containing an exploit payload. In addition, this malicious certificate would have to be signed by a trusted certificate authority (CA).

Servers with a vulnerable version of OpenSSL can be attacked if they support mutual authentication – a scenario where both client and a server provide a valid and signed X.509 certificate, and the client is able to present a certificate with an exploit payload to the server.

How should you handle this issue?

If you’re managing services that run OpenSSL: you should patch vulnerable OpenSSL packages. On a Linux system you can determine if you have any processes dynamically loading OpenSSL with the lsof command. Here’s an example of finding OpenSSL being used by NGINX.

root@55f64f421576:/# lsof | grep libssl.so.3
nginx   1294     root  mem       REG              254,1           925009 /usr/lib/x86_64-linux-gnu/libssl.so.3 (path dev=0,142)

Once the package maintainers for your Linux distro release OpenSSL 3.0.7 you can patch by updating your package sources and upgrading the libssl3 package. On Debian and Ubuntu this can be done with the apt-get upgrade command

root@55f64f421576:/# apt-get --only-upgrade install libssl3

With that said, it’s possible that you could be running a vulnerable version of OpenSSL that the lsof command can’t find because your process is statically compiled. It’s important to update your statically compiled software that you are responsible for maintaining, and make sure that over the coming days you are updating your operating system and other installed software that might contain the vulnerable OpenSSL versions.

Key takeaways

Cloudflare’s use of BoringSSL helped us be confident that the issue would not impact us prior to the release date of the vulnerabilities.

More generally, the vulnerability is a reminder that memory safety is still an important issue. This issue may be difficult to exploit because it requires a maliciously crafted certificate that is signed by a trusted CA, and certificate issuers are likely to begin validating that the certificates they sign don’t contain payloads that exploit these vulnerabilities.  However, it’s still important to patch your software and upgrade your vulnerable OpenSSL packages to OpenSSL 3.0.7 given the severity of the issue.

To learn more about our mission to help build a better Internet, start here. If you’re looking for a new career direction, check out our open positions.

The collective thoughts of the interwebz