This guest post was authored by Sapan Jain, DevOps Engineer at Slice, and edited by Sobhan Archakam and Adnan Bilwani, at AWS.
Slice empowers over 18,000 independent pizzerias with the modern tools that have grown the major restaurant chains. By uniting these small businesses with specialized technology, marketing, data insights, and shared services, Slice enables them to serve their digitally-minded customers and move away from third-party apps. Using Amazon DevOps Guru, Slice is able to fine-tune their operations to better support these customers.
Serial tech entrepreneur Ilir Sela started Slice to modernize and support his family’s New York City pizzerias. Today, the company partners with restaurants in 3,000 cities and all 50 states, forming the nation’s largest pizza network. For more information, visit slicelife.com.
Slice’s challenge
At Slice, we manage a wide variety of systems, services, and platforms, all with varying levels of complexity. Observability, monitoring, and log aggregation are things we excel at, and they’re always critical for our platform engineering team. However, deriving insights from this data still requires some manual investigation, particularly when dealing with operational anomalies and/or misconfigurations.
To gain automated insights into our services and resources, Slice conducted a proof-of-concept utilizing Amazon DevOps Guru to analyze a small selection of AWS resources. Amazon DevOps Guru identified potential issues in our environment, resulting in actionable insights (ultimately leading to remediation). As a result of this analysis, we enabled Amazon DevOps Guru account-wide, thereby leading to numerous insights into our production environment.
Insights with Amazon DevOps Guru
After we configured Amazon DevOps Guru to begin its account-wide analysis, we left the tool alone to begin the process of collecting and analyzing data. We immediately began seeing some actionable insights for various production AWS resources, some of which are highlighted in the following section:
Amazon DynamoDB Point-in-time recovery
Amazon DynamoDB offers a point-in-time recovery (PITR) feature that provides continuous backups of your DynamoDB data for 35 days to help you protect against accidental write or deletes. If enabled, this lets you restore your respective table to a previous state. Amazon DevOps Guru identified several tables in our environment that had PITR disabled, along with a corresponding Recommendation.
Figure 1. The graphic shows proactive insights for the last 1 month. The one insight shown is ‘Dynamo Table Point in Time Recovery not enabled’ with a status of OnGoing and a severity of low.
Elasticache anomalous evictions
Amazon Elasticache for Redis is used by a handful of our services to cache any relevant application data. Amazon DevOps Guru identified that one of our instances was exhibiting anomalous behavior regarding its cache eviction rate. Essentially, due to the memory pressure of the instance, the eviction rate of cache entries began to increase. DevOps Guru recommended revisiting the sizing of this instance and scaling it vertically or horizontally, where appropriate.
Figure 2. The graph shows the metric: count of ElastiCache evictions plotted for the time period Jul 3, 20:35 to Jul 3, 21:35 UTC. A highlighted section shows that the evictions increased to a peak of 2500 between 21:00 and 21:08. Outside of this interval the evictions are below 500
AWS Lambda anomalous errors
We manage a few AWS Lambda functions that all serve different purposes. During the beginning of normal work day, we began to see increased error rates for a particular function resulting in an exception being thrown. DevOps Guru was able to detect the increase in error rates and flag them as anomalous. Although retries in this case wouldn’t have solved the problem, it did increase our visibility into the issue (which was also corroborated by our APM platform).
Figure 3. The graph shows the metric: count of AWS/Lambda errors plotted between 11:00 and 13:30 on Jul 6. The sections between the times 11:23 and 12:15 UTC are highlighted to show the anomalies
Conclusion
Amazon DevOps Guru integrated into our environment quickly, with no more additional configuration or setup aside from a few button clicks to enable the service. After reviewing several of the proactive insights that DevOps Guru provided, we could formulate plans of action regarding remediation. One specific case example of this is where DevOps Guru flagged several of our Lambda functions for not containing enough subnets. After triaging the finding, we discovered that we were lacking multi-AZ redundancy for several of those functions. As a result, we could implement a change that maximized our availability of those resources.
With the continuous analysis that DevOps Guru performs, we continue to gain new insights into the resources that we utilize and deploy in our environment. This lets us improve operationally while simultaneously maintaining production stability.
For many years, Chaos Engineering was viewed as a mechanism to help surface the “known-unknowns” (things that we are aware of, but do not fully understand) in our environments or “unknown-unknowns” (things we are neither aware of, nor fully understand).
Using Chaos Engineering, chaos experiments have been conducted on infrastructure, applications, and business processes that identified weaknesses and prevented outages for many organizations; yet, while Chaos Engineering found a home across various industries, like Financial Services, Media and Entertainment, Healthcare, Telecommunication, Hospitality and others, it has been slow in its adoption.
A different perspective on Chaos Engineering
For the last decade, Chaos Engineering had the reputation of being a mechanism to “purposely break things in production”, which stopped many companies from adopting it. The ultimate goal of Chaos Engineering is not about breaking production systems.
Chaos Engineering offers a mechanism that allows your teams to gain deep insights into your workloads by executing controlled chaos experiments that are based on a real-world hypothesis. These experiments have a clear scope that defines the expected impact to the workload and includes a rollback mechanism where there is availability or recovery processes in place to mitigate the failure.
Chaos Engineering drives operational readiness and best practices around how your workloads should be observed, designed, and implemented to survive component failure with minimal to no impact to the end user. Therefore, Chaos Engineering can lead to improved resilience and observability, ultimately improving the end-user’s experience and increasing organizations’ uptime.
The Shared Responsibility Model for resilience
When you build a workload in the Amazon Web Services (AWS) Cloud, we (at AWS) are responsible for the “resilience of the cloud”; this means, we are responsible for the resilience of the services and infrastructure offered on the AWS Cloud. This infrastructure is composed of the hardware, software, networking, and facilities that run AWS Cloud services.
Your responsibility as a customer is the “resilience in the cloud”, meaning your responsibility is determined by the AWS Cloud services that you consume. This determines the amount of configuration work, recovery mechanisms, operational tooling, and observability logic that are needed to make the workload resilient (Figure 1).
Figure 1. AWS Shared Responsibility Model for resilience
Resilience in the cloud
Separation of duties creates interesting challenges in resilience:
How can you build workloads that will mitigate enough failure modes to meet your resilience objective, if you are not responsible for operating the underlying services that you rely on?
How are your workloads performing if one or more AWS services are impaired, a network disruption occurs, or a natural disaster strikes?
While there is distinct guidance on these questions in the AWS Well-Architected Framework’s Reliability Pillar, one question still remains: can your team/organization simulate a controlled event in pre-production or production that would give them confidence that the observability tooling, incident response, and recovery mechanisms will protect the workload from a disruption with minimal to no customer impact?
If you have been operating in a regulated environment, like the Financial Services industry, Healthcare, or the Federal Government, you can cite that the quarterly/yearly disaster-recovery (DR) exercises and your business continuity plan help with such simulations.
Planned DR exercises have a clear structure and scope: employees know that they have to be ready on a certain date and time, and they will execute the runbooks and playbooks that are hopefully up-to-date on that day. In essence, this validates a failover of a known-state. While DR exercises can provide a high level of confidence that operations will continue in a secondary region without being dependent on any services in the primary site, these exercises do not provide the ability to detect and mitigate the different types of failure modes that may be encountered in a real-world scenario.
Disaster recovery and failure in the real world
For example, in 2012, Hurricane Sandy took down critical infrastructure services when it struck the Northeast US, resulting in power and telecommunication outages on the East Coast. Many companies’ business continuity plans did not account for staff living in zones impacted by natural disaster. Clearly, these individuals would/will not be able to assist during a real-life DR event.
Executing a DR plan quarterly or yearly may not be enough to prepare an organization for real-world events: they can come without notice and in many different flavors, like faulty deployments or configurations, hardware failures, data and state corruption, the inability to connect to a third-party provider, or natural disasters. Most may not require the execution of your DR plan but, instead, challenge observability, high-availability strategy, and incident-response processes.
Chaos Engineering real-world events
How can you prepare for unknown events? Chaos Engineering provides value to your organization by allowing it to get ahead of unexpected disruptions by continuously injecting controlled, real-world disruptions as a scheduled job, in your software development lifecycle, and/or continuous integration and continuous delivery (CI/CD) pipelines at the cloud-provider, infrastructure, workload-component, and process level.
Consider Chaos Engineering a resilience guardian: it gives the confidence, control, and rigor needed to ensure the experiment does not impact the customer, or quickly stop the experiment if it does. Using these mechanisms, your teams can learn from faults in a controlled environment and observe, measure, and improve the workloads’ resilience, plus validate the logs, metrics, and that alarms are in place to notify operators within a predetermined timeframe.
Finding and amending deficiencies
When incorporating Chaos Engineering into your day-to-day operations, workload deficiencies will surface and need to be addressed. Chaos Engineering experiments run in production that surface unexpected behavior will only minimally impact customers, if at all, compared with real-world, unexpected disruptions. Controlled experiments are executed with a clear scope of impact. Experts are present to observe the experiment and automated rollback mechanisms executed. In the worst-case scenario, these experts will get hands-on and remediate the disruption on the spot.
If an experiment surfaces unknown behavior, there is a Correction of Error (COE) analysis. The COE is a process for improving quality by documenting and addressing issues, focusing on identifying and amending root causes.
Using the COE, we can explore the customer interaction with the workload and understand the customer impact. This can provide further insights on what happened during the event and give way to deep dives into the component that caused failure. If the fault is not identifiable, more observability should be added to the workload.
Additionally, incident-response mechanisms are reviewed to validate that a disruption was detected, key stakeholders are notified, and escalations processes begin in the predetermined timeframe. Prioritizing new findings and, based on impact, adding them to the issue back log, and addressing known risks are the keys to successful Chaos Engineering and mitigating future impact to the workload.
Figure 2. AWS Fault Injection Simulator integrates with AWS resources
As Chaos Engineering should provide as much flexibility as possible when it comes to fault injection, AWS FIS integrates with external tools, such as Chaos Toolkit and Chaos Mesh, to expand the scope of failures that can be injected to your workload.
Conclusion
Chaos Engineering is not about breaking systems but rather creating resilient workloads that can survive real-world events with minimal-to-no customer impact, by finding the “known-unknowns” and/or “unknown-unknowns” that can cause such events. Additionally, these mechanisms help improve operational excellence and resilience through developer and observability best practices, allowing you to catch deficiencies before they escalate into large-scale events and therefore improve the customers experience.
Security updates have been issued by Debian (mediawiki and twig), Oracle (expat, gnutls and nettle, and kernel), Red Hat (expat, kernel, and kpatch-patch), and Ubuntu (advancecomp and dotnet6).
Welcome to our DDoS Threat Report for the third quarter of 2022. This report includes insights and trends about the DDoS threat landscape – as observed across Cloudflare’s global network.
Multi-terabit strong DDoS attacks have become increasingly frequent. In Q3, Cloudflare automatically detected and mitigated multiple attacks that exceeded 1 Tbps. The largest attack was a 2.5 Tbps DDoS attack launched by a Mirai botnet variant, aimed at the Minecraft server, Wynncraft. This is the largest attack we’ve ever seen from the bitrate perspective.
It was a multi-vector attack consisting of UDP and TCP floods. However, Wynncraft, a massively multiplayer online role-playing game Minecraft server where hundreds and thousands of users can play on the same server, didn’t even notice the attack, since Cloudflare filtered it out for them.
The 2.5 Tbps DDoS attack that targeted Wynncraft — launched by Mirai
General DDoS attack trends
Overall this quarter, we’ve seen:
An increase in DDoS attacks compared to last year.
Longer-lasting volumetric attacks, a spike in attacks generated by the Mirai botnet and its variants.
Surges in attacks targeting Taiwan and Japan.
Application-layer DDoS attacks
HTTP DDoS attacks increased by 111% YoY, but decreased by 10% QoQ.
HTTP DDoS attacks targeting Taiwan increased by 200% QoQ; attacks targeting Japan increased by 105% QoQ.
Reports of Ransom DDoS attacks increased by 67% YoY and 15% QoQ.
Network-layer DDoS attacks
L3/4 DDoS attacks increased by 97% YoY and 24% QoQ.
L3/4 DDoS attacks by Mirai botnets increased by 405% QoQ.
The Gaming / Gambling industry was the most targeted by L3/4 DDoS attacks including a massive 2.5 Tbps DDoS attack.
This report is based on DDoS attacks that were automatically detected and mitigated by Cloudflare’s DDoS Protection systems. To learn more about how it works, check out this deep-dive blog post.
Ransom attacks
Ransom DDoS attacks are attacks where the attacker demands a ransom payment, usually in the form of Bitcoin, to stop/avoid the attack. In Q3, 15% of Cloudflare customers that responded to our survey reported being targeted by HTTP DDoS attacks accompanied by a threat or a ransom note. This represents a 15% increase QoQ and 67% increase YoY of reported ransom DDoS attacks.
Distribution of Ransom DDoS attacks by quarter
Diving into Q3, we can see that since June 2022, there was a steady decline in reports of ransom attacks. However, in September, the reports of ransom attacks spiked again. In the month of September, almost one out of every four respondents reported receiving a ransom DDoS attack or threat — the highest month in 2022 so far.
Distribution of Ransom DDoS attacks by month
How we calculate Ransom DDoS attack trends Our systems constantly analyze traffic and automatically apply mitigation when DDoS attacks are detected. Each DDoS’d customer is prompted with an automated survey to help us better understand the nature of the attack and the success of the mitigation. For over two years, Cloudflare has been surveying attacked customers. One of the questions in the survey asks the respondents if they received a threat or a ransom note demanding payment in exchange to stop the DDoS attack. Over the past year, on average, we collected 174 responses per quarter. The responses of this survey are used to calculate the percentage of Ransom DDoS attacks.
Application-layer DDoS attacks
Application-layer DDoS attacks, specifically HTTP DDoS attacks, are attacks that usually aim to disrupt a web server by making it unable to process legitimate user requests. If a server is bombarded with more requests than it can process, the server will drop legitimate requests and – in some cases – crash, resulting in degraded performance or an outage for legitimate users.
Application-layer DDoS attack trends
When we look at the graph below, we can see a clear trend of approximately 10% decrease in attacks each quarter since 2022 Q1. However, despite the downward trend, when comparing Q3 of 2022 to Q3 of 2021, we can see that HTTP DDoS attacks still increased by 111% YoY.
Distribution of HTTP DDoS attacks by quarter
When we dive into the months of the quarter, attacks in September and August were fairly evenly distributed; 36% and 35% respectively. In July, the amount of attacks was the lowest for the quarter (29%).
Distribution of HTTP DDoS attacks by month in 2022 Q3
Application-layer DDoS attacks by industry
By bucketing the attacks by our customers’ industry of operation, we can see that HTTP applications operated by Internet companies were the most targeted in Q3. Attacks on the Internet industry increased by 131% QoQ and 300% YoY.
The second most attacked industry was the Telecommunications industry with an increase of 93% QoQ and 2,317% (!) YoY. In third place was the Gaming / Gambling industry with a more conservative increase of 17% QoQ and 36% YoY.
Top industries targeted by HTTP DDoS attacks in 2022 Q3
Application-layer DDoS attacks by target country
Bucketing attacks by our customers’ billing address gives us an understanding of which countries are more attacked. HTTP applications operated by US companies were the most targeted in Q3. US-based websites saw an increase of 60% QoQ and 105% YoY in attacks targeting them. After the US, was China with a 332% increase QoQ and an 800% increase YoY.
Looking at Ukraine, we can see that attacks targeting Ukrainian websites increased by 67% QoQ but decreased by 50% YoY. Furthermore, attacks targeting Russian websites increased by 31% QoQ and 2,400% (!) YoY.
In East Asia, we can see that attacks targeting Taiwanese companies increased by 200% QoQ and 60% YoY, and attacks targeting Japanese companies increased by 105% QoQ.
Top countries targeted by HTTP DDoS attacks in 2022 Q3
When we zoom in on specific countries, we can identify the below trends that may reveal interesting insights regarding the war in Ukraine and geopolitical events in East Asia:
In Ukraine, we see a surprising change in the attacked industries. Over the past two quarters, Broadcasting, Online Media and Publishing companies were targeted the most in what appeared to be an attempt to silence information and make it unavailable to civilians. However, this quarter, those industries dropped out of the top 10 list. Instead, the Marketing & Advertising industry took the lead (40%), followed by Education companies (20%), and Government Administration (8%).
In Russia, attacks on the Banking, Financial Services and Insurance (BFSI) industry continue to persist (25%). Be that as it may, attacks on the BFSI sector still decreased by 44% QoQ. In second place is the Events Services industry (20%), followed by Cryptocurrency (16%), Broadcast Media (13%), and Retail (11%). A significant portion of the attack traffic came from Germany-based IP addresses, and the rest were globally distributed.
In Taiwan, the two most attacked industries were Online Media (50%) and Internet (23%). Attacks to those industries were globally distributed indicating the usage of botnets.
In Japan, the most attacked industry was Internet/Media & Internet (52%), Business Services (12%), and Government – National (11%).
Application-layer DDoS attack traffic by source country
Before digging into specific source country metrics, it is important to note that while country of origin is interesting, it is not necessarily indicative of where the attacker is located. Oftentimes with DDoS attacks, they are launched remotely, and attackers will go to great lengths to hide their actual location in an attempt to avoid being caught. If anything, it is indicative of where botnet nodes are located. With that being said, by mapping the attacking IP address to their location, we can understand where attack traffic is coming from.
After two consecutive quarters, China replaced the US as the main source of HTTP DDoS attack traffic. In Q3, China was the largest source of HTTP DDoS attack traffic. Attack traffic from China-registered IP addresses increased by 29% YoY and 19% QoQ. Following China was India as the second-largest source of HTTP DDoS attack traffic — an increase of 61% YoY. After India, the main sources were the US and Brazil.
Looking at Ukraine, we can see that this quarter there was a drop in attack traffic originating from Ukrainian and Russian IP addresses — a decrease of 29% and 11% QoQ, respectively. However, YoY, attack traffic from within those countries still increased by 47% and 18%, respectively.
Another interesting data point is that attack traffic originating from Japanese IP addresses increased by 130% YoY.
Top source countries of HTTP DDoS attacks in 2022 Q3
Network-layer DDoS attacks
While application-layer attacks target the application (Layer 7 of the OSI model) running the service that end users are trying to access (HTTP/S in our case), network-layer attacks aim to overwhelm network infrastructure (such as in-line routers and servers) and the Internet link itself.
Network-layer DDoS attack trends
In Q3, we saw a large surge in L3/4 DDoS attacks — an increase of 97% YoY and a 24% QoQ. Furthermore, when we look at the graph we can see a clear trend, over the past three quarters, of an increase in attacks.
Distribution of L3/4 DDoS attacks by quarter
Drilling down into the quarter, it’s apparent that the attacks were, for the most part, evenly distributed throughout the quarter — with a slightly larger share for July.
Distribution of L3/4 DDoS attacks by month in 2022 Q3
Network-layer DDoS attacks by Industry
The Gaming / Gambling industry was hit by the most L3/4 DDoS attacks in Q3. Almost one out of every five bytes Cloudflare ingested towards Gaming / Gambling networks was part of a DDoS attack. This represents a whopping 381% increase QoQ.
The second most targeted industry was Telecommunications — almost 6% of bytes towards Telecommunications networks were part of DDoS attacks. This represents a 58% drop from the previous quarter where Telecommunications was the top most attacked industry by L3/4 DDoS attacks.
Following were the Information Technology and Services industry along with the Software industry. Both saw significant growth in attacks — 89% and 150% QoQ, respectively.
Top industries targeted by L3/4 DDoS attacks in 2022 Q3
Network-layer DDoS attacks by target country
In Q3, Singapore-based companies saw the most L3/4 DDoS attacks — over 15% of all bytes to their networks were associated with a DDoS attack. This represents a dramatic 1,175% increase QoQ.
The US comes in second after a 45% decrease QoQ in attack traffic targeting US networks. In third, China, with a 62% QoQ increase. Attacks on Taiwan companies also increased by 200% QoQ.
Top countries targeted by L3/4 DDoS attacks in 2022 Q3
Network-layer DDoS attacks by ingress country
In Q3, Cloudflare’s data centers in Azerbaijan saw the largest percentage of attack traffic. More than a third of all packets ingested there were part of a L3/4 DDoS attack. This represents a 44% increase QoQ and a huge 59-fold increase YoY.
Similarly, our data centers in Tunisia saw a dramatic increase in attack packets – 173x the amount in the previous year. Zimbabwe and Germany also saw significant increases in attacks.
Zooming into East Asia, we can see that our data centers in Taiwan saw an increase of attacks — 207% QoQ and 1,989% YoY. We saw similar numbers in Japan where attacks increased by 278% QoQ and 1,921% YoY.
Looking at Ukraine, we actually see a dip in the amount of attack packets we observed in our Ukraine-based and Russia-based data centers — 49% and 16% QoQ, respectively.
Top Cloudflare data center locations with the highest percentage of DDoS attack traffic in 2022 Q3
Attack vectors & Emerging threats
An attack vector is the method used to launch the attack or the method of attempting to achieve denial-of-service. With a combined share of 71%, SYN floods and DNS attacks remain the most popular DDoS attack vectors in Q3.
Top attack vectors in 2022 Q3
Last quarter, we saw a resurgence of attacks abusing the CHARGEN protocol, the Ubiquity Discovery Protocol, and Memcached reflection attacks. While the growth in Memcached DDoS attacks also slightly grew (48%), this quarter, there was a more dramatic increase in attacks abusing the BitTorrent protocol (1,221%), as well as attacks launched by the Mirai botnet and its variants.
BitTorrent DDoS attacks increased by 1,221% QoQ The BitTorrent protocol is a communication protocol that’s used for peer to peer file sharing. To help the BitTorrent clients find and download the files efficiently, BitTorrent clients may use BitTorrent Trackers or Distributed Hash Tables (DHT) to identify the peers that are seeding the desired file. This concept can be abused to launch DDoS attacks. A malicious actor can spoof the victim’s IP address as a seeder IP address within Trackers and DHT systems. Then clients would request the files from those IPs. Given a sufficient number of clients requesting the file, it can flood the victim with more traffic than it can handle.
Mirai DDoS attacks increased by 405% QoQ Mirai is malware that infects smart devices that run on ARC processors, turning them into a network of bots that can be used to launch DDoS attacks. This processor runs a stripped-down version of the Linux operating system. If the default username-and-password combo is not changed, Mirai is able to log in to the device, infect it, and take over. The botnet operator can instruct the botnet to launch a flood of UDP packets at the victim’s IP address to bombard them.
Top emerging threats in 2022 Q3
Network-layer DDoS attacks by Attack Rates & Duration
While Terabit-strong attacks are becoming more frequent, they are still the outliers. The majority of attacks are tiny (in terms of Cloudflare scale). Over 95% of attacks peaked below 50,000 packets per second (pps) and over 97% below 500 Megabits per second (Mbps). We call this “cyber vandalism”.
What is cyber vandalism? As opposed to “classic” vandalism where the purpose is to cause deliberate destruction of or damage to public or private physical property — such as graffiti on the side of a building — in the cyberworld, cyber vandalism is the act of causing deliberate damage to Internet properties. Today the source codes for various botnets are available online and there are a number of free tools that can be used to launch a flood of packets. By directing those tools to Internet properties, any script-kid can use those tools to launch attacks against their school during exam season or any other website they desire to take down or disrupt. This is as opposed to organized crime, Advanced Persistent Threat actors, and state-level actors that can launch much larger and sophisticated attacks.
Distribution of DDoS attacks by bitrate in 2022 Q3
Similarly, most of the attacks are very short and end within 20 minutes (94%). This quarter we did see an increase of 9% in attacks of 1-3 hours, and a 3% increase in attacks over 3 hours — but those are still the outliers.
QoQ change in the duration of DDoS attacks in 2022 Q3
Even with the largest attacks, such as the 2.5 Tbps attack we mitigated earlier this quarter, and the 26M request per second attack we mitigated back in the summer, the peak of the attacks were short-lived. The entire 2.5 Tbps attack lasted about 2 minutes, and the peak of the 26M rps attack only 15 seconds. This emphasizes the need for automated, always-on solutions. Security teams can’t respond quick enough. By the time the security engineer looks at the PagerDuty notification on their phone, the attack has subsided.
Summary
Attacks may be initiated by humans, but they are executed by bots — and to play to win, you must fight bots with bots. Detection and mitigation must be automated as much as possible, because relying solely on humans puts defenders at a disadvantage. Cloudflare’s automated systems constantly detect and mitigate DDoS attacks for our customers, so they don’t have to.
Over the years, it has become easier, cheaper, and more accessible for attackers and attackers-for-hire to launch DDoS attacks. But as easy as it has become for the attackers, we want to make sure that it is even easier – and free – for defenders of organizations of all sizes to protect themselves against DDoS attacks of all types. We’ve been providing unmetered and unlimited DDoS protection for free to all of our customers since 2017 — when we pioneered the concept.
Cloudflare’s mission is to help build a better Internet. A better Internet is one that is more secure, faster, and reliable for everyone – even in the face of DDoS attacks.
With Google Cloud Next happening this week, there’s been some recent water cooler talk – okay, informal, ad hoc Zoom calls – where discussions about what makes Google Cloud Platform (GCP) unique when it comes to security. A few specific differences have popped up here and there (default data encryption, the way IAM is handled, etc.), but, generally speaking, many of the principles that apply to all other cloud providers apply to GCP environments.
For one, due to the speed and scale of these environments, it’s simultaneously very difficult and extremely critical to maintain an up-to-date inventory of the state of all resources in your environment. This means constantly monitoring your environment for resources being created, deleted, or modified in as close to real time as possible.
And in an effort to avoid ambiguity or hide behind marketing buzz terms, when I’m referring to “real time” here, I’m talking about sub 5-minute intervals based on activity happening in the environment. This is not to be confused with “near real time” approaches some vendors tout, which, in reality, still only pulls in data once or twice a day based on a static schedule.
In GCP, like in AWS, Azure, and all other cloud environments, simply getting a snapshot once a day to identify misconfigurations, vulnerabilities, or suspicious behaviors like you might with an on-prem data center just isn’t a scalable strategy. It’s a common cliche, but the ephemeral nature and rate of change in public cloud environments makes that kind of scanning strategy extremely ineffective when it comes to monitoring, analyzing, and eliminating actual risk in a cloud environment.
Let me lay out a couple examples where this kind of real-time monitoring can provide significant, potentially necessary, value to security teams working to make their cloud risk management programs more effective.
Identification of high-risk resources
As an example, say a developer is in a GCP project associated with your company’s revenue-generating application and they spin up a Cloud Storage instance that is, whether mistakenly or maliciously, open to the public internet.
If your security team is reliant on a scan to happen 12 hours later to get visibility into this activity, your organization will constantly be left open to significant risk. Take away the hyperbole here and assume it’s a much smaller risk or compliance violation. Even in that situation, your team is still working from behind and, presumably, almost always facing some level of stress about what issues are out there in the environment that they won’t know about for another 12-18 hours.
Worst of all, with this type of scanning you’re generally just getting a point-in-time snapshot of the environment and usually don’t know who made the change or how long ago it happened. This makes it much more difficult and time consuming for your team to actually assess the risk or get their hands on the right information to make an informed decision about how the situation should be addressed.
When a team is working with real-time data, however, they can be much more diligent and confident that they’re prioritizing the right issues at any given moment, with all the necessary context about who made the change and when it occurred. This not only helps teams stay ahead of issues and reduce the risk of a breach in their environment, but also helps keep individuals and teams feeling positive about the impact that the program is having on the organization.
Delayed remediation workflows
Building off of the previous example, it’s not only that teams can’t respond to risk they haven’t been notified of, it’s also that any automated response workflows your team may have built out to be more efficient are significantly less effective when they’re triggered by hours-old data. A 12-hour delay in an automation workflow all but eliminates the value of the automation itself, and it can actually cause headaches and confusion that detract from your team’s efficiency, rather than improving it (more on this in the next example).
In contrast, if you’re able to detect risky changes to your environment as they happen, you can automatically respond to that issue as it happens. In the case of this all being a mistake caused by a developer working a little too quickly, you’re able to automatically notify them of their error within a matter of minutes, likely while they’re still working within that project. Giving your development team this kind of feedback in the moment, rather than forcing them to context switch and go back into the project to fix the error a day later, is an excellent way to build stronger relationships and rapport with that team.
In the more rare case that this is indeed a malicious internal or external actor, enabling your automated remediation workflows to kick into gear within seconds and potentially stop the behavior could mean the difference between a minor incident and a breach requiring public disclosure from your organization.
Minimizing false positives and cross-team friction
Speaking of relationships with the development team (sorry, #DevSecOps), I can almost guarantee that working with data from scans or snapshots that occur every 12 or 24 hours in your cloud will cause friction between your two teams. Whether it’s tied to manual identification of risky resources or automated workflows notifying them of a non-compliant asset, working with stale data will inevitably lead to false positives that will both annoy and distract your already overburdened development team.
Take the example highlighted above, but instead, let’s say the developer actually spun up that Cloud Storage instance for a short amount of time in a dev instance with no actual customer data as part of a testing exercise. By the time your team gets visibility into this and either reaches out manually or has some automated notification sent to the developer, that instance could have already been deleted for hours. Now your team is looking at one set of old data and seeing an issue, meanwhile the developer is insisting that the storage container doesn’t even exist anymore. As mentioned above, this is going to cause headaches and frustration for both parties, and cause your team to lose credibility with the dev team.
At this point, you can probably guess where this is going next. With real-time monitoring in your environment this situation can be avoided altogether because your team will be looking at the same up-to-date information, and your team will be able to see that the storage container was shut down or removed from the project rather than spending time chasing down a false positive.
Researchers have used thermal cameras and ML guessing techniques to recover passwords from measuring the residual heat left by fingers on keyboards. From the abstract:
We detail the implementation of ThermoSecure and make a dataset of 1,500 thermal images of keyboards with heat traces resulting from input publicly available. Our first study shows that ThermoSecure successfully attacks 6-symbol, 8-symbol, 12-symbol, and 16-symbol passwords with an average accuracy of 92%, 80%, 71%, and 55% respectively, and even higher accuracy when thermal images are taken within 30 seconds. We found that typing behavior significantly impacts vulnerability to thermal attacks, where hunt-and-peck typists are more vulnerable than fast typists (92% vs 83% thermal attack success if performed within 30 seconds). The second study showed that the keycaps material has a statistically significant effect on the effectiveness of thermal attacks: ABS keycaps retain the thermal trace of users presses for a longer period of time, making them more vulnerable to thermal attacks, with a 52% average attack accuracy compared to 14% for keyboards with PBT keycaps.
“ABS” is Acrylonitrile Butadiene Styrene, which some keys are made of. Others are made of Polybutylene Terephthalate (PBT). PBT keys are less vulnerable.
But, honestly, if someone can train a camera at your keyboard, you have bigger problems.
The kernel’s Bugzilla
instance is largely unloved and ignored, at least as a bug-reporting
tool for the bulk of the upstream kernel. At the recent Maintainers Summit,
Bugzilla was discussed during the regression-handling session led by Thorsten
Leemhuis. In a followup to that discussion, Leemhuis posted
some ideas for improving the state of bugzilla.kernel.org to the
ksummit-discuss mailing list recently; the resulting discussion helped
clarify a number of problem areas for it—and for the Bugzilla tool itself.
“Никой няма да забрави картините с пороя, удавил на втори септември трите карловски села – Каравелово, Богдан и Слатина. И трите са в подножието на планината – Средна гора. Истински…
In modern data architectures, it’s common to store data in multiple data sources. However, organizations embracing this approach still need insights from their data and require technologies that help them break down data silos. Amazon Athena is an interactive query service that makes it easy to analyze structured, unstructured, and semi-structured data stored in Amazon Simple Storage Service (Amazon S3) in addition to relational, non-relation, object, and custom data sources through its query federation capabilities. Athena is serverless, so there’s no infrastructure to manage, and you only pay for the queries that you run.
Organizations building a modern data architecture want to query data in-place from purpose-built data stores without building complex extract, transform, and load (ETL) pipelines. Athena’s federated query feature allows organizations to achieve this and makes it easy to:
Create reports and dashboards from data stored in relational, non-relational, object, and custom data sources
Run on-demand analysis on data spread across multiple systems of record using a single tool and single SQL dialect
Join multiple data sources together to produce new input features for machine learning model training workflows
However, when querying and joining huge amounts of data from different data stores, it’s important for queries to run quickly, at low cost, and without impacting source systems. Predicate pushdown is supported by many query engines and is a technique that can drastically reduce query processing time by filtering data at the source early in the processing workflow. In this post, you’ll learn how predicate pushdown improves query performance and how you can validate when Athena applies predicate pushdown to federated queries.
Benefits of predicate pushdown
The key benefits of predicate pushdown are as follows:
Improved query runtime
Reduced network traffic between Athena and the data source
Reduced load on the remote data source
Reduced cost resulting from reduced data scans
Let’s explore a real-world scenario to understand when predicate pushdown is applied to federated queries in Athena.
Solution overview
Imagine a hypothetical ecommerce company with data stored in
Amazon Redshift – Company’s Datawarehouse, used for current and historical analytics
Amazon DynamoDB – NoSQL Database, used for real-time inventory tracking and latest supplier data in the company
Record counts for these tables are as follows.
Data Store
Table Name
Number of Records
Description
Amazon Redshift
Catalog_Sales
4.3 billion
Current and historical Sales data fact Table
Amazon Redshift
Date_dim
73,000
Date Dimension table
DynamoDB
Part
20,000
Realtime Parts and Inventory data
DynamoDB
Partsupp
80,000
Realtime Parts and supplier data
Aurora MySQL
Supplier
1,000
Latest Supplier transactions
Aurora MySQL
Customer
15,000
Latest Customer transactions
Our requirement is to query these sources individually and join the data to track pricing and supplier information and compare recent data with historical data using SQL queries with various filters applied. We’ll use Athena federated queries to query and join data from these sources to meet this requirement.
The following diagram depicts how Athena federated queries use data source connectors run as Lambda functions to query data stored in sources other than Amazon S3.
When a federated query is submitted against a data source, Athena invokes the data source connector to determine how to read the requested table and identify filter predicates in the WHERE clause of the query that can be pushed down to the source. Applicable filters are automatically pushed down by Athena and have the effect of omitting unnecessary rows early in the query processing workflow and improving overall query execution time.
Let’s explore three use cases to demonstrate predicate pushdown for our ecommerce company using each of these services.
Prerequisites
As a prerequisite, review Using Amazon Athena Federated Query to know more about Athena federated queries and how to deploy these data source connectors.
Use case 1: Amazon Redshift
In our first scenario, we run an Athena federated query on Amazon Redshift by joining its Catalog_sales and Date_dim tables. We do this to show the number of sales orders grouped by order date. The following query gets the information required and takes approximately 14 seconds scanning approximately 43 MB of data:
SELECT "d_date" AS Order_date,
     count(1) AS Total_Orders
 FROM "lambda:redshift"."order_schema"."catalog_sales" l,
     "lambda:redshift"."order_schema"."date_dim" d
 WHERE l.cs_sold_date_sk = d_date_sk
     and cs_sold_date_sk between 2450815 and 2450822 --Date keys for first week of Jan 1998
 GROUP BY "d_date"
 order by "d_date"
Athena pushes the following filters to the source for processing:
cs_sold_date_sk between 2450815 and 2450822 for the Catalog_Sales table in Amazon Redshift.
d_date_sk between 2450815 and 2450822; because of the join l.cs_sold_date_sk=d_date_sk in the query, the Date_dim table is also filtered at the source, and only filtered data is moved from Amazon Redshift to Athena.
Let’s analyze the query plan by using recently released visual explain tool to confirm the filter predicates are pushed to the data source:
As shown above (only displaying the relevant part of the visual explain plan), because of the predicate pushdown, the Catalog_sales and Date_dim tables have filters applied at the source. Athena processes only the resulting filtered data.
Using the Athena console, we can see query processing details using the recently released query stats to interactively explore processing details with predicate pushdown at the query stage:
Displaying only the relevant query processing stages, Catalog_sales table has approximately 4.3 billion records, and Date_dim has approximately 73,000 records in Amazon Redshift. Only 11 million records from the Catalog_sales (Stage 4) and 8 records from the Date_dim (Stage 5) are passed from source to Athena, because the predicate pushdown pushes query filter conditions to the data sources. This filters out unneeded records at the source, and only brings the required rows to Athena.
Using predicate pushdown resulted in scanning 99.75% less data from Catalog_sales and 99.99% less data from Date_dim. This results in a faster query runtime and lower cost.
Use case 2: Amazon Redshift and Aurora MySQL
In our second use case, we run an Athena federated query on Aurora MySQL and Amazon Redshift data stores. This query joins the Catalog_sales and Date_dim tables in Amazon Redshift with the Customer table in the Aurora MySQL database to get the total number of orders with the total amount spent by each customer for the first week in January 1998 for the market segment of AUTOMOBILE. The following query gets the information required and takes approximately 35 seconds scanning approximately 337 MB of data:
SELECT  cs_bill_customer_sk Customer_id ,"d_date" Order_Date
 ,count("cs_order_number") Total_Orders ,sum(l.cs_net_paid_inc_ship_tax) AS Total_Amount
 FROM "lambda:mysql".sales.customer c,"lambda:redshift"."order_schema"."catalog_sales" l
 ,"lambda:redshift"."order_schema"."date_dim" d
 WHERE c_mktsegment = 'AUTOMOBILE'
 AND c_custkey = cs_bill_customer_sk
 AND l.cs_sold_date_sk=d_date_sk
 AND cs_sold_date_sk between 2450815 and 2450822 --Date keys for first week of Jan 1998
 GROUP BY cs_bill_customer_sk,"d_date"
 ORDER BY cs_bill_customer_sk,"d_date"
Athena pushes the following filters to the data sources for processing:
cs_sold_date_sk between 2450815 and 2450822 for the Catalog_Sales table in Amazon Redshift.
d_date_sk between 2450815 and 2450822; because of the join l.cs_sold_date_sk=d_date_sk in the query, the Date_dim table is also filtered at the source (Amazon Redshift) and only filtered data is moved from Amazon Redshift to Athena.
c_mktsegment = 'AUTOMOBILE' for the Customer table in the Aurora MySQL database.
Now let’s consult the visual explain plan for this query to show the predicate pushdown to the source for processing:
As shown above (only displaying the relevant part of the visual explain plan), because of the predicate pushdown, Catalog_sales and Date_dim have the query filter applied at the source (Amazon Redshift), and the customer table has the market segment AUTOMOBILE filter applied at the source (Aurora MySQL). This brings only the filtered data to Athena.
As before, we can see query processing details using the recently released query stats to interactively explore processing details with predicate pushdown at the query stage:
Displaying only the relevant query processing stages, Catalog_sales has 4.3 billion records, Date_Dim has 73,000 records in Amazon Redshift, and Customer has 15,000 records in Aurora MySQL. Only 11 million records from Catalog_sales (Stage 6), 8 records from Date_dim (Stage 7), and 3,000 records from Customer (Stage 5) are passed from the respective sources to Athena because the predicate pushdown pushes query filter conditions to the data sources. This filters out unneeded records at the source and only brings the required rows to Athena.
Here, predicate pushdown resulted in scanning 99.75% less data from Catalog_sales, 99.99% less data from Date_dim, and 79.91% from Customer. Furthermore, this results in a faster query runtime and reduced cost.
Use case 3: Amazon Redshift, Aurora MySQL, and DynamoDB
For our third use case, we run an Athena federated query on Aurora MySQL, Amazon Redshift, and DynamoDB data stores. This query joins the Part and Partsupp tables in DynamoDB, the Catalog_sales and Date_dim tables in Amazon Redshift, and the Supplier and Customer tables in Aurora MySQL to get the quantities available at each supplier for orders with the highest revenue during the first week of January 1998 for the market segment of AUTOMOBILE and parts manufactured by Manufacturer#1.
The following query gets the information required and takes approximately 33 seconds scanning approximately 428 MB of data in Athena:
SELECT "d_date" Order_Date
     ,c_mktsegment
     ,"cs_order_number"
     ,l.cs_item_sk Part_Key
     ,p.p_name Part_Name
     ,s.s_name Supplier_Name
     ,ps.ps_availqty Supplier_Avail_Qty
     ,l.cs_quantity Order_Qty
     ,l.cs_net_paid_inc_ship_tax Order_Total
 FROM "lambda:dynamo".default.part p,
     "lambda:mysql".sales.supplier s,
     "lambda:redshift"."order_schema"."catalog_sales" l,
     "lambda:dynamo".default.partsupp ps,
     "lambda:mysql".sales.customer c,
     "lambda:redshift"."order_schema"."date_dim" d
 WHERE
     c_custkey = cs_bill_customer_sk
     AND l.cs_sold_date_sk=d_date_sk
     AND c.c_mktsegment = 'AUTOMOBILE'
     AND cs_sold_date_sk between 2450815 and 2450822 --Date keys for first week of Jan 1998
     AND p.p_partkey=ps.ps_partkey
     AND s.s_suppkey=ps.ps_suppkey
     AND p.p_partkey=l.cs_item_sk
     AND p.p_mfgr='Manufacturer#1'
Athena pushes the following filters to the data sources for processing:
cs_sold_date_sk between 2450815 and 2450822 for the Catalog_Sales table in Amazon Redshift.
d_date_sk between 2450815 and 2450822; because of the join l.cs_sold_date_sk=d_date_sk in the query, the Date_dim table is also filtered at the source and only filtered data is moved from Amazon Redshift to Athena.
c_mktsegment = 'AUTOMOBILE' for the Customer table in the Aurora MySQL database.
p.p_mfgr='Manufacturer#1' for the Part table in DynamoDB.
Now let’s run the explain plan for this query to confirm predicates are pushed down to the source for processing:
As shown above (displaying only the relevant part of the plan), because of the predicate pushdown, Catalog_sales and Date_dim have the query filter applied at the source (Amazon Redshift), the Customer table has the market segment AUTOMOBILE filter applied at the source (Aurora MySQL), and the Part table has the part manufactured by Manufacturer#1 filter applied at the source (DynamoDB).
We can analyze query processing details using the recently released query stats to interactively explore processing details with predicate pushdown at the query stage:
Displaying only the relevant processing stages, Catalog_sales has 4.3 billion records, Date_Dim has 73,000 records in Amazon Redshift, Customer has 15,000 records in Aurora MySQL, and Part has 20,000 records in DynamoDB. Only 11 million records from Catalog_sales (Stage 5), 8 records from Date_dim (Stage 9), 3,000 records from Customer (Stage 8), and 4,000 records from Part (Stage 4) are passed from their respective sources to Athena, because the predicate pushdown pushes query filter conditions to the data sources. This filters out unneeded records at the source, and only brings the required rows from the sources to Athena.
Considerations for predicate pushdown
When using Athena to query your data sources, consider the following:
Depending on the data source, data source connector, and query complexity, Athena can push filter predicates to the source for processing. The following are some of the sources Athena supports predicate pushdown with:
Athena also performs predicate pushdown on data stored in an S3 data lake. And, with predicate pushdown for supported sources, you can join all your data sources in one query and achieve fast query performance.
You can use the recently released query stats as well as EXPLAIN and EXPLAIN ANALYZE on your queries to confirm predicates are pushed down to the source.
Queries may not have predicates pushed to the source if the query’s WHERE clause uses Athena-specific functions (for example, WHERE log2(col)<10).
Conclusion
In this post, we demonstrated three federated query scenarios on Aurora MySQL, Amazon Redshift, and DynamoDB to show how predicate pushdown improves federated query performance and reduces cost and how you can validate when predicate pushdown occurs. If the federated data source supports parallel scans, then predicate pushdown makes it possible to achieve performance that is close to the performance of Athena queries on data stored in Amazon S3. You can utilize the patterns and recommendations outlined in this post when querying supported data sources to improve overall query performance and minimize data scanned.
About the authors
Rohit Bansal is an Analytics Specialist Solutions Architect at AWS. He has nearly two decades of experience helping customers modernize their data platforms. He is passionate about helping customers build scalable, cost-effective data and analytics solutions in the cloud. In his spare time, he enjoys spending time with his family, travel, and road cycling.
Ruchir Tripathi is a Senior Analytics Solutions Architect aligned to Global Financial Services at AWS. He is passionate about helping enterprises build scalable, performant, and cost-effective solutions in the cloud. Prior to joining AWS, Ruchir worked with major financial institutions and is based out of New York Office.
To build a data lake on AWS, a common data ingestion pattern is to use AWS Glue jobs to perform extract, transform, and load (ETL) data from relational databases to Amazon Simple Storage Service (Amazon S3). A project often involves extracting hundreds of tables from source databases to the data lake raw layer. And for each source table, it’s recommended to have a separate AWS Glue job to simplify operations, state management, and error handling. This approach works perfectly with a small number of tables. However, with hundreds of tables, this results in hundreds of ETL jobs, and managing AWS Glue jobs at this scale may pose an operational challenge if you’re not yet ready to deploy using a CI/CD pipeline. Instead, we tackle this issue by decoupling the following:
ETL job logic – We use an AWS Glue blueprint, which allows you to reuse one blueprint for all jobs with the same logic
Job definition – We use a JSON file, so you can define jobs programmatically without learning a new language
Job deployment – With AWS Step Functions, you can copy workflows to manage different data processing use cases on AWS Glue
In this post, you will learn how to handle data lake landing jobs deployment in a standardized way—by maintaining a JSON file with table names and a few parameters (for example, a workflow catalog). AWS Glue workflows are created and updated after manually running the resources deployment flow in Step Functions. You can further customize the AWS Glue blueprints to make your own multi-step data pipelines to move data to downstream layers and purpose-built analytics services (example use cases include partitioning or importing to an Amazon DynamoDB table).
Overview of solution
The following diagram illustrates the solution architecture, which contains two major areas:
Resource deployment (components 1–2) – An AWS Step Functions workflow is run manually on demand to update or deploy the required AWS Glue resources. These AWS Glue resources will be used for landing data into the data lake
ETL job runs (components 3–6) – The AWS Glue workflows (one per source table) run on the defined schedule, and extract and land data to the data lake raw layer
The solution workflow contains the following steps:
An S3 bucket stores an AWS Glue blueprint (ZIP) and the workflow catalog (JSON file).
A Step Functions workflow orchestrates the AWS Glue resources creation.
We use Amazon Aurora as the data source with our sample data, but any PostgreSQL database works with the provided script, or other JDBC sources with customization.
If you want to use your existing database either in AWS or on premises as a data source, you need network connectivity (a subnet and security group) for the AWS Glue jobs that can access the source database, Amazon S3, and Secrets Manager.
Provision resources with AWS CloudFormation
In this step, we provision our solution resources with AWS CloudFormation.
Database with sample data (optional)
This CloudFormation stack works only in AWS Regions where Amazon Aurora Serverless v1 is supported. Complete the following steps to create a database with sample data:
Choose Launch Stack.
On the Create stack page, choose Next.
For Stack name, enter demo-database.
For DBSecurityGroup, choose select the security group for the database (for example, default).
For DBSubnet, choose two or more private subnets to host the database.
For ETLAZ, choose the Availability Zone for ETL jobs. It must match with ETLSubnet.
For ETLSubnet, choose the subnet for the jobs. This must match with ETLAZ.
To find the subnet and corresponding Availability Zone, go to the Amazon Virtual Private Cloud (Amazon VPC) console and look at the columns Subnet ID and Availability Zone.
Choose Next.
On the Configure stack options page, skip the inputs and choose Next.
On the Review page, choose Create stack.
When the stack is complete, go to the Outputs tab and note the value for SecretsARN.
This CloudFormation stack creates the following resources:
In the Connect to database section, provide the following information:
For Database instance, enter demo-<123456789012>.
For Database username, connect with a Secrets Manager ARN.
For Secrets Manager ARN, enter the ARN from the outputs of the CloudFormation stack.
For Database name, enter hr.
Choose Connect to database.
Enter the contents of the SQL file into the editor, then choose Run.
Main stack (required)
This CloudFormation stack works in all AWS Regions.
Choose Launch Stack.
On the Create stack page, choose Next.
For Stack name, enter data-lake-landing.
For BlueprintName, enter a name for your blueprint (default: data-lake-landing).
For S3BucketNamePrefix, enter a prefix (default: data-lake-raw-layer).
Choose Next.
On the Configure stack options page, skip the inputs and choose Next.
On the Review page, select I acknowledge that AWS CloudFormation might create IAM resources with custom names.
Choose Create stack.
When the stack is complete, go to the Outputs tab and note the names of the S3 bucket (for example, data-lake-raw-layer-123456789012-region) and Step Functions workflow (for example, data-lake-landing).
The CloudFormation stack creates the following resources:
An S3 bucket as the data lake raw layer
A Step Functions workflow (see the definition on the GitHub repo)
AWS Identity and Access Management (IAM) roles and policies for the Step Functions workflow to provision AWS Glue resources and AWS Glue job executions.
The GlueExecutionRole is limited to the DemoDBSecret in Secrets Manager. If you need to connect to other databases which has a different endpoint/address or credentials, don’t forget to create new secrets and grant additional permissions to the IAM role or secrets so your AWS Glue jobs can authenticate with the source databases.
Prepare database connections
If you want to use this solution to perform ETL against your existing databases, follow this section. Otherwise, if you have deployed the CloudFormation stack for the database with sample data, jump to the section “Edit the workflow catalog”.
You need to have a running PostgreSQL database ready. To connect to other database engines, you need to customize this solution, particularly the jdbcUrl in the supplied PySpark script.
Create the database secret
To create your Secrets Manager secret, complete the following steps:
For the VPC, subnet, and security groups (prepared in the prerequisite steps), enter where the ETL jobs run and are able to connect to the source database, Amazon S3, and Secrets Manager.
Choose Create connection.
You’re now ready to configure the rest of the solution.
Edit the workflow catalog
To download the workflow catalog, complete the following steps:
If you are using the provided sample database, you must change the values of GlueExecutionRole and DestinationBucketName. If you are using your own databases, you must change all vaules except WorkflowName, JobScheduleType, and ScheduleCronPattern.
Rename the file your_blueprint_name.json and upload it to your S3 bucket (for example, s3://data-lake-raw-layer-123456789012-eu-west-1/data-lake-landing.json).
The example workflow has the JobScheduleType set to Cron. See Time-based schedules for jobs and crawlers for examples setting cron patterns. Alternatively set JobScheduleType to OnDemand.
Write the DataFrame to Amazon S3 as Parquet files.
Prepare the AWS Glue blueprint
Prepare your AWS Glue blueprint with the following steps:
Download the sample file and unzip it in your local computer.
Make any necessary changes to the PySpark script to include your own logic, and compress the three files (blueprint.cfg, jdbc_to_s3.py, layout.py; exclude any folders) as your_blueprint_name.zip (for example, data-lake-landing.zip):
zip data-lake-landing.zip blueprint.cfg jdbc_to_s3.py layout.py
Upload to the S3 bucket (for example, s3://data-lake-raw-layer-123456789012-region/data-lake-landing.zip).
Now you should have two files uploaded to your S3 bucket.
Run the Step Functions workflow to deploy AWS Glue resources
To run the Step Functions workflow, complete the following steps:
On the Step Functions console, select your state machine (data-lake-landing) and choose View details.
Choose Start execution.
Keep the default values in the pop-up.
Choose Start execution.
Wait until the Success step at the bottom turns green.
It’s normal to have some intermediate steps with the status “Caught error.”
When the workflow catalog contains a large number of ETL job entries, you can expect some delays. In our test environment, creating 100 jobs from a clean state can take around 22 minutes; the second run (deleting existing AWS Glue resources and creating 100 jobs) can take around 27 minutes.
Verify the workflow in AWS Glue
To check the workflow, complete the following steps:
Verify that all AWS Glue workflows defined in workflow_config.json are listed.
Select one of the workflows, and on the Action menu, choose Run.
Wait for about 3 minutes (or longer if not using the provided database with sample data), and verify on the Amazon S3 console that new Parquet files are created in your data lake (for example, s3://data-lake-raw-layer-123456789012-region/database/table/ingestion_date=yyyy-mm-dd/).
Step Functions workflow overview
This section describes the major steps in the Step Functions workflow.
Register the AWS Glue blueprint
A blueprint allows you to parameterize a workflow (defining jobs and crawlers), and subsequently generate multiple AWS Glue workflows reusing the same code logic to handle similar data ETL activities. The following diagram illustrates the AWS Glue blueprint registration part of the Step Functions workflow.
The step Glue: CreateBlueprint takes the ZIP archive in Amazon S3 (sample) and registers it for later use.
The step S3: ParseGlueWorkflowsConfig triggers the following Map state, and runs a set of steps for each element of an input array.
We set the maximum concurrency to five parallel iterations to lower the chance of exceeding the maximum allowed API request rate (per account per Region). For each ETL job definition, the Step Functions workflow cleans up relevant AWS Glue resources (if they exist), including the workflow, job, and trigger.
For more information on the Map state, refer to Map.
Run the AWS Glue blueprint
Within the Map state, the step Glue: CreateWorkflowFromBlueprint starts an asynchronous process to create the AWS Glue workflow (for each job definition), and the jobs and triggers that the workflow encapsulates.
In this solution, all AWS Glue workflows share the same logic, beginning with a trigger to handle the schedule, followed by a job to run the ETL logic.
As indicated by the step CreateWorkflowFailed, any AWS Glue blueprint creation failure stops the whole Step Functions workflow and marks it with a failed status. Note that no rollback will happen. Fix the errors and rerun the Step Functions workflow. This will not result in duplicated AWS Glue resources and existing ones will be cleaned up in the process.
Limitations
Note the following limitations of this solution:
Each run of the Step Functions workflow deletes all relevant AWS Glue jobs defined in the workflow catalog, and creates new jobs with a different (random) suffix. As a result, you will lose the job run history in AWS Glue. The underlying metrics and logs are retained in Amazon CloudWatch.
Clean up
To avoid incurring future charges, perform the following steps:
Disable the schedules of the deployed AWS Glue jobs:
Open the workload configuration file in your S3 bucket (s3://data-lake-raw-layer-123456789012-eu-west-1/data-lake-landing.json) and replace the value of JobScheduleType to OnDemand for all workflow definitions.
Run the Step Functions workflow (data-lake-landing).
Observe that all AWS Glue triggers ending with _starting_trigger have the trigger type On-demand instead of Schedule.
Empty the S3 bucket and delete the CloudFormation stack.
Delete the deployed AWS Glue resources:
All AWS Glue triggers ending with _starting_trigger.
All AWS Glue jobs starting with the WorkflowName defined in the workflow catalog.
All AWS Glue workflows with the WorkflowName defined in the workflow catalog.
AWS Glue blueprints.
Conclusion
AWS Glue blueprints allow data engineers to build and maintain AWS Glue jobs landing data from RDBMS to your data lake at scale.By adopting this standardized and reusable approach, instead of maintaining hundreds of AWS Glue jobs, you now keep track the workflow catalog. When you have new tables to land to your data lake, simply add the entries to your workflow catalog and rerun the Step Functions workflow to deploy resources.
Moustafa Mahmoud is a Solutions Architect of AWS Data Lab with a passion for data integration, data analysis, machine learning, and BI. Moustafa helps customers convert their ideas to a production-ready data product on AWS. He has over 10 years of experience as a data engineer, machine learning practitioner, and software developer. In his spare time, Moustafa loves exploring nature, reading, and spending time with friends and family.
Corvus Lee is a Solutions Architect of AWS Data Lab. He enjoys all kinds of data-related discussions, and helps customers build MVPs using AWS Databases, Analytics, and Machine Learning services.
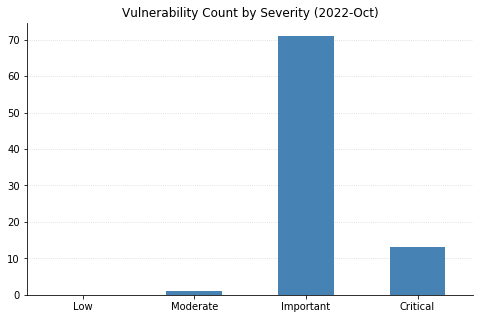
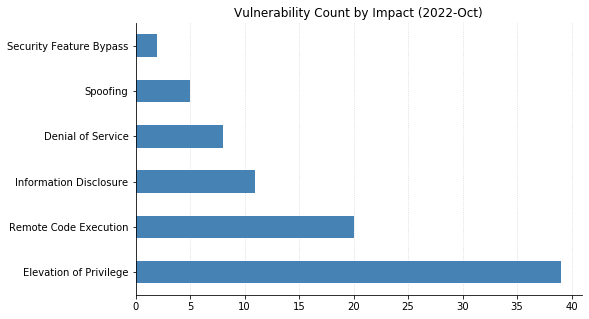
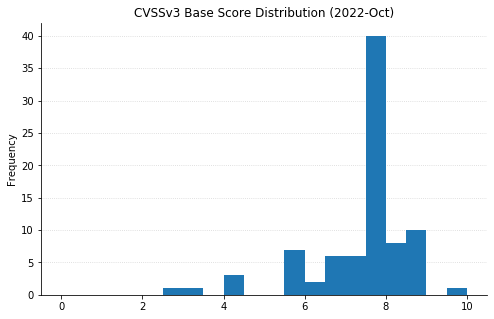
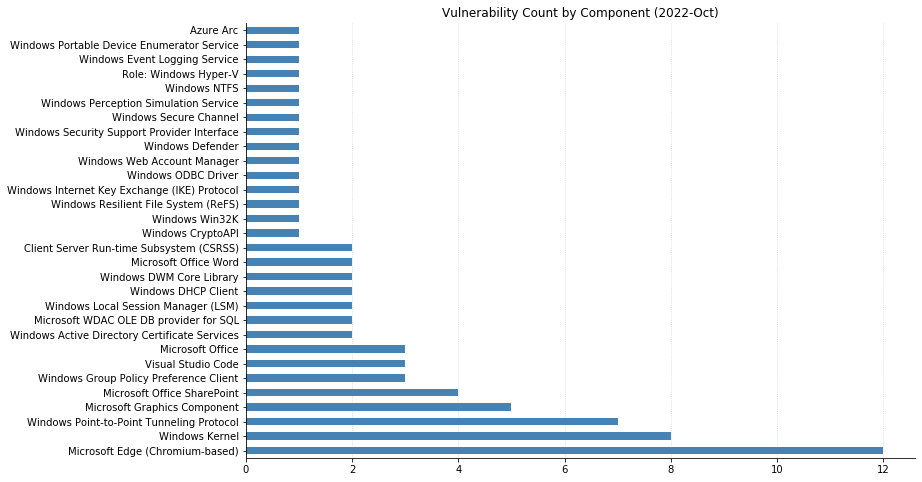
The October batch of CVEs published by Microsoft includes 96 vulnerabilities, including 12 fixed earlier this month that affect the Chromium project used by their Edge browser.
Top of mind for many this month is whether Microsoft would patch the two Exchange Server zero-day vulnerabilities (CVE-2022-41040 and CVE-2022-41082) disclosed at the end of September. While Microsoft was relatively quick to acknowledge the vulnerabilities and provide mitigation steps, their guidance has continually changed as the recommended rules to block attack traffic get bypassed. This whack-a-mole approach seems likely to continue until a proper patch addressing the root causes is available; unfortunately, it doesn’t look like that will be happening today. Thankfully, the impact should be more limited than 2021’s ProxyShell and ProxyLogon vulnerabilities due to attackers needing to be authenticated to the server for successful exploitation. Reports are also surfacing about an additional zero-day distinct from these being used in ransomware attacks; however, these have not yet been substantiated.
Microsoft did address two other zero-day vulnerabilities with today’s patches. CVE-2022-41033, an Elevation of Privilege vulnerability affecting the COM+ Event System Service in all supported versions of Windows, has been seen exploited in the wild. CVE-2022-41043 is an Information Disclosure vulnerability affecting Office for Mac that was publicly disclosed but not (yet) seen exploited in the wild.
Nine CVEs categorized as Remote Code Execution (RCE) with Critical severity were also patched today – seven of them affect the Point-to-Point Tunneling Protocol, and like those fixed last month, require an attacker to win a race condition to exploit them. CVE-2022-38048 affects all supported versions of Office, and CVE-2022-41038 could allow an attacker authenticated to SharePoint to execute arbitrary code on the server, provided the account has “Manage List” permissions.
Maxing out the CVSS base score with a 10.0 this month is CVE-2022-37968, an Elevation of Privilege vulnerability in the Azure Arc-enabled Kubernetes cluster Connect component. It’s unclear why Microsoft has assigned such a high score, given that an attacker would need to know the randomly generated external DNS endpoint for an Azure Arc-enabled Kubernetes cluster (arguably making the Attack Complexity “High”). That said, if this condition is met then an unauthenticated user could become a cluster admin and potentially gain control over the Kubernetes cluster. Users of Azure Arc and Azure Stack Edge should check whether auto-updates are turned on, and if not, upgrade manually as soon as possible.
The Opus codec is an audio codec that
was designed from the beginning to avoid existing patents in the field and
be royalty-free for all users. It was standardized by the IETF in 2012 as RFC 6716.
Now a company called Vectis (“a premier
full-suite IP licensing and consultancy boutique“) is collecting
patents that are claimed to read on Opus as a way of demanding
royalties on its use.
“The planned Opus program will focus on hardware devices and will not be
directed towards open-source software, applications, services, or
content“. (Thanks to Paul Wise).
You can send media in milliseconds to just about every corner of the earth with an origin store at your favorite cloud storage company and a snappy CDN. Sadly, delivering people across continents is a touch more complicated and time intensive. Nevertheless, the Backblaze team is saddling up planes, trains, and automobiles to bring the latest on media workflows to the attendees of NAB Show New York. Whether you’re there in person or virtually, we’ll be discussing and demo-ing all the newest Backblaze B2 Cloud Storage solutions that will ensure your data can travel with ease—no mass transit needed—everywhere you need it to be.
Learn More LIVE in NYC
If you’re attending the NAB Show New York, join us in booth 1239 to learn about integrating B2 Cloud Storage into your workflow. Stop by anytime or you can schedule a meeting here. We’d love to see you.
NAB Show New York Preview: What’s New for Backblaze B2 Media Workflow Solutions
Our booth will have all the goodness you’d expect of us: partners, friendly faces, spots to take a load off and talk about making your data work harder, and, of course, some next-level SWAG. Let’s get into what you can expect.
New Pricing Models and Migration Tools
Our team is on hand to talk you through two new offerings that have been generating a lot of excitement among teams across media organizations:
Backblaze B2 Reserve: You can now purchase the Backblaze service many know and love in capacity-based bundles through resellers. If your team seeks 100% budget predictability with transaction fees and premium support included, you should check out this new offering. Check it out here.
Universal Data Migration: Recently an International Broadcasting Convention (IBC) 2022 Best of Show nominee, the service makes it easy and FREE to move data into Backblaze from legacy cloud, on-premises, and LTO/tape origins. If your current data storage is holding your team or your budget back, we’ll pay to free your media and move it to B2 Cloud Storage. Learn more here.
Six Flavors of Media Workflow Deep Dives
We’ve gathered materials and expertise to discuss or demo our six most asked about workflow improvements. We’re happy to talk about many other tools and improvements, but here are the six areas we expect to talk about the most:
Moving more (or all) media production to the cloud. Ensuring everyone—clients, collaborators, employers, everyone—has easy real-time access to content is essential for the inevitable geographical distribution of modern media workflows.
Reducing costs. Cloud workflows don’t need to come with costly gotchas, minimum retention penalties, and/or high costs when you actually want to use your content. We’ll explain how the right partners will unlock your budget so you can save on cloud services and spend more on creative projects.
Streamlining delivery. Pairing cloud storage with the right CDN is essential to making sure your media is consumable and monetizable at the edge. From streaming services to ecommerce outlets to legacy media outlets, we’ve helped every type of media organization do more with their content.
Freeing storage. Empty your expensive on-prem storage and stop adding HDs and tapes to the pile by moving finished projects to always-hot cloud storage. This doesn’t just free up space and money: Instantly accessible archives means you can work with and monetize older content with little friction in your creative process.
Safeguarding content. All those tapes or HDs on a shelf, in the closet, or wherever you keep them are hard to manage and harder to access and use. Parking everything safely and securely in the cloud means all that data is centrally accessible, protected, and available for more use.
Backing up (better!). Yes, we’ve got roots in backup going back >15 years—so when it comes to making sure your precious media is protected with easy access for speedy recovery, we’ve got a few thoughts (and solutions).
Partners, Partners, and More Partners…
“The more we get together, the happier we’ll be,” might as well be the theme lyric of cloud workflows. Combining best of breed platforms unlocks better value and functionality, and offers you the ability to build your cloud stack exactly how you need it for your business. We’ve got a large ecosystem of Alliance Partners, and we’re happy to get deep into your needs and demo how you can combine Backblaze B2 Cloud Storage with one or more partners including iconik, LucidLink, Synology (who will also be right next to us in the Javits Center!), and Fastly to best achieve your objectives.
Hoping to visit NAB Show New York but not yet registered? All good. You can register free on the NAB site with promo code NY4429.
Hoping We Can Help You Soon
Whether it’s in person at NAB Show New York or virtually when it works for you, we’d love to walk you through any of the solutions we can serve for hardworking media teams. If you will be in Manhattan, schedule a meeting to ensure you’ll get the right expert on our team, then stick around for the swag and good times. This invitation applies to you too, Channel Partners and Resellers—whether you have active projects or just want to learn more, let’s meet up and chat about ways to deliver more value together. If you’re not making the trip, not a problem. Just contact us here so we can arrange to help virtually.
Version 7.0.0
of the VirtualBox virtualization system is out. Changes include support
for fully encrypted virtual machines, a new performance-monitoring tool,
improved theme support, and a number of new devices.
The collective thoughts of the interwebz
Manage Consent
To provide the best experiences, we use technologies like cookies to store and/or access device information. Consenting to these technologies will allow us to process data such as browsing behavior or unique IDs on this site. Not consenting or withdrawing consent, may adversely affect certain features and functions.
Functional
Always active
The technical storage or access is strictly necessary for the legitimate purpose of enabling the use of a specific service explicitly requested by the subscriber or user, or for the sole purpose of carrying out the transmission of a communication over an electronic communications network.
Preferences
The technical storage or access is necessary for the legitimate purpose of storing preferences that are not requested by the subscriber or user.
Statistics
The technical storage or access that is used exclusively for statistical purposes.The technical storage or access that is used exclusively for anonymous statistical purposes. Without a subpoena, voluntary compliance on the part of your Internet Service Provider, or additional records from a third party, information stored or retrieved for this purpose alone cannot usually be used to identify you.
Marketing
The technical storage or access is required to create user profiles to send advertising, or to track the user on a website or across several websites for similar marketing purposes.


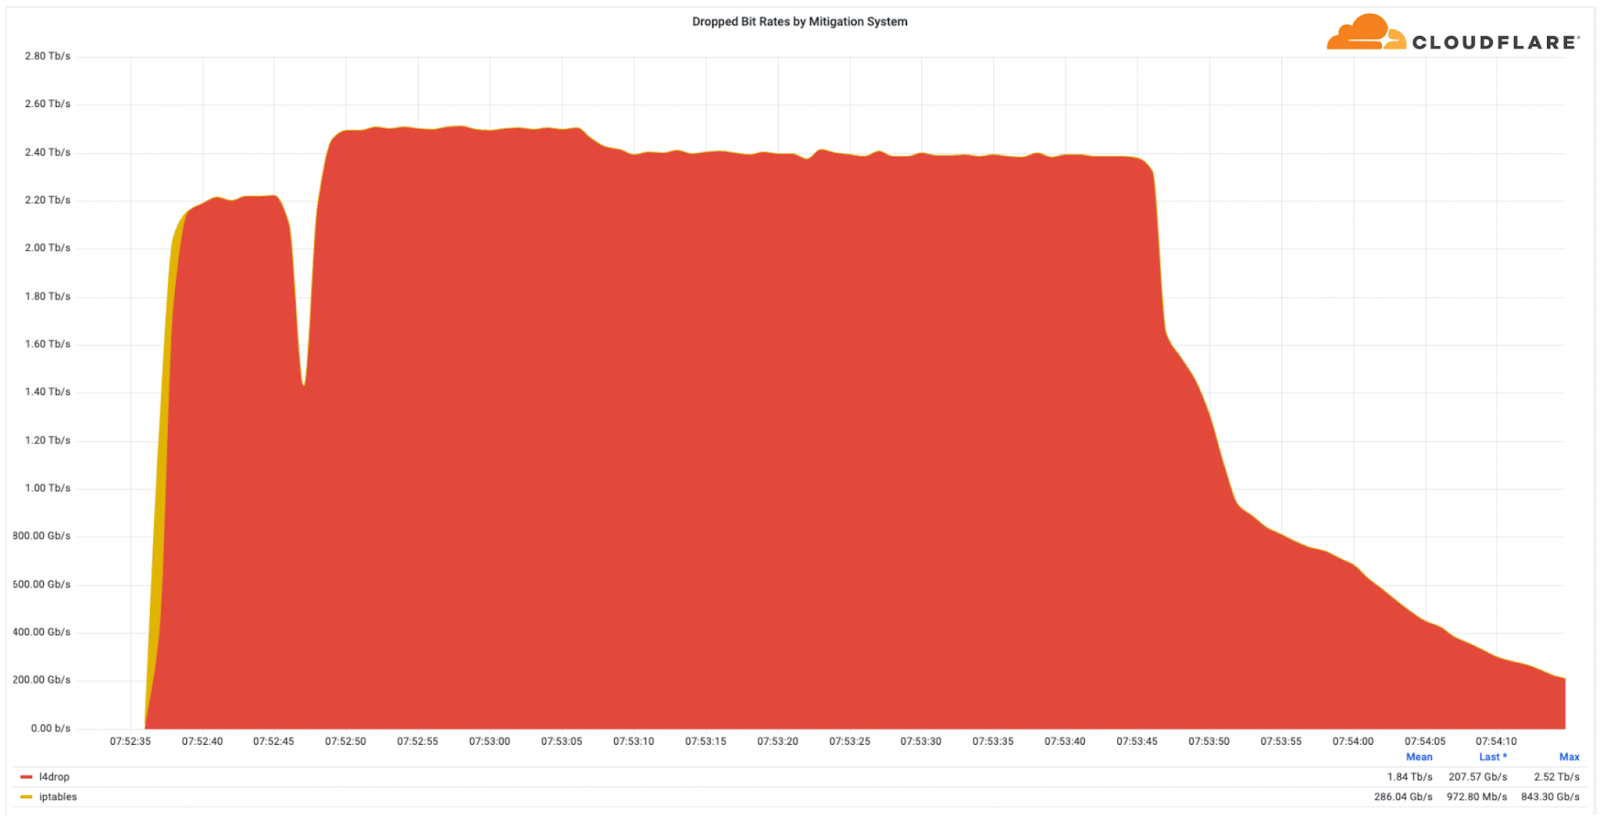


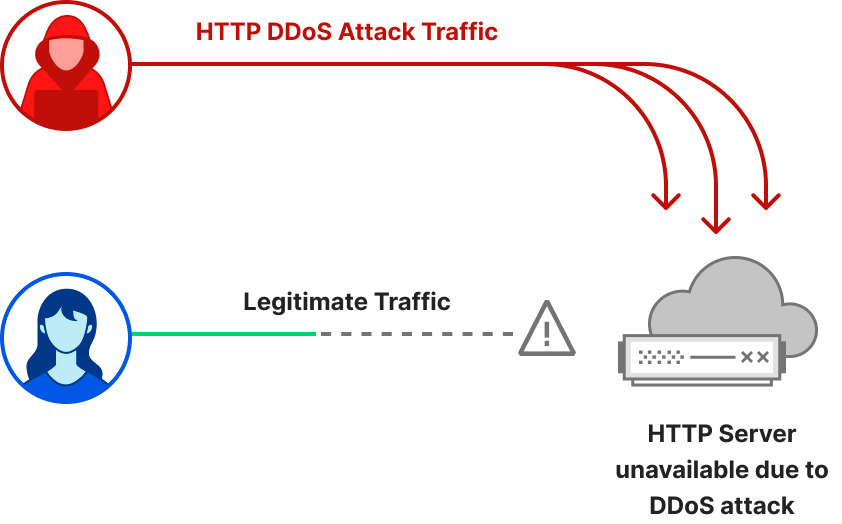


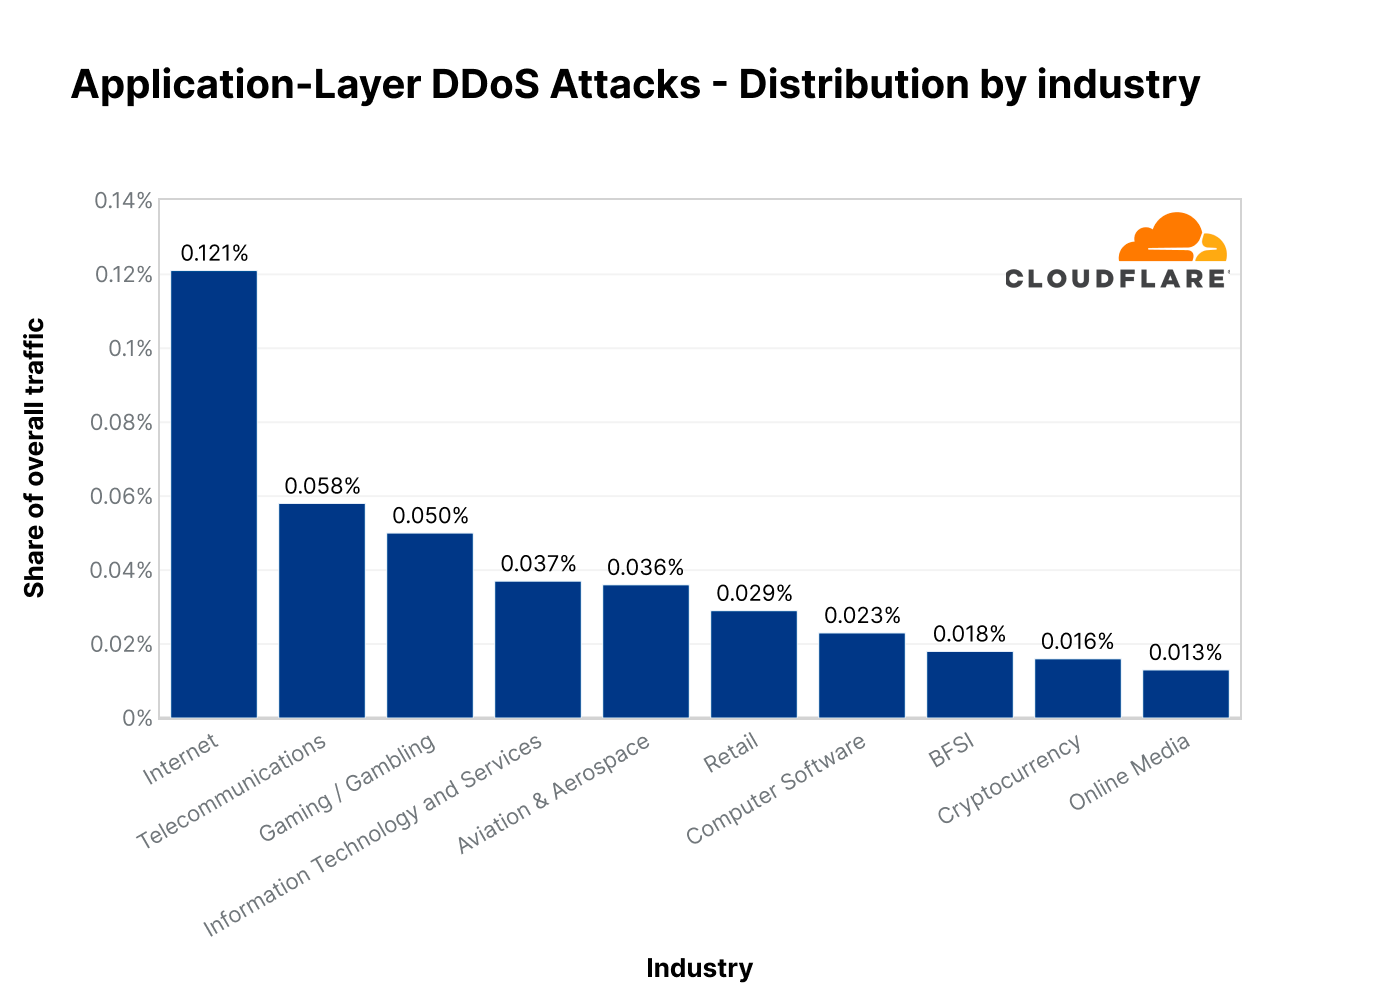
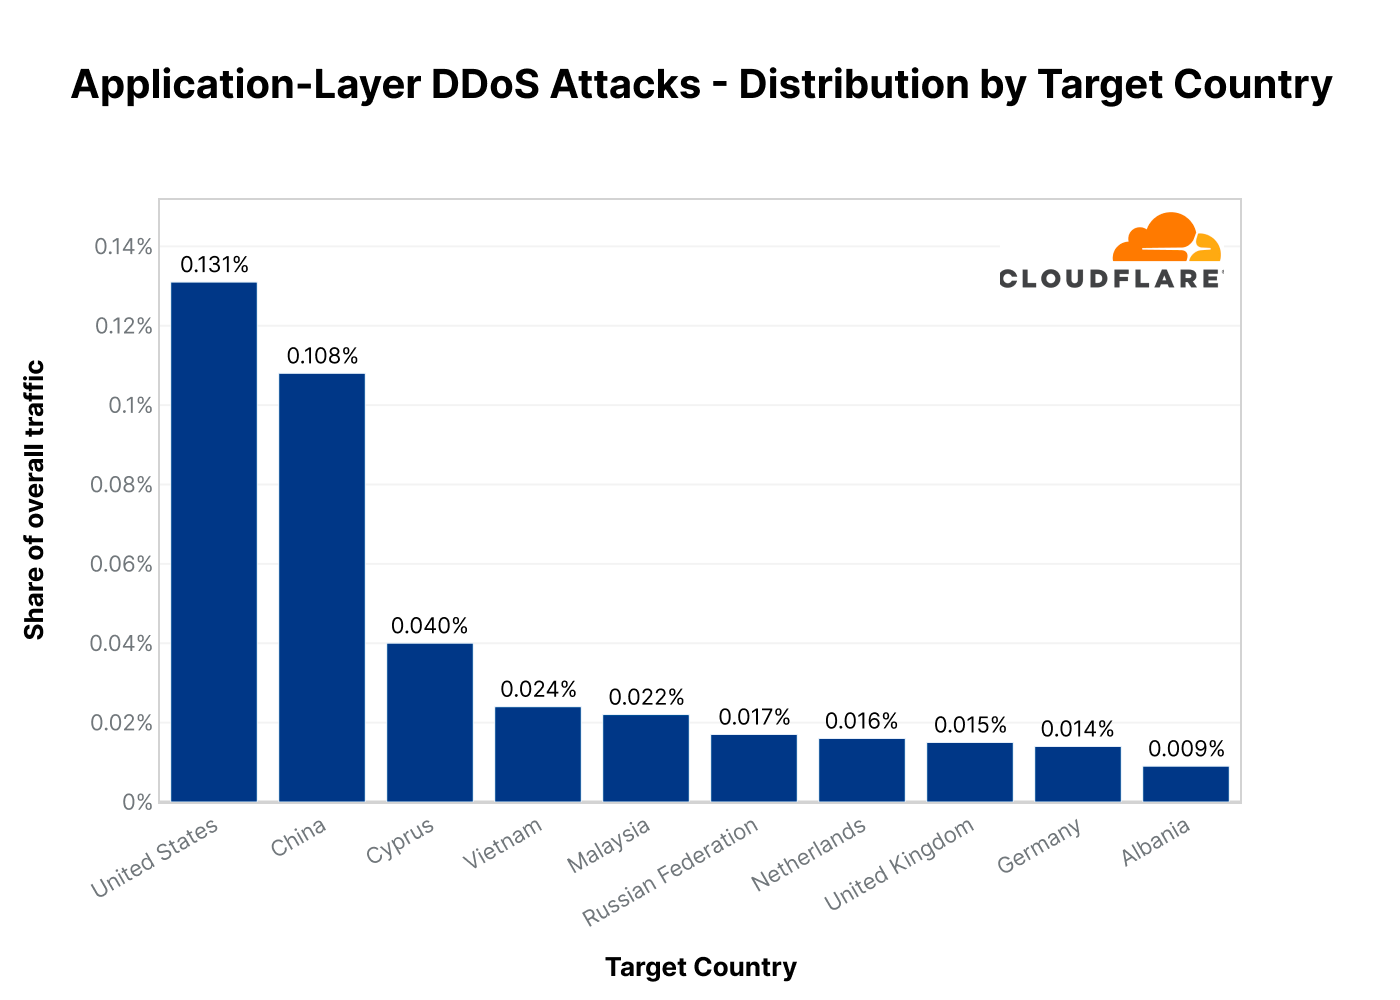
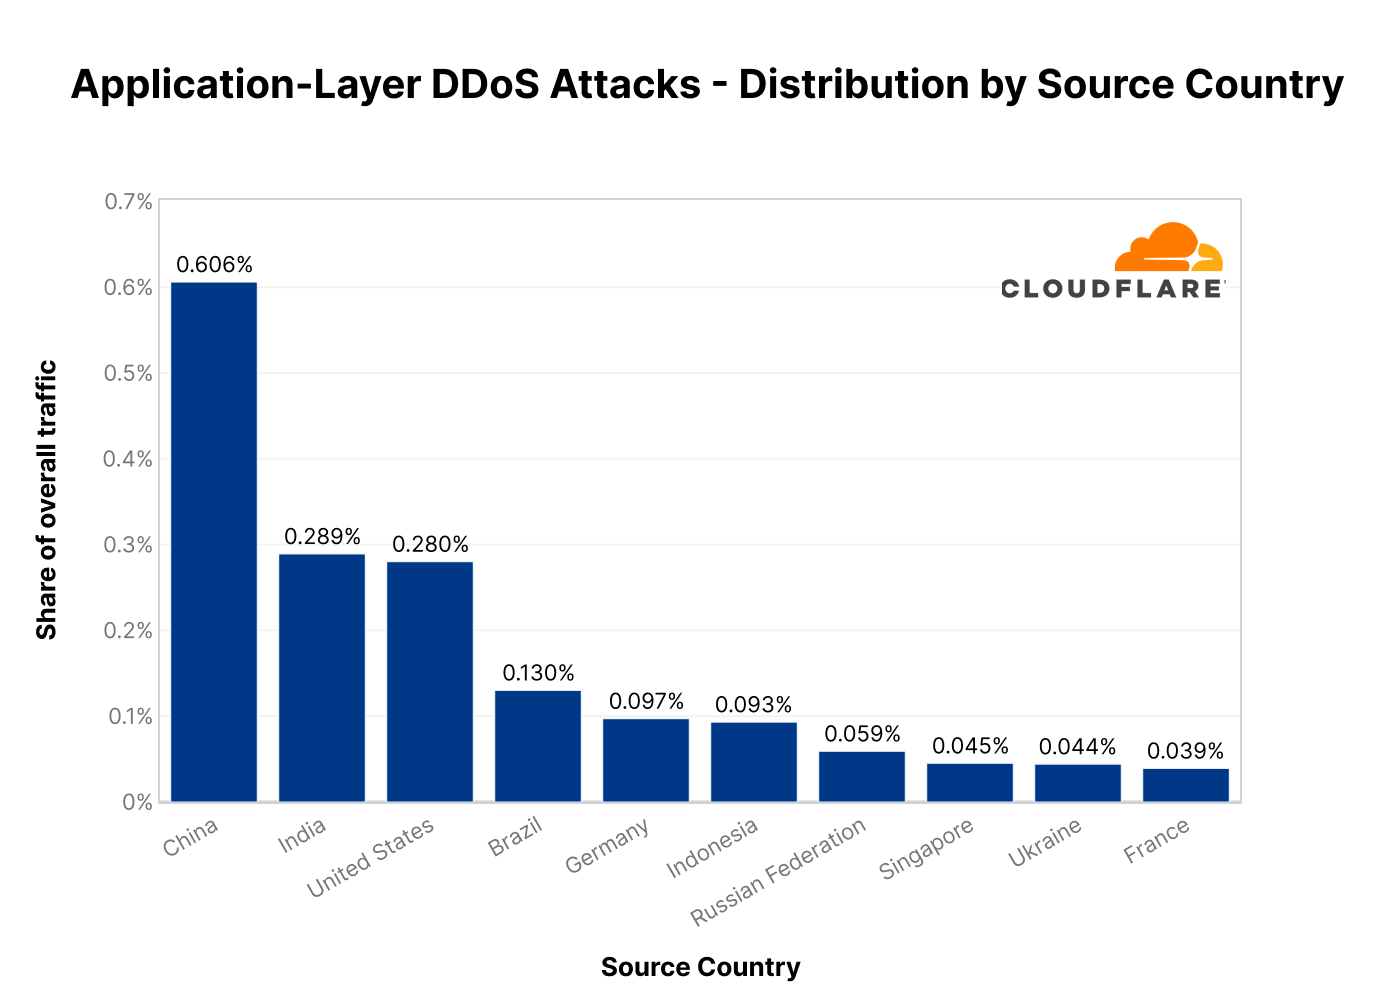
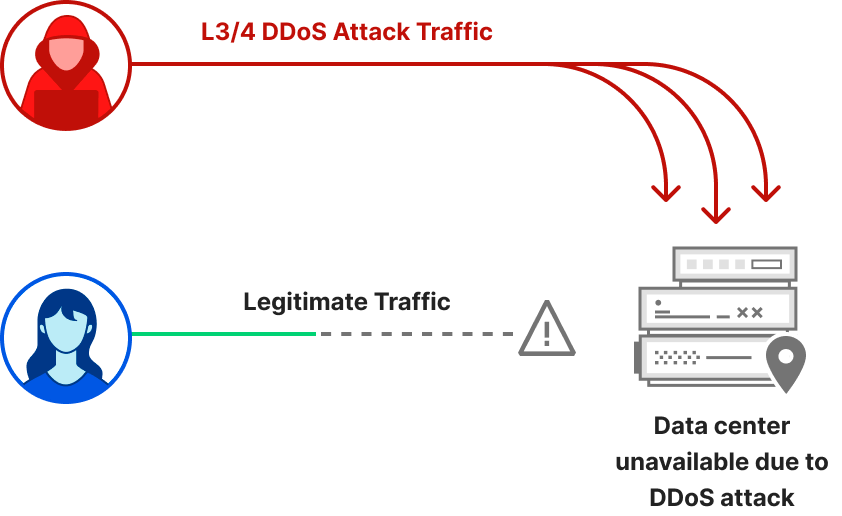


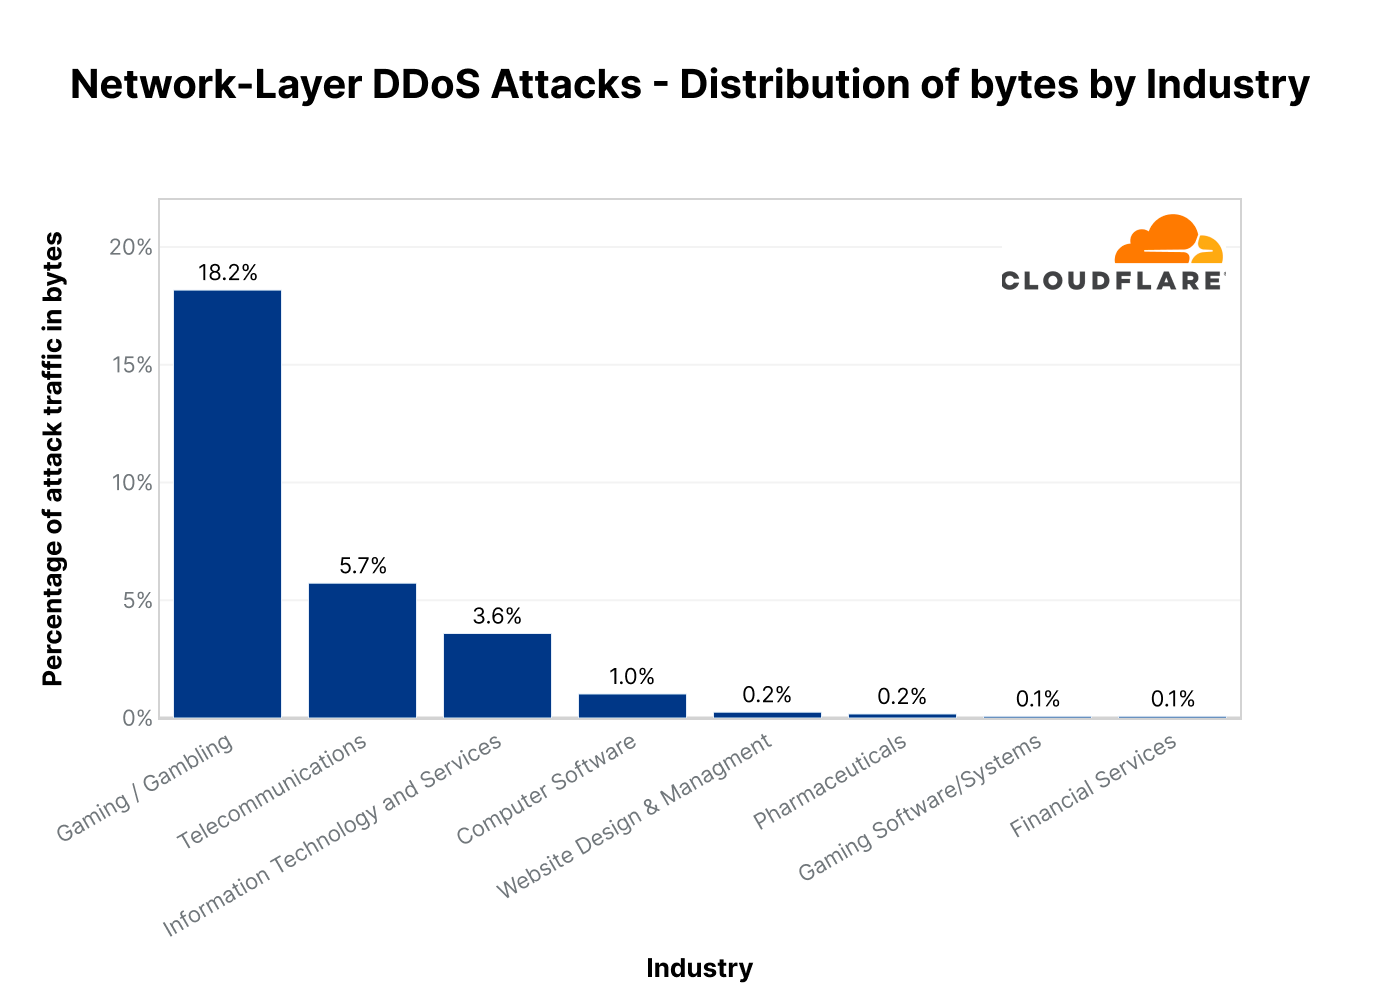
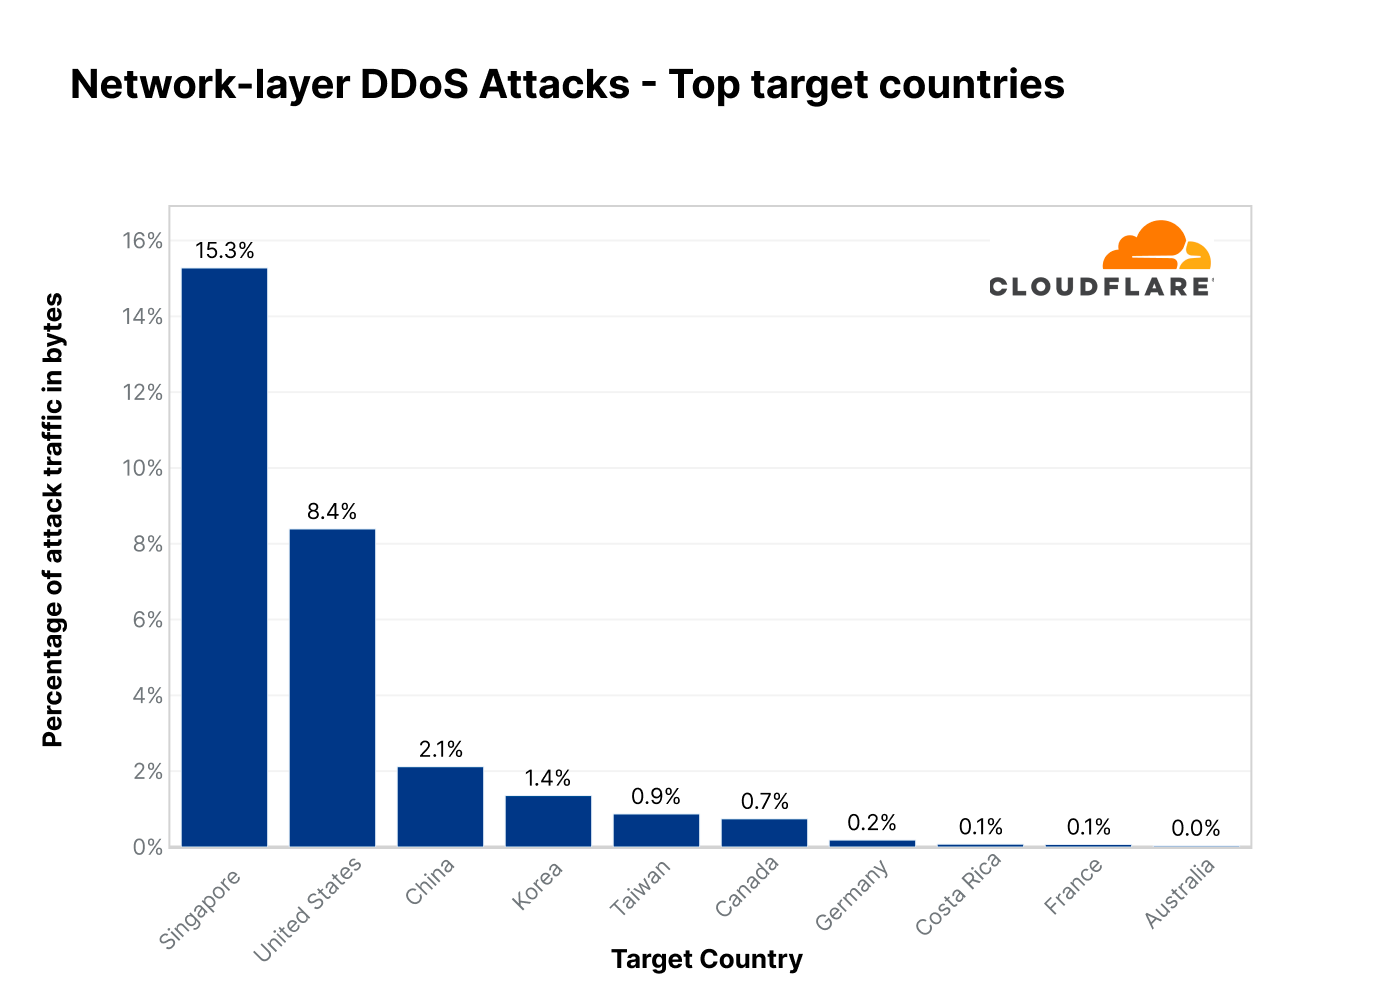

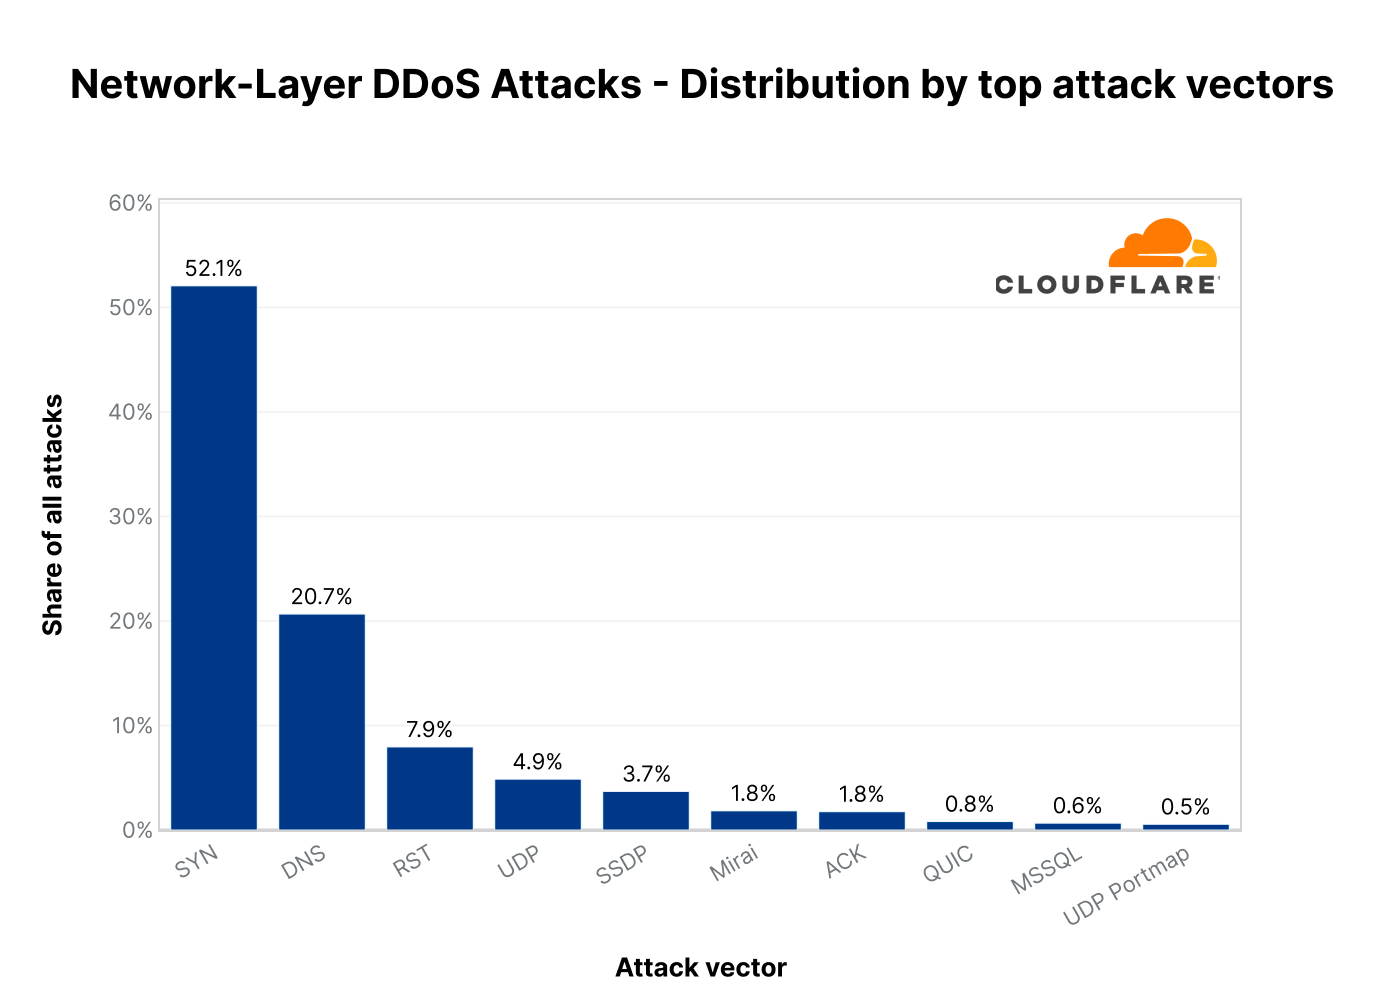
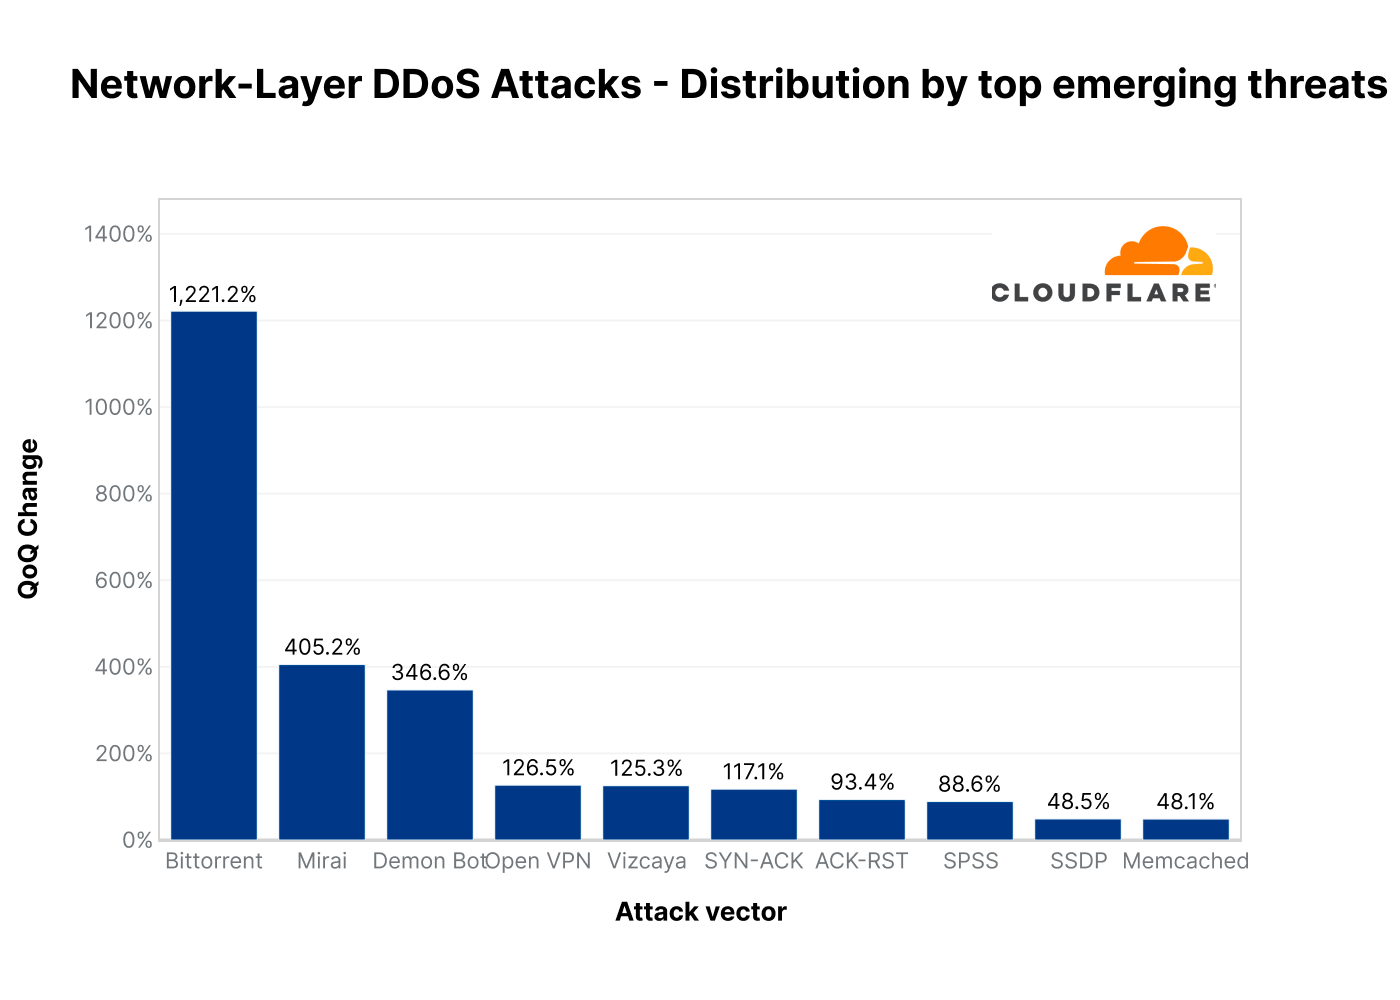
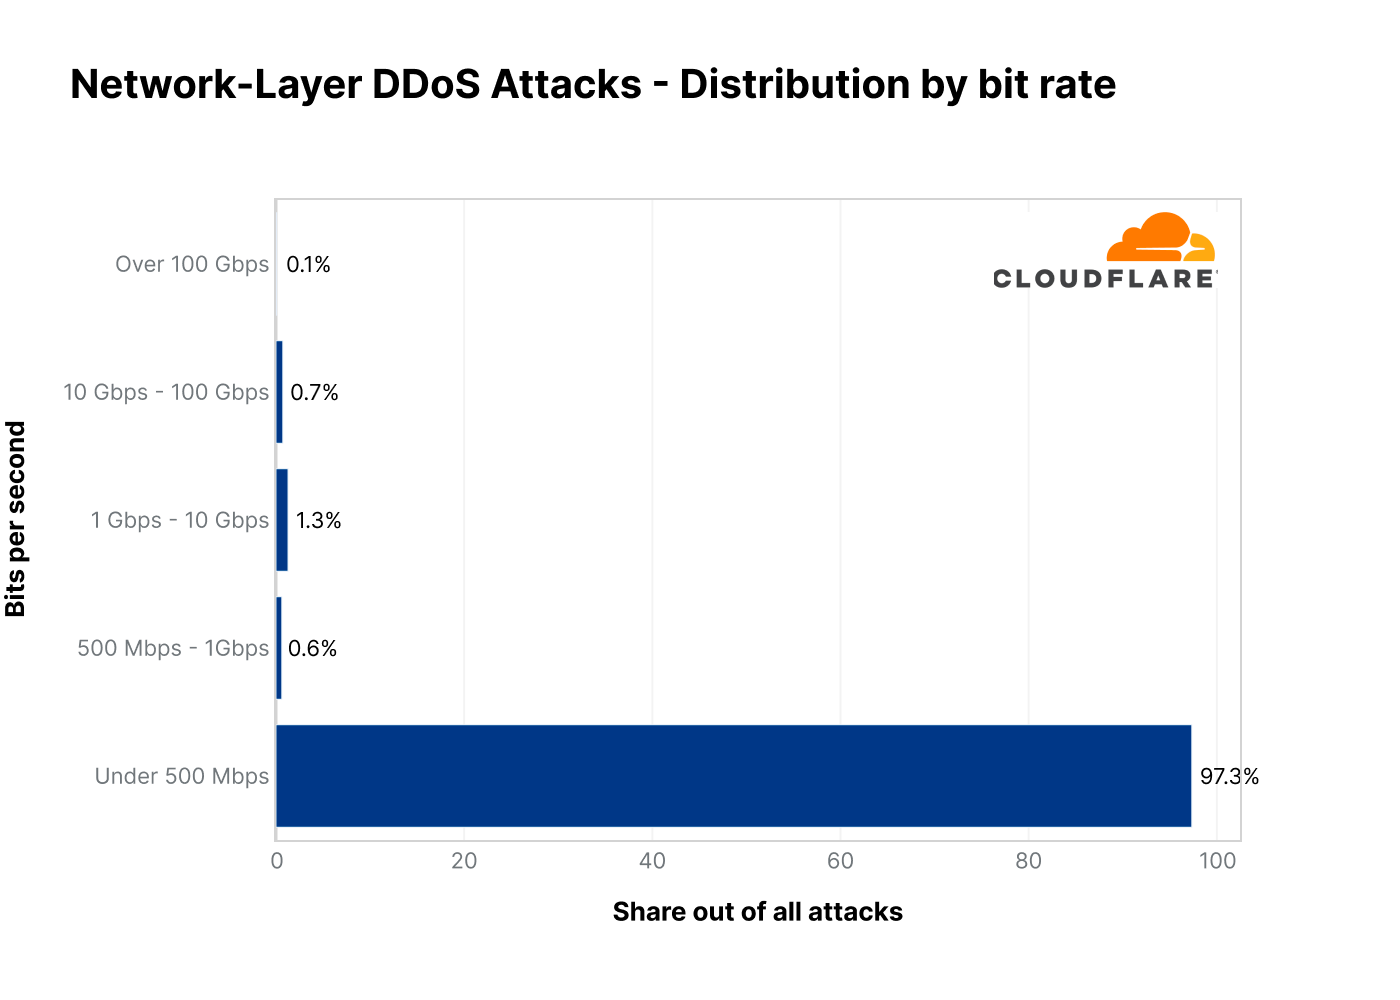
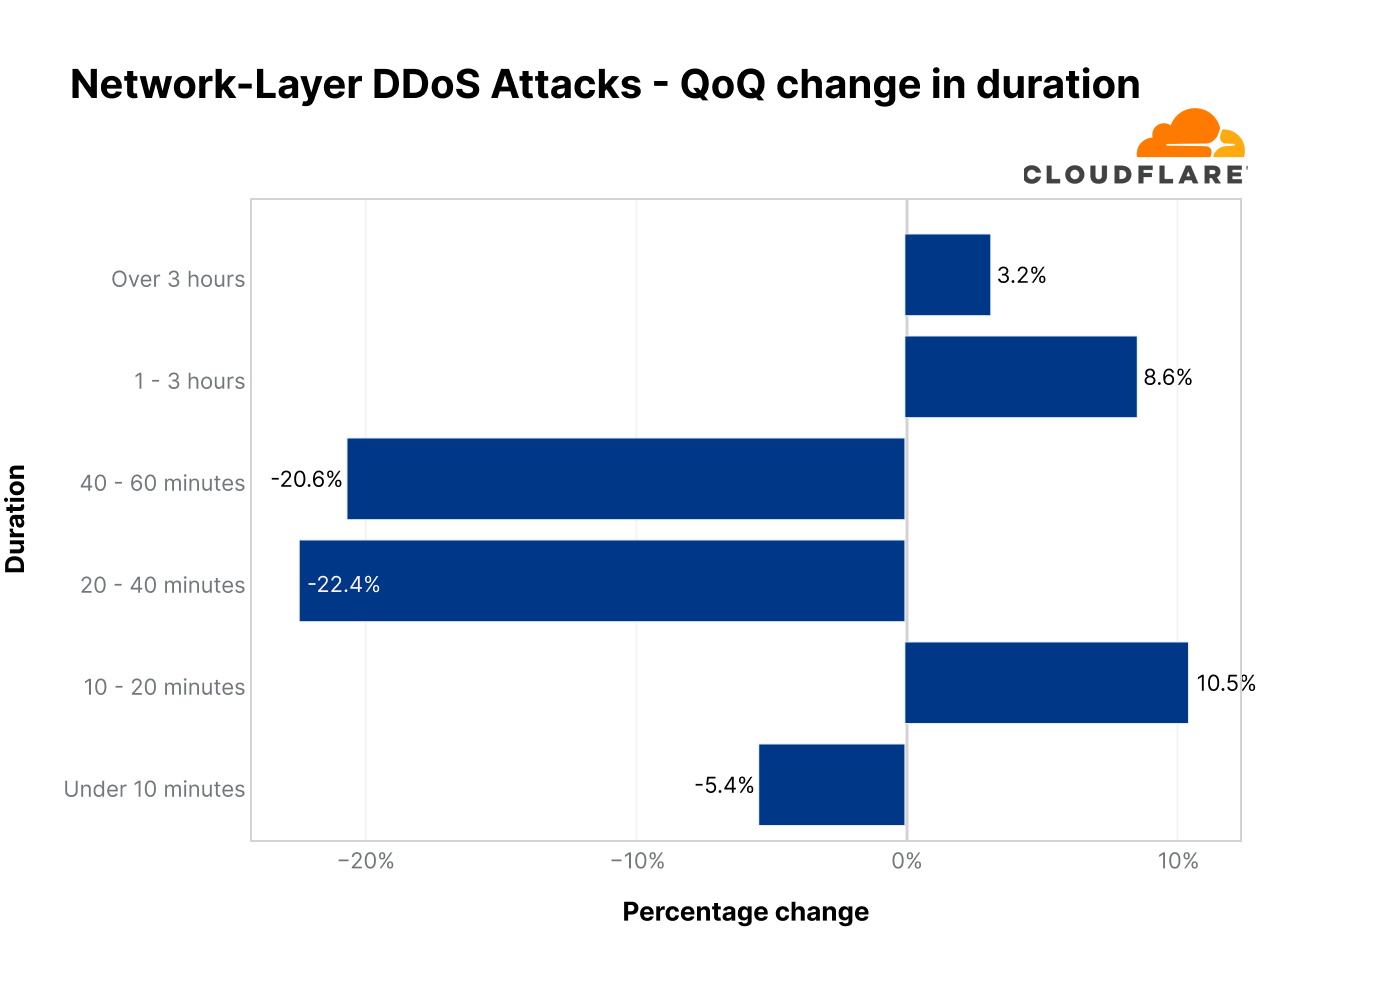


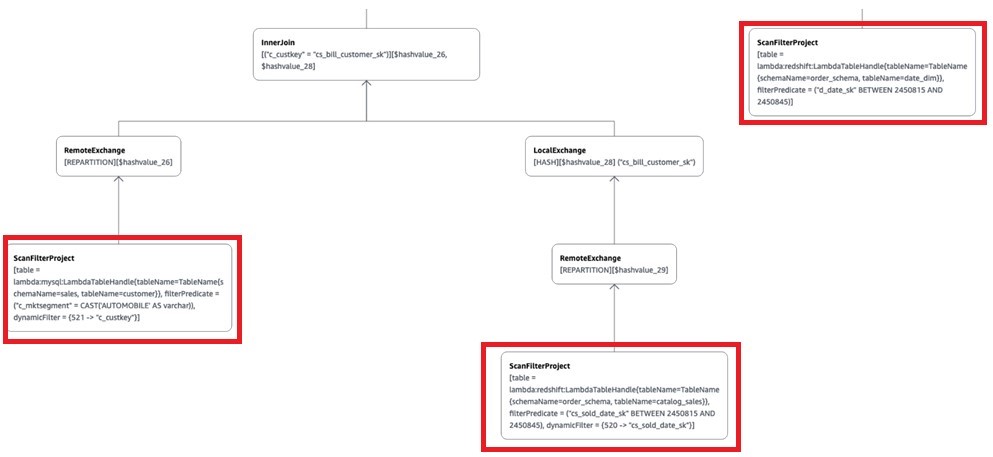
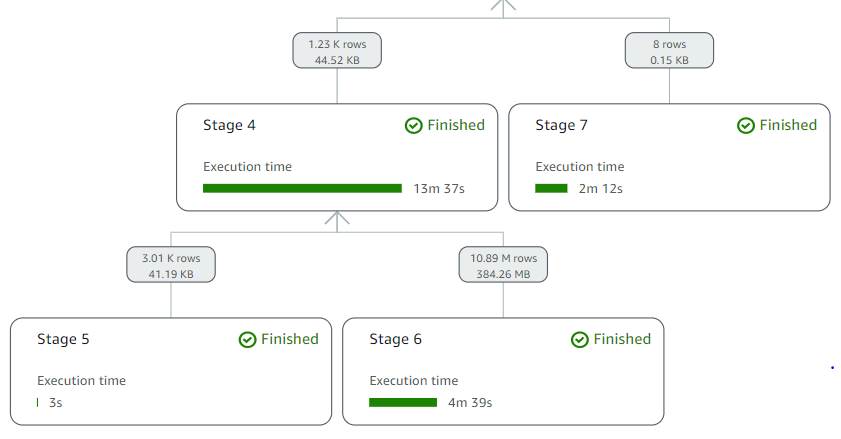
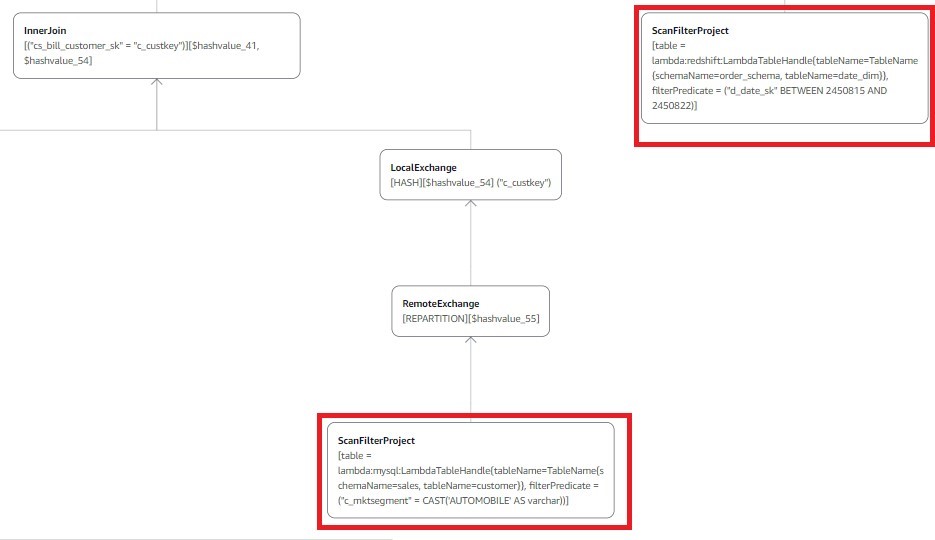


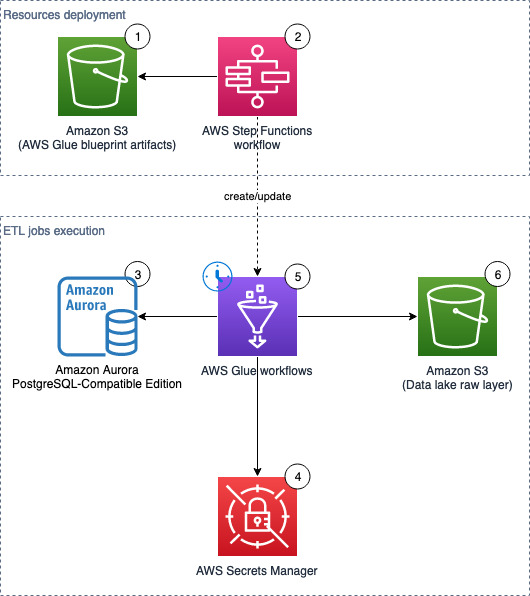

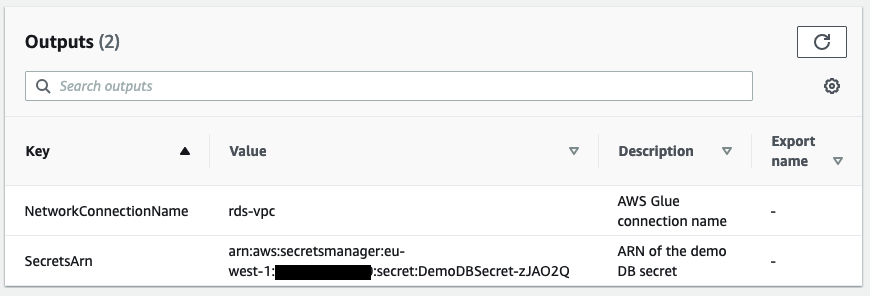


 Moustafa Mahmoud is a Solutions Architect of AWS Data Lab with a passion for data integration, data analysis, machine learning, and BI. Moustafa helps customers convert their ideas to a production-ready data product on AWS. He has over 10 years of experience as a data engineer, machine learning practitioner, and software developer. In his spare time, Moustafa loves exploring nature, reading, and spending time with friends and family.
 Corvus Lee is a Solutions Architect of AWS Data Lab. He enjoys all kinds of data-related discussions, and helps customers build MVPs using AWS Databases, Analytics, and Machine Learning services.