How Product Teams Can Build Empathy Through Experimentation

Post Syndicated from Netflix Technology Blog original https://netflixtechblog.com/how-product-teams-can-build-empathy-through-experimentation-6253603880a6

A conversation between Travis Brooks, Netflix Product Manager for Experimentation Platform, and George Khachatryan, OfferFit CEO

Note: I’ve known George for a little while now, and as we’ve talked a lot about the philosophy of experimentation, he kindly invited me to their office (virtually) for their virtual speaker series. We had a fun conversation with his team, and we realized that some parts of it might make a good blog post as well. So we jointly edited a bit for length and clarity, and are posting here as well as on OfferFit’s blog. Hope you enjoy the result. — Travis B.

George Khachatryan: Travis, could you tell us a bit about your background and how you came to your current role?

Travis Brooks: I’m the product manager (PM) for the experimentation platform. So my job is to make sure that all the tooling and infrastructure we have at Netflix for experimentation does what it needs to do, and to set the road map for the next year or more for what we’re building.

I started out in physics, but ended up not doing that. Instead, I started leading an information resource for particle physics literature. One of the things we ran up against was we didn’t really have enough users to run experiments. We were all experimental physicists at heart and we wanted to make decisions on some sort of principled basis, but we didn’t actually have enough users to get statistical significance.

At the same time, I had an opportunity to go join Yelp as the first product manager there for search, where there were many more users. And so I did that and spent some time building out search algorithms and recommendation engines at Yelp.

I came to Netflix about three years ago, and first led a team of data scientists responsible for front end experimentation — basically everything you see on the Netflix platform. And then in the last year, I’ve been the PM for all of our experimentation infrastructure and platform.

George Khachatryan: So over the last decade, a lot of tech companies have been increasingly embracing user centric design — it’s kind of become the accepted wisdom. And a lot of non-tech companies also are increasingly trying to be customer centric in their thinking. How would you define user centric design and what role do you think experimentation plays in it?

Travis Brooks: Let me say first that I’m talking here about my own experiences. I’m not speaking for Netflix.

But what I can say is that broadly, I think user centric design is really about empathy. And as a person who’s been both a user facing PM and a tools PM, having empathy for your user is one of the core traits that defines good product management. So when we say “user centric”, we’re just saying, “Hey, really lean into empathy.”

When you’re building things, whether you’re a visual designer, or a designer of an API, or a PM, or anybody who’s building something, lean into trying to put yourself in the shoes of the user. And if you can do that, not just at the beginning when you write down the specs, but all the way through the process, you make a better product in the end.

In the act of building we tend to get really entranced by the technical problem and solving that problem. And in fact, it’s probably necessary to lose sight of what the end user is going to experience in order to build the best technical solution. So to build products that are effective for the user we need that user perspective brought back into focus pretty regularly — “Oh, wait, here’s what the end user is going to experience” Or, “Oh yeah, actually we don’t even need to solve that really challenging, interesting technical problem over there, because the end user is only going to experience this part over here.” To me, that’s what user centric design means.

How do we make sure that in all aspects, whether it’s an API, or the front-end visual design, we’re centering the user? How are they going to experience this product? What are their pain points? Is what we’re doing actually connected to that end user?

George Khachatryan: And what role does experimentation play, if any, in building empathy?

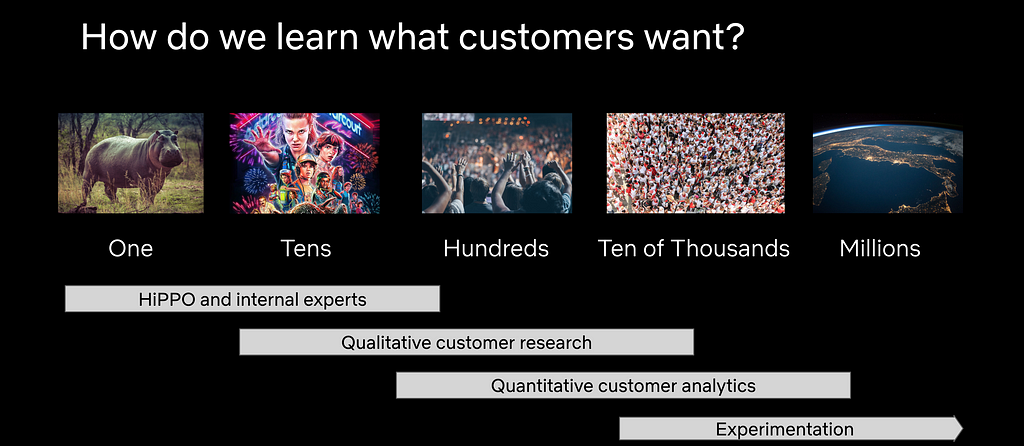
Travis Brooks: This is really a PM’s role — to ensure that the team that’s building something is maintaining that level of user empathy. But then you have to ask, “How does the PM know what users want?” Right? They’re not magic. A good PM doesn’t spring fully formed from the head of Zeus with all the knowledge of what users want. How do they get that knowledge? I think there are four ways.

1. One way is if you’re PM-ing a product that you yourself use. It’s the cheapest and maybe the lowest fidelity way of building empathy. “Okay, well, I’m a user so I know what users feel because I use the product”. It’s low fidelity because it’s an N of 1, and you’re certainly not a typical user. You’re a PM. You have a way different way of interacting with products than most people.

2. Typically the next thing people do is they start talking to users. And if they’re smart, they start talking to people who are not like them. “Hey, how do you use this product? What do you value? What do you find painful about it? How often do you use it? Why don’t you use it more? When was the last time you used it? What were you trying to do? Did you achieve that?” — all those typical user research questions that PMs ask. Really good user researchers get into this sort of qualitative research, and that’s a great way to build broader empathy, at a higher fidelity level, than just, “I use my product.”

3. Then you get to a scale where you have a lot of users, and talking to them becomes an art of “How do I get a representative sample from this broad population?” And you start to worry that maybe their memory isn’t quite perfect. Users are self-reporting how they use things, but that’s not actually how they use things. We know people have a lot of cognitive biases in that way. So then you start getting into observational data, and you say, “well, okay, people report that they use the product once a week. If I go look at data, I can see people use the product three times a week, so I can tell that what they report isn’t quite what happened.” Adding this observational data layer makes user research much higher fidelity. Of course, it’s higher cost and may take some time and some effort and investment.

4. But even that observational data layer doesn’t really help you understand how people use the product at the level of a deep causal connection. The end game of trying to understand the user is, “if I do X, users respond this way”. And the only way to establish that causal connection — maybe not the only way, but the most reliable way, the highest fidelity way — is to show a random sample of your users X and see how they differ from the rest of your users who didn’t see X. That’s the core of experimentation: a high cost, high fidelity, arguably lower speed, way to build empathy. It’s probably not the first place you’re going to turn to build empathy, but you’re going to get there and you’ll eventually need to have it in your arsenal.

Different scales of usage demand different methods of learning
Different methods of learning work optimally at different scales, having all of them in your arsenal is useful.

George Khachatryan: Yeah. So you talk about the importance of building an experimentation culture. Can you explain what the main elements of such a culture would be, in your view?

Travis Brooks: I think having a sense of humility is super important. If you read our blog posts, or posts from anybody who does massive scale testing such as Microsoft, you see that they test, and most of their treatments fail. And those are treatments from expert designers and PMs and engineers who have the best context, the best user research. Especially as your product matures, it is hard to improve upon. Even a less mature product is hard to improve upon, because it turns out our intuition is pretty good. We understand what users need. It’s just not a very reliable mechanism. So most treatments that we come up with fail, which means you have to have a lot of humility.

You can’t get married to your ideas and say, “I’m going to do an experiment; this is going to blow the world away.” And you end up wasting a lot of time and effort trying to show that your treatment is good, even if it’s not. You miss the bigger picture, which is, “Hey, you tried something. It didn’t work. What can you learn from that experience to inform the next treatment?”

The cultures where people can be really successful in experimentation involve a lot of humility, which encourages that sort of iterative approach. “I’m guessing this is not going to work because I can see from history most of these things don’t work. What I’m going to do is put it out there and I’m going to learn from it. Maybe I’ll get lucky and it’ll work right off the bat, but maybe I won’t. I’ll learn from the next two tests, and I’ll get to someplace where I can actually solve this problem.”

The other thing I think is important is having a culture of open debate, where decisions are made out in the open. The more open your decision-making, the louder a voice data has. When decision-making gets closed, into one person’s office or one person’s head, it’s hard. Often when people debate and they can’t agree, they turn to data, because it’s a lot harder to disagree with that. And so if you want an experimentation culture, if you want data, have open debate. Have open decision making. Then people more clearly see that they need data, that they need to experiment.

So yes, I think that humility and open decision-making are really important.


How Product Teams Can Build Empathy Through Experimentation was originally published in Netflix TechBlog on Medium, where people are continuing the conversation by highlighting and responding to this story.

[$] (Re)moving outdated Python tools and scripts

Post Syndicated from original https://lwn.net/Articles/910898/

At the end of September, Victor Stinner reported
on a security bug
fix
he had been working on for a script from the CPython
Tools/scripts directory. As part of that work, he realized
that there were 74 scripts in that directory that were potentially
outdated, unused, unmaintained, trivial, buggy, or some combination of all
of those. It
is not uncommon for projects to have code that accretes in overlooked
corners of the source tree, but it makes sense to periodically take a look
to see if changes are needed. Stinner seems to have kicked that off for Python
with his message.

Split your monolithic Apache Kafka clusters using Amazon MSK Serverless

Post Syndicated from Ali Alemi original https://aws.amazon.com/blogs/big-data/split-your-monolithic-apache-kafka-clusters-using-amazon-msk-serverless/

Today, many companies are building real-time applications to improve their customer experience and get immediate insights from their data before it loses its value. As the result, companies have been facing increasing demand to provide data streaming services such as Apache Kafka for developers. To meet this demand, companies typically start with a small- or medium-sized, centralized Apache Kafka cluster to build a global streaming service. Over time, they scale the capacity of the cluster to match the demand for streaming. They choose to keep a monolithic cluster to simplify staffing and training by bringing all technical expertise in a single place. This approach also has cost benefits because it reduces the technical debt, overall operational costs, and complexity. In a monolithic cluster, the extra capacity is shared among all applications, therefore it usually reduces the overall streaming infrastructure cost.

In this post, I explain a few challenges with a centralized approach, and introduce two strategies for implementing a decentralized approach, using Amazon MSK Serverless. A decentralized strategy enables you to provision multiple Apache Kafka clusters instead of a monolithic one. I discuss how this strategy helps you optimize clusters per your application’s security, storage, and performance needs. I also discuss the benefits of a decentralized model and how to migrate from a monolithic cluster to a multi-cluster deployment model.

MSK Serverless can reduce the overhead and cost of managing Apache Kafka clusters. It automatically provisions and scales compute and storage resources for Apache Kafka clusters and automatically manages cluster capacity. It monitors how the partitions are distributed across the backend nodes and reassigns the partitions automatically when necessary. It integrates with other AWS services such as Amazon CloudWatch, where you can monitor the health of the cluster. The choice of MSK Serverless in this post is deliberate, even though the concepts can be applied to the Amazon MSK provisioned offering as well.

Overview of solution

Apache Kafka is an open-source, high-performance, fault-tolerant, and scalable platform for building real-time streaming data pipelines and applications. Apache Kafka simplifies producing and consuming streaming data by decoupling producers from the consumers. Producers simply interact with a single data store (Apache Kafka) to send their data. Consumers read the continuously flowing data, independent from the architecture or the programming language of the producers.

Apache Kafka is a popular choice for many use cases, such as:

  • Real-time web and log analytics
  • Transaction and event sourcing
  • Messaging
  • Decoupling microservices
  • Streaming ETL (extract, transform, and load)
  • Metrics and log aggregation

Challenges with a monolithic Apache Kafka cluster

Monolithic Apache Kafka saves companies from having to install and maintain multiple clusters in their data centers. However, this approach comes with common disadvantages:

  • The entire streaming capacity is consolidated in one place, making capacity planning difficult and complicated. You typically need more time to plan and reconfigure the cluster. For example, when preparing for sales or large campaign events, it’s hard to predict and calculate an aggregation of needed capacity across all applications. This can also inhibit the growth of your company because reconfiguring a large cluster for a new workload often takes longer than a small cluster.
  • Organizational conflicts may occur regarding the ownership and maintenance of the Apache Kafka cluster, because a monolithic cluster is a shared resource.
  • The Apache Kafka cluster becomes a single point of failure. Any downtime means the outage of all related applications.
  • If you choose to increase Apache Kafka’s resiliency with a multi-datacenter deployment, then you typically must have a cluster with the same size (as large) in the other data center, which is expensive.
  • Maintenance and operation activities, such as version upgrades or installing OS patches, take significantly longer for larger clusters due to the distributed nature of Apache Kafka architecture.
  • A faulty application can impact the reliability of the whole cluster and other applications.
  • Version upgrades have to wait until all applications are tested with the new Apache Kafka version. This limits any application from experimenting with Apache Kafka features quickly.
  • This model makes it difficult to attribute the cost of running the cluster to the applications for chargeback purposes.

The following diagram shows a monolithic Apache Kafka architecture.

diagram shows a monolithic Apache Kafka architecture.

Decentralized model

A decentralized Apache Kafka deployment model involves provisioning, configuring, and maintaining multiple clusters. This strategy generally isn’t preferred because managing multiple clusters requires heavy investments in operational excellence, advanced monitoring, infrastructure as code, security, and hardware procurement in on-premises environments.

However, provisioning decentralized Apache Kafka clusters using MSK Serverless doesn’t require those investments. It can scale the capacity and storage up and down instantly based on the application requirement, adding new workloads or scaling operations without the need for complex capacity planning. It also provides a throughput-based pricing model, and you pay for the storage and throughput that your applications use. Moreover, with MSK Serverless, you no longer need to perform standard maintenance tasks such as Apache Kafka version upgrade, partition reassignments, or OS patching.

With MSK Serverless, you benefit from a decentralized deployment without the operational burden that usually comes with a self-managed Apache Kafka deployment. In this strategy, the DevOps managers don’t have to spend time provisioning, configuring, monitoring, and operating multiple clusters. Instead, they invest more in building more operational tools to onboard more real-time applications.

In the remainder of this post, I discuss different strategies for implementing a decentralized model. Furthermore, I highlight the benefits and challenges of each strategy so you can decide what works best for your organization.

Write clusters and read clusters

In this strategy, write clusters are responsible for ingesting data from the producers. You can add new workloads by creating new topics or creating new MSK Serverless clusters. If you need to scale the size of current workloads, you simply increase the number of partitions of your topics if the ordering isn’t important. MSK Serverless manages the capacity instantly as per the new configuration.

Each MSK Serverless cluster provides up to 200 MBps of write throughput and 400 MBps of read throughput. It also allocates up to 5 MBps of write throughput and 10 MBps of read throughput per partition.

Data consumers within any organization can usually be divided to two main categories:

  • Time-sensitive workloads, which need data with very low latency (such as millisecond or subsecond) and can only tolerate a very short Recovery Time Objective (RTO)
  • Time-insensitive workloads, which can tolerate higher latency (sub-10 seconds to minute-level latency) and longer RTO

Each of these categories also can be further divided into subcategories based on certain conditions, such as data classification, regulatory compliance, or service level agreements (SLAs). Read clusters can be set up according to your business or technical requirements, or even organizational boundaries, which can be used by the specific group of consumers. Finally, the consumers are configured to run against the associated read cluster.

To connect the write clusters to read clusters, a data replication pipeline is necessary. You can build a data replication pipeline many ways. Because MSK Serverless supports the standard Apache Kafka APIs, you can use the standard Apache Kafka tools such as MirrorMaker 2 to set up replications between Apache Kafka clusters.

The following diagram shows the architecture for this strategy.

diagram shows the architecture for this strategy.

This approach has the following benefits:

  • Producers are isolated from the consumers; therefore, your write throughput can scale independently from your read throughput. For example, if you have reached your max read throughput with existing clusters and need to add a new consumer group, you can simply provision a new MSK Serverless cluster and set up replication between the write cluster and the new read cluster.
  • It helps enforce security and regulatory compliance. You can build streaming jobs that can mask or remove the sensitive fields of data events, such as personally identifiable information (PII), while replicating the data.
  • Different clusters can be configured differently in terms of retention. For example, read clusters can be configured with different maximum retention periods, to save on storage cost depending on their requirements.
  • You can prioritize your response time for outages for certain clusters over the others.
  • For implementing increased resiliency, you can have fewer clusters in the backup Region by only replicating the data from the write clusters. Other clusters such as read clusters can be provisioned when the workload failover is invoked. In this model, with the MSK Serverless pricing model, you pay additionally for what you use (lighter replica) in the backup Region.

There are a few important notes to keep in mind when choosing this strategy:

  • It requires setting up multiple replications between clusters, which comes with additional operational and maintenance complexity.
  • Replication tools such as MirrorMaker 2 only support at-least-once processing semantics. This means that during failures and restarts, data events can be duplicated. If you have consumers that can’t tolerate data duplication, I suggest building data pipelines that support the exactly-once processing semantic for replicating the data, such as Apache Flink, instead of using MirrorMaker 2.
  • Because consumers don’t consume data directly from the write clusters, the latency is increased between the writers and the readers.
  • In this strategy, even though there are multiple Apache Kafka clusters, ownership and control still reside with one team, and the resources are in a single AWS account.

Segregating clusters

For some companies, providing access to Apache Kafka through a central data platform can create scaling, ownership, and accountability challenges. Infrastructure teams may not understand the specific business needs of an application, such as data freshness or latency requirements, security, data schemas, or a specific method needed for data ingestion.

You can often reduce these challenges by giving ownership and autonomy to the team who owns the application. You allow them to build and manage their application and needed infrastructure, rather than only being able to use a common central platform. For instance, development teams are responsible for provisioning, configuring, maintaining, and operating their own Apache Kafka clusters. They’re the domain experts of their application requirements, and they can manage their cluster according to their application needs. This reduces overall friction and puts application teams accountable to their advertised SLAs.

As mentioned before, MSK Serverless minimizes the operation and maintenance work associated with Apache Kafka clusters. This enables the autonomous application teams to manage their clusters according to industry best practices, without needing to be an expert in running highly available Apache Kafka clusters on AWS. If the MSK Serverless cluster is provisioned within their AWS account, they also own all the costs associated with operating their applications and the data streaming services.

The following diagram shows the architecture for this strategy.

diagram shows the architecture for this strategy.

This approach has the following benefits:

  • MSK Serverless clusters are managed by different teams; therefore, the overall management work is minimized.
  • Applications are isolated from each other. A faulty application or downtime of a cluster doesn’t impact other applications.
  • Consumers read data directly with low latency from the same cluster where the data is written.
  • Each MSK Serverless cluster scales differently per its write and read throughput.
  • Simple cost attribution means that application teams own their infrastructure and its cost.
  • Total ownership of the streaming infrastructure allows developers to adopt streaming faster and deliver more functionalities. It may also help shorten their response time to failures and outages.

Compared to the previous strategy, this approach has the following disadvantages:

  • It’s difficult to enforce a unified security or regulatory compliance across many teams.
  • Duplicate copies of the same data may be ingested in multiple clusters. This increases the overall cost.
  • To increase resiliency, each team individually needs to set up replications between MSK Serverless clusters.

Moving from a centralized to decentralized strategy

MSK Serverless provides AWS Command Line Interface (AWS CLI) tools and support for AWS CloudFormation templates for provisioning clusters in minutes. You can implement any of the strategies that I mentioned earlier via the methods AWS provides, and migrate your producers and consumers when the new clusters are ready.

The following steps provide further guidance on implementation of these strategies:

  1. Begin by focusing on the current issues with the monolithic Apache Kafka. Next, compare the challenges with the benefits and disadvantages, as listed under each strategy. This helps you decide which strategy serves your company the best.
  2. Identify and document each application’s performance, resiliency, SLA, and ownership requirements separately.
  3. Attempt grouping applications that have similar requirements. For example, you may find a few applications that run batch analytics; therefore, they’re not sensitive to data freshness and also don’t need access to sensitive (or PII) data. If you decide segregating clusters is the right strategy for your company, you may choose to group applications by the team who owns them.
  4. Compare each group of applications’ storage and streaming throughput requirements against the MSK Serverless quotas. This helps you determine whether one MSK Serverless cluster can provide the needed aggregated streaming capacity. Otherwise, further divide larger groups to smaller ones.
  5. Create MSK Serverless clusters per each group you identified earlier via the AWS Management Console, AWS CLI, or CloudFormation templates.
  6. Identify the topics that correspond to each new MSK Serverless cluster.
  7. Choose the best migration pattern to Amazon MSK according to the replication requirements. For example, when you don’t need data transformation, and duplicate data events can be tolerated by applications, you can use Apache Kafka migration tools such as MirrorMaker 2.0.
  8. After you have verified the data is replicating correctly to the new clusters, first restart the consumers against the new cluster. This ensures no data will be lost as the result of the migration.
  9. After the consumers resume processing data, restart the producers against the new cluster, and shut down the replication pipeline you created earlier.

As of this writing, MSK Serverless only supports AWS Identity and Access Management (IAM) for authentication and access control. For more information, refer to Securing Apache Kafka is easy and familiar with IAM Access Control for Amazon MSK. If your applications use other methods supported by Apache Kafka, you need to modify your application code to use IAM Access Control instead or use the Amazon MSK provisioned offering.

Summary

MSK Serverless eliminates operational overhead, including the provisioning, configuration, and maintenance of highly available Apache Kafka. In this post, I showed how splitting Apache Kafka clusters helps improve the security, performance, scalability, and reliability of your overall data streaming services and applications. I also described two main strategies for splitting a monolithic Apache Kafka cluster using MSK Serverless. If you’re using Amazon MSK provisioned offering, these strategies are still relevant when considering moving from a centralized to a decentralized model. You can decide the right strategy depending on your company’s specific needs.

For further reading on Amazon MSK, visit the official product page.


About the Author

About the author Ali AlemiAli Alemi is a Streaming Specialist Solutions Architect at AWS. Ali advises AWS customers with architectural best practices and helps them design real-time analytics data systems that are reliable, secure, efficient, and cost-effective. He works backward from customers’ use cases and designs data solutions to solve their business problems. Prior to joining AWS, Ali supported several public sector customers and AWS consulting partners in their application modernization journey and migration to the cloud.

[Security Nation] James Kettle of PortSwigger on Advancing Web-Attack Research

Post Syndicated from Rapid7 original https://blog.rapid7.com/2022/10/12/security-nation-james-kettle-of-portswigger-on-advancing-web-attack-research/

[Security Nation] James Kettle of PortSwigger on Advancing Web-Attack Research

In this episode of Security Nation, Jen and Tod talk to James Kettle of PortSwigger. Their discussion includes research for new web-attack techniques and how those get field tested (hint: bug bounties). The research is kept fresh from donations gleaned from the bug bounty field tests. PortSwigger validates their research in the real world, and those advances in web-attack techniques are published and disseminated in and effort to fix bugs and misconfigurations.

Stick around for the Rapid Rundown, where Tod and Jen talk about the recent Fortinet advisory concerning the “silent patching” of bugs without disclosure of any real details – only to have attackers go and reverse it all anyway.  

James Kettle

[Security Nation] James Kettle of PortSwigger on Advancing Web-Attack Research

James ‘albinowax’ Kettle is Director of Research at PortSwigger. His latest work includes browser-powered desync attacks and web-cache poisoning. James has extensive experience cultivating novel attack techniques, including RCE via Server-Side Template Injection and abusing the HTTP Host header to poison password reset emails and server-side caches. James is also the author of various popular open-source tools including Param Miner, Turbo Intruder, and HTTP Request Smuggler. He is a frequent speaker at numerous prestigious venues, including both Black Hat USA and EU, OWASP AppSec USA and EU, and DEFCON.

Show notes

Interview links

  • Prior Security Nation episode in which loads of Portswigger references were dropped:
  • https://www.rapid7.com/blog/post/2021/08/18/security-nation-daniel-crowley/
  • New research from James about browser-powered desync attacks:
  • https://portswigger.net/research/browser-powered-desync-attacks

Rapid Rundown links

Like the show? Want to keep Jen and Tod in the podcasting business? Feel free to rate and review with your favorite podcast purveyor, like Apple Podcasts.

Want More Inspiring Stories From the Security Community?

Subscribe to Security Nation Today

Simplifying serverless permissions with AWS SAM Connectors

Post Syndicated from Eric Johnson original https://aws.amazon.com/blogs/compute/simplifying-serverless-permissions-with-aws-sam-connectors/

This post written by Kurt Tometich, Senior Solutions Architect, AWS.

Developers have been using the AWS Serverless Application Model (AWS SAM) to streamline the development of serverless applications with AWS since late 2018. Besides making it easier to create, build, test, and deploy serverless applications, AWS SAM now further simplifies permission management between serverless components with AWS SAM Connectors.

Connectors allow the builder to focus on the relationships between components without expert knowledge of AWS Identity and Access Management (IAM) or direct creation of custom policies. AWS SAM connector supports AWS Step Functions, Amazon DynamoDB, AWS Lambda, Amazon SQS, Amazon SNS, Amazon API Gateway, Amazon EventBridge and Amazon S3, with more resources planned in the future.

AWS SAM policy templates are an existing feature that helps builders deploy serverless applications with minimally scoped IAM policies. Because there are a finite number of templates, they’re a good fit when a template exists for the services you’re using. Connectors are best for those getting started and who want to focus on modeling the flow of data and events within their applications. Connectors will take the desired relationship model and create the permissions for the relationship to exist and function as intended.

In this blog post, I show you how to speed up serverless development while maintaining secure best practices using AWS SAM connector. Defining a connector in an AWS SAM template requires a source, destination, and a permission (for example, read or write). From this definition, IAM policies with minimal privileges are automatically created by the connector.

Usage

Within an AWS SAM template:

  1. Create serverless resource definitions.
  2. Define a connector.
  3. Add a source and destination ID of the resources to connect.
  4. Define the permissions (read, write) of the connection.

This example creates a Lambda function that requires write access to an Amazon DynamoDB table to keep track of orders created from a website.

AWS Lambda function needing write access to an Amazon DynamoDB table

AWS Lambda function needing write access to an Amazon DynamoDB table

The AWS SAM connector for the resources looks like the following:

LambdaDynamoDbWriteConnector:
  Type: AWS::Serverless::Connector
  Properties:
    Source:
      Id: CreateOrder
    Destination:
      Id: Orders
    Permissions:
      - Write

“LambdaDynamoDbWriteConnector” is the name of the connector, while the “Type” designates it as an AWS SAM connector. “Properties” contains the source and destination logical ID for our serverless resources found within our template. Finally, the “Permissions” property defines a read or write relationship between the components.

This basic example shows how easy it is to define permissions between components. No specific role or policy names are required, and this syntax is consistent across many other serverless components, enforcing standardization.

Example

AWS SAM connectors save you time as your applications grow and connections between serverless components become more complex. Manual creation and management of permissions become error prone and difficult at scale. To highlight the breadth of support, we’ll use an AWS Step Functions state machine to operate with several other serverless components. AWS Step Functions is a serverless orchestration workflow service that integrates natively with other AWS services.

Solution overview

Architectural overview

Architectural overview

This solution implements an image catalog moderation pipeline. Amazon Rekognition checks for inappropriate content, and detects objects and text in an image. It processes valid images and stores metadata in an Amazon DynamoDB table, otherwise emailing a notification for invalid images.

Prerequisites

  1. Git installed
  2. AWS SAM CLI version 1.58.0 or greater installed

Deploying the solution

  1. Clone the repository and navigate to the solution directory:
    git clone https://github.com/aws-samples/step-functions-workflows-collection
    cd step-functions-workflows-collection/moderated-image-catalog
  2. Open the template.yaml file located at step-functions-workflows-collection/moderated-image-catalog and replace the “ImageCatalogStateMachine:” section with the following snippet. Ensure to preserve YAML formatting.
    ImageCatalogStateMachine:
        Type: AWS::Serverless::StateMachine
        Properties:
          Name: moderated-image-catalog-workflow
          DefinitionUri: statemachine/statemachine.asl.json
          DefinitionSubstitutions:
            CatalogTable: !Ref CatalogTable
            ModeratorSNSTopic: !Ref ModeratorSNSTopic
          Policies:
            - RekognitionDetectOnlyPolicy: {}
  3. Within the same template.yaml file, add the following after the ModeratorSNSTopic section and before the Outputs section:
    # Serverless connector permissions
    StepFunctionS3ReadConnector:
      Type: AWS::Serverless::Connector
      Properties:
        Source:
          Id: ImageCatalogStateMachine
        Destination:
          Id: IngestionBucket
        Permissions:
          - Read
    
    StepFunctionDynamoWriteConnector:
      Type: AWS::Serverless::Connector
      Properties:
        Source:
          Id: ImageCatalogStateMachine
        Destination:
          Id: CatalogTable
        Permissions:
          - Write
    
    StepFunctionSNSWriteConnector:
      Type: AWS::Serverless::Connector
      Properties:
        Source:
          Id: ImageCatalogStateMachine
        Destination:
          Id: ModeratorSNSTopic
        Permissions:
          - Write

    You have removed the existing inline policies for the state machine and replaced them with AWS SAM connector definitions, except for the Amazon Rekognition policy. At the time of publishing this blog, connectors do not support Amazon Rekognition. Take some time to review each of the connector’s syntax.

  4. Deploy the application using the following command:
    sam deploy --guided

    Provide a stack name, Region, and moderators’ email address. You can accept defaults for the remaining prompts.

Verifying permissions

Once the deployment has completed, you can verify the correct role and policies.

  1. Navigate to the Step Functions service page within the AWS Management Console and ensure you have the correct Region selected.
  2. Select State machines from the left menu and then the moderated-image-catalog-workflow state machine.
  3. Select the “IAM role ARN” link, which will take you to the IAM role and policies created.

You should see a list of policies that correspond to the AWS SAM connectors in the template.yaml file with the actions and resources.

Permissions list in console

Permissions list in console

You didn’t need to supply the specific policy actions: Use Read or Write as the permission and the service handles the rest. This results in improved readability, standardization, and productivity, while retaining security best practices.

Testing

  1. Upload a test image to the Amazon S3 bucket created during the deployment step. To find the name of the bucket, navigate to the AWS CloudFormation console. Select the CloudFormation stack via the name entered as part of “sam deploy –guided.” Select the Outputs tab and note the IngestionBucket name.
  2. After uploading the image, navigate to the AWS Step Functions console and select the “moderated-image-catalog-workflow” workflow.
  3. Select Start Execution and input an event:
    {
        "bucket": "<S3-bucket-name>",
        "key": "<image-name>.jpeg"
    }
  4. Select Start Execution and observe the execution of the workflow.
  5. Depending on the image selected, it will either add to the image catalog, or send a content moderation email to the email address provided. Find out more about content considered inappropriate by Amazon Rekognition.

Cleanup

To delete any images added to the Amazon S3 bucket, and the resources created by this template, use the following commands from the same project directory.

aws s3 rm s3://< bucket_name_here> --recursive
sam delete

Conclusion

This blog post shows how AWS SAM connectors simplify connecting serverless components. View the Developer Guide to find out more about AWS SAM connectors. For further sample serverless workflows like the one used in this blog, see Serverless Land.

“Пазителката на гората” е в ръцете на ВАС

Post Syndicated from Екип на Биволъ original https://bivol.bg/gabrovo-forests_case.html

сряда 12 октомври 2022


Точно една година след като Биволъ и Валя Ахчиева разследвахме и публикувахме зловещите корупционни схеми за незаконните сечи на вековните фори в Габровския Балкан, случаят отново става обществено актуален. Главна…

AWS Communication Developer Services (CDS) recognized in the 2022 Gartner Market Guide for CPaaS

Post Syndicated from laurcudn original https://aws.amazon.com/blogs/messaging-and-targeting/aws-communication-developer-services-cds-recognized-in-the-2022-gartner-market-guide-for-cpaas/

2022 Gartner Market Guide for CPaaS recognizes AWS Communication Developer Services (CDS)

Every business needs to communicate with customers through channels like email, SMS, notifications, voice, and even video. CPaaS, or Communications Platform as a Service, provers combine those capabilities into a single offering. Communication developers exploring new CPaaS solutions can read the 2022 Gartner Market Guide for CPaaS to learn about AWS Communication Developer Services’ (CDS) capabilities in these channels.

What is CPaaS?

Gartner defines CPaaS, or Communication Platform as a Service, as “cPaaS offer[ing] application leaders a cloud-based, multilayered middleware on which they can develop, run and distribute communications software. The platform offers APIs and integrated development environments that simplify the integration of communications capabilities (for example, voice, messaging and video) into applications, services or business processes.” CPaaS offerings allow companies to integrate communication capabilities into their apps, websites, and technologies in a flexible and customized manner. Companies can choose to add channels and features, like SMS, email, voice, notifications, and more through APIs and SDKs. CPaaS also describes the layers of target audience segmentation, message orchestration and vertical solutions in communication technologies.

2022 Gartner CPaaS Market Guide

The 2022 Gartner CPaaS Market Guide provides key considerations to keep in mind when selecting a communications platform partner to increase customer engagement across channels. Gartner defines the market in three levels, Foundational, Emerging, and Potential Differentiation.

Foundational: Foundational requirements are common communication APIs, and are estimated by Gartner to represent about 85% of current market spend. These fall in to channel-based capabilities like SIP trunking, phone numbers, long and short codes, network connections, SMS, voice, notifications, orchestration, inbound and outbound email, and basic security like 2-factor authorization (2FA) via SMS, email, voice, or other channels. AWS Communication Developer Services (CDS) are built on flexible APIs that support all of the channels listed above. CDS allows builders to use APIs as simple configuration out of the box, or customize APIs through more advanced coding.

Emerging: Emerging offerings include ML capabilities like messaging and voice bots or sentiment analysis, advanced message options, reputation and delivery managers, and campaign managers. AWS Communication Developer Services (CDS) is built using AWS’ leading ML capabilities, and makes it easy for developers to implement advanced machine learning and artificial intelligence features like voice and messaging bots, speech to text, and sentiment analysis. AWS Communication Developer Services (CDS) has orchestrated email and message capabilities. Campaign management is simple through designated campaign and journey features.

Potential differentiation: Gartner identifies potential long-term opportunities for differentiation in areas like vertical solutions and integration with contact centers. CDS has helped many healthcare, financial services, and entertainment customers modernize their customer communications. Our customers work closely with leading partners like Accenture, Local Measure, and many more for seamless integration into current technology and communication stacks. Through CDS’ close ties with the Amazon Connect contact center solution, it’s easy to integrate contact center capabilities with messaging and multichannel communications.

Gartner CPaaS Architecture Diagram

Market Direction and Trends:

Gartner predicts continued growth of the CPaaS category. Gartner reports that most new CPaaS customers enter the category with a specific channel need, such as push notifications, then expands their offerings to include additional channels and functionalities as new needs arise.
Trends include conversational everything and the rise of messaging and voice bots, predictive intelligence for personalization, and local global expansion through Channel Partners.

About AWS Communication Developer Services

AWS Communication Developer Services (CDS) are a set of SDKs and APIs that allow developers to embed customer communications directly into their applications. Developers use AWS CDS to improve communication with their customers across different use cases, including application-to-person (A2P) communications, asynchronous communications, and real-time communications. AWS CDS supports channels like email, SMS, push notifications, chat, audio, video, and voice over the PSTN. Send messages to your customers with the scale of AWS and pay only for what you use.

Use Cases

Alerts + Notifications

Send customers alerts or notifications through email, SMS, push, in-app notifications, or via voice API

Promotional Messages

Send promotions and marketing messages with top email inbox deliverability and segmented messaging

In-App Video

Build your application or website with scalable video technology that can support telehealth, field support, education, and more

Interactive Voice Response (IVR)

Build an IVR system that can support touch-tone, conversation voice bots, and text-to-speech

Want to read the full Market Guide?
Download the 2022 Gartner CPaaS Market Guide for free here.

Fine-tuning Operations at Slice using AWS DevOps Guru

Post Syndicated from Adnan Bilwani original https://aws.amazon.com/blogs/devops/fine-tuning-operations-at-slice-using-aws-devops-guru/

This guest post was authored by Sapan Jain, DevOps Engineer at Slice, and edited by Sobhan Archakam and Adnan Bilwani, at AWS.

Slice empowers over 18,000 independent pizzerias with the modern tools that have grown the major restaurant chains. By uniting these small businesses with specialized technology, marketing, data insights, and shared services, Slice enables them to serve their digitally-minded customers and move away from third-party apps. Using Amazon DevOps Guru, Slice is able to fine-tune their operations to better support these customers.

Serial tech entrepreneur Ilir Sela started Slice to modernize and support his family’s New York City pizzerias. Today, the company partners with restaurants in 3,000 cities and all 50 states, forming the nation’s largest pizza network. For more information, visit slicelife.com.

Slice’s challenge

At Slice, we manage a wide variety of systems, services, and platforms, all with varying levels of complexity. Observability, monitoring, and log aggregation are things we excel at, and they’re always critical for our platform engineering team. However, deriving insights from this data still requires some manual investigation, particularly when dealing with operational anomalies and/or misconfigurations.

To gain automated insights into our services and resources, Slice conducted a proof-of-concept utilizing Amazon DevOps Guru to analyze a small selection of AWS resources. Amazon DevOps Guru identified potential issues in our environment, resulting in actionable insights (ultimately leading to remediation). As a result of this analysis, we enabled Amazon DevOps Guru account-wide, thereby leading to numerous insights into our production environment.

Insights with Amazon DevOps Guru

After we configured Amazon DevOps Guru to begin its account-wide analysis, we left the tool alone to begin the process of collecting and analyzing data. We immediately began seeing some actionable insights for various production AWS resources, some of which are highlighted in the following section:

Amazon DynamoDB Point-in-time recovery

Amazon DynamoDB offers a point-in-time recovery (PITR) feature that provides continuous backups of your DynamoDB data for 35 days to help you protect against accidental write or deletes. If enabled, this lets you restore your respective table to a previous state. Amazon DevOps Guru identified several tables in our environment that had PITR disabled, along with a corresponding Recommendation.

The graphic shows proactive insights for the last 1 month. The one insight shown is 'Dynamo Table Point in Time Recovery not enabled' with a status of OnGoing and a severity of low.

The graphic shows proactive insights for the last 1 month. The one insight shown is 'Dynamo Table Point in Time Recovery not enabled' with a status of OnGoing and a severity of low.

Figure 1. The graphic shows proactive insights for the last 1 month. The one insight shown is ‘Dynamo Table Point in Time Recovery not enabled’ with a status of OnGoing and a severity of low.

Elasticache anomalous evictions

Amazon Elasticache for Redis is used by a handful of our services to cache any relevant application data. Amazon DevOps Guru identified that one of our instances was exhibiting anomalous behavior regarding its cache eviction rate. Essentially, due to the memory pressure of the instance, the eviction rate of cache entries began to increase. DevOps Guru recommended revisiting the sizing of this instance and scaling it vertically or horizontally, where appropriate.

The graph shows the metric: count of ElastiCache evictions plotted for the time period Jul 3, 20:35 to Jul 3, 21:35 UTC. A highlighted section shows that the evictions increased to a peak of 2500 between 21:00 and 21:08. Outside of this interval the evictions are below 500.

The graph shows the metric: count of ElastiCache evictions plotted for the time period Jul 3, 20:35 to Jul 3, 21:35 UTC. A highlighted section shows that the evictions increased to a peak of 2500 between 21:00 and 21:08. Outside of this interval the evictions are below 500.

Figure 2. The graph shows the metric: count of ElastiCache evictions plotted for the time period Jul 3, 20:35 to Jul 3, 21:35 UTC. A highlighted section shows that the evictions increased to a peak of 2500 between 21:00 and 21:08. Outside of this interval the evictions are below 500

AWS Lambda anomalous errors

We manage a few AWS Lambda functions that all serve different purposes. During the beginning of normal work day, we began to see increased error rates for a particular function resulting in an exception being thrown. DevOps Guru was able to detect the increase in error rates and flag them as anomalous. Although retries in this case wouldn’t have solved the problem, it did increase our visibility into the issue (which was also corroborated by our APM platform).

The graph shows the metric: count of AWS/Lambda errors plotted between 11:00 and 13:30 on Jul 6. The sections between the times 11:23 and 12:15 and at 12:37 and 13:13 UTC are highlighted to show the anomalies.

Figure 3. The graph shows the metric: count of AWS/Lambda errors plotted between 11:00 and 13:30 on Jul 6. The sections between the times 11:23 and 12:15 and at 12:37 and 13:13 UTC are highlighted to show the anomalies

Figure 3. The graph shows the metric: count of AWS/Lambda errors plotted between 11:00 and 13:30 on Jul 6. The sections between the times 11:23 and 12:15 UTC are highlighted to show the anomalies

Conclusion

Amazon DevOps Guru integrated into our environment quickly, with no more additional configuration or setup aside from a few button clicks to enable the service. After reviewing several of the proactive insights that DevOps Guru provided, we could formulate plans of action regarding remediation. One specific case example of this is where DevOps Guru flagged several of our Lambda functions for not containing enough subnets. After triaging the finding, we discovered that we were lacking multi-AZ redundancy for several of those functions. As a result, we could implement a change that maximized our availability of those resources.

With the continuous analysis that DevOps Guru performs, we continue to gain new insights into the resources that we utilize and deploy in our environment. This lets us improve operationally while simultaneously maintaining production stability.

About the author:

Adnan Bilwani

Adnan Bilwani is a Sr. Specialist Builders Experience at AWS and part of the AI for DevOps portfolio of services providing fully managed ML-based solutions to enhance your DevOps workflows.

Sobhan Archakam

Sobhan Archakam is a Senior Technical Account Manager at Amazon Web Services. He provides advocacy and guidance to Enterprise Customers to plan, build, deploy and operate solutions at scale using best practices.

Sapan Jain

Sapan Jain is a DevOps Engineer at Slice. He provides support in all facets of DevOps, and has an interest in performance, observability, automation, and troubleshooting.

Chaos Engineering in the cloud

Post Syndicated from Laurent Domb original https://aws.amazon.com/blogs/architecture/chaos-engineering-in-the-cloud/

For many years, Chaos Engineering was viewed as a mechanism to help surface the “known-unknowns” (things that we are aware of, but do not fully understand) in our environments or “unknown-unknowns” (things we are neither aware of, nor fully understand).

Using Chaos Engineering, chaos experiments have been conducted on infrastructure, applications, and business processes that identified weaknesses and prevented outages for many organizations; yet, while Chaos Engineering found a home across various industries, like Financial Services, Media and Entertainment, Healthcare, Telecommunication, Hospitality and others, it has been slow in its adoption.

A different perspective on Chaos Engineering

For the last decade, Chaos Engineering had the reputation of being a mechanism to “purposely break things in production”, which stopped many companies from adopting it. The ultimate goal of Chaos Engineering is not about breaking production systems.

Chaos Engineering offers a mechanism that allows your teams to gain deep insights into your workloads by executing controlled chaos experiments that are based on a real-world hypothesis. These experiments have a clear scope that defines the expected impact to the workload and includes a rollback mechanism where there is availability or recovery processes in place to mitigate the failure.

Chaos Engineering drives operational readiness and best practices around how your workloads should be observed, designed, and implemented to survive component failure with minimal to no impact to the end user. Therefore, Chaos Engineering can lead to improved resilience and observability, ultimately improving the end-user’s experience and increasing organizations’ uptime.

The Shared Responsibility Model for resilience

When you build a workload in the Amazon Web Services (AWS) Cloud, we (at AWS) are responsible for the “resilience of the cloud”; this means, we are responsible for the resilience of the services and infrastructure offered on the AWS Cloud. This infrastructure is composed of the hardware, software, networking, and facilities that run AWS Cloud services.

Your responsibility as a customer is the “resilience in the cloud”, meaning your responsibility is determined by the AWS Cloud services that you consume. This determines the amount of configuration work, recovery mechanisms, operational tooling, and observability logic that are needed to make the workload resilient (Figure 1).

AWS Shared Responsibility Model for resilience

Figure 1. AWS Shared Responsibility Model for resilience

Resilience in the cloud

Separation of duties creates interesting challenges in resilience:

  • How can you build workloads that will mitigate enough failure modes to meet your resilience objective, if you are not responsible for operating the underlying services that you rely on?
  • How are your workloads performing if one or more AWS services are impaired, a network disruption occurs, or a natural disaster strikes?

While there is distinct guidance on these questions in the AWS Well-Architected Framework’s Reliability Pillar, one question still remains: can your team/organization simulate a controlled event in pre-production or production that would give them confidence that the observability tooling, incident response, and recovery mechanisms will protect the workload from a disruption with minimal to no customer impact?

If you have been operating in a regulated environment, like the Financial Services industry, Healthcare, or the Federal Government, you can cite that the quarterly/yearly disaster-recovery (DR) exercises and your business continuity plan help with such simulations.

Planned DR exercises have a clear structure and scope: employees know that they have to be ready on a certain date and time, and they will execute the runbooks and playbooks that are hopefully up-to-date on that day. In essence, this validates a failover of a known-state. While DR exercises can provide a high level of confidence that operations will continue in a secondary region without being dependent on any services in the primary site, these exercises do not provide the ability to detect and mitigate the different types of failure modes that may be encountered in a real-world scenario.

Disaster recovery and failure in the real world

For example, in 2012, Hurricane Sandy took down critical infrastructure services when it struck the Northeast US, resulting in power and telecommunication outages on the East Coast. Many companies’ business continuity plans did not account for staff living in zones impacted by natural disaster. Clearly, these individuals would/will not be able to assist during a real-life DR event.

Executing a DR plan quarterly or yearly may not be enough to prepare an organization for real-world events: they can come without notice and in many different flavors, like faulty deployments or configurations, hardware failures, data and state corruption, the inability to connect to a third-party provider, or natural disasters. Most may not require the execution of your DR plan but, instead, challenge observability, high-availability strategy, and incident-response processes.

Chaos Engineering real-world events

How can you prepare for unknown events? Chaos Engineering provides value to your organization by allowing it to get ahead of unexpected disruptions by continuously injecting controlled, real-world disruptions as a scheduled job, in your software development lifecycle, and/or continuous integration and continuous delivery (CI/CD) pipelines at the cloud-provider, infrastructure, workload-component, and process level.

Consider Chaos Engineering a resilience guardian: it gives the confidence, control, and rigor needed to ensure the experiment does not impact the customer, or quickly stop the experiment if it does. Using these mechanisms, your teams can learn from faults in a controlled environment and observe, measure, and improve the workloads’ resilience, plus validate the logs, metrics, and that alarms are in place to notify operators within a predetermined timeframe.

Finding and amending deficiencies

When incorporating Chaos Engineering into your day-to-day operations, workload deficiencies will surface and need to be addressed. Chaos Engineering experiments run in production that surface unexpected behavior will only minimally impact customers, if at all, compared with real-world, unexpected disruptions. Controlled experiments are executed with a clear scope of impact. Experts are present to observe the experiment and automated rollback mechanisms executed. In the worst-case scenario, these experts will get hands-on and remediate the disruption on the spot.

If an experiment surfaces unknown behavior, there is a Correction of Error (COE) analysis. The COE is a process for improving quality by documenting and addressing issues, focusing on identifying and amending root causes.

Using the COE, we can explore the customer interaction with the workload and understand the customer impact. This can provide further insights on what happened during the event and give way to deep dives into the component that caused failure. If the fault is not identifiable, more observability should be added to the workload.

Additionally, incident-response mechanisms are reviewed to validate that a disruption was detected, key stakeholders are notified, and escalations processes begin in the predetermined timeframe. Prioritizing new findings and, based on impact, adding them to the issue back log, and addressing known risks are the keys to successful Chaos Engineering and mitigating future impact to the workload.

Chaos Engineering on AWS

To get started with Chaos Engineering on AWS, AWS Fault Injection Simulator (AWS FIS) was launched in early 2021. AWS FIS is a fully managed service used to run fault injection experiments that simulate real-world AWS faults. This service can be used as part of your CI/CD pipeline or otherwise outside the pipeline via cron jobs.

As demonstrated in Figure 2, AWS FIS can inject faults sequentially or simultaneously, introducing faults across different types of resources, Amazon Elastic Compute Cloud, Amazon Elastic Container Service, Amazon Elastic Kubernetes Service, and Amazon Relational Database Service. Some of these faults include:

  • Termination of resources
  • Forcing failovers
  • Stressing CPU or memory
  • Throttling
  • Latency
  • Packet loss

Since it is integrated with Amazon CloudWatch alarms, you can setup stop conditions as guardrails to rollback an experiment if it causes unexpected impact.

AWS Fault Injection Simulator integrates with AWS resources

Figure 2. AWS Fault Injection Simulator integrates with AWS resources

As Chaos Engineering should provide as much flexibility as possible when it comes to fault injection, AWS FIS integrates with external tools, such as Chaos Toolkit and Chaos Mesh, to expand the scope of failures that can be injected to your workload.

Conclusion

Chaos Engineering is not about breaking systems but rather creating resilient workloads that can survive real-world events with minimal-to-no customer impact, by finding the “known-unknowns” and/or “unknown-unknowns” that can cause such events. Additionally, these mechanisms help improve operational excellence and resilience through developer and observability best practices, allowing you to catch deficiencies before they escalate into large-scale events and therefore improve the customers experience.

If you’d like to know more, please join us at AWS re:Invent 2022, where we will present multiple sessions on Chaos Engineering. Also, explore Chaos Engineering Stories!

Cloudflare DDoS threat report 2022 Q3

Post Syndicated from Omer Yoachimik original https://blog.cloudflare.com/cloudflare-ddos-threat-report-2022-q3/

Cloudflare DDoS threat report 2022 Q3

Cloudflare DDoS threat report 2022 Q3

Welcome to our DDoS Threat Report for the third quarter of 2022. This report includes insights and trends about the DDoS threat landscape – as observed across Cloudflare’s global network.

Multi-terabit strong DDoS attacks have become increasingly frequent. In Q3, Cloudflare automatically detected and mitigated multiple attacks that exceeded 1 Tbps. The largest attack was a 2.5 Tbps DDoS attack launched by a Mirai botnet variant, aimed at the Minecraft server, Wynncraft. This is the largest attack we’ve ever seen from the bitrate perspective.

It was a multi-vector attack consisting of UDP and TCP floods. However, Wynncraft, a massively multiplayer online role-playing game Minecraft server where hundreds and thousands of users can play on the same server, didn’t even notice the attack, since Cloudflare filtered it out for them.

Cloudflare DDoS threat report 2022 Q3
The 2.5 Tbps DDoS attack that targeted Wynncraft — launched by Mirai

Overall this quarter, we’ve seen:

  • An increase in DDoS attacks compared to last year.
  • Longer-lasting volumetric attacks, a spike in attacks generated by the Mirai botnet and its variants.
  • Surges in attacks targeting Taiwan and Japan.

Application-layer DDoS attacks

  • HTTP DDoS attacks increased by 111% YoY, but decreased by 10% QoQ.
  • HTTP DDoS attacks targeting Taiwan increased by 200% QoQ; attacks targeting Japan increased by 105% QoQ.
  • Reports of Ransom DDoS attacks increased by 67% YoY and 15% QoQ.

Network-layer DDoS attacks

  • L3/4 DDoS attacks increased by 97% YoY and 24% QoQ.
  • L3/4 DDoS attacks by Mirai botnets increased by 405% QoQ.
  • The Gaming / Gambling industry was the most targeted by L3/4 DDoS attacks including a massive 2.5 Tbps DDoS attack.

This report is based on DDoS attacks that were automatically detected and mitigated by Cloudflare’s DDoS Protection systems. To learn more about how it works, check out this deep-dive blog post.

Ransom attacks

Ransom DDoS attacks are attacks where the attacker demands a ransom payment, usually in the form of Bitcoin, to stop/avoid the attack. In Q3, 15% of Cloudflare customers that responded to our survey reported being targeted by HTTP DDoS attacks accompanied by a threat or a ransom note. This represents a 15% increase QoQ and 67% increase YoY of reported ransom DDoS attacks.

Cloudflare DDoS threat report 2022 Q3
Distribution of Ransom DDoS attacks by quarter

Diving into Q3, we can see that since June 2022, there was a steady decline in reports of ransom attacks. However, in September, the reports of ransom attacks spiked again. In the month of September, almost one out of every four respondents reported receiving a ransom DDoS attack or threat — the highest month in 2022 so far.

Cloudflare DDoS threat report 2022 Q3
Distribution of Ransom DDoS attacks by month

How we calculate Ransom DDoS attack trends
Our systems constantly analyze traffic and automatically apply mitigation when DDoS attacks are detected. Each DDoS’d customer is prompted with an automated survey to help us better understand the nature of the attack and the success of the mitigation. For over two years, Cloudflare has been surveying attacked customers. One of the questions in the survey asks the respondents if they received a threat or a ransom note demanding payment in exchange to stop the DDoS attack. Over the past year, on average, we collected 174 responses per quarter. The responses of this survey are used to calculate the percentage of Ransom DDoS attacks.

Application-layer DDoS attacks

Application-layer DDoS attacks, specifically HTTP DDoS attacks, are attacks that usually aim to disrupt a web server by making it unable to process legitimate user requests. If a server is bombarded with more requests than it can process, the server will drop legitimate requests and – in some cases – crash, resulting in degraded performance or an outage for legitimate users.

Cloudflare DDoS threat report 2022 Q3

When we look at the graph below, we can see a clear trend of approximately 10% decrease in attacks each quarter since 2022 Q1. However, despite the downward trend, when comparing Q3 of 2022 to Q3 of 2021, we can see that HTTP DDoS attacks still increased by 111% YoY.

Cloudflare DDoS threat report 2022 Q3
Distribution of HTTP DDoS attacks by quarter

When we dive into the months of the quarter, attacks in September and August were fairly evenly distributed; 36% and 35% respectively. In July, the amount of attacks was the lowest for the quarter (29%).

Cloudflare DDoS threat report 2022 Q3
Distribution of HTTP DDoS attacks by month in 2022 Q3

Application-layer DDoS attacks by industry

By bucketing the attacks by our customers’ industry of operation, we can see that HTTP applications operated by Internet companies were the most targeted in Q3. Attacks on the Internet industry increased by 131% QoQ and 300% YoY.

The second most attacked industry was the Telecommunications industry with an increase of 93% QoQ and 2,317% (!) YoY. In third place was the Gaming / Gambling industry with a more conservative increase of 17% QoQ and 36% YoY.

Cloudflare DDoS threat report 2022 Q3
Top industries targeted by HTTP DDoS attacks in 2022 Q3

Application-layer DDoS attacks by target country

Bucketing attacks by our customers’ billing address gives us an understanding of which countries are more attacked. HTTP applications operated by US companies were the most targeted in Q3. US-based websites saw an increase of 60% QoQ and 105% YoY in attacks targeting them. After the US, was China with a 332% increase QoQ and an 800% increase YoY.

Looking at Ukraine, we can see that attacks targeting Ukrainian websites increased by 67% QoQ but decreased by 50% YoY. Furthermore, attacks targeting Russian websites increased by 31% QoQ and 2,400% (!) YoY.

In East Asia, we can see that attacks targeting Taiwanese companies increased by 200% QoQ and 60% YoY, and attacks targeting Japanese companies increased by 105% QoQ.

Cloudflare DDoS threat report 2022 Q3
Top countries targeted by HTTP DDoS attacks in 2022 Q3

When we zoom in on specific countries, we can identify the below trends that may reveal interesting insights regarding the war in Ukraine and geopolitical events in East Asia:

In Ukraine, we see a surprising change in the attacked industries. Over the past two quarters, Broadcasting, Online Media and Publishing companies were targeted the most in what appeared to be an attempt to silence information and make it unavailable to civilians. However, this quarter, those industries dropped out of the top 10 list. Instead, the Marketing & Advertising industry took the lead (40%), followed by Education companies (20%), and Government Administration (8%).

In Russia, attacks on the Banking, Financial Services and Insurance (BFSI) industry continue to persist (25%). Be that as it may, attacks on the BFSI sector still decreased by 44% QoQ. In second place is the Events Services industry (20%), followed by Cryptocurrency (16%), Broadcast Media (13%), and Retail (11%). A significant portion of the attack traffic came from Germany-based IP addresses, and the rest were globally distributed.

In Taiwan, the two most attacked industries were Online Media (50%) and Internet (23%). Attacks to those industries were globally distributed indicating the usage of botnets.

In Japan, the most attacked industry was Internet/Media & Internet (52%), Business Services (12%), and Government – National (11%).

Application-layer DDoS attack traffic by source country

Before digging into specific source country metrics, it is important to note that while country of origin is interesting, it is not necessarily indicative of where the attacker is located. Oftentimes with DDoS attacks, they are launched remotely, and attackers will go to great lengths to hide their actual location in an attempt to avoid being caught. If anything, it is indicative of where botnet nodes are located. With that being said, by mapping the attacking IP address to their location, we can understand where attack traffic is coming from.

After two consecutive quarters, China replaced the US as the main source of HTTP DDoS attack traffic. In Q3, China was the largest source of HTTP DDoS attack traffic. Attack traffic from China-registered IP addresses increased by 29% YoY and 19% QoQ. Following China was India as the second-largest source of HTTP DDoS attack traffic — an increase of 61% YoY. After India, the main sources were the US and Brazil.

Looking at Ukraine, we can see that this quarter there was a drop in attack traffic originating from Ukrainian and Russian IP addresses — a decrease of 29% and 11% QoQ, respectively. However, YoY, attack traffic from within those countries still increased by 47% and 18%, respectively.

Another interesting data point is that attack traffic originating from Japanese IP addresses increased by 130% YoY.

Cloudflare DDoS threat report 2022 Q3
Top source countries of HTTP DDoS attacks in 2022 Q3

Network-layer DDoS attacks

While application-layer attacks target the application (Layer 7 of the OSI model) running the service that end users are trying to access (HTTP/S in our case), network-layer attacks aim to overwhelm network infrastructure (such as in-line routers and servers) and the Internet link itself.

Cloudflare DDoS threat report 2022 Q3

In Q3, we saw a large surge in L3/4 DDoS attacks — an increase of 97% YoY and a 24% QoQ. Furthermore, when we look at the graph we can see a clear trend, over the past three quarters, of an increase in attacks.

Cloudflare DDoS threat report 2022 Q3
Distribution of L3/4 DDoS attacks by quarter

Drilling down into the quarter, it’s apparent that the attacks were, for the most part, evenly distributed throughout the quarter — with a slightly larger share for July.

Cloudflare DDoS threat report 2022 Q3
Distribution of L3/4 DDoS attacks by month in 2022 Q3

Network-layer DDoS attacks by Industry

The Gaming / Gambling industry was hit by the most L3/4 DDoS attacks in Q3. Almost one out of every five bytes Cloudflare ingested towards Gaming / Gambling networks was part of a DDoS attack. This represents a whopping 381% increase QoQ.

The second most targeted industry was Telecommunications — almost 6% of bytes towards Telecommunications networks were part of DDoS attacks. This represents a 58% drop from the previous quarter where Telecommunications was the top most attacked industry by L3/4 DDoS attacks.

Following were the Information Technology and Services industry along with the Software industry. Both saw significant growth in attacks — 89% and 150% QoQ, respectively.

Cloudflare DDoS threat report 2022 Q3
Top industries targeted by L3/4 DDoS attacks in 2022 Q3

Network-layer DDoS attacks by target country

In Q3, Singapore-based companies saw the most L3/4 DDoS attacks — over 15% of all bytes to their networks were associated with a DDoS attack. This represents a dramatic 1,175% increase QoQ.

The US comes in second after a 45% decrease QoQ in attack traffic targeting US networks. In third, China, with a 62% QoQ increase. Attacks on Taiwan companies also increased by 200% QoQ.

Cloudflare DDoS threat report 2022 Q3
Top countries targeted by L3/4 DDoS attacks in 2022 Q3

Network-layer DDoS attacks by ingress country

In Q3, Cloudflare’s data centers in Azerbaijan saw the largest percentage of attack traffic. More than a third of all packets ingested there were part of a L3/4 DDoS attack. This represents a 44% increase QoQ and a huge 59-fold increase YoY.

Similarly, our data centers in Tunisia saw a dramatic increase in attack packets – 173x the amount in the previous year. Zimbabwe and Germany also saw significant increases in attacks.

Zooming into East Asia, we can see that our data centers in Taiwan saw an increase of attacks — 207% QoQ and 1,989% YoY. We saw similar numbers in Japan where attacks increased by 278% QoQ and 1,921% YoY.

Looking at Ukraine, we actually see a dip in the amount of attack packets we observed in our Ukraine-based and Russia-based data centers — 49% and 16% QoQ, respectively.

Cloudflare DDoS threat report 2022 Q3
Top Cloudflare data center locations with the highest percentage of DDoS attack traffic in 2022 Q3

Attack vectors & Emerging threats

An attack vector is the method used to launch the attack or the method of attempting to achieve denial-of-service. With a combined share of 71%, SYN floods and DNS attacks remain the most popular DDoS attack vectors in Q3.

Cloudflare DDoS threat report 2022 Q3
Top attack vectors in 2022 Q3

Last quarter, we saw a resurgence of attacks abusing the CHARGEN protocol, the Ubiquity Discovery Protocol, and Memcached reflection attacks. While the growth in Memcached DDoS attacks also slightly grew (48%), this quarter, there was a more dramatic increase in attacks abusing the BitTorrent protocol (1,221%), as well as attacks launched by the Mirai botnet and its variants.

BitTorrent DDoS attacks increased by 1,221% QoQ
The BitTorrent protocol is a communication protocol that’s used for peer to peer file sharing. To help the BitTorrent clients find and download the files efficiently, BitTorrent clients may use BitTorrent Trackers or Distributed Hash Tables (DHT) to identify the peers that are seeding the desired file. This concept can be abused to launch DDoS attacks. A malicious actor can spoof the victim’s IP address as a seeder IP address within Trackers and DHT systems. Then clients would request the files from those IPs. Given a sufficient number of clients requesting the file, it can flood the victim with more traffic than it can handle.

Mirai DDoS attacks increased by 405% QoQ
Mirai is malware that infects smart devices that run on ARC processors, turning them into a network of bots that can be used to launch DDoS attacks. This processor runs a stripped-down version of the Linux operating system. If the default username-and-password combo is not changed, Mirai is able to log in to the device, infect it, and take over. The botnet operator can instruct the botnet to launch a flood of UDP packets at the victim’s IP address to bombard them.

Cloudflare DDoS threat report 2022 Q3
Top emerging threats in 2022 Q3

Network-layer DDoS attacks by Attack Rates & Duration

While Terabit-strong attacks are becoming more frequent, they are still the outliers. The majority of attacks are tiny (in terms of Cloudflare scale). Over 95% of attacks peaked below 50,000 packets per second (pps) and over 97% below 500 Megabits per second (Mbps). We call this “cyber vandalism”.

What is cyber vandalism? As opposed to “classic” vandalism where the purpose is to cause deliberate destruction of or damage to public or private physical property — such as graffiti on the side of a building — in the cyberworld, cyber vandalism is the act of causing deliberate damage to Internet properties. Today the source codes for various botnets are available online and there are a number of free tools that can be used to launch a flood of packets. By directing those tools to Internet properties, any script-kid can use those tools to launch attacks against their school during exam season or any other website they desire to take down or disrupt. This is as opposed to organized crime, Advanced Persistent Threat actors, and state-level actors that can launch much larger and sophisticated attacks.

Cloudflare DDoS threat report 2022 Q3
Distribution of DDoS attacks by bitrate in 2022 Q3

Similarly, most of the attacks are very short and end within 20 minutes (94%). This quarter we did see an increase of 9% in attacks of 1-3 hours, and a 3% increase in attacks over 3 hours — but those are still the outliers.

Cloudflare DDoS threat report 2022 Q3
QoQ change in the duration of DDoS attacks in 2022 Q3

Even with the largest attacks, such as the 2.5 Tbps attack we mitigated earlier this quarter, and the 26M request per second attack we mitigated back in the summer, the peak of the attacks were short-lived. The entire 2.5 Tbps attack lasted about 2 minutes, and the peak of the 26M rps attack only 15 seconds. This emphasizes the need for automated, always-on solutions. Security teams can’t respond quick enough. By the time the security engineer looks at the PagerDuty notification on their phone, the attack has subsided.

Summary

Attacks may be initiated by humans, but they are executed by bots — and to play to win, you must fight bots with bots. Detection and mitigation must be automated as much as possible, because relying solely on humans puts defenders at a disadvantage. Cloudflare’s automated systems constantly detect and mitigate DDoS attacks for our customers, so they don’t have to.

Over the years, it has become easier, cheaper, and more accessible for attackers and attackers-for-hire to launch DDoS attacks. But as easy as it has become for the attackers, we want to make sure that it is even easier – and free – for defenders of organizations of all sizes to protect themselves against DDoS attacks of all types. We’ve been providing unmetered and unlimited DDoS protection for free to all of our customers since 2017 — when we pioneered the concept.

Cloudflare’s mission is to help build a better Internet. A better Internet is one that is more secure, faster, and reliable for everyone – even in the face of DDoS attacks.

Real-Time Risk Mitigation in Google Cloud Platform

Post Syndicated from Ben Austin original https://blog.rapid7.com/2022/10/12/real-time-risk-mitigation-in-google-cloud-platform/

Real-Time Risk Mitigation in Google Cloud Platform

With Google Cloud Next happening this week, there’s been some recent water cooler talk – okay, informal, ad hoc Zoom calls – where discussions about what makes Google Cloud Platform (GCP) unique when it comes to security. A few specific differences have popped up here and there (default data encryption, the way IAM is handled, etc.), but, generally speaking, many of the principles that apply to all other cloud providers apply to GCP environments.

For one, due to the speed and scale of these environments, it’s simultaneously very difficult and extremely critical to maintain an up-to-date inventory of the state of all resources in your environment. This means constantly monitoring your environment for resources being created, deleted, or modified in as close to real time as possible.

And in an effort to avoid ambiguity or hide behind marketing buzz terms, when I’m referring to “real time” here, I’m talking about sub 5-minute intervals based on activity happening in the environment. This is not to be confused with “near real time” approaches some vendors tout, which, in reality, still only pulls in data once or twice a day based on a static schedule.

In GCP, like in AWS, Azure, and all other cloud environments, simply getting a snapshot once a day to identify misconfigurations, vulnerabilities, or suspicious behaviors like you might with an on-prem data center just isn’t a scalable strategy. It’s a common cliche, but the ephemeral nature and rate of change in public cloud environments makes that kind of scanning strategy extremely ineffective when it comes to monitoring, analyzing, and eliminating actual risk in a cloud environment.

Let me lay out a couple examples where this kind of real-time monitoring can provide significant, potentially necessary, value to security teams working to make their cloud risk management programs more effective.

Identification of high-risk resources

As an example, say a developer is in a GCP project associated with your company’s revenue-generating application and they spin up a Cloud Storage instance that is, whether mistakenly or maliciously, open to the public internet.

If your security team is reliant on a scan to happen 12 hours later to get visibility into this activity, your organization will constantly be left open to significant risk. Take away the hyperbole here and assume it’s a much smaller risk or compliance violation. Even in that situation, your team is still working from behind and, presumably, almost always facing some level of stress about what issues are out there in the environment that they won’t know about for another 12-18 hours.

Worst of all, with this type of scanning you’re generally just getting a point-in-time snapshot of the environment and usually don’t know who made the change or how long ago it happened. This makes it much more difficult and time consuming for your team to actually assess the risk or get their hands on the right information to make an informed decision about how the situation should be addressed.

When a team is working with real-time data, however, they can be much more diligent and confident that they’re prioritizing the right issues at any given moment, with all the necessary context about who made the change and when it occurred. This not only helps teams stay ahead of issues and reduce the risk of a breach in their environment, but also helps keep individuals and teams feeling positive about the impact that the program is having on the organization.

Delayed remediation workflows

Building off of the previous example, it’s not only that teams can’t respond to risk they haven’t been notified of, it’s also that any automated response workflows your team may have built out to be more efficient are significantly less effective when they’re triggered by hours-old data. A 12-hour delay in an automation workflow all but eliminates the value of the automation itself, and it can actually cause headaches and confusion that detract from your team’s efficiency, rather than improving it (more on this in the next example).

In contrast, if you’re able to detect risky changes to your environment as they happen, you can automatically respond to that issue as it happens. In the case of this all being a mistake caused by a developer working a little too quickly, you’re able to automatically notify them of their error within a matter of minutes, likely while they’re still working within that project. Giving your development team this kind of feedback in the moment, rather than forcing them to context switch and go back into the project to fix the error a day later, is an excellent way to build stronger relationships and rapport with that team.

In the more rare case that this is indeed a malicious internal or external actor, enabling your automated remediation workflows to kick into gear within seconds and potentially stop the behavior could mean the difference between a minor incident and a breach requiring public disclosure from your organization.

Minimizing false positives and cross-team friction

Speaking of relationships with the development team (sorry, #DevSecOps), I can almost guarantee that working with data from scans or snapshots that occur every 12 or 24 hours in your cloud will cause friction between your two teams. Whether it’s tied to manual identification of risky resources or automated workflows notifying them of a non-compliant asset, working with stale data will inevitably lead to false positives that will both annoy and distract your already overburdened development team.

Take the example highlighted above, but instead, let’s say the developer actually spun up that Cloud Storage instance for a short amount of time in a dev instance with no actual customer data as part of a testing exercise. By the time your team gets visibility into this and either reaches out manually or has some automated notification sent to the developer, that instance could have already been deleted for hours. Now your team is looking at one set of old data and seeing an issue, meanwhile the developer is insisting that the storage container doesn’t even exist anymore. As mentioned above, this is going to cause headaches and frustration for both parties, and cause your team to lose credibility with the dev team.

At this point, you can probably guess where this is going next. With real-time monitoring in your environment this situation can be avoided altogether because your team will be looking at the same up-to-date information, and your team will be able to see that the storage container was shut down or removed from the project rather than spending time chasing down a false positive.

Earlier this month we released event-driven harvesting for GCP in InsightCloudSec. This agentless, real-time monitoring helps your security team achieve every one of the benefits outlined above while also avoiding API rate limiting. In addition, we’ve recently added GCP CIS Benchmarks v1.3.0, added GCP threat findings into our console, and added support for Google Directory to give visibility into IAM factors such as user last login, MFA status, group association and more.

If you want to learn more about how Rapid7 can help you secure Google Cloud Platform, or any other public cloud environment, sign up for our live bi-weekly demo of InsightCloudSec.

Recovering Passwords by Measuring Residual Heat

Post Syndicated from Bruce Schneier original https://www.schneier.com/blog/archives/2022/10/recovering-passwords-by-measuring-residual-heat.html

Researchers have used thermal cameras and ML guessing techniques to recover passwords from measuring the residual heat left by fingers on keyboards. From the abstract:

We detail the implementation of ThermoSecure and make a dataset of 1,500 thermal images of keyboards with heat traces resulting from input publicly available. Our first study shows that ThermoSecure successfully attacks 6-symbol, 8-symbol, 12-symbol, and 16-symbol passwords with an average accuracy of 92%, 80%, 71%, and 55% respectively, and even higher accuracy when thermal images are taken within 30 seconds. We found that typing behavior significantly impacts vulnerability to thermal attacks, where hunt-and-peck typists are more vulnerable than fast typists (92% vs 83% thermal attack success if performed within 30 seconds). The second study showed that the keycaps material has a statistically significant effect on the effectiveness of thermal attacks: ABS keycaps retain the thermal trace of users presses for a longer period of time, making them more vulnerable to thermal attacks, with a 52% average attack accuracy compared to 14% for keyboards with PBT keycaps.

“ABS” is Acrylonitrile Butadiene Styrene, which some keys are made of. Others are made of Polybutylene Terephthalate (PBT). PBT keys are less vulnerable.

But, honestly, if someone can train a camera at your keyboard, you have bigger problems.

News article.

The collective thoughts of the interwebz