Post Syndicated from Michael Hume original https://aws.amazon.com/blogs/compute/serverless-generative-ai-architectural-patterns/
Organizations of all sizes and types are harnessing large language models (LLMs) and foundation models (FMs) to build generative AI applications that deliver new customer and employee experiences. Serverless computing offers the perfect solution, empowering organizations to focus on innovation, flexibility, and cost-efficiency without the complexity of infrastructure management. Organizations transitioning their experimental implementations into production-ready applications can implement proven, scalable, and maintainable software design patterns as the cornerstone of their architecture.
This two-part series explores the different architectural patterns, best practices, code implementations, and design considerations essential for successfully integrating generative AI solutions into both new and existing applications. In this post, we focus on patterns applicable for architecting real-time generative AI applications. Part 2 addresses patterns for building batch-oriented generative AI implementations using serverless services.
Separation of concerns
A fundamental principle in building robust generative AI applications is the separation of concerns, which involves dividing the application stack into three distinct components: frontend, middleware, and backend service layers. This architectural approach (as shown in the following diagram) offers multiple benefits, including reduced complexity, enhanced maintainability, and the ability to scale components independently. By implementing this separation, you can develop cross-platform solutions while maintaining the flexibility to evolve each component according to specific requirements.
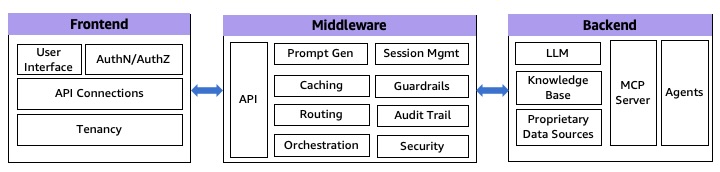
Fig 1: 3 Tier generative AI Architecture
Although these layers are merely extensions to the traditional software stack, they do perform some specific tasks in generative AI applications.
Frontend layer
The frontend layer serves as the primary interface between end-users and the generative AI application. For organizations integrating generative AI into existing applications, this layer might already be established. The frontend handles critical responsibilities including user authentication, UI/UX presentation, and API communication. AWS provides a robust suite of serverless services to support frontend implementations, including AWS Amplify for full-stack development, Amazon CloudFront paired with Amazon Simple Storage Service (Amazon S3) for content delivery, and container services like Amazon Elastic Container Service (Amazon ECS) and Amazon Elastic Kubernetes Service (Amazon EKS) for application hosting. Specialized services such as Amazon Lex can enhance the user experience through conversational interfaces and intelligent search capabilities for building interactive chatbots.
Middleware layer
This represents the integration layer, comprising of three essential sub-layers that manage different aspects of the application logic and data flow:
- API layer – This layer exposes backend services through various protocols, including REST, GraphQL, and WebSockets. It handles essential functions such as input validation, traffic management, and CORS support. The API layer also implements authorization and access control mechanisms, manages API versioning, and provides monitoring capabilities. It provides secure and efficient communication between the frontend and backend components while maintaining scalability and reliability. AWS managed services like Amazon API Gateway and AWS AppSync can help create an AI gateway to simplify access and API management.
- Prompt engineering layer – This layer encapsulates the business logic necessary for interacting with LLMs. It handles dynamic prompt generation, model selection, prompt caching, model routing, guardrails, and security enforcement. This layer implements token and context window optimization, sensitive information filtering, output content moderation, error handling, retry logic, and audit trails. By centralizing these functions, you can maintain consistent prompt strategies, enforce security, and optimize model interactions across applications. You can use Amazon DynamoDB to store prompt templates and configurations, and use Amazon Bedrock Guardrails, Amazon Bedrock prompt caching, and Amazon Bedrock Intelligent Prompt Routing to implement responsible AI safeguards, reuse of prompt prefixes, and dynamic routing, respectively.
- Orchestration layer – This layer manages complex interactions between various system components. It coordinates external API calls and agent calls, manages vector database queries, stores user sessions and conversation histories, and maintains conversation context across multiple LLM interactions. Frameworks like LangChain and LlamaIndex are commonly used to simplify these operations and provide standardized approaches to common generative AI tasks. AWS Step Functions has direct integrations with over 220 AWS services, including Amazon Bedrock, enabling you to construct intricate generative AI workflows without incurring additional computational resources. Additionally, with Amazon Bedrock Flows, you can create complex, flexible, multi-prompt workflows to evaluate, compare, and version.
Backend services, agents, and private data sources
The backend layer forms the core of generative AI response generation powered by LLMs. It consists of hosting and invoking the LLM model, agents, knowledge bases, or a Model Context Protocol (MCP) server. Amazon Bedrock, Amazon SageMaker JumpStart, and Amazon SageMaker offer a variety of high-performing FMs from leading AI companies or the option to bring your own. You can securely run an MCP server using a containerized architecture, as described in Guidance for Deploying Model Context Protocol Servers on AWS.
Private data sources complement LLMs by providing authoritative proprietary knowledge outside of its training data. For Retrieval Augmented Generation (RAG) implementations, Amazon Kendra, Amazon OpenSearch Serverless, and Amazon Aurora PostgreSQL-Compatible Edition with the pgVector extension provide robust, scalable vector database options. For a deeper dive, please read The role of vector databases in generative AI applications on available AWS service options to store embeddings in a purpose built vector database.
Real-time applications process and deliver responses with minimal latency, enhancing the user experience and facilitating faster decision-making. In the following sections, we explore some architectural patterns that can be used to implement real-time generative AI applications.
Pattern 1: Synchronous request response
In this pattern, responses are generated and immediately delivered, while the client blocks/waits for response. Although this is simple to implement, has a predictable flow, and offers strong consistency, it suffers from blocking operations, high latency, and potential timeouts. When implemented for generative AI applications, this pattern is particularly suited for certain modalities like video or image generations. For fast LLM interactions, it can handle multiple concurrent requests while maintaining consistent performance under varying loads. This model can be implemented through several architectural approaches.
REST APIs
You can use RESTful APIs to communicate with your backend over HTTP requests. You can use REST or HTTP APIs in API Gateway or an Application Load Balancer for path-based routing to the middleware. API Gateway offers additional features like token-based authentication, custom authorizers, resource-based permissions, request/response mapping and transformation, versioning, and rate-limiting. However, with REST/HTTP APIs in API Gateway, the response must be generated within 29 seconds to meet the default integration timeout. You can extend this default limit to 5 minutes for REST APIs with a possible reduction in your AWS Region-level throttle quota for your account. For an example implementation, refer to Interact with Bedrock models from a Lambda function fronted with an API Gateway. The following diagram illustrates this architecture.
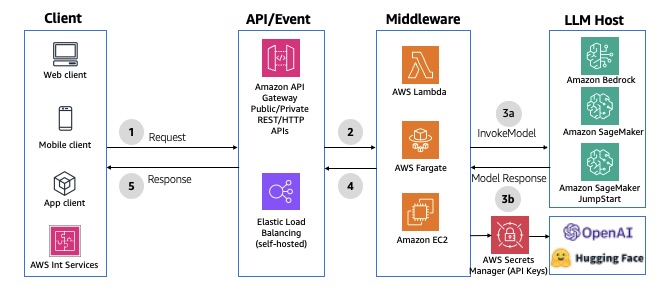
Fig 2: Synchronous REST/HTTP APIs using Amazon API Gateway
GraphQL HTTP APIs
You can use AWS AppSync as the API layer to take advantage of the benefits of GraphQL APIs. GraphQL APIs offer declarative and efficient data fetching using a typed schema definition, serverless data caching, offline data synchronization, security, and fine-grained access control. It also provides data sources and resolvers for writing business logic. If you don’t need the mutation layer, AWS AppSync can directly invoke an LLM in Amazon Bedrock. AWS AppSync integration timeout is set to 30 seconds by default and can’t be extended. If you need to perform operations that might take longer, consider implementing asynchronous patterns or breaking down the operation into smaller chunks. For an example integration, see Invoke Amazon Bedrock models from AWS AppSync HTTP resolver. The following diagram illustrates the solution architecture.
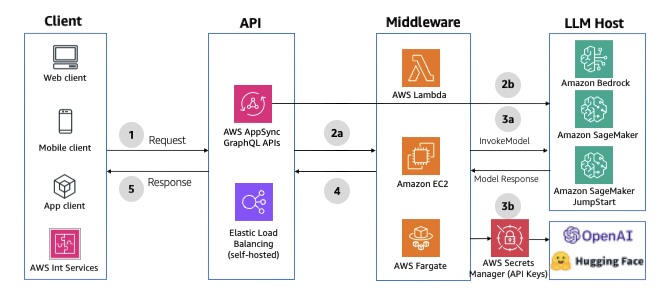 Fig 3: Synchronous GraphQL HTTP APIs using AWS AppSync
Conversational chatbot interface
Amazon Lex is a service for building conversational interfaces with voice and text, offering speech recognition and language understanding capabilities. It simplifies multimodal development and enables publication of chatbots to various chat services and mobile devices. It offers native integration with Lambda to streamline chatbot development. When a Lambda function is used for fulfilment, the default response timeout is set to 30 seconds. To bypass, you can use fulfilment updates to provide periodic updates to the user, so the user knows that the chatbot is still working on their request. For an example implementation, see Enhance Amazon Connect and Lex with generative AI capabilities. The following diagram illustrates the solution architecture.
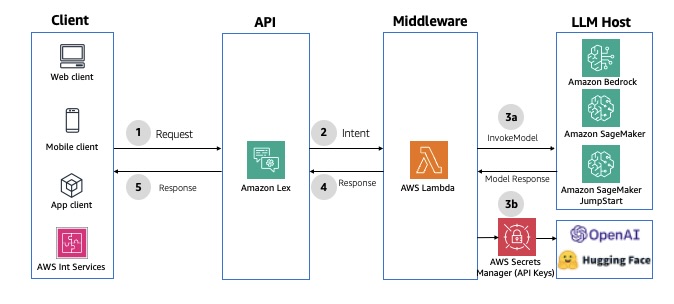
Fig 4: Synchronous conversational APIs using Amazon Lex
Model invocation using orchestration
AWS Step Functions enables orchestration and coordination of multiple tasks, with native integrations across AWS services like Amazon API Gateway, AWS Lambda, and Amazon DynamoDB. AWS Step Functions offers built-in features like function orchestration, branching, error handling, parallel processing, and human-in-the-loop capabilities. It also has an optimized integration with Amazon Bedrock, allowing direct invocation of Amazon Bedrock FMs from AWS Step Functions workflows. With this integration, you can accomplish the following:
- Enrich Step Functions data processing with generative AI capabilities for tasks like text summarization, image generation, or personalization
- Retrieve and inject up-to-date data (such as product pricing or user profiles) into LLM prompts for improved accuracy
- Orchestrate LLM and agent calls in a customized processing chain, using the best-suited models at each stage
- Implement human-in-the-loop interactions to moderate responses and handle hallucinations of the FM
For an example implementation using API Gateway, see Prompt chaining with Amazon API Gateway and AWS Step Functions. For an example implementation using AWS AppSync, see Prompt chaining with AWS AppSync, AWS Step Functions and Amazon Bedrock. The following diagram illustrates an example architecture.
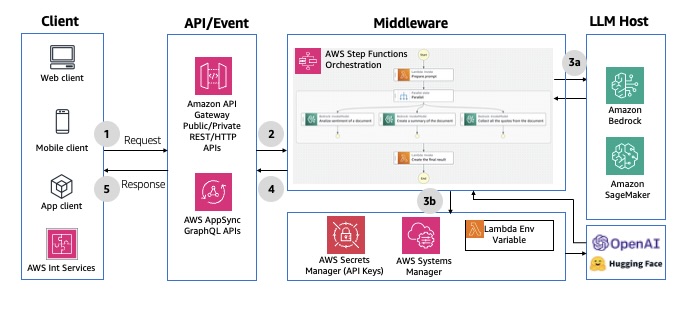 Fig 5: Synchronous model invocations using AWS Step Functions
Pattern 2: Asynchronous request response
This pattern provides a full-duplex, bidirectional communication channel between the client and server without clients having to wait for updates. The biggest advantages is its non-blocking nature that can handle long-running operations. However, they are more complex to implement because they require channel, message, and state management. This model can be implemented through two architectural approaches.
WebSocket APIs
The WebSocket protocol enables real-time, synchronous communication between the frontend and middleware, allowing for bidirectional, full-duplex messaging over a persistent TCP connection. This bidirectional behavior enhances client/service interactions, enabling services to push data to clients without requiring explicit requests. Using API Gateway, you can create a WebSocket APIs as a stateful frontend for an AWS service (such as Lambda or DynamoDB) or for an HTTP endpoint. The WebSocket API invokes your backend based on the content of the messages it receives from client apps. After the message is generated, the backend can send callback messages to connected clients. Each request-response cycle must complete within 29 seconds, as defined by the API Gateway integration timeout for WebSockets. The connection duration for API Gateway WebSocket APIs can be up to 2 hours with an idle connection timeout of 10 minutes—these can’t be extended. For an example implementation, refer to AI Chat with Amazon API Gateway (WebSockets), AWS Lambda and Amazon Bedrock. The following diagram illustrates an example architecture.
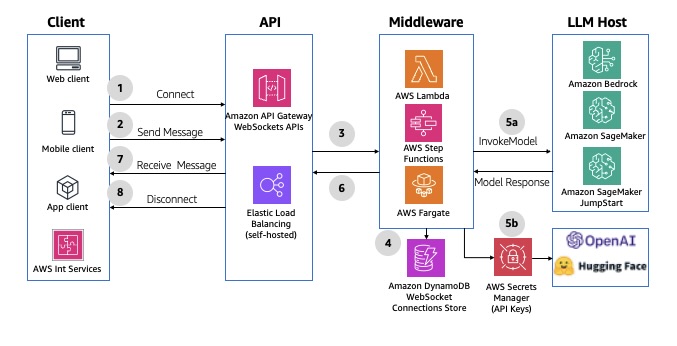 Fig 6: Asynchronous WebSocket APIs using Amazon API Gateway
GraphQL WebSocket APIs
AWS AppSync can establish and maintain secure WebSocket connections for GraphQL subscription operations, enabling middleware applications to distribute data in real time from data sources to subscribers. It also supports a simple publish-subscribe model, where client frontends can listen to specific channels or topics, with AWS AppSync managing multiple temporary pub/sub channels and WebSocket connections to deliver and filter data based on the channel name. For an example implementation, refer to AI Chat with AWS AppSync (WebSockets), AWS Lambda, and Amazon Bedrock. The following diagram illustrates an example architecture.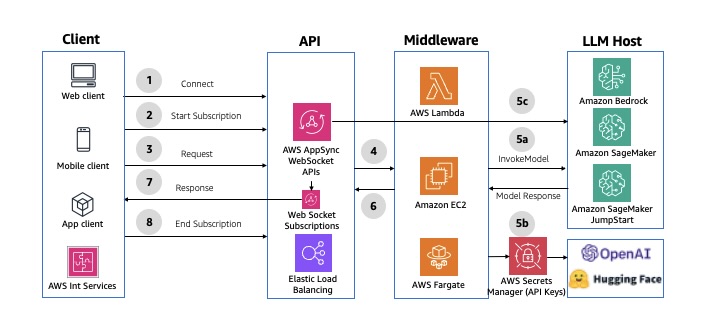
Fig 7: Asynchronous GraphQL WebSocket APIs using AWS
Pattern 3: Asynchronous streaming response
This streaming pattern enables real-time response flow to clients in chunks, enhancing the user experience and minimizing first response latency. This pattern uses built-in streaming capabilities in services like Amazon Bedrock (InvokeModelWithResponseStream or ConverseStream APIs) and SageMaker real-time inference, enabling applications to display results incrementally rather than waiting for complete responses. This pattern is particularly effective for applications implementing text modality such as chat interfaces and word-based content generation tools.
Implementation is achieved through the API Gateway WebSocket API or AWS AppSync WebSocket APIs or GraphQL subscriptions, with careful consideration given to timeout management and connection handling.
The following diagram illustrates the architecture of asynchronous streaming using API Gateway WebSocket APIs.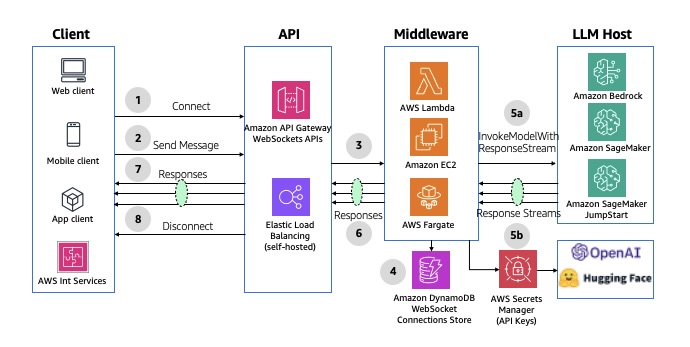
Fig 8: Asynchronous streaming response using Amazon API Gateway WebSockets APIs
The following diagram illustrates the architecture of asynchronous streaming using AWS AppSync WebSocket APIs.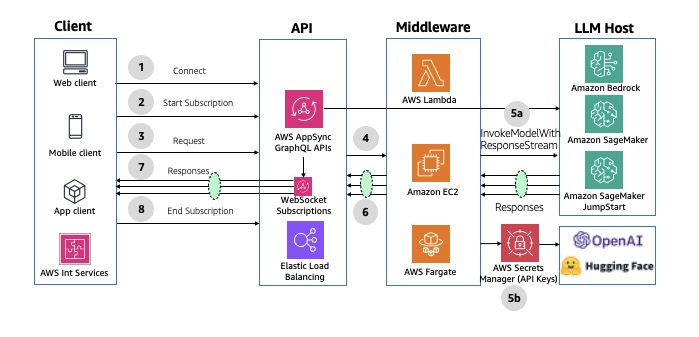
Fig 9: Asynchronous streaming response using AWS AppSync WebSocket APIs
If you don’t need an API layer, Lambda response streaming lets a Lambda function progressively stream response payloads back to clients. For more details, see Using Amazon Bedrock with AWS Lambda. The following diagram illustrates this architecture.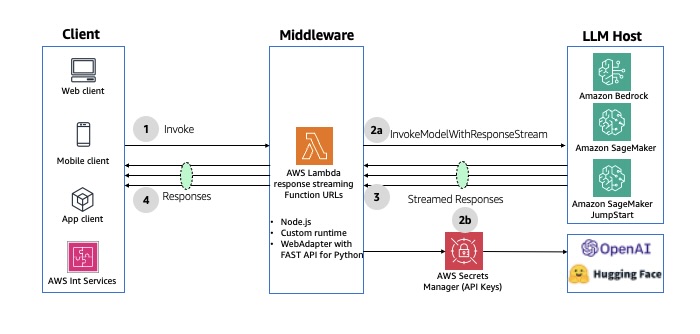
Fig 10: Asynchronous response using AWS Lambda response streaming
Conclusion
This post introduced three design patterns applicable for real-time generative AI applications: synchronous request response, asynchronous request response, and asynchronous streaming response. We also highlighted how to implement these patterns using AWS serverless services. When selecting an appropriate pattern for your implementation, it is crucial to consider the anticipated end-user experience, the existing technical stack, AWS service quotas, and the latency of your LLM responses. In Part 2, we discuss patterns for building batch-oriented generative AI implementations using AWS serverless services.