Post Syndicated from LastWeekTonight original https://www.youtube.com/watch?v=6RxqNv6bEug
Mouse Turbines
Post Syndicated from original https://xkcd.com/2641/

DS620slim tiny home server
Post Syndicated from original https://blog.erratasec.com/2022/07/ds620slim-tiny-home-server.html

In this blogpost, I describe the Synology DS620slim. Mostly these are notes for myself, so when I need to replace something in the future, I can remember how I built the system. It’s a “NAS” (network attached storage) server that has six hot-swappable bays for 2.5 inch laptop drives.
That’s right, laptop 2.5 inch drives. It makes this a tiny server that you can hold in your hand.
The purpose of a NAS is reliable storage. All disk drives eventually fail. If you stick a USB external drive on your desktop for backups, it’ll eventually crash, losing any data on it. A failure is unlikely tomorrow, but a spinning disk will almost certainly fail some time in the next 10 years. If you want to keep things, like photos, for the rest of your life, you need to do something different.
The solution is RAID, an array of redundant disks such that when one fails (or even two), you don’t lose any data. You simply buy a new disk to replace the failed one and keep going. With occasional replacements (as failures happen) it can last decades. My older NAS is 10 years old and I’ve replaced all the disks, one slot replaced twice.
This can be expensive. A NAS requires a separate box in addition to lots of drives. In my case, I’m spending $1500 for a 18-terabytes of disk space that would cost only $400 as an external USB drive. But amortized for the expected 10+ year lifespan, I’m paying $15/month for this home system.
This unit is not just disk drives but also a server. Spending $500 just for a box to hold the drives is a bit expensive, but the advantage is that it’s also a server that’s powered on all the time. I can setup tasks to run on regular basis that would break if I tried to regularly run them on a laptop or desktop computer.
There are lots of do-it-yourself solutions (like the Radaxa Taco carrier board for a Raspberry Pi 4 CM running Linux), but I’m choosing this solution because I want something that just works without any hassle, that’s configured for exactly what I need. For example, eventually a disk will fail and I’ll have to replace it, and I know now that this is something that will be effortless when it happens in the future, without having to relearn some arcane Linux commands that I’ve forgotten years ago.
Despite this, I’m a geek who obsesses about things, so I’m still going to do possibly unnecessary things, like upgrading hardware: memory, network, and fan for an optimized system. Here are all the components of my system:
- $500 – DS620slim unit
- $1000 – 6x Seagate Barracuda 5TB 2.5 inch laptop drive (ST5000LM000)
- $100 – 2x Crucial 8GB DDR3 SODIMMs (CT2K102464BF186D) or 2x OWC (update: in building a new system in 2023-December, the Crucial memory didn’t work, but the OWC memory did).
- $30 – 2.5gbps Ethernet USB (CableCreation B07VNFLTLD)
- $15 – Noctua NF-A8 ULN ultra silent fan
- $360 – WD Elements 18TB USB drive (WDBWLG0180HBK-NESN)
You can save a bunch of money by going down to 4TB drives (and a 14TB backup USB drive), but I chose the larger 5TB drives.
Disk Drives
The most important reason for choosing this product is the smaller 2.5-inch disk drives (sized for laptops). Otherwise, you should buy one of the larger (much larger) system that’ll holder standard sized drives.
The drives will be largest cost. A 5TB spinning disk costs ~$150, or an 8TB SSD flash costs ~$700. Buying 6 of them is your largest investment. You don’t have to fill up the system, or buy the largest drives, but if you put in the time and effort, you might as well go all the way. On a cost-per-gigabyte, the larger drives seem to be best price.
As you know, there are only three manufacturers remaining for spinning rust drives: Seagate, Western Digital (WD), and Toshiba. Also as you know, laptops have moved away from rotating disks, adopting SSDs instead. Thus, the 2.5 inch form factor for spinning disks is likely dead. For right now, they are a lot cheaper than SSDs, a fifth of the price. In the future, when a drive dies on the array, I’ll likely have to replace it with an SSD, because a replacement spinning disk is no longer available. The SATA SSD itself is eventually going to disappear (to be replaced by NVMe SSDs), but they should still be around a decade from now when I need replacement drives. (I plan on the NAS lasting a decade before I have to upgrade and move the data).
The internal 5TB drives are a bit expensive. One strategy would be to instead buy external USB drives and “shuck” them, removing the USB enclosure to get at the drives themselves. It’s a common strategy when under certain market conditions, external drives are cheaper than internal drives. I tried buying a $100 5TB Western Digital external drive. It didn’t work — it wasn’t a SATA drive in a USB enclosure, but was natively USB on the circuit board. I’m using it as a Raspberry Pi 4 drive instead for storing blockchain info.
Inserting the drive into the 620slim is easy: just pop out the carrier, add the drive, and pop it back in. The carrier comes with little posts on one side that fit the screw holes, meaning you only need to screw in the other side with 2 screws — or you can forgo the screws altogether.
The carriers have locks, to prevent people from accidentally pulling out a drive, but I don’t use them. In 5 years when a drive fails and I need to replace it, I don’t want to go hunting for these keys. The entire strategy I’m using here is that when failure happens, I’ll fix it right away rather than finding reasons to procrastinate. I’ve had to replace 3 failed drives in my previous NAS, and this worked well.
Memory
The DS620slim comes with 2-gigabytes of memory, in a single SO-DIMM slot. There’s a second empty SO-DIMM slot. (SO-DIMMs are the smaller form factor for memory that’s intended for notebook computers and tiny servers).
Synology will officially sell you a 4-gig SO-DIMM to put in the empty slot, bringing total memory to 6-gigs.
Unofficially, you can get two of these, using the second to replace the existing 2-gigs, brining it to 8-gigs total.
Even more unofficially, you can go to 16gigs. According to Intel’s official spec sheet for the J3355 CPU, it only supports 8-gigs. Such numbers are usually conservative, reflecting the memory available at the time. When larger capacities appear later, they usually work. Such is the case here, where I put in 16-gigs total using Crucial SO-DIMMs (two 8-gig DIMMs).
I recommend expanding memory here, if only an extra 2gig DIMM to fill that free space. It’s a quick and easy replacement, just unscrew the bottom plate and insert the memory.
Ethernet
The unit only comes with gigabit Ethernet. This can be a bottleneck, so we want to speed that up.
It comes with two Ethernet ports, which support aggregation, but I couldn’t get a speed increase. It seems they’ll speed things up if there are at least two devices talking to the NAS, but won’t speed up when there’s only one client. But then, if you have two clients, then things will slow down anyway, because accesses are no longer sequential.
The solution is to use a faster Ethernet adapter, like 2.5gig, 5gig, or 10gig. There’s no PCIe slot in the device, but it does have USB 3. I can therefore use a 2.5gbps or 5gbps dongle.
I benchmarked the three options, and found the following performance, in mbps (mega-bits per second). This was measured with large sequential transfers, small or random transfers are roughly the same speed, around 350mbps, for all three adapters.
There’s a big jump in performance using the 2.5gbps adapter, but only a marginal increase using the 5gbps adapter.
Synology doesn’t support the adapters directly. To install them, I used the following steps with the following project:
- Enable SSH, using (Control Panel -> Terminal). If you are a geek, you’ve already done this.
- Go to this GitHub project and download the the r8152-apollolake-2.15.0-5.spk file (from the Releases section) to your local computer. Your DS620slim has an Apollo Lake CPU, so that’s the package we are using.
- Use the “Package Center” to do a “Manual” install, and upload this SPK file. If you get an error saying you don’t have permissions, log out and back in. Otherwise, you’ll first get a warning saying the driver isn’t supported by Synology, and eventually you’ll get the error “Failed to install package”. This is supposed to happen.
- From the SSH command-line, run the command:
- sudo install -m 4755 -o root -D /var/packages/r8152/target/r8152/spk_su /opt/sbin/spk_su
- Now repeat the step using “Packet Center” to do a “Manual” install. If you didn’t close the window that you had open, you can just click on the “Done” button a second time and it’ll work.
- Now reboot, and plug in the USB adapter.
For 5-gbps, you can use go through the same process to install Aquantia aqc111 drivers. I did this to get a Sabrent NT-SS5G adapter to work.
In practice, when transferring large files, you still aren’t going to be able to exceed 2.5gbps much, so I just use the slower adapter. It’s cheaper and uses a lot less electrical power (a 2.5gbps Ethernet adapter is noticeably cooler than a 5gbps, which is in turn noticeably cooler than 10gbps).
Fan
The unit comes with a small fan that by default will run in “quiet” mode, but under load, the noise becomes noticeable. A cheap $15 gets a fan that runs a lot quieter, like a Noctua fan famous for this. Replacing the fan doesn’t require any tools, as it’s held in by rubber thingies.
This allows me to run the fan at a higher speed, with less noise, which keeps everything even cooler. Since I plan on a 10 year lifespan with rotating disks, I figure lower temperatures will be better for longevity.
USB drive backups
RAID6 gives pretty good safety, allowing two drives to fail with no data loss. The term “RAID5” means one redundant disk, the term “RAID6” means two redundant disks.
But you should still do backups. The NAS itself can fail. Or, ransomware can delete all the files. There’s lots of possible failures.
One of the neat things with Synology is that it’s easy to schedule regular backups to an external USB drive.
In my case, I’m using an 18 terabyte USB drive costing $400 for backups. I just schedule it and forget it, backups always happen, and ransomware on Windows machines can delete everything on the NAS but can’t touch the backup.
UPS (Uninterruptable Power Supply)
For a small NAS, I bought a small UPS. This is some weird APC unit that I got on close-out for $100. It’s such a weird little product that I don’t think it was very popular.
It’s a lithium ion UPS. The price for lithium batters, especially LiFePO4, is approaching the point where they are price competitive with traditional lead acid batteries. This is especially true considering that they last longer in UPS applications than lead acid.
File system
Now with hardware out of the way, let’s talk software. Once you insert the drives, plug in the Ethernet, and turn on the power, you access the device with a web browser and configure from there.
There are several choices for how you want to configure RAID and the filesystem.
I chose BTRFS on top of RAID6.
BTRFS is a new Linux filesystem that’s increasingly becoming the default. It’s major feature is that it includes checksums for files as part of their metadata (along with filenames and timestamps). This allows the filesystem to detect when a file has become corrupted, so that the file can be repaired. Bits will rot on hard disk, so files can become corrupted over time even if the files are never written to or read. Scrubbing prevents this from happening. With Synology, I simply configure it to scrub the entire filesystem every month.
This is not “btrfs-raid”, but “btrfs-on-raid6”. BTRFS has some experimental RAID built-in, but it’s buggy and doesn’t really work. Instead, I first create a RAID6 array combining multiple drives into a single virtual drive, then put BTRFS on top of that.
These boxes are designed to allow multiple filesystems to be created, but I create simply the one. I do have multiple “shares”, though, such as for videos and music, but these are still just directories on the same filesystem.
I also occasionally take “snapshots”. I’m not sure how that works since I’ve never restored a snapshot, but in principle it’ll be quicker restoring from backups.
Summary
If you are looking for between 16TB and 20TB, for more personal use than a large office, it’s rather perfect. Yea, it’ll be 4 times more expensive than just getting an external USB drive, but it’s RAID and it’s own server.
It’s so cute I got a second one and filled it with 2TB SSDs, for database accesses that spend a lot of time searching through large database of poorly indexed data (like password dumps).
Mail day 040 – SwitchBot lock & camera, M5 Stack, SunFounder TS7-Pro
Post Syndicated from BeardedTinker original https://www.youtube.com/watch?v=qFxh3sMkfsY
Дърва срещу гласове? Правителствени кадри манипулират местни избори със сделки
Post Syndicated from Екип на Биволъ original https://bivol.bg/%D0%BE%D0%BF%D0%B8%D1%82-%D0%BD%D0%B0-%D0%B1%D1%81%D0%BF-%D1%81-%D0%B4%D1%8A%D1%80%D0%B6%D0%B0%D0%B2%D0%BD%D0%B0%D1%82%D0%B0-%D0%B3%D0%BE%D1%80%D0%B0-%D0%B4%D0%B0-%D0%BA%D1%83%D0%BF%D0%B8.html
неделя 3 юли 2022

Високопоставени служители от правителството в оставака се опитват да влияят на местни избори, чрез обещания за апетитни сделки с определени фирми и бизнесмени. Това научи “Биволъ” от свои читатели, станали…
Inbound
Post Syndicated from Oglaf! -- Comics. Often dirty. original https://www.oglaf.com/inbound/


Darktable 4.0.0 released
Post Syndicated from original https://lwn.net/Articles/899805/
Version
4.0.0 of the darktable raw photo editor has been released.
“The UI has been completely revamped again to improve look and
“. Other changes include new exposure and
consistency. Padding, margins, color, contrast, alignment, and icons have
been reworked throughout
color-calibration modules, a reworked “filmic” color-mapping module, guided
laplacian highlight reconstruction, and more. (LWN looked at darktable in January).
Stable kernels for the weekend
Kayane | The Queen of E-Fighters | Talks at Google
Post Syndicated from Talks at Google original https://www.youtube.com/watch?v=2gpntWEkwgY
History Camp America 2022: Swag Unboxing
Post Syndicated from The History Guy: History Deserves to Be Remembered original https://www.youtube.com/watch?v=U3ehuUhFSxI
Listening to old HiFi components wirelessly via a Soundbar
Post Syndicated from Techmoan original https://www.youtube.com/watch?v=ZlI3yB2N9Pg
Friday Squid Blogging: Multiplexing SQUIDs for X-ray Telescopes
Post Syndicated from Bruce Schneier original https://www.schneier.com/blog/archives/2022/07/friday-squid-blogging-multiplexing-squids-for-x-ray-telescopes.html
NASA is researching new techniques for multiplexing SQUIDs—that’s superconducting quantum interference devices—for X-ray observatories.
As usual, you can also use this squid post to talk about the security stories in the news that I haven’t covered.
Read my blog posting guidelines here.
Седмицата (27 юни – 2 юли)
Post Syndicated from Йовко Ламбрев original https://toest.bg/editorial-27-june-2-july-2022/
Трета седмица живеем с последиците от политическата буря, започнала с разпада на управляващата коалиция и последвалия вот на недоверие, който събори 99-тото правителство на България. Но политическата истерия премина в кресчендо, когато премиерът Кирил Петков обяви, че сме посочили вратата на 70 души от състава на руските представителства у нас. А след закритото заседание на Народното събрание по темата депутатът Ивайло Мирчев заяви:
Българските служби са в тежка битка с предатели вътре в тях, които работят срещу България. Службите ни са тежко пробити и е нужна реформа за ограничаване влиянието на Путин върху тях.

Дали правителство №100 ще се роди в този парламент, или в кухнята на президента, предстои да видим. Но със сигурност може да се твърди, че на Радев цялата ситуация му носи преки и косвени ползи. Президентската институция у нас е конструирана в общия случай като власт с преобладаващо декоративна роля, но в ръцете на Румен Радев се сдоби с твърде голяма гравитация. При това – без да е имало законодателни промени в тази посока. България е парламентарна демокрация, в която президентът извлича директна изгода от слабия парламент. Емилия Милчева разглежда повече нюанси в анализа си „Кой, ако не президентът“.

В друга гореща тема от местния обществен дебат се превърнаха резултатите от националното външно оценяване на учениците. За пореден път. Светла Енчева резюмира случаите, привлекли най-много внимание тази година, но също така търси причините в дълбоко заровените базисни проблеми на образователната ни система, за които никоя власт не успява да намери полезни решения. „Да помечтаем за училищното образование“ е заглавието на нейния материал.

Миналата седмица Върховният съд на Съединените щати, в чийто състав след назначенията на президента Доналд Тръмп преобладават съдии с консервативен уклон, отмени прецедента „Роу срещу Уейд“ от 1973 г. Така фактически заличи конституционното право на аборт и остави темата в ръцете на щатските законодателства. Новината безспорно е изключително неприятна и макар на първо четене да изглежда далеч от местния ни дневен ред, не бива да подценяваме влиянието на подобно събитие върху останалия свят, Европа и у нас. Повече по темата, заедно с допълнителен контекст и важни детайли, прочетете в анализа на Йоанна Елми „Тялото като държавна собственост“.

Изложбата „Тоталпроект“, открита в сряда в Регионалния център за съвременни изкуства „Топлоцентрала“ в София, се опитва да привлече вниманието ни върху тихите шедьоври на непознатата архитектурна модерност и по-конкретно върху няколко добри примера от българската следвоенна архитектура. Тези, с които толкова сме свикнали, че дори може би не забелязваме именно защото успешно и удобно са се вплели в ежедневието на градовете и хората. Прочетете емоционалния разказ на Зорница Христова за впечатленията и размишленията, които видяното на изложбата е провокирало у нея.

В рубриката ни „На второ четене“ Севда Семер този път ни препоръчва книгата „Може би Естер“ на родената в Киев писателка и журналистка Катя Петровская. Книга, чийто жанр е трудно да се определи еднозначно. Донякъде биография, донякъде исторически роман, със сигурност обаче е книга за хората и връзките между тях, за спомените и травмите, за войната и последиците. „Разбира се, особено трудно е да се четат истории за война и смърт по тези земи точно днес. Но е и особено важно“, пише Севда и добавя: „Да смятаме, че нямаме нищо общо, все така ми се струва едно от най-ужасните неща.“

Нека завършим с най-новото есе на Нева Мичева в отговор на читателско писмо, пристигнало в пощенската кутия на рубриката ни „Говори с Нева“. Този път темата е за кризите. За това как не сме съвсем сигурни дали живеем в периодите между една и друга криза, или цялата конструкция на живота ни е стъпила върху няколко „опорни“ кризи. Прочетете чудесния текст на Нева „Нагоре-надолу и пак, и пак“.
Приятно четене!
Тихите шедьоври на модерната архитектура
Post Syndicated from Зорница Христова original https://toest.bg/tihite-shediovri-na-modernata-arhitektura/
Деца играят в двора на детската си градина. Започва да ръми и учителката ги събира. Изкачват стълбите към просторната тераса и сядат там да довършат играта си на сухо, без да се прибират. Пролуките в дървения парапет на терасата са изрязани във формата на момиченца. През тях се вижда мократа зеленина. Едно дете ожаднява и влиза вътре. На мозайката на пода – същото момиченце от парапета на верандата. То е и на тънката решетка по прозорците на първия етаж. В цялата сграда има съвсем лек отглас от възрожденската архитектура – чардакът, дървеният материал, – но никакво цитатничене и кич. Само момиченцата от парапета тихо се държат за ръце.
Една жена се връща от работа в малкия си град. Спокойствието постепенно се е превърнало в еднообразие. Има нужда от цвят – не през цялото време, това би било уморително, но има нужда градът ѝ да се променя понякога. Междувременно се стъмва. И бялата сграда до нея внезапно се преобразява – отвътре запалват осветлението, мондриановският витраж на фасадата проблясва през геометричната решетка и в краката на жената плисват жълто, синьо, червено.
Едно момче ще се качи за пръв път на самолет. Отива на летището, а там всичко, до най-малкия детайл, му казва: „Ти ще летиш! Ще летиш!“ На фасадата уж абстрактните вертикални линии образуват силует на птица. Вътре стълбищата сякаш летят, свързани с тавана. Плотовете на гишетата също плуват във въздуха. Дори столовете приличат на птици – полукръговете на седалки и облегалки напомнят крила. Момчето усеща прилив на еуфория.


Това са три от шестте архитектурни истории, показани в изложбата „Тоталпроект“ на арх. Анета Василева, арх. Емилия Кълева и арх. Даяна Николова. Тези добри примери от непознатата архитектурна модерност не са „пожелателно мислене“, че някой ден ще се случи нещо подобно и у нас. Те вече са осъществени – не в Амстердам, не в Сидни, а в Лозница, Русе, Казанлък, София, Шумен. И съществуват от десетилетия. Техните архитекти са хора, които са имали вкус към мястото и умение да се вглеждат в човешките нужди около себе си. Да им отговорят – и в същото време ненатрапчиво да възпитат вкуса. Творбите им не са предназначени за показване по изложения, не са грандиозни и смайващи. Не са за другите архитекти, а за хората. Днес се говори за „град за хората“ – но пешеходната зона в Шумен например постига точно това. Без манифест.
През годините след 10 ноември изразът „соцархитектура“ сякаш сложи кръст на всичко, строено между 1944-та и 1989-та. Това клише обаче ни пречи да видим какво всъщност е постигнал българският архитектурен модернизъм. Добрите примери, ако не бъдат ценени като такива, ще бъдат изгубени. Хората се бунтуват в защита на онова, чиято ценност разбират – обикновено това са сгради от 20-те с ясна сецесионна красота. Тихите шедьоври на модерната архитектура обаче не предизвикват инстинкт за защита. И следващият строителен предприемач лесно ще ги събори, за да издигне на тяхно място поредния блок.


Аз съм виждала този процес в родния си град – насред пешеходната зона на Добрич изникнаха бетонни магазини, а сега знаковото кино ще бъде съборено. Дали това няма да се случи и с представените в изложбата сгради?
Изложбата „Тоталпроект“ се опитва да предотврати този процес по най-естествения начин – като покаже красотата на архитектурата, като я обясни на хората. Самата изложба е построена на принципа, за който разказва – тоталната свързаност между елементите в цялото. Всеки от архитектурните казуси е представен с огромна снимка, която да потопи зрителя във визуалната му среда; с конкретен детайл, който може да се пипне: реплика на парапета от детската градина, решетка с витража от културния дом в Лозница, врата от галерията в Казанлък, дори стълбище от столичния квартал „Зона Б-5“.


Цветови кодове насочват зрителя кое е елемент от конструкцията, кое е повтарящ се мотив и т.н. Дори подът е включен в разказа – с градоустройствения план на мястото. Преградните стени между различните проекти носят пана с повече информация за идеята и човека, който я е осъществил. Вероятно не сме го чували – и това е наш пропуск. Авторката на детската градина например е Лиляна Босева. Нейната майка Жени Патева е основателка и първа председателка на женско дружество преди Девети – може би затова основният мотив в сградата е момиченцето, а не както е обичайно – редуващи се фигурки на момиченце и момченце. Авторът на летището в Русе си е живял и работил в града – добро напомняне, че стандартният атестат „учил еди-къде си“ също е предразсъдък, който идва от ниско национално самочувствие.


Не съм архитект и не знам как би реагирала професионалната общност. Знам обаче, че в моята област достойните примери за талант, дълбочина и последователност в работата на предишното поколение вдъхват спокойствие. Тук е възможно да се работи така. Има към какво да се стремя, без да ме е страх, че ще увисна във въздуха. Има смисъл да се опитвам да съм част от нещо по-голямо. Освен това мога да си отдъхна в ролята на публика, на човек, който просто се радва на нещо красиво и в същото време усеща потвърждение на някакви важни свои ценности. Такова усещане вдъхва тази архитектурна изложба на мен, преводача. Вероятно така ще въздейства и на хората от други професии – давайте, вкусът, хармонията и грижата за другите не са още за изхвърляне.
Изложбата е копродукция на Регионалния център за съвременно изкуство „Топлоцентрала“ и Фондация „Ново архитектурно наследство“. Може да бъде видяна до 21 август 2022 г. в галерията на най-новото мултифункционално арт пространство на София – „Бял куб“, част от „Топлоцентрала“, на ул. Емил Берсински №5.
Заглавна снимка: © Studio Blenda
Нагоре-надолу и пак, и пак
Post Syndicated from Нева Мичева original https://toest.bg/nagore-nadolu-i-pak-i-pak/
Напоследък около мен се изреждат доста кръгли рождени дни и забелязвам една интересна тенденция – неминуемо ще се намери някой добронамерен приятел или роднина да ожали рожденика заради встъпването му в нова житейска криза. Изглежда, че не само пубертетът и кризата на средната възраст са моменти, подходящи за „подивяване“. Към тях се добавят и кризите на 20-те, 30-те и 40-те, кризата на четвърт века, кризата на седмокласника и „страшните три“ (и на малките не им се разминава) – въобще положението става от криза в криза. Чудя се защо сами си го правим екстракризисно, и ми е интересно да чуя твоите размишления по въпроса.
Усмихнати поздрави,
Елица
О, веднага се сещам и за кризата на идентичността, която ни спохожда във всички десетилетия (да не кажа години, месеци и дори денонощия) – и лично, и национално, и поколенчески. За кризата на доверието, на съвестта, на самочувствието – коя повече, коя по-малко кодифицирана, но всичките отдавна познати като жанр. Сещам се за икономическите и енергийните кризи от последните десетилетия, за периодично олюляващата се от кризи на демокрацията Европа и за сегашната правителствена криза в България. За глобалната здравна криза, в която още се намираме. И за неотдавнашния момент, в който „Гардиън“ взе решение да остави – поради непригодност към загрубелите обстоятелства – словосъчетанието „климатична промяна“, за да вкара в употреба „климатична криза“.
Ако отворим пресата ей сега, оттам ще се изсипе лавина от световни кризи – от остри спешности, като вездесъщото пластмасово замърсяване и разпръснатите, но непрестанни хуманитарни бедствия, до по-отвлечени тенденции, като кризата на вниманието или на мъжествеността. Излишно е да казвам, мила Ели, че и аз съм в душевна микрокриза поради грамадното закъснение, с което ти отговарям, макар и въпросът ти много да ми допадна. „Криза след криза“ никак не ми се струва преувеличено за постоянния кипеж във и около човека. Именно затова разбирам защо маркирането на определени възрасти като непременно кризисни ти се вижда прекалено – защото е избежимо. А колкото по-малко стрес без нужда, толкова по-хубаво.
Ние, хората, притежаваме естествена склонност към драматизъм в описанията – понеже всичко най-добре схващаме и помним в истории, обичаме и да им подсилим контурите, за да станат по-отчетливи, по-паметни. Да наричаме понятния си дискомфорт или динамичността на определени свои стадии с име, предназначено за далеч по-страшни сътресения, вероятно ни помага. На когото – с каквото му е нужно: да се почувства част от нещо по-голямо или нещо по-несамотно; да даде име на неназовимото, което го притиска; да се оневини с форсмажорни обстоятелства; по-бързо да каталогизира перипетиите си.
Надали някой би оспорвал, че пубертетът е изпитание; че в определена фаза от развитието на личността натрупаната умора е способна да предизвика срив; че двайсетгодишните и петдесетгодишните имат различни грижи и нужди. Но и надали някой би се учудил кой знае колко, ако хлапето му се справи в крачка с трудностите на пубертета; ако сривовете не се случат или по нищо не приличат на тези на останалите; ако двайсетгодишните наоколо се окажат по-отговорни и по-адекватни от петдесетгодишните (питай патило), а петдесетгодишните – по-бодри и по-игриви от двайсетгодишните. Затова хич не обичам – а чувствам, че и ти не харесваш особено – предварителното „ожалване“. То е безпредметно и някак злорадо. Да не говорим, че настройва за поражение.
Прелом. Първото значение на „криза“ е медицинско: „важен момент, период в развитието на болест, от който зависи изходът на болестта“. Тоест разклон, на който единият път е към възстановяване, другият – към небитието. Подобни екстремни алтернативи вече не се срещат често по нашите ширини, та да употребяваме думата за щяло и нещяло. А и животът и характерните му стръмнини не заслужават да ги разглеждаме като болест. От друга страна обаче, емоцията също има права. Изглежда, че в свят, в който едни буквално изтезават други, да кажеш например, че „жестоко те мъчи“ съмнение, е неприлично пресилено. И все пак има измерение – емоционалното, – в което това може да е единствено вярното.
Ако се вгледаме, много радикални промени – да се събереш с някого, да смениш работата си, дома или държавата, да се откажеш от познатото в полза на по-желаното, да създадеш нещо – притежават всички белези и доста от последиците на кризата. Обаче ги наричаме другояче. „Криза“ сякаш поема цялата ни съпротива и антипатия към промяната без наше съгласие (а каква по-натрапена промяна от тази на растящата възраст?).
Промяна. Преди години се заговори, че китайската дума за „криза“ се изписвала с два знака, единият от които означавал „опасност“, а другият – „възможност“ (в смисъла на „сгода“, „слука“, „шанс“). Бидейки във висша степен утешително, нещото се повтаряше до втръсване: всяко зло за добро с екзотичен ореол. После се оказа, че не е точно така: съчетанието на двата знака ще рече чисто и просто „надвиснал риск“ и за китайците никак не е окуражаващо. Обаче знаеш ли какво? Неверността на популярното твърдение („думата е съставена от това и това“) не отменя верността на извода („с новото идват и опасности, и шансове“). Действително се случва злото да е за добро. Или въобще да не е зло.
Човек трябва да се справя с толкова много променливи през живота си, че волно или неволно се стреми към сигурност, към равновесие, към намаляване на разклоненията, възлите и дори новостите, само и само да има стабилност. Промяната вещае хаос – същото, мисля, което ти наричаш „подивяване“: период на преобразяване в друго, на неяснота и невъзможен контрол, все едно дали дивото идва отвън, или отвътре. Очевидно е защо в кризите не влизаме с радост. Но не е речено, че няма да излезем с придобивки.
Равносметка. „Критични обстоятелства“ неслучайно звучи сходно с „критическа възраст“ или „критично мислене“. Кризата и критиката произлизат от гръцкия (то кое ли не произлиза от него) – от дума, обемаща значения като „откъсване“, „оценка“ и „отсъждане“. Споменавам го само защото ми харесва да си мисля за критиката като за поставяне на нещо в криза с цел да се изпита качеството му. Иначе през етимологическите разкопки се стига до всякакви нищо незначещи извън лингвистиката родства. (Кризата и критиката, освен другото, са рожби на общ индоевропейски корен, от който изникват и „криминален“, „дискриминация“, „екскремент“, „секрет“ и „концерт“…)
Изпадала съм в криза от възрастта си веднъж – когато бях на 27. Чувствах се ничия (90-те не бяха читаво време за социално прохождане), провалена в основните очаквания към младата жена от ранния постсоц и като цяло – свършена. Започваше цяло ново хилядолетие, а аз бях никъде и не знаех накъде да се обърна и какво да направя, та нещо по-смислено да се конкретизира около мен. От немай-къде продължих да се опитвам да налучкам и малко по-късно взех да усещам, че може би не е залудо.
Нужда. През 1980 г. Джон Ленън измисля за сина си Шон приспивната песничка „Мило момче“: „Така очаквам – казва в нея – да те видя как порастваш. Но май и двамата ще трябва да сме търпеливи, защото има дълъг път за извървяване и мъчна работа за вършене. Дотогава обаче, преди да пресечеш улицата, хвани ръката ми. Животът е онова, което ти се случва, докато си правиш други планове.“ Тази последна фраза, цитирана милион пъти с името на Ленън под нея, не е негова. А той не дочаква да види сина си пораснал, въпреки заразителния си оптимизъм („всеки ден става все по-добре и по-добре“, пее в същата песен).
И все пак – както в криворазбраната китайска криза – нещата тук са верни и неверни едновременно. Оздравяване има, има и смърт; има надежда и страдание; има лоши изходи от измислени кризи и добри възможности покрай истински затруднения; всеки ден става по-добре и по-зле… Прелом, промяна, равносметка, нужда – тези думи се повтарят в речниците около „криза“. Каквото и да е, към колкото и широк кръг от преживявания да е приложима, тя също попада в „други планове“.
Заглавна снимка: Кармен Маура в „Жени на ръба на нервна криза“, реж. Педро Алмодовар, 1988
„Говори с Нева“ е рубрика за писма от читатели. Винаги съм си мечтала да поддържам такава и да имам адрес, на който непознати да ми пишат, за да ми разкажат нещо важно за себе си, което да обсъдим – както във влака, когато разговорът тръгне. Случка, върху която да поразсъждаваме, чуденка, която да разчепкаме още малко, наблюдение, към което да добавя друго. Сигурна съм, че както аз винаги съм искала да отговарям на писма, така има хора, които винаги са искали да ги напишат. Заповядайте.
На второ четене: „Може би Естер“ от Катя Петровская
Post Syndicated from Севда Семер original https://toest.bg/na-vtoro-chetene-mozhe-bi-ester/
Никой от нас не чете единствено най-новите книги. Тогава защо само за тях се пише? „На второ четене“ е рубрика, в която отваряме списъците с книги, публикувани преди поне година, четем ги и препоръчваме любимите си от тях. Рубриката е част от партньорската програма Читателски клуб „Тоест“. Изборът на заглавия обаче е единствено на авторите – Стефан Иванов и Севда Семер, които биха ви препоръчали тези книги и ако имаше как веднъж на две седмици да се разходите с тях в книжарницата.
„Може би Естер“ от Катя Петровская
превод от немски Милен Милев, изд. „Парадокс“, 2016
За какво се нуждаеш от този човек, защо разравяш прахта му? И какво е да си свързана с него?
Тези въпроси са отправени към Катя Петровская в писмо, което тя помества в книгата. Родена в Киев, в семейство от еврейски произход, авторката пише на немски историята на рода си – и сякаш търси именно отговорите на тези два въпроса.
 Случи се няколко пъти да ме питат какво чета, след като бях започнала „Може би Естер“. И установих колко е трудно да се отговори. Когато казвах за какво става дума в книгата, хората първо предполагаха, че е автобиография. Обяснявах, че не се усеща точно така, защото историите са не само на авторката и рода ѝ, но и на хора извън него – тоест на по-големия контекст, включващ световните войни. Значи е историческа? И това не е съвсем точно – пояснявах, че книгата е разделена на отделни истории, малко като сборник с разкази. Има части от какви ли не източници, като цитираното горе писмо, а има и пасажи в поток на съзнанието и дори един сън. Значи са есета? Може би нещо такова, казвах, но продължавах да се чудя за по-подходяща дума. Тогава проверих как е описана на български „Може би Естер“ – най-често е обяснена просто като „книга“. Трудно е да се определи жанрът на онова, което е по-болезнено от история, по-отдалечено от мемоар, по-лично от есе.
В интервю с Капка Касабова Марин Бодаков сравнява нейната книга „Към езерото“ с „Може би Естер“ и с „В памет на паметта“ на Мария Степанова – защото са все книги за биографичната и автобиографичната памет. Капка Касабова говори за новите търсения:
Тази преработка е вид алхимия, за която колективно сме готови. При преливането на малкия и големия разказ, личното и колективното, сурово житейското и художественото в най-добрия случай се получава златна сплав.
Четенето на Катя Петровская наистина се усеща, като да присъстваш на алхимичен процес с цялото му обръщане на прах в злато. Какво виждаме, когато гледаме назад? Себе си? Липсите? Силата на корените? Всичко това – стига да поискаме да го видим. В „Драмата на надареното дете“ терапевтката Алис Милер говори за необходимостта да познаваме историята на собственото си детство, да разберем истината за това, което сме преживели. Тя пише за нуждата да погледнем отвъд обичайно приетото – че детството е един щастлив момент от живота – и да видим къде всъщност ни е било трудно, в кое сме останали неразбрани, сами или наранени. Това е нужно, за да пораснем истински – и да успеем да бъдем истинското си аз.
Катя Петровская минава през подобен процес, но задачата ѝ е още по-голяма и по-болезнена: не само собствената ѝ личност, но цялото ѝ семейство минава под лупата. Също както приемаме, че детството е щастлив период, така и за някои семейни травми се знае, че са тежки – и толкова. Но какво означава да видиш семейството си не като брой загинали или оцелели в Холокоста и брой съдби, променени от войната и революцията, а да се заровиш в историите? Да изградиш поне емоционална връзка с онези, които по една или друга причина отсъстват от семейния пейзаж, да видиш лицата им, да научиш имената им.
В търсенето някои парчета си остават липсващи. Заглавието идва от името на нейната прабаба, която може би се е казвала Естер, но със сигурност е била единствената останала в Киев, когато семейството бяга от нацистите. Тя става тяхна жертва – отзовава се на призива всички от еврейски произход да се явят на определено място. Бащата на авторката не може да си спомни името ѝ с точност не защото я чувства твърде далечна или защото тя няма значение, а напротив, от близост – защото сам я е наричал „бабо“ и не е чувал други нейни имена освен „бабо“ и „мамо“.
Авторката се опитва едновременно да се отдалечи и да се приближи. Заглавието на книгата съдържа точно това – опита да се видят хората като история, но и приемането, че някои части ще останат неясни, понеже са твърде близо, за да бъдат фокусирани.
В нашите географски ширини много хора познаваме от първо лице прийома, че за семейството не се говори извън него. И заради това е важно да се разказват тези истории. В един момент авторката споменава, че майка ѝ я моли изрично да не слага нещо в книгата. Не само конкретният факт, но и молбата да бъде прикрит биват показани. По този начин е конструирана цялата книга. Съсредоточеното усилие да се изровят тези забравени или труднодостъпни спомени е съчетано с описанието на трудностите. Авторката говори и как е забравила всичко от момента, в който влиза в Освиенцим. Липсата на спомени също може да говори.
Езикът и липсата му са не само символично, но и буквално част от историята. Поколения след поколения, семейството е преподавало на глухонеми деца. Поместени са писма от благодарни родители и историите на тези учители в семейството. Но това се превръща и в метафора за идентичността на самата авторка: „Нашето юдейство за мен си остана глухонямо, а глухонямостта – юдейска.“ А за преместването си в Германия авторката казва:
Впуснах се в немския, все едно борбата срещу немотата продължаваше, нали немският, немецкий, на руски е езикът на немите, немой немец, че той немецът въобще не може да говори. Този немски ми беше като багета или лозова пръчка в търсенето на домашните ми, които векове наред бяха учили глухонеми деца на говор, като че трябваше да науча немия немски, за да мога да говоря, а това желание ми беше непонятно.
Разбира се, особено трудно е да се четат истории за война и смърт по тези земи точно днес. Но е и особено важно. В книгата има много въпроси без отговор – не защото не им е даден такъв, а защото отговор може би не съществува. Авторката пита:
Остава ли едно място същото място, ако на това място човек убива, после заравя, взривява, изравя, изгаря, смила, разпръсква, мълчи, сади, лъже, зарива с боклук, наводнява, бетонира, отново мълчи, отцепва, арестува опечалени, по-късно изгражда десет паметника, поменува личните жертви веднъж годишно или пък смята, че няма нищо общо с това?
Да смятаме, че нямаме нищо общо, все така ми се струва едно от най-ужасните неща. „Може би Естер“ ми върна усещането за връзките – семейни, исторически, лични, емоционални, – които държат всички ни заедно. За мен беше напомняне за общото, което имаме, и за отговорността ни към него.
Заглавно изображение: Колаж от корицата на книгата „Може би Естер“ (изд. „Парадокс“, худ. Христо Райчев, Румен Баросов) и снимка на Sincerely Media / Unsplash
Активните дарители на „Тоест“ получават постоянна отстъпка в размер на 20% от коричната цена на всички заглавия от каталога на „Парадокс“, както и на няколко други български издателства в рамките на партньорската програма Читателски клуб „Тоест“. За повече информация прочетете на toest.bg/club.
Metasploit Weekly Wrap-Up
Post Syndicated from Grant Willcox original https://blog.rapid7.com/2022/07/01/metasploit-weekly-wrap-up-164/
SAMR Auxiliary Module
A new SAMR auxiliary module has been added that allows users to add, lookup, and delete computer accounts from an AD domain. This should be useful for pentesters on engagements who need to create an AD account to gain an initial foothold into the domain for lateral movement attacks, or who need to use this functionality as an attack primitive.
Note when using this module that there is a standard number of computers a user can add, so be wary that you may get STATUS_DS_MACHINE_ACCOUNT_QUOTA_EXCEEDED error messages if you try to run this repeatedly. It should also be noted that whilst a standard user can create a computer account, you will need additional privileges to delete that account.
A Pesky Table Bug Gets Squashed
A well known bug in Rex-Tables when trying to render tables which contain unsupported characters has now been fixed in Rex-Text 0.2.38, which has now been pulled into the framework. This should solve a number of issues that have been reported over the last year such as https://github.com/rapid7/metasploit-framework/issues/15833, https://github.com/rapid7/metasploit-framework/issues/14955, and https://github.com/rapid7/metasploit-framework/issues/15044. It should also help improve experiences with some of the new LDAP work we have been working on lately, so that users should have a smoother experience once that releases.
PHP Mailer Argument Injection Module Improvements
As a final point of note, community contributor erikbomb has improved the PHP Mailer Argument Injection exploit targeting CVE-2016-10033 and CVE-2016-10045 to now support changing the name of the fields for the name, email, and message objects. This should allow this exploit to work under additional scenarios where these settings may need to be altered for the exploit to successfully run. Much thanks to erikbomb for these enhancements!
New module content (1)
- SAMR Computer Management by JaGoTu and Spencer McIntyre – This adds an auxiliary module that can be used to add, lookup, and delete computer accounts from an active directory domain. The computer account can offer a sort of foothold into the domain for lateral movements or as a common attack primitive.
Enhancements and features (1)
- #16721 from erikbomb – This updates the PHP Mailer Argument Injection exploit to allow setting the names of certain fields via advanced options. These configuration options then allow the exploit to work in additional scenarios.
Bugs fixed (2)
- #16722 from bcoles – Fixes module metadata for stability and reliability.
- #16729 from gwillcox-r7 – Fixes a crash in Metasploit’s console when trying to render tables which contain unsupported characters.
Get it
As always, you can update to the latest Metasploit Framework with msfupdate
and you can get more details on the changes since the last blog post from
GitHub:
If you are a git user, you can clone the Metasploit Framework repo (master branch) for the latest.
To install fresh without using git, you can use the open-source-only Nightly Installers or the
binary installers (which also include the commercial edition).
Use AWS CloudWatch as a destination for Amazon Redshift Audit logs
Post Syndicated from Nita Shah original https://aws.amazon.com/blogs/big-data/using-aws-cloudwatch-as-destination-for-amazon-redshift-audit-logs/
Amazon Redshift is a fast, scalable, secure, and fully-managed cloud data warehouse that makes it simple and cost-effective to analyze all of your data using standard SQL. Amazon Redshift has comprehensive security capabilities to satisfy the most demanding requirements. To help you to monitor the database for security and troubleshooting purposes, Amazon Redshift logs information about connections and user activities in your database. This process is called database auditing.
Amazon Redshift Audit Logging is good for troubleshooting, monitoring, and security purposes, making it possible to determine suspicious queries by checking the connections and user logs to see who is connecting to the database. It gives information, such as the IP address of the user’s computer, the type of authentication used by the user, or the timestamp of the request. Audit logs make it easy to identify who modified the data. Amazon Redshift logs all of the SQL operations, including connection attempts, queries, and changes to your data warehouse. These logs can be accessed via SQL queries against system tables, saved to a secure Amazon Simple Storage Service (Amazon S3) Amazon location, or exported to Amazon CloudWatch. You can view your Amazon Redshift cluster’s operational metrics on the Amazon Redshift console, use CloudWatch, and query Amazon Redshift system tables directly from your cluster.
This post will walk you through the process of configuring CloudWatch as an audit log destination. It will also show you that the latency of log delivery to either Amazon S3 or CloudWatch is reduced to less than a few minutes using enhanced Amazon Redshift Audit Logging. You can enable audit logging to Amazon CloudWatch via the AWS-Console or AWS CLI & Amazon Redshift API.
Solution overview
Amazon Redshift logs information to two locations-system tables and log files.
- System tables: Amazon Redshift logs data to system tables automatically, and history data is available for two to five days based on log usage and available disk space. To extend the log data retention period in system tables, use the Amazon Redshift system object persistence utility from AWS Labs on GitHub. Analyzing logs through system tables requires Amazon Redshift database access and compute resources.
- Log files: Audit logging to CloudWatch or to Amazon S3 is an optional process. When you turn on logging on your cluster, you can choose to export audit logs to Amazon CloudWatch or Amazon S3. Once logging is enabled, it captures data from the time audit logging is enabled to the present time. Each logging update is a continuation of the previous logging update. Access to audit log files doesn’t require access to the Amazon Redshift database, and reviewing logs stored in Amazon S3 doesn’t require database computing resources. Audit log files are stored indefinitely in CloudWatch logs or Amazon S3 by default.
Amazon Redshift logs information in the following log files:
- Connection log – Provides information to monitor users connecting to the database and related connection information. This information might be their IP address.
- User log – Logs information about changes to database user definitions.
- User activity log – It tracks information about the types of queries that both the users and the system perform in the database. It’s useful primarily for troubleshooting purposes.
Benefits of enhanced audit logging
For a better customer experience, the existing architecture of the audit logging solution has been improved to make audit logging more consistent across AWS services. This new enhancement will reduce log export latency from hours to minutes with a fine grain of access control. Enhanced audit logging improves the robustness of the existing delivery mechanism, thus reducing the risk of data loss. Enhanced audit logging will let you export logs either to Amazon S3 or to CloudWatch.
The following section will show you how to configure audit logging using CloudWatch and its benefits.
Setting up CloudWatch as a log destination
Using CloudWatch to view logs is a recommended alternative to storing log files in Amazon S3. It’s simple to configure and it may suit your monitoring requirements, especially if you use it already to monitor other services and application.
To set up a CloudWatch as your log destination, complete the following steps:
- On the Amazon Redshift console, choose Clusters in the navigation pane.
This page lists the clusters in your account in the current Region. A subset of properties of each cluster is also displayed. - Choose cluster where you want to configure CloudWatch logs.

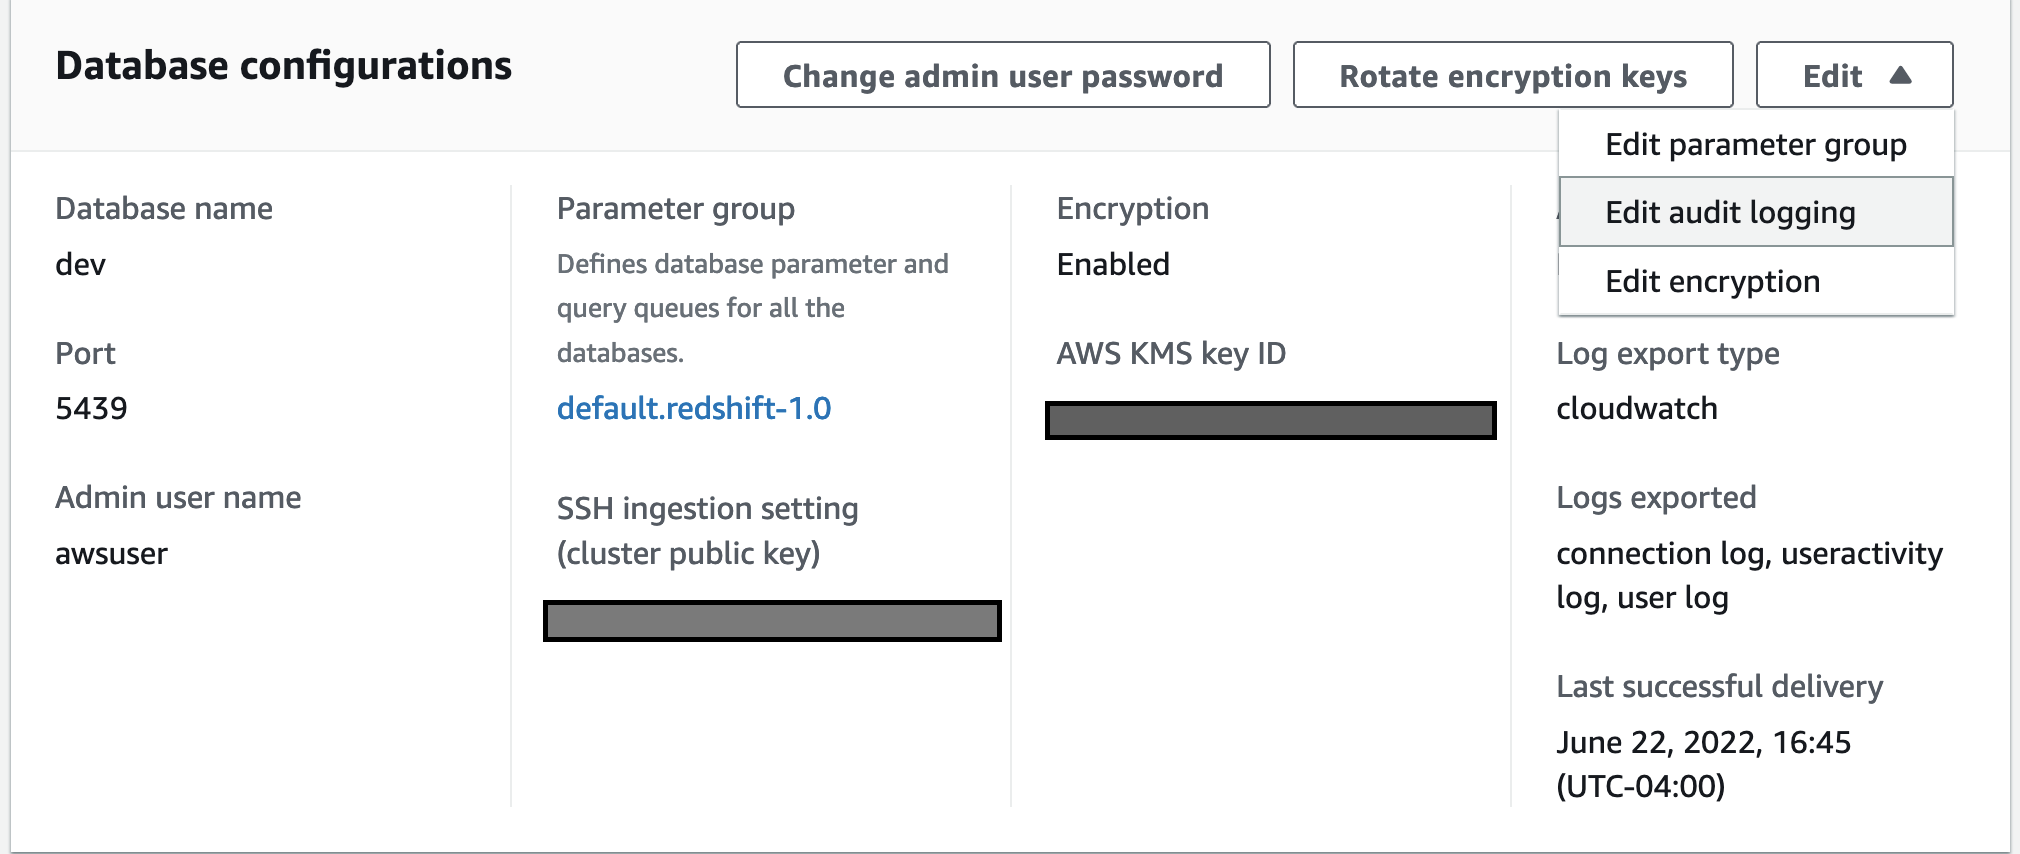
- Select properties to edit audit logging.

- Choose Turn on configure audit logging, and CloudWatch under log export type.

- Select save changes.


Analyzing audit log in near real-time
To run SQL commands, we use redshift-query-editor-v2, a web-based tool that you can use to explore, analyze, share, and collaborate on data stored on Amazon Redshift. However, you can use any client tools of your choice to run SQL queries.
Now we’ll run some simple SQLs and analyze the logs in CloudWatch in near real-time.
- Run test SQLs to create and drop user.

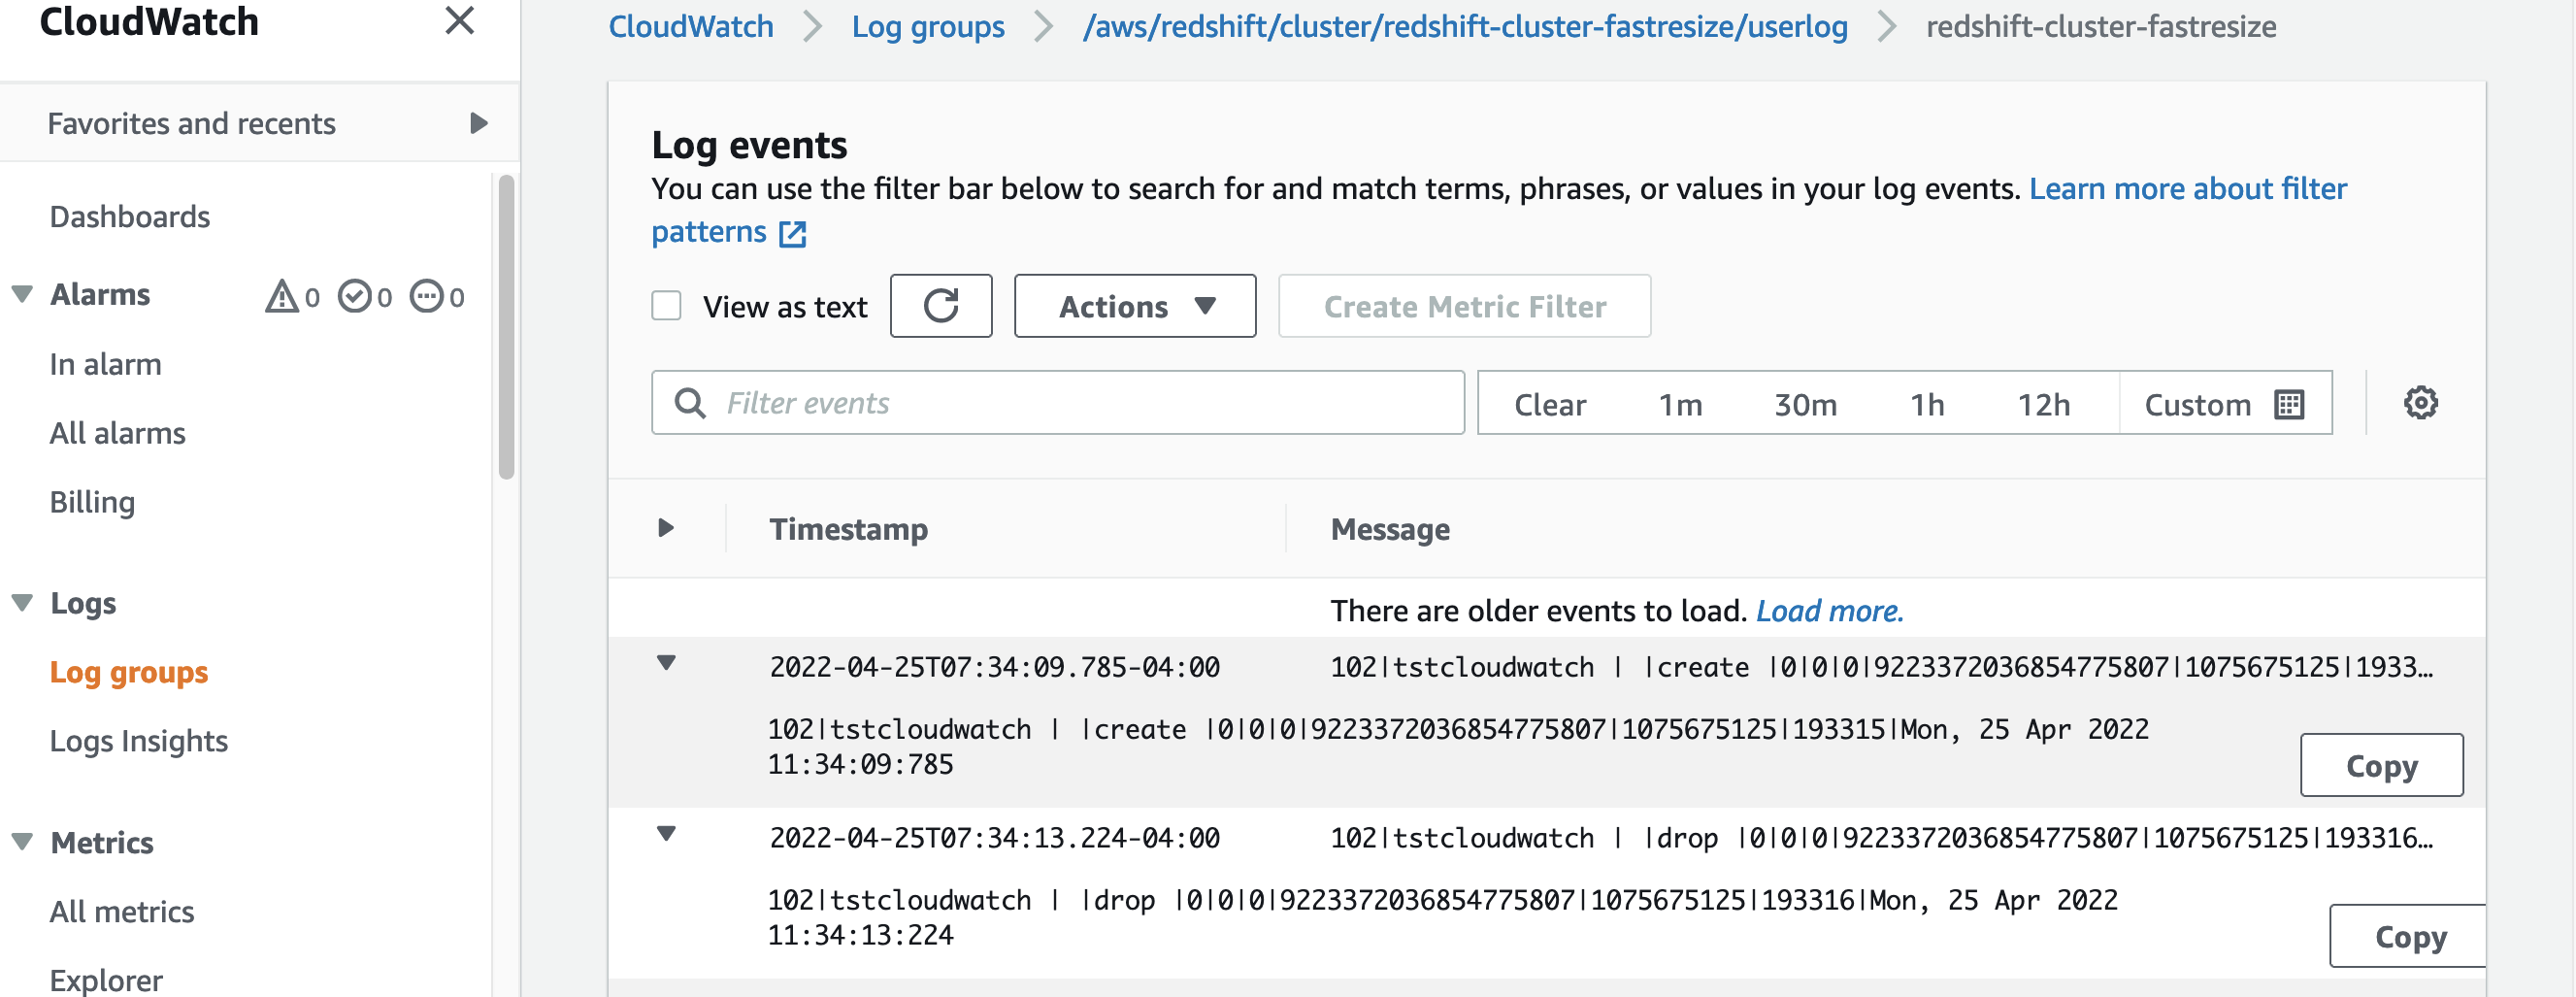
- On the AWS Console, choose CloudWatch under services, and then select Log groups from the right panel.

- Select the userlog – user logs created in near real-time in CloudWatch for the test user that we just created and dropped earlier.


Benefits of using CloudWatch as a log destination
- It’s easy to configure, as it doesn’t require you to modify bucket policies.
- It’s easy to view logs and search through logs for specific errors, patterns, fields, etc.
- You can have a centralized log solution across all AWS services.
- No need to build a custom solution such as AWS Lambda or Amazon Athena to analyze the logs.
- Logs will appear in near real-time.
- It has improved log latency from hours to just minutes.
- By default, log groups are encrypted in CloudWatch and you also have the option to use your own custom key.
- Fine-granular configuration of what log types to export based on your specific auditing requirements.
- It lets you export log groups’ logs to Amazon S3 if needed.
Setting up Amazon S3 as a log destination
Although using CloudWatch as a log destination is the recommended approach, you also have the option to use Amazon S3 as a log destination. When the log destination is set up to an Amzon S3 location, enhanced audit logging logs will be checked every 15 minutes and will be exported to Amazon S3. You can configure audit logging on Amazon S3 as a log destination from the console or through the AWS CLI.
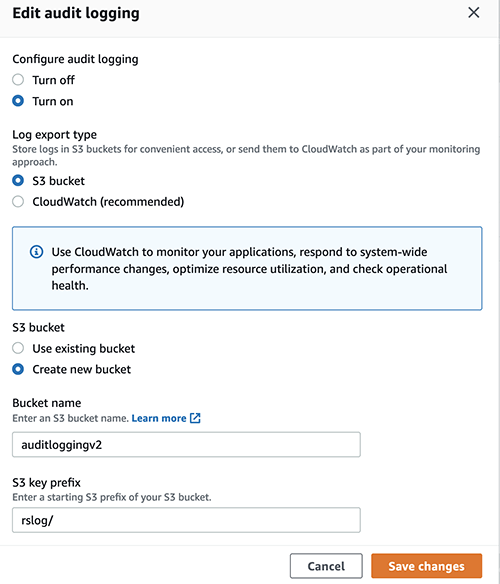
Once you save the changes, the Bucket policy will be set as the following using the Amazon Redshift service principal.

For additional details please refer to Amazon Redshift audit logging.
For enabling logging through AWS CLI – db-auditing-cli-api.
Cost
Exporting logs into Amazon S3 can be more cost-efficient, though considering all of the benefits which CloudWatch provides regarding search, real-time access to data, building dashboards from search results, etc., it can better suit those who perform log analysis.
For further details, refer to the following:
Best practices
Amazon Redshift uses the AWS security frameworks to implement industry-leading security in the areas of authentication, access control, auditing, logging, compliance, data protection, and network security. For more information, refer to Security in Amazon Redshift.
Audit logging to CloudWatch or to Amazon S3 is an optional process, but to have the complete picture of your Amazon Redshift usage, we always recommend enabling audit logging, particularly in cases where there are compliance requirements.
Log data is stored indefinitely in CloudWatch Logs or Amazon S3 by default. This may incur high, unexpected costs. We recommend that you configure how long to store log data in a log group or Amazon S3 to balance costs with compliance retention requirements. Apply the right compression to reduce the log file size.
Conclusion
This post demonstrated how to get near real-time Amazon Redshift logs using CloudWatch as a log destination using enhanced audit logging. This new functionality helps make Amazon Redshift Audit logging easier than ever, without the need to implement a custom solution to analyze logs. We also demonstrated how the new enhanced audit logging reduces log latency significantly on Amazon S3 with fine-grained access control compared to the previous version of audit logging.
Unauthorized access is a serious problem for most systems. As an administrator, you can start exporting logs to prevent any future occurrence of things such as system failures, outages, corruption of information, and other security risks.
About the Authors
 Nita Shah is an Analytics Specialist Solutions Architect at AWS based out of New York. She has been building data warehouse solutions for over 20 years and specializes in Amazon Redshift. She is focused on helping customers design and build enterprise-scale well-architected analytics and decision support platforms.
 Evgenii Rublev is a Software Development Engineer on the Amazon Redshift team. He has worked on building end-to-end applications for over 10 years. He is passionate about innovations in building high-availability and high-performance applications to drive a better customer experience. Outside of work, Evgenii enjoys spending time with his family, traveling, and reading books.
 Yanzhu Ji is a Product manager on the Amazon Redshift team. She worked on Amazon Redshift team as a Software Engineer before becoming a Product Manager, she has rich experience of how the customer facing Amazon Redshift features are built from planning to launching, and always treat customers’ requirements as first priority. In personal life, Yanzhu likes painting, photography and playing tennis.
 Ryan Liddle is a Software Development Engineer on the Amazon Redshift team. His current focus is on delivering new features and behind the scenes improvements to best service Amazon Redshift customers. On the weekend he enjoys reading, exploring new running trails and discovering local restaurants.
Understanding the lifecycle of Amazon EC2 Dedicated Hosts
Post Syndicated from Sheila Busser original https://aws.amazon.com/blogs/compute/understanding-the-lifecycle-of-amazon-ec2-dedicated-hosts/
This post is written by Benjamin Meyer, Sr. Solutions Architect, and Pascal Vogel, Associate Solutions Architect.
Amazon Elastic Compute Cloud (Amazon EC2) Dedicated Hosts enable you to run software on dedicated physical servers. This lets you comply with corporate compliance requirements or per-socket, per-core, or per-VM licensing agreements by vendors, such as Microsoft, Oracle, and Red Hat. Dedicated Hosts are also required to run Amazon EC2 Mac Instances.
The lifecycles and states of Amazon EC2 Dedicated Hosts and Amazon EC2 instances are closely connected and dependent on each other. To operate Dedicated Hosts correctly and consistently, it is critical to understand the interplay between Dedicated Hosts and EC2 Instances. In this post, you’ll learn how EC2 instances are reliant on their (dedicated) hosts. We’ll also dive deep into their respective lifecycles, the connection points of these lifecycles, and the resulting considerations.
What is an EC2 instance?
An EC2 instance is a virtual server running on top of a physical Amazon EC2 host. EC2 instances are launched using a preconfigured template called Amazon Machine Image (AMI), which packages the information required to launch an instance. EC2 instances come in various CPU, memory, storage and GPU configurations, known as instance types, to enable you to choose the right instance for your workload. The process of finding the right instance size is known as right sizing. Amazon EC2 builds on the AWS Nitro System, which is a combination of dedicated hardware and the lightweight Nitro hypervisor. The EC2 instances that you launch in your AWS Management Console via Launch Instances are launched on AWS-controlled physical hosts.
What is an Amazon EC2 Bare Metal instance?
Bare Metal instances are instances that aren’t using the Nitro hypervisor. Bare Metal instances provide direct access to physical server hardware. Therefore, they let you run legacy workloads that don’t support a virtual environment, license-restricted business-critical applications, or even your own hypervisor. Workloads on Bare Metal instances continue to utilize AWS Cloud features, such as Amazon Elastic Block Store (Amazon EBS), Elastic Load Balancing (ELB), and Amazon Virtual Private Cloud (Amazon VPC).
What is an Amazon EC2 Dedicated Host?
An Amazon EC2 Dedicated Host is a physical server fully dedicated to a single customer. With visibility of sockets and physical cores of the Dedicated Host, you can address corporate compliance requirements, such as per-socket, per-core, or per-VM software licensing agreements.
You can launch EC2 instances onto a Dedicated Host. Instance families such as M5, C5, R5, M5n, C5n, and R5n allow for the launching of different instance sizes, such as4xlarge and 8xlarge, to the same host. Other instance families only support a homogenous launching of a single instance size. For more details, see Dedicated Host instance capacity.
As an example, let’s look at an M6i Dedicated Host. M6i Dedicated Hosts have 2 sockets and 64 physical cores. If you allocate a M6i Dedicated Host, then you can specify what instance type you’d like to support for allocation. In this case, possible instance sizes are:
largexlarge2xlarge4xlarge8xlarge12xlarge16xlarge24xlarge32xlargemetal
The number of instances that you can launch on a single M6i Dedicated Host depends on the selected instance size. For example:
- In the case of
xlarge(4 vCPUs), a maximum of 32m6i.xlargeinstances can be scheduled on this Dedicated Host. - In the case of
8xlarge(32 vCPUs), a maximum of 4m6i.8xlargeinstances can be scheduled on this Dedicated Host. - In the case of
metal(128 vCPUs), a maximum of 1m6i.metalinstance can be scheduled on this Dedicated Host.
When launching an EC2 instance on a Dedicated Host, you’re billed for the Dedicated Host but not for the instance. The cost for Amazon EBS volumes is the same as in the case of regular EC2 instances.
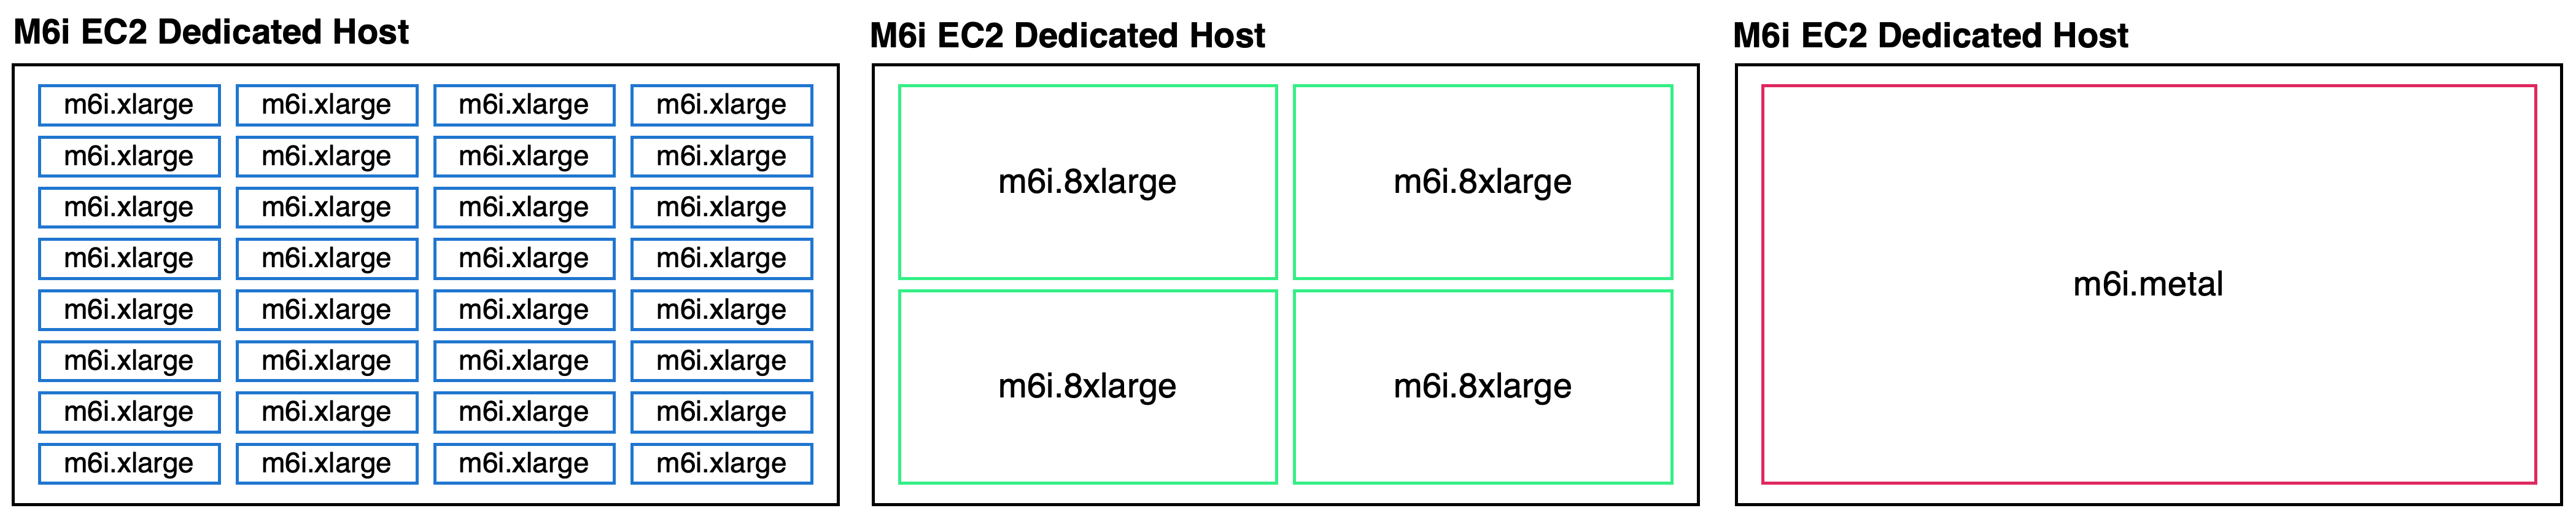
Exemplary M6i Dedicated Host instance selections: m6i.xlarge, m6i.8xlarge and m6i.metal
Understanding the EC2 instance lifecycle
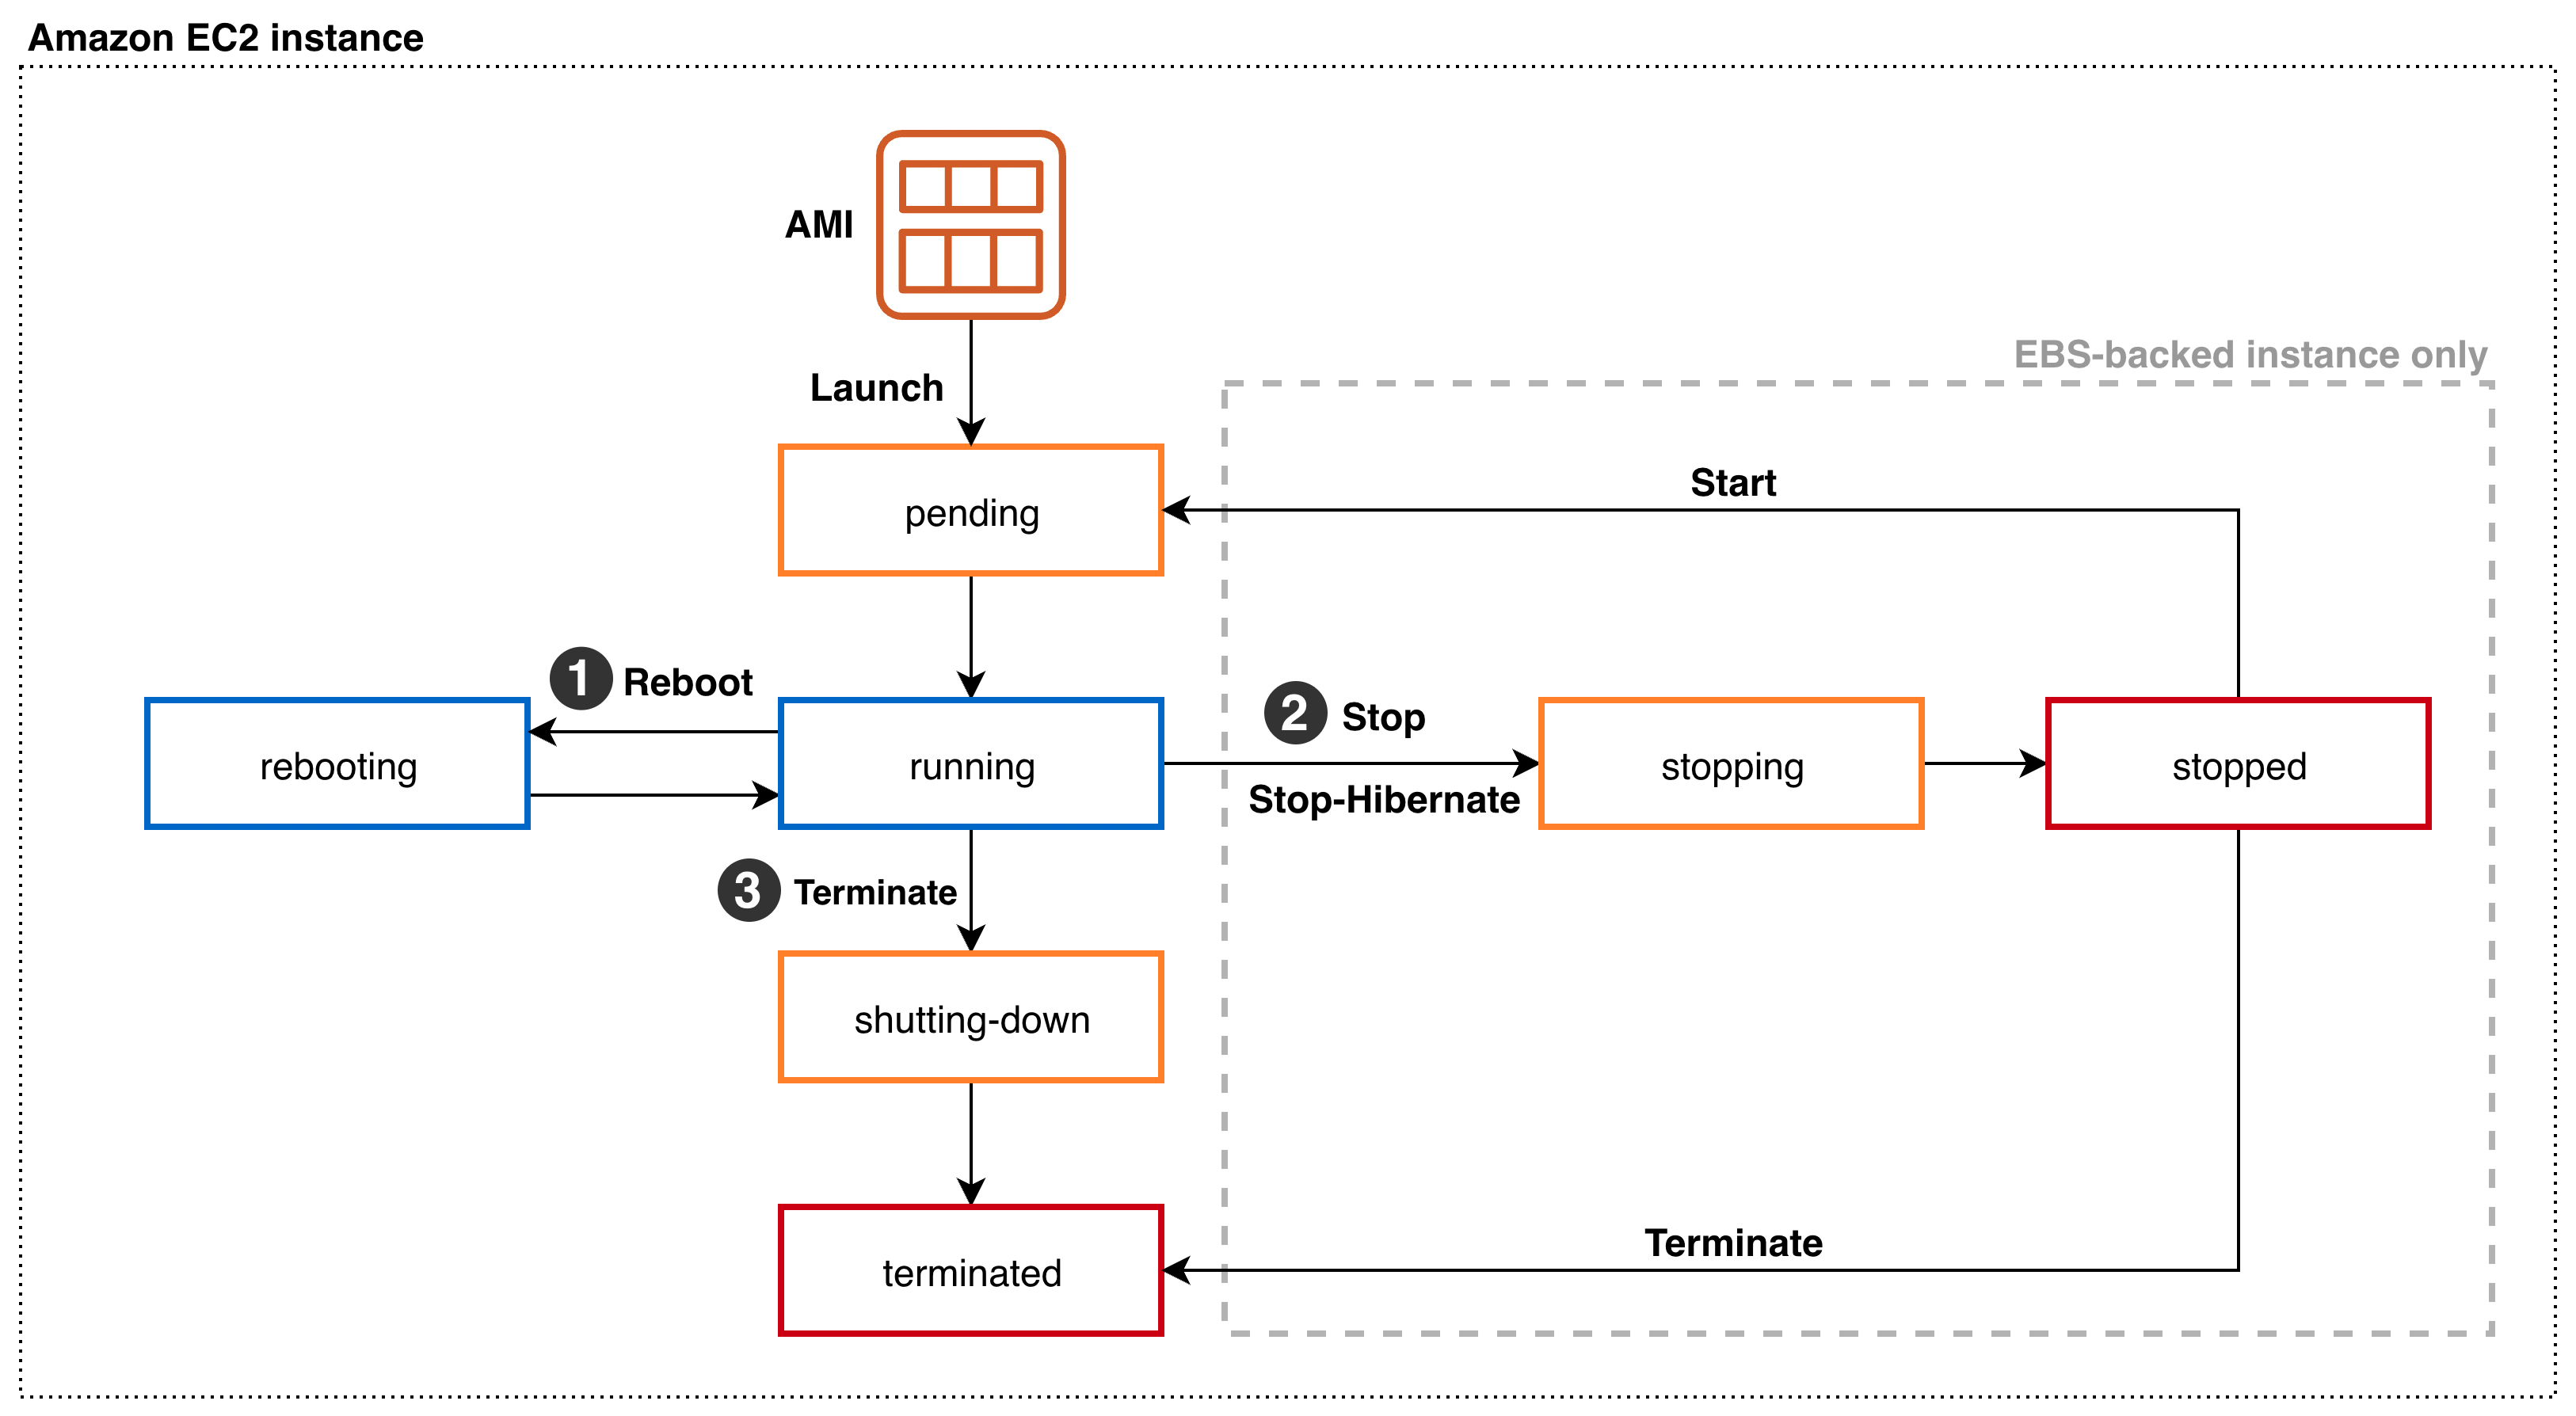
Amazon EC2 instance lifecycle states and transitions
Throughout its lifecycle, an EC2 instance transitions through different states, starting with its launch and ending with its termination. Upon Launch, an EC2 instance enters the pending state. You can only launch EC2 instances on Dedicated Hosts in the available state. You aren’t billed for the time that the EC2 instance is in any state other than running. When launching an EC2 instance on a Dedicated Host, you’re billed for the Dedicated Host but not for the instance. Depending on the user action, the instance can transition into three different states from the running state:
- Via
Rebootfrom therunningstate, the instance enters therebootingstate. Once the reboot is complete, it reenters therunningstate. - In the case of an Amazon EBS-backed instance, a
StoporStop-Hibernatetransitions the running instance into thestoppingstate. After reaching the stopped state, it remains there until further action is taken. ViaStart, the instance will reenter thependingand subsequently therunningstate. ViaTerminatefrom thestopped state, the instance will enter theterminatedstate. As part of aStoporStop-Hibernateand subsequentStart, the EC2 instance may move to a different AWS-managed host. OnReboot, it remains on the same AWS-managed host. - Via
Terminatefrom therunningstate, the instance will enter theshutting-downstate, and finally theterminatedstate. An instance can’t be started from theterminatedstate.
Understanding the Amazon EC2 Dedicated Host lifecycle

Amazon EC2 Dedicated Host lifecycle states and transitions
An Amazon EC2 Dedicated Host enters the available state as soon as you allocate it in your AWS account. Only if the Dedicated Host is in the available state, you can launch EC2 instances on it. You aren’t billed for the time that your Dedicated Host is in any state other than available. From the available state, the following states and state transitions can be reached:
- You can Release the Dedicated Host, transitioning it into the
releasedstate. Amazon EC2 Mac Instances Dedicated Hosts have a minimum allocation time of 24h. They can’t be released within the 24h. You can’treleasea Dedicated Host that contains instances in one of the following states:pending, running, rebooting, stopping, orshuttingdown. Consequently, you mustStoporTerminateany EC2 instances on the Dedicated Host and wait until it’s in theavailablestate before being able toreleaseit. Once an instance is in thestoppedstate, you can move it to a different Dedicated Host by modifying its Instance placement configuration. - The Dedicated Host may enter the
pendingstate due to a number of reasons. In case of an EC2 Mac instance, stopping or terminating a Mac instance initiates a scrubbing workflow of the underlying Dedicated Host, during which it enters thependingstate. This scrubbing workflow includes tasks such as erasing the internal SSD, resetting NVRAM, and more, and it can take up to 50 minutes to complete. Additionally, adding or removing a Dedicated Host to or from a Resource Group can cause the Dedicated Host to go into thependingstate. From thependingstate, the Dedicated Host will reenter theavailablestate. - The Dedicated Host may enter the
under-assessmentstate if AWS is investigating a possible issue with the underlying infrastructure, such as a hardware defect or network connectivity event. While the host is in theunder-assessmentstate, all of the EC2 instances running on it will have theimpairedstatus. Depending on the nature of the underlying issue and if it’s configured, the Dedicated Host will initiate host auto recovery.
If Dedicated Host Auto Recovery is enabled for your host, then AWS attempts to restart the instances currently running on a defect Dedicated Host on an automatically allocated replacement Dedicated Host without requiring your manual intervention. When host recovery is initiated, the AWS account owner is notified by email and by an AWS Health Dashboard event. A second notification is sent after the host recovery has been successfully completed. Initially, the replacement Dedicated Host is in the pending state. EC2 instances running on the defect dedicated Host remain in the impaired status throughout this process. For more information, see the Host Recovery documentation.
Once all of the EC2 instances have been successfully relaunched on the replacement Dedicated Host, it enters the available state. Recovered instances reenter the running state. The original Dedicated Host enters the released-permanent-failure state. However, if the EC2 instances running on the Dedicated Host don’t support host recovery, then the original Dedicated Host enters the permanent-failure state instead.
Conclusion
In this post, we’ve explored the lifecycles of Amazon EC2 instances and Amazon EC2 Dedicated Hosts. We took a close look at the individual lifecycle states and how both lifecycles must be considered in unison to operate EC2 Instances on EC2 Dedicated Hosts correctly and consistently. To learn more about operating Amazon EC2 Dedicated Hosts, visit the EC2 Dedicated Hosts User Guide.
Monitor your Amazon QuickSight deployments using the new Amazon CloudWatch integration
Post Syndicated from Mayank Agarwal original https://aws.amazon.com/blogs/big-data/monitor-your-amazon-quicksight-deployments-using-the-new-amazon-cloudwatch-integration/
Amazon QuickSight is a fully-managed, cloud-native business intelligence (BI) service that makes it easy to connect to your data, create interactive dashboards, and share these with tens of thousands of users, either within the QuickSight interface or embedded in software as a service (SaaS) applications or web portals. With QuickSight providing insights to power your daily decisions, it becomes more important than even for administrators and developers to ensure their QuickSight dashboards and data refreshes are operating smoothly as expected.
We recently announced the availability of QuickSight metrics within Amazon CloudWatch, which enables developers and administrators to monitor the availability and performance of their QuickSight deployments in real time. With the availability of metrics related to dashboard views, visual load times, and data ingestion details into SPICE (the QuickSight in-memory data store), developers and administrators can ensure that end-users of QuickSight deployments have an uninterrupted experience with relevant data. CloudWatch integration is now available in QuickSight Enterprise Edition in all supported Regions. These metrics can be accessed via CloudWatch, and allow QuickSight deployments to be monitored similarly to other application deployments on AWS, with the ability to generate alarms on failures and to slice and dice historical events to view trends and identify optimization opportunities. Metrics are kept for a period of 15 months, allowing them to be used for historical comparison and trend analysis.
Feature overview
QuickSight emits the following metrics to track the performance and availability of dataset ingestions, dashboards, and visuals. In addition to individual asset metrics, QuickSight also emits aggregated metrics to track performance and availability of all dashboards and SPICE ingestions for an account in a Region.
| . | Metric | Description | Unit |
| 1 | IngestionErrorCount |
The number of failed ingestions. | Count |
| 2 | IngestionInvocationCount |
The number of ingestions initiated. This includes scheduled and manual ingestions that are triggered through either the QuickSight console or through APIs. | Count |
| 3 | IngestionLatency |
The time from ingestion initiation to completion. | Second |
| 4 | IngestionRowCount |
The number of successful row ingestions. | Count |
| 5 | DashboardViewCount |
The number of times that a dashboard has been loaded or viewed. This includes all access patterns such as web, mobile, and embedded. | Count |
| 6 | DashboardViewLoadTime |
The time that it takes a dashboard to load. The time is measured starting from the navigation to the dashboard to when all visuals within the view port are rendered. | Millisecond |
| 7 | VisualLoadTime |
The time it takes for a QuickSight visual to load, including the round-trip query time from the client to QuickSight and back to the client. | Millisecond |
| 8 | VisualLoadErrorCount |
The number of times a QuickSight visual fails to complete a data load. | Count |
Access QuickSight metrics in CloudWatch
Use the following procedure to access QuickSight metrics in CloudWatch:
- Sign in to the AWS account associated with your QuickSight account.
- In the upper-left corner of the AWS Console Home, choose Services, and then choose CloudWatch.

- On the CloudWatch console, under Metrics in the navigation pane, choose All metrics, and choose QuickSight.

- To access individual metrics, choose Dashboard metrics, Visual metrics, and Ingestion metrics.
- To access aggregate metrics, choose Aggregate metrics.


Visualize metrics on the CloudWatch console
You can use the CloudWatch console to visualize metric data generated from your QuickSight deployment. For more information, see Graphing metrics.
Create an alarm using CloudWatch console
You can also create a CloudWatch alarm that monitors CloudWatch metrics for your QuickSight assets. CloudWatch automatically sends you a notification when the metric reaches a threshold you specify. For examples, see Using Amazon CloudWatch alarms.
Use case overview
Let’s consider a fictional company, OkTank, which is an independent software vendor (ISV) in the healthcare space. They have an application that is used by different hospitals across different regions of the country to manage their revenue. OkTank has hundreds of hospitals with thousands of healthcare employees accessing their application and has embedded operations related to their business using multiple QuickSight dashboards in their application. In addition, they allow embedded authoring experience to each hospital’s in-house data analysts to build their own dashboards for their BI needs.
All the dashboards are powered by a database cluster, and they have multiple ingestion schedules. Because their QuickSight usage is growing and hospitals’ in-house data analysts are contributing by bringing in more data and their own dashboards, OkTank wants to monitor and make sure they’re providing their readers with a consistent, performant, and uninterrupted experience on QuickSight.
OkTank has some key monitoring needs that they deem critical:
- Monitoring console – They want a general monitoring console where they can monitor reader engagement in their account, most popular dashboards, and overall visual load performance. They would like to monitor overall ingestion performance in their account.
- Dashboard adoption and performance – They want to monitor traffic growth with respect to performance to make sure they’re meeting scaling needs.
- Visual performance and availability – They have some visuals with complex queries and would like to make sure these queries are running fast enough without failures so that their readers have a performant and uninterrupted experience.
- Ingestion failures – They want to be alerted if any scheduled ingestion fails, so that they can act right away and make sure their readers don’t experience any interruptions.
In the following sections, we discuss how OkTank meets each monitoring need in more detail.
Monitoring console
OkTank wants to have a general monitoring console to look at key KPIs, monitor reader engagement, and make sure their readers are getting a consistent and uninterrupted experience with QuickSight.
To create a monitoring console and add a KPI metric to it, OkTank takes the following steps:
- On the CloudWatch console, under Metrics in the navigation pane, choose Dashboards.
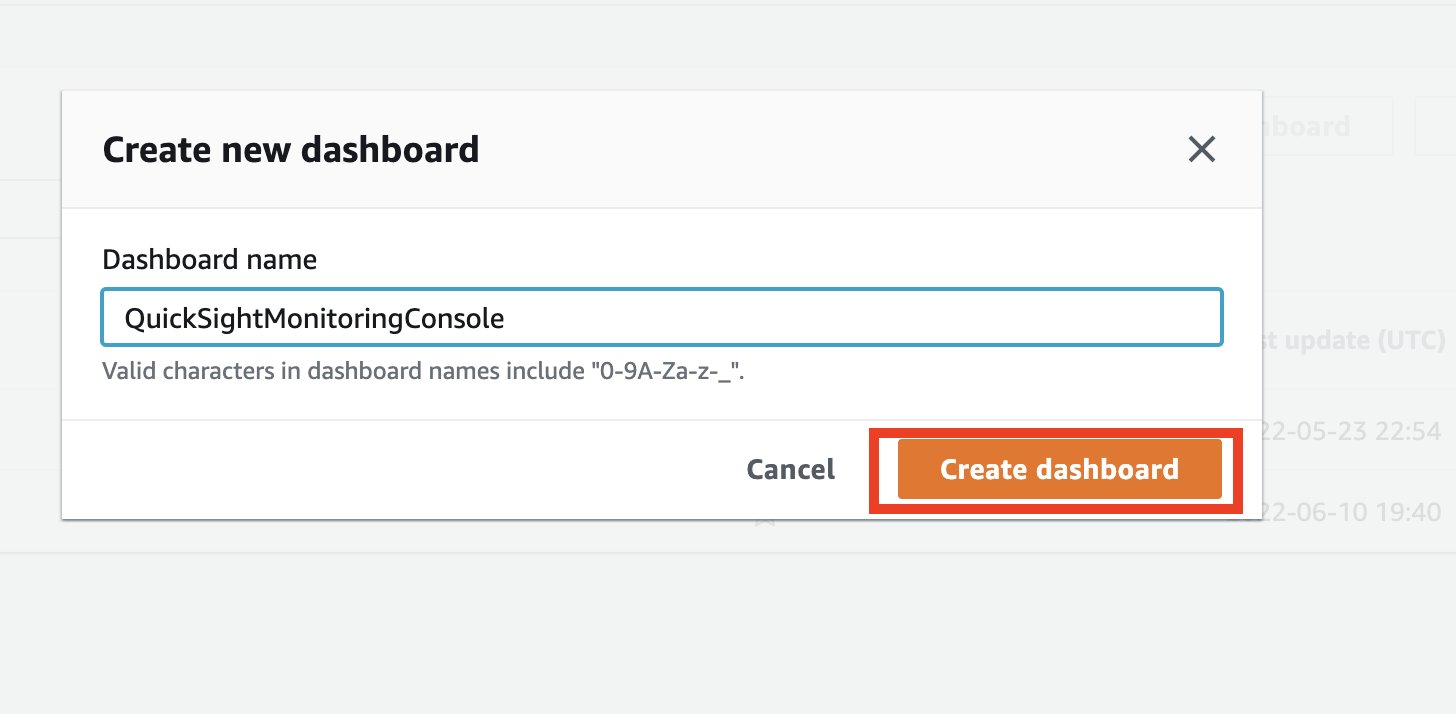
- Choose Create dashboard.

- Enter the dashboard name and choose Create dashboard.

- On the blank dashboard landing page, choose either Add a first widget or the plus sign to add a widget.

- In the Add widget section, choose Number.

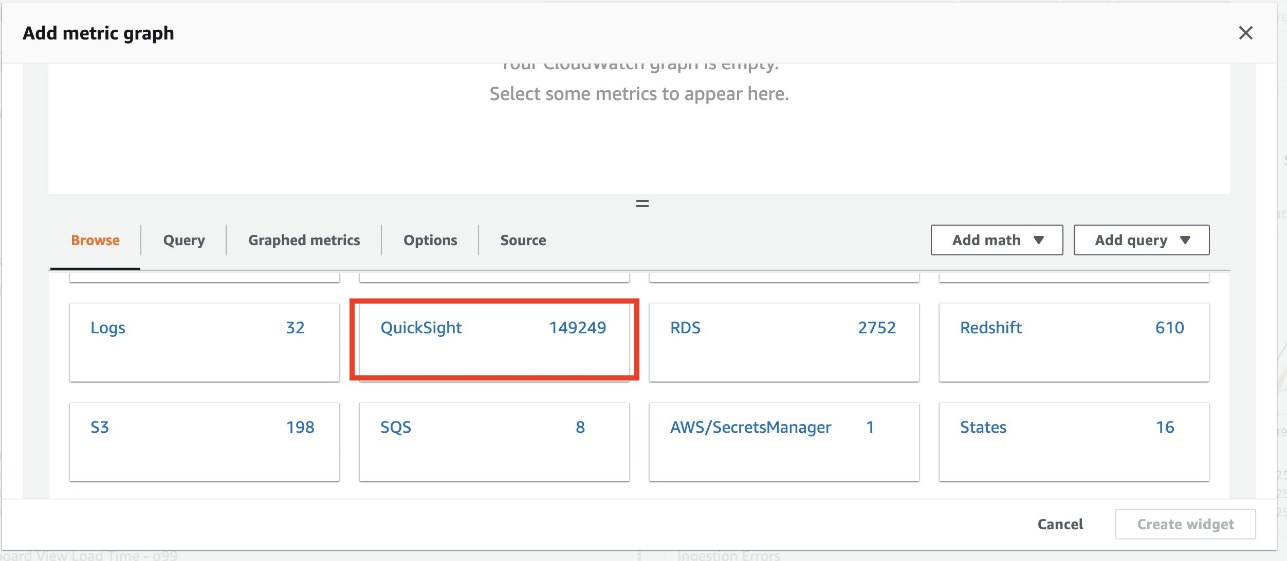
- On the Browse tab, choose QuickSight.

- Choose Aggregate metrics.
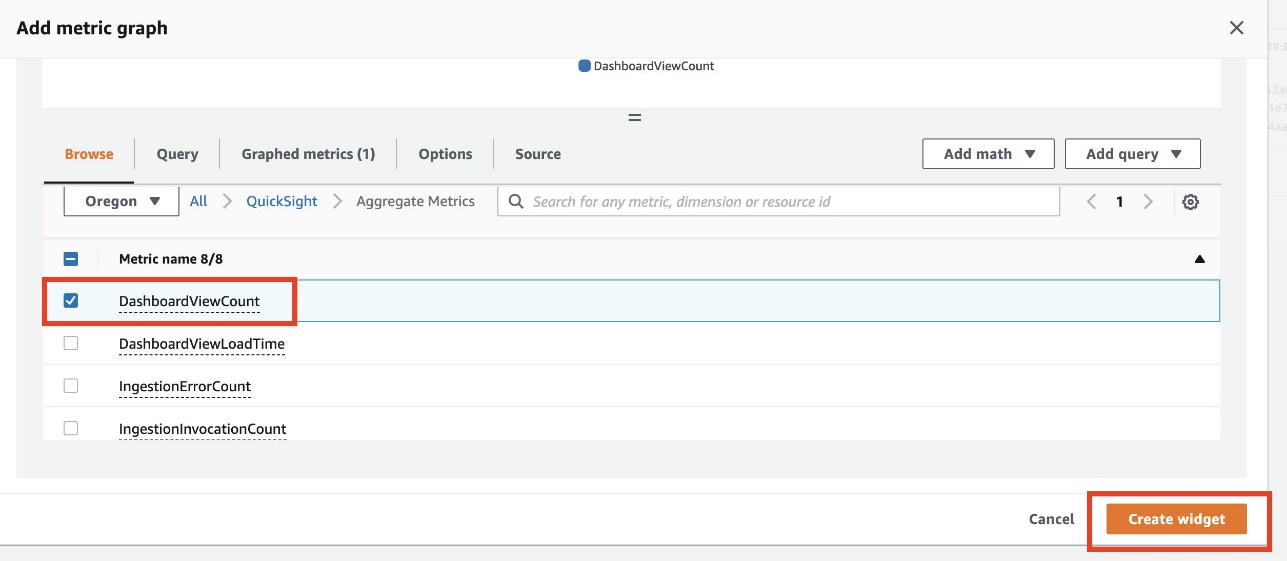
- Select DashboardViewCount.
- Choose Create widget.
- On the options menu of the newly created widget, choose Edit.

- Enter the desired widget name.
- For Statistic, choose Sum.
- For Period, choose 1 day.
- Choose Update widget.


With the widget options, OkTank has added more KPIs on the console, such as average dashboard load time across the region during the day and the 10 most popular dashboards with the highest views, and created their monitoring console.

Dashboard adoption and performance
OkTank has some critical dashboards, and they want to monitor adoption of that dashboard and track its loading performance to make sure they can meet scaling needs.
They take the following steps to create a widget:
- On the monitoring console, choose the plus sign.

- In the Add widget section, choose Line.

- In the Add to this dashboard section, choose Metrics.

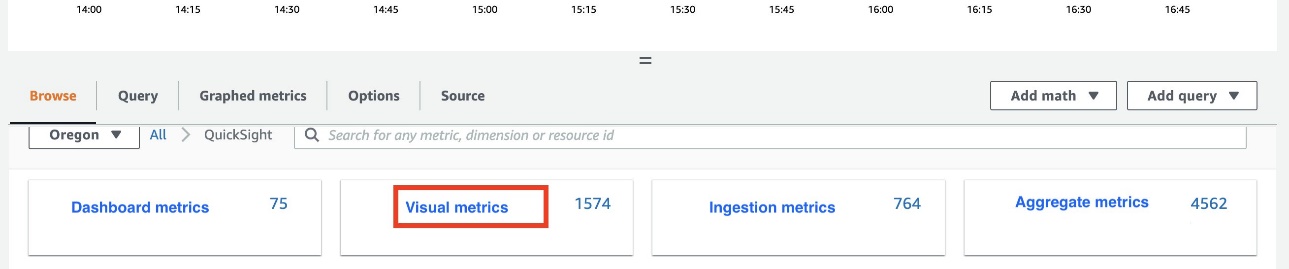
- On the Browse tab, choose QuickSight.
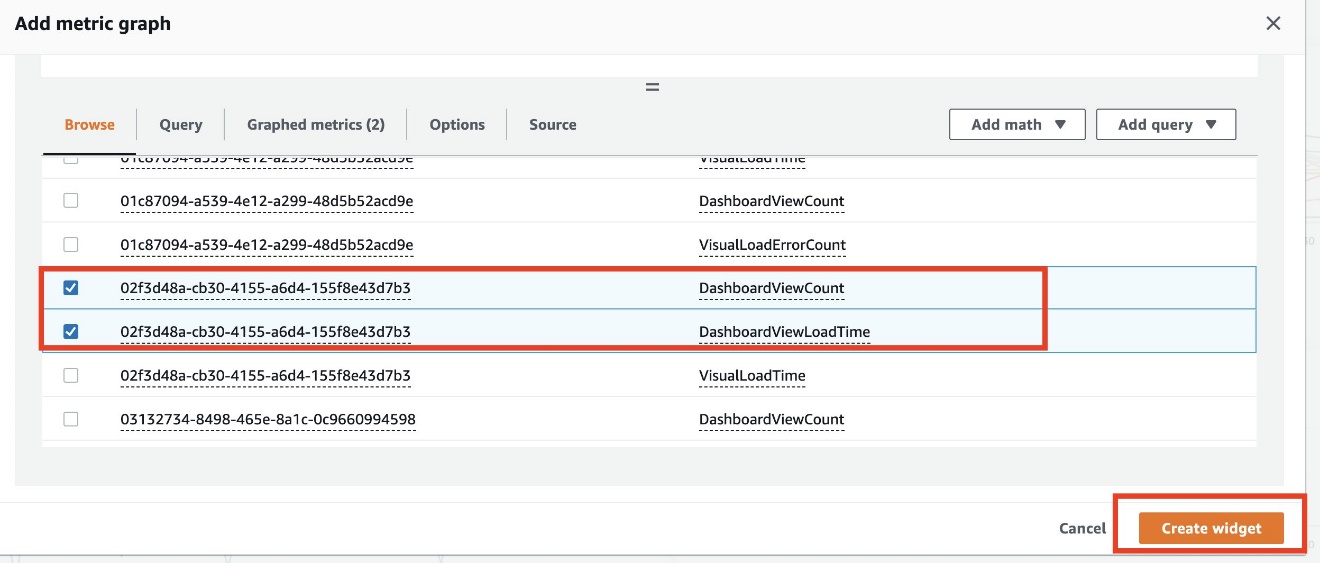
- Choose Dashboard metrics.

- Choose the
DashboardViewCountandDashbordViewLoadTimemetrics of the critical dashboard. - Choose Create widget.


The newly created widget shows critical dashboards views and load times in multiple dimensions.

Visual performance and availability
OkTank has some visuals that require them to run complex queries while loading. They want to provide their readers with consistent and uninterrupted experience. In addition, they would like to be alerted in case a query experiences failures when running or takes longer than the desired runtime.
They take the following steps to monitor and set up an alarm:
- On the monitoring console, choose the plus sign.
- In the Add widget section, choose Line.
- In the Add to this dashboard section, choose Metrics.
- On the Browse tab, choose QuickSight.
- Choose Visual metrics.
- Choose the
VisualLoadTimemetric of the critical visual and configure the time period on the menu above the chart. - To get alerted in case the critical visual fails to load due to query failure, choose the
VisualLoadErrorCountmetric.

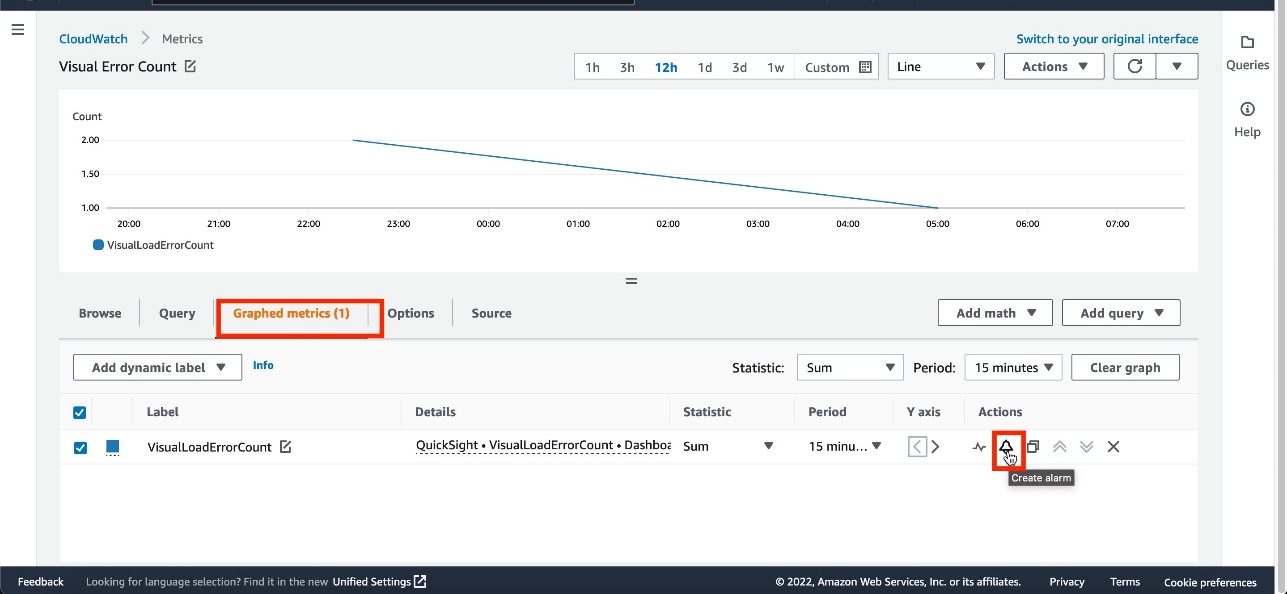
The newly created widget shows visuals load performance over the selected time frame. - On the Graphed metrics tab, select the
VisualLoadErrorCountmetric. - On the Actions menu, choose Create alarm.

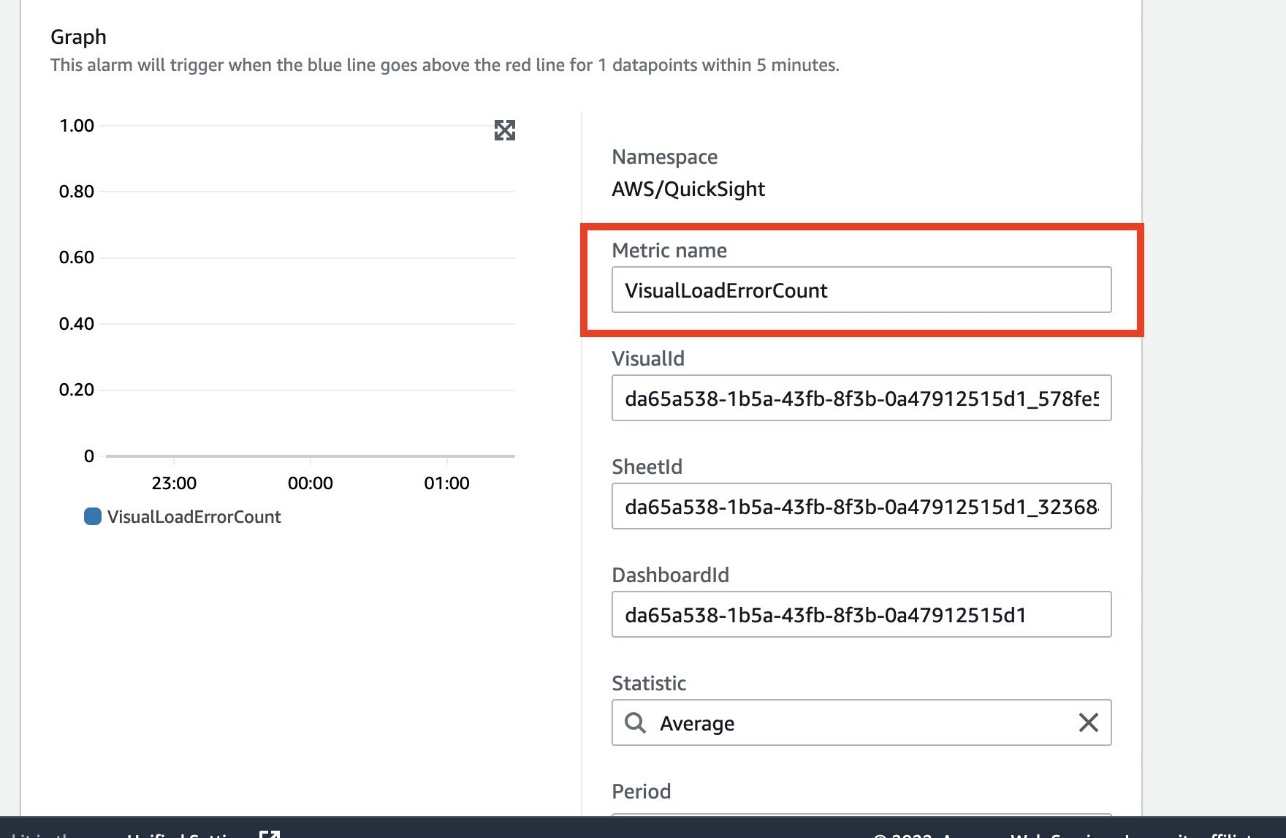
- For Metric name, enter a name.
- Confirm that the value for DashboardId matches the dashboard that has the visual.

In the Conditions section, OkTank wants to be notified when the error count is greater than or equal to 1. - For Threshold type, select Static.
- Select Greater/Equal.
- Enter
1. - Choose Next.
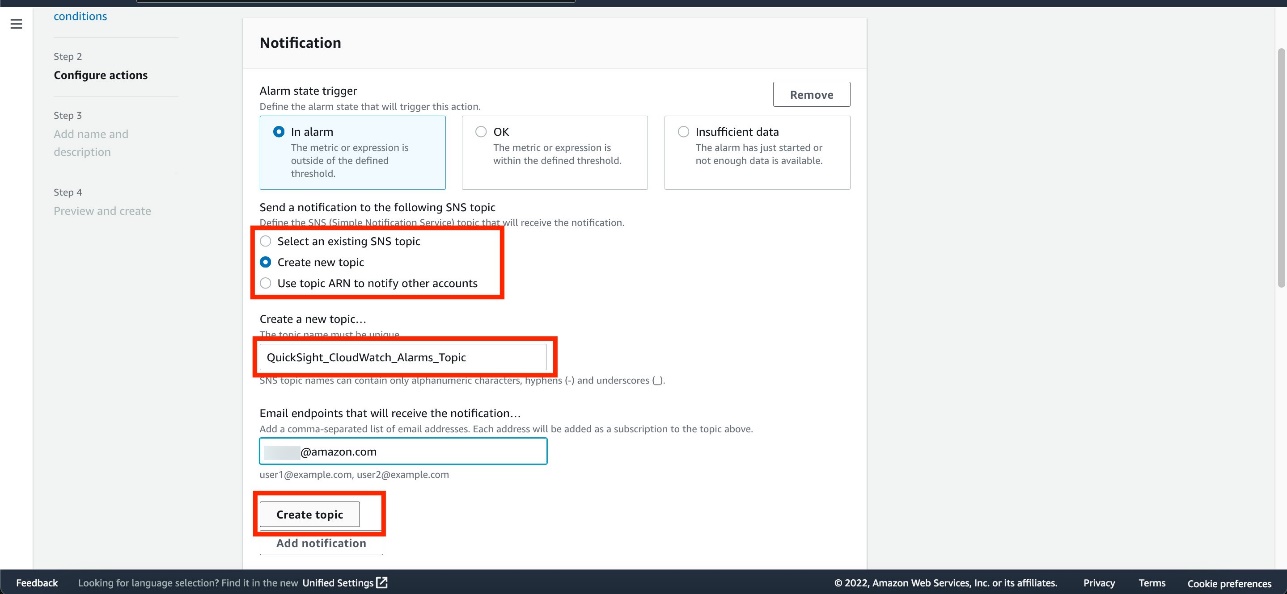
- In the Notification section, choose Select an existing SNS topic or Create a new topic.
- If you’re creating a new topic, provide a name for the topic and email addresses of recipients.
- Choose Create topic.
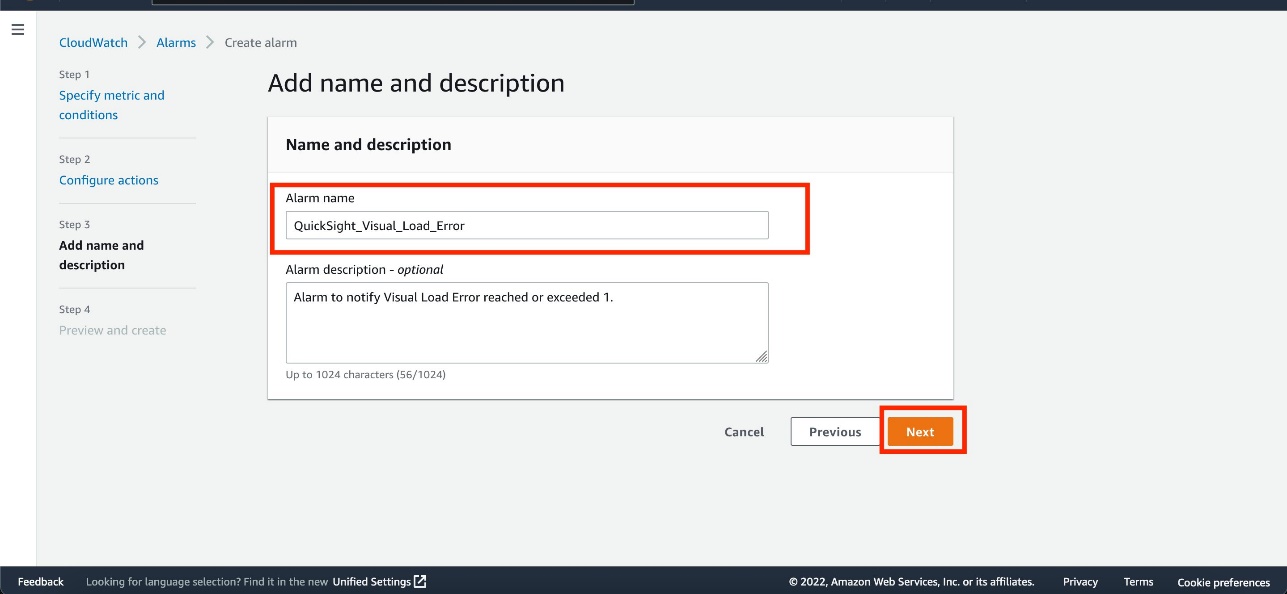
- Enter an alarm name and optional description.
- Choose Next.
- Verify the details and choose Create alarm.


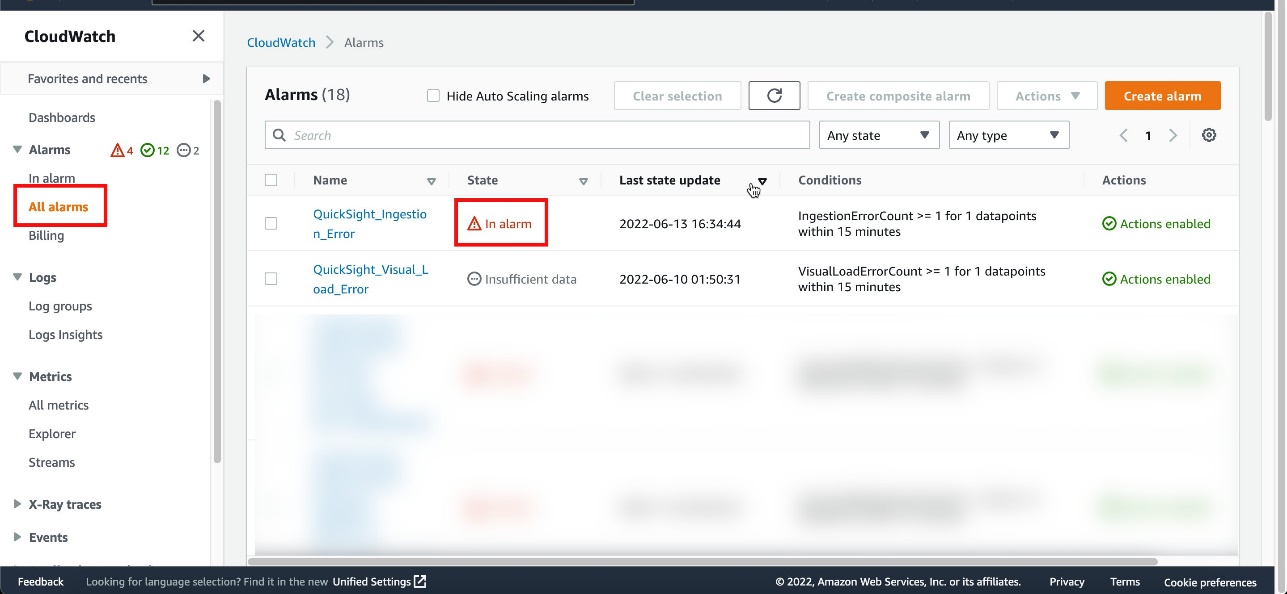
The alarm is now available on the CloudWatch console. If the visual fails to load, the VisualLoadErrorCount value becomes 1 or more (depending on the number of times the dashboard is invoked) and the alarm state is set to In alarm.

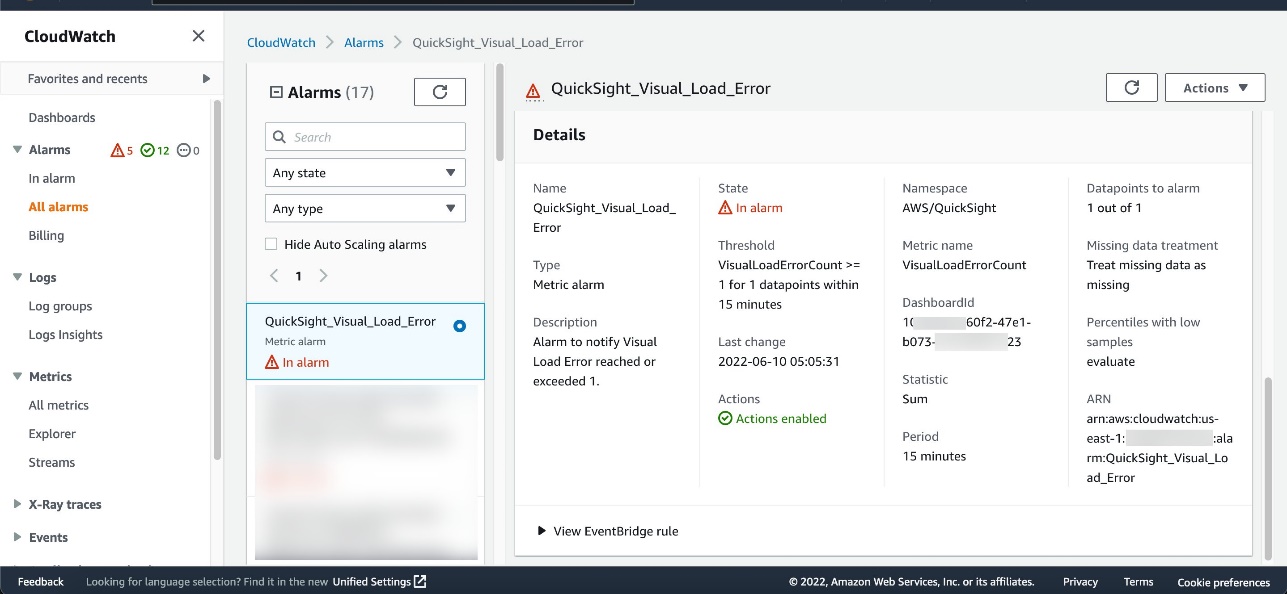
Choose the alarm to get more details.
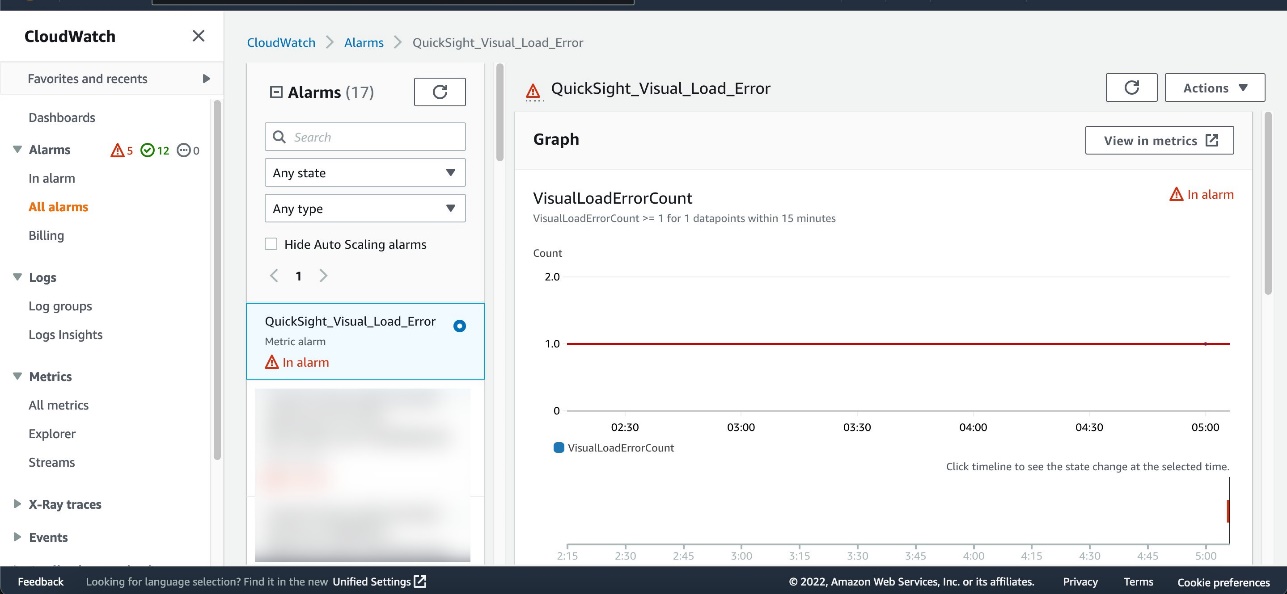
You can scroll down for more information about the alarm.
OkTank also receives an email to the email endpoint defined in the Amazon Simple Notification Service (Amazon SNS) topic.

Ingestion failures
OkTank wants to be alerted if any scheduled SPICE data ingestion fails, so that they can act right away and make sure their readers don’t experience any interruptions. This allows the administrator to find out the root cause of the SPICE ingestion failure (for example, an overloaded database instance) and fix it to ensure the latest data is available in the dependent dashboards.
They take the following steps to monitor and set up an alarm:
- On the monitoring console, choose the plus sign.
- In the Add widget section, choose Line.
- In the Add to this dashboard section, choose Metrics.
- On the Browse tab, choose QuickSight.
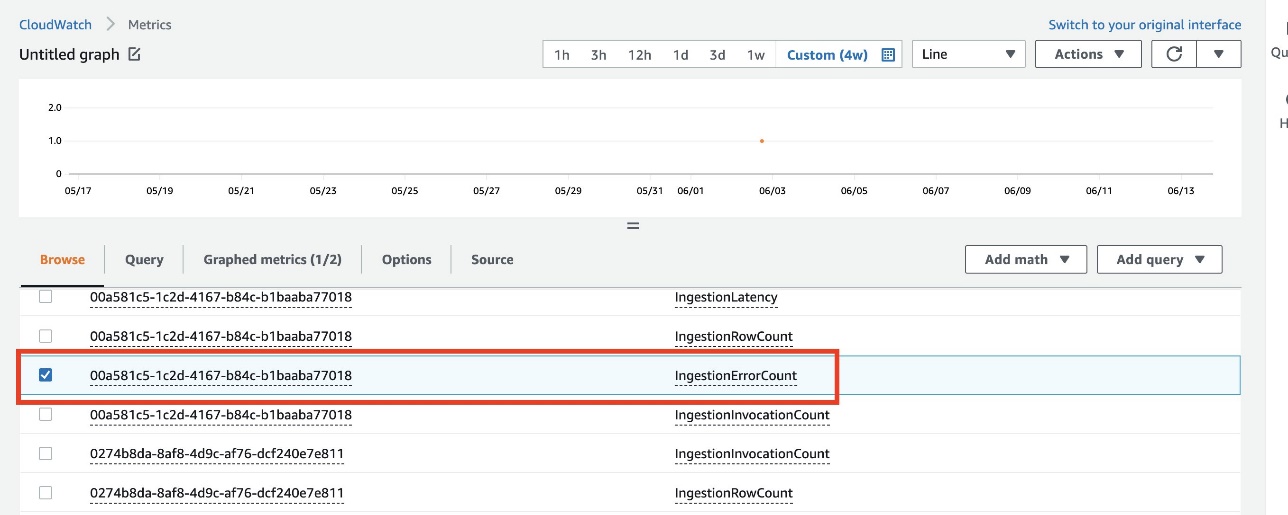
- Choose Ingestion metrics.
- Choose the
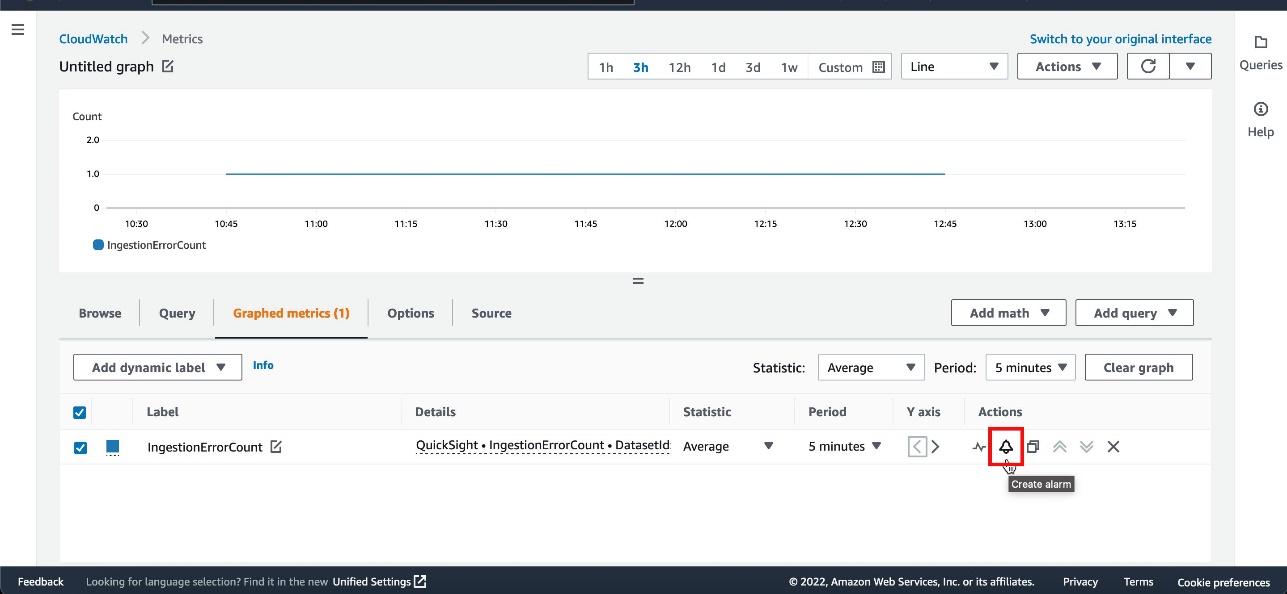
IngestionErrorCountmetric of the dataset and configure the time period on the menu above the chart.

- Follow the same steps as in the previous section to set up an alarm.

When ingestion fails for the dataset, the alarm changes to an In Alarm state and you receive an email notification.
The following screenshot shows an example of the email.

Conclusion
With QuickSight metrics in CloudWatch, QuickSight developers and administrators can observe and respond to the availability and performance of their QuickSight ecosystem in near-real time. They can monitor dataset ingestions, dashboards, and visuals to provide end-users of QuickSight and applications that embed QuickSight dashboards with a consistent, performant, and uninterrupted experience.
Try out QuickSight metrics in Amazon CloudWatch to monitor your Amazon QuickSight deployments, and share your feedback and questions in the comments.
About the Authors
 Mayank Agarwal is a product manager for Amazon QuickSight, AWS’ cloud-native, fully managed BI service. He focuses on account administration, governance and developer experience. He started his career as an embedded software engineer developing handheld devices. Prior to QuickSight he was leading engineering teams at Credence ID, developing custom mobile embedded device and web solutions using AWS services that make biometric enrollment and identification fast, intuitive, and cost-effective for Government sector, healthcare and transaction security applications.
 Raj Jayaraman is a Senior Specialist Solutions Architect for Amazon QuickSight. Raj focuses on helping customers develop sample dashboards, embed analytics and adopt BI design patterns and best practices.