Recently, we released a major report analyzing the threat landscape of Japan, the globe’s third largest economy. In that report we looked at the ways in which threat actors infiltrate Japanese companies (spoiler alert: it is often through foreign subsidiaries and affiliates) and some of the most pervasive threats those companies face such as ransomware and state-sponsored threat actors.
We also took a look at some of the hardest hit industries and it should come as no surprise that some of the most commonly attacked companies are in industries where Japan currently excels on a global scale. Think manufacturing and automotive, technology & media, and financial services.
In these blog posts we’re going to briefly discuss the findings for one of those industries, but rest assured, more information can be found in our one-page rundowns and the report itself.
Financial services companies are prime targets for attackers around the world but Japan’s robust and global financial industry makes it particularly attractive for cyber criminals and a major risk for millions of people. Attacks on financial services companies often come from two directions, seeking the personally identifiable information, or PII, of customers, and that of employees themselves.
When it comes to customer data, phishing was the most common way attackers sought to access it with 31% of all attacks coming in this form since 2021. Of note, English was the most frequently used language in these phishing attacks. The use of English rather than Japanese, a language that relatively few foreigners speak, highlights the degree to which language barriers impact the targeting of Japan.
Cryptocurrency exchanges were also major targets as cyber attackers, specifically those that are state-sponsored (more on that in the report) seek out crypto due to its ability to operate outside of traditional financial institutions. For more detail on the threat landscape of the financial services industry in Japan check out our report, or the handy one-page brief specifically looking at this industry.
This post was originally published in 2018 and updated in 2021. We’re sharing an update to this post to provide the latest information on VMs and containers.
Both virtual machines (VMs) and containers help you optimize computer hardware and software resources via virtualization.
Containers have been around for a while, but their broad adoption over the past few years has fundamentally changed IT practices. On the other hand, VMs have enjoyed enduring popularity, maintaining their presence across data centers of various scales.
As you think about how to run services and build applications in the cloud, these virtualization techniques can help you do so faster and more efficiently. Today, we’re digging into how they work, how they compare to each other, and how to use them to drive your organization’s digital transformation.
First, the Basics: Some Definitions
What Is Virtualization?
Virtualization is the process of creating a virtual version or representation of computing resources like servers, storage devices, operating systems (OS), or networks that are abstracted from the physical computing hardware. This abstraction enables greater flexibility, scalability, and agility in managing and deploying computing resources. You can create multiple virtual computers from the hardware and software components of a single machine. You can think of it as essentially a computer-generated computer.
What Is a Hypervisor?
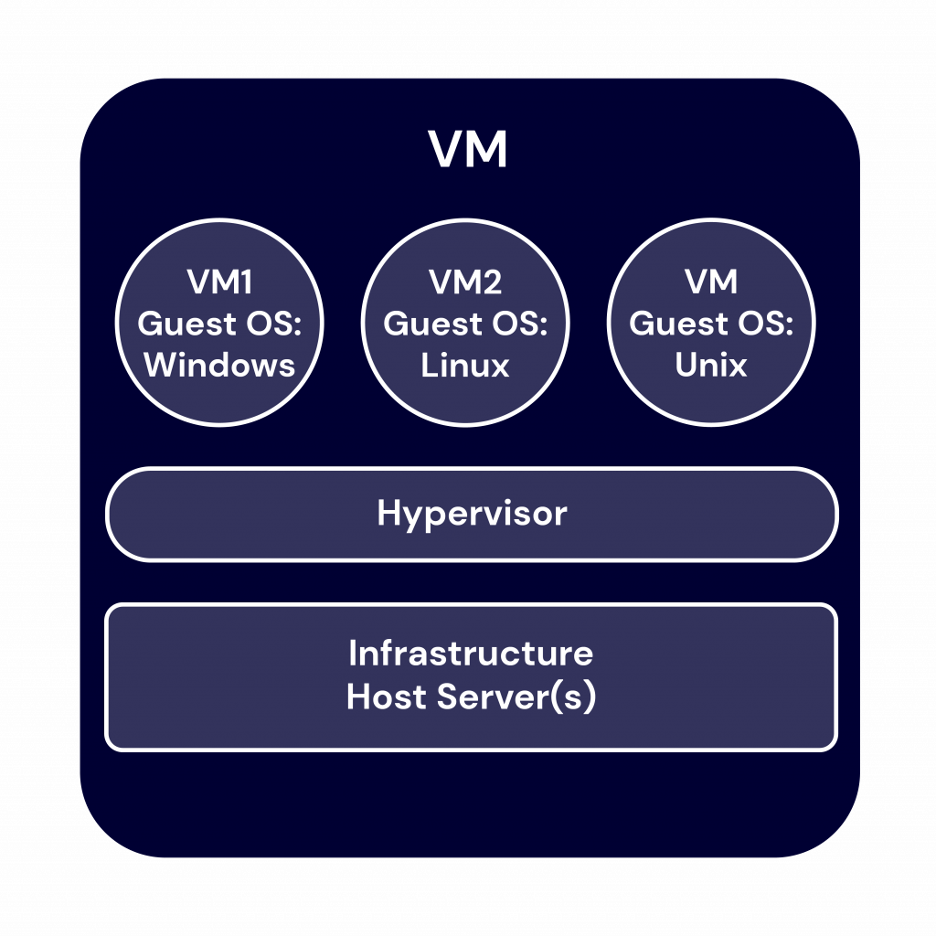
The software that enables the creation and management of virtual computing environments is called a hypervisor. It’s a lightweight software or firmware layer that sits between the physical hardware and the virtualized environments and allows multiple operating systems to run concurrently on a single physical machine. The hypervisor abstracts and partitions the underlying hardware resources, such as central processing units (CPUs), memory, storage, and networking, and allocates them to the virtual environments. You can think of the hypervisor as the middleman that pulls resources from the raw materials of your infrastructure and directs them to the various computing instances.
There are two types of hypervisors:
Type 1, bare-metal hypervisors, run directly on the hardware.
Type 2 hypervisors operate within a host operating system.
Hypervisors are fundamental to virtualization technology, enabling efficient utilization and management of computing resources.
VMs and Containers
What Are VMs?
The computer-generated computers that virtualization makes possible are known as virtual machines (VMs)—separate virtual computers running on one set of hardware or a pool of hardware. Each virtual machine acts as an isolated and self-contained environment, complete with its own virtual hardware components, including CPU, memory, storage, and network interfaces. The hypervisor allocates and manages resources, ensuring each VM has its fair share and preventing interference between them.
Each VM requires its own OS. Thus each VM can host a different OS, enabling diverse software environments and applications to exist without conflict on the same machine. VMs provide a level of isolation, ensuring that failures or issues within one VM do not impact others on the same hardware. They also enable efficient testing and development environments, as developers can create VM snapshots to capture specific system states for experimentation or rollbacks. VMs also offer the ability to easily migrate or clone instances, making it convenient to scale resources or create backups.
Since the advent of affordable virtualization technology and cloud computing services, IT departments large and small have embraced VMs as a way to lower costs and increase efficiencies.
VMs, however, can take up a lot of system resources. Each VM runs not just a full copy of an OS, but a virtual copy of all the hardware that the operating system needs to run. It’s why VMs are sometimes associated with the term “monolithic”—they’re single, all-in-one units commonly used to run applications built as single, large files. (The nickname, “monolithic,” will make a bit more sense after you learn more about containers below.) This quickly adds up to a lot of RAM and CPU cycles. They’re still economical compared to running separate actual computers, but for some use cases, particularly applications, it can be overkill, which led to the development of containers.
Benefits of VMs
All OS resources available to apps.
Well-established functionality.
Robust management tools.
Well-known security tools and controls.
The ability to run different OS on one physical machine.
Cost savings compared to running separate, physical machines.
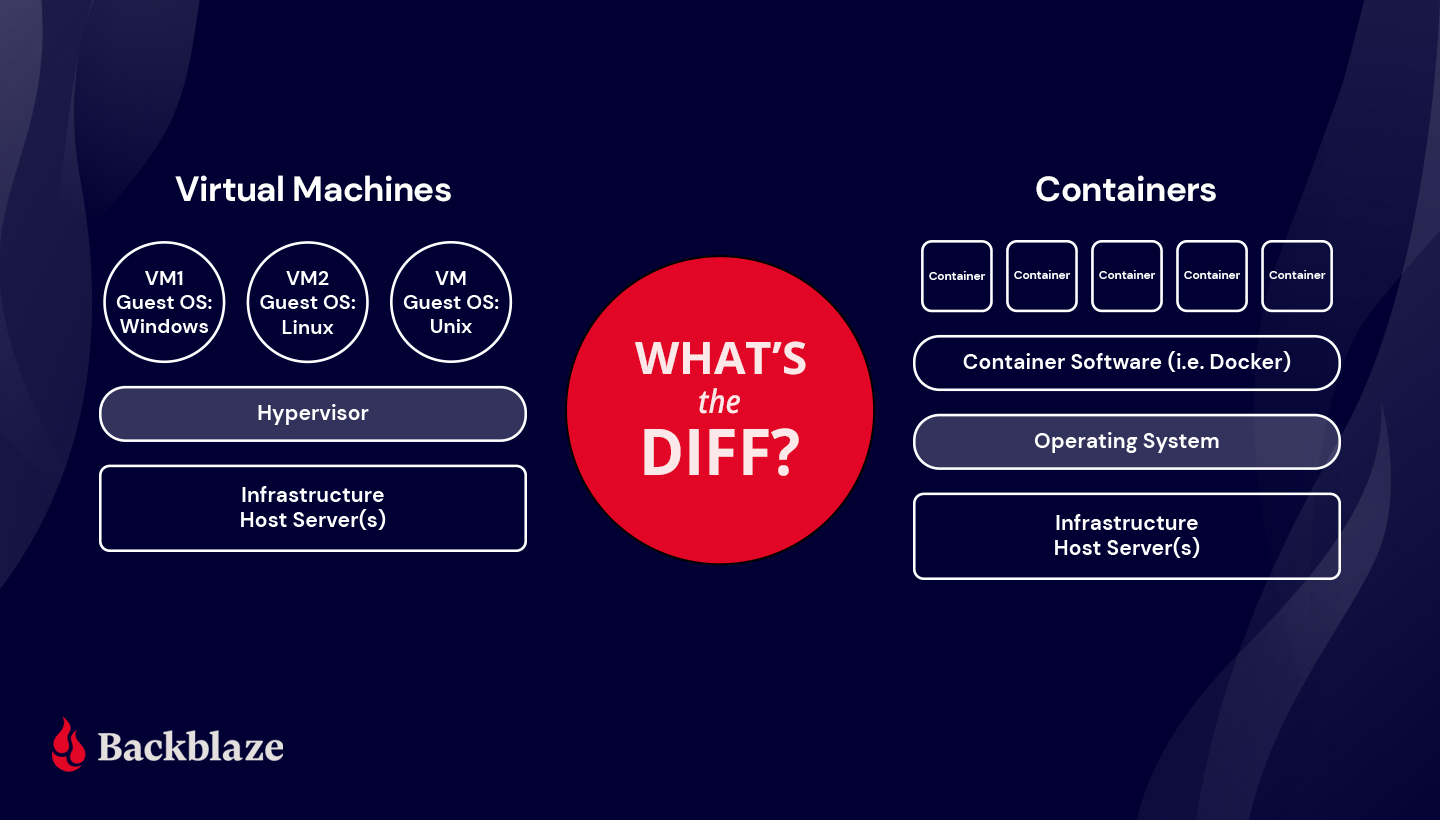
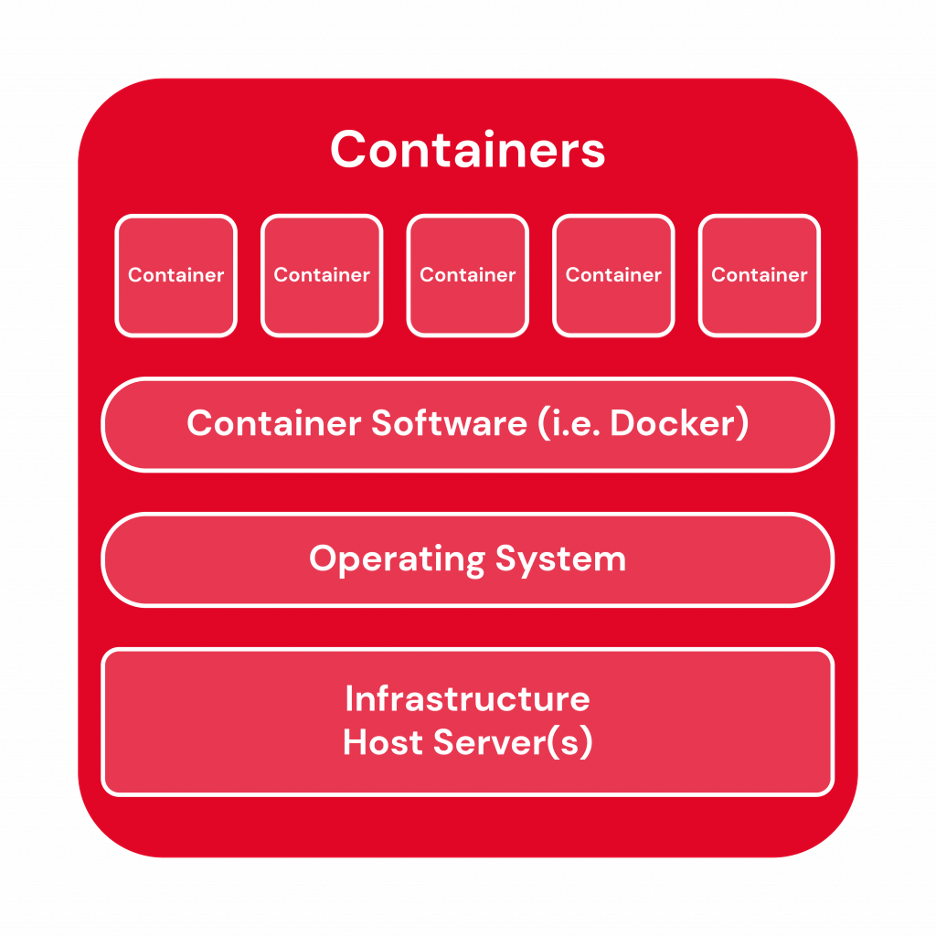
With containers, instead of virtualizing an entire computer like a VM, just the OS is virtualized.
Containers sit on top of a physical server and its host OS—typically Linux or Windows. Each container shares the host OS kernel and, usually, the binaries and libraries, too, resulting in more efficient resource utilization. (See below for definitions if you’re not familiar with these terms.) Shared components are read-only.
Why are they more efficient? Sharing OS resources, such as libraries, significantly reduces the need to reproduce the operating system code—a server can run multiple workloads with a single operating system installation. That makes containers lightweight and portable—they are only megabytes in size and take just seconds to start. What this means in practice is you can put two to three times as many applications on a single server with containers than you can with a VM. Compared to containers, VMs take minutes to run and are an order of magnitude larger than an equivalent container, measured in gigabytes versus megabytes.
Container technology has existed for a long time, but the launch of Docker in 2013 made containers essentially industry standard for application and software development. Technologies like Docker or Kubernetes to create isolated environments for applications. And containers solve the problem of environment inconsistency—the old “works on my machine” problem often encountered in software development and deployment.
Developers generally write code locally, say on their laptop, then deploy that code on a server. Any differences between those environments—software versions, permissions, database access, etc.—leads to bugs. With containers, developers can create a portable, packaged unit that contains all of the dependencies needed for that unit to run in any environment whether it’s local, development, testing, or production. This portability is one of containers’ key advantages.
Containers also offer scalability, as multiple instances of a containerized application can be deployed and managed in parallel, allowing for efficient resource allocation and responsiveness to changing demand.
Microservices architectures for application development evolved out of this container boom. With containers, applications could be broken down into their smallest component parts or “services” that serve a single purpose, and those services could be developed and deployed independently of each other instead of in one monolithic unit.
For example, let’s say you have an app that allows customers to buy anything in the world. You might have a search bar, a shopping cart, a buy button, etc. Each of those “services” can exist in their own container, so that if, say, the search bar fails due to high load, it doesn’t bring the whole thing down. And that’s how you get your Prime Day deals today.
More Definitions: Binaries, Libraries, and Kernels
Binaries: In general, binaries are non-text files made up of ones and zeros that tell a processor how to execute a program.
Libraries: Libraries are sets of prewritten code that a program can use to do either common or specialized things. They allow developers to avoid rewriting the same code over and over.
Kernels: Kernels are the ringleaders of the OS. They’re the core programming at the center that controls all other parts of the operating system.
Container Tools
Linux Containers (LXC): Commonly known as LXC, these are the original Linux container technology. LXC is a Linux operating system-level virtualization method for running multiple isolated Linux systems on a single host.
Docker: Originally conceived as an initiative to develop LXC containers for individual applications, Docker revolutionized the container landscape by introducing significant enhancements to improve their portability and versatility. Gradually evolving into an independent container runtime environment, Docker emerged as a prominent Linux utility, enabling the seamless creation, transportation, and execution of containers with remarkable efficiency.
Kubernetes: Kubernetes, though not a container software in its essence, serves as a vital container orchestrator. In the realm of cloud-native architecture and microservices, where applications deploy numerous containers ranging from hundreds to thousands or even billions, Kubernetes plays a crucial role in automating the comprehensive management of these containers. While Kubernetes relies on complementary tools like Docker to function seamlessly, it’s such a big name in the container space it wouldn’t be a container post without mentioning it.
Benefits of Containers
Reduced IT management resources.
Faster spin ups.
Smaller size means one physical machine can host many containers.
Reduced and simplified security updates.
Less code to transfer, migrate, and upload workloads.
What’s the Diff: VMs vs. Containers
The virtual machine versus container debate gets at the heart of the debate between traditional IT architecture and contemporary DevOps practices.
VMs have been, and continue to be, tremendously popular and useful, but sadly for them, they now carry the term “monolithic” with them wherever they go like a 25-ton Stonehenge around the neck. Containers, meanwhile, pushed the old gods aside, bedecked in the glittering mantle of “microservices.” Cute.
To offer another quirky tech metaphor, VMs are to containers what glamping is to ultralight backpacking. Both equip you with everything you need to survive in the wilds of virtualization. Both are portable, but containers will get you farther, faster, if that’s your goal. And while VMs bring everything and the kitchen sink, containers leave the toothbrush at home to cut weight. To make a more direct comparison, we’ve consolidated the differences into a handy table:
VMs
Containers
Heavyweight.
Lightweight.
Limited performance.
Native performance.
Each VM runs in its own OS.
All containers share the host OS.
Hardware-level virtualization.
OS virtualization.
Startup time in minutes.
Startup time in milliseconds.
Allocates required memory.
Requires less memory space.
Fully isolated and hence more secure.
Process-level isolation, possibly less secure.
Uses for VMs vs. Uses for Containers
Both containers and VMs have benefits and drawbacks, and the ultimate decision will depend on your specific needs.
When it comes to selecting the appropriate technology for your workloads, virtual machines (VMs) excel in situations where applications demand complete access to the operating system’s resources and functionality. When you need to run multiple applications on servers, or have a wide variety of operating systems to manage, VMs are your best choice. If you have an existing monolithic application that you don’t plan to or need to refactor into microservices, VMs will continue to serve your use case well.
Containers are a better choice when your biggest priority is maximizing the number of applications or services running on a minimal number of servers and when you need maximum portability. If you are developing a new app and you want to use a microservices architecture for scalability and portability, containers are the way to go. Containers shine when it comes to cloud-native application development based on a microservices architecture.
You can also run containers on a virtual machine, making the question less of an either/or and more of an exercise in understanding which technology makes the most sense for your workloads.
In a nutshell:
VMs help companies make the most of their infrastructure resources by expanding the number of machines you can squeeze out of a finite amount of hardware and software.
Containers help companies make the most of the development resources by enabling microservices and DevOps practices.
Are You Using VMs, Containers, or Both?
If you are using VMs or containers, we’d love to hear from you about what you’re using and how you’re using them. Drop a note in the comments.
The page structure sits at the core of the kernel’s
memory-management subsystem; one such structure exists for every page of
installed RAM. This structure is increasingly seen as a problem, though,
and phasing it out is one of the many side projects associated with the folio conversion. One step in that direction
is currently meeting some pushback from memory-management developers,
though, who think that some of these changes are coming too soon.
Security updates have been issued by Debian (lemonldap-ng and php-dompdf), Red Hat (.NET 6.0, .NET 7.0, firefox, and thunderbird), Scientific Linux (firefox and thunderbird), SUSE (ghostscript, installation-images, kernel, php7, python, and python-Django), and Ubuntu (linux-azure, linux-gcp, linux-ibm, linux-oracle, mozjs102, postgresql-9.5, and tiff).
Големите управляващи коалиции в България си намират външнополитически основания. Членството в Европейския съюз обоснова правителството на тройната коалиция – БСП, ДПС и НДСВ. Заради Шенген, еврозоната и войната в Украйна ПП–ДБ получава подкрепа от ГЕРБ–СДС, а те пък очакват да им дойде ротацията след по-малко от 9 месеца и да управляват със свой кабинет.
Така Европа и западните съюзници получават предвидим партньор в лицето на България, а българското общество – халтава сглобка, чиито съставни части се борят със стръв за места в регулаторите и институциите с няколкогодишни мандати. Към сглобката бе прилепено и ДПС – чрез формулата за „конституционно мнозинство“ и със съдействието на ГЕРБ. Ето че „добрите“ и „лошите“ вече са едно управление – нито „добро“, нито „лошо“, нито добролошо, но със сигурност трудно за преглъщане от избирателите на ПП–ДБ.
„Пропагандният приапизъм“ (израз, с който коментатор в социалните мрежи определи пилона в Рожен) вече отстъпи място на прагматизма, предпочитан от политиците в не-изборни времена. Особено при подялбата на постове, от чиито решения зависят много бизнеси и разпределяне на милиарди.
Подбор в тесен (троен) кръг
Вече няма съмнение, че коалиционно споразумение няма да има. Заглъхнаха всякакви сигнали и от ПП–ДБ, и от ГЕРБ–СДС да има някакви публично известни правила, по които ще стават назначенията, а през това време ДПС тихо консумира, без да вдига шум. Modus operandi e намерен, след като се разпределят позиции в регулатори и институции. Изчезна и онази първоначална свенливост на обединените в не-коалиция политически сили.
В Народното събрание става раздаването на председателските места в постоянните комисии, в резултат на което ГЕРБ–СДС взе 15, ДПС – пет, а ПП–ДБ – три. Гладкото протичане на гласуването е доказателство, че всичко е било предварително съгласувано. Председател на Бюджетната комисия стана Йордан Цонев (ДПС), един от най-големите критици на политиката на финансовия министър Асен Василев, а Делян Пеевски бе включен в Правната. Външната комисия оглави лидерът на ГЕРБ Бойко Борисов – огледално на позицията външен министър, която заема в правителството представителката на ГЕРБ Мария Габриел. Така Борисов, чието чисто съдебно минало не е заплашено от „Барселонагейт“, Иван Гешев или нещо друго, е видим в бяло за европейските и евроатлантическите партньори.
Синхрон като с комисиите се получава и с ръководството на БНБ – гуверньор за втори 6-годишен мандат остава Димитър Радев, кандидат на ГЕРБ–СДС. Въпреки че двамата подуправители не са официално обявени (формално Радев трябва да внесе кандидатурите им в парламента, след като бъде избран), най-вероятните ще са Андрей Гюров от ПП, неуспял кандидат за управител на БНБ в 47-мия парламент, и Петър Чобанов от ДПС. Това ще е екипът, който ще носи отговорността за присъединяването на България към еврото, ако се въведе от 1 януари 2025 г. – заедно с третия подуправител Радослав Миленков от сферата на влияние на ГЕРБ & ДПС, чийто мандат изтича същата година.
Трудността да се споразумеят за управител на Здравната каса, след като не бе харесана кандидатката на ГЕРБ Иванка Динева, предизвика промяна на закона – подуправителят да изпълнява безсрочно длъжността до избирането на титуляр. Едва ли ГЕРБ и ДПС ще позволят някой извън тяхната сфера на влияние да разпределя бюджета на НЗОК – 7,27 млрд. лв. за тази година, с 910 млн. повече от предходната. Лъвският пай от тази сума винаги е за болниците – почти 50%, макар за 2023 г. да е 45%. Средно за ЕС този процент е 30%, тъй като в развитите европейски държави ударението е върху превенцията.
Сметната палата, чиято работа е да следи целесъобразно и ефективно ли се харчат публичните средства, също ще получи гербер за шеф. Партията на Бойко Борисов издигна лоялен партиец – Димитър Главчев, за председател на институцията, от която зависят контролът и (не)прикриването на корупцията. ПП–ДБ не възразяват.
До началото на парламентарната ваканция през август остават две седмици и управляващото мнозинство едва ли ще премине и към другите регулатори, които очакват обновяване – КЕВР, КФН, КЗК и др. Още повече че към момента не са назначени и всички областни управители. Първите шест от общо 28 станаха известни тази седмица и те са на София-град, Пловдив, Ловеч, Плевен, Добрич и Силистра. До избора на следващите по местата си остават избраните от служебния кабинет на президента.
Съдебната реформа – възпряна от реформаторите
Крехкият позитивизъм покрай съставянето на правителството бързо се разсея заради правените на тъмно кадрови договорки. И не само. 45 дни след като окончателно беше приет механизмът за контрол на главния прокурор, очакван 12 години, конституционното мнозинство – ПП–ДБ, ГЕРБ–СДС и ДПС, реши да поправи промените в Наказателно-процесуалния кодекс и Закона за съдебната власт, които го въвеждат. Без публични обяснения и ясна обосновка. С подписите на Десислава Атанасова (ГЕРБ), Кирил Петков (ПП–ДБ), Атанас Атанасов (ПП–ДБ), Надежда Йорданова (ПП–ДБ) и Хамид Хамид (ДПС) беше предложено изборът на разследващ главния прокурор да става по нова, несъздадена още система, различна от Единната информационна система на съдилищата (EИСС).
ЕИСС е платформа за управление на съдебните дела, създадена от държавната фирма „Информационно обслужване“, която обхваща всички съдилища, и чрез нея се генерира случайното разпределение на делата. Процесът е обвеян със съмнения за неслучайност при някои дела. Както отбелязаха юристи, излиза, че за разследващ главния прокурор се прави специална система, но не се променя ЕИСС за останалите дела. Заместник-председателката на Върховния касационен съд Лада Паунова отбеляза по повода, че това ще срине доверието в настоящата система.
Законопроектът се появи веднага след като на случаен принцип във ВКС от 22-ма съдии, съгласили се да разследват престъпления на главния прокурор, беше избрана съдия Даниела Талева за ad hoc прокурор. Тя трябваше да разследва сигнали, сред които и за имотното състояние, срещу изпълняващия функцията главен прокурор Борислав Сарафов. Прокурорската колегия на ВСС – същата, която бързо-бързо избра Сарафов за и.ф., обаче отказа да я назначи.
Намериха се и мотиви, и те са същите, с които прокурорската колегия спря процедурата за избор на нов главен прокурор – делото пред Конституционния съд, образувано по искане на бившия главен прокурор Иван Гешев. Той оспорва законовите промени, които въвеждат механизма за разследване на обвинител №1. Със същия аргумент конституционното мнозинство – ГЕРБ–СДС, ПП–ДБ и ДПС, призова в безпрецедентна декларация ВСС да прекрати процедурата за избор на нов главен прокурор, добавяйки и предвижданите промени в Конституцията (които ще станат неясно кога).
Резултатът от всички тези действия е, че Сарафов – дясната ръка на Гешев, обърнала се срещу него, може да си отдъхне, и то задълго. Нищо не го застрашава. Няма законови санкции за прокурорската колегия, ако блокира назначаването на разследващ главния прокурор – законодателите от ГЕРБ, ПП–ДБ и ДПС не ги разписаха. А срок, в който да стане, не е посочен. Така че няма особена сила призивът на правосъдния министър Атанас Славов прокурорската колегия на ВСС да продължи започналата процедура по механизма за разследване на главния прокурор и неговите заместници, като назначи съдия Даниела Талева за прокурор, работещ по сигналите срещу Сарафов.
Не е ясно и колко бързо ще се направи нова система за избор. Когато един ден стане готова, пак ще има избор на прокурор ad hoc, но няма да е Талева.
Наред с промяната в механизма за разследващ главния прокурор, от три на шест месеца беше удължен срокът, в който да бъде избран нов Висш съдебен съвет, който пък трябва да избере нов главен прокурор. Мандатът на настоящия ВСС е изтекъл миналата година и вместо да избере нов, както повелява законът, парламентарното мнозинство определи през май т.г. един срок, който се оказа, че няма да изпълни – и повторно го удължи.
Всички тези законодателни промени минаха през Правната комисия скорострелно, както и предишните. Също така спешно бяха внесени в пленарната зала, бързичко и без шум приети, а срокът между първо и второ четене – съкратен на три дни.
Случващото се хвърля сянка върху реформаторите, след като фундаментът на тяхната реформа е на поправителен малко повече от месец след приемането му, което произведе шумни аплаузи. Заради приемането на механизма 49-тият парламент избра най-напред председател на Правната комисия – единствената с такъв в продължение на няколко седмици.
Е, ако не друго, конституционното мнозинство работи – макар и не по Конституцията.
On the week of July 10, 2023, we launched a new capability for Zone Versioning – Version Comparisons. With Version Comparisons, you can quickly get a side by side glance of what changes were made between two versions. This makes it easier to evaluate that a new version of your zone’s configuration is correct before deploying to production.
A quick recap about Zone Versioning
Zone Versioning was launched at the start of 2023 to all Cloudflare Enterprise customers and allows you to create and manage independent versions of your zone configuration. This enables you to safely configure a set of configuration changes and progressively roll out those changes together to predefined environments of traffic. Having the ability to carefully test changes in a test or staging environment before deploying them to production, can help catch configuration issues before they can have a large impact on your zone’s traffic. See the general availability announcement blog for a deeper dive on the overall capability.
Why we built Version Comparisons
Diff is a well known and often used tool by many software developers to quickly understand the difference between two files. While originally just a command line utility it is now ubiquitous across the software world. Most commonly used in code reviews, software developers use ‘diffs’ to ensure they can validate the set of changes they intend to make to a codebase and to allow others to easily review their code by focusing on what changed. One of the drawbacks of graphical user interfaces (GUIs) for managing configurations is since they aren’t ‘files’, tools like diff don’t work for them. This was true with Zone Versioning, as to try and understand what had changed between two versions you would need to manually inspect each version and the various sections of the dashboard across both versions. This is quite tedious and error-prone, so it can reduce the safety that versioning can provide.
With Version Comparisons, we are bringing the same capabilities of diff but without the need for using a command line to allow customers to compare two versions side by side. This makes the process of understanding which configurations of your zone changed between two versions easy, quick and painless. By pointing out which config has changed, you can have greater confidence that deploying a new version of your configuration will not create any surprises. Let’s now look at how to use Version Comparisons in the Cloudflare Dashboard.
Using Version Comparisons
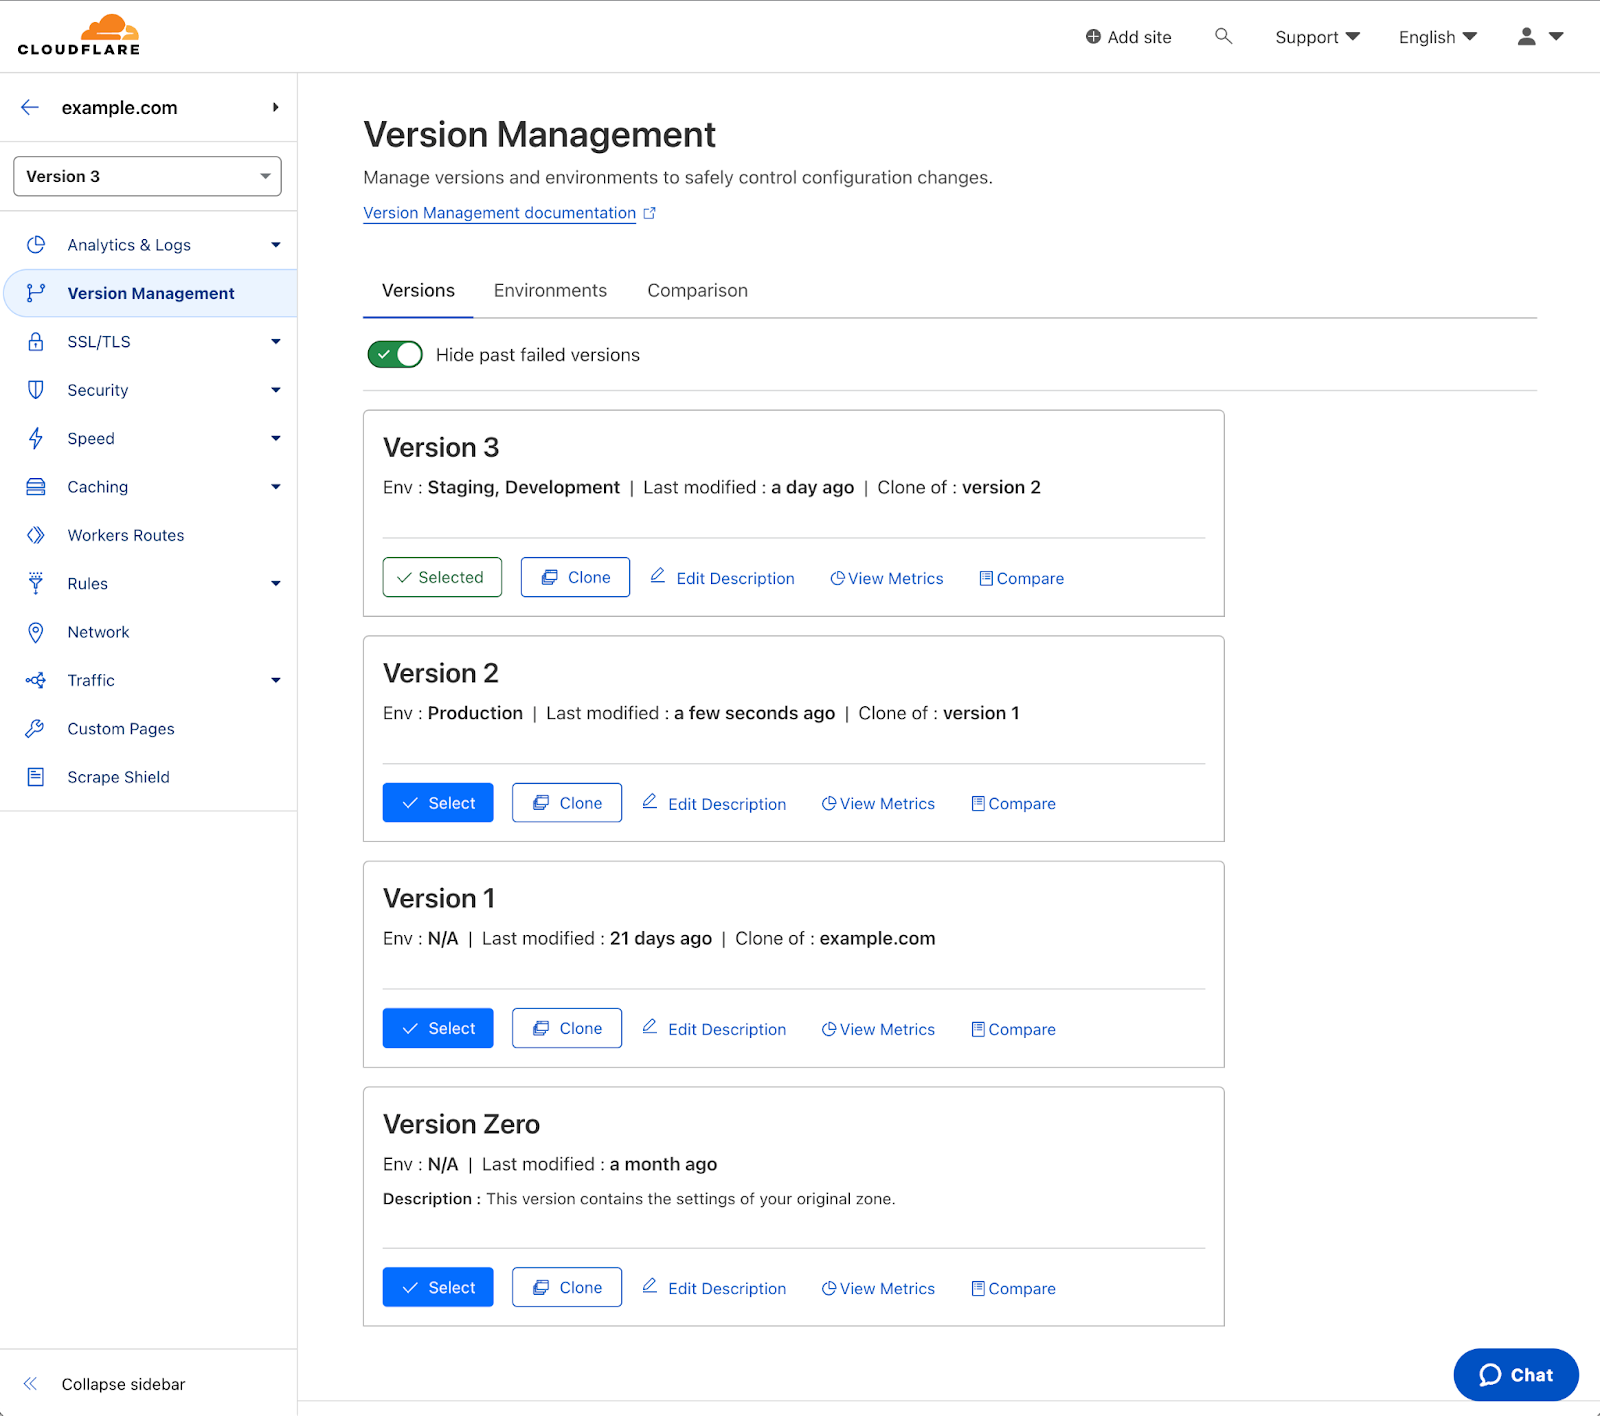
After navigating to a zone that has Zone Versioning enabled, select ‘Version Management’ in the left-hand navigation. For help getting started with Zone Versioning, see our dev docs.
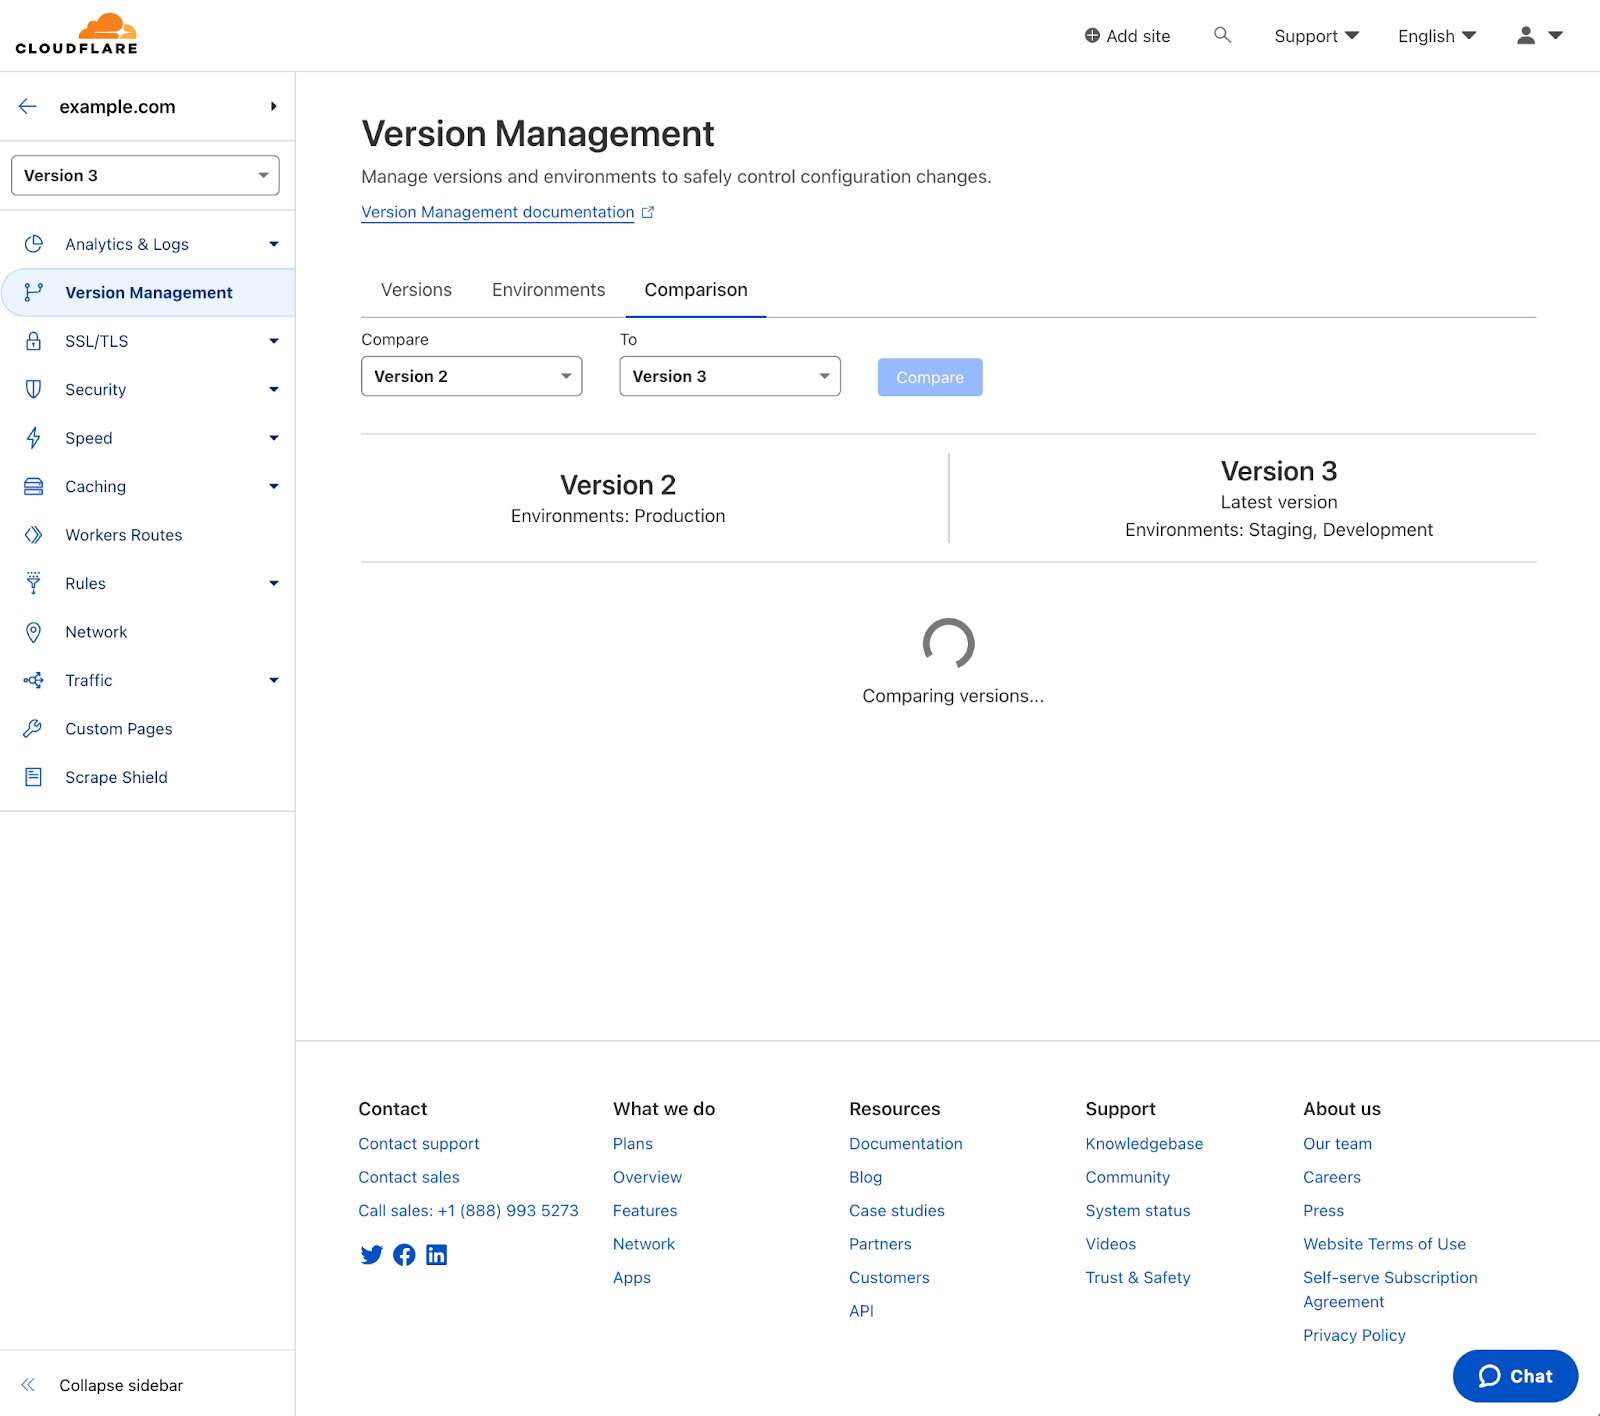
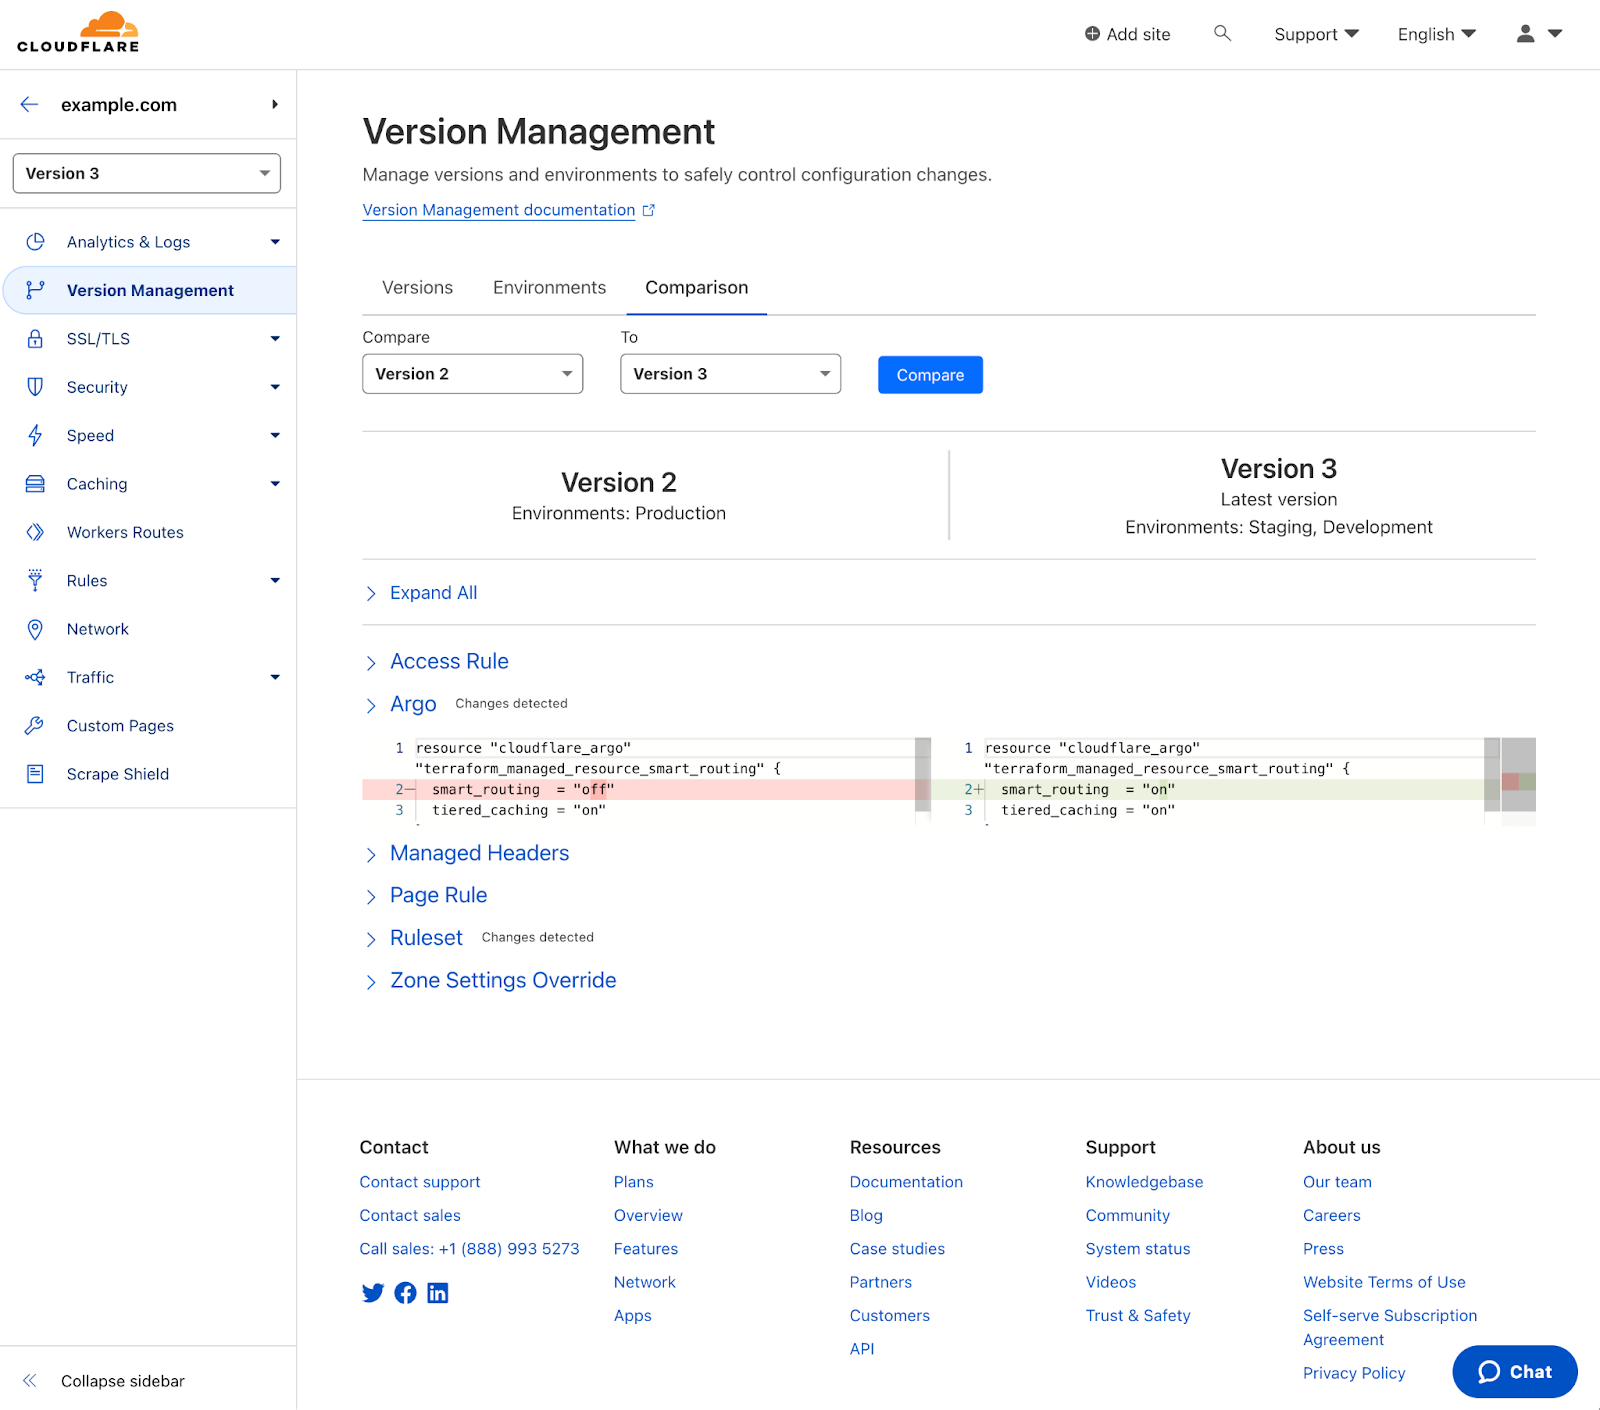
After selecting the ‘Version Management’ tab you will notice a third option – ‘Comparisons’. Selecting that will prompt you to select two versions to compare. Select the two version you want to compare and then select ‘Compare’
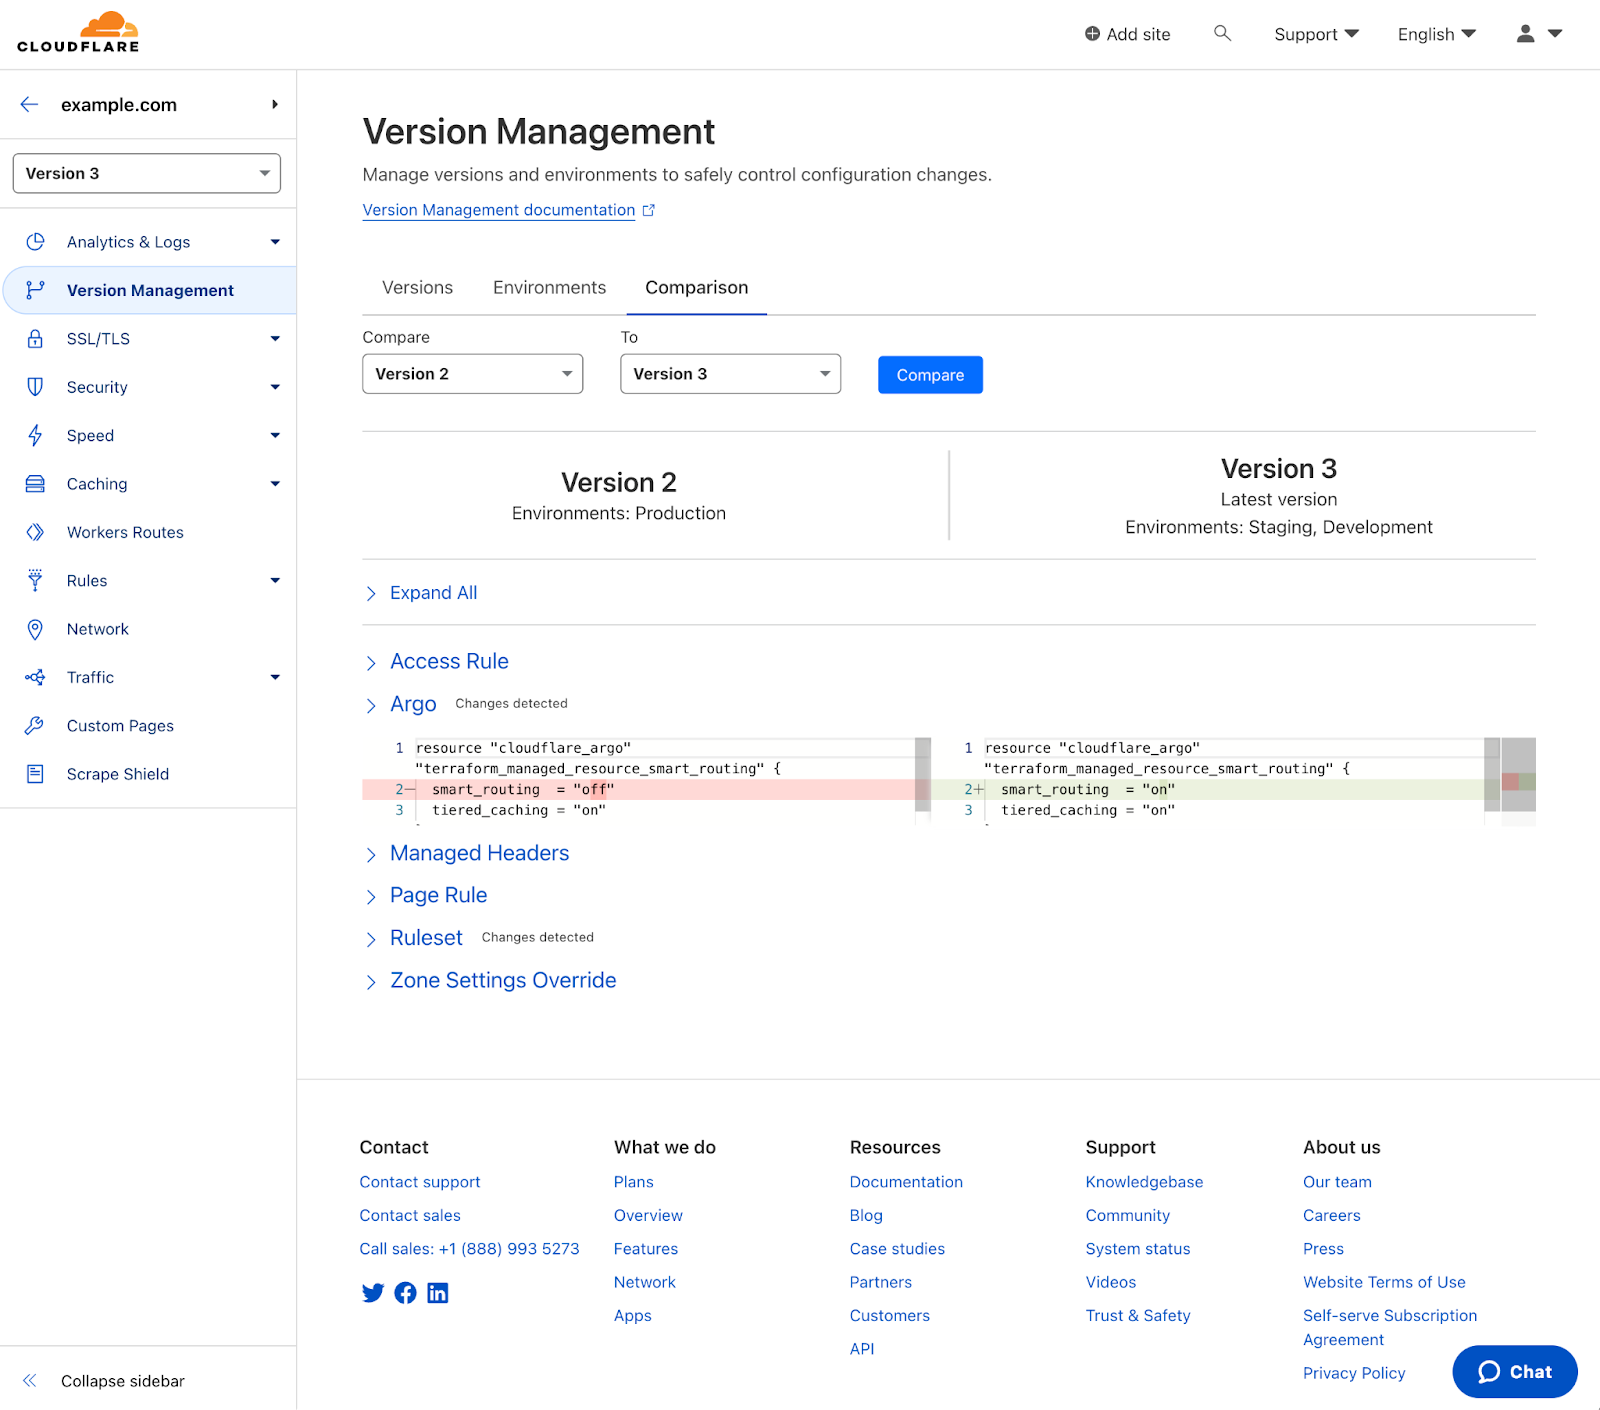
After a few seconds, the page will update automatically with a comparison on a per-product basis. The lower numbered version will always be presented on the left and the top will show you which environments the versions are assigned to so that you can ensure you are comparing the right versions. A common use case would be to compare the versions in staging and production to verify the changes before promoting the staging version to production.
Any products with changes will have ‘changes detected’ noted next to them. Selecting one will open up the diff of that product across both versions.
Changes will be highlighted for new additions and removals for that service. Based on the comparison, you can then decide if more changes are necessary or if that new version is ready to be rolled out.
Try out Version Comparisons today
Versions comparisons are available to all customers using Zone Versioning! If you are a Cloudflare Enterprise customer, to get started using Zone Versioning and Version Comparisons, check out our dev docs.
През последните 10–15 години възможностите за редактиране на генома на културните растения се разшириха значително и учените вече имат по-прецизни и по-лесни за употреба инструменти, като ZFNs, TALENs и най-новия CRISPR/Cas9. Тези методи са основата на т.нар. нови геномни техники (НГТ) и бяха в своеобразна сива зона в Европа, защото нямаше пълна яснота дали растенията, получени с тяхна помощ, попадат в категорията на „класическите“ ГМО.
С решение на Съда на Европейския съюз от средата на 2018 г. бе установено, че към новите геномни техники ще се прилага съществуващото законодателство за ГМО. Въпреки че позицията на повечето учени, включително от Европейския орган за безопасност на храните (ЕОБХ), е, че те са по-безопасни от старите методи за генетични манипулации, това решение донякъде не беше изненада поради традиционно консервативния подход на ЕС в тази област.
Но ситуацията може да се промени – след проучване на НГТ Европейската комисия предлага преразглеждане на сегашните регулации и облекчаването им за някои растения. В предложението се въвеждат две категории, в които ще попадат растенията в зависимост от вида, броя и размера на генетичните модификации на генома.
Категория 1 ще покрива растения с промени, които може да се срещнат в природата или да се постигнат с традиционните техники за селекция. Това ограничава потенциалните промени до насочена мутагенеза (промяна на конкретни участъци от ДНК, в повечето случаи с цел инактивиране на гени) и цисгенеза (прехвърляне на генетичен материал от два близкородствени организма).
Преди пускането им на пазара те ще минават през процедура на верификация, но тя ще бъде значително облекчена и ускорена, а след това растенията ще бъдат третирани като получени от конвенционална селекция. Все пак при съществени промени на състава и хранителните им качества ще попадат под регулациите за нови храни в ЕС и ще минават за одобрение през ЕОБХ.
Може би най-спорната част е НГТ произходът да бъде означен само на семената, използвани от земеделците, а всички продукти, които стигат до крайния потребител, да бъдат разглеждани като конвенционални. Все пак тези растения няма да могат да се сертифицират като „органични“, което донякъде ще ги различава. Най-вероятно обект на възражения ще бъде и условието, че отделните страни членки няма да могат да забранят полските опити и отглеждането на тези растения.
В предложението се говори и за проследяемост, но е интересно как ще бъде реализиран този процес, защото за разлика от по-старите методи за намеса в генома, промяната с помощта на НГТ е недоловима.
За останалите растения (категория 2) ще продължат да важат сегашните регулации за ГМО. Тук ще се включват трансгенетичните растения (с вмъкнато ДНК от различни организми), растенията с екстензивни редакции и някои други изключения.
Предложението за промяна идва в динамичен момент в глобален мащаб. От особена важност е въвеждането на нови сортове, които ще са ключови за изхранването ни на фона на настъпващите климатични промени. Друг значим фактор е опасността от изоставане в сферата на генетичните редакции както в научен, така и икономически аспект. Регулациите за този тип генетични редакции са значително по-облекчени в САЩ, Индия, Китай, Великобритания и редица други държави, което прави развитието на иновации в сферата по-лесно и по-изгодно. В документа се споменават също пандемията от COVID-19 и войната в Украйна, разкрили външните зависимости на Европа.
Очаквано, научните среди и биотехнологичните компании приемат новината добре. Според оценката на ЕК промяната в регулациите би спестила милиони евро годишно и така разработването на нови сортове ще стане по-достъпно, а административните разходи ще намалеят. В подкрепа на предложението за облекчаване на регулациите е и организацията EU-SAGE („Устойчиво земеделие чрез генетични редакции в Европа“), в която членуват учени от над 150 европейски института, три от които български.
Редица организации се противопоставят със становището, че промените ще влошат качеството на храната. Има също опасения, че селекцията на нови видове ще бъде консолидирана в ограничен брой биотехнологични гиганти, което ще доведе до по-високи цени на семената, и ще бъде ограничена свободата на фермерите. Събрани са и над 400 000 подписа в петиция, която според организаторите ѝ ще покаже преобладаващото негативно мнение на жителите на ЕС.
В процеса на обсъждане най-вероятно ще настъпят промени в детайлите, но след като бъдат приети от ЕК, новите правила ще трябва да бъдат гласувани и в Европейския парламент, където също се очаква да има разгорещени дебати. Важното е, че дискусията е започнала и има възможност да се стигне до решение, което да е в крак с промените – както климатични, така и научни.
Планетата се затопля
За съжаление, глобалните климатични промени не чакат обсъжданията. В няколко поредни юлски дни бяха счупени температурните рекорди и се очаква2023-та да е най-горещата година от последните над 200, в които се правят точни измервания. Ако се включат и палеоклиматичните данни, този период може да достигне 120 000 години.
Справка в поддържания от Университета на Мейн Climate Reanalyzer показва, че средната глобална температура е достигнала 17,23°C на 6 юли. Един от рекордите е потвърден и от Европейската услуга за проследяване на климатичните промени, в която се използват данни от спътниците „Коперник“. Учените отбелязват, че това може да е вследствие на времето в Южното полукълбо и потока от необичайно горещ въздух над части от Антарктида, но промените са отчетени и в много други точки на света. В алжирския град Адрар температурата не е паднала под 39,6°C дори и през нощта. А след два смъртни случая в Пекин поради високите температури, в редица градове в Китай бяха отворени бомбоубежищата и бе забранена работата на открито.
Една от основните причини за високите температури е Ел Ниньо – топлата фаза на Южното колебание, чийто интензитет този път е особено висок. Това донякъде беше очаквано заради нехарактерно голямата продължителност на предхождащата студена фаза (Ла Ниня). Тъй като пикът на топлата фаза обикновено е между ноември и януари, се очаква ефектът му да се засили през идните месеци, като не е изключено да продължи и по-дълго от обичайното, както стана и при предхождащата Ла Ниня.
За интензитета на Ел Ниньо е ключова температурата на океанската вода, защото при него само се прехвърля топлина от океана към атмосферата. А океанът се затопля – според данни на Европейската услуга за проследяване на климатичните промени температурата на океана през юни е с 0,91°C над средната за периода 1979–2023 г. и с около 0,5°C по-висока от предишния юнски рекорд, отчетен през 2010 г. Особено топли са североизточните части на Атлантика, където температурите са достигнали 1,36°C над средното.
Поради затоплянето на горните слоеве на океана, изкачването на студената вода от дълбочините се забавя и се образува своеобразна възглавница от топла вода. Така топлината, която океанът е поел през трите години на Ла Ниня, сега се освобождава. Този фронт предизвиква и повече гръмотевични бури, което допълнително затопля атмосферата.
Високите температури са само едно от следствията на глобалните климатични промени. Водният цикъл на планетата също се влияе и променя по опасен начин. Испания е засегната от суша, която може да се окаже рекордна за последния век с 36 последователни месеца с валежи по-ниски от средната стойност. Съчетано с високите температури, това вещае катастрофална година за земеделците. Проблеми има и с питейната вода. Нивото на язовира Sau Reservoir в Каталуния е едва на 7% от капацитета му през април. Това е наложило и премахването на рибата от него, тъй като водата вече е била негодна за живот. На този фон наводнения в Индия засегнаха над половин милион души, като проливните дъждове са довели до преливането на река Беки и евакуацията на около 14 000 души. Наводнения с жертви имаше и в Япония и Турция.
В Канада бушуват опустошителни горски пожари, димът от които покри северните части на САЩ. Изгорели са над 9 млн. хектара – два пъти повече от обработваемите площи в България, а властите предупреждават, че тази година опасният сезон ще е по-продължителен. Мащабите са безпрецедентни и освен че имат унищожителни последици, пожарите ще влошат дългосрочно климата – въглеродните емисии са много по-високи от предходни години, а кумулативната топлина, отделена от огъня до момента, е почти два пъти повече, отколкото за цялата рекордна 2022 година. Най-вероятно ранното начало на сезона на пожарите се дължи на нехарактерните и дълги суши, комбинирани с необичайно високи температури. В началото на юли в северните части на провинция Квебек температурата е достигнала 34°C.
Промените са пагубни за всички обитатели на планетата. Затоплянето на океана, особено когато е рязко, както по време на Ел Ниньо, влияе зле и на обитателите му, и на птиците, които се хранят с тях. Ефектът от това не е незабавен, а може да се наблюдава след един до шест месеца според изследване на американски учени. Обобщени са данни от четири проекта за обследване на плажове, в които обучени доброволци броят мъртвите птици в конкретен участък.
Причините за смъртта на птиците са разнообразни, но повечето са свързани с променящите се екосистеми. Най-честата причина е промяна във видовия състав и размера на популациите в местата, в които те се хранят, водещо до гладна смърт. С промяната на самия океан е очаквано да настъпят промени и в организмите, които го обитават. Според авторите на статията мащабът на тези промени е голям и може да става въпрос за над милион загинали птици в периода 2014–2019 г. По-топлите води са добра среда за развитието на алги, които може да бъдат токсични за животните.
Топлинните вълни имат негативно влияние и върху насекомите. Ако температурата се повиши за три дни по време на възпроизвеждане, броят на потомството намалява двойно, а вероятността от успешно оплождане спада със 75%. Драстично спада и вероятността младите насекоми да оцелеят. Интересното е, че ако периодът на висока температура е малко преди или след периода на интимност, негативното му влияние е почти незначително. Резултатите от това изследване са важни, тъй като насекомите са основна част от хранителните вериги и над 89% от цъфтящите растения се опрашват от тях. В скорошна публикация е изказана хипотезата, че първите цъфтящи растения са били опрашвани от насекоми, а разпространението на полен с вятъра се е появило на по-късен етап.
Учените сигнализират за опасността от климатичните промени от десетилетия, но взетите мерки, изглежда, са твърде късни или недостатъчни. Протоколът от Киото и последващото Парижко споразумение дават рамка на световните правителства за намаляване на емисиите, но не е ясно дали те ще бъдат достатъчни. Планетата има известен буфер, най-вече в Световния океан, за поемане на допълнителна топлина, но той започва да се изчерпва и сме на ръба на събития, които ще бъдат каскадни и необратими. Въпреки че някои са скептични относно антропогенния характер на случващото се, то е факт и пред нас стоят множество проблеми, за които ще трябва да се намери решение.
Заглавно изображение: Язовир Sau Reservoir в Каталуния, заснет на 13 март 2023 г. Нивото на водоема е спаднало драстично оттогава. Снимка: European Union, Copernicus Sentinel-2 imagery
The first Republican primary debate has a popularity threshold to determine who gets to appear: 40,000 individual contributors. Now there are a lot of conventional ways a candidate can get that many contributors. Doug Burgum came up with a novel idea: buy them:
A long-shot contender at the bottom of recent polls, Mr. Burgum is offering $20 gift cards to the first 50,000 people who donate at least $1 to his campaign. And one lucky donor, as his campaign advertised on Facebook, will have the chance to win a Yeti Tundra 45 cooler that typically costs more than $300—just for donating at least $1.
It’s actually a pretty good idea. He could have spent the money on direct mail, or personalized social media ads, or television ads. Instead, he buys gift cards at maybe two-thirds of face value (sellers calculate the advertising value, the additional revenue that comes from using them to buy something more expensive, and breakage when they’re not redeemed at all), and resells them. Plus, many contributors probably give him more than $1, and he got a lot of publicity over this.
Probably the cheapest way to get the contributors he needs. A clever hack.
EDITED TO ADD (7/16): These might be “straw donors” and illegal:
The campaign’s donations-for-cash strategy could raise potential legal concerns, said Paul Ryan, a campaign finance lawyer. Voters who make donations in exchange for gift cards, he said, might be considered straw donors because part or all of their donations are being reimbursed by the campaign.
“Federal law says ‘no person shall make a contribution in the name of another person,’” Mr. Ryan said. “Here, the candidate is making a contribution to himself in the name of all these individual donors.”
Richard L. Hasen, a law professor at the University of California, Los Angeles, who specializes in election law, said that typically, campaigns ask the Federal Election Commission when engaging in new forms of donations.
The Burgum campaign’s maneuver, he said, “certainly seems novel” and “raises concerns about whether it violates the prohibition on straw donations.”
Something for the courts to figure out, if this matter ever gets that far.
Celebrate another year of young people’s computer programs in space with us: today we and our collaborators at the European Space Agency can finally announce the winning and highly commended teams in this year’s Astro Pi Mission Space Lab.
Mission Space Lab: Young people’s experiments in space
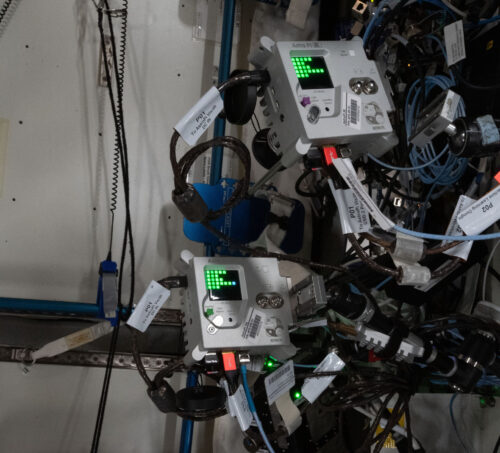
In Mission Space Lab, teams of young people work together to create computer programs for scientific experiments to be carried out on the International Space Station. The programs they design and create run on the two Astro Pi computers: space-adapted Raspberry Pis with cameras and a range of sensors.
The two Astro Pi computers on board the ISS
Teams’ programs were deployed on the ISS during May and ran for up to 3 hours, collecting data for their experiments. Once we’d sent the teams their data, they started analysing it in order to write their Phase 4 reports. To identify patterns and phenomena they were interested in, many teams chose to compare their data with other sources.
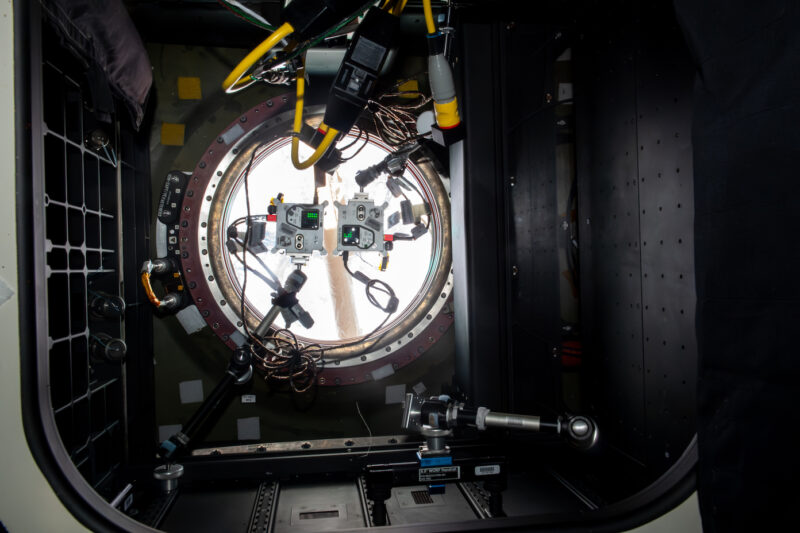
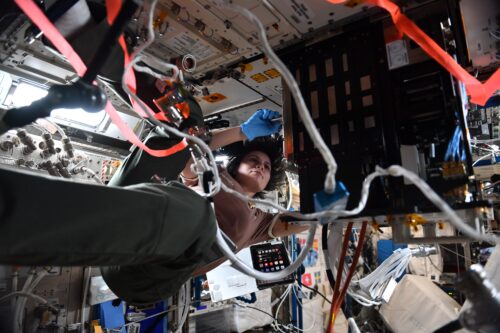
The Astro Pis in the WORF window of the ISS
We were especially excited to see the results from the experiments this year, particularly given that the upgraded Astro Pi units with their High Quality Cameras were positioned in a new observation window (WORF) on the ISS. This allowed teams to capture high-resolution images with a much wider field of view.
A volcano erupting in Guatemala, captured on the ISS by a team’s Mission Space Lab experiment
What have Mission Space Lab teams investigated this year?
We feel very privileged to see the culmination of the team’s experiments in their final reports. So let’s share a few highlights from this year’s experiments:
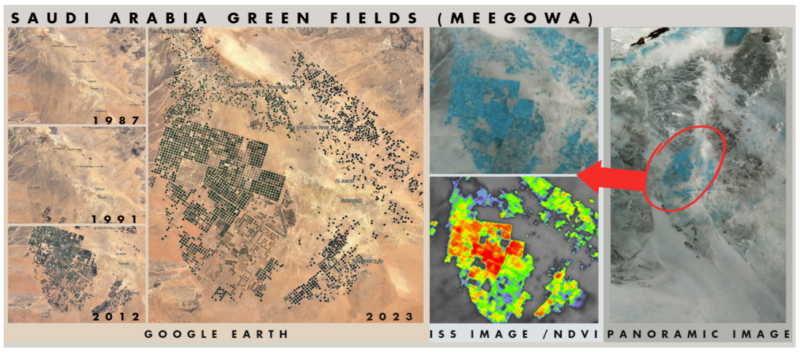
Team Aretusafrom Sicily explored the effects of climate change by cross-referencing the images they captured with the Astro Pis with historical images from Google Earth. They used Near Infrared photography to capture images, and NDVI (Normalised Difference Vegetation Index) image processing in their analysis. Below you can see that they have compared data of Saudi Arabia from 1987 to 2023, showing increasing levels of vegetation grown in attempts to restore degraded land.
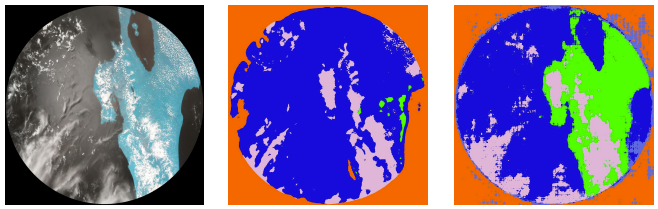
Team Barrande from the Czech Republic trained AI models on images they gathered to identify topographical features of Earth. Their Mission Space Lab program used the Astro Pi computer’s machine learning dongle to train one AI model in real time. Later, the team also used the collected images to train another model back on Earth. Comparing the outputs of the two models, the team could tell how well the models had identified different topographical features. The below selection shows an image the team’s experiment captured on the left, the same image after processing by the AI model trained on the Astro Pi computer in the middle, and the image processed by the AI model trained on Earth.
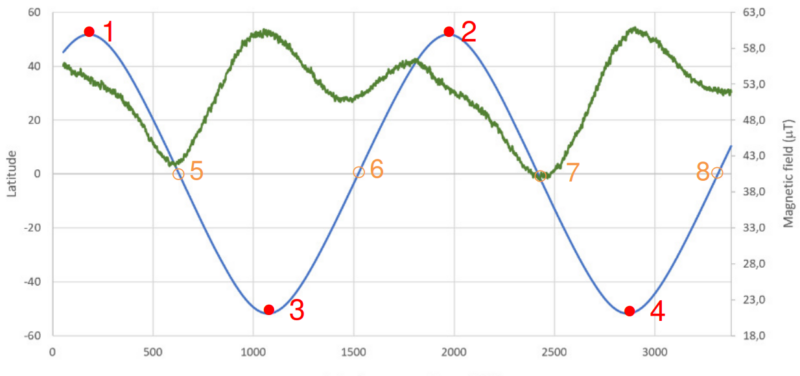
TeamDAHspace from Portugal measured the intensity of the Earth’s magnetic field along the orbit path of the ISS. Using the magnetometer on the Astro Pi, their experiment recorded data allowing the team to track changes of intensity. The team mapped this data to the ISS’s coordinates, showing the difference in the Earth’s magnetic field between the North Pole (points 1 and 2 on the chart below) and the South Pole (points 3 and 4).
And the winning teams are…
We and our collaborators at ESA Education have been busy reviewing all of the reports to assess the scientific merit, use of the Astro Pi hardware, experiment design, and data analysis. The ten winning teams come from schools and coding clubs in 11 countries. We are sending each team some cool space swag to recognise their achievement.
You can click on a team name to read the team’s experiment report.
All of the teams whose Mission Space Lab programs ran on the ISS will receive a certificate signed by ESA astronaut Samantha Cristoforetti. The winning and highly commended teams will also be invited to a live video chat with an ESA astronaut in the autumn.
Samantha Cristoforetti on board the ISS during her Minerva mission and after returning from space. Credit: ESA/NASA
Congratulations to all 2022/23 participants
Huge congratulations to every team that participated in Astro Pi Mission Space Lab. We hope you found it fun and inspiring to take part.
A big thank you to everyone who has been involved in the European Astro Pi Challenge this year. An amazing 24,850 young people from 29 countries had their programs run in space this year. We can’t wait to do it all again starting in September.
And it’s not just us saying thanks and well done — here’s a special message from ESA astronaut Matthias Maurer:
Looking forward to the next Astro Pi Challenge
On 18 September 2023, we’ll launch the European Astro Pi Challenge for 2023/24. Mission Zero will open in September, and we’ll announce exciting news about Mission Space Lab in September too.
If you know a young person who might be interested in the Astro Pi Challenge, sign up for the newsletter on astro-pi.org and follow the Astro Pi Twitter account for all the latest announcements about how you can support them to take the unique opportunity to write code to run in space.
AlmaLinux has announced that
the distribution will no longer be a strict clone of Red Hat Enterprise
Linux, but will maintain ABI compatibility.
For a typical user, this will mean very little change in your use
of AlmaLinux. Red Hat-compatible applications will still be able to
run on AlmaLinux OS, and your installs of AlmaLinux will continue
to receive timely security updates. The most remarkable potential
impact of the change is that we will no longer be held to the line
of “bug-for-bug compatibility” with Red Hat, and that means that we
can now accept bug fixes outside of Red Hat’s release cycle. While
that means some AlmaLinux OS users may encounter bugs that are not
in Red Hat, we may also accept patches for bugs that have not yet
been accepted upstream, or shipped downstream.
This post is written by Yahav Biran, Principal SA, and Yuval Dovrat, Israel Head Compute SA.
This post shows you how to integrate AWS Graviton-based Amazon EC2 instances into an existing Amazon Elastic Kubernetes Service (Amazon EKS) environment running on x86-based Amazon EC2 instances. Customers use mixed-CPU architectures to enable their application to utilize a wide selection of Amazon EC2 instance types and improve overall application resilience. In order to successfully run a mixed-CPU application, it is strongly recommended that you test application performance in a test environment before running production applications on Graviton-based instances. You can follow AWS’ transition guide to learn more about porting your application to AWS Graviton.
This example shows how you can use KEDA for controlling application capacity across CPU types in EKS. KEDA will trigger a deployment based on the application’s response latency as measured by the Application Load Balancer (ALB). To simplify resource provisioning, Karpenter, an open-source Kubernetes node provisioning software, and AWS Load Balancer Controller, are shown as well.
Solution Overview
There are two solutions that this post covers to test a mixed-CPU application. The first configuration (shown in Figure 1 below) is the “A/B Configuration”. It uses an Application Load Balancer (ALB)-based Ingress to control traffic flowing to x86-based and Graviton-based node pools. You use this configuration to gradually migrate a live application from x86-based instances to Graviton-based instances, while validating the response time with Amazon CloudWatch.
Figure 1, config 1: A/B Configuration
In the second configuration, the “Karpenter Controlled Configuration” (shown in Figure 2 below as Config 2), Karpenter automatically controls the instance blend. Karpenter is configured to use weighted provisioners with values that prioritize AWS Graviton-based Amazon EC2 instances over x86-based Amazon EC2 instances.
It is recommended that you start with the “A/B” configuration to measure the response time of live requests. Once your workload is validated on Graviton-based instances, you can build the second configuration to simplify the deployment configuration and increase resiliency. This enables your application to automatically utilize x86-based instances if needed, for example, during an unplanned large-scale event.
You can find the step-by-step guide on GitHub to help you to examine and try the example app deployment described in this post. The following provides an overview of the step-by-step guide.
After making any required changes, you might need to recompile your application for the Arm64 architecture. This is necessary if your application is written in a language that compiles to machine code, such as Golang and C/C++, or if you need to rebuild native-code libraries for interpreted/JIT compiled languages such as the Python/C API or Java Native Interface (JNI).
To allow your containerized application to run on both x86 and Graviton-based nodes, you must build OCI images for both the x86 and Arm64 architectures, push them to your image repository (such as Amazon ECR), and stitch them together by creating and pushing an OCI multi-architecture manifest list. You can find an overview of these steps in this AWS blog post. You can also find the AWS Cloud Development Kit (CDK) construct on GitHub to help get you started.
To simplify the process, you can use a Linux distribution package manager that supports cross-platform packages and avoid platform-specific software package names in the Linux distribution wherever possible. For example, use:
RUN pip install httpd
instead of:
ARG ARCH=aarch64 or amd64 RUN yum install httpd.${ARCH}
This blog post shows you how to automate multi-arch OCI image building in greater depth.
Application Deployment
Config 1 – A/B controlled topology
This topology allows you to migrate to Graviton while validating the application’s response time (approximately 300ms) on both x86 and Graviton-based instances. As shown in Figure 1, this design has a single Listener that forwards incoming requests to two Target Groups. One Target Group is associated with Graviton-based instances, while the other Target Group is associated with x86-based instances. The traffic ratio associated with each target group is defined in the Ingress configuration.
Here are the steps to create Config 1:
Create two KEDA ScaledObjects that scale the number of pods based on the latency metric (AWS/ApplicationELB-TargetResponseTime) that matches the target group (triggers.metadata.dimensionValue). Declare the maximum acceptable latency in targetMetricValue:0.3. Below is the Graviton deployment scaledObject (spec.scaleTargetRef), note the comments that denote the value of the x86 deployment scaledObject
To simplify testing and control for potential performance differences in instance generations, create two dedicated Karpenter provisioners and Kubernetes Deployments (replica sets) and specify the instance generation, CPU count, and CPU architecture for each one. This example uses c7g (Graviton3) and c6i (Intel) . You will remove these constraints in the next topology to allow more allocation flexibility.
Create an Application Load Balancer using the AWS Load Balancer Controller to distribute incoming requests among the different pods. Control the traffic routing in the ingress by adding an ingress.kubernetes.io/actions.weighted-routing annotation. You can adjust the weight in the example below to meet your needs. This migration example started with a 100%-to-0% x86-to-Graviton ratio, adjusting over time by 10% increments until it reached a 0%-to-100% x86-to-Graviton ratio.
You can simulate live user requests to an example application ALB endpoint. Amazon CloudWatch populates ALB Target Group request/second metrics, dimensioned by HTTP response code, to help assess the application throughput and CPU usage.
During the simulation, you will need to verify the following:
Both Graviton-based instances and x86-based instances pods process a variable amount of traffic.
The application response time (p99) meets the performance requirements (300ms).
The orange (Graviton) and blue (x86) curves of HTTP 2xx responses (figure 4) show the application throughput (HTTP requests/seconds) for each CPU architecture during the migration.
Figure 3 HTTP 2XX per CPU architecture
Figure 4 shows an example of application response time during the transition from x86-based instances to Graviton-based instances. The latency associated with each instance family grows and shrinks as the live request simulation changes the load on the application. In this example, the latency on x86 instances (until 07:00) grew up to 300ms because most of the request load was directed at to x86-based pods. It began to converge at around 08:00 when more pods were powered by Graviton-based instances. Finally, after 15:00, the request load was processed by Graviton-based instances entirely.
Figure 4: Target Response Time p99
Config 2 – Karpenter Controlled Configuration
After fully testing the application on Graviton-based EC2 instances, you are ready to simplify the deployment topology with weighted provisioners while preserving the ability to launch x86-based instances as needed.
Here are the steps to create Config 2:
Reuse the CPU-based provisioners from the previous topology, but assign a higher .spec.weight to Graviton-based instances provisioner. The x86 provisioner is still deployed in case x86-based instances are required. The karpenter.k8s.aws/instance-family can be expanded beyond those set in Config 1 or excluded by switching the operator to NotIn.
The x86-based Amazon EC2 instances Karpenter provisioner:
Next, merge the two Kubernetes deployments into one deployment similar to the original before migration (i.e., no specific nodeSelector that points to a CPU-specific provisioner).
The two services are also combined into a single Kubernetes service and the actions.weighted-routing annotation is removed from the ingress resources:
Unite the two KEDA ScaledObject resources from the first configuration and point them to a single deployment, e.g., simplemultiarchapp. The new KEDA ScaledObject will be:
A synthetic limit on Graviton CPU capacity is set to illustrate the scaling to x86_64 CPUs (Provisioner.limits.resources.cpu). The total application throughput (figure 6) is shown by aarch64_200 (blue) and x86_64_200 (orange). Mixing CPUs did not impact the target response time (Figure 6). Karpenter behaved as expected: prioritizing Graviton-based instances, and bursting to x86-based Amazon EC2 instances when CPU limits were crossed.
Figure 6 Config 2 -HTTP response time p99 with mixed-CPU provisioner
Conclusion
The use of a mixed-CPU architecture enables your application to utilize a wide selection of Amazon EC2 instance types and improves your applications’ resilience while meeting your service-level objectives. Application metrics can be used to control the migration with AWS ALB Ingress, Karpenter, and KEDA. Moreover, AWS Graviton-based Amazon EC2 instances can deliver up to 40% better price performance than x86-based Amazon EC2 instances. Learn more about this example on GitHub and more announcements about Gravtion.
AWS customers are looking for an efficient tracking method of support cases raised with AWS Support across their multiple interconnected accounts. Having a unified view lets the cloud operations team derive actionable insights across the support cases raised by different business units and accounts. This helps ensure that the team has a comprehensive understanding of the state of existing support cases and can quickly identify and work with teams to resolve them. The team can also prioritize their responses based on the severity of impact of the issues and take action on cases that need acknowledgement or additional information. AWS Systems Manager is the operations hub for your AWS applications and resources and a secure end-to-end management solution for hybrid cloud environments that enables secure operations at scale. AWS Systems Manager Explorer provides a summary of support cases across your AWS accounts to help you get better visibility into the operational health of your AWS environment.
This post describes how Amazon QuickSight dashboards can help you visualize your support cases in a single pane of glass using data extracts from Systems Manager. QuickSight meets varying analytic needs from the same source of truth through modern interactive dashboards, paginated reports, embedded analytics, and natural language queries.
Solution overview
The following architecture diagram illustrates the use of Systems Manager to provide a summary of support cases across your AWS accounts. The solution automates the collection process using a Systems Manager Automation document, scheduling automations within a maintenance window. When the Systems Manager configuration is done, the automation extracts the all support cases across the organization and creates a CSV file in an Amazon Simple Storage Service (Amazon S3) bucket. From the S3 bucket, we integrate with Amazon Athena to create a table, and lastly we visualize all support cases in QuickSight. Note that for aggregating data across multiple accounts, they must reside within a single AWS Organization. Implementing the solution requires the following steps:
Set up a Systems Manager maintenance window.
Register an automation task in the maintenance window.
Create an Amazon Simple Notification Service (SNS) topic. Use the following command to create an SNS topic named SSM-supportcases-notification and subscribe an email address:
After you have all the prerequisites in place, follow the step-by-step instructions in the rest of this post.
Set up a Systems Manager maintenance window
Maintenance windows, a capability of Systems Manager, help you define a schedule for AWS support cases to extract at a predefined schedule. For instructions on creating a maintenance window, see Create a maintenance window (console).
Register an automation task with a maintenance window
In this step, you add a task to a maintenance window. Tasks are the actions performed when a maintenance window runs. For instructions on registering an automation task to a maintenance window, see Schedule automations with maintenance windows.
Provide a name for the maintenance task and choose the automation document AWS-ExportOpsDataToS3
2. Enter the following details in the Input parameters section.
Variable
Description
Value
assumeRole
(Required) The role ARN to assume during the automation run
The role you created as a prerequisite
filters
(Optional) Filters for the getOpsSummary request
Leave blank
syncName
(Optional) The name of the resource data sync
The sync name that you created as a prerequisite
resultAttribute
(Optional) The result attribute for the getOpsSummary request
AWS:SupportCenterCase
columnFields
(Optional) The column fields to write to the output file
(Required) The S3 bucket where you want to download the output file
The S3 bucket that you created as a prerequisite
snsTopicArn
(Required) The SNS topic ARN to notify when the download is complete
The ARN for the SNS topic that you created as a prerequisite
snsSuccessMessage
(Optional) The message to send when a document is complete
Leave blank
columnFieldsWithType
(Optional) The fully qualified column fields to write to the output file
Leave blank
resultAttributeList
(Optional) The multiple result attributes for the getOpsSummary request
Leave blank
Choose the IAM service role you created as a prerequisite.
Choose Register Automation task.
After you successfully register the task, the automation will run, and you will see CSV files getting created in your S3 bucket. In our use case, we set the rate expression as 1 day. However, you can use a lesser frequency such as 1 hour or even 5 minutes to test the functionality.
Create a database in the AWS Glue Data Catalog
Before you can create an AWS Glue crawler, you need to create a database in the Data Catalog, which is a container that holds tables. You use databases to organize your tables into separate categories. In our use case, support cases data resides in an S3 bucket.
On the AWS Glue console, create a new database.
For Name, enter a name (for example, aws_support_cases).
Crawlers invoke classifiers to infer the schema of your data. We need to create a custom classifier because when we extract the support cases, every column in a potential header parses as a string data type. When creating your classifier, choose Has headings and add the following:
To create a crawler that reads files stored on Amazon S3, complete the following steps:
On the AWS Glue console, in the navigation pane, choose Crawlers.
On the Crawlers page, choose Add crawler.
For Crawler name, enter support cases extract, then choose Next.
For the crawler source type, choose Data stores, then choose Next.
Now let’s point the crawler to your data.
On the Add a data store page, choose the Amazon S3 data store.
For Crawl data in, choose Specified path in this account.
For Include path, enter the path where the crawler can find the support cases data, which is s3://S3_BUCKET_PATH. After you enter the path, the title of this field changes to Include path.
Choose Next.
The crawler also needs permissions to access the data store and create objects in the Data Catalog.
To configure these permissions, choose Create an IAM role. The IAM role name starts with AWSGlueServiceRole-; you enter the last part of the role name (for this post, we enter Crawlercases).
Choose Next.
Crawlers create tables in your Data Catalog. Tables are contained in a database in the Data Catalog.
Choose Target database and select the database you created.
Now we create a schedule for the crawler.
For Frequency, choose Daily
Choose Next.
Verify the choices you made. If you see any mistakes, you can choose Edit to return to previous pages and make changes.
After you have reviewed the information, choose Finish to create the crawler.
After the AWS Glue crawler is configured successfully, we query the data from the database and table created by the crawler and create views in Athena. The data source for the dashboard will be an Athena view of your existing support_cases database. We create a view in Athena with a group by condition. Create the view case_summary_view by modifying the table name support_cases from the following code and run the query in the Athena query editor:
CREATE OR REPLACE VIEW "case_summary_view" AS SELECT DISTINCT DisplayId caseid , SourceAccountId accountid , Subject case_subject , Status case_status , ServiceCode case_service , CategoryCode case_category , CAST("substring"(TimeCreated, 1, 10) AS date) case_created_on FROM "AwsDataCatalog"."aws_support_cases"."aws_support_cases_report" GROUP BY DisplayId, SourceAccountId, Subject, Status, ServiceCode, CategoryCode, SeverityCode, TimeCreated
Visualize AWS support cases in QuickSight
After we create the Athena view, we can create a dashboard in QuickSight. Before connecting QuickSight to Athena, make sure to grant QuickSight access to Athena and the associated S3 buckets in your account. For details, refer to Authorizing connections to Amazon Athena.
On the QuickSight console, choose Datasets in the navigation pane.
Choose New dataset.
Choose Athena as your data source.
For Data source name¸ enter AWS_Support_Cases.
Choose Create data source.
For Database, choose the aws_support_cases database, which contains the views you created (refer to the Athena console if you are unsure which ones to select)
For Tables, select the case_summary_view table that we created as part of the steps in Athena.
Choose Edit/Preview data.
Select SPICE to change your query mode.
Now you can create the sheet aws_support_cases in the analysis.
Choose Publish & Visualize.
Select the sheet type that you want (Interactive sheet or Paginated report). For this post, we select Interactive sheet.
In Sheet 1 of the newly created analysis, under Fields list, choose case_category and case_status.
For Visual types, choose a clustered bar combo chart.
This type of visual returns the count of records by case category.
To add more visuals to the workspace, choose Add, then Add visual.
In the second visual, we create a donut chart with the field case_status to count the number of overall cases.
Next, we create a word cloud to display how often AWS support cases have been raised by which AWS account.
The word cloud shows the top 100 accounts by default (if you have data for more than one account) and displays the account with the maximum number of entries in a higher font size. If you wanted to show just the top account, you would have to configure a top 1 filter.
Next, we create a stacked bar combo chart to display cases with service type, using the fields case_created_on, caseid, and case_service.
Next, we create a table visual to display all case details in table format (select all available fields).
The following screenshot shows a visualization of all fields of support cases in tabular format.
19. Adjust the size and position of the visuals to fit the layout of your analysis.
The following screenshot shows our final dashboard for support cases. You’ve now set up a fully functional AWS support cases dashboard at an organizational view. You can share the dashboard with your cloud platform and operations teams. For more information, refer to Sharing Amazon QuickSight dashboards.
Clean up
When you don’t need this dashboard anymore, complete the following steps to delete the AWS resources you created to avoid ongoing charges to your account:
Cancel your QuickSight subscription. You should only delete your QuickSight account if you explicitly set it up to follow this post and are absolutely sure that it’s not being used by any other users.
Conclusion
This post outlined the steps and resources required to construct a customized analytics dashboard in QuickSight, empowering you to attain comprehensive visibility and valuable insights into support cases generated across multiple accounts within your organization. To learn more about how QuickSight can help your business with dashboards, reports, and more, visit Amazon QuickSight.
About the authors
Yash Bindlish is a Enterprise Support Manager at Amazon Web Services. He has more than 17 years of industry experience including roles in cloud architecture, systems engineering, and infrastructure. He works with Global Enterprise customers and help them build, scalable, modern and cost effective solutions on their growth journey with AWS. He loves solving complex problems with his solution-oriented approach.
Shivani Reddy is a Technical Account Manager (TAM) at AWS with over 12 years of IT experience. She has worked in a variety of roles, including application support engineer, Linux systems engineer, and administrator. In her current role, she works with global customers to help them build sustainable software solutions. She loves the customer management aspect of her job and enjoys working with customers to solve problems and find solutions that meet their specific needs.
Amazon FSx for NetApp ONTAP was launched in late 2021. With FSx for ONTAP you get the popular features, performance, and APIs of ONTAP file systems, with the agility, scalability, security, and resilience of AWS, all as a fully managed service.
Today we are adding support for SnapLock, an ONTAP feature that gives you the power to create volumes that provide Write Once Read Many (WORM) functionality. SnapLock volumes prevent modification or deletion of files within a specified retention period, and can be used to meet regulatory requirements and to protect business-critical data from ransomware attacks and other malicious attempts at alteration or deletion. FSx for ONTAP is the only cloud-based file system that supports SnapLock Compliance mode. FSx for ONTAP also supports tiering of WORM data to lower-cost storage for all SnapLock volumes.
Protecting Data with SnapLock SnapLock gives you an additional layer of data protection, and can be thought of as part of your organization’s overall data protection strategy. When you create a volume and enable SnapLock, you choose one of the following retention modes:
Compliance – This mode is used to address mandates such as SEC Rule 17a-4(f), FINRA Rule 4511 and CFTC Regulation 1.31. You can use this mode to ensure a WORM file cannot be deleted by any user until after its retention period expires. Volumes in this mode cannot be renamed and cannot be deleted until the retention periods of all WORM files on the volume have expired.
Enterprise – This mode is used to enforce organizational data retention policies or to test retention settings before creating volumes in Compliance mode. You can use this mode to prevent most users from deleting WORM data, while allowing authorized users to perform deletions, if necessary. Volumes in this mode can be deleted even if they contain WORM files under an active retention period.
You also choose a default retention period. This period indicates the length of time that each file must be retained after it is committed to the WORM state, and can be as long as 100 years, and there’s also an Infinite option. You can also set a custom retention period for specific files or specific trees of files and it will apply to those files at the time that they are committed to the WORM state.
Files are committed to the WORM state when they become read-only (chmod -w on Linux or attrib +r on Windows). You can configure a per-volume autocommit period (5 minutes to 10 years) to automatically commit files that have remained as-is for the period, and you can also initiate a Legal Hold in Compliance mode in order to retain specific files for legal purposes.
You also have another interesting data protection and compliance option. You can create one volume without SnapLock enabled, and another one with it enabled, and then periodically replicate from the first one to the second using NetApp SnapVault. This will give you snapshot copies of entire volumes that you can retain for months, years, or decades as needed.
Speaking of interesting options, you can make use of FSx for ONTAP volume data tiering to keep active files on high-performance SSD storage and the other files on storage that is cost-optimized for data that is accessed infrequently.
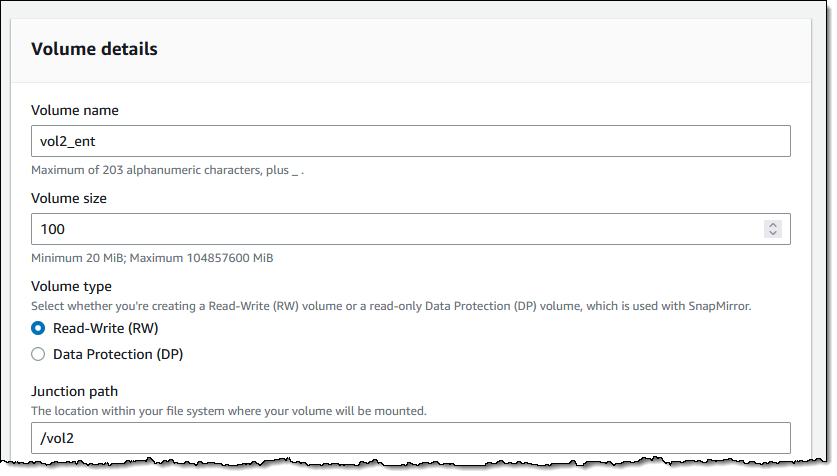
Creating SnapLock Volumes I can create new volumes and enable SnapLock with a couple of clicks. I enter the volume name, size, and path as usual:
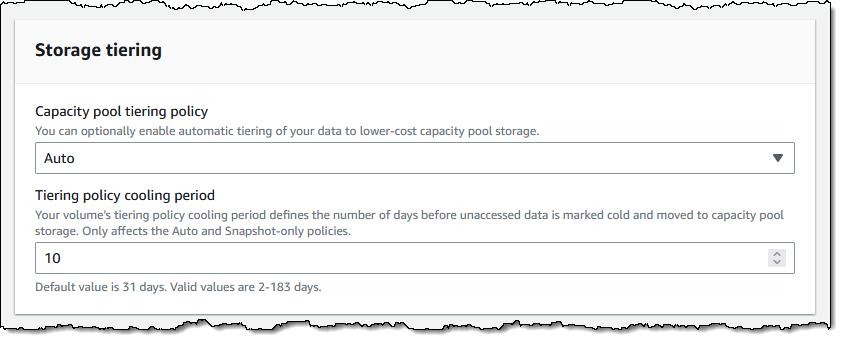
As I mentioned earlier, I can also make use of a capacity pool (this is set to Auto by default, and I set a 10 day cooling period):
I scroll down to the Advanced section and click Enabled, then select Enterprise retention mode. I also set up my retention periods, enable autocommit after 9 days, and leave the other options as-is:
I add a tag, and click Create volume to move ahead:
I take a quick break, and when I come back my volume is ready to use:
At this point I can mount it in the usual way, create files, and allow SnapLock to do its thing!
Things to Know Here are a couple of things that you should know about this powerful new feature:
Existing Volumes – You cannot enable this feature for an existing volume, but you can create a new, SnapLock-enabled volume, and copy or migrate the data to it.
Volume Deletion – As I noted earlier, you cannot delete a SnapLock Compliance volume if it contains WORM files with an unexpired retention period. Take care when setting this to avoid creating volumes that will last longer than needed.
Pricing – There’s an additional GB/month license charge for the use of SnapLock volumes; check out the Amazon FSx for NetAPP ONTAP Pricing page for more information.
To provide the best experiences, we use technologies like cookies to store and/or access device information. Consenting to these technologies will allow us to process data such as browsing behavior or unique IDs on this site. Not consenting or withdrawing consent, may adversely affect certain features and functions.
Functional
Always active
The technical storage or access is strictly necessary for the legitimate purpose of enabling the use of a specific service explicitly requested by the subscriber or user, or for the sole purpose of carrying out the transmission of a communication over an electronic communications network.
Preferences
The technical storage or access is necessary for the legitimate purpose of storing preferences that are not requested by the subscriber or user.
Statistics
The technical storage or access that is used exclusively for statistical purposes.The technical storage or access that is used exclusively for anonymous statistical purposes. Without a subpoena, voluntary compliance on the part of your Internet Service Provider, or additional records from a third party, information stored or retrieved for this purpose alone cannot usually be used to identify you.
Marketing
The technical storage or access is required to create user profiles to send advertising, or to track the user on a website or across several websites for similar marketing purposes.











 Yash Bindlish is a Enterprise Support Manager at Amazon Web Services. He has more than 17 years of industry experience including roles in cloud architecture, systems engineering, and infrastructure. He works with Global Enterprise customers and help them build, scalable, modern and cost effective solutions on their growth journey with AWS. He loves solving complex problems with his solution-oriented approach.
 Shivani Reddy is a Technical Account Manager (TAM) at AWS with over 12 years of IT experience. She has worked in a variety of roles, including application support engineer, Linux systems engineer, and administrator. In her current role, she works with global customers to help them build sustainable software solutions. She loves the customer management aspect of her job and enjoys working with customers to solve problems and find solutions that meet their specific needs.