Post Syndicated from BeardedTinker original https://www.youtube.com/watch?v=huXLIHs4pC0
Pentales: Old Vulns, New Tricks
Post Syndicated from Austin Guidry original https://blog.rapid7.com/2023/07/13/pentales-old-vulns-new-tricks/

At Rapid7 we love a good pentest story. So often they show the cleverness, skill, resilience, and dedication to our customer’s security that can only come from actively trying to break it! In this series, we’re going to share some of our favorite tales from the pen test desk and hopefully highlight some ways you can improve your own organization’s security.
This engagement began like any other Internal Network Penetration test. I followed a systematic methodology to enumerate the internal domain. The target organization was a financial institution, but their internal domain was administered via Active Directory (AD) like most organizations with more than a handful of computers. AD is a Microsoft product that provides centralized control of the whole gamut of networking devices that an organization may have. This may include workstations, servers, switches, routers, printers, and IoT devices. Additionally, AD can be used for localized, global, or cloud-based networks.
After enumeration, I identified high value targets and a wide range of open ports and services. I used a Metasploit RC file containing instructions and settings to configure Metasploit modules. This allowed me to scan the open ports and services for common/default credentials, vulnerabilities, misconfigurations, software types, version numbers, and other accessible information in the background while I covered more ground manually.
I began operations to understand the state of several types of combinable networking vulnerabilities, checking for broadcast name services (BNS) and poisoning capabilities, Server Message Block (SMB) Signing statuses for hosts using SMB visible to my attack box (PTK), and for Internet Protocol version 6 (IPv6) traffic. These are some of the more common ways to begin a successful attack path. I checked all of these options on this organization’s network, but I found that I could not leverage BNS poisoning, SMB Signing not required, or IPv6-based attacks.
Luckily, the Metasploit RC file found default credentials for Intelligent Platform Management Interface (IPMI) assets. The IPMI protocol’s design introduced a vulnerability that provides a hash to someone attempting authentication. A user would attempt to authenticate with a specific username, and the IPMI device would provide the hash for that account. The Metasploit module for dumping IPMI hashes does this exactly for a wordlist full of common usernames and checks the provided hashes against a partial rainbow table of common passwords like “admin” and “root.” In this case, several devices were using credentials such as “admin:admin” and “root:root.”
This is exciting because IPMI is used to control servers, and more often these days server virtualization is such that several server virtual machines (VMs) are hosted on one physical server computer. I logged into the web interfaces associated with these IPMIs and found within the remote consoles that three of these IPMI assets were hosting VMware ESXi instances. VMware ESXi is, in fact, used to host and manage multiple VMs. The remote consoles provided the IP and website addresses for the VMware ESXi administrative login interfaces. I navigated to these interfaces and typed in the default credentials used on the IPMI hosts… and they were valid!
At this point, I was quite shocked that default credentials were in use, some 4+ decades after “admin:admin” became an official vulnerability. Not to mention, default credentials to valuable assets is probably the simplest and easiest vulnerability to exploit.
So, I got into the VMware ESXi consoles and I quickly identified which of the three assets contained the primary Domain Controller (DC) and Exchange Server. As an administrator to the VMware ESXi console, I had a lot of flexibility in what I was able to do with the virtual machines. First, I checked to see if there were sessions still open with these two assets. Both were locked and would require valid credentials to access via (Remote Desktop Protocol) RDP or similar remote access control.
I could conduct other attacks such as Denial of Service (DoS), deleting the machine or turning it off, but this would immediately be noticed by organization personnel, and most importantly these types of attacks were out of scope. DoS is out of scope for pentesters by default. This type of attack is extremely harmful to business operations, and has the potential to cause irreversible harm.
I needed to find an interface with which I had administrative control to view data on these VMs vs. trying to use the underlying Operating Systems (OS) within the VMs. I tried to download the VMs, but they would have taken 10 + days for the DC and multiple weeks for the Exchange Server. I tried to create a snapshot of the memory of the DC to attempt to filter credentials from it, but this was also too large and I could not acquire the file during the engagement.
I asked for help from the consulting team. At Rapid7, we have a deep bench of talented and knowledgeable people and a healthy culture of teamwork and support.
One of my teammates hopped on a call to help me investigate the potential options. Upon further review of the accessible ports and services in use by the VMware ESXi host, we found that Secure Shell (SSH) was open and accessible. There is a tool called SSHFS, which stands for SSH File System. This tool uses an SSH connection to mount and interact with the files on a remote device. This is similar to Network File Share (NFS) where a user can create a directory and mount it to the directory of a remote device. With administrative credentials to the VMware ESXi device, this provided me administrative control over the remote system’s file system and allowed me to interact with it in the same way as local files.
From here, I simply navigated to the directory within the DC that contained the NTDS.DIT file. This file is present on all Windows hosts, however, when it is contained by a Domain Controller this file contains all of the New Technology LAN Manager (NTLM) hashes for all of the accounts on the domain, including users, workstation machine accounts, and service accounts.
Sometimes, for environments that have or once had devices older than Windows Vista or Server 2008, there are also LM hashes which are incredibly weak. The entire keyspace for LM can be cracked in minutes to hours depending on the hardware, and the entire 8 character keyspace for NTLM can be cracked within several hours on enterprise-grade hardware.
This does not even cover the most valuable feature of NTLM authentication. NTLM hashes can be used as passwords, making it irrelevant to know the cleartext password that created the hash. This is called a “pass-the-hash” attack. Upon successfully dumping the NTDS.DIT file for the organization’s domain, I now controlled every domain-joined account and device.
With this control, I switched gears to post-exploitation and demonstrating impact for the organization’s stakeholders. I logged into several email accounts, looking for and finding sensitive information such as Social Security Numbers (SSNs) and Account Numbers. I sent emails from organizational personnel’s email accounts to the point-of-contact and myself, demonstrating the impersonation potential. I used cracked account credentials to locate accounts for which Multi-factor Authentication (MFA) had not been configured and enrolled in MFA for one account. I perused several organization-wide network file share servers finding sensitive documents, PII, account numbers, bank and loan statements, and network information. I found multiple PDFs identifying the organization’s ATMs, their names, locations, makes and models, support information from supporting third-parties, and IP addresses.
I used these ATM IP addresses to conduct additional enumeration attempting to discover attack paths to gain control of ATMs. I found several open ports but was unable to gain access or control to the ATMs. However, within the directories containing ATM information were Excel spreadsheet logs of ATM activity. These non-password-protected spreadsheets held cardholder data, their links to bank customer account numbers, and historical information such as timestamps, locations, transaction amounts, and transaction types.
The customer’s environment had a lot of time and effort dedicated to security, and the security team covered many of the “low-hanging-fruit.” Sometimes older technology like IPMI is necessary for business. It is vital to understand the risks and to work with the technology we have to secure it against well-documented attacks. Why allow anyone internally to see an administrative resource? Access controls and closing unnecessary ports could minimize the attack surface on exploitable systems. Finally, one of the best defenses continues to be a strong, unique password for all logins, local or domain.
We, the pentesters at Rapid7 put our experience and knowledge together to reveal the weaknesses in the customer’s environment and give them the opportunities to fix them. Sometimes hacking is like finding a needle in the haystack, but we hackers have automated needle-finding, haystack-searching machines. Do your research, do the best you can, and when in doubt, get a pentest!
Check us out at this year’s Black Hat USA in Las Vegas! Our experts will be giving talks and our booth will be staffed with many members of our team. Stop by and say hi.
Old Blackmoon Trojan, NEW Monetization Approach
Post Syndicated from Natalie Zargarov original https://blog.rapid7.com/2023/07/13/old-blackmoon-trojan-new-monetization-approach/

Rapid7 is tracking a new, more sophisticated and staged campaign using the Blackmoon trojan, which appears to have originated in November 2022. The campaign is actively targeting various businesses primarily in the USA and Canada. However, it is not used to steal credentials, instead it implements different evasion and persistence techniques to drop several unwanted programs and stay in victims’ environment for as long as possible.
Blackmoon, also known as KRBanker, is a banking trojan first spotted in late September 2015 when targeting banks of the Republic of Korea. Back in 2015, it was using a “pharming” technique to steal credentials from targeted victims. This technique involves redirecting traffic to a forged website when a user attempts to access one of the banking sites being targeted by the cyber criminals. The fake server masquerades the original site and urges visitors to submit their information and credentials.
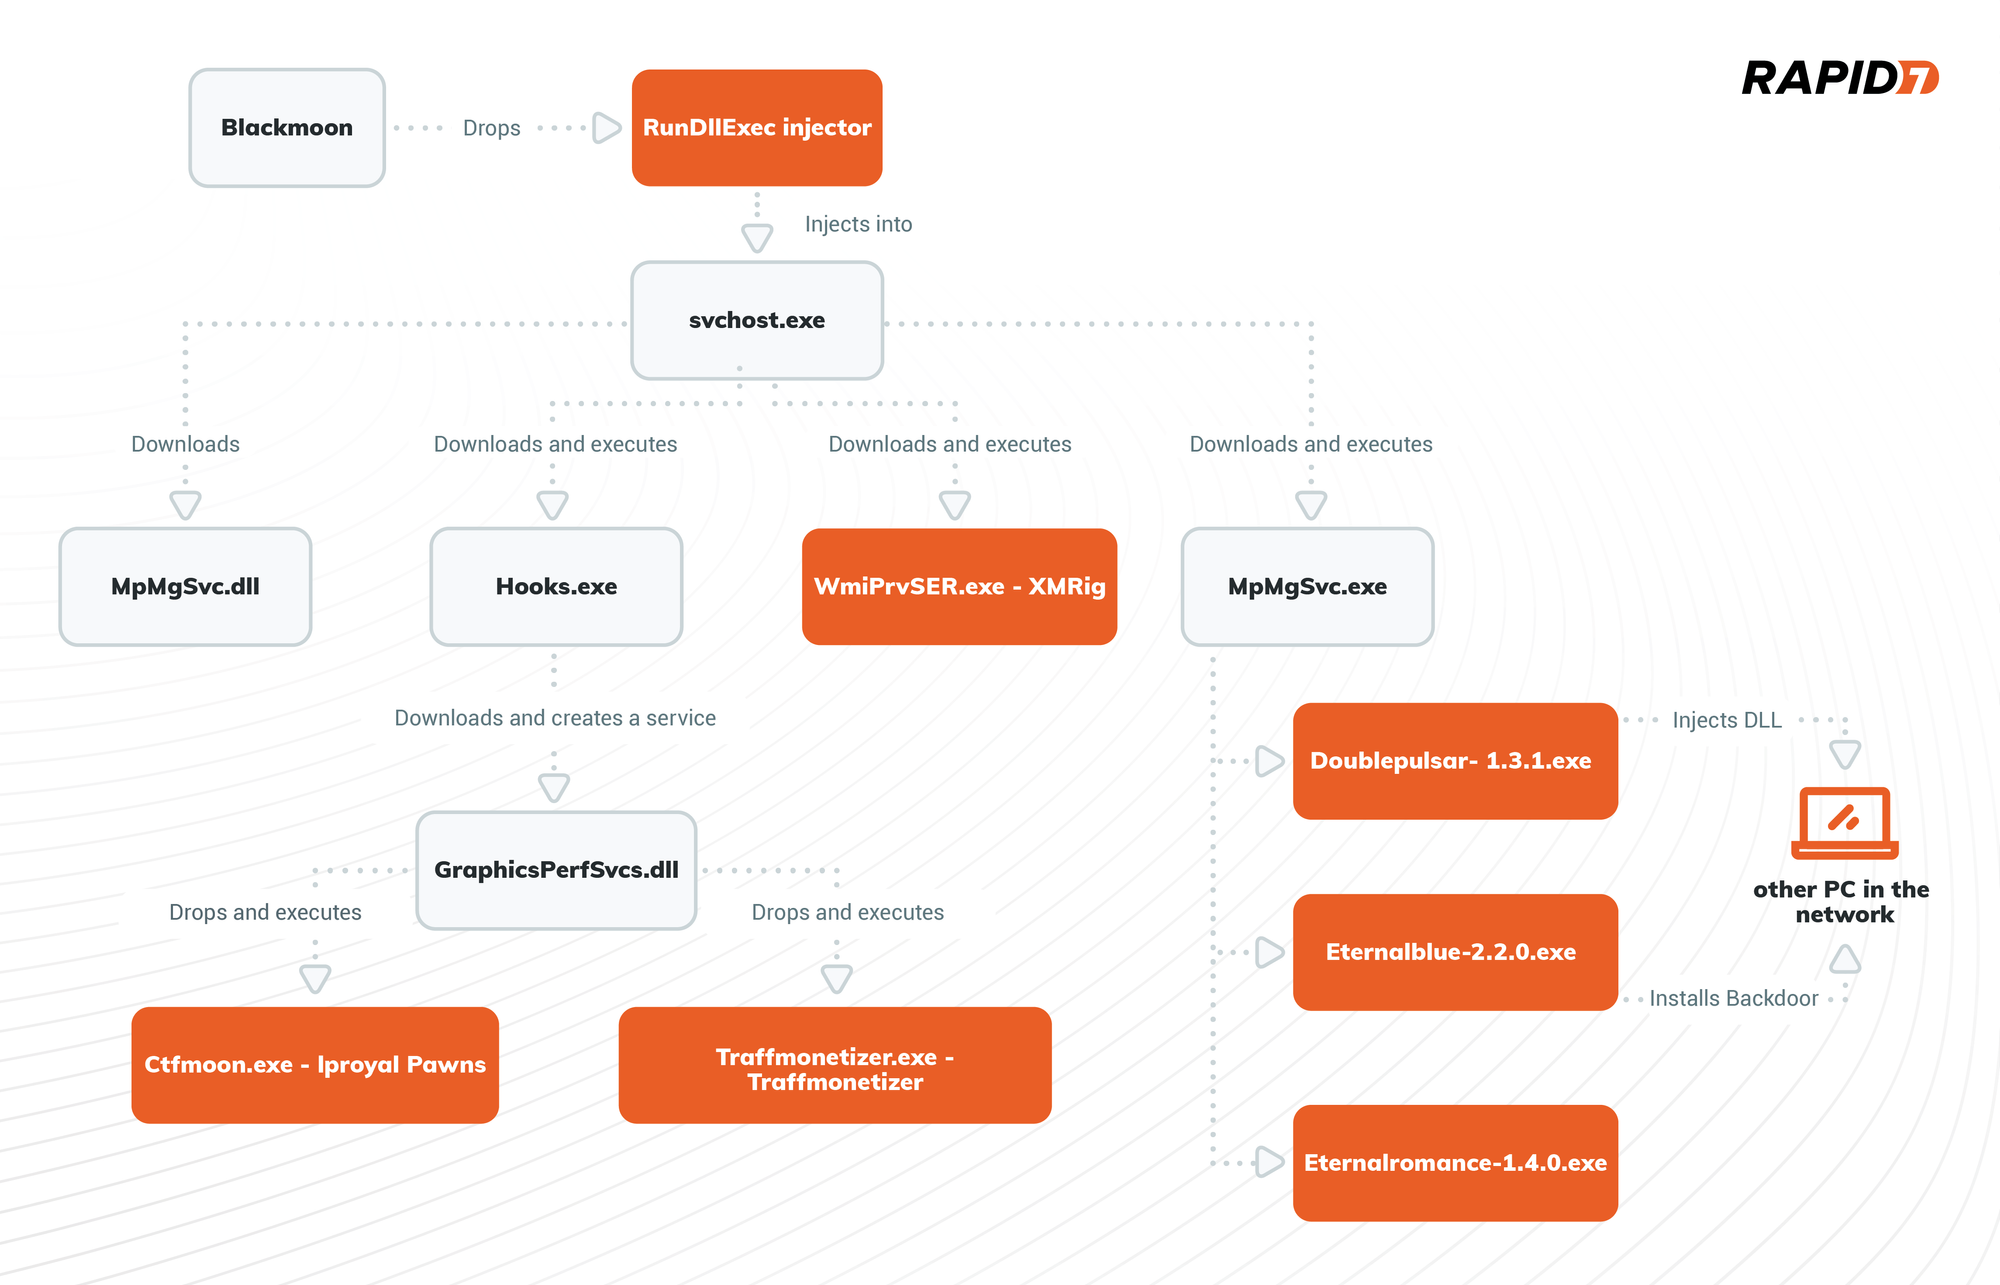
Stage 1 – Blackmoon
Blackmoon trojan was named after a debug string “blackmoon,” that is present in its code:

Blackmoon drops a dll into C:\Windows\Logs folder named RunDllExe.dll and implements a Port Monitors persistence technique. Port Monitors is related to the Windows Print Spooler Service or spoolsv.exe. When adding a printer port monitor a user (or the attacker in our case) has the ability to add an arbitrary dll that acts as the monitor. There are two ways to add a port monitor: via Registry for persistence or via a AddMonitor API call for immediate dll execution.
Our sample implements both, it calls AddMonitor API call to immediately execute RunDllExe.dll:

It also sets a Driver value in HKLM\SYSTEM\CurrentControlSet\Control\Print\Monitors\RunDllExe registry key to the malicious dll path.

Next, the malware adds a shutdown system privilege to the Spooler service by adding SeShutdownPrivilege to the RequiredPrivileges value of HKEY_LOCAL_MACHINE\SYSTEM\CurrentControlSet\Services\Spooler registry key.


The malware disables Windows Defender by setting HKLM\SOFTWARE\Policies\Microsoft\Windows Defender\DisableAntiSpyware value to “1”.
It also stops and disables “Lanman” service (the service that allows a computer to share files and printers with other devices on the network).
To block all incoming RPC and SMB communication the malware executes the set of following commands:
netsh ipsec static add policy name=Block
netsh ipsec static add filterlist name=Filter1
netsh ipsec static add filter filterlist=Filter1 srcaddr=any dstaddr=Me dstport=135 protocol=TCP
netsh ipsec static add filter filterlist=Filter1 srcaddr=any dstaddr=Me dstport=135 protocol=UDP
netsh ipsec static add filter filterlist=Filter1 srcaddr=any dstaddr=Me dstport=139 protocol=TCP
netsh ipsec static add filter filterlist=Filter1 srcaddr=any dstaddr=Me dstport=139 protocol=UDP
netsh ipsec static add filter filterlist=Filter1 srcaddr=any dstaddr=Me dstport=445 protocol=TCP
netsh ipsec static add filter filterlist=Filter1 srcaddr=any dstaddr=Me dstport=445 protocol=UDP
netsh ipsec static add filteraction name=FilteraAtion1 action=block
netsh ipsec static add rule name=Rule1 policy=Block filterlist=Filter1 filteraction=FilteraAtion1
netsh ipsec static set policy name=Block assign=y
The malware sets two additional values under HKEY_LOCAL_MACHINE\SYSTEM\CurrentControlSet\Services\aspnet_staters: Work and Mining, both set to “1”.
Next, the malware checks if one of the following services exists on the victim computer:
- clr_optimization_v3.0.50727_32
- clr_optimization_v3.0.50727_64
- WinHelpsvcs
- Services
- Help Service
- KuGouMusic
- WinDefender
- Msubridge
- ChromeUpdater
- MicrosoftMysql
- MicrosoftMssql
- Conhost
- MicrosotMaims
- MicrosotMais
In case the service is found, it will be disabled (by setting “Start” value under HKEY_LOCAL_MACHINE\SYSTEM\CurrentControlSet\Services\servicename to “4”) or deleted by using DeleteService API call.
The malware enumerates running processes by using a combination of CreateToolhelp32Snapshot and Process32First and Process32Next API calls to terminate service’s process if one is running.
Finally, a Powershell command is executed to delete the running process’s file and the malware exits.
Stage 2 – RunDllExe.dll – injector
RunDllExe.dll is executed by Spooler service and is responsible for injecting a next stage payload into the newly executed svchost.exe process. The malware implements Process Hollowing injection technique. The injected code is a C++ file downloader.
Stage 3 – File Downloader
The downloader first checks if ‘Work’ and ‘Mining’ values exist and set under HKEY_LOCAL_MACHINE\SYSTEM\CurrentControlSet\Services\aspnet_staters registry key, if the values do not exist, it will create them and set both to “1”.
As downloader, this part of the attack flow is checking if all needed to be downloaded files are already present (by using PathFileExistsA API call) on the PC, if not, the malware sleeps for two minutes before every download and then use the URLDownloadToFileA API call to download the following files:
- C:\WINDOWS\Temp\MpMgSvc.dll
- C:\WINDOWS\Temp\Hooks.exe
- C:\WINDOWS\Temp\MpMgSvc.exe
- C:\Windows\Microsoft.NET\Framework\v3.0\WmiPrvSER.exe
After the download all but the MpMgSvc.dll are executed by the downloader:

Stage 4 – Hook.exe – dropper
Hook.exe drops an additional dll to the users roaming folder C:\Users\Username\AppData\Roaming\GraphicsPerfSvcs.dll and creates a new service named GraphicsPerfSvcs, which will be automatically executed at system startup. The service name is almost identical to the legitimate service named GraphicsPerfSvc, which belongs to the Graphics performance monitor service. Naming services and files similarly to the once belonged to OS is an evasion technique widely used by threat actors.

The dropper starts the created service. It then creates and executes a .vbs which responsible for deleting Hook.exe and the .vbs itself:

Stage 4.1 – MpMgSvc.exe – spreader MpMgSvc.exe first creates a new \BaseNamedObjects\Brute_2022 mutex. As being responsible for spreading the malware, it drops Doublepulsar-1.3.1.exe, Eternalblue-2.2.0.exe, Eternalromance-1.4.0.exe and all required for these files libraries into the C:\Windows\Temp folder.
Then it scans the network for PC’s with open 3306, 445, 1433 ports. If any open ports are found, the spreader will attempt to install a backdoor by using EternalBlue and send shellcode to inject dll with Doublepulsar as implemented in the Eternal-Pulsar github project .

There are two dlls dropped, one for x64 architecture and the second one for x86. When injected by Doublepulsar it will download the first stage Blackmoon malware and follow the same execution stages described in this analysis.
Stage 4.2 – WmiPrvSER.exe – XMRig miner
WmiPrvSER.exe is a classic XMRig Monero miner. Our sample is the XMRig version 6.18, and it creates a BaseNamedObjects\\Win__Host mutex on the victim’s host. You can find a full report on XMRig here.
Stage 5 – GraphicsPerfSvcs service – dropper
As mentioned in the previous stage, the GraphicsPerfSvcs service will be started automatically at system startup. Every time it runs, it will check if two of the following files exist:
- C:\Windows\TEMP\ctfmoon.exe
- C:\Windows\Microsoft.NET\traffmonetizer\Traffmonetizer.exe
If not found, it will drop both those files and all needed dlls for their execution.
The dropper also creates two new firewall rules that allow all outbound connections from dropped files by executing the following commands:
netsh advfirewall firewall add rule name=ctfmoon dir=out program=C:\Windows\Microsoft.NET\ctfmoon.exe action=allownetsh advfirewall firewall add rule name=traffmonetizer dir=out program=C:\Windows\Microsoft.NET\traffmonetizer\traffmonetizer.exe action=allow

The service stays up and constantly attempts to read from the URL: hxxp://down.ftp21[.]cc/Update.txt. At the time of the analysis, this URL was down so we were not able to observe its content. However, following the service code, it seems to read the URL content and check if it contains one of the following commands:
[Delete File], [Kill Proccess], or [Delete Service], which will delete file, kill process or delete service accordingly.
Stage 6 – Ctfmoon.exe and Traffmonetizer.exe – Traffic Stealers
GraphicsPerfSvcs service executes two dropped files: Ctfmoon.exe and Traffmonetizer.exe, both appeared to be Potentially Unwanted Programs (PUP’s) in the form of traffic stealers. Both software are using the “network bandwidth sharing” monetization scheme to make “passive income”.
Ctfmoon.exe is a cli version of the Iproyal Pawns application. It gets the user email address and password as execution parameters to associate the activity and collect the money to the passed account. GraphicsPerfSvcs executes the following command line to start the Iproyal Pawns: ctfmoon.exe [email protected] -password=123456Aa. -device-name=Win32 -accept-tos
We can see that the user mentioned in our execution parameters already made $169:

The Traffmonetizer.exe is similar to Ctfmoon.exe, created by Traffmonetizer. It reads the user account data from a settings.json file dropped in users roaming directory. Our .json file contains the following content:
{"Token":"1gUgURMzQiuGFgttIdjeZBS0G6fqFlVvhCKlqzfHd3o=","StartWithWindows":false,"Accepting":true}.
Conclusion
The analysis in this blog reveals the effort threat actors put into the attack flow, by using several evasion and persistence techniques and using different approaches to increase their income and use victim resources.
MITRE ATT&CK Techniques:
| Persistence | Boot or Logon Autostart Execution: Port Monitors (T1547.010) | The Blackmoon trojan (a95737adb2cd7b1af2291d143200a82d8d32 a868c64fb4acc542608f56a0aeda) is using Port Monitors technique to establish persistence on the target host. |
|---|---|---|
| Persistence | Create or Modify System Process: Windows Service (T1543.003) | The Hook.exe dropper (1A7A4B5E7C645316A6AD59E26054A95 654615219CC03657D6834C9DA7219E99F) creates a new service to establish persistence on the target host. |
| Defense Evasion | Process Injection: Process Hollowing (T1055.012) | The dll dropped by Blackmoon (F5D508C816E485E05DF5F58450D623DC6B FA35A2A0682C238286D82B4B476FBB) is using the process hollowing technique to evade endpoint security detection. |
| Defense Evasion | Impair Defenses: Disable or Modify Tools (T1562.001) | The Blackmoon trojan (a95737adb2cd7b1af2291d143200a82d8 d32a868c64fb4acc542608f56a0aeda) disables Windows Defender to evade end-point security detection. |
| Lateral Movement | Exploitation of Remote Services (T1210) | The MpMgSvc.exe spreader (72B0DA797EA4FC76BA4DB6AD131056257965D F9B2BCF26CE2189AF3DBEC5B1FC) uses EternalBlue and DoublePulsar to spread in organization’s environment. |
| Discovery | Network Share Discovery (T1135) | The MpMgSvc.exe spreader (72B0DA797EA4FC76BA4DB6AD131056257965D F9B2BCF26CE2189AF3DBEC5B1FC) scans the network do discover open SMB ports. |
| Impact | Resource Hijacking (T1496) | The XMRing miner (ECC5A64D97D4ADB41ED9332E4C0F5DC7DC02 A64A77817438D27FC31C69F7C1D3), Iproyal Pawns trafficStealer (FDD762192D351CEA051C0170840F1D8D 171F334F06313A17EBA97CACB5F1E6E1) and Traffmonetizer trafficStealer (2923EACD0C99A2D385F7C989882B7CCA 83BFF133ECF176FDB411F8D17E7EF265) executed to use victim’s resources. |
| Impact | Service Stop (T1489) | The Blackmoon trojan (a95737adb2cd7b1af2291d143200a82d8d 32a868c64fb4acc542608f56a0aeda) stops updates and security products services. |
| Command and Control | Application Layer Protocol: Web Protocols (T1071.001) | The downloader (E9A83C8811E7D7A6BF7EA7A656041BCD68968 7F8B23FA7655B28A8053F67BE99) downloads next stage payloads over HTTP protocol. GraphicsPerfSvcs service (5AF88DBDC7F53BA359DDC47C3BCAF3F5FE 9BDE83211A6FF98556AF7E38CDA72B) uses HTTP protocol to get command from C&C server. |
IOC’s
| File name | SHA-256 | |
|---|---|---|
| 445.exe | a95737adb2cd7b1af2291d143200a82 d8d32a868c64fb4acc542608f56a0aeda |
Blackmoon Trojan |
| RunDllExe.dll | F5D508C816E485E05DF5F58450D623DC 6BFA35A2A0682C238286D82B4B476FBB |
Injector |
| Injected code | E9A83C8811E7D7A6BF7EA7A656041BCD 689687F8B23FA7655B28A8053F67BE99 |
Downloader |
| MpMgSvc.dll | E9BD4A9C6EA27033BCB696E65D7441DC2D 42CD7F9F02084B5C704316F0A4FDDF |
|
| Hooks.exe | 1A7A4B5E7C645316A6AD59E26054A95654615 219CC03657D6834C9DA7219E99F |
Dropper |
| MpMgSvc.exe | 72B0DA797EA4FC76BA4DB6AD131056257965 DF9B2BCF26CE2189AF3DBEC5B1FC |
Spreader |
| WmiPrvSER.exe | ECC5A64D97D4ADB41ED9332E4C0F5DC7DC02 A64A77817438D27FC31C69F7C1D3 |
XMRig |
| GraphicsPerfSvcs.dll | 5AF88DBDC7F53BA359DDC47C3BCAF3F5FE9BDE 83211A6FF98556AF7E38CDA72B |
Dropper |
| Doublepulsar-1.3.1.exe | 15FFBB8D382CD2FF7B0BD4C87A7C0BFFD1541 C2FE86865AF445123BC0B770D13 |
Shellcode installer |
| Eternalblue-2.2.0.exe | 85B936960FBE5100C170B777E1647CE9F0F0 1E3AB9742DFC23F37CB0825B30B5 |
Exploit |
| Eternalromance-1.4.0.exe | B99C3CC1ACBB085C9A895A8C3510F6DAA F31F0D2D9CCB8477C7FB7119376F57B |
Exploit |
| X64.dll | 275A9A7B99F3474CBF8A61964A6022E3CF 7BAF76E0EE2FBA31A708D8F1E25BD0 |
shellcode |
| X86.dll | F247A48D3ECDBDF91FCD7A2D8728ADAAF 06149586ADDE62DE7212C6DE645AD58 |
shellcode |
| Ctfmoon.exe | FDD762192D351CEA051C0170840F1D8D171 F334F06313A17EBA97CACB5F1E6E1 |
Iproyal Pawns |
| Traffmonetizer.exe | 2923EACD0C99A2D385F7C989882B7CCA8 3BFF133ECF176FDB411F8D17E7EF265 |
Traffmonetizer |
| [email protected] | Iproyal Pawns account | |
| 1gUgURMzQiuGFgttIdjeZBS0 G6fqFlVvhCKlqzfHd3o= |
Traffmonetizer token |
|
| hxxp://down.ftp21[.]cc | C&C server |
References
How to Use Cloud Replication to Automate Environments
Post Syndicated from Pat Patterson original https://www.backblaze.com/blog/how-to-use-cloud-replication-to-automate-environments/
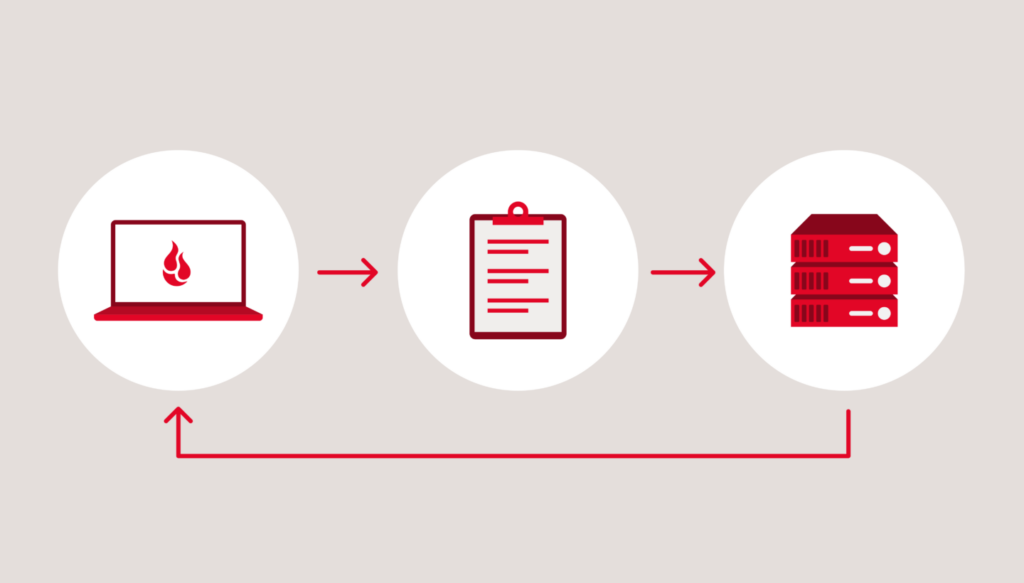
A little over a year ago, we announced general availability of Backblaze Cloud Replication, the ability to automatically copy data across buckets, accounts, or regions. There are several ways to use this service, but today we’re focusing on how to use Cloud Replication to replicate data between environments like testing, staging, and production when developing applications.
First we’ll talk about why you might want to replicate environments and how to go about it. Then, we’ll get into the details: there are some nuances that might not be obvious when you set out to use Cloud Replication in this way, and we’ll talk about those so that you can replicate successfully.
Other Ways to Use Cloud Replication
In addition to replicating between environments, there are two main reasons you might want to use Cloud Replication:
- Data Redundancy: Replicating data for security, compliance, and continuity purposes.
- Data Proximity: Bringing data closer to distant teams or customers for faster access.
Maintaining a redundant copy of your data sounds, well, redundant, but it is the most common use case for cloud replication. It supports disaster recovery as part of a broad cyber resilience framework, reduces the risk of downtime, and helps you comply with regulations.
The second reason (replicating data to bring it geographically closer to end users) has the goal of improving performance and user experience. We looked at this use case in detail in the webinar Low Latency Multi-Region Content Delivery with Fastly and Backblaze.
Four Levels of Testing: Unit, Integration, System, and Acceptance

The Most Interesting Man in the World may test his code in production, but most of us prefer to lead a somewhat less “interesting” life. If you work in software development, you are likely well aware of the various types of testing, but it’s useful to review them to see how different tests might interact with data in cloud object storage.
Let’s consider a photo storage service that stores images in a Backblaze B2 Bucket. There are several real-world Backblaze customers that do exactly this, including Can Stock Photo and CloudSpot, but we’ll just imagine some of the features that any photo storage service might provide that its developers would need to write tests for.
Unit Tests
Unit tests test the smallest components of a system. For example, our photo storage service will contain code to manipulate images in a B2 Bucket, so its developers will write unit tests to verify that each low-level operation completes successfully. A test for thumbnail creation, for example, might do the following:
- Directly upload a test image to the bucket.
- Run the “‘Create Thumbnail” function against the test image.
- Verify that the resulting thumbnail image has indeed been created in the expected location in the bucket with the expected dimensions.
- Delete both the test and thumbnail images.
A large application might have hundreds, or even thousands, of unit tests, and it’s not unusual for development teams to set up automation to run the entire test suite against every change to the system to help guard against bugs being introduced during the development process.
Typically, unit tests require a blank slate to work against, with test code creating and deleting files as illustrated above. In this scenario, the test automation might create a bucket, run the test suite, then delete the bucket, ensuring a consistent environment for each test run.
Integration Tests
Integration tests bring together multiple components to test that they interact correctly. In our photo storage example, an integration test might combine image upload, thumbnail creation, and artificial intelligence (AI) object detection—all of the functions executed when a user adds an image to the photo storage service. In this case, the test code would do the following:
- Run the “Add Image” procedure against a test image of a specific subject, such as a cat.
- Verify that the test and thumbnail images are present in the expected location in the bucket, the thumbnail image has the expected dimensions, and an entry has been created in the image index with the “cat” tag.
- Delete the test and thumbnail images, and remove the image’s entry from the index.
Again, integration tests operate against an empty bucket, since they test particular groups of functions in isolation, and require a consistent, known environment.
System Tests
The next level of testing, system testing, verifies that the system as a whole operates as expected. System testing can be performed manually by a QA engineer following a test script, but is more likely to be automated, with test software taking the place of the user. For example, the Selenium suite of open source test tools can simulate a user interacting with a web browser. A system test for our photo storage service might operate as follows:
- Open the photo storage service web page.
- Click the upload button.
- In the resulting file selection dialog, provide a name for the image, navigate to the location of the test image, select it, and click the submit button.
- Wait as the image is uploaded and processed.
- When the page is updated, verify that it shows that the image was uploaded with the provided name.
- Click the image to go to its details.
- Verify that the image metadata is as expected. For example, the file size and object tag match the test image and its subject.
When we test the system at this level, we usually want to verify that it operates correctly against real-world data, rather than a synthetic test environment. Although we can generate “dummy data” to simulate the scale of a real-world system, real-world data is where we find the wrinkles and edge cases that tend to result in unexpected system behavior. For example, a German-speaking user might name an image “Schloss Schönburg.” Does the system behave correctly with non-ASCII characters such as ö in image names? Would the developers think to add such names to their dummy data?

Acceptance Tests
The final testing level, acceptance testing, again involves the system as a whole. But, where system testing verifies that the software produces correct results without crashing, acceptance testing focuses on whether the software works for the user. Beta testing, where end-users attempt to work with the system, is a form of acceptance testing. Here, real-world data is essential to verify that the system is ready for release.
How Does Cloud Replication Fit Into Testing Environments?
Of course, we can’t just use the actual production environment for system and acceptance testing, since there may be bugs that destroy data. This is where Cloud Replication comes in: we can create a replica of the production environment, complete with its quirks and edge cases, against which we can run tests with no risk of destroying real production data. The term staging environment is often used in connection with acceptance testing, with test(ing) environments used with unit, integration, and system testing.
Caution: Be Aware of PII!
Before we move on to look at how you can put replication into practice, it’s worth mentioning that it’s essential to determine whether you should be replicating the data at all, and what safeguards you should place on replicated data—and to do that, you’ll need to consider whether or not it is or contains personally identifiable information (PII).
The National Institute of Science and Technology (NIST) document SP 800-122 provides guidelines for identifying and protecting PII. In our example photo storage site, if the images include photographs of people that may be used to identify them, then that data may be considered PII.
In most cases, you can still replicate the data to a test or staging environment as necessary for business purposes, but you must protect it at the same level that it is protected in the production environment. Keep in mind that there are different requirements for data protection in different industries and different countries or regions, so make sure to check in with your legal or compliance team to ensure everything is up to standard.
In some circumstances, it may be preferable to use dummy data, rather than replicating real-world data. For example, if the photo storage site was used to store classified images related to national security, we would likely assemble a dummy set of images rather than replicating production data.
How Does Backblaze Cloud Replication Work?
To replicate data in Backblaze B2, you must create a replication rule via either the web console or the B2 Native API. The replication rule specifies the source and destination buckets for replication and, optionally, advanced replication configuration. The source and destination buckets can be located in the same account, different accounts in the same region, or even different accounts in different regions; replication works just the same in all cases. While standard Backblaze B2 Cloud Storage rates apply to replicated data storage, note that Backblaze does not charge service or egress fees for replication, even between regions.
It’s easier to create replication rules in the web console, but the API allows access to two advanced features not currently accessible from the web console:
- Setting a prefix to constrain the set of files to be replicated.
- Excluding existing files from the replication rule.
Don’t worry: this blog post provides a detailed explanation of how to create replication rules via both methods.
Once you’ve created the replication rule, files will begin to replicate at midnight UTC, and it can take several hours for the initial replication if you have a large quantity of data. Files uploaded after the initial replication rule is active are automatically replicated within a few seconds, depending on file size. You can check whether a given file has been replicated either in the web console or via the b2-get-file-info API call. Here’s an example using curl at the command line:
 % curl -s -H "Authorization: ${authorizationToken}" \
    -d "{\"fileId\":  \"${fileId}\"}" \
    "${apiUrl}/b2api/v2/b2_get_file_info" | jq .
{
  "accountId": "15f935cf4dcb",
  "action": "upload",
  "bucketId": "11d5cf096385dc5f841d0c1b",
  ...
  "replicationStatus": "pending",
  ...
}
In the example response, replicationStatus returns the response pending; once the file has been replicated, it will change to completed.
Here’s a short Python script that uses the B2 Python SDK to retrieve replication status for all files in a bucket, printing the names of any files with pending status:
import argparse
import os

from dotenv import load_dotenv

from b2sdk.v2 import B2Api, InMemoryAccountInfo
from b2sdk.replication.types import ReplicationStatus

# Load credentials from .env file into environment
load_dotenv()

# Read bucket name from the command line
parser = argparse.ArgumentParser(description='Show files with "pending" replication status')
parser.add_argument('bucket', type=str, help='a bucket name')
args = parser.parse_args()

# Create B2 API client and authenticate with key and ID from environment
b2_api = B2Api(InMemoryAccountInfo())
b2_api.authorize_account("production", os.environ["B2_APPLICATION_KEY_ID"], os.environ["B2_APPLICATION_KEY"])

# Get the bucket object
bucket = b2_api.get_bucket_by_name(args.bucket)

# List all files in the bucket, printing names of files that are pending replication
for file_version, folder_name in bucket.ls(recursive=True):
    if file_version.replication_status == ReplicationStatus.PENDING:
        print(file_version.file_name)
Note: Backblaze B2’s S3-compatible API (just like Amazon S3 itself) does not include replication status when listing bucket contents—so for this purpose, it’s much more efficient to use the B2 Native API, as used by the B2 Python SDK.
You can pause and resume replication rules, again via the web console or the API. No files are replicated while a rule is paused. After you resume replication, newly uploaded files are replicated as before. Assuming that the replication rule does not exclude existing files, any files that were uploaded while the rule was paused will be replicated in the next midnight-UTC replication job.
How to Replicate Production Data for Testing
The first question is: does your system and acceptance testing strategy require read-write access to the replicated data, or is read-only access sufficient?
Read-Only Access Testing
If read-only access suffices, it might be tempting to create a read-only application key to test against the production environment, but be aware that testing and production make different demands on data. When we run a set of tests against a dataset, we usually don’t want the data to change during the test. That is: the production environment is a moving target, and we don’t want the changes that are normal in production to interfere with our tests. Creating a replica gives you a snapshot of real-world data against which you can run a series of tests and get consistent results.
It’s straightforward to create a read-only replica of a bucket: you just create a replication rule to replicate the data to a destination bucket, allow replication to complete, then pause replication. Now you can run system or acceptance tests against a static replica of your production data.
To later bring the replica up to date, simply resume replication and wait for the nightly replication job to complete. You can run the script shown in the previous section to verify that all files in the source bucket have been replicated.
Read-Write Access Testing
Alternatively, if, as is usually the case, your tests will create, update, and/or delete files in the replica bucket, there is a bit more work to do. Since testing intends to change the dataset you’ve replicated, there is no easy way to bring the source and destination buckets back into sync—changes may have happened in both buckets while your replication rule was paused.
In this case, you must delete the replication rule, replicated files, and the replica bucket, then create a new destination bucket and rule. You can reuse the destination bucket name if you wish since, internally, replication status is tracked via the bucket ID.
Always Test Your Code in an Environment Other Than Production
In short, we all want to lead interesting lives—but let’s introduce risk in a controlled way, by testing code in the proper environments. Cloud Replication lets you achieve that end while remaining nimble, which means you get to spend more time creating interesting tests to improve your product and less time trying to figure out why your data transformed in unexpected ways.
Now you have everything you need to create test and staging environments for applications that use Backblaze B2 Cloud Object Storage. If you don’t already have a Backblaze B2 account, sign up here to receive 10GB of storage, free, to try it out.
The post How to Use Cloud Replication to Automate Environments appeared first on Backblaze Blog | Cloud Storage & Cloud Backup.
Supermicro CloudDC Review Single-Socket AMD EPYC AS-2015CS-TNR
Post Syndicated from Patrick Kennedy original https://www.servethehome.com/supermicro-as-2015cs-tnr-clouddc-review-amd-epyc-genoa-bergamo/
In our Supermicro AS-2015CS-TNR review we see how this CloudDC server offers a flexible single-socket AMD EPYC platform with easy serviceability
The post Supermicro CloudDC Review Single-Socket AMD EPYC AS-2015CS-TNR appeared first on ServeTheHome.
Rust 1.71.0 released
Post Syndicated from original https://lwn.net/Articles/938120/
Version
1.71.0 of the Rust language has been released. Changes this time
include the C-unwind
ABI, an upgrade to musl 1.2, and more.
[$] Stabilizing per-VMA locking
Post Syndicated from original https://lwn.net/Articles/937943/
The kernel-development process routinely absorbs large changes to
fundamental subsystems and still produces stable releases every nine or ten
weeks. On occasion, though, the development community’s luck runs out.
The per-VMA locking work that went into the
6.4 release is a case in point; it looked like a well-tested change that
improved page-fault scalability. There turned out to be a few demons
hiding in that code, though, that made life difficult for early adopters of
the 6.4 kernel.
How AWS helped Altron Group accelerate their vision for optimized customer engagement
Post Syndicated from Jason Yung original https://aws.amazon.com/blogs/big-data/how-aws-helped-altron-group-accelerate-their-vision-for-optimized-customer-engagement/
This is a guest post co-authored by Jacques Steyn, Senior Manager Professional Services at Altron Group.
Altron is a pioneer of providing data-driven solutions for their customers by combining technical expertise with in-depth customer understanding to provide highly differentiated technology solutions. Alongside their partner AWS, they participated in AWS Data-Driven Everything (D2E) workshops and a bespoke AWS Immersion Day workshop that catered to their needs to improve their engagement with their customers.
This post discusses the journey that took Altron from their initial goals, to technical implementation, to the business value created from understanding their customers and their unique opportunities better. They were able to think big but start small with a working solution involving rich business intelligence (BI) and insights provided to their key business areas.
Data-Driven Everything engagement
Altron has provided information technology services since 1965 across South Africa, the Middle East, and Australia. Although the group saw strong results at 2022-year end, the region continues to experience challenging operating conditions with global supply chains disrupted, electronic component shortages, and scarcity of IT talent.
To reflect the needs of their customers spread across different geographies and industries, Altron has organized their operating model across individual Operating Companies (OpCos). These are run autonomously with different sales teams, creating siloed operations and engagement with customers and making it difficult to have a holistic and unified sales motion.
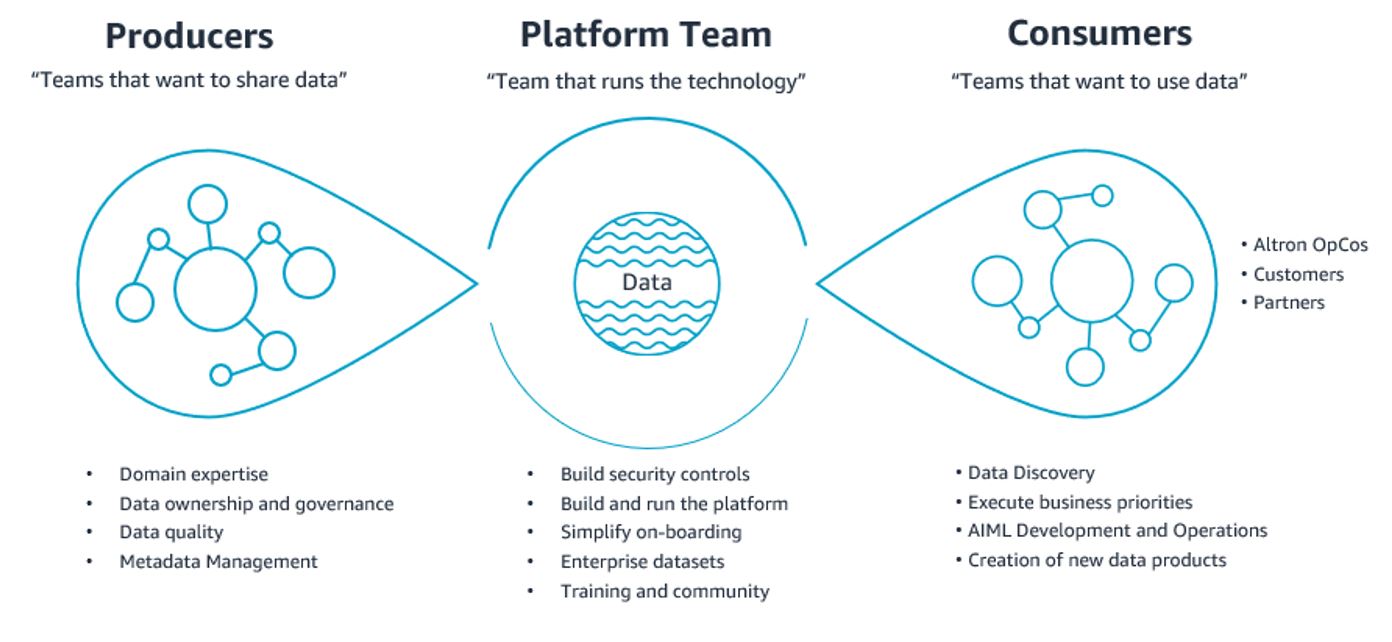
To succeed further, their vision of data requires it to be accessible and actionable to all, with key roles and responsibilities defined by those who produce and consume data, as shown in the following figure. This allows for transparency, speed to action, and collaboration across the group while enabling the platform team to evangelize the use of data:
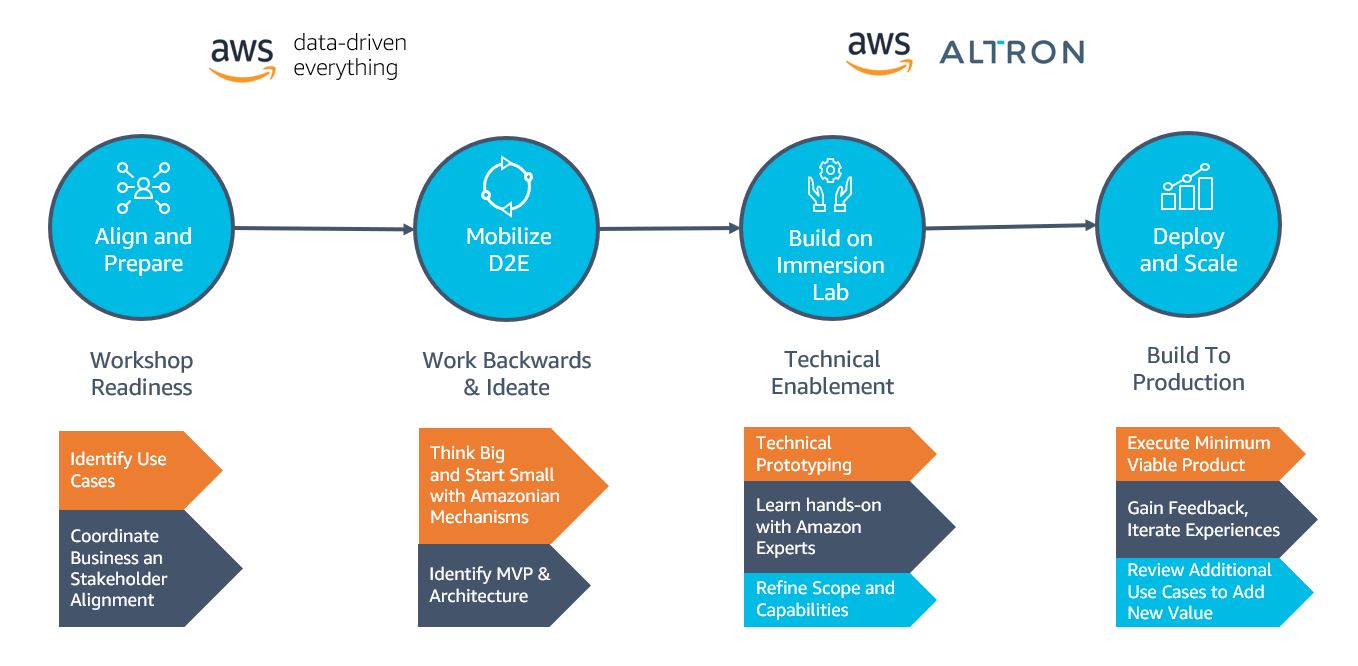
Altron engaged with AWS to seek advice on their data strategy and cloud modernization to bring their vision to fruition. The D2E program was selected to help identify the best way to think big but start small by working collaboratively to ideate on the opportunities to build data as a product, particularly focused on federating customer profile data in an agile and scalable approach.
Amazon mechanisms such as Working Backwards were employed to devise the most delightful and meaningful solution and put customers at the heart of the experience. The workshop helped devise the think big solution that starting with the Systems Integration (SI) OpCo as the first flywheel turn would be the best way to start small and prototype the initial data foundation collaboratively with AWS Solutions Architects.
Preparing for an AWS Immersion Day workshop
The typical preparation of an AWS Immersion Day involves identifying examples of common use case patterns and utilizing demonstration data. To maximize its success, the Immersion Day was stretched across multiple days as a hands-on workshop to enable Altron to bring their own data, build a robust data pipeline, and scale their long-term architecture. In addition, AWS and Altron identified and resolved any external dependencies, such as network connectivity to data sources and targets, where Altron was able to put the connectivity to the sources in place.
Identifying key use cases
After a number of preparation meetings to discuss business and technical aspects of the use case, AWS and Altron identified two uses cases to resolve their two business challenges:
- Business intelligence for business-to-business accounts – Altron wanted to focus on their business-to-business (B2B) accounts and customer data. In particular, they wanted to enable their account managers, sales executives, and analysts to use actual data and facts to get a 360 view of their accounts.
- Goals – Grow revenue, increase the conversion ratio of opportunities, reduce the average sales cycle, improve the customer renewal rate.
- Target – Dashboards to be refreshed on a daily basis that would provide insights on sales, gross profit, sales pipelines, and customers.
- Data quality for account and customer data – Altron wanted to enable data quality and data governance best practices.
- Goals – Lay the foundation for a data platform that can be used in the future by internal and external stakeholders.
Conducting the Immersion Day workshop
Altron set aside 4 days for their Immersion Day, during which time AWS had assigned a dedicated Solutions Architect to work alongside them to build the following prototype architecture:

This solution includes the following components:
- AWS Glue is a serverless data integration service that makes it simple to discover, prepare, move, and integrate data from multiple sources for analytics, machine learning, and application development. The Altron team created an AWS Glue crawler and configured it to run against Azure SQL to discover its tables. The AWS Glue crawler populates the table definition with its schema in AWS Glue Data Catalog.
- This step consists of two components:
- A set of AWS Glue PySpark jobs reads the source tables from Azure SQL and outputs the resulting data in the Amazon Simple Storage Service “Raw Zone”. Basic formatting and readability of the data is standardized here. The jobs run on a scheduled basis, according to the upstream data availability (which currently is daily).
- Users are able to manually upload reference files (CSV and Excel format) via the Amazon Web Services console directly to the Amazon S3 buckets. Depending on the frequency of upload, the Altron team will consider automated mechanisms and remove manual upload.
- The reporting zone is based on a set of Amazon Athena views, which are consumed for BI purposes. The Altron team used Athena to explore the source tables and create the views in SQL language. Depending on the needs, the Altron team will materialize these views or create corresponding AWS Glue jobs.
- Athena exposes the content of the reporting zone for consumption.
- The content of the reporting zone is ingested via SPICE in Amazon QuickSight. BI users create dashboards and reports in QuickSight. Business users can access QuickSight dashboards from their mobile, thanks to the QuickSight native application, configured to use single sign-on (SSO).
- An AWS Step Functions state machine orchestrates the run of the AWS Glue jobs. The Altron team will expand the state machine to include automated refresh of QuickSight SPICE datasets.
- To verify the data quality of the sources through statistically-relevant metrics, AWS Glue Data Quality runs data quality tasks on relevant AWS Glue tables. This can be run manually or scheduled via Amazon Eventbridge (Optional).
Generating business outcomes
In 4 days, the Altron SI team left the Immersion Day workshop with the following:
- A data pipeline ingesting data from 21 sources (SQL tables and files) and combining them into three mastered and harmonized views that are cataloged for Altron’s B2B accounts.
- A set of QuickSight dashboards to be consumed via browser and mobile.
- Foundations for a data lake with data governance controls and data quality checks. The datasets used for the workshop originate from different systems; by integrating the datasets during the workshop implementation, the Altron team can have a comprehensive overview of their customers.
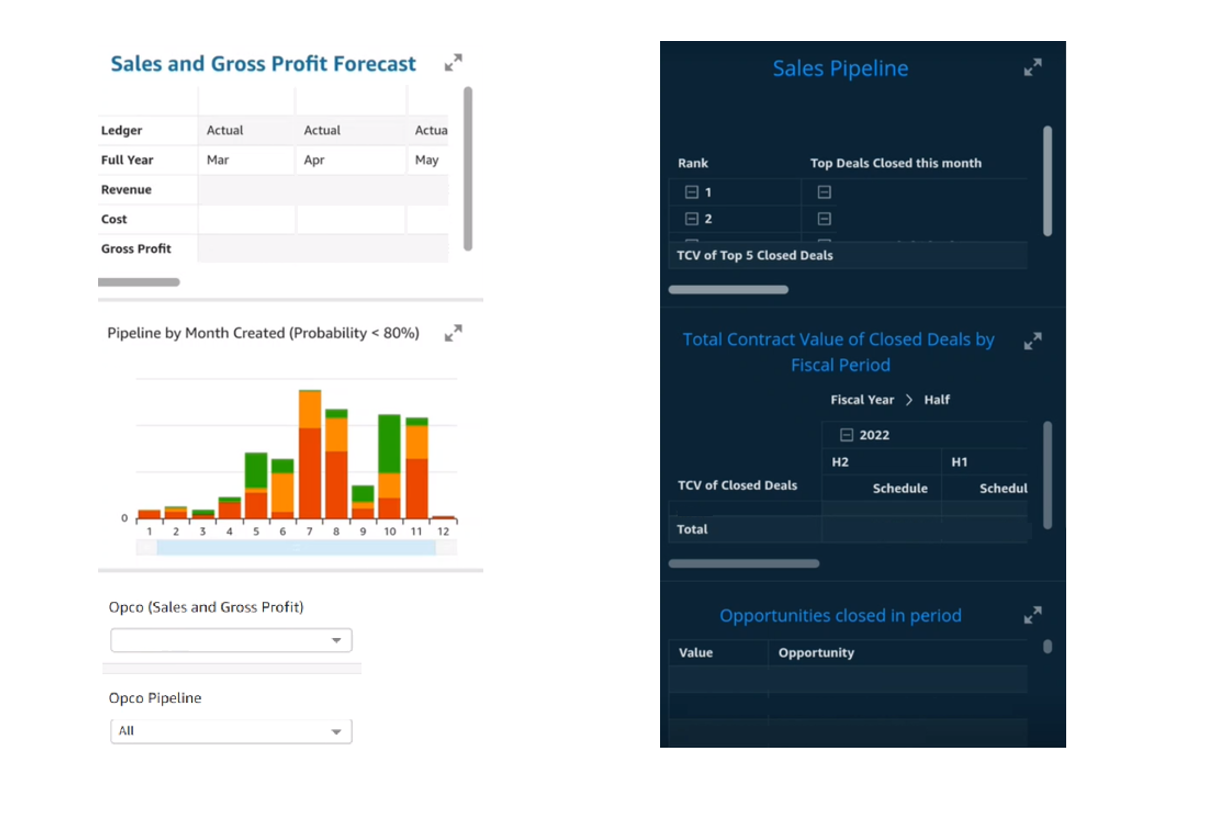
Altron’s sales teams are now able to quickly refresh dashboards encompassing previously disparate datasets that are now centralized to get insights about sales pipelines and forecasts on their desktop or mobile. The technical teams are equally adept at adjusting to business needs by autonomously onboarding new data sources and further enriching the user experience and trust in the data.
Conclusion
In this post, we walked you through the journey the Altron team took with AWS. The outcomes to identify the opportunities that were most pressing to Altron, applying a working backward approach and coming up with a best-fit architecture, led to the subsequent AWS Immersion Day to implement a working prototype that helped them become more data-driven.
With their new focus on AWS skills and mechanisms, increasing trust in their internal data, and understanding the importance of driving change in data literacy and mindset, Altron is better set up for success to best serve their customers in the region.
To find out more about how Altron and AWS can help work backward on your data strategy and employ the agile methodologies discussed in this post, check out Data Management. To learn more about how can help you turn your ideas into solutions, visit the D2E website and the series of AWS Immersion Days that you can choose from. For more hands-on bespoke options, contact your AWS Account Manager, who can provide more details.
Special thanks to everyone at Altron Group who helped contribute to the success of the D2E and Build Lab workshops:
- The Analysts (Liesl Kok, Carmen Kotze)
- Data Engineers (Banele Ngemntu, James Owen, Andrew Corry, Thembelani Mdlankomo)
- QuickSight BI Developers (Ricardo De Gavino Dias, Simei Antoniades)
- Cloud Administrator (Shamiel Galant)
About the authors
 Jacques Steyn runs the Altron Data Analytics Professional Services. He has been leading the building of data warehouses and analytic solutions for the past 20 years. In his free time, he spends time with his family, whether it be on the golf , walking in the mountains, or camping in South Africa, Botswana, and Namibia.
 Jason Yung is a Principal Analytics Specialist with Amazon Web Services. Working with Senior Executives across the Europe and Asia-Pacific Regions, he helps customers become data-driven by understanding their use cases and articulating business value through Amazon mechanisms. In his free time, he spends time looking after a very active 1-year-old daughter, alongside juggling geeky activities with respectable hobbies such as cooking sub-par food.
 Michele Lamarca is a Senior Solutions Architect with Amazon Web Services. He helps architect and run Solutions Accelerators in Europe to enable customers to become hands-on with AWS services and build prototypes quickly to release the value of data in the organization. In his free time, he reads books and tries (hopelessly) to improve his jazz piano skills.
 Hamza is a Specialist Solutions Architect with Amazon Web Services. He runs Solutions Accelerators in EMEA regions to help customers accelerate their journey to move from an idea into a solution in production. In his free time, he spends time with his family, meets with friends, swims in the municipal swimming pool, and learns new skills.
Vega Cloud brings FinOps solutions to their customers faster by embedding Amazon QuickSight
Post Syndicated from Kris Bliesner original https://aws.amazon.com/blogs/big-data/vega-cloud-brings-finops-solutions-to-their-customers-faster-by-embedding-amazon-quicksight/
This is a guest post authored by Kris Bliesner and Mike Brown from Vega Cloud.
Vega Cloud is a premier member of the FinOps Foundation, a program by Linux Foundation supporting FinOps practitioners on cloud financial management best practices. Vega Cloud provides a place where finance, engineers, and innovators come together to accelerate the business value of the cloud with concrete curated data, context-relevant recommendations, and automation to achieve cost savings. Vega Cloud’s platform is based on the FinOps Foundation’s best practices and removes the confusion behind the business value of cloud services and accelerates strategic decisions while maintaining cost optimization. Vega’s curated reports provide actionable insights to accelerate time-to-value from years into days. On average, Vega’s customers immediately identify 15–25% of underutilized cloud spend with a clear direction on how to reallocate the funds to maximize business impact.
Vega Cloud has been growing rapidly and saw an opportunity to accelerate cloud intelligence at hyperscale. Engineering leadership chose Amazon QuickSight, which allowed Vega to add insightful analytics into its platform with customized interactive visuals and dashboards, while scaling at a lower cost without the need to manage infrastructure.
In this post, we discuss how Vega uses QuickSight to bring cloud intelligence solutions to our customers.
Bringing solutions to market at a fast pace
The Vega Cloud Platform was designed from the start by cloud pioneers to enable businesses to get the most value out of their cloud spend. This is done by a multi-step process that starts with data analytics and ends with automation to remediate inefficiencies. The Vega Cloud Platform consumes customer billing and usage information from cloud providers and third parties, and uses that data to show customers what they are spending and which services they are consuming, with business context to help the customer with chargebacks and cost inquiries. The Vega Cloud Platform then analyzes the data collected and produces context relevant recommendations across five major categories: financial, waste elimination, utilization, process, and architecture. Finally, the Vega Cloud Platform enables customers to choose which recommendations to implement through automated processes and immediately receive cost benefits without massive amounts of work by end developers or app teams.
Vega is constantly updating and improving the platform by adding more recommendation types, deeper analytics, and easier automation to save time. When looking for an embedded analytics solution to bring these insights to customers, Vega looked for a tool that would allow us to keep up with our rapid growth and iterate quickly. With QuickSight, Vega has been able to scale from the proof of concept stage to enterprise-level analytics and visualizations as the company grows. QuickSight enables our product team to ship product quickly and rapidly test customer feedback and assumptions. Vega has tremendously reduced the time from idea to implementation for the analytics solutions by using QuickSight.

Using embedded QuickSight saved Vega 6–12 months of development time, allowing us to go to market sooner. Vega Cloud’s team of certified FinOps practitioners—a unique combination of finance professionals, architects, FinOps practitioners, educators, engineers, financial analysts, and data analysts with deep expertise in multi-cloud environments—can focus on driving business growth and meeting customer needs. QuickSight gives the Vega team one place to build reports and dashboards, allowing the Vega Cloud Platform to deliver data analytics to customers quickly and consistently. The Vega Cloud Platform uses QuickSight APIs to seamlessly onboard new users. In addition to the cost savings Vega Cloud has achieved by saving development time, QuickSight doesn’t require licensing or maintenance costs. The AWS pay-as-you-go pricing model allowed Vega Cloud to hit the ground running and scale with real-time demand.
Creating a powerful array of solutions for customers
By embedding QuickSight, Vega Cloud has been able to bring a wealth of information to cloud consumers, helping them gain value and efficiencies. For example, an enterprise customer in the energy industry engaged Vega for cloud cost optimization and saw monthly savings exceeding 25% with cumulative savings of over $1.36 million over 11 months. They moved from 24% Reserved Instance/Savings Plans (RI/SP) coverage to 53% coverage. Their optimization efforts led them to increase their cloud commit by 10 times over 5 years.
The Vega Cloud Platform has two SKUs that use embedded QuickSight: Vega Inform and Vega Optimize. Vega Inform is about cost allocation, chargebacks and showbacks, anomaly detection, spend analysis, and deep usage analytics. Vega Optimize is an easy-to-use set of dashboards to help customers better understand the optimization opportunities they have across their entire enterprise. In the Vega Inform SKU, the Vega Cloud Platform provides true multi-cloud cost reporting with cash and fiscal views and the ability to switch between them seamlessly. The Vega Cloud Platform is a curated data platform to ensure customers avoid garbage in/garbage out scenarios. Vega curates customer usage and billing data to verify billing rates, usage, and credit allocation, and then enables retroactive cleanups to historical spend.
Vega Optimize is a core piece of the Vega Cloud Platform and allows end-users to see cost-optimization recommendations with business context added using the embedded QuickSight dashboards. The Vega Cloud Platform enables end-users to self-manage and approve optimization recommendations for implementation—ensuring that businesses are taking the actions they need to better manage their cloud investments.
Vega customers can identify and act upon near-term optimization opportunities prioritized by business impact and level of effort, as well as identify, purchase, and track committed use resources. QuickSight enables end-users to easily filter down data to exactly what the user wants to see. Doing so enables questions to be answered more quickly, which ensures the right optimization takes place in a timely manner. The depth and breadth of data the Vega Cloud Platform consumes and surfaces to end-users via QuickSight provides customers with a platform approach to enabling FinOps within their organizations.

Powerful and dynamic QuickSight features
The Vega Cloud Platform ingests billions of lines of data on behalf of customers, which must be converted into actionable insight and personalized to a decision-maker’s role inside the organization. Processing terabytes of data can lead to delayed and infrequent reports, slowing down an organization’s ability to respond and compete in their respective markets. It is paramount that customers have consistent, dependable access to timely reports with the correct business context. QuickSight is powered by SPICE (Super-fast, Parallel, In-memory Calculation Engine), a robust in-memory engine that now supports up to 1 billion rows of data. Thanks to the Vega Cloud Platform’s implementation of QuickSight, Vega has offloaded the responsibility including engineering from customers to ingest and curate billions of rows of data every day. The Vega Cloud Platform uses role-based permissions, with row-level security from QuickSight, to centralize and tailor data to prioritize actionable insights with the ability to quickly investigate details to provide evidence-based decisions to customers.

QuickSight allows Vega to highlight data that is considered high-cost or high-value to its customers so that they can take quick action. This is accomplished by purpose-built dashboards based on over a decade of experience to ensure customers see the items that will be most impactful in their optimization efforts. The advanced visualizations, sorting, and filtering capabilities of QuickSight allow the Vega Cloud Platform to scale usage by multiple groups within a business, including finance, DevOps, IT and many others. Along with QuickSight, the Vega Cloud Platform uses many other AWS services, including but not limited to Amazon Relational Database Service (Amazon RDS), Amazon Redshift, Amazon Athena, AWS Glue, and more.
Scaling into the future with QuickSight
Vega is focused on continuing to provide customers with cloud intelligence at hyperscale using QuickSight. The Vega Cloud Platform roadmap includes a proof of concept for Amazon QuickSight Q, which would give customers the ability to ask questions in natural language and receive accurate answers with relevant visualizations that help users gain insights from the data. This also includes paginated reports, which makes it easier for customers to create, schedule, and share reports.
QuickSight has enabled Vega Cloud to grow rapidly, while saving time and money and delivering FinOps solutions to businesses in any and every vertical industry consuming cloud at scale.
To learn more about how you can embed customized data visuals and interactive dashboards into any application, visit Amazon QuickSight Embedded.
About the Authors
 Kris Bliesner, CEO, Vega Cloud is a seasoned technology leader with over 25 years of experience in IT management, cloud computing, and consumer-based technology. As the co-founder and CEO of Vega Cloud, Kris continues to be at the forefront of revolutionizing cloud infrastructure optimization.
 Mike Brown, CTO, Vega Cloud is a highly-skilled technology leader and co-founder of Vega Cloud, where he currently serves as the Chief Technology Officer (CTO). With a proven track record in driving technological innovation, Mike has been instrumental in shaping the application architecture and solutions for the company.
SonicWall Recommends Urgent Patching for GMS and Analytics CVEs
Post Syndicated from Caitlin Condon original https://blog.rapid7.com/2023/07/13/etr-sonicwall-recommends-urgent-patching-for-gms-and-analytics-cves/

On Wednesday, July 12, 2023, security firm SonicWall published an urgent security advisory warning customers of 15 new vulnerabilities affecting on-premise instances of their Global Management System (GMS) and Analytics products. Four of the vulnerabilities carry critical severity ratings:
- CVE-2023-34124: Web service authentication bypass
- CVE-2023-34133: Multiple unauthenticated SQL injection issues and security filter bypass
- CVE-2023-34134: Password hash read via web service
- CVE-2023-34137: CAS authentication bypass
The rest of the vulnerabilities include a predictable password reset key issue and a hard-coded Tomcat credentials issue, in addition to command injection, file write, file upload, password hash read, and other issues. SonicWall took the unusual (but not unprecedented) step of issuing an urgent security notice for the new CVEs.
Per the company’s advisory, the various vulnerabilities could allow an attacker to view data that they would not normally be able to retrieve, including data belonging to other users or other data that the application itself is able to access. Attackers may be able to modify or delete this data, causing persistent changes to the application’s content or behavior. At least on the surface, the potential for data exposure and theft as a result of these flaws sounds reminiscent of the recent MOVEit Transfer vulnerabilities — we expect these CVEs to be extremely attractive to adversaries, including those looking to extort victims after executing smash-and-grab attacks.
While the vulnerabilities are not known to be exploited in the wild as of July 13, 2023, SonicWall vulnerabilities, including Rapid7-discovered vulnerabilities, have been popular targets for adversaries in the past (including ransomware groups). The urgent nature of SonicWall’s warning reflects that history and should be heeded.
Mitigation guidance
The affected products are:
- SonicWall GMS 9.3.2-SP1 and before
- SonicWall Analytics 2.5.0.4-R7 and before
The vulnerabilities are fixed in SonicWall GMS 9.3.3 and SonicWall Analytics 2.5.2. We urge on-prem customers to update immediately, without waiting for a regular patch cycle to occur. See SonicWall’s advisory for full details.
Rapid7 customers
Our engineering team expects to ship remote vulnerability checks for the vulnerabilities affecting SonicWall GMS in today’s (July 13) content release. We are investigating the feasibility of adding checks for SonicWall Analytics.
Security updates for Thursday
Post Syndicated from original https://lwn.net/Articles/938108/
Security updates have been issued by Debian (ruby-doorkeeper), Fedora (mingw-nsis and thunderbird), Red Hat (bind9.16, nodejs, nodejs:16, nodejs:18, python38:3.8 and python38-devel:3.8, and rh-nodejs14-nodejs), Slackware (krb5), SUSE (geoipupdate, installation-images, libqt5-qtbase, python-Django1, and skopeo), and Ubuntu (knot-resolver, lib3mf, linux, linux-aws, linux-kvm, linux-lowlatency, linux-raspi, linux, linux-aws, linux-kvm, linux-lts-xenial, linux-azure, linux-gcp, linux-ibm, linux-oracle, linux-azure-fde, linux-xilinx-zynqmp, and scipy).
Spring 2023 PCI DSS and 3DS compliance packages available now
Post Syndicated from Nivetha Chandran original https://aws.amazon.com/blogs/security/spring-2023-pci-dss-and-3ds-compliance-packages-available-now/
Amazon Web Services (AWS) is pleased to announce that seven additional AWS services have been added to the scope of our Payment Card Industry Data Security Standard (PCI DSS) and Payment Card Industry Three-Domain Secure (PCI 3DS) certifications.
The compliance package for PCI DSS and 3DS includes the Attestation of Compliance (AOC), which shows that AWS has been successfully validated against these standards; and the AWS Responsibility Summary, which customers can use to better understand their responsibility regarding operating controls to effectively develop and operate a secure environment on AWS.
These are the seven additional services that have been added to the scope:
- Amazon Chime SDK
- AWS Fault Injection Simulator
- Amazon Inspector
- AWS Mainframe Modernization
- Amazon Omics
- AWS Payment Cryptography
- AWS Wickr
For the full list of services in scope, see AWS Services in Scope by Compliance Program.
Coalfire, a third-party Qualified Security Assessor (QSA), evaluated AWS. Customers can access the AOC and the Responsibility Summary through AWS Artifact, a self-service portal for on-demand access to AWS compliance reports.
To learn more about our PCI program and other compliance and security programs, see the AWS Compliance Programs page. As always, we value your feedback and questions; reach out to the AWS Compliance team through the Contact Us page.
If you have feedback about this post, submit comments in the Comments section below. If you have questions about this post, contact AWS Support.
Want more AWS Security news? Follow us on Twitter.
DLP Exact Data Match beta now available
Post Syndicated from Noelle Kagan original http://blog.cloudflare.com/edm-beta/


The most famous data breaches–the ones that keep security practitioners up at night–involved the leak of millions of user records. Companies have lost names, addresses, email addresses, Social Security numbers, passwords, and a wealth of other sensitive information. Protecting this data is the highest priority of most security teams, yet many teams still struggle to actually detect these leaks.
Cloudflare’s Data Loss Prevention suite already includes the ability to identify sensitive data like credit card numbers, but with the volume of data being transferred every day, it can be challenging to understand which of the transactions that include sensitive data are actually problematic. We hear customers tell us, “I don’t care when one of my employees uses a personal credit card to buy something online. Tell me when one of my customers’ credit cards are leaked.”
In response, we looked for a method to distinguish between any credit card and one belonging to a specific customer. We are excited to announce the launch of our newest Data Loss Prevention feature, Exact Data Match. With Exact Data Match (EDM), customers securely tell us what data they want to protect, and then we identify, log, and block the presence or movement of that data. For example, if you provide us with a set of credit card numbers, we will DLP scan your traffic or repositories for only those cards. This allows you to create targeted DLP detections for your organization.
What is Exact Data Match?
Many Data Loss Prevention (DLP) detections begin with a generic identification of a pattern, often using a regular expression, and then are validated by additional criteria. Validation can leverage a wide range of techniques from checksums to machine learning models. However, this validates that the pattern is a credit card, not that it is your credit card.
With Exact Data Match, you tell us exactly the data you want to protect, but we never see it in cleartext. You provide a list of data of your choosing, such as a list of names, addresses, or credit card numbers, and that data is hashed before ever reaching Cloudflare. We store the hashes and scan your traffic or content for matches of the hashes. When we find a match, we log or block it according to your policy.
By using a finite list of data, we drastically reduce false positives compared to generic pattern matching. Meanwhile, hashing the data maintains your data privacy. Our goal is to meet your data protection and privacy needs.
How do I use it?
We now offer you the ability to upload DLP datasets. These allow you to provide batches of data to be used for your DLP detections.

When creating a dataset, provide a name, description, and a file containing the data to match.
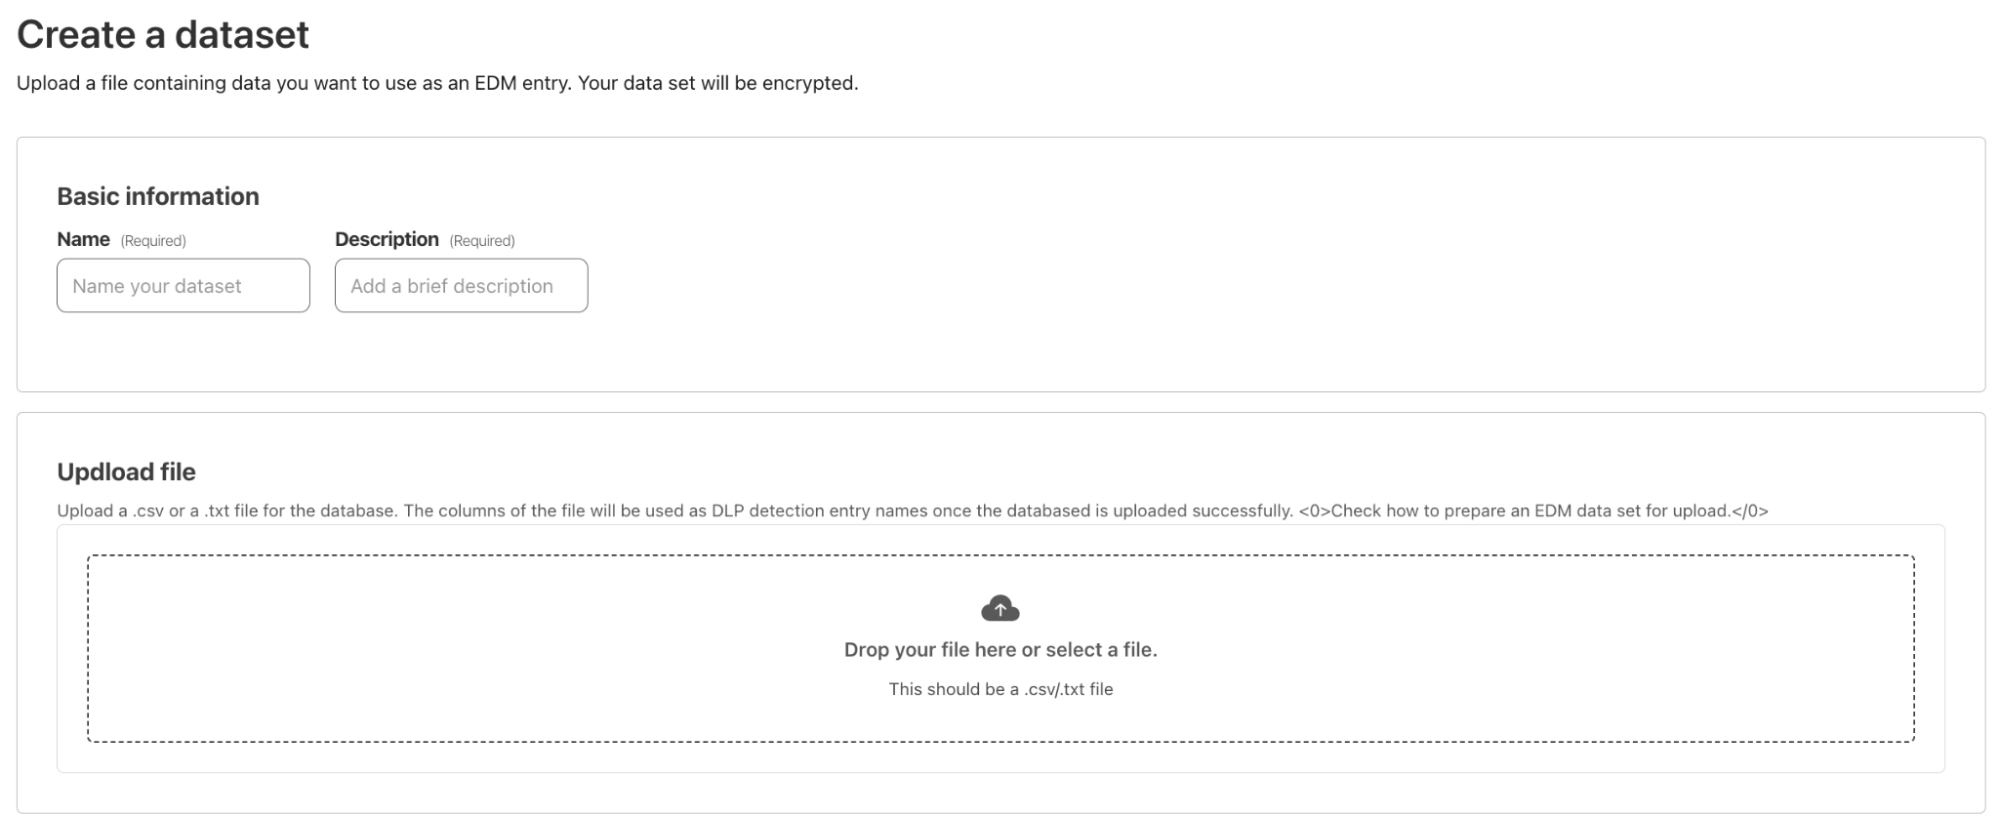
When you upload the file, Cloudflare one-way hashes the data right in your browser. The hashed data is then transferred via API to Cloudflare, while the cleartext data never leaves the browser.
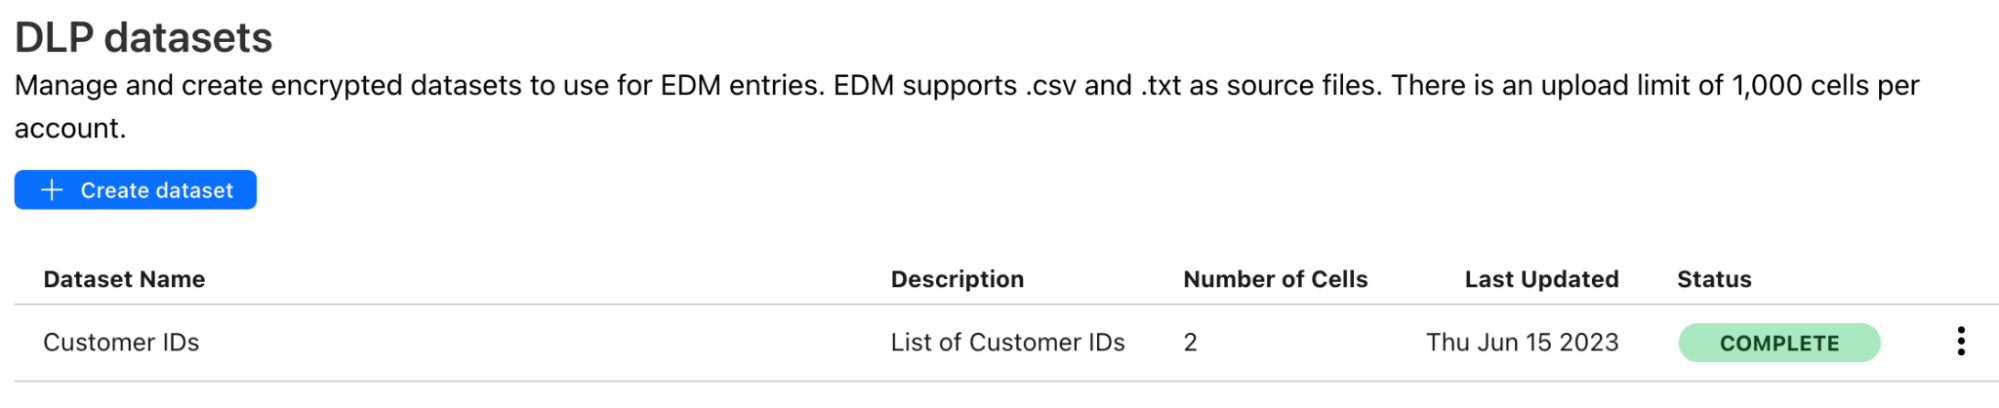
You can see the status of the upload in the datasets table.
The dataset can now be added to a DLP profile for detection. You can also add other predefined and custom entries to the same DLP profile.
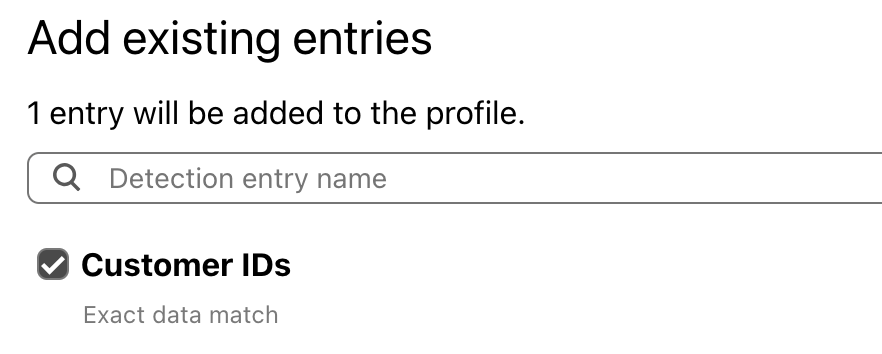
DLP Profiles can be used for inline scanning and protection with Cloudflare Gateway or scanning your data at rest with Cloudflare CASB.
Can I join the beta?
Exact data match is now available for every DLP customer. If you are not a DLP customer but would like to learn more about Cloudflare One and DLP, reach out for a consultation.
What’s next?
Customers have many different formats to store data, and many different ways in which they want to monitor it. Our goal is to offer as much flexibility as your organization needs to meet your data protection goals.
Directing ML-powered Operational Insights from Amazon DevOps Guru to your Datadog event stream
Post Syndicated from Bineesh Ravindran original https://aws.amazon.com/blogs/devops/directing_ml-powered_operational_insights_from_amazon_devops_guru_to_your_datadog_event_stream/
Amazon DevOps Guru is a fully managed AIOps service that uses machine learning (ML) to quickly identify when applications are behaving outside of their normal operating patterns and generates insights from its findings. These insights generated by DevOps Guru can be used to alert on-call teams to react to anomalies for business mission critical workloads. If you are already utilizing Datadog to automate infrastructure monitoring, application performance monitoring, and log management for real-time observability of your entire technology stack, then this blog is for you.
You might already be using Datadog for a consolidated view of your Datadog Events interface to search, analyze and filter events from many different sources in one place. Datadog Events are records of notable changes relevant for managing and troubleshooting IT Operations, such as code, deployments, service health, configuration changes and monitoring alerts.
Wherever DevOps Guru detects operational events in your AWS environment that could lead to outages, it generates insights and recommendations. These insights/recommendations are then pushed to a user specific Datadog endpoint using Datadog events API. Customers can then create dashboards, incidents, alarms or take corrective automated actions based on these insights and recommendations in Datadog.
Datadog collects and unifies all of the data streaming from these complex environments, with a 1-click integration for pulling in metrics and tags from over 90 AWS services. Companies can deploy the Datadog Agent directly on their hosts and compute instances to collect metrics with greater granularity—down to one-second resolution. And with Datadog’s out-of-the-box integration dashboards, companies get not only a high-level view into the health of their infrastructure and applications but also deeper visibility into individual services such as AWS Lambda and Amazon EKS.
This blogpost will show you how to utilize Amazon DevOps guru with Datadog to get real time insights and recommendations on their AWS Infrastructure. We will demonstrate how an insight generated by Amazon DevOps Guru for an anomaly can automatically be pushed to Datadog’s event streams which can then be used to create dashboards, create alarms and alerts to take corrective actions.
Solution Overview
When an Amazon DevOps Guru insight is created, an Amazon EventBridge rule is used to capture the insight as an event and routed to an AWS Lambda Function target. The lambda function interacts with Datadog using a REST API to push corresponding DevOps Guru events captured by Amazon EventBridge
The EventBridge rule can be customized to capture all DevOps Guru insights or narrowed down to specific insights. In this blog, we will be capturing all DevOps Guru insights and will be performing actions on Datadog for the below DevOps Guru events:
- DevOps Guru New Insight Open
- DevOps Guru New Anomaly Association
- DevOps Guru Insight Severity Upgraded
- DevOps Guru New Recommendation Created
- DevOps Guru Insight Closed
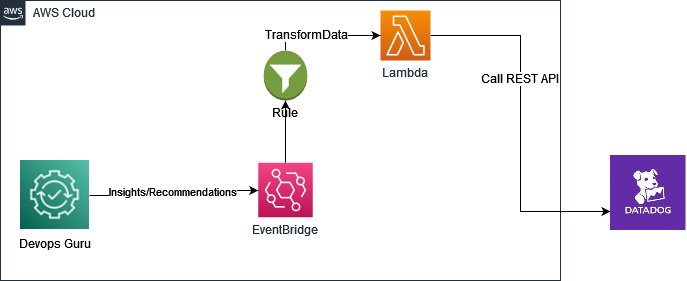
Figure 1: Amazon DevOps Guru Integration with Datadog with Amazon EventBridge and AWS.
Solution Implementation Steps
Pre-requisites
Before you deploy the solution, complete the following steps.
-
- Datadog Account Setup: We will be connecting your AWS Account with Datadog. If you do not have a Datadog account, you can request a free trial developer instance through Datadog.
- Datadog Credentials: Gather the credentials of Datadog keys that will be used to connect with AWS. Follow the steps below to create an API Key and Application Key
Add an API key or client token-
- To add a Datadog API key or client token:
- Navigate to Organization settings, then click the API keys or Client Tokens
- Click the New Key or New Client Token button, depending on which you’re creating.
- Enter a name for your key or token.
- Click Create API key or Create Client Token.
- Note down the newly generated API Key value. We will need this in later steps
-

Figure 2: Create new API Key.
Add application keys
- To add a Datadog application key, navigate to Organization Settings > Application Keys.If you have the permission to create application keys, click New Key.Note down the newly generated Application Key. We will need this in later steps
-

Add Application Key and API Key to AWS Secrets Manager : Secrets Manager enables you to replace hardcoded credentials in your code, including passwords, with an API call to Secrets Manager to retrieve the secret programmatically. This helps ensure the secret can’t be compromised by someone examining your code,because the secret no longer exists in the code.
Follow below steps to create a new secret in AWS Secrets Manager.
- Open the Secrets Manager console at https://console.aws.amazon.com/secretsmanager/
- Choose Store a new secret.
- On the Choose secret type page, do the following:
- For Secret type, choose other type of secret.
- In Key/value pairs, either enter your secret in Key/value
pairs
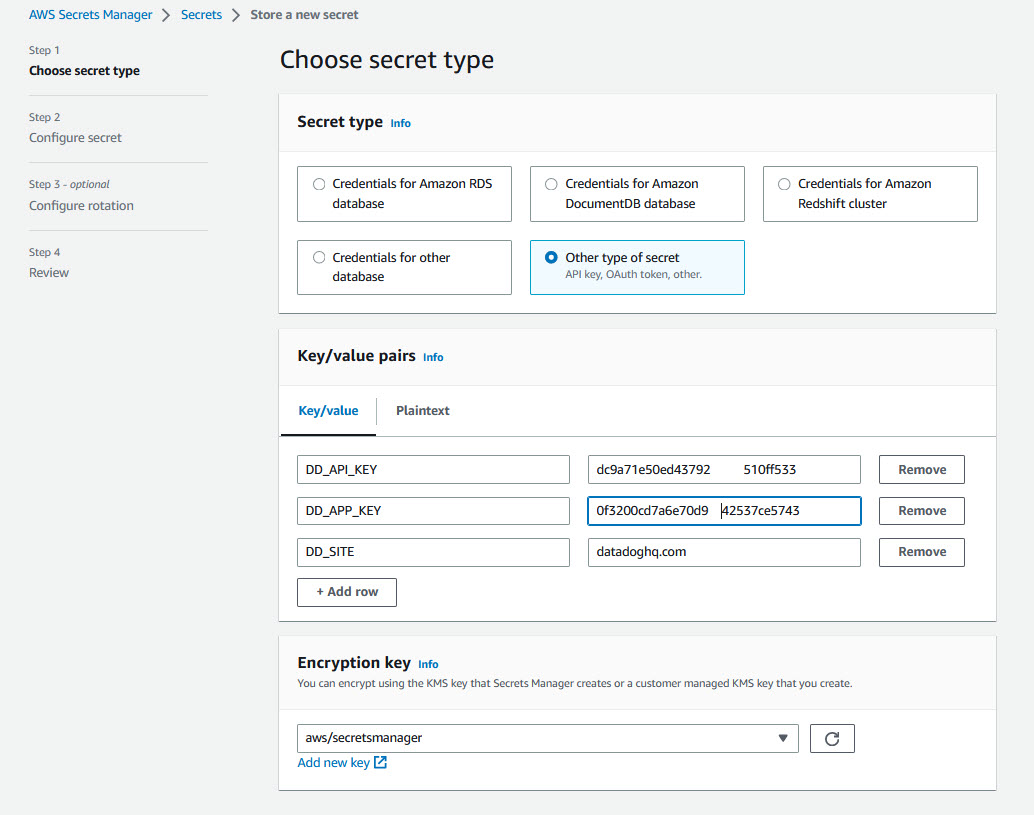
Figure 3: Create new secret in Secret Manager.
Click next and enter “DatadogSecretManager” as the secret name followed by Review and Finish
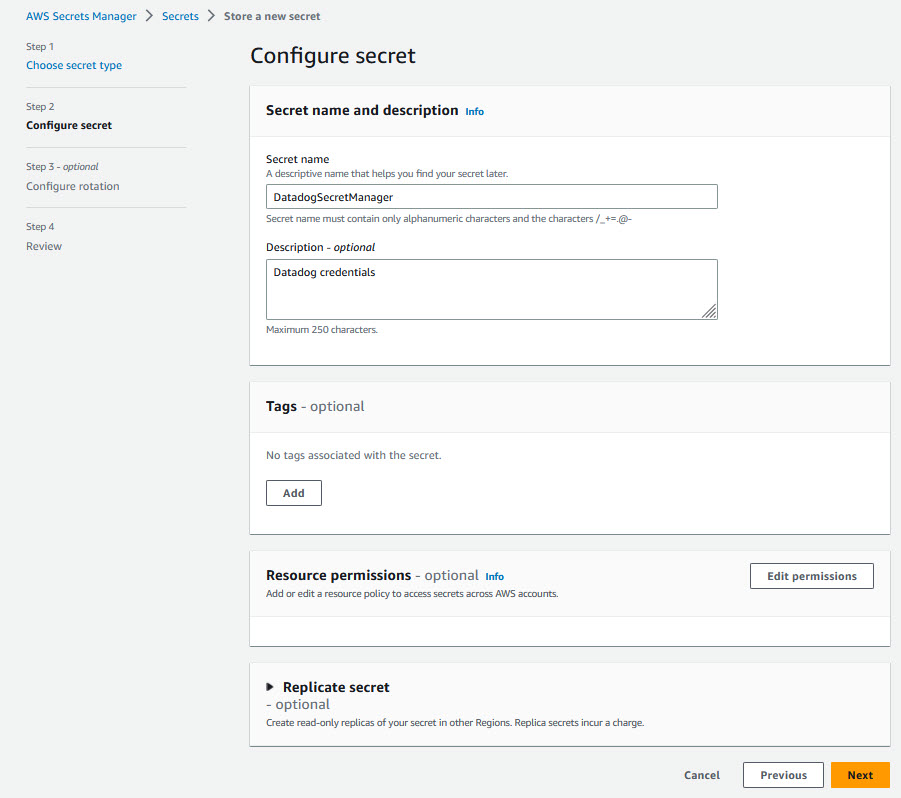
Figure 4: Configure secret in Secret Manager.
-
-
- Enable DevOps Guru for your applications by following these steps or you can follow this blog to deploy a sample serverless application that can be used to generate DevOps Guru insights for anomalies detected in the application.
- AWS Cloud9 is recommended to create an environment as AWS Serverless Application Model (SAM) CLI and AWS Command Line Interface (CLI) are pre-installed and can be accessed from a bash terminal.
- Install and set up SAM CLI – Install the SAM CLI
- Download and set up Java. The version should be matching to the runtime that you defined in the SAM template. yaml Serverless function configuration – Install the Java SE Development Kit 11
- Maven – Install Maven
-
Option 1: Deploy Datadog Connector App from AWS Serverless Repository
The DevOps Guru Datadog Connector application is available on the AWS Serverless Application Repository which is a managed repository for serverless applications. The application is packaged with an AWS Serverless Application Model (SAM) template, definition of the AWS resources used and the link to the source code. Follow the steps below to quickly deploy this serverless application in your AWS account
-
-
- Login to the AWS management console of the account to which you plan to deploy this solution.
- Go to the DevOps Guru Datadog Connector application in the AWS Serverless Repository and click on “Deploy”.
- The Lambda application deployment screen will be displayed where you can enter the Datadog Application name

Figure 5: DevOps Guru Datadog connector.

Figure 6: Serverless Application DevOps Guru Datadog connector.
- After successful deployment the AWS Lambda Application page will display the “Create complete” status for the serverlessrepo-DevOps-Guru-Datadog-Connector application. The CloudFormation template creates four resources,
- Lambda function which has the logic to integrate to the Datadog
- Event Bridge rule for the DevOps Guru Insights
- Lambda permission
- IAM role
- Now skip Option 2 and follow the steps in the “Test the Solution” section to trigger some DevOps Guru insights/recommendations and validate that the events are created and updated in Datadog.
-


Option 2: Build and Deploy sample Datadog Connector App using AWS SAM Command Line Interface
As you have seen above, you can directly deploy the sample serverless application form the Serverless Repository with one click deployment. Alternatively, you can choose to clone the GitHub source repository and deploy using the SAM CLI from your terminal.
The Serverless Application Model Command Line Interface (SAM CLI) is an extension of the AWS CLI that adds functionality for building and testing serverless applications. The CLI provides commands that enable you to verify that AWS SAM template files are written according to the specification, invoke Lambda functions locally, step-through debug Lambda functions, package and deploy serverless applications to the AWS Cloud, and so on. For details about how to use the AWS SAM CLI, including the full AWS SAM CLI Command Reference, see AWS SAM reference – AWS Serverless Application Model.
Before you proceed, make sure you have completed the pre-requisites section in the beginning which should set up the AWS SAM CLI, Maven and Java on your local terminal. You also need to install and set up Docker to run your functions in an Amazon Linux environment that matches Lambda.
Clone the source code from the github repo
git clone https://github.com/aws-samples/amazon-devops-guru-connector-datadog.git
Build the sample application using SAM CLI
$cd DatadogFunctions

$sam build
Building codeuri: $\amazon-devops-guru-connector-datadog\DatadogFunctions\Functions runtime: java11 metadata: {} architecture: x86_64 functions: Functions
Running JavaMavenWorkflow:CopySource
Running JavaMavenWorkflow:MavenBuild
Running JavaMavenWorkflow:MavenCopyDependency
Running JavaMavenWorkflow:MavenCopyArtifacts

Build Succeeded

Built Artifacts  : .aws-sam\build
Built Template   : .aws-sam\build\template.yaml

Commands you can use next
=========================
[*] Validate SAM template: sam validate
[*] Invoke Function: sam local invoke
[*] Test Function in the Cloud: sam sync --stack-name {{stack-name}} --watch
[*] Deploy: sam deploy --guided
This command will build the source of your application by installing dependencies defined in Functions/pom.xml, create a deployment package and saves it in the. aws-sam/build folder.
Deploy the sample application using SAM CLI
$sam deploy --guided
This command will package and deploy your application to AWS, with a series of prompts that you should respond to as shown below:
-
-
- Stack Name: The name of the stack to deploy to CloudFormation. This should be unique to your account and region, and a good starting point would be something matching your project name.
- AWS Region: The AWS region you want to deploy your application to.
- Confirm changes before deploy: If set to yes, any change sets will be shown to you before execution for manual review. If set to no, the AWS SAM CLI will automatically deploy application changes.
- Allow SAM CLI IAM role creation:Many AWS SAM templates, including this example, create AWS IAM roles required for the AWS Lambda function(s) included to access AWS services. By default, these are scoped down to minimum required permissions. To deploy an AWS CloudFormation stack which creates or modifies IAM roles, the CAPABILITY_IAM value for capabilities must be provided. If permission isn’t provided through this prompt, to deploy this example you must explicitly pass
--capabilities CAPABILITY_IAMto the sam deploy command. - Disable rollback [y/N]: If set to Y, preserves the state of previously provisioned resources when an operation fails.
- Save arguments to configuration file (samconfig.toml): If set to yes, your choices will be saved to a configuration file inside the project, so that in the future you can just re-run sam deploy without parameters to deploy changes to your application.
-
After you enter your parameters, you should see something like this if you have provided Y to view and confirm ChangeSets. Proceed here by providing ‘Y’ for deploying the resources.
Initiating deployment
=====================

        Uploading to sam-app-datadog/0c2b93e71210af97a8c57710d0463c8b.template  1797 / 1797  (100.00%)


Waiting for changeset to be created..

CloudFormation stack changeset
---------------------------------------------------------------------------------------------------------------------
Operation                     LogicalResourceId             ResourceType                  Replacement
---------------------------------------------------------------------------------------------------------------------
+ Add                         FunctionsDevOpsGuruPermissi   AWS::Lambda::Permission       N/A
                              on
+ Add                         FunctionsDevOpsGuru           AWS::Events::Rule             N/A
+ Add                         FunctionsRole                 AWS::IAM::Role                N/A
+ Add                         Functions                     AWS::Lambda::Function         N/A
---------------------------------------------------------------------------------------------------------------------


Changeset created successfully. arn:aws:cloudformation:us-east-1:867001007349:changeSet/samcli-deploy1680640852/bdc3039b-cdb7-4d7a-a3a0-ed9372f3cf9a


Previewing CloudFormation changeset before deployment
======================================================
Deploy this changeset? [y/N]: y

2023-04-04 15:41:06 - Waiting for stack create/update to complete

CloudFormation events from stack operations (refresh every 5.0 seconds)
---------------------------------------------------------------------------------------------------------------------
ResourceStatus                ResourceType                  LogicalResourceId             ResourceStatusReason
---------------------------------------------------------------------------------------------------------------------
CREATE_IN_PROGRESS            AWS::IAM::Role                FunctionsRole                 -
CREATE_IN_PROGRESS            AWS::IAM::Role                FunctionsRole                 Resource creation Initiated
CREATE_COMPLETE               AWS::IAM::Role                FunctionsRole                 -
CREATE_IN_PROGRESS            AWS::Lambda::Function         Functions                     -
CREATE_IN_PROGRESS            AWS::Lambda::Function         Functions                     Resource creation Initiated
CREATE_COMPLETE               AWS::Lambda::Function         Functions                     -
CREATE_IN_PROGRESS            AWS::Events::Rule             FunctionsDevOpsGuru           -
CREATE_IN_PROGRESS            AWS::Events::Rule             FunctionsDevOpsGuru           Resource creation Initiated
CREATE_COMPLETE               AWS::Events::Rule             FunctionsDevOpsGuru           -
CREATE_IN_PROGRESS            AWS::Lambda::Permission       FunctionsDevOpsGuruPermissi   -
                                                            on
CREATE_IN_PROGRESS            AWS::Lambda::Permission       FunctionsDevOpsGuruPermissi   Resource creation Initiated
                                                            on
CREATE_COMPLETE               AWS::Lambda::Permission       FunctionsDevOpsGuruPermissi   -
                                                            on
CREATE_COMPLETE               AWS::CloudFormation::Stack    sam-app-datadog               -
---------------------------------------------------------------------------------------------------------------------


Successfully created/updated stack - sam-app-datadog in us-east-1
Once the deployment succeeds, you should be able to see the successful creation of your resources. Also, you can find your Lambda, IAM Role and EventBridge Rule in the CloudFormation stack output values.
You can also choose to test and debug your function locally with sample events using the SAM CLI local functionality.Test a single function by invoking it directly with a test event. An event is a JSON document that represents the input that the function receives from the event source. Refer the Invoking Lambda functions locally – AWS Serverless Application Model link here for more details.
$ sam local invoke Functions -e ‘event/event.json’
Once you are done with the above steps, move on to “Test the Solution” section below to trigger some DevOps Guru insights and validate that the events are created and pushed to Datadog.
Test the Solution
To test the solution, we will simulate a DevOps Guru Insight. You can also simulate an insight by following the steps in this blog. After an anomaly is detected in the application, DevOps Guru creates an insight as shown below
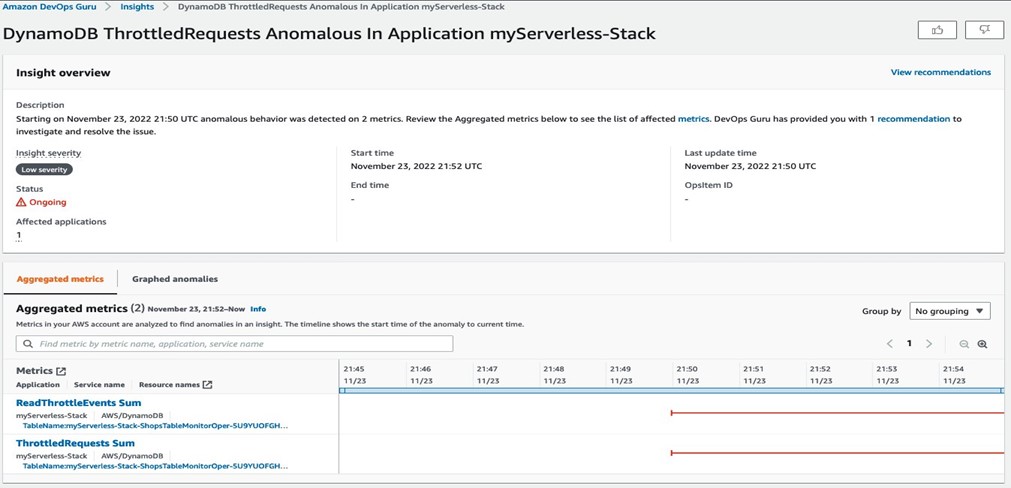
Figure 7: DevOps Guru insight for DynamoDB
For the DevOps Guru insight shown above, a corresponding event is automatically created and pushed to Datadog as shown below. In addition to the events creation, any new anomalies and recommendations from DevOps Guru is also associated with the events
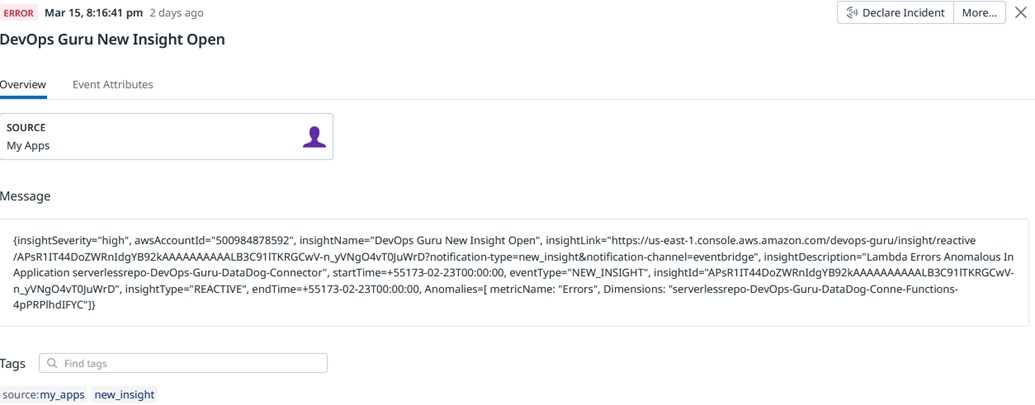
Figure 8 : DevOps Guru Insight pushed to Datadog event stream.
Cleaning Up
To delete the sample application that you created, In your Cloud 9 environment open a new terminal. Now type in the AWS CLI command below and pass the stack name you provided in the deploy step
aws cloudformation delete-stack --stack-name <Stack Name>
Alternatively ,you could also use the AWS CloudFormation Console to delete the stack
Conclusion
This article highlights how Amazon DevOps Guru monitors resources within a specific region of your AWS account, automatically detecting operational issues, predicting potential resource exhaustion, identifying probable causes, and recommending remediation actions. It describes a bespoke solution enabling integration of DevOps Guru insights with Datadog, enhancing management and oversight of AWS services. This solution aids customers using Datadog to bolster operational efficiencies, delivering customized insights, real-time alerts, and management capabilities directly from DevOps Guru, offering a unified interface to swiftly restore services and systems.
To start gaining operational insights on your AWS Infrastructure with Datadog head over to Amazon DevOps Guru documentation page.
About the authors:
Nikon 70-180mm – Lighter, Cheaper, Smaller… BUT…🤔
Post Syndicated from Matt Granger original https://www.youtube.com/watch?v=i0WYIgqj8LA
French Police Will Be Able to Spy on People through Their Cell Phones
Post Syndicated from Bruce Schneier original https://www.schneier.com/blog/archives/2023/07/french-police-will-be-able-to-spy-on-people-through-their-cell-phones.html
The French police are getting new surveillance powers:
French police should be able to spy on suspects by remotely activating the camera, microphone and GPS of their phones and other devices, lawmakers agreed late on Wednesday, July 5.
[…]
Covering laptops, cars and other connected objects as well as phones, the measure would allow the geolocation of suspects in crimes punishable by at least five years’ jail. Devices could also be remotely activated to record sound and images of people suspected of terror offenses, as well as delinquency and organized crime.
[…]
During a debate on Wednesday, MPs in President Emmanuel Macron’s camp inserted an amendment limiting the use of remote spying to “when justified by the nature and seriousness of the crime” and “for a strictly proportional duration.” Any use of the provision must be approved by a judge, while the total duration of the surveillance cannot exceed six months. And sensitive professions including doctors, journalists, lawyers, judges and MPs would not be legitimate targets.
[$] LWN.net Weekly Edition for July 13, 2023
Post Syndicated from original https://lwn.net/Articles/937458/
The LWN.net Weekly Edition for July 13, 2023 is available.
[$] Testing for storage and filesystems
Post Syndicated from original https://lwn.net/Articles/937830/
The kdevops
kernel-testing framework has come up at several earlier summits, including
in two separate sessions at last year’s event.
Testing kernel filesystems and the block layer, not to mention lots of
other kernel subsystems, has become increasingly
important over time.
So it was no
surprise that Luis Chamberlain led a
combined storage and filesystem session at the
2023 Linux Storage, Filesystem,
Memory-Management and BPF Summit to talk more about testing, the
resources needed for it, and what can be done to improve it. It was the
final session for this year’s summit, so this article completes our coverage.
Convening public benefit and charitable foundations working in open domains (OSI blog)
Post Syndicated from original https://lwn.net/Articles/938021/
Over on the Open Source Initiative (OSI) blog, the organization has announced the Open Policy Alliance (OPA), which is meant to bring together various non-profit organizations to help educate and inform US policy makers about open-source software and its needs:
The need to create such a program is more urgent today due to the rise of new regulations in the software industry and adjacent open domains around the world. Cyber security, the societal impact of AI, data and privacy are important issues for legislators globally. At the same time, the COVID-19 pandemic drove collaborative development to unprecedented levels and took Open Source software, open research, open content and data from mainstream to main stage. Moving forward, developing these important public policies whilst not harming the ecosystem requires an understanding of how the Open Source ecosystem works. Ensuring stakeholders without historic benefit of representation are included in those discussions becomes paramount to that end.
The OPA will focus on educating public policy makers on Open Source to inform their development and deliberation of new policy concepts. There are unintended consequences that come from a lack of understanding of how open collaboration works in practice. The OPA will address this as well as the historic absence of contribution from underrepresented groups. The interest areas of the OPA community will complement those of Digitable Public Goods Alliance, a UNICEF multi-stakeholder initiative with a mission to accelerate the attainment of sustainable development goals in low- and middle-income countries that OSI joined earlier this year.
Configure end-to-end data pipelines with Etleap, Amazon Redshift, and dbt
Post Syndicated from Zygimantas Koncius original https://aws.amazon.com/blogs/big-data/configure-end-to-end-data-pipelines-with-etleap-amazon-redshift-and-dbt/
This blog post is co-written with Zygimantas Koncius from Etleap.
Organizations use their data to extract valuable insights and drive informed business decisions. With a wide array of data sources, including transactional databases, log files, and event streams, you need a simple-to-use solution capable of efficiently ingesting and transforming large volumes of data in real time, ensuring data cleanliness, structural integrity, and data team collaboration.
In this post, we explain how data teams can quickly configure low-latency data pipelines that ingest and model data from a variety of sources, using Etleap’s end-to-end pipelines with Amazon Redshift and dbt. The result is robust and flexible data products with high scalability and best-in-class query performance.
Introduction to Amazon Redshift
Amazon Redshift is a fast, fully-managed, self-learning, self-tuning, petabyte-scale, ANSI-SQL compatible, and secure cloud data warehouse. Thousands of customers use Amazon Redshift to analyze exabytes of data and run complex analytical queries. Amazon Redshift Serverless makes it straightforward to run and scale analytics in seconds without having to manage the data warehouse. It automatically provisions and scales the data warehouse capacity to deliver high performance for demanding and unpredictable workloads, and you only pay for the resources you use. Amazon Redshift helps you break down the data silos and allows you to run unified, self-service, real-time, and predictive analytics on all data across your operational databases, data lake, data warehouse, and third-party datasets with built-in governance. Amazon Redshift delivers up to five times better price performance than other cloud data warehouses out of the box and helps you keep costs predictable.
Introduction to dbt
dbt is a SQL-based transformation workflow that is rapidly emerging as the go-to standard for data analytics teams. For straightforward use cases, dbt provides a simple yet robust SQL transformation development pattern. For more advanced scenarios, dbt models can be expanded using macros created with the Jinja templating language and external dbt packages, providing additional functionality.
One of the key advantages of dbt is its ability to foster seamless collaboration within and across data analytics teams. A strong emphasis on version control empowers teams to track and review the history of changes made to their models. A comprehensive testing framework ensures that your models consistently deliver accurate and reliable data, while modularity enables faster development via component reusability. Combined, these features can improve your data team’s velocity, ensure higher data quality, and empower team members to assume ownership.
dbt is popular for transforming big datasets, so it’s important that the data warehouse that runs the transformations provide a lot of computational capacity at the lowest possible cost. Amazon Redshift is capable of fulfilling both of these requirements, with features such as concurrency scaling, RA3 nodes, and Redshift Serverless.
To take advantage of dbt’s capabilities, you can use dbt Core, an open-source command-line tool that serves as the interface to using dbt. By running dbt Core along with dbt’s Amazon Redshift adapter, you can compile and run your models directly within your Amazon Redshift data warehouse.
Introduction to Etleap
Etleap is an AWS Advanced Technology Partner with the AWS Data & Analytics Competency and Amazon Redshift Service Ready designation. Etleap simplifies the data pipeline building experience. A cloud-native platform that seamlessly integrates with AWS infrastructure, Etleap consolidates data without the need for coding. Automated issue detection pinpoints problems so data teams can stay focused on analytics initiatives, not data pipelines. Etleap integrates key Amazon Redshift features into its product, such as streaming ingestion, Redshift Serverless, and data sharing.
In Etleap, pre-load transformations are primarily used for cleaning and structuring data, whereas post-load SQL transformations enable multi-table joins and dataset aggregations. Bridging the gap between data ingestion and SQL transformations comes with multiple challenges, such as dependency management, scheduling issues, and monitoring the data flow. To help you address these challenges, Etleap introduced end-to-end pipelines that use dbt Core models to combine data ingestion with modeling.
Etleap end-to-end data pipelines
The following diagram illustrates Etleap’s end-to-end pipeline architecture and an example data flow.

Etleap end-to-end data pipelines combine data ingestion with modeling in the following way: a cron schedule first triggers ingestion of data required by the models. Once all the ingestion is complete, a user-defined dbt build is run, which performs post-load SQL transformations and aggregations on the data that has just been ingested by ingestion pipelines.
End-to-end pipelines offer several advantages over running dbt workflows in isolation, including dependency management, scheduling and latency, Amazon Redshift workload synchronization, and managed infrastructure.
Dependency management
In a typical dbt use case, the data that dbt performs SQL transformations on is ingested by an extract, transform, and load (ETL) tool such as Etleap. Tables ingested by ETL processes in dbt projects are usually referenced as dbt sources. Those source references need to be maintained either manually or using custom solutions. This is often a laborious and error-prone process. Etleap eliminates these processes by automatically keeping your dbt source list up to date. Additionally, any changes made to the dbt project or ingestion pipeline will be validated by Etleap, ensuring that the changes are compatible and won’t disrupt your dbt builds.
Scheduling and latency
End-to-end pipelines allow you to monitor and minimize end-to-end latency. This is achieved by using a single end-to-end pipeline schedule, which eliminates the need for an independent ingestion pipeline and dbt job-level schedules. When the schedule triggers the end-to-end pipeline, the ingestion processes will run. The dbt workflow will start only after the data for every table used in the dbt SQL models is up to date. This removes the need for additional scheduling components outside of Etleap, which reduces data stack complexity. It also ensures that all data involved in dbt transformations is at least as recent as the scheduled trigger time. Consequently, data in all the final tables or views will be up to date as of the scheduled trigger time.
Amazon Redshift workload synchronization
Due to pipelines and dbt builds running on the same schedule and triggering only the required parts of data ingestion and dbt transformations, higher workload synchronization is achieved. This means that customers using Redshift Serverless can further minimize their compute usage, driving their costs down further.
Managed infrastructure
One of the challenges when using dbt Core is the need to set up and maintain your own infrastructure in which the dbt jobs can be run efficiently and securely. As a software as a service (SaaS) provider, Etleap provides highly scalable and secure dbt Core infrastructure out of the box, so there’s no infrastructure management required by your data teams.
Solution overview
To illustrate how end-to-end pipelines can address a data analytics team’s needs, we use an example based on Etleap’s own customer success dashboard.
For Etleap’s customer success team, it’s important to track changes in the number of ingestion pipelines customers have. To meet the team’s requirements, the data analyst needs to ingest the necessary data from internal systems into an Amazon Redshift cluster. They then need to develop dbt models and schedule an end-to-end pipeline. This way, Etleap’s customer success team has dashboard-ready data that is consistently up to date.
Ingest data from the sources
In Etleap’s case, the internal entities are stored in a MySQL database, and customer relationships are managed via HubSpot. Therefore, the data analyst must first ingest all data from the MySQL user and pipeline tables as well as the companies entity from HubSpot into their Amazon Redshift cluster. They can achieve this by logging into Etleap and configuring ingestion pipelines through the UI.
Develop the dbt models
After the data has been loaded into Amazon Redshift, the data analyst can begin creating dbt models by using queries that join the HubSpot data with internal entities. The first model, user_pipelines.sql, joins the users table with the pipelines table based on the foreign key user_id stored in the pipelines table, as shown in the following code. Note the use of source notation to reference the source tables, which were ingested using ingestion pipelines.
The second model, company_pipelines.sql, joins the HubSpot companies table with the user_pipelines table, which is created by the first dbt model, based on the email domain. Note the usage of ref notation to reference the first model:
After creating these models in the dbt project, the data analyst will have achieved the data flow summarized in the following figure.
Test the dbt workflow
Finally, the data analyst can define a dbt selector to select the newly created models and run the dbt workflow locally. This creates the views and tables defined by the models in their Amazon Redshift cluster.
The resulting company_pipelines table enables the team to track metrics, such as the number of pipelines created by each customer or the number of pipelines created on any particular day.
Schedule an end-to-end pipeline in Etleap
After the data analyst has developed the initial models and queries, they can schedule an Etleap end-to-end pipeline by choosing the selector and defining a desired cron schedule. The end-to-end pipeline matches the sources to pipelines and takes care of running the ingestion pipelines as well as dbt builds on a defined schedule, ensuring high freshness of the data.
The following screenshot of the Etleap UI shows the configuration of an end-to-end pipeline, including its cron schedule, which models are included in the dbt build, and the mapping of inferred dbt sources to Etleap pipelines.
Summary
In this post, we described how Etleap’s end-to-end pipelines enable data teams to simplify their data integration and transformation workflows as well as achieve higher data freshness. In particular, we illustrated how data teams can use Etleap with dbt and Amazon Redshift to run their data ingestion pipelines with post-load SQL transformations with minimal effort required by the team.
Start using Amazon Redshift or Amazon Redshift Serverless to take advantage of their powerful SQL transformations. To get started with Etleap, start a free trial or request a tailored demo.
About the authors
 Zygimantas Koncius is an engineer at Etleap with 3 years of experience in developing robust and performant ETL software. In addition to development work, he maintains Etleap infrastructure and provides deep-level technical customer support.
 Sudhir Gupta is a Principal Partner Solutions Architect, Analytics Specialist at AWS with over 18 years of experience in Databases and Analytics. He helps AWS partners and customers design, implement, and migrate large-scale data & analytics (D&A) workloads. As a trusted advisor to partners, he enables partners globally on AWS D&A services, builds solutions/accelerators, and leads go-to-market initiatives.