Post Syndicated from Matt Granger original https://www.youtube.com/watch?v=isLxidvUjlU
Get Down
Post Syndicated from Oglaf! -- Comics. Often dirty. original https://www.oglaf.com/getdown/


[$] 1½ Topics: realtime throttling and user-space adaptive spinning
Post Syndicated from original https://lwn.net/Articles/931789/
The Linux CPU scheduler will let realtime tasks hog the CPU to the
exclusion of everything else — except when it doesn’t. At the 2023 Open
Source Summit North America, Joel Fernandes covered the problems with
the kernel’s realtime throttling mechanism and a couple of potential
solutions. As a bonus, since the room was unscheduled for the following
slot, attendees were treated to a spontaneous session on
adaptive spinning in user space run by André Almeida.
ASRock Adopts Alder Lake-N with N100 Based N100DC-ITX and N100M Motherboards
Post Syndicated from Cliff Robinson original https://www.servethehome.com/asrock-adopts-intel-alder-lake-n-with-n100-based-n100dc-itx-and-n100m-motherboards/
ASRock has two new Intel Alder Lake-N motherboards. Both the ASRock N100DC-ITX and N100M sport the Intel N100 E-core processor
The post ASRock Adopts Alder Lake-N with N100 Based N100DC-ITX and N100M Motherboards appeared first on ServeTheHome.
Nikon Z8 Portrait shoot
Post Syndicated from Matt Granger original https://www.youtube.com/watch?v=9SGvqrpBSGI
Nikon Z8 – Hands on review
Post Syndicated from Matt Granger original https://www.youtube.com/watch?v=fj9AMU0GZJU
AIWA SYSTEM 22 – Micro HiFi from 1979
Post Syndicated from Techmoan original https://www.youtube.com/watch?v=TMtqWGsvLaU
Седмицата (8–13 май)
Post Syndicated from Светла Енчева original https://www.toest.bg/sedmitsata-8-13-mai/

Седмицата започна с почивен ден, защото в неделя се падна Денят на храбростта и на Българската армия. Замисляли ли сте се защо в България е официален празник 6 май, но не и Денят на Европа, който се отбелязва два дни по-късно? В настоящия контекст този въпрос е особено актуален. Уж храброст, а президентът и главнокомандващ на армията Румен Радев упорито демонстрира заучена безпомощност, твърдейки, че изпращането на оръжие за Украйна е равносилно на въвличане във война. Уж армията ни е част от НАТО, а България – от ЕС, а страната ни все заема такива позиции, които са от полза по-скоро на Русия. От скорошните опити на България да блокира вноса на селскостопанска продукция от Украйна, та до Истанбулската конвенция (която впрочем тази седмица беше ратифицирана от Европейския парламент).
„Войната по пътищата“ е клише, прикриващо институционалното и общественото безхаберие. Седмицата отмина под знака на поредната нелепа трагедия – двойка влюбени младежи загубиха живота си, пометени от кола, карана от едва-що взело книжка 18-годишно момче. В петък пък 84-годишен мъж беше блъснат от превозно средство на спирка, докато се е опитвал да се качи в автобуса. Преди да се въвеждат по-строги наказания за шофьорите и да се назначават повече пътни полицаи, ще е добре съществуващите санкции да не остават само на хартия и униформените на пътя да престанат да се правят на ударени, освен когато провеждат показни акции. А улиците да се правят с мисъл, че градовете са за хората.
Като стана дума за акции, пловдивската полиция накара около 400 посетители на нощен клуб да се съблекат голи и ги държа затворени в него с часове, защото… можело някой посетител да има наркотици. Според органите на реда всичко е точно. Според правозащитници унижаващото отношение и произволното отнемане на свободата са нарушение на конституционни права, а полицаите са превишили правомощията си.
Като стана дума за превишени правомощия, за кого се сещате? Разбира се, за главния прокурор. Изглежда, че „Инструментът на Господ“, както Иван Гешев сам се нарича, като един Христос е предаден от своите. На тази тема е и седмичният коментар на Емилия Милчева „Добрите“, „лошите“ и главният прокурор“. Тя задава въпроса дали става дума за отстрел на обвинител №1, или за алиби на ГЕРБ и ДПС, чрез което да мотивират пред обществото едно съвместно управление. Независимо дали шапката на Гешев вече е скроена, ако няма читав механизъм за контрол над институцията главен прокурор, просто една удобна на ГЕРБ и ДПС личност ще бъде сменена с друга.
От големите политически теми прескачаме на микроравнище. Дебютната статия на новата ни авторка Мария П. Василева е за микродозирането и някои макротеми, свързани с него. Станалото модерно на Запад микродозиране е нова пресечна точка между наркопазара и лъскавия свят на уелнес индустрията. Става дума за използване на халюциногенни вещества, но в малки количества, от които човек не може съвсем да се надруса, но му става хубаво и поне малко се отдалечава от твърдата почва на реалността. Акцентира се върху терапевтичния потенциал на микродозирането за лечението на депресия, тревожност, посттравматичен стрес, зависимости и пр., както и върху връзката му с креативността. Клиничните изследвания обаче не са еднозначни, макар и известните рискове да не са много. Засега микродозирането е на ръба на закона.
Оставаме на микровълни и с новата порция научни новини, сведени до знанието ни от Михаил Ангелов. Знаете ли, че според едно изследване всяка седмица изяждаме пластмаса с обема на една банкова карта? Това е така, защото пластмасата, която изхвърляме, се усвоява от организмите, които пък после ние консумираме. Вирусите също са микроскопични, а повече от 100 години учените не могат да решат дали да ги класифицират като живи организми. И все пак те са ключов фактор в еволюцията и развитието на биосистемите, както и в бъдещето на екологичните процеси, протичащи на фона на глобалните климатични промени.
Излизаме от микровълните, но оставаме на вълната на природата. Севда Семер задава пет въпроса по повод първата ферма за октоподи, която предстои да бъде открита в Испания. Досега тези морски животни, известни с развития си интелект, са улавяни само в дивата природа, но скоро много от тях ще бъдат отглеждани само за да бъдат убивани и изяждани от хората. Севда цитира Светлана Алексиевич, според която е човешко право да се учиш да не убиваш, и предлага да преосмислим отношението си към консумирането на животни – над 80 милиарда от тях годишно умират, защото ние така сме решили.
В рубриката „На второ четене“ пък Севда ни обръща внимание върху книгата „Барнабо от планината“ от Дино Будзати, преведена от италиански от Нева Мичева. (И вие като мен ли смятате, че е крайно време Нева да отговори на още някое читателско писмо в авторската си рубрика?) Романът е разположен в миналото, но е написан в сегашно време, защото в планината е винаги сега. Всичко се случва пред очите ни, но вече е било. Още първите страници на книгата носят поезия, но не в смисъла на нещо отнесено, а като чувствително и съсредоточено наблюдение на случващото се. Авторът впрочем разбира от планини, защото е бил и алпинист.
Както винаги използвам случая, че съм дежурна по бюлетин, за да споделя някои лични препоръки. Първата е: моля ви, внимавайте, като пресичате. Както и когато управлявате автомобил. Дори да спазвате всички правила, това не бива да ви успокоява, защото на пътя все има някой, който не ги спазва и не му пука.
Краткият и не съвсем успешен полет на ракетата Starship на компанията на Илон Мъск SpaceX беше преди няколко седмици – на 20 април. Но понеже оттогава не съм писала бюлетин, не мога да се стърпя да не споделя с вас каква асоциация предизвика у мен събитието. Сетих се за клипа на песента Space Song на Dubioza Kolektiv. SpaceX е сериозна компания – не като пародийната Босненска космическа агенция, която превръща стара лада в ракета и я зарежда с ябълкова ракия. Резултатът обаче е същият.
Приятно четене, гледане и слушане!
Z8 Live Q&A
Post Syndicated from Matt Granger original https://www.youtube.com/watch?v=qVHJJU8UvDw
Comic for 2023.05.13 – Post Nasal Drip
Post Syndicated from Explosm.net original https://explosm.net/comics/post-nasal-drip
New Cyanide and Happiness Comic
Friday Squid Blogging: Giant Squid Video
Post Syndicated from Bruce Schneier original https://www.schneier.com/blog/archives/2023/05/friday-squid-blogging-giant-squid-video.html
A video—authentic, not a deep fake—of a giant squid close to the surface.
As usual, you can also use this squid post to talk about the security stories in the news that I haven’t covered.
Read my blog posting guidelines here.
Zabbix in: exploratory data analysis rehearsal – Part 1
Post Syndicated from Paulo R. Deolindo Jr. original https://blog.zabbix.com/zabbix-in-exploratory-data-analysis-rehearsal-part-1/25802/
Abstract
Imagine your happiness when you start a new enterprise device and application monitoring project using Zabbix[i]. Indeed, doing this is so easy that the first results bring up a lot of satisfaction very quickly. For example, when you apply a specific template [ii]in a specific host and the data comes (like magic) and you can create some dashboards with these data and visualize then.
If you haven’t done this yet, you must try it as soon as possible. You can create a web server host using both Apache or Nginx web services, applying the appropriate template and getting metrics by HTTP checks: “Apache by HTTP” template or “Nginx by HTTP” template. You will see interesting metrics being collected and you will be able to create and view some graphs or dashboards. But the work is not finished yet, because using Zabbix, you can do much more!
In this article, I’ll talk about how we can think of new metrics, new use cases, how to support our business and help the company with important results and insights using exploratory data analysis introducing and implementing some data science concepts using only Zabbix.
What is our goal?
Testing and learning some new Zabbix functions introduced from 6.0 version, compare some results and discuss insights.
Contextualizing
Let’s keep the focus on the web server metrics. However, all the results of this study can be used later in different scenarios.
The web server runs nginx version 1.18.0 and we are using “Nginx by HTTP” template to collect the following metrics:
- HTTP agent master item: get_stub_status
- Dependent items[i]:
Nginx: Connections accepted per second
Nginx: Connections dropped per second
Nginx: Connections handled per second
- Simple check items:
Nginx: Service response time
That are the possibilities at the moment and below we have a simple dashboard created to view the initial results:

All widgets are reflecting metrics collected by using out-of-the-box “Nginx by HTTP” template.
Despite being Zabbix specialist and having some knowledge about our monitored application, there are some questions we need to ask ourselves. These questions do not need to be exhaustive, but they are relevant for our exercise. So, let’s jump to the next topic.
Generating new metrics! Bringing up some thoughts!
Let’s think about the collected metrics in the beginning of this monitoring project:
- Why the does number of requests only increase?
- When did we have more or fewer connections, considering for example, the last hour?
- What’s the percentage change comparing the current hour with the previous one?
- Which value can be representing the best or the worst response time performance?
- Considering some collected values, can we predict an application downtime?
- Can we detect anomalies in the application based on the amount of collected values and application behavior?
- How to stablish a baseline? Is it possible?
These are some questions we need to answer using this article and the next ones to come.
Generating new metrics
1st step: Let’s create a new template. From “nginx by HTTP”, clone it and change its name to “Nginx by HTTP modified”;
2nd step: Modify the “Nginx: Requests total” item, adding a new pre-processing step: “Simple change”. It will look like the image below:

It’s a Dependent item from the Master item “Nginx: Get stub status page” and the last one is based on HTTP agent to retrieve the main metric. So, if the number of the total connections always increase, the current value will be decreased from the last collected value. A simple mathematical operation: subtraction. And then, from this moment on we’ll have the number of new connections per minute.
The formula for the “Simple change” pre-processing step can be represented using the following images:

I also suggest you change the name of the item to: “Nginx: Requests at last minute”.
I can add some Tags[i] too. These tags can be used in the future to filter the views and so on.

Same metrics variations
With the modified nginx template we can retrieve how many new connections our web application receives per minute and then, we can create new metrics from the previous one. Using Zabbix timeshift[i] [ii]function, we can create metrics such as the number of connections:
- At the last hour
- Today so far and Yesterday
- This week and at the previous week
- This month and the previous month
- This year and at the previous year
- Etc
This exercise can be very interesting. Let’s create some Calculated items with the following formulas:
sum(//nginx.requests.total,1h:now/h) # Somatório de novas conexões na hora anterior
sum(//nginx.requests.total,1h:now/h+1h) # Somatório de novas conexões da hora atual
In Zabbix official documentation we have lots of examples to creating Calculated items using “time shift” parameter. Please, see this link.
Improving our dashboard
Using the new metrics, we can improve our dashboard and enhance the data visualization. Briefly:

The same framework could be used to show the daily, weekly, monthly and yearly data, depending on your business rule, of course. Please, be patient because some items will have some delay in collecting operation (monthly, yearly, etc).
Basic statistics metrics using Zabbix
As we know, it is perfectly possible to generate some statistics values with Zabbix by using Calculated items. However, there are questions that can guide us to other thoughts and some answers will come in format of metrics, again.
- Today, which response time was the best?
- And if we think about the worst response time?
- And about the average?
We can start with these basic statistics and then, growing up latter.

All data in dashboard above were retrieved using simple Zabbix functions.
The best response time today so far.
min(//net.tcp.service.perf[http,”{HOST.CONN}”,”{$NGINX.STUB_STATUS.PORT}”],1d:now/d+1d)
The worst response time today so far.
max(//net.tcp.service.perf[http,”{HOST.CONN}”,”{$NGINX.STUB_STATUS.PORT}”],1d:now/d+1d)
The average of the response time today so far.
avg(//net.tcp.service.perf[http,”{HOST.CONN}”,”{$NGINX.STUB_STATUS.PORT}”],1d:now/d+1d)
It’s ok. Nothing is new, so far. But let’s check some thoughts.
Why we are Looking for the best, the worst and the average using min, max e avg functions, instead of trendmin, trendmax e trendavg functions? The Trend-based functions retrieve data from trends tables, while History-based functions calculates in “real time”. If you wish to use History-based functions to calculate something in a short period, ok. But if you wish to use it to calculate some values considering a long period such as month or year… hum! It can be complicated, and it can take a lot of resources of your infrastructure power.
We need to remember an important thing: to use Trend-based functions, we must consider only data retrieved until the last full hour, because we have to consider the trend-cache sync process.
Look at the dashboard below, this time, using Trend-based Functions for the statistics.

Look at the current results. Basically, they are the same. There aren’t so many differences and, I guess, using it’s an intelligent way to retrieve the desired values.
Insights
If a response time is too short such as 0.06766 (the best of the day) and another value is too big and is representing the worst response time, such as 3.1017, can you imagine which and how many values exist between then?

How to calculate de average? You know: the sum of all collected values within a period, divided by the number of values.
So far, so good. The avg or trendavg functions can retrieve this average based on the desired period. However, if you look at the graph above, you will see some “peaks” in certain periods. These “peaks” are called “outliers”. The outliers are influencers of the average.
The outliers are important but because it exists, the average sometimes may not represent the reality. Think about this: a response time of the web application having stayed between 0.0600 and 0.0777 at the previous hour. During a specific minute within the same monitored period, for some reason, the response time was 3.0123. In this case, the average will increase. But, what if we discard the outlier? Obviously, the average will be as expected. In this case, the outlier was a deviation, “an error in the matrix”. So, we need to be able to calculate de average or other estimative location for our values, without the outlier.
And we cannot forget: if we are looking for anomalies based on the web application response time, we need to consider the outliers. If not, I guess, outliers can be removed on the calculation for now.
Ok! Outliers can influence the common average. So, how can we calculate something without the outliers?
Introduction to Median
About data timeline, we can affirm that the database is respecting the collected timestamp. Look at the collected data below:
| 2023-04-06 16:24:50 1680809090 0.06977 |
| 2023-04-06 16:23:50 1680809030 0.06981 |
| 2023-04-06 16:22:50 1680808970 0.07046 |
| 2023-04-06 16:21:50 1680808910 0.0694 |
| 2023-04-06 16:20:50 1680808850 0.06837 |
| 2023-04-06 16:19:50 1680808790 0.06941 |
| 2023-04-06 16:18:53 1680808733 3.1101 |
| 2023-04-06 16:17:51 1680808671 0.06942 |
| 2023-04-06 16:16:50 1680808610 0.07015 |
| 2023-04-06 16:15:50 1680808550 0.06971 |
| 2023-04-06 16:14:50 1680808490 0.07029 |
For the average, the timestamp or the collected order will not be important. However, if we ignore its timestamp and order the values from smallest to biggest, we’ll get something like this:
| 0.06837 | 0.0694 | 0.06941 | 0.06942 | 0.06971 | 0.06977 | 0.06981 | 0.07015 | 0.07029 | 0.07046 | 3.1101 |
Table 1.0 – 11 collected values, ordered by from smallest to biggest
In this case, the values are ordered by from the smallest one to the biggest one, ignoring their timestamp.
Look at the outlier at the end. It’s not important for us right now.
The timeline has an odd number of values and the value in green, is the central value. The Median. And what if it was an even number of values? How could we calculate the median? There is a formula for it.
| 0.0694 | 0.06941 | 0.06942 | 0.06971 | 0.06977 | 0.06981 | 0.07015 | 0.07029 | 0.07046 | 3.1101 |
Table 2.0 – 10 collected values, ordered by from smallest to biggest
Now, we have two groups of values. There is not a central position.
This time, we can use the median formula (in general): Calculate de average for the last value for the “Group A” and the first value for the “Group B”. Look at the timeline below and the values in green and orange colors.
Percentile in Zabbix
Despite considering the concept of median, we can also use the percentile calculation.
In most of cases, the median has a synonymous: “50th percentile”.
I’m proposing you an exercise:
1. You must create a Zabbix trapper item and send to it the following values using zabbix-sender:
0.06837, 0.0694, 0.06941, 0.06942, 0.06971, 0.06977, 0.06981, 0.07015, 0.07029, 0.07046, 3.1101
# for x in `cat numbers.txt`; do zabbix_sender -z 159.223.145.187 -s “Web server A” -k percentile.test -o “$x”; done
At the end, we’ll have 11 values in Zabbix database, and we’ll calculate the 50th percentile
2. You must create a Zabbix Calculated item with the following formula:
percentile(//percentile.test,#11,50)
In this case, we can read it: consider the last 11 values and return the value in the 50th position in the array. And you can check in advance the result using “Test” button in Zabbix.

Now, we’ll work with an even number of values, excluding the value 0.06837. Our values for the next test will be:
0.0694, 0.06941, 0.06942, 0.06971, 0.06977, 0.06981, 0.07015, 0.07029, 0.07046, 3.1101
Please, before sending the values with zabbix-sender again, clear the history and trends for this Calculated item and then, adjust the formula:
percentile(//percentile.test,#10,50)

Checking the result, something curious happened: the 50th percentile was the same value.
There is a simple explanation for this.
Considering the last 10 values, in green we have the “Group A” and in orange, we have the “Group B”. The value retrieved using 50th percentile formula occupies the same position in both first and second tests.

We can test it again but this time, let’s change the formula to 51st percentile. The next value will be the first value for the second group.
percentile(//percentile.test,#10,51)

The result was changed. Now, we have something different to work and then, in the next steps, we’ll retrieve the median.
So, the percentile can be considered the central value for an odd number of values, but when we have an even number of values, the result cannot be the expected.
Average ou Percentile?
Two different calculations. Two different results. Neither the first is wrong nor the second. Both values can be considered correct, but we need some context for this affirmation.
The average is considering the outliers. The last one, percentile, is not.
Let’s update our dashboard.

We don’t need to prove anything to anyone about the values, but we need to show the values and their context.
Median
It’s simple: If the median is the central value, we can retrieve the average for the 50th percentile and 51st percentile, in this case. Remember, our new connections are being collected every minute, so at the end of each hour, we’ll have an even number of values.
Fantastic. We can calculate de median in a simple way:
(last(//percentile.50.input.values)+last(//percentile.51.input.values))/2
This is the median formula in this case using Zabbix. Let’s check the results in our dashboard.

Partial conclusion
In this article, we have just explored some Zabbix functions to calculate basic statistics and bring up some insights about a symbolic web application and its response time.
There is no absolute truth about those metrics but each one of them needs a context.
In Exploratory Data Analysis, asking questions can guide us to interesting answers, but remember that we need to know where we are going or what we wish.
With Zabbix, you and me can perform a Data Scientist function, knowing Zabbix too and knowing it very well.
You don’t need to use python or R for all tasks in Data Science. We’ll talk about it in next articles for this series.
Keep in mind: Zabbix is your friend. Let’s learn Zabbix and get wonderful results!
_____________
[1] Infográfico Zabbix (unirede.net)
[1] [1] https://www.unirede.net/zabbix-templates-onde-conseguir/
[1] https://www.unirede.net/monitoramento-de-certificados-digitais-de-websites-com-zabbix-agent2/
[1] Tagging: Monitorando todos os serviços! – YouTube
[1] [1] Timeshift – YouTube
Cloudflare’s view of Internet disruptions in Pakistan
Post Syndicated from David Belson original http://blog.cloudflare.com/cloudflares-view-of-internet-disruptions-in-pakistan/


On Tuesday, May 9, Imran Khan, former Prime Minister of Pakistan was arrested on corruption charges. Following the arrest, violent protests erupted in several cities, leading the government of Pakistan to order the shutdown of mobile Internet services, as well as the blocking of several social media platforms. Below, we examine the impact of these shutdowns at a national and local level, as seen through Cloudflare traffic data. In addition, we illustrate how Pakistanis appear to be turning to Cloudflare’s 1.1.1.1 resolver in an attempt to maintain access to the open Internet.
General traffic trends
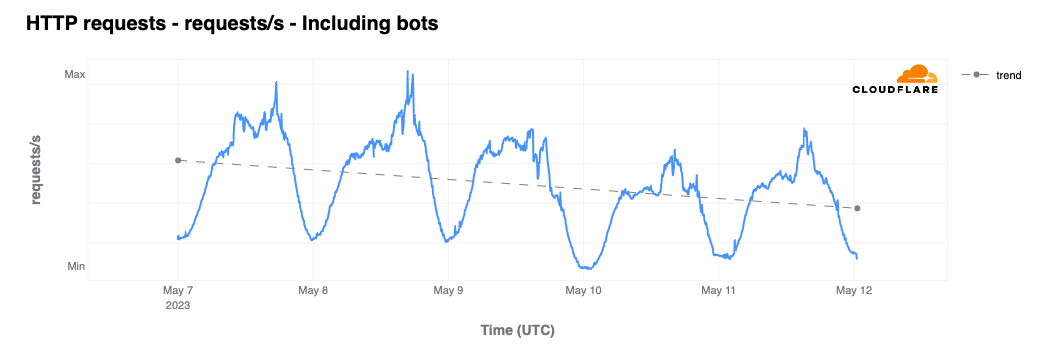
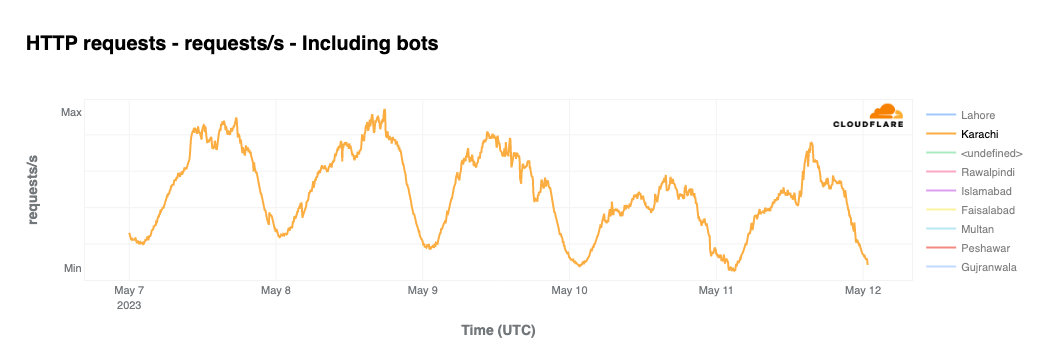
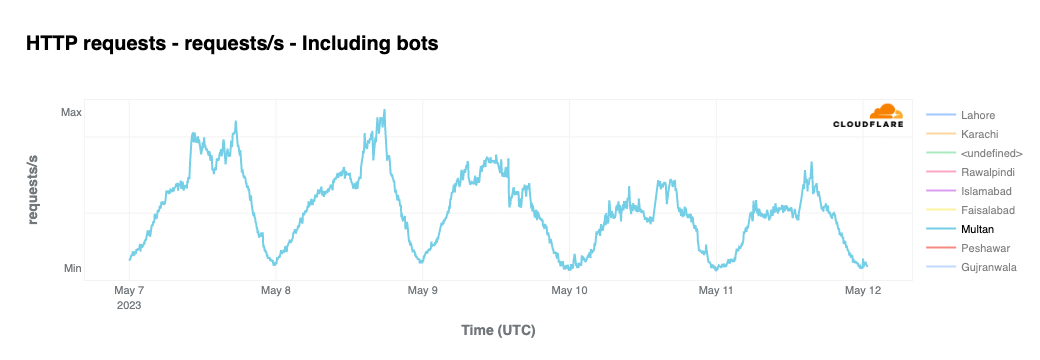
Since Tuesday, May 9, peak traffic levels aggregated at a country level (as measured by HTTP request volume) have been declining, down nearly 30% during the first several days of the mobile Internet shutdowns. The lowest traffic levels (nadirs of the graph) have also declined, dropping by as much as one-third as well. In the sections below, we drill down into this traffic loss, looking at outages at a network level, and the impact of those outages at an administrative unit and city level.
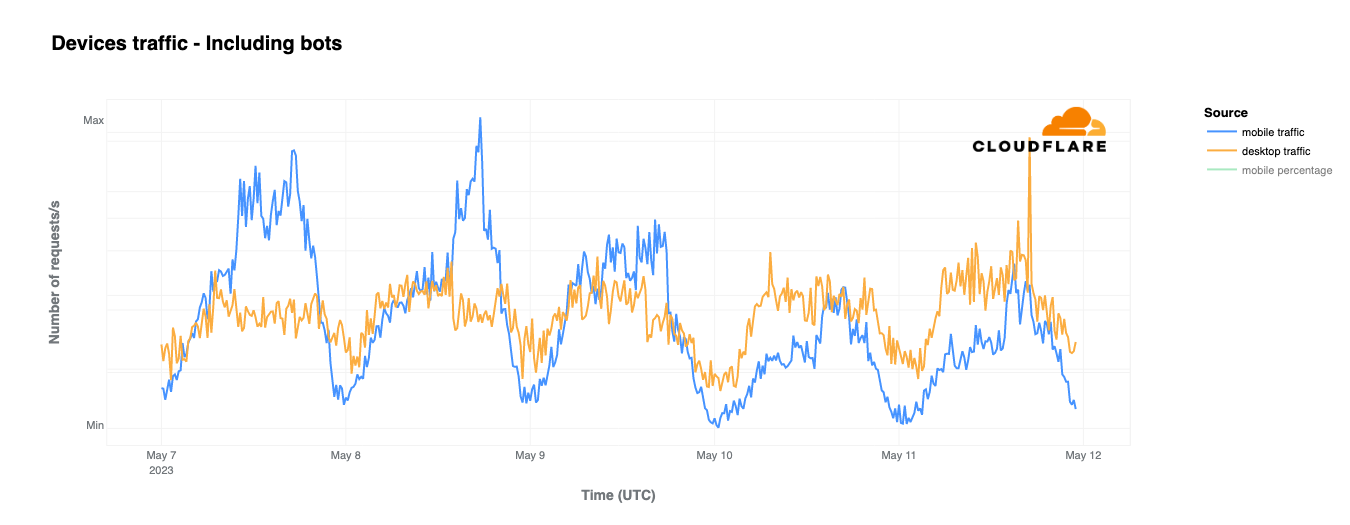
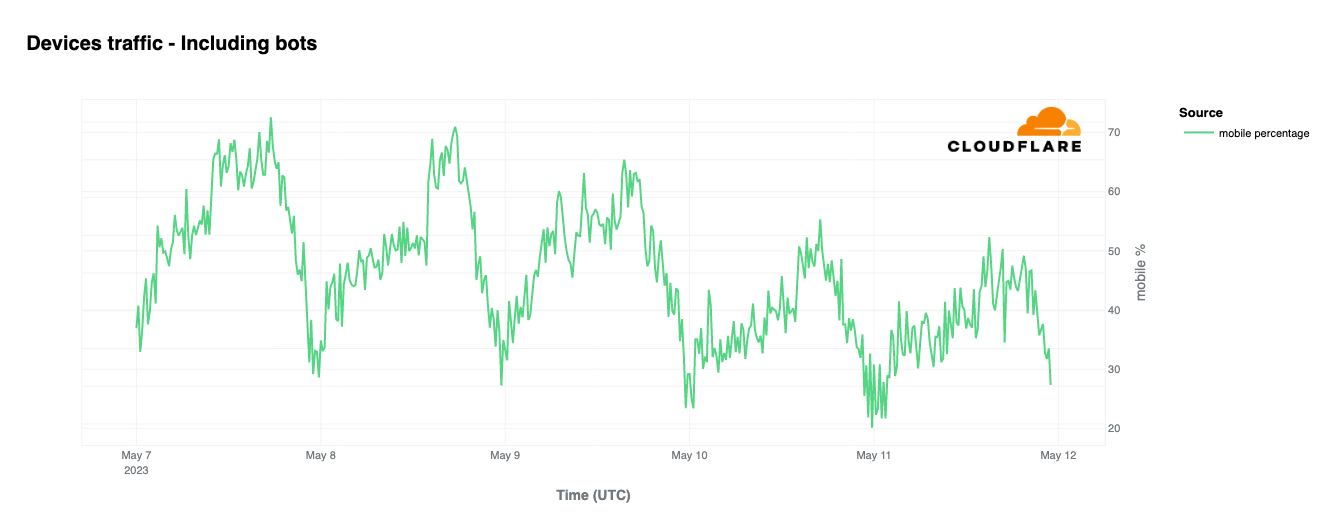
The mobile network shutdowns have also impacted the profile of traffic that Cloudflare sees from Pakistan. In analyzing traffic from desktop devices vs. mobile devices, we observed a 60% drop in request volume from mobile devices, while desktop traffic request volume remained fairly consistent. Peak mobile device traffic share dropped from 70% to 43%.
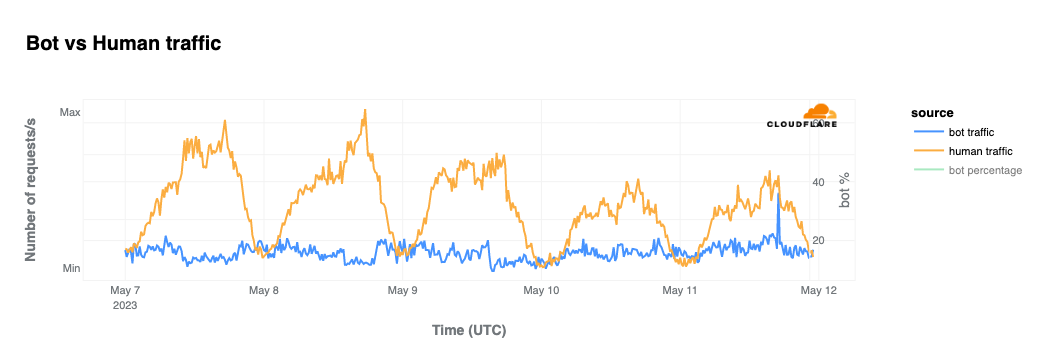
Cloudflare uses a bot score assigned to each request to indicate how likely it is that the request came from a bot or a human user. Since these shutdowns began, peak human request volume has dropped by 40%, while bot traffic has remained relatively consistent.
Mobile network shutdowns
On Wednesday, May 10, the Pakistan Telecommunication Authority (PTA) announced that Internet services would remain suspended across the country for an “indefinite” period, responding to a directive from the Ministry of the Interior to block mobile broadband services. As a result of the shutdowns associated with this directive, Cloudflare observed outages on the four major mobile providers within the country:
- Telenor Pakistan (AS24499) starting at 17:00 UTC (22:00 local time)
- Zong/China Mobile Pakistan (AS59257) starting at 17:00 UTC (22:00 local time)
- Jazz/Mobilink (AS45669) starting at 13:00 UTC (18:00 local time)
- Ufone/PTML (AS56167) starting at 20:00 UTC (01:00 local time, May 10)
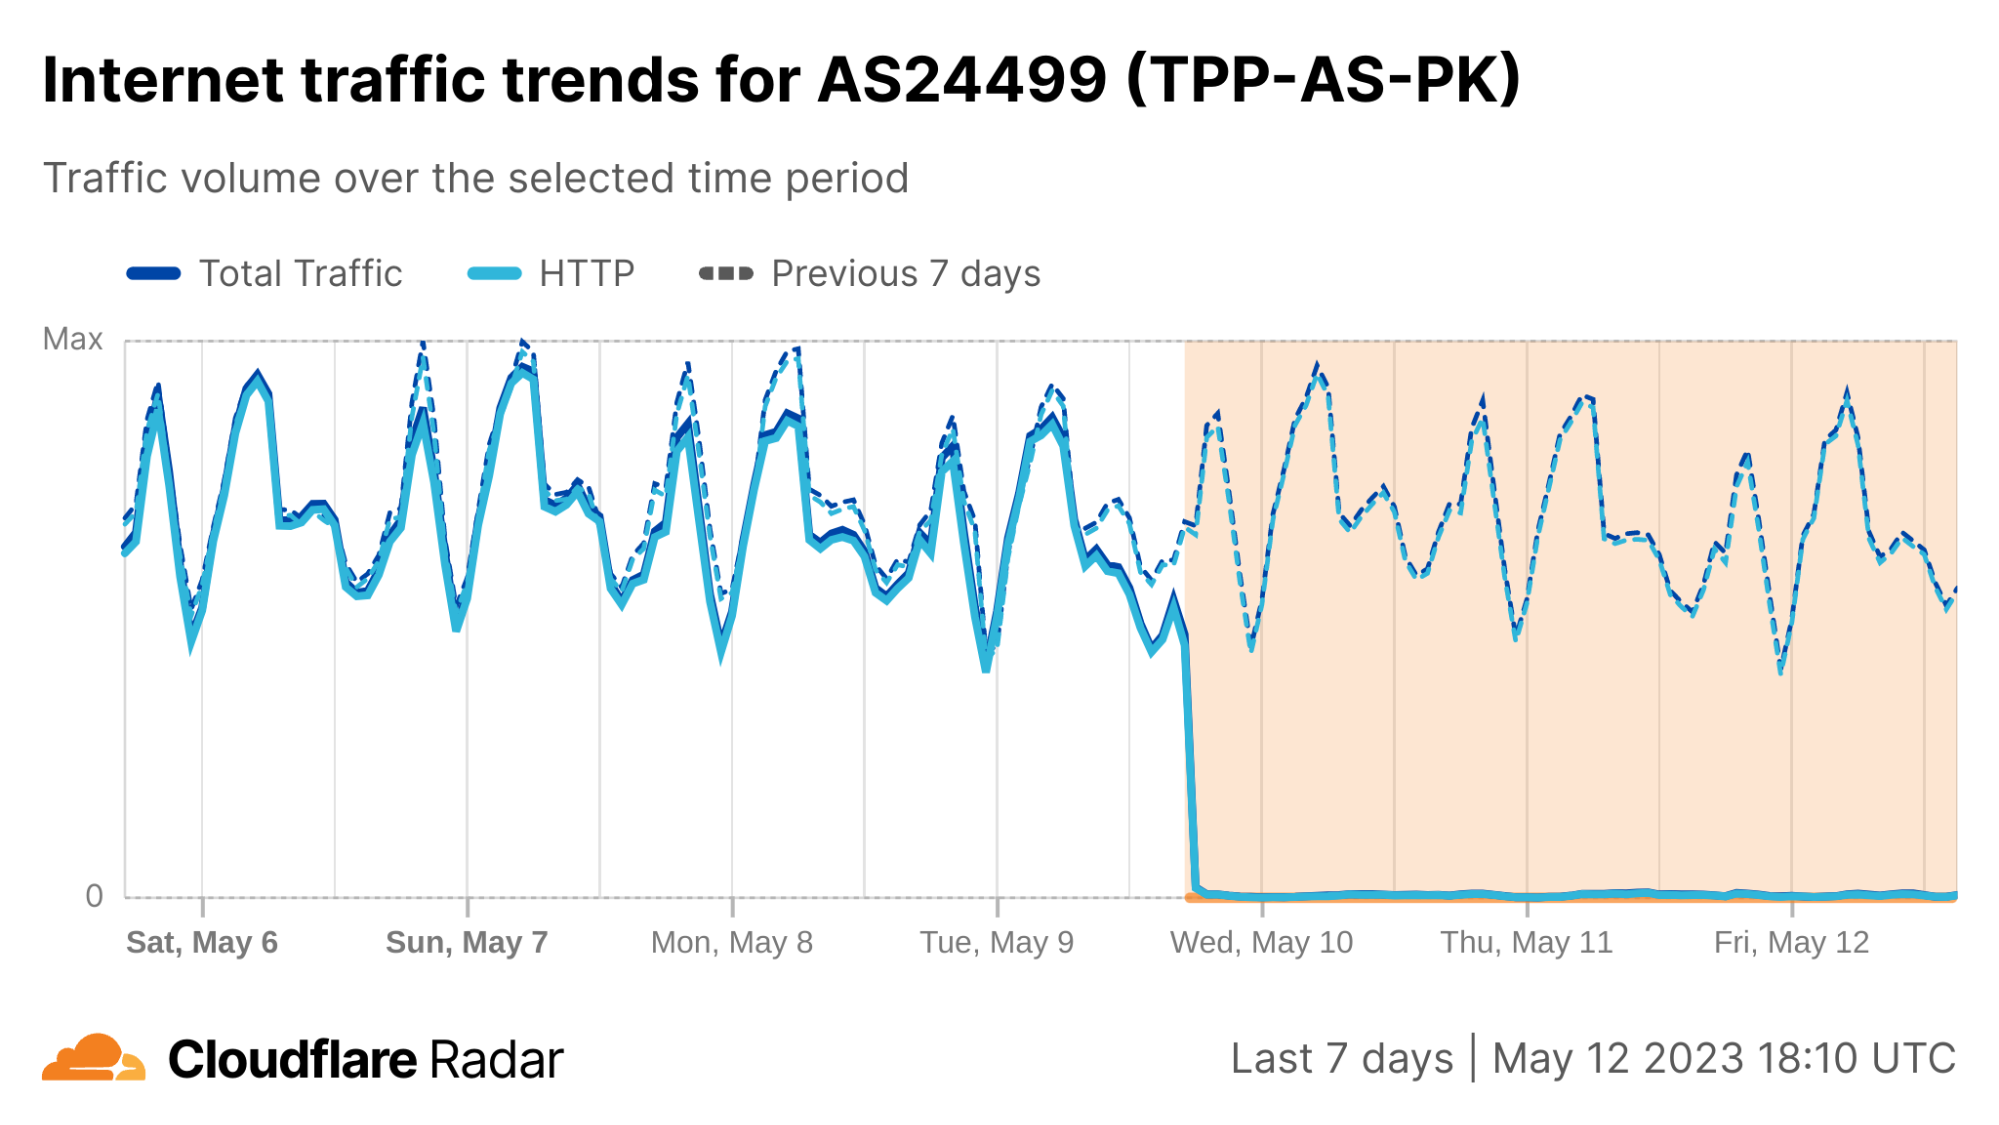
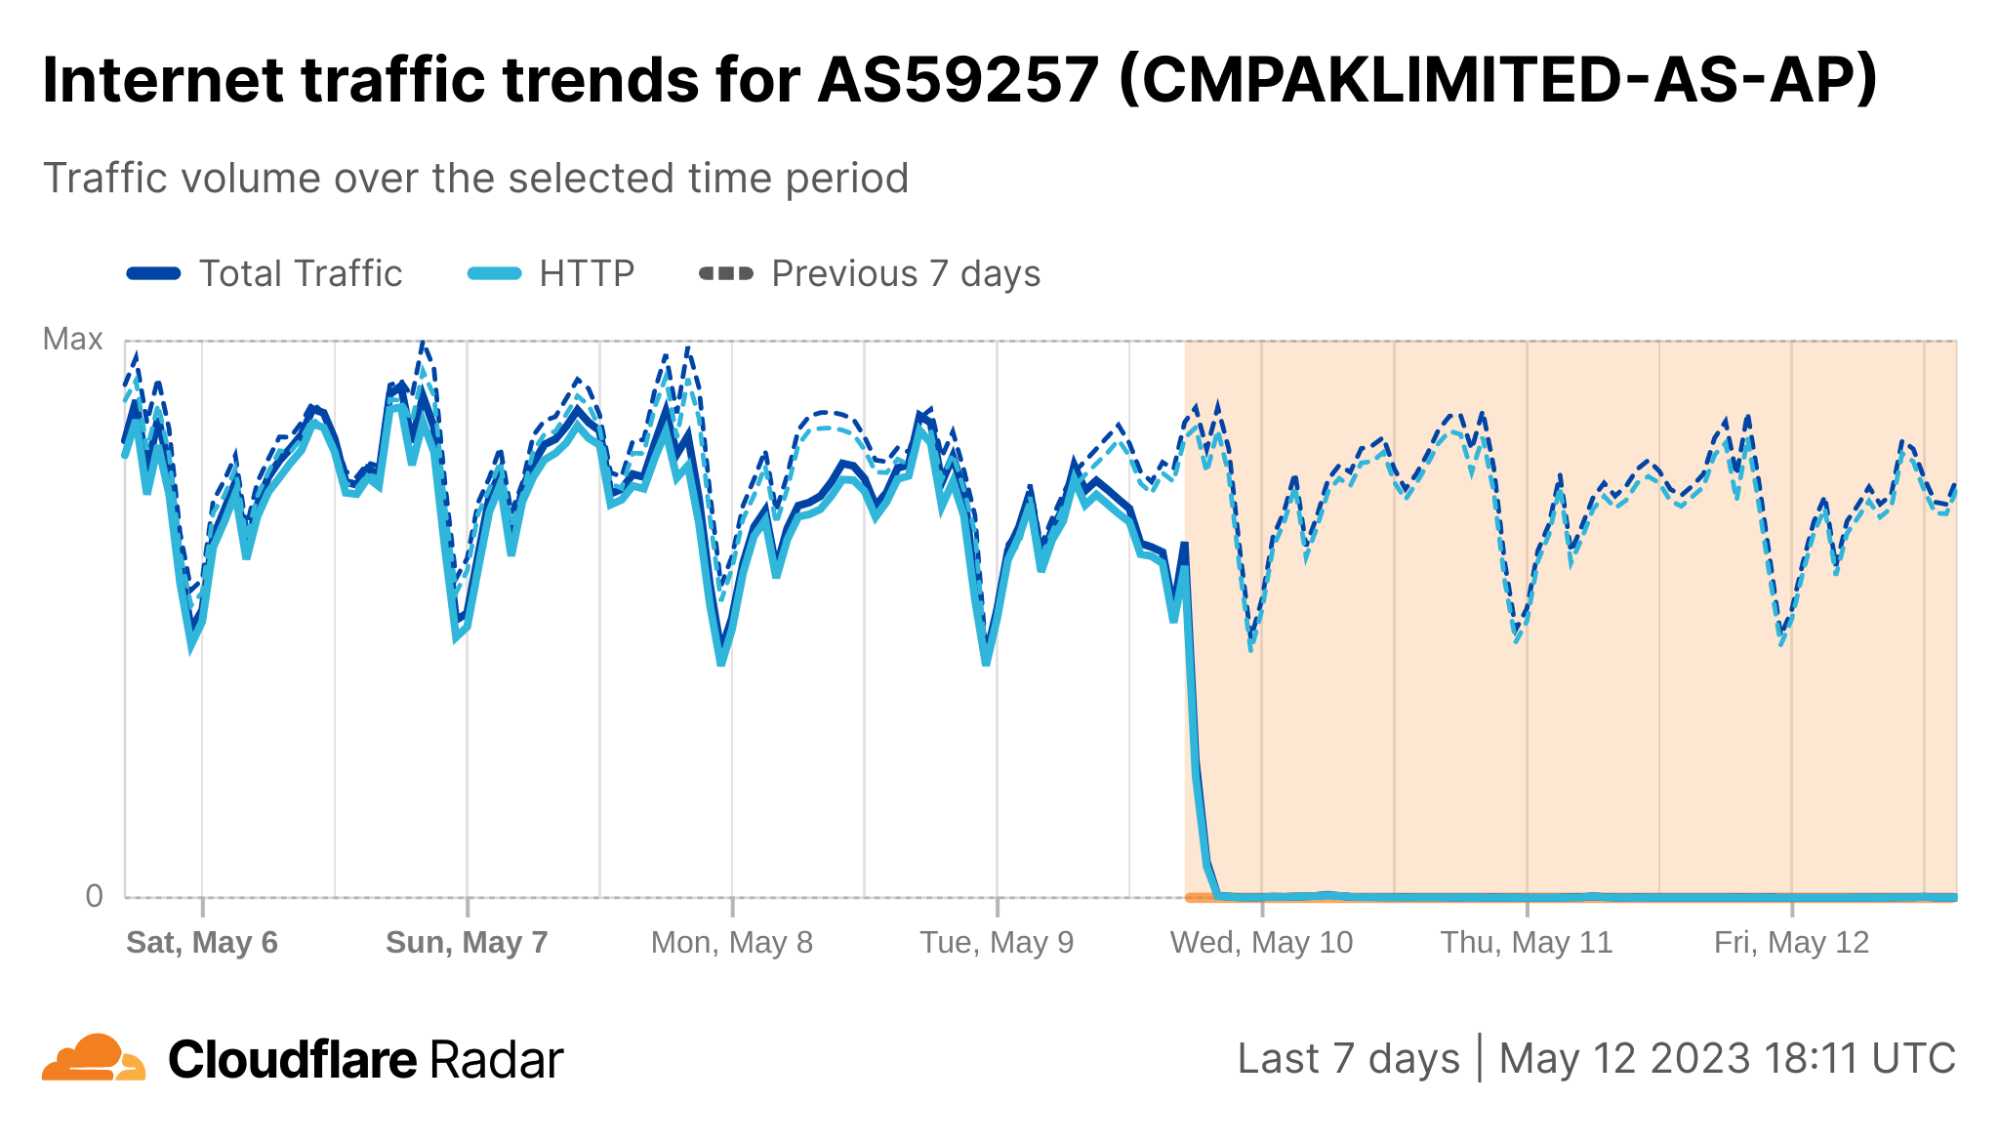
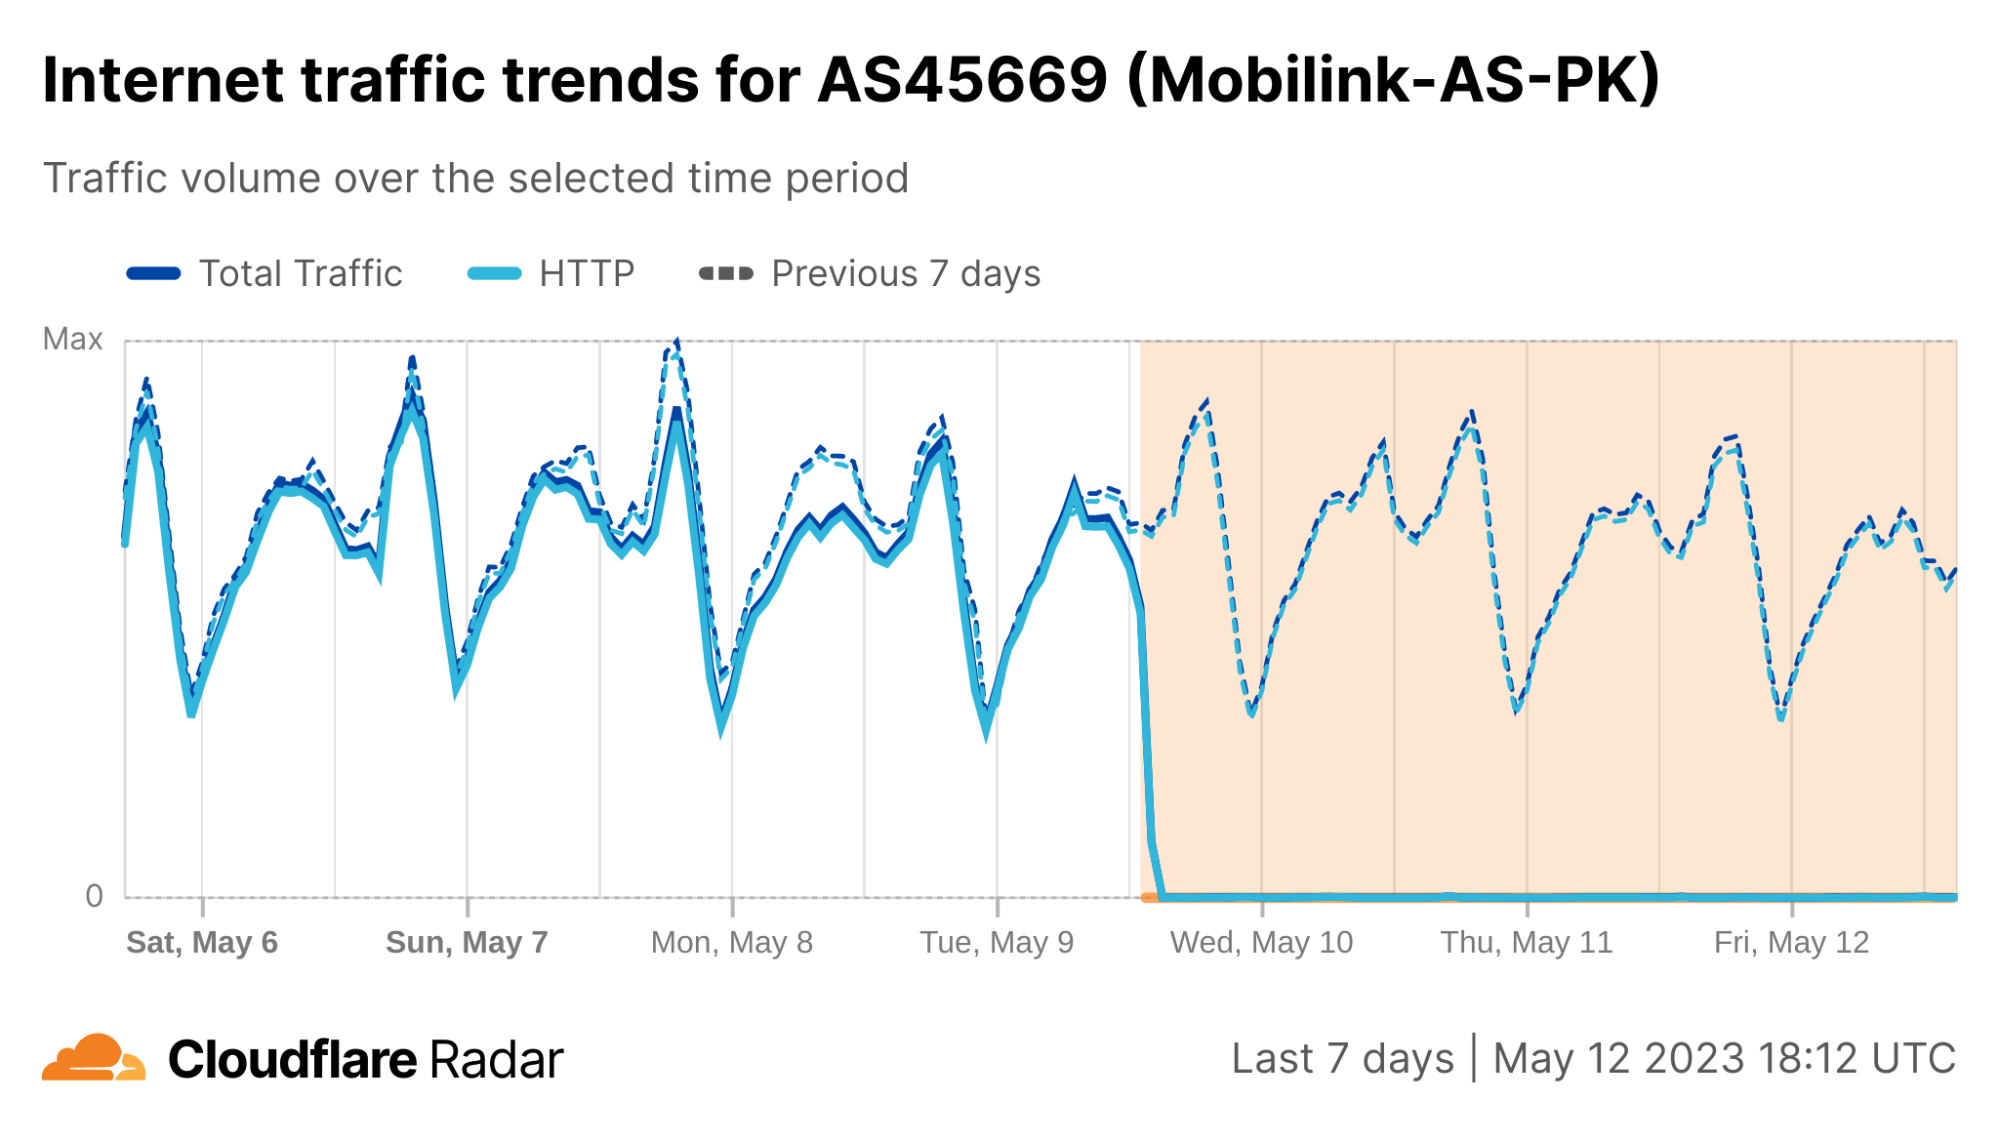
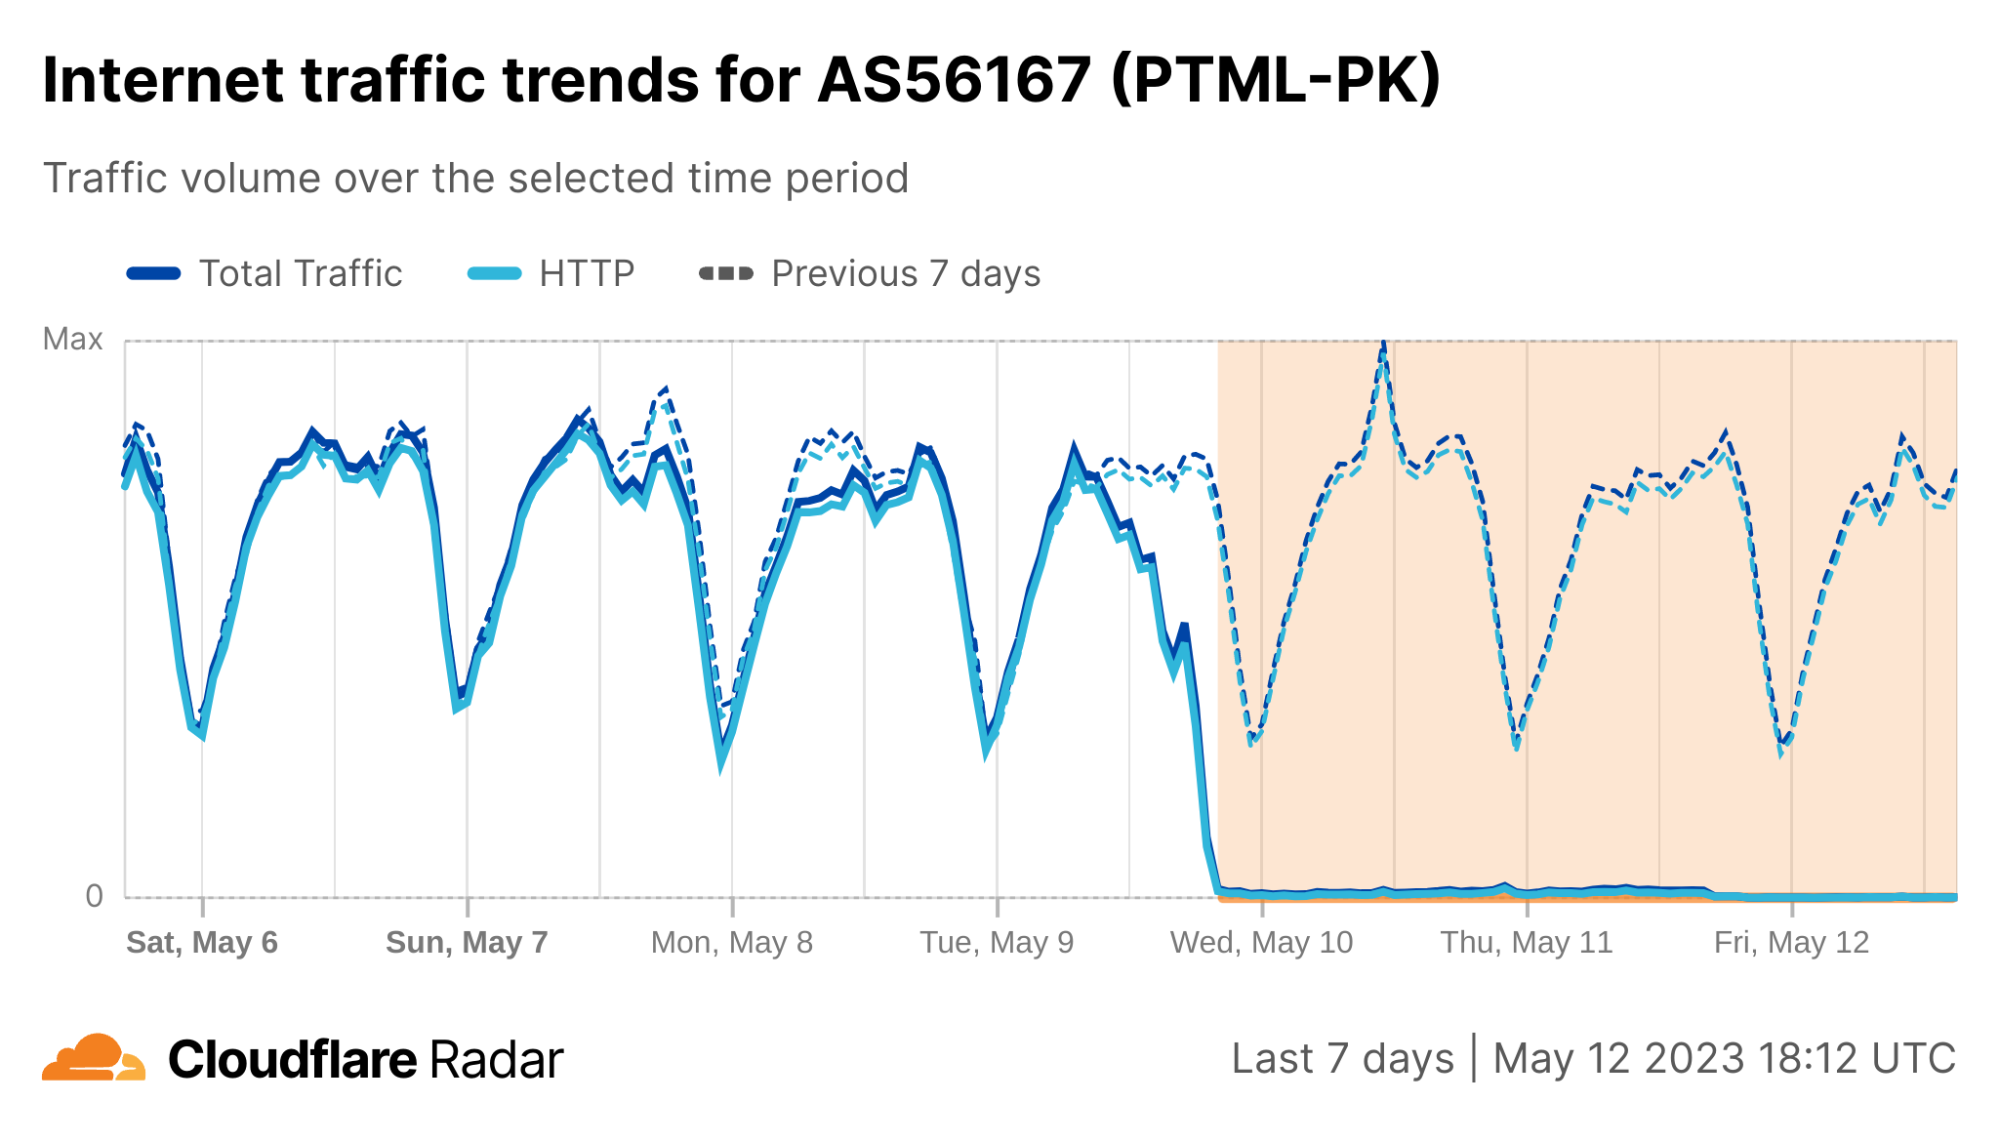
Although Pakistan has high mobile Internet usage, it appears that fixed broadband Internet connections are readily used as a backup when mobile connectivity becomes unavailable. Autonomous systems associated with fixed broadband networks saw significant increases in traffic when the mobile networks were shut down.
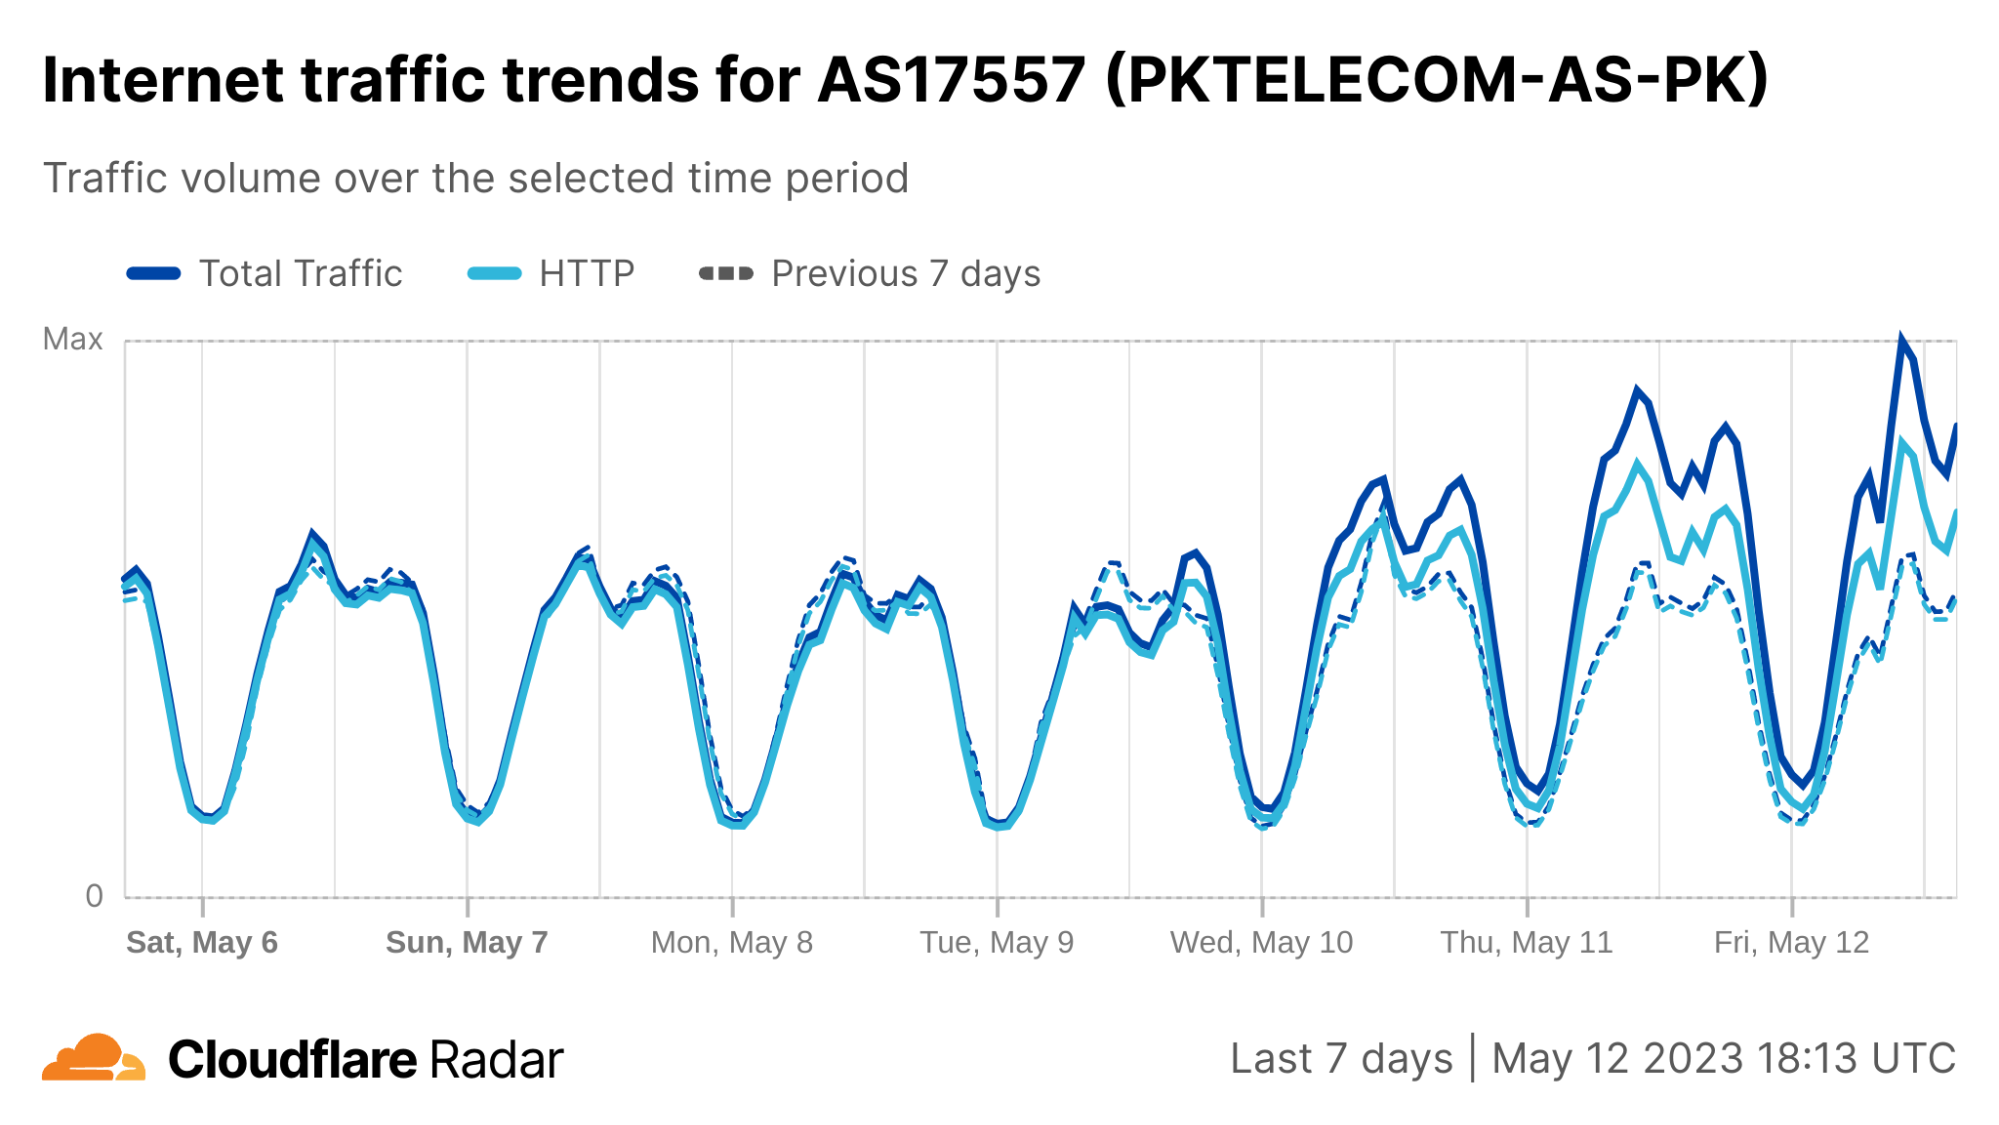
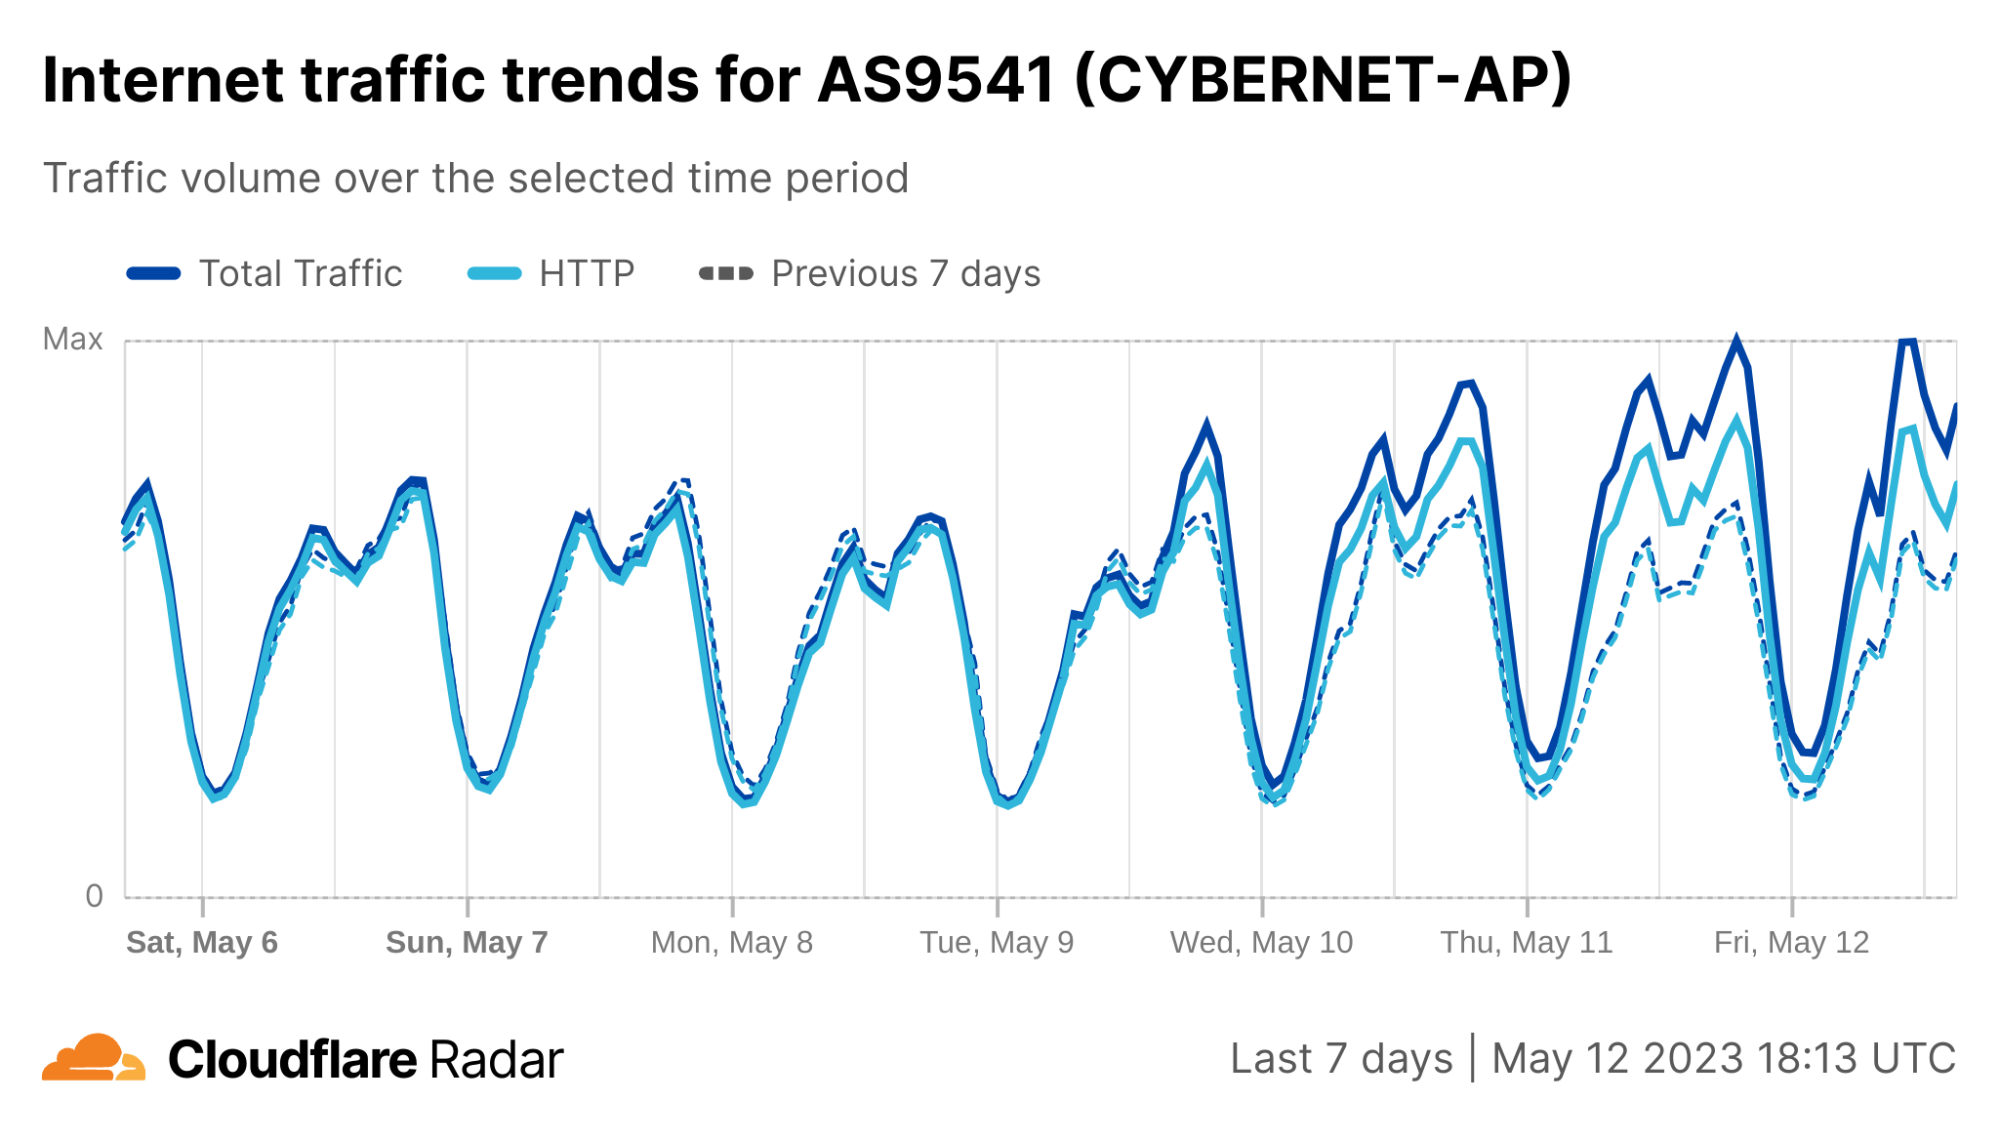
Nationwide providers PTCL (AS17557) and Cybernet (AS9541) saw higher peak traffic volumes as compared to a week prior starting at 17:00 UTC (22:00 local time) on May 9.
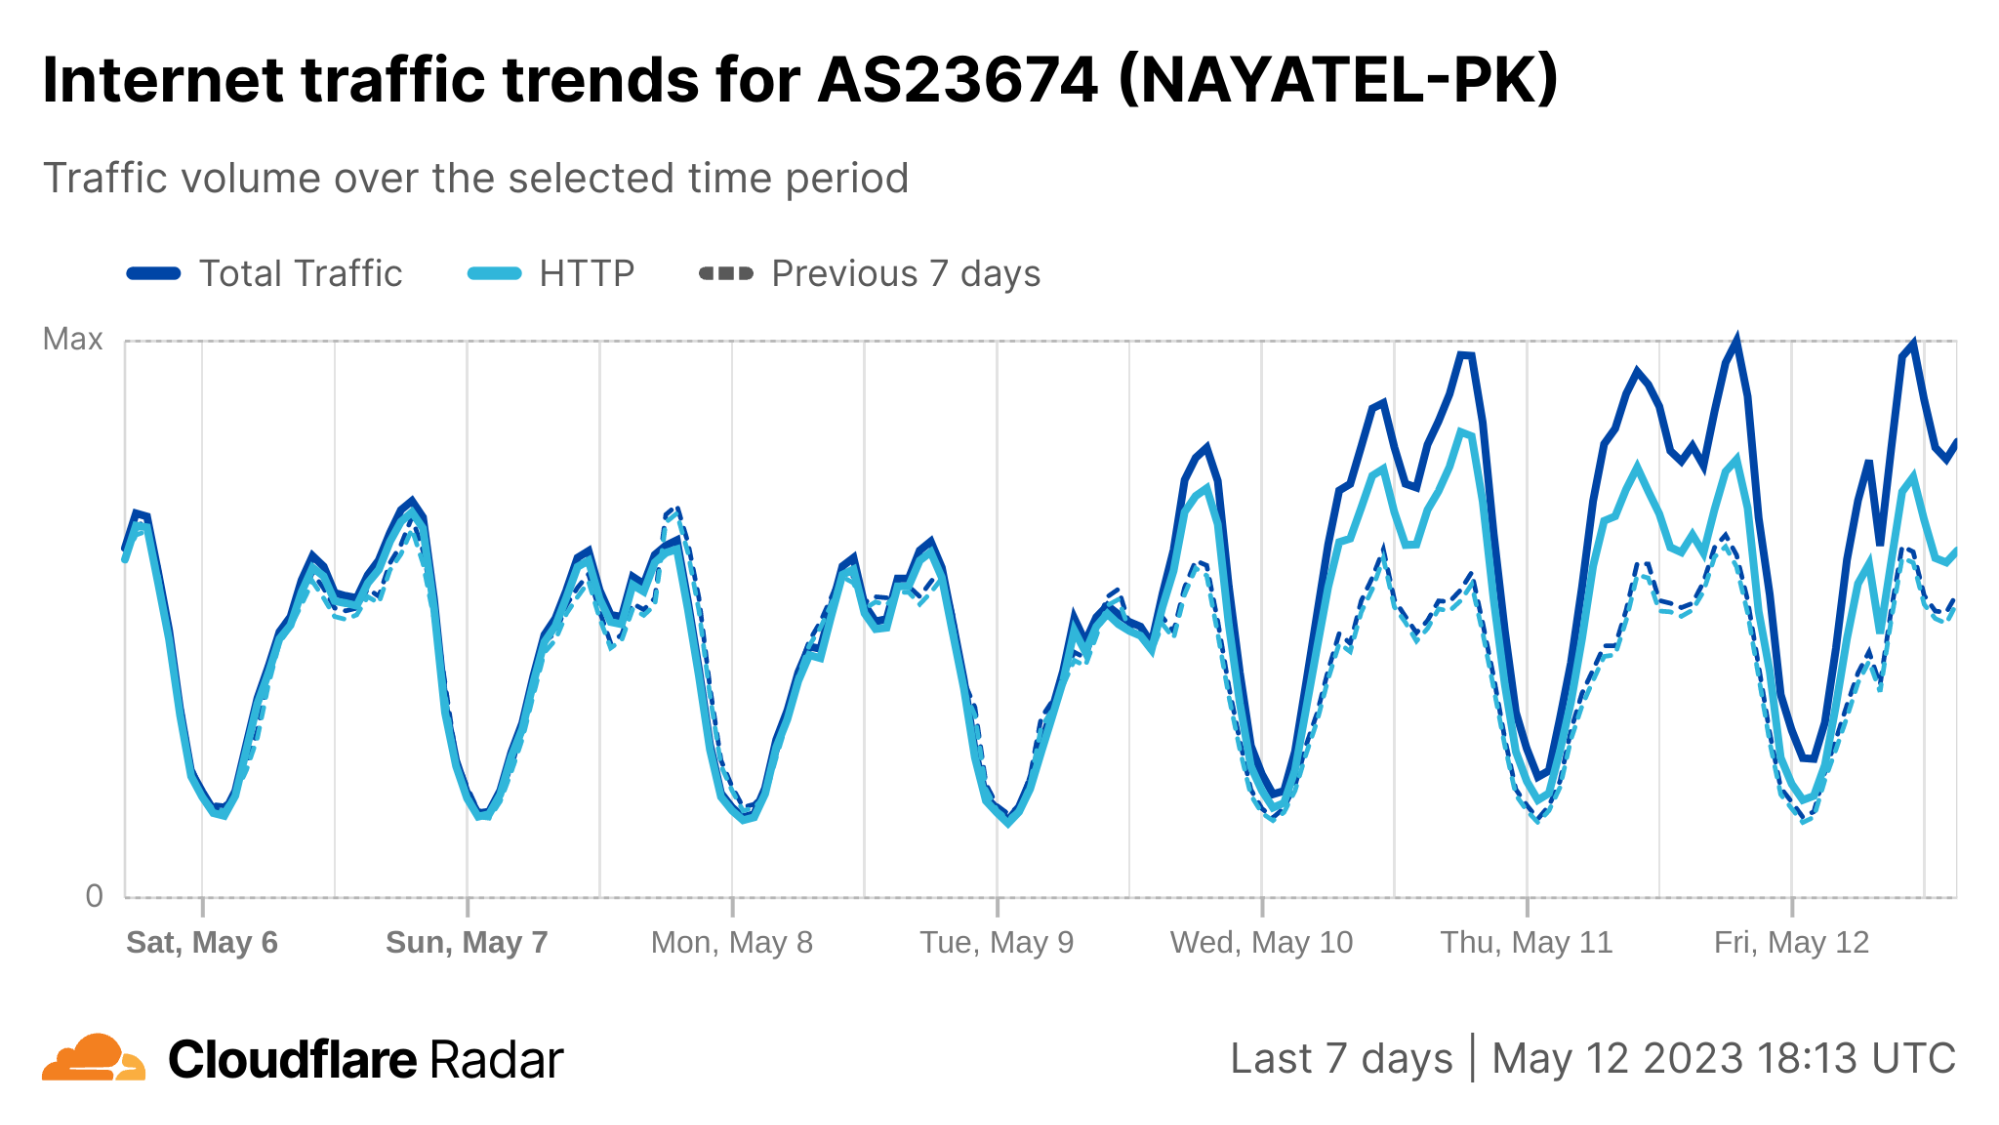
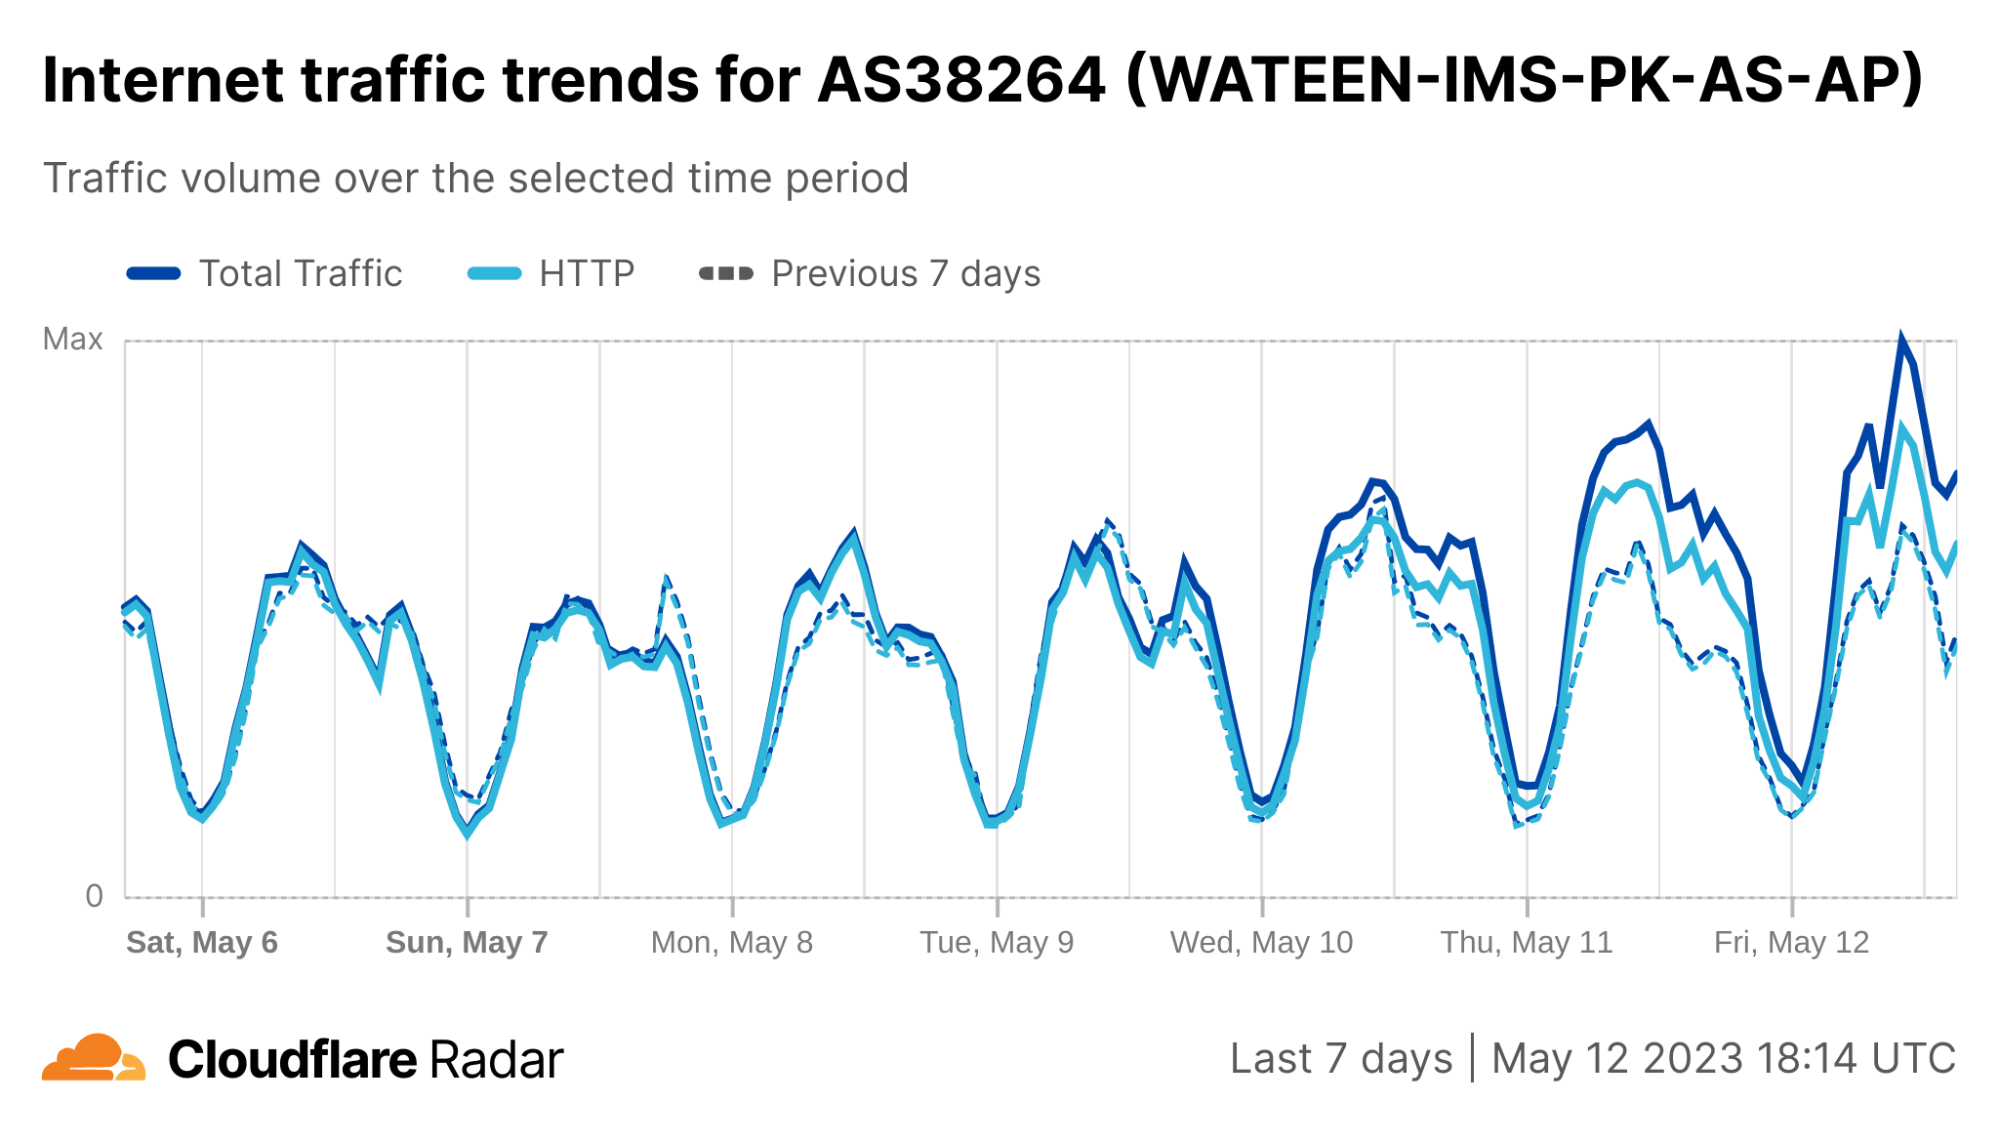
Smaller local providers Nayatel (AS23674) and Wateen Telecom (AS38264) also saw higher peak traffic levels starting around 16:00 UTC (21:00 local time) on May 9.
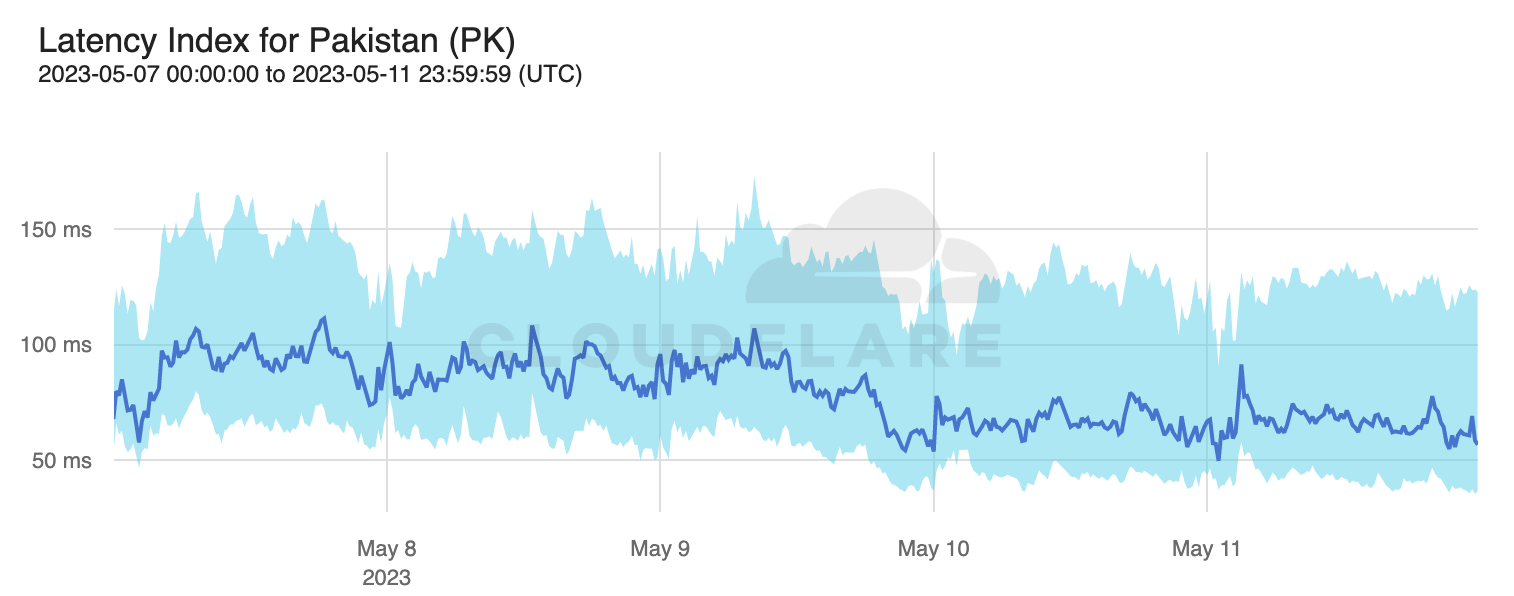
Interestingly, median latency within Pakistan also dropped slightly after mobile networks were shut down. Prior to the shutdown, median latency (as observed to Cloudflare and a set of other providers) was in the 90-100ms range, while afterwards, it has averaged closer to 75ms. This may be a result of users shifting to lower latency fixed broadband connections, as discussed above.
Administrative unit-level disruptions
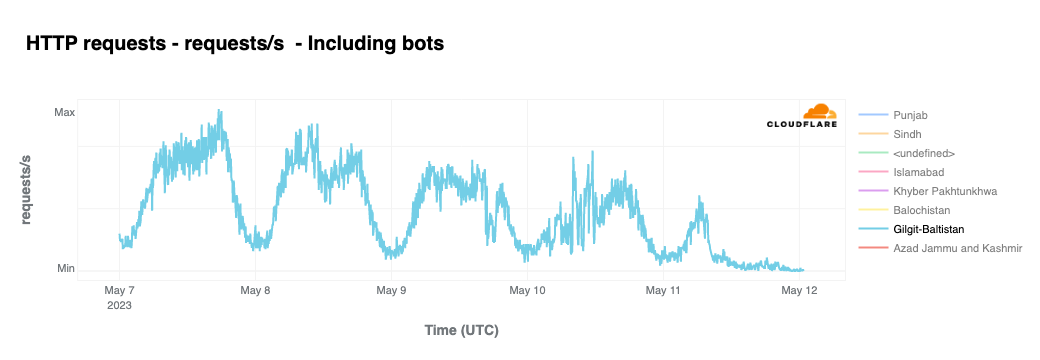
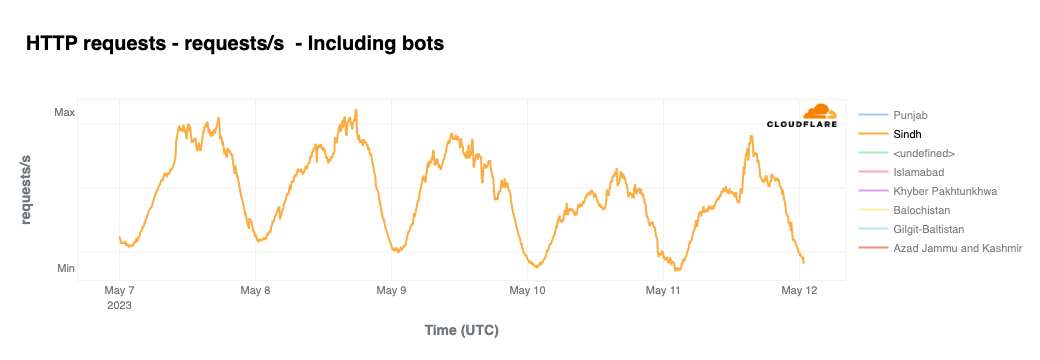
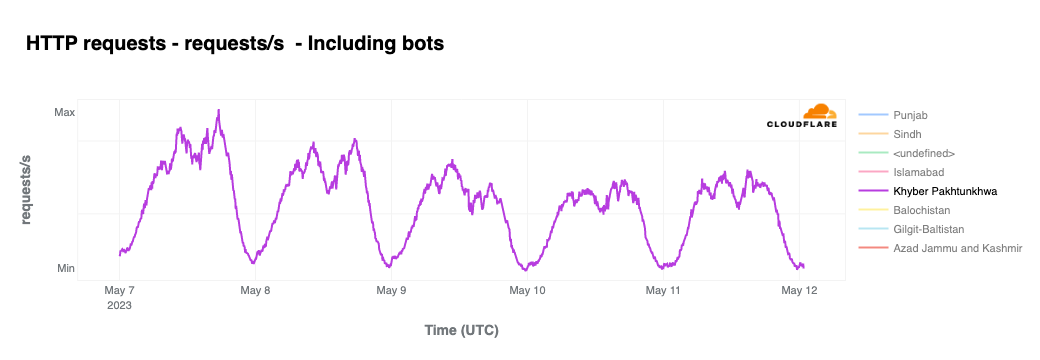
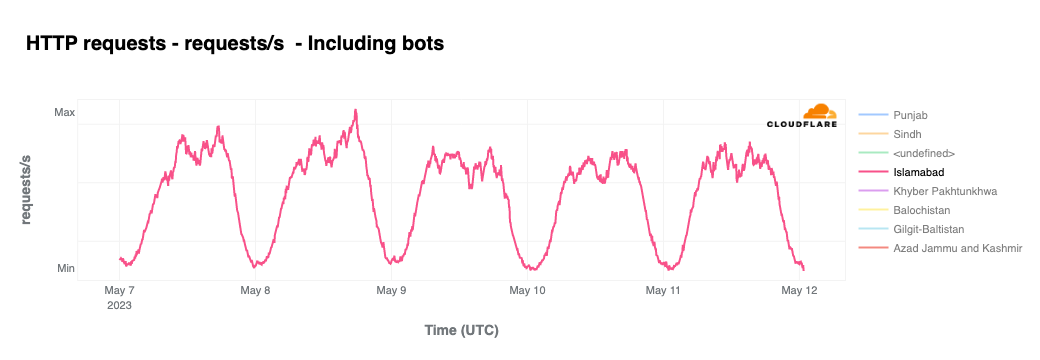
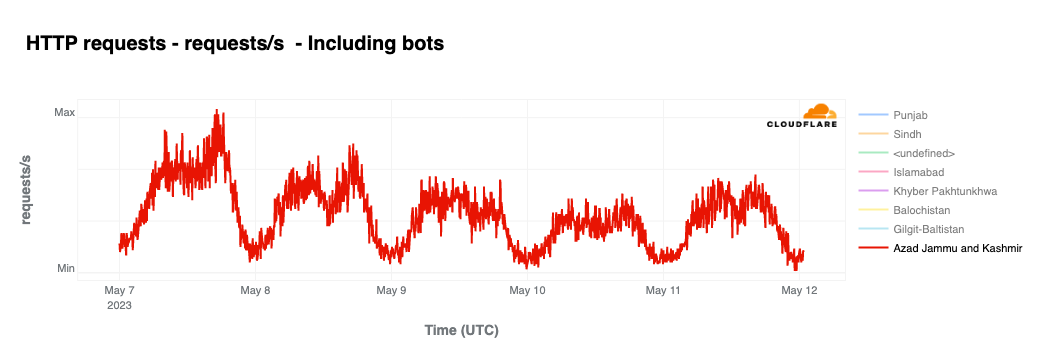
Because the mobile network providers that were affected by the shutdown directive provide services nationwide, we also observed an impact to traffic across multiple administrative units within the country. None of these locations has experienced a complete outage, but peak traffic levels have clearly been declining in comparison to previous days.
Gilgit-Baltistan experienced the largest loss, where peak traffic has fallen nearly 60%. In Sindh, peak traffic is down around 35%, followed by Khyber Pakhtunkhwa, where it is down 30%. Islamabad and Azad Jammu and Kashmir have seen peak traffic declines of ~20%.
City-level disruptions
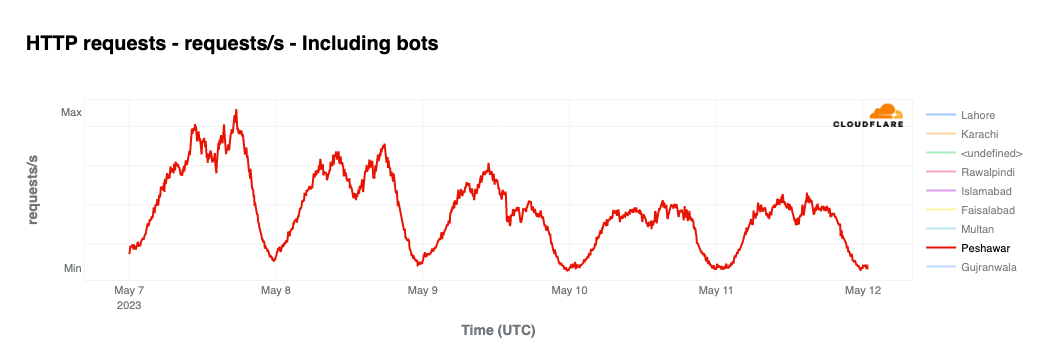
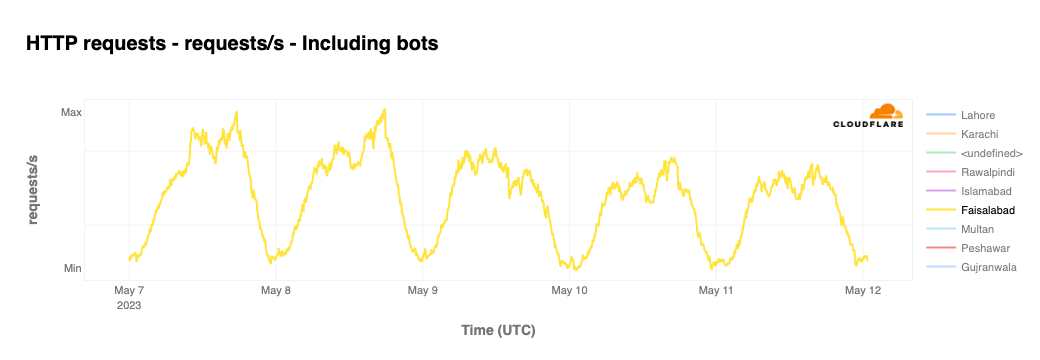
The impact of the mobile network shutdowns is also visible at a more local level, with lower peak traffic levels clearly visible in four cities. The significant traffic loss has been in Peshawar (Khyber Pakhtunkhwa), which has dropped nearly 55% from prior days. Faisalabad (Punjab), Karachi (Sindh), and Multan (Punjab) have all seen peak traffic drop approximately 40%.
Content blocking
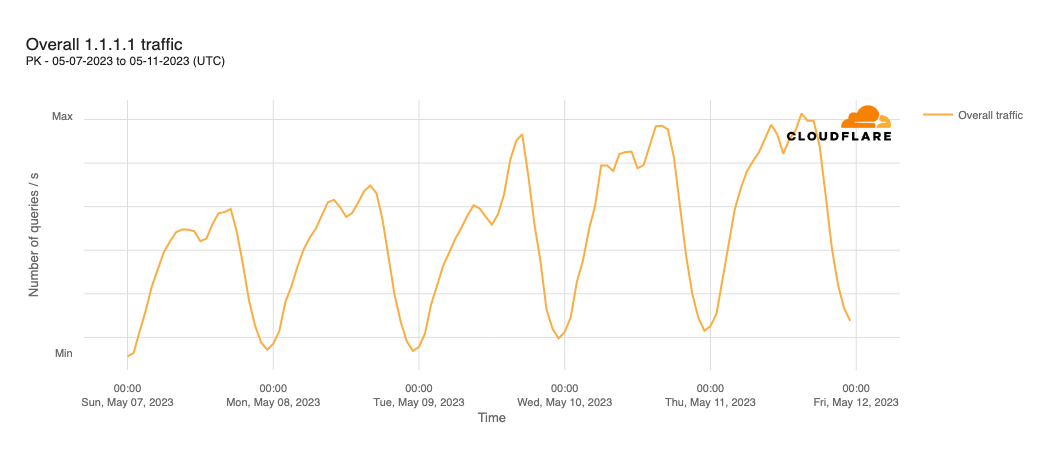
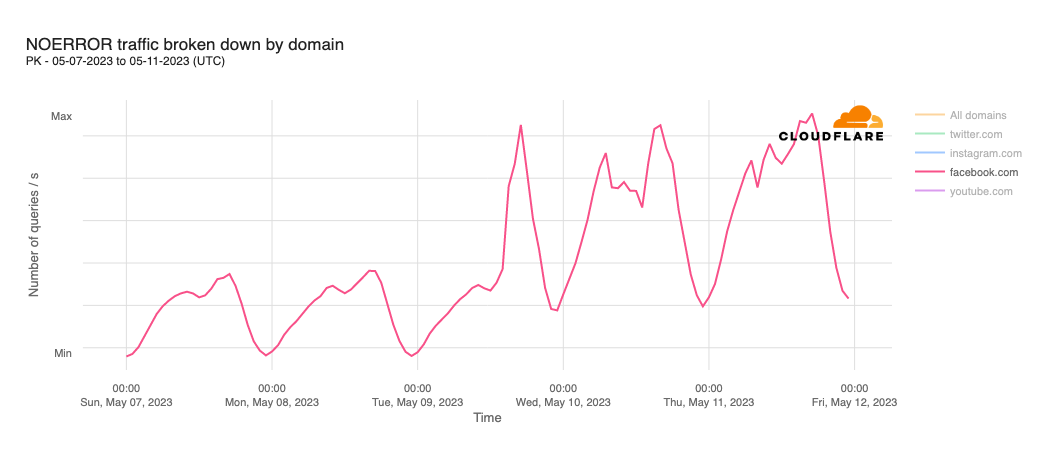
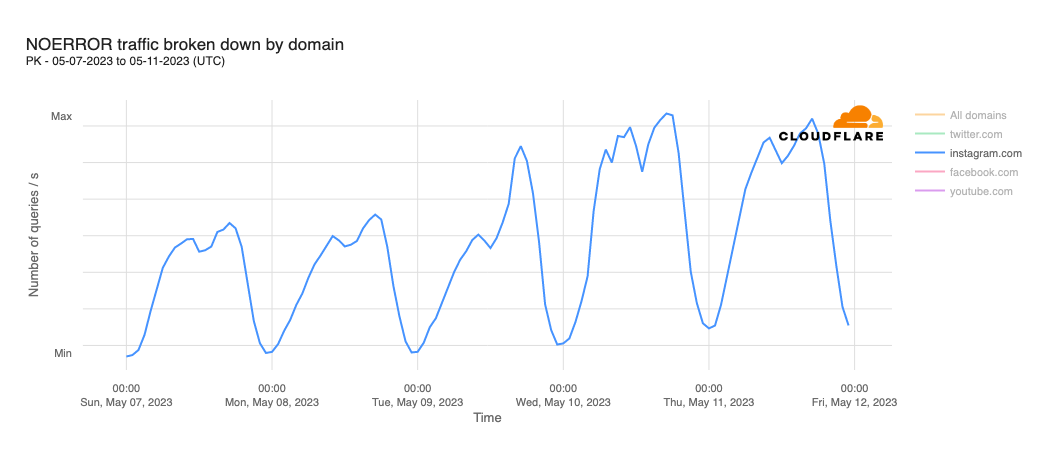
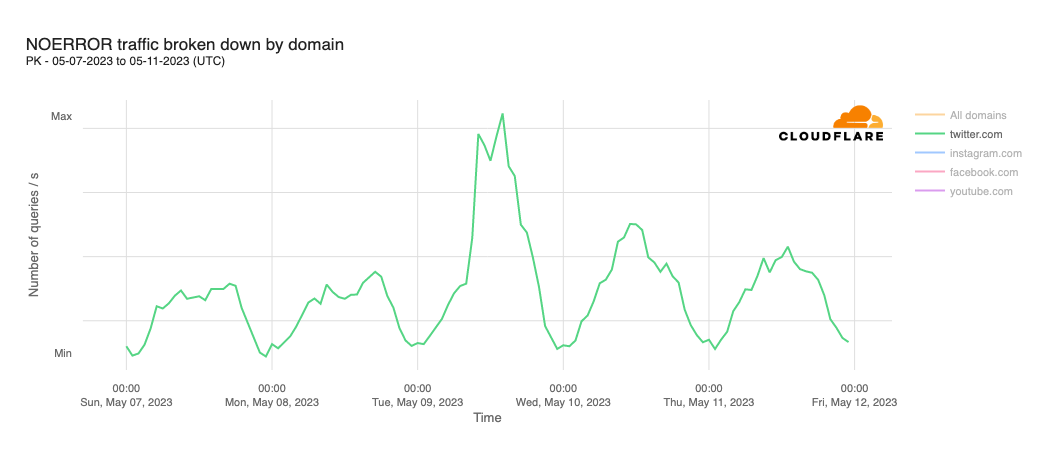
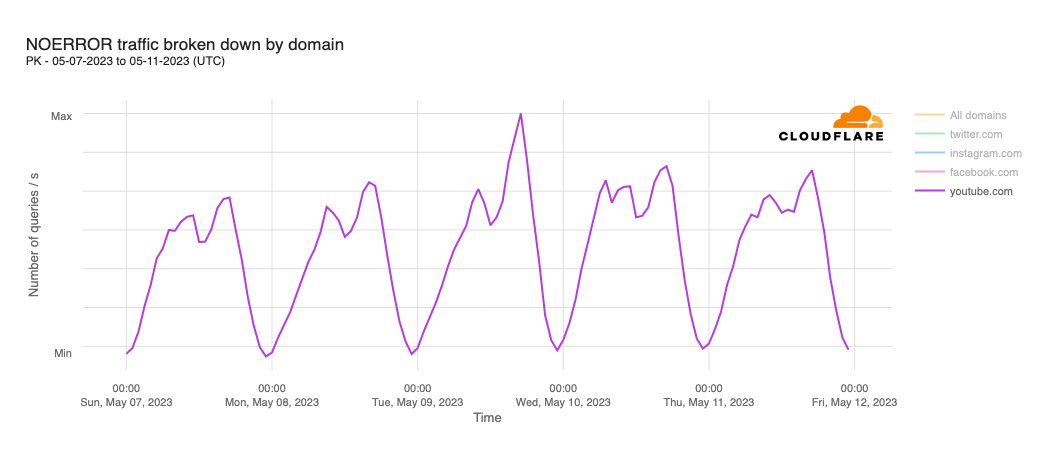
In addition to the government-directed mobile network shutdowns, Pakistan’s authorities have also ordered Internet service providers to block access to social media platforms including Facebook, Instagram, YouTube, and Twitter. Testing by the Open Observatory for Network Interference (OONI), an Internet censorship measurement organization, suggests that this blocking is using a combination of TLS-level interference and DNS-based blocking. When the latter occurs in a country, Cloudflare’s 1.1.1.1 DNS resolver often sees an increase in request volume from the country as users seek ways to continue to access the open Internet.
Over the last several days, as expected, 1.1.1.1 request volume from Pakistan has increased, up approximately 40%. Peak request volume for the blocked social media platforms has also increased. Traffic for facebook.com saw a significant increase starting around 14:00 UTC (19:00 local time) on May 9, with peak request volume more than doubling. Request volume for instagram.com, also owned by Facebook parent Meta, also began to increase around the same time, and has grown nearly 50%. Requests for twitter.com began to spike around 08:00 UTC (13:00 local time) on May 9, growing as much as 150% that afternoon. Request volume for youtube.com also spiked on May 9, increasing by approximately 40%. And like twitter.com, request volume on May 10 was higher than earlier in the week, but lower than the spike seen the previous day.
Conclusion
Because of the ubiquity of Internet connectivity and social media tools in everyday life, Internet shutdowns and website blocking ultimately come with a significant human and financial cost. The mobile network shutdowns in Pakistan have impacted tens of thousands of “gig workers” and freelancers that depend on mobile connectivity. Many point-of-sale terminals in the country also depend on mobile connectivity, with transactions through Pakistan’s main digital payment systems fell by around 50% after the shutdowns were put into place. Telecommunications operators within Pakistan have estimated the extent of the financial damage thus far to be Rs. 820 million (approximately $2.8 million USD).
Use Cloudflare Radar to monitor the impact of such government-directed Internet disruptions, and follow @CloudflareRadar on Twitter for updates on Internet disruptions as they occur.
Learn How to Modernize Your Applications at AWS Serverless Innovation Day
Post Syndicated from Marcia Villalba original https://aws.amazon.com/blogs/aws/learn-how-to-modernize-your-applications-at-aws-serverless-innovation-day/
Join us on Wednesday, May 17, for AWS Serverless Innovation Day, a free full-day virtual event. You will learn about AWS Serverless technologies and event-driven architectures from customers, experts, and leaders.
AWS Serverless Innovation Day is an event to empower builders and technical decision-makers with different AWS Serverless technologies, including AWS Lambda, Amazon Elastic Container Service (Amazon ECS) with AWS Fargate, Amazon EventBridge, and AWS Step Functions. The talks of the day will cover three key topics: event-driven architectures, serverless containers, and serverless functions, and how they can be utilized to build and modernize applications. Application modernization is a priority for organizations this year, and serverless helps to increase the software delivery speed and reduce the total cost of ownership.

Eric Johnson and Jessica Deen will be the hosts for the event. Holly Mesrobian, VP of Serverless Compute at AWS, will deliver the welcome keynote and share AWS’s vision for Serverless. The day ends with closing remarks from James Beswick and Usman Khalid, Events and Workflows Director at AWS.
The event is split into three groups of talks: event-driven architecture, serverless containers, and Lambda-based applications. Each group kicks off with a fireside chat between AWS customers and an AWS leader. You can learn how organizations, such as Capital One, PostNL, Pentasoft, Delta Air Lines, and Smartsheets, are using AWS Serverless technologies to solve their most challenging problems and continue to innovate.
During the day, all the sessions include demos and use cases, where you can learn the best practices and how to build applications. If you cannot attend all day, here are some of my favorite sessions to watch:
- Building with serverless workflows at scale – Ben Smith will show you how to unleash the power of AWS Step Functions.
- Event design and event-first development – In this session, David Boyne will show you a robust approach to event design with Amazon EventBridge.
- Best practices for AWS Lambda – You will learn from Julian Wood how to get the most out of your functions.
- Optimizing for cost using Amazon ECS – Scott Coulton will show you how to reduce operational overhead from the control plane with Amazon ECS.
There is no up-front registration required to join the AWS Serverless Innovation Day, but if you want to be notified before the event starts, get in-depth news, articles, and event updates, and get a notification when the on-demand videos are available, you can register on the event page. The event will be streamed on Twitch, LinkedIn Live, YouTube, and Twitter.
See you there.
— Marcia
Научни новини: Микро- и нанопластмаси и еволюция на вирусите
Post Syndicated from Михаил Ангелов original https://www.toest.bg/nauchni-novini-mikro-i-nanoplastmasi-i-evolyutsiya-na-virusite/
Микро- и нанопластмаси

Пластмасите са революционен материал, който много бързо след изобретяването му навлиза във всички области на живота и променя цели индустрии. В повечето случаи пластмасите са синтетични полимери, произвеждани от нефт (за някои вече се използват растителни суровини, например царевица), но тази зависимост не е най-големият проблем с тях. Комбинацията между широкото им разпространение, производството на големи обеми изделия за еднократна употреба и невъзможността да се разграждат в природата води до редица екологични предизвикателства.
Oсвен прякото замърсяване на природата с пластмаси има и друга уловка – при употребата им се получават микро- и нанопластмасови частици (МНП), които са с размер съответно под 5 мм и 1 µм. Част от тях се произвеждат за най-различни цели (ексфолианти в козметиката, за индустриални нужди), но друг източник е всекидневната употреба на пластмасови продукти. МНП се отделят при прането на синтетични дрехи, от пластмасовите съдове и прибори, от гумите на колите – почти няма дейност, свързана с употребата на пластмаса, която да не генерира известно количество от тях.
Вследствие на това те могат да бъдат открити навсякъде в околната среда – във въздуха, в естествени и изкуствени водни басейни, в почвата, откъдето попадат и в хранителните вериги на всички обитатели на екосистемите дори и в най-отдалечените места.
МНП са открити във водорасли, растящи под леда в протока Фрам, намиращ се между Гренландия и Свалбард в Северния ледовит океан. Видът Melosira arctica образува дълги нишки със слузеста покривка, която има способността да улавя частиците около себе си – от въздуха, водата и леда. Водораслите нарастват бързо през пролетта и лятото, след което клетките, изграждащи нишките, започват да отмират. След стопяването на ледените късове, върху които са прикрепени, водораслите се оплитат и образуват агрегати, които бързо потъват в дълбочините, носейки пластмасовите частици със себе си. Това обяснява откриването на МНП дори на дълбочина от няколко хиляди метра.
Веднъж попаднали там, те преминават в хранителната верига – от различни видове зоопланктон, които служат за храна на арктическата треска, която от своя страна е жертва на различни водни птици и тюлени, които пък са част от менюто на полярните мечки.
От околната среда – чрез храната, – както и от продуктите, които използваме, МНП попадат и в нашите тела. Според една публикация всяка седмица поглъщаме по 5 г пластмаса, което грубо се равнява на една банкова карта. Ето защо зачестяват съобщенията за откриването им в различни човешки органи и индикациите, че това може да доведе до редица заболявания, стават притеснителни.
До сравнително скоро главният фокус беше върху химическите добавки в пластмасите, използвани за промяна на свойствата им, като бисфенол A (BPA), който има потенциал да наруши ендокринната система и действа сходно на естрогена. Въпреки че тези ефекти са слаби, поради широката му употреба хората са постоянно изложени на него, което води до редица регулации за приложението му в продукти за хранителната промишленост. Например в Европейския съюз той е включен в списъка на веществата, пораждащи сериозно безпокойство.
Може да се окаже обаче, че някои пластмаси имат такива свойства и без в тях да са вложени допълнителни вещества. За да определят ефекта от вдишването им, учени са изложили разгонени женски плъхове на аерозолен поток от полиамидни наночастици в концентрация, сходна с тази, на която сме изложени във всекидневието си. При вдишването им частиците би трябвало да покрият всички части на белите дробове, но това не е довело до възпалителни процеси в тях. Наблюдаваните промени са повишено кръвно налягане и стесняване на кръвоносните съдове в матката, без изменения в аортата.
Но най-интересно е, че макар качеството на използваната пластмаса да е било подходящо за хранителната индустрия и да са липсвали добавки, са отчетени понижени нива на естрадиол, който е един от основните женски хормони и има роля в регулирането на менструалния цикъл и развитието на гърдите. Това означава, че самите наночастици нарушават функциите на ендокринната система. Склонността на полиамида да се свързва с вещества, сходни с естрогена, вече е известна, но за първи път изследване показва директното му влияние in vivo след приемане по начин, който можем да срещнем всеки ден.
Освен че влияят върху хормоните, МНП могат да достигнат и най-различни органи, например мозъка. Скорошно изследване показва, че полистиреновите наночастици имат способността да преминат кръвно-мозъчната бариера. Полистиренът е полимер, който се използва изключително често в хранителната индустрия за еднократни опаковки, като кутии за бързо хранене и чаши (пример е експандираният полистирен – бялата „пухкава“ пластмаса, сходна със стиропора).
Използвайки компютърен модел с няколко различни условия, учените са проследили възможността за преминаване през липидна мембрана, сходна с тази, предпазваща мозъка. Контролното условие е с обикновени наночастици, а другите – с различна покривка, която се състои от холестерол или протеини, създаващи т.нар. биомолекулна корона – ефект, използван за доставяне на лекарства под формата на наночастици. Моделът е показал, че протеиновата корона възпрепятства частиците да преминат към нервната тъкан, докато холестеролната ги улеснява. Симулацията е потвърдена и in vivo в мишки, при които е установено, че частиците успешно са преминали в мозъка им само два часа след като са ги приели с храната си.
Преминаването на тази бариера е притеснително, защото тя има изключително важна защитна функция – предпазва мозъка от патогени и вредни вещества, които могат да циркулират в кръвообращението. Според учените навлизането на частиците в мозъка може да доведе до по-чести възпалителни процеси, които да са причина за развитие на тумори и невродегенеративни заболявания като алцхаймер и паркинсон.
Решение за въпроса с МНП все още няма, но по него се работи активно. Ограничаването на използваните пластмасови продукти е част от стратегията, но предвид масовостта и икономическите им предимства ще трябва да се разработят и системи за намаляването, улавянето и преработването.
Еволюция на вирусите
Повече от 100 години учените не могат да решат дали да класифицират вирусите като живи организми, но е неоспоримо, че те са ключов фактор в еволюцията и развитието на биосистемите и успешно използват всички познати организми като свои гостоприемници – бактерии, гъби, растения и животни, дори и други вируси. Това е благодарение на тяхната изключително разнообразна форма, структура и генетичен материал.
Двойноверижните ДНК (ДвДНК) вируси се класифицират в две основни групи – Varidnaviria (които са сравнително големи) и Duplodnaviria (които са по-малки). Първата е доста разнообразна и голяма част от вирусите в нея се намират в соленоводните басейни, но тя включва и причинителите на редица важни заболявания, като едра шарка, африканска чума по свинете и др. Малките вируси от своя страна са поели по два пътя – едните (Caudoviricetes) специализират по прокариотни организми и имат характерната за бактериофагите структура, докато другите са предпочели животните – това е групата на добре познатите херпес вируси (Herpesvirales). Това разделяне представлява интерес за учените, защото няма ясна следа откъде са произлезли херпес вирусите и каква е родствената връзка между големите и малките ДвДНК вируси.
Потенциално свързващо звено е открито в публичния набор данни от проекта Tara Oceans, целящ обследването на планктона в слоевете на океаните, в които достига слънчева светлина. При анализ на около 1000 метагенома и метатранскриптома (сборна информация за всички гени и информационни РНКи в една проба, най-често от различни индивиди/видове) за общи гени и протеини между отделните групи е установено съществуването на непознати до момента вируси, наречени mirusvirus (от лат. mirus – ’странно, неочаквано’). Техни гостоприемници са някои видове планктон и макар да са новооткрити, изглежда, че са сред широко разпространените групи вируси в океаните. Освен това данните сочат, че след като инфектират планктона, те са много активни в него, което показва потенциала им да регулират неговите популации. Така с потъването на мъртвите клетки се подхранват други екологични системи.
Геномът на тези вируси е сложен, съставен от части с различен произход. Повечето от гените им, наред с функционално важните за репликация и транскрипция на ДНК, са близки до тези на големите вируси. Но гените, отговарящи за образуването на капсида им (обвивката, която ги предпазва от околната среда и им помага да навлязат в гостоприемника) и служещи за таксономично определяне, показват връзка с групата на херпес вирусите. Според учените най-вероятно те са се появили от общ предшественик след процес, наречен редуктивна еволюция, при който части от генома на организмите отпадат.
Благодарение на екип от Оксфорд вече знаем повече и за произхода на вирусите от Bamfordvirae, част от групата Varidnaviria. Те са доста разнообразни и включват няколко основни вида, като NCLDV (най-големите вируси, открити до момента), аденовирусите (причиняващи настинки), вирофагите (вируси, паразитиращи по вируси), както и полинтоните – мобилни генетични елементи, които могат да се интегрират в генома на гостоприемника си.
До момента има две основни хипотези за появата им. Според първата – „отделяне от ядрото“ – предшествениците са били полинтони, които са се отделили от генома на по-сложни видове и са започнали да се разпространяват, паразитирайки, като с времето се обвиват в капсид, давайки начало на аденовирусите и NCLDV. При другата – „вирофаген произход“ – се предполага, че NCLDV са еволюирали заедно с вирофагите, от които с течение на времето са се отделили полинтоните и аденовирусите.
Използвайки статистически и филогенетични методи, учените са разгледали четири от най-важните гени, които се срещат във всички тези вируси и отговарят за оформянето на техния капсид. Получените резултати показват липса на пряка връзка между аденовирусите и NCLDV, което опровергава първата хипотеза. Според данните аденовирусите и полинтоните имат общ предшественик, който не е свързан с NCLDV. Подкрепата за втората хипотеза не е пълна, защото този предшественик не е бил вирофаг, но това не я отрича изцяло, така че авторите я приемат като най-вероятно обяснение за еволюционните процеси.
Според тях вирофагите са еволюирали наред с NCLDV, като са се специализирали да ги заразяват. Най-вероятно общият предшественик за цялата група е бил активен поне преди около един милиард години, обменяйки генетична информация с последния общ предшественик на еукариотните клетки (LECA). Това показва тясната връзка на вирусите с еволюцията на по-висшите организми и повдига въпроса дали те нямат принос за тези процеси.
Освен в миналото, вирусите ще са ключов участник и в бъдещето на екологичните процеси, протичащи на фона на глобалните климатични промени. Основен участник в глобалните цикли на въглерод и хранителни вещества са микроорганизмите, които ги синтезират, разграждат и трансформират от един вид в друг. Динамиката на тези процеси зависи от температурата и някои промени в тях са вече известни – ускоряване на отделянето на въглероден диоксид, преразпределяне във видовия състав.
Предвид важната връзка между вирусите и микроорганизмите, едно от притесненията на учените е, че не знаем как промените в климата ще се отразят на техните взаимодействия. Събраните в обзорна статия данни сочат, че с повишаване на температурата латентният период (от заразяване до отделяне на нови вирусни частици) се скъсява, броят на отделените вириони се увеличава, увеличава се и смъртността на гостоприемниците. Това би довело до сериозни промени в хранителните мрежи в микробиалните системи, но за съжаление, в момента има повече въпроси, отколкото отговори какви ще бъдат те.
Авторите предлагат торфените блата като моделна система, в която да се проучат по-добре както взаимодействията между вирусите и микроорганизмите, така и влиянието на температурата върху тях. Самите процеси в тези блата са сравнително добре изследвани, а вече започват да се появяват и публикации за ролята на вирусите в тях. Според опростен модел, описан в статията, може да се очаква, че с повишаването на температурата вирусите всъщност биха имали благоприятно влияние, тъй като ще увеличат значително количеството органичен въглерод, който след това ще премине в нещо като хранилище под формата на торф.
Освен ясно видимите промени, които вирусите могат да донесат за хората (най-ярък е пандемията, от която още не сме се възстановили), те може да се окажат ключов участник и в по-бавните и „невидими“ процеси, протичащи в екосистеми, на които не се обръща толкова внимание или пък е трудно да се изследват, като океаните и почвите. Вникването в еволюционните процеси в тези интересни видове, намиращи се на ръба между живото и неживото, ще ни помогне да се подготвим за промените в климата, които ни очакват.
Metasploit Wrap-up
Post Syndicated from Alan David Foster original https://blog.rapid7.com/2023/05/12/metasploit-weekly-wrap-up-10/
Chaining for the win #1: Pentaho Business Server

This week, our very own jheysel-r7 added an exploit module that leverages two vulnerabilities in Hitachi Vantara Pentaho Business Analytics Server prior to versions 9.4.0.1 and 9.3.0.2, including 8.3.x. The module chains an authentication bypass (CVE-2022-43939) and Server Side Template Injection – SSTI – (CVE-2022-43769) to achieve unauthenticated code execution as the user running the application. Patches are available and It is highly recommended to apply them as soon as possible. The exploit is straightforward to execute and very reliable.
Chaining for the win #2: Zyxel
Community contributor h00die-gr3y added another exploit module that also chains two vulnerabilities, this time targeting Zyxel devices. It exploits an unauthenticated local file disclosure – LFI – (CVE-2023-28770) vulnerability and a weak password derivation algorithm to obtain unauthenticated remote code execution as the supervisor user. These vulnerabilities affect the zhttpd and zcmd binaries, respectively, which are present on more than 40 Zyxel routers and CPE devices. The module leverages a LFI to read the entire configuration of the router, from which it derives the supervisor password by exploiting a weak password derivation algorithm. Finally, if the device is reachable via SSH, the module establishes a connection using the leaked supervisor credentials to execute commands.
GSoC Project: Enable HTTP-Trace for scanner modules
One more successful GSoC project to enhance Metasploit has landed this week. Contributor 3V3RYONE, extended the HTTP-Trace capability to login scanner modules, which was only available to exploit modules before. That’s a very useful feature to debug a module by allowing users to display the full HTTP requests and responses of scanner modules within msfconsole. More information about previous Metasploit GSoC projects can be found here.
Here is an example output of a login scanner module running with the HTTPTrace feature enabled:
msf6 > use auxiliary/scanner/http/buffalo_login
msf6 auxiliary(scanner/http/buffalo_login) > set RHOSTS www.example.com
RHOSTS => www.example.com
msf6 auxiliary(scanner/http/buffalo_login) > set USERPASS_FILE data/wordlists/http_default_userpass.txt
USERPASS_FILE => data/wordlists/http_default_userpass.txt
msf6 auxiliary(scanner/http/buffalo_login) > set HttpTrace true
HttpTrace => true
msf6 auxiliary(scanner/http/buffalo_login) > run

####################
# Request:
####################
POST /dynamic.pl HTTP/1.1
Host: www.example.com
User-Agent: Mozilla/5.0 (Macintosh; Intel Mac OS X 12_2_1) AppleWebKit/537.36 (KHTML, like Gecko) Chrome/98.0.4758.81 Safari/537.36
Content-Type: application/x-www-form-urlencoded
Content-Length: 51

bufaction=verifyLogin&user=connect&password=connect
####################
# Response:
####################
HTTP/1.1 404 Not Found
Content-Type: text/html; charset=UTF-8
Referrer-Policy: no-referrer
Content-Length: 1571
Date: Mon, 26 Sep 2022 06:21:16 GMT
Connection: close

[...]
New module content (3)
Zyxel chained RCE using LFI and weak password derivation algorithm
Authors: Bogi Napoleon Wennerstrøm, SEC Consult Vulnerability Lab, Thomas Rinsma, and h00die-gr3y
Type: Exploit
Pull request: #17881 contributed by h00die-gr3y
AttackerKB reference: CVE-2023-28770
Description: This adds a new exploit module that leverages multiple vulnerabilities in the zhttpd and zcmd binaries, which are present on more than 40 Zyxel routers and CPE devices, to achieve remote code execution as user supervisor. This chains a local file disclosure vulnerability that allows an unauthenticated attacker to read the configuration file and a weak password derivation algorithm vulnerability. The module uses the leaked credentials to establish a SSH connection and execute commands.
Pentaho Business Server Auth Bypass and Server Side Template Injection RCE
Authors: Harry Withington, dwbzn, and jheysel-r7
Type: Exploit
Pull request: #17964 contributed by jheysel-r7
AttackerKB reference: CVE-2022-43939
Description: A new module has been added which exploits Hitachi Vantara Pentaho Business Analytics Server versions before 9.4.0.1 and 9.3.0.2, including 8.3.x. To do this it first exploits CVE-2022-43939 to bypass authentication before using CVE-2022-43769, a Server Side Template Injection (SSTI) vulnerability, to achieve unauthenticated code execution as the user running the Pentaho Business Analytics Server.
ManageEngine ADAudit Plus Authenticated File Write RCE
Authors: Erik Wynter and Moon
Type: Exploit
Pull request: #17133 contributed by ErikWynter
AttackerKB reference: CVE-2021-42847
Description: A new exploit module has been added which gains authenticated RCE on ManageEngine AdAudit builds 7005 and prior by creating a custom alert profile and leveraging the custom alert script component. On builds 7004 and later, CVE-2021-42847 is utilized to gain RCE as the user running AdAudit, which will typically be a local administrator, via an arbitrary file write to create the necessary script for the alert profile.
Enhancements and features (3)
- #17060 from 3V3RYONE – Updates the HTTP scanner modules with the functionality to log both HTTP requests and responses. This functionality can be enabled with
set HTTPTrace true. This functionality is useful for debugging modules. In scenarios where the traffic is encrypted, for instance with WinRM, the logged values will be unencrypted. - #17807 from gwillcox-r7 – Adds documentation for Metasploit’s folder structure, so that those unfamiliar with Metasploit can quickly get up to speed and understand where files might be located or where to place new files when developing content for Metasploit.
- #17972 from h00die – Updates the example modules to align with the latest Metasploit framework module conventions.
Bugs fixed (2)
- #17968 from zeroSteiner – A bug has been fixed where Certificate Templates were not being identified as vulnerable when there was an ACE that granted enrollment rights but did not correspond to any object types. The logic has now been updated so that only ACEs associated with an object that is neither the
CERTIFICATE_ENROLLMENT_EXTENDED_RIGHTright nor theCERTIFICATE_AUTOENROLLMENT_EXTENDED_RIGHTright will be ignored. - #17980 from sempervictus – This fixes the file system path check used by PowerShell sessions.
Documentation added (1)
- #17984 from adfoster-r7 – Fixes a Kerberos datastore name typo in the WinRM wiki docs.
You can always find more documentation on our docsite at docs.metasploit.com.
Get it
As always, you can update to the latest Metasploit Framework with msfupdate
and you can get more details on the changes since the last blog post from
GitHub:
If you are a git user, you can clone the Metasploit Framework repo (master branch) for the latest.
To install fresh without using git, you can use the open-source-only Nightly Installers or the
binary installers (which also include the commercial edition).
Building Your Digital Twin | Roger Highfield and Peter Coveney | Talks at Google
Post Syndicated from Talks at Google original https://www.youtube.com/watch?v=1dyMU_Fhd_g
[$] The future of memory tiering
Post Syndicated from original https://lwn.net/Articles/931421/
Memory tiering is the practice of dividing physical memory into separate
levels according to its performance characteristics, then allocating that
memory in a (hopefully) optimal manner for the workload the system is
running. The subject came up repeatedly during the 2023 Linux Storage, Filesystem,
Memory-Management and BPF Summit. One session, led by David Rientjes,
focused directly on tiering and how it might be better supported by the
Linux kernel.
ASUS Pro WS W790E SAGE SE Intel Xeon W-3400 Motherboard Quick Look
Post Syndicated from Eric Smith original https://www.servethehome.com/asus-pro-ws-w790e-sage-se-intel-xeon-w-3400-motherboard-quick-look/
We take a quick look at the ASUS Pro WS W790E SAGE SE motherboard for Intel Xeon W-3400 and W-2400 processors with massive PCIe Gen5 features
The post ASUS Pro WS W790E SAGE SE Intel Xeon W-3400 Motherboard Quick Look appeared first on ServeTheHome.
How I used GitHub Copilot to build a browser extension
Post Syndicated from Rizel Scarlett original https://github.blog/2023-05-12-how-i-used-github-copilot-to-build-a-browser-extension/
| For the first time ever, I built a browser extension and did it with the help of GitHub Copilot. Here’s how. |
I’ve built a rock, paper, scissors game with GitHub Copilot but never a browser extension. As a developer advocate at GitHub, I decided to put GitHub Copilot to the test, including its upcoming chat feature, and see if it could help me write an extension for Google Chrome to clear my cache.
I’m going to be honest: it wasn’t as straightforward as I expected it to be. I had a lot of questions throughout the build and had to learn new information.
But at the end of the day, I gained experience with learning an entirely new skill with a generative AI coding tool and pair programming with GitHub Copilot—and with other developers on Twitch  .
I wanted to create steps that anyone—even those without developer experience—could easily replicate when building this extension, or any other extension. But I also wanted to share my new takeaways after a night of pair programming with GitHub Copilot and human developers.
So, below you’ll find two sections:
 How I built a Chrome extension with GitHub Copilot in seven steps.
- You’ll see my questions and prompts and the responses from GitHub Copilot .
- You’ll see my questions and prompts
- Three important lessons I learned about learning and pair programming in the age of AI.


Let’s jump in.
How to build a Chrome extension with GitHub Copilot
To get started, you’ll need to have GitHub Copilot installed and open in your IDE. I also have access to an early preview of GitHub Copilot chat, which is what I used when I had a question. If you don’t have GitHub Copilot chat, sign up for the waitlist, and pair GitHub Copilot with ChatGPT for now.
1. Using the chat window, I asked GitHub Copilot, “How do I create a Chrome extension? What should the file structure look like?”
 GitHub Copilot gave me general steps for creating an extension—from designing the folder structure to running the project locally in Chrome.
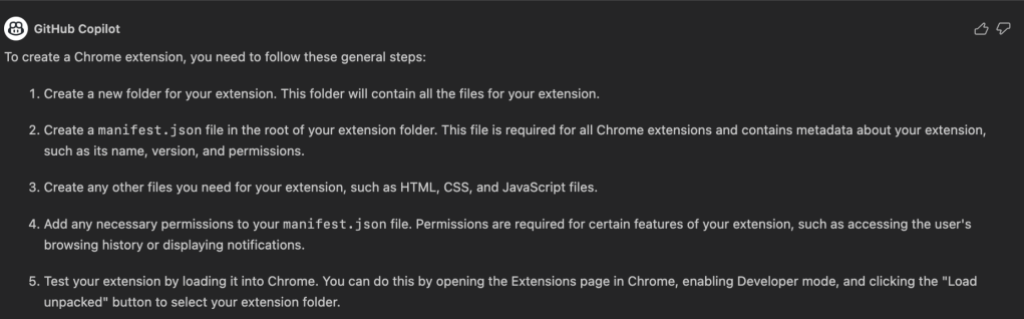
Then, it shared an example of a Chrome extension file structure.
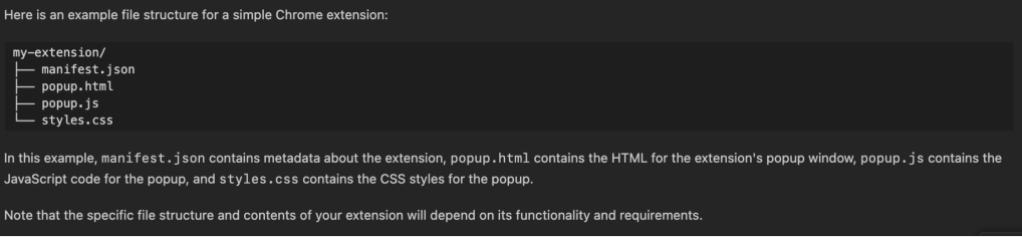
To save you some time, here’s a chart that briefly defines the purpose of these files:
manifest.json 
|
Metadata about your extension, like the name and version, and permissions. Manifest as a proper noun is the name of the Google Chrome API. The latest is V3. |
popup.js 
|
When users click on your extension icon in their Chrome toolbar, a pop-up window will appear. This file is what determines the behavior of that pop-up and contains code for handling user interactions with the pop-up window. |
popup.html and style.css 
|
These files make up the visual of your pop-up window. popup.html is the interface, including layout, structure, and content. style.css determines the way the HTML file should be displayed in the browser, including font, text color, background, etc. |
2. Create the manifest.json
 Inside a folder in my IDE, I created a file called manifest.json. In manifest.json,
I described my desired file:
Manifest for Chrome extension that clears browser cache.
manifest_version: 3
Permissions for the extension are: storage, tabs, browsingData
I pressed enter and invoked suggestions from GitHub Copilot by typing a curly brace.
Inside the curly brace, GitHub Copilot suggested the manifest. I deleted the lines describing my desired manifest.json, and the final file looked like this:
{
   "name": "Clear Cache",
   "version": "1.0",
   "manifest_version": 3,
   "description": "Clears browser cache",
   "permissions": [
       "storage",
       "tabs",
       "browsingData"
   ],
   "action": {
       "default_popup": "popup.html"
   },
   "background": {
       "service_worker": "background.js"
   }
}
3. Create a service worker, which is a file called background.js

This wasn’t a file that was recommended from my chat with GitHub Copilot. I learned that it was a necessary file from a developer who tuned into my livestream . The background.js is what gives your extension the ability to run in the background, perform tasks, and respond to user events outside of the extension’s pop-up window (like network requests and data storage).
In my background.js file, I wrote a comment describing my desired service worker:
Service Worker for Google Chrome Extension
Handles when extension is installed
Handles when message is received
Then, I wrote a comment for the first function, which prompted a suggestion from GitHub Copilot, and then wrote another comment to describe the second function.
The final file looked like this:
/*
Service Worker for Google Chrome Extension
Handles when extension is installed
Handles when message is received
*/

// console.log when extension is installed
chrome.runtime.onInstalled.addListener(function() {
   console.log("Extension installed");
});

// send response when message is received and console.log when message is received
chrome.runtime.onMessage.addListener(function(request, sender, sendResponse) {
   console.log("Message received");
   sendResponse("Message received");
});
4. Create the popup.html file
In the popup.html file, I wrote a comment describing how I wanted my pop-up window to appear. This window is the one users will see when they click on the extension icon.
<!--
   HTML for Chrome extension that clears browser cache.
   Connect to javascript file called popup.js and CSS file called style.css
   Will render the following buttons with id's:
   - "All History"
   - "Past Month"
   - "Past Week"
   - "Past Day"
   - "Past Hour"
   - "Past Minute"


   Will render an empty paragraph with id "lastCleared"
-->
GitHub Copilot suggested the following:
<!DOCTYPE html>
<html>
   <head>
       <meta charset="utf-8">
       <title>Clear Cache</title>
       <link rel="stylesheet" href="style.css">
   </head>
   <body>
       <h1>Clear Cache</h1>
       <button id="allHistory">All History</button>
       <button id="pastMonth">Past Month</button>
       <button id="pastWeek">Past Week</button>
       <button id="pastDay">Past Day</button>
       <button id="pastHour">Past Hour</button>
       <button id="pastMinute">Past Minute</button>
       <p id="lastCleared"></p>
       <script src="popup.js"></script>
   </body>
</html>
5. Test the browser extension
I decided to test the modifications before incorporating additional styles or interactivity. I prefer making incremental changes and conducting manual tests in between because it simplifies the debugging process.
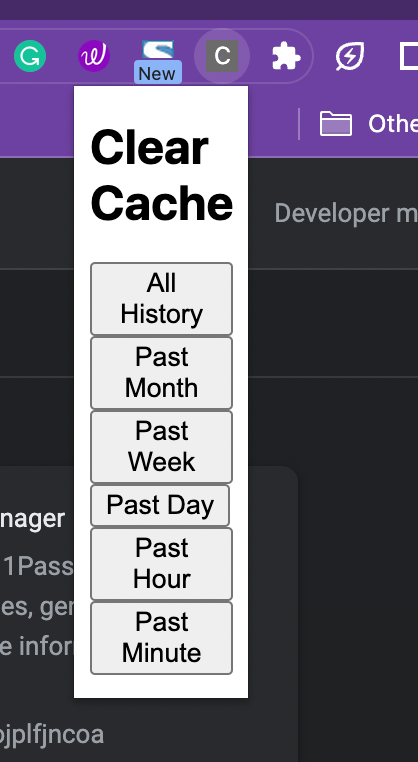
Navigate to chrome://extensions/ in your Chrome browser. Turn on developer mode. Press “Load unpacked.” Upload the folder that holds your Chrome extension. Once loaded, you should be able to test your extension. Here’s what mine looked like:
6. Create a popup.js file to add interactivity
Inside this file, write a comment that will act as pseudocode for you but as a prompt for GitHub Copilot.
Pseudocode isn’t code, but a method of conceptualizing and communicating ideas to plan and design programs before writing the actual code. Programmers can concentrate on algorithmic logic without worrying about syntactic details of a particular programming language—and communicate ideas to other developers regardless of coding experience.
Here’s the pseudocode I used:
/*
This program is a Chrome Extension that clears browser cache.
Handle on button click:
- button with id "allHistory" that clears all cache history
- button with id "pastMonth" that clears cache history from the past month
- button with id "pastWeek" that clears cache history from the past week
- button with id "pastDay" that clears cache history from the past day
- button with id "pastHour" that clears cache history from the past hour
- button with id "pastMinute" that clears cache history from the past minute


Create function that
- converts dates and times into human-readable format
- adds "Successfully cleared cache" with date and time in a paragraph with id "lastCleared"
*/
Then, write the series of comments below, but write them one at a time to allow GitHub Copilot to generate a code suggestion after each one. The final popup.js looked like this:
/*
This program is a Chrome Extension that clears browser cache.
Handle on button click:
- button with id "allHistory" that clears all cache history
- button with id "pastMonth" that clears cache history from the past month
- button with id "pastWeek" that clears cache history from the past week
- button with id "pastDay" that clears cache history from the past day
- button with id "pastHour" that clears cache history from the past hour
- button with id "pastMinute" that clears cache history from the past minute

Create function that
- converts dates and times into human-readable format
- adds "Successfully cleared cache" with date and time in a paragraph with id "lastCleared"
*/

// convert date and time into human-readable format
function convertDate(date) {
   let date = new Date(date);
   var options = { weekday: 'long', year: 'numeric', month: 'long', day: 'numeric' };
   return date.toLocaleDateString("en-US", options);
}

// add successfully cleared cache into paragraph with id "lastCleared"
function addCleared() {
   var p = document.getElementById("lastCleared");
   let date = new Date();
   p.innerHTML = "Successfully cleared cache " + convertDate(date);
}

// clear all cache history
document.getElementById("allHistory").addEventListener("click", function() {
   chrome.browsingData.removeCache({ "since": 0 }, function() {
       addCleared();
   });
});

// clear cache history from the past month
document.getElementById("pastMonth").addEventListener("click", function() {
   let date = new Date();
   date.setMonth(date.getMonth() - 1);
   chrome.browsingData.removeCache({ "since": date.getTime() }, function() {
       addCleared();
   });
});

// clear cache history from the past week
document.getElementById("pastWeek").addEventListener("click", function() {
   let date = new Date();
   date.setDate(date.getDate() - 7);
   chrome.browsingData.removeCache({ "since": date.getTime() }, function() {
       addCleared();
   });
});

// clear cache history from the past day
document.getElementById("pastDay").addEventListener("click", function() {
   let date = new Date();
   date.setDate(date.getDate() - 1);
   chrome.browsingData.removeCache({ "since": date.getTime() }, function() {
       addCleared();
   });
});

// clear cache history from the past hour
document.getElementById("pastHour").addEventListener("click", function() {
  let date = new Date();
   date.setHours(date.getHours() - 1);
   chrome.browsingData.removeCache({ "since": date.getTime() }, function() {
       addCleared();
   });
});

// clear cache history from the past minute
document.getElementById("pastMinute").addEventListener("click", function() {
  let date = new Date();
   date.setMinutes(date.getMinutes() - 1);
   chrome.browsingData.removeCache({ "since": date.getTime() }, function() {
       addCleared();
   });
});
GitHub Copilot actually generated the var keyword, which is outdated. So I changed that keyword to let.
7. Create the last file in your folder: style.css
Write a comment that describes the style you want for your extension. Then, type “body” and continue tabbing until GitHub Copilot suggests all the styles.
My final style.css looked like this:
/* Style the Chrome extension's popup to be wider and taller
Use accessible friendly colors and fonts
Make h1 elements legible
Highlight when buttons are hovered over
Highlight when buttons are clicked
Align buttons in a column and center them but space them out evenly
Make paragraph bold and legible
*/

body {
   background-color: #f1f1f1;
   font-family: Arial, Helvetica, sans-serif;
   font-size: 16px;
   color: #333;
   width: 400px;
   height: 400px;
}

h1 {
   font-size: 24px;
   color: #333;
   text-align: center;
}

button {
   background-color: #4CAF50;
   color: white;
   padding: 15px 32px;
   text-align: center;
   text-decoration: none;
   display: inline-block;
   font-size: 16px;
   margin: 4px 2px;
   cursor: pointer;
   border-radius: 8px;
}

button:hover {
   background-color: #45a049;
}

button:active {
   background-color: #3e8e41;
}

p {
   font-weight: bold;
   font-size: 18px;
   color: #333;
}
| For detailed, step-by-step instructions, check out my Chrome extension with GitHub Copilot repo. |
Three important lessons about learning and pair programming in the age of AI
- Generative AI reduces the fear of making mistakes. It can be daunting to learn a new language or framework, or start a new project. The fear of not knowing where to start—or making a mistake that could take hours to debug—can be a significant barrier to getting started. I’ve been a developer for over three years, but streaming while coding makes me nervous. I sometimes focus more on people watching me code and forget the actual logic. When I conversed with GitHub Copilot, I gained reassurance that I was going in the right direction and that helped me to stay motivated and confident during the stream.
-
Generative AI makes it easier to learn about new subjects, but it doesn’t replace the work of learning. GitHub Copilot didn’t magically write an entire Chrome extension for me. I had to experiment with different prompts, and ask questions to GitHub Copilot, ChatGPT, Google, and developers on my livestream. To put it in perspective, it took me about 1.5 hours to do steps 1 to 5 while streaming.
But if I hadn’t used GitHub Copilot, I would’ve had to write all this code by scratch or look it up in piecemeal searches. With the AI-generated code suggestions, I was able to jump right into review and troubleshooting, so a lot of my time and energy was focused on understanding how the code worked. I still had to put in the effort to learn an entirely new skill, but I was analyzing and evaluating code more often than I was trying to learn and then remember it.
-
Generative AI coding tools made it easier for me to collaborate with other developers. Developers who tuned into the livestream could understand my thought process because I had to tell GitHub Copilot what I wanted it to do. By clearly communicating my intentions with the AI pair programmer, I ended up communicating them more clearly with developers on my livestream, too. That made it easy for people tuning in to become my virtual pair programmers during my livestream.
Overall, working with GitHub Copilot made my thought process and workflow more transparent. Like I said earlier, it was actually a developer on my livestream who recommended a service worker file after noticing that GitHub Copilot didn’t include it in its suggested file structure. Once I confirmed in a chat conversation with GitHub Copilot and a Google search that I needed a service worker, I used GitHub Copilot to help me write one.
Take this with you
GitHub Copilot made me more confident with learning something new and collaborating with other developers. As I said before, live coding can be nerve-wracking. (I even get nervous even when I’m just pair programming with a coworker!) But GitHub Copilot’s real-time code suggestions and corrections created a safety net, allowing me to code more confidently—and quickly— in front of a live audience. Also, because I had to clearly communicate my intentions with the AI pair programmer, I was also communicating clearly with the developers who tuned into my livestream. This made it easy to virtually collaborate with them.
The real-time interaction with GitHub Copilot and the other developers helped with catching errors, learning coding suggestions, and reinforcing my own understanding and knowledge. The result was a high-quality codebase for a browser extension.
This project is a testament to the collaborative power of human-AI interaction. The experience underscored how GitHub Copilot can be a powerful tool in boosting confidence, facilitating learning, and fostering collaboration among developers.