Post Syndicated from Talks at Google original https://www.youtube.com/watch?v=LXWC_3aaZLk
Devi Brown | Cultivating Wellness at Work | Talks at Google
Post Syndicated from Talks at Google original https://www.youtube.com/watch?v=JscbYFeuZZY
What’s New in InsightVM and Nexpose: Q1 2023 in Review
Post Syndicated from Roshnee Mistry Shah original https://blog.rapid7.com/2023/03/31/whats-new-in-insightvm-and-nexpose-q1-2023-in-review/

In Q1, our team continued to focus on driving better customer outcomes with InsightVM and Nexpose by further improving efficiency and performance. While many of these updates are under the hood, you may have started to notice faster vulnerability checks available for the recent ETRs or an upgraded user interface for the console Admin page. Let’s take a look at some of the key updates in InsightVM and Nexpose from Q1.
[InsightVM and Nexpose] View expiration date for Scan Assistant digital certificates
Scan Assistant, a lightweight service deployed on the asset, leverages the Scan Engine and digital certificates to securely deliver the core benefits of authenticated scanning without the need to manage traditional account-based credentials.
Customers can now easily determine the validity of a Scan Assistant digital certificate by viewing the Expiration Date on the Shared Scan Credential Configuration page.

[InsightVM and Nexpose] A new look for the Console Administration page
We updated the user interface (UI) of the Console Administration page to facilitate a more intuitive and consistent user experience across InsightVM and the Insight Platform. You can even switch between light mode and dark mode for this page. This update is part of our ongoing Security Console experience transformation to enhance its usability and workflow—stay tuned for more updates!

[InsightVM and Nexpose] Checks for notable vulnerabilities
Rapid7’s Emergent Threat Response (ETR) program flagged multiple CVEs this quarter. InsightVM and Nexpose customers can assess their exposure to many of these CVEs with vulnerability checks, including:
- Oracle E-Business Suite CVE-2022-21587: Added to the CISA Known Exploited Vulnerabilities (KEV) catalog, this vulnerability affected a collection of Oracle enterprise applications and can lead to unauthenticated remote code execution. Part of our recurring coverage, learn more about the vulnerability and our response.
- VMware ESXi Servers CVE-2021-21974: VMware ESXi is used by enterprises to deploy and serve virtual computers. VMware ESXi servers worldwide were targeted by a ransomware that leveraged CVE-2021-21974. Part of our recurring coverage, learn more about the vulnerability and our response.
- ManageEngine CVE-2022-47966: ManageEngine offers a variety of enterprise IT management tools to manage IT operations. At least 24 on-premise ManageEngine products were impacted from the exploitation of CVE-2022-47966, a pre-authentication remote code execution (RCE) vulnerability. Learn more about the vulnerability and our response.
- Control Web Panel CVE-2022-44877: Control Web Panel is a popular free interface for managing web servers. In early January, security researcher Numan Türle published a proof-of-concept exploit for CVE-2022-44877, an unauthenticated remote code execution vulnerability in Control Web Panel (CWP, formerly known as CentOS Web Panel). Learn more about the vulnerability and our response.
- GoAnywhere MFT CVE-2023-0669: Fortra’s GoAnywhere MFT offers managed file transfer solutions for enterprises. CVE-2023-0669, an actively exploited zero-day vulnerability affected the on-premise instances of Fortra’s GoAnywhere MFT. Learn more about the vulnerability and our response.
- Jira Service Management Products CVE-2023-22501: Atlassian’s Jira Service Management Server and Data Center offerings were impacted by CVE-2023-22501, a critical broken authentication vulnerability that allows an attacker to impersonate another user and gain access to a Jira Service Management instance under certain circumstances. Learn more about the vulnerability and our response.
- ZK Framework CVE-2022-36537: The vulnerability in ZK Framework, an open-source Java framework for creating web applications, was actively exploited due to its use in ConnectWise R1Soft Server Backup Manager, and allowed remote code execution and the installation of malicious drivers that function as backdoors. Learn more about the vulnerability and our response.
Want to know how you can refine your existing vulnerability management practices and use InsightVM to improve your readiness for the next emergent threat? Join our upcoming webinar:
Up Next for InsightVM | Custom Policies with Agent-Based Policy Assessment
Guidelines from Center for Internet Security (CIS) and Security Technical Implementation Guides (STIG) are widely used industry benchmarks for configuration assessment. However, a benchmark or guideline as-is may not meet the unique needs of your business. Very soon (next quarter soon), you can start using Agent-Based Policy for custom policy assessment.
Simplify Service-to-Service Connectivity, Security, and Monitoring with Amazon VPC Lattice – Now Generally Available
Post Syndicated from Danilo Poccia original https://aws.amazon.com/blogs/aws/simplify-service-to-service-connectivity-security-and-monitoring-with-amazon-vpc-lattice-now-generally-available/
At AWS re:Invent 2022, we introduced in preview Amazon VPC Lattice, a new capability of Amazon Virtual Private Cloud (Amazon VPC) that gives you a consistent way to connect, secure, and monitor communication between your services. With VPC Lattice, you can define policies for network access, traffic management, and monitoring to connect compute services across instances, containers, and serverless applications.
Today, I am happy to share that VPC Lattice is now generally available. Compared to the preview, you have access to new capabilities:
- Services can use a custom domain name in addition to the domain name automatically generated by VPC Lattice. When using HTTPS, you can configure an SSL/TLS certificate that matches the custom domain name.
- You can deploy the open-source AWS Gateway API Controller to use VPC Lattice with a Kubernetes-native experience. It uses the Kubernetes Gateway API to let you connect services across multiple Kubernetes clusters and services running on EC2 instances, containers, and serverless functions.
- You can use an Application Load Balancer (ALB) or a Network Load Balancer (NLB) as a target for a service.
- The IP address target type now supports IPv6 connectivity.
Let’s see some of these new features in practice.
Using Amazon VPC Lattice for Service-to-Service Connectivity
In my previous post introducing VPC Lattice, I show how to create a service network, associate multiple VPCs and services, and configure target groups for EC2 instances and Lambda functions. There, I also show how to route traffic based on request characteristics and how to use weighted routing. Weighted routing is really handy for blue/green and canary-style deployments or for migrating from one compute platform to another.
Now, let’s see how to use VPC Lattice to allow the services of an e-commerce application to communicate with each other. For simplicity, I only consider four services:
- The
Orderservice, running as a Lambda function. - The
Inventoryservice, deployed as an Amazon Elastic Container Service (Amazon ECS) service in a dual-stack VPC supporting IPv6. - The
Deliveryservice, deployed as an ECS service using an ALB to distribute traffic to the service tasks. - The
Paymentservice, running on an EC2 instance.
First, I create a service network. The Order service needs to call the Inventory service (to check if an item is available for purchase), the Delivery service (to organize the delivery of the item), and the Payment service (to transfer the funds). The following diagram shows the service-to-service communication from the perspective of the service network.

These services run in different AWS accounts and multiple VPCs. VPC Lattice handles the complexity of setting up connectivity across VPC boundaries and permission across accounts so that service-to-service communication is as simple as an HTTP/HTTPS call.
The following diagram shows how the communication flows from an implementation point of view.

The Order service runs in a Lambda function connected to a VPC. Because all the VPCs in the diagram are associated with the service network, the Order service is able to call the other services (Inventory, Delivery, and Payment) even if they are deployed in different AWS accounts and in VPCs with overlapping IP addresses.
Using a Network Load Balancer (NLB) as Target
The Inventory service runs in a dual-stack VPC. It’s deployed as an ECS service with an NLB to distribute traffic to the tasks in the service. To get the IPv6 addresses of the NLB, I look for the network interfaces used by the NLB in the EC2 console.

When creating the target group for the Inventory service, under Basic configuration, I choose IP addresses as the target type. Then, I select IPv6 for the IP Address type.

In the next step, I enter the IPv6 addresses of the NLB as targets. After the target group is created, the health checks test the targets to see if they are responding as expected.

Using an Application Load Balancer (ALB) as Target
Using an ALB as a target is even easier. When creating a target group for the Delivery service, under Basic configuration, I choose the new Application Load Balancer target type.

I select the VPC in which to look for the ALB and choose the Protocol version.

In the next step, I choose Register now and select the ALB from the dropdown. I use the default port used by the target group. VPC Lattice does not provide additional health checks for ALBs. However, load balancers already have their own health checks configured.

Using Custom Domain Names for Services
To call these services, I use custom domain names. For example, when I create the Payment service in the VPC console, I choose to Specify a custom domain configuration, enter a Custom domain name, and select an SSL/TLS certificate for the HTTPS listener. The Custom SSL/TLS certificate dropdown shows available certificates from AWS Certificate Manager (ACM).

Securing Service-to-Service Communications
Now that the target groups have been created, let’s see how I can secure the way services communicate with each other. To implement zero-trust authentication and authorization, I use AWS Identity and Access Management (IAM). When creating a service, I select the AWS IAM as Auth type.

I select the Allow only authenticated access policy template so that requests to services need to be signed using Signature Version 4, the same signing protocol used by AWS APIs. In this way, requests between services are authenticated by their IAM credentials, and I don’t have to manage secrets to secure their communications.

Optionally, I can be more precise and use an auth policy that only gives access to some services or specific URL paths of a service. For example, I can apply the following auth policy to the Order service to give to the Lambda function these permissions:
- Read-only access (GET method) to the
Inventoryservice/stockURL path. - Full access (any HTTP method) to the
Deliveryservice/deliveryURL path.
{
    "Version": "2012-10-17",
    "Statement": [
        {
            "Effect": "Allow",
            "Principal": {
                "AWS": "<Order Service Lambda Function IAM Role ARN>"
            },
            "Action": "vpc-lattice-svcs:Invoke",
            "Resource": "<Inventory Service ARN>/stock",
            "Condition": {
                "StringEquals": {
                    "vpc-lattice-svcs:RequestMethod": "GET"
                }
            }
        },
        {
            "Effect": "Allow",
            "Principal": {
                "AWS": "<Order Service Lambda Function IAM Role ARN>"
            },
            "Action": "vpc-lattice-svcs:Invoke",
            "Resource": "<Delivery Service ARN>/delivery"
        }
    ]
}
Using VPC Lattice, I quickly configured the communication between the services of my e-commerce application, including security and monitoring. Now, I can focus on the business logic instead of managing how services communicate with each other.
Availability and Pricing
Amazon VPC Lattice is available today in the following AWS Regions: US East (Ohio), US East (N. Virginia), US West (Oregon), Asia Pacific (Singapore), Asia Pacific (Sydney), Asia Pacific (Tokyo), and Europe (Ireland).
With VPC Lattice, you pay for the time a service is provisioned, the amount of data transferred through each service, and the number of requests. There is no charge for the first 300,000 requests every hour, and you only pay for requests above this threshold. For more information, see VPC Lattice pricing.
We designed VPC Lattice to allow incremental opt-in over time. Each team in your organization can choose if and when to use VPC Lattice. Other applications can connect to VPC Lattice services using standard protocols such as HTTP and HTTPS. By using VPC Lattice, you can focus on your application logic and improve productivity and deployment flexibility with consistent support for instances, containers, and serverless computing.
Simplify the way you connect, secure, and monitor your services with VPC Lattice.
— Danilo
[$] An operation for filesystem tucking
Post Syndicated from original https://lwn.net/Articles/927491/
As a general rule, the purpose behind mounting a filesystem is to make that
filesystem’s contents visible to the system, or at least to the mount
namespace where that mount occurs. For similar reasons, it is unusual to
mount one filesystem on top of another, since that would cause the contents
of the over-mounted filesystem to be hidden. There are exceptions to
everything, though, and that extends to mounted filesystems; a
“tucking” mechanism proposed by Christian Brauner is designed to hide
mounted filesystems underneath other mounts — temporarily, at least.
Security updates for Friday
Post Syndicated from original https://lwn.net/Articles/928013/
Security updates have been issued by Debian (joblib, json-smart, libmicrohttpd, and xrdp), Fedora (thunderbird and xorg-x11-server-Xwayland), Mageia (dino, perl-Cpanel-JSON-XS, perl-Net-Server, snort, tigervnc/x11-server, and xapian), SUSE (curl, kernel, openssl-1_0_0, and shim), and Ubuntu (glusterfs, linux-gcp-4.15, musl, and xcftools).
Научни новини: агроволтаични системи, карти на мозъка и снимки на Космоса
Post Syndicated from Михаил Ангелов original https://www.toest.bg/nauchni-novini-agrovoltaichni-sistemi-karta-na-mozuka/
Агроволтаични системи

Слънчевите панели наред с вятърните генератори са един от ключовите начини за добиване на електричество от възобновяеми източници, но сред основните им недостатъци е мястото, което заемат. Често те са организирани в соларни ферми, разположени върху земя, която може да се използва за земеделие. Едно от възможните решения на това са агроволтаичните системи – панелите се поставят по-високо, давайки възможност под тях да се отглеждат различни култури.
Проблем при такъв тип системи е засенчването на растенията от панелите. Но при отглеждане на соя в соларна ферма в Италия намалението на добива не е било толкова значително. В зависимост от осветеността загубата е била между 8 и 13%, което е далеч под очакванията и изискванията, посочени в някои стандарти. Наред с добива са определени и някои важни параметри – височина на растенията, съдържание на хлорофил и листна площ. Този полеви експеримент е използван за валидиране на сложен компютърен модел, който може да симулира целия растежен период и да предвиди потенциалния добив.
Соята се смята за култура, която не търпи засенчване, но данните, налични към момента, са получени при условия, в които няма агроволтаична система. Това изследване показва нуждата от изпитването на растенията в реална среда, тъй като наличието на панели не е същото като засенчването при съвместно отглеждане на различни растителни видове.
В някои случаи засенчването дори може да се окаже полезно – в географски области със силно слънцегреене и малко валежи, каквито се наблюдават в части на Африка, агроволтаичните системи позволяват отглеждането на култури, за които прекалено силното слънце и прекомерната топлина са неблагоприятни. Осигурената сянка намалява и нуждата от вода, което допълнително улеснява фермерите.
Интересно решение са и полупрозрачните органични панели. За разлика от конвенционалните силициеви панели, в тях има един или няколко слоя органични вещества, които поглъщат светлина основно в ултравиолетовия и инфрачервения спектър, и така се пропуска видимата ѝ част. Един от недостатъците на тези панели е, че те се амортизират сравнително бързо, което налага да се подменят по-често.
Потенциално решение за това е описано в скорошна публикация в журнала Nature Sustainability. В структурата на панелите е добавен междинен слой от естествения антиоксидант глутатион, който се среща във всички висши живи организми. Той предпазва органичния фотоактивен слой от възникването на радикали, които съкращават живота му. В пилотното изследване е постигнато запазване на ефективността над 80% след 1000 часа работа.
Изпитано е и как панелите влияят на растения като броколи и пшеница, което е дало изненадващи резултати. В оранжерия, покрита с органични панели, растежът на културите е бил по-интензивен в сравнение с растежа в оранжерия със стъклен покрив. Авторите го обясняват с това, че панелът поглъща UV и инфрачервените лъчи, предпазвайки растенията от вредното влияние на първите и намалявайки затоплянето на оранжерията от вторите.
Интересно е, че освен за растенията този тип системи може да бъде полезен и за самите соларни панели. Тъй като топлината е един от основните фактори, които определят тяхната дълготрайност и ефективност, охлаждането им е особено важно, но все още няма технология, която да е напълно енергийно и икономически обоснована.
В скорошно изследване екип от Университета „Корнел“ показва, че повдигането на панелите на по-голяма височина и засяването на соя под тях може да е от помощ за охлаждането им. Подобно на италианските си колеги те са разработили модел за симулация на температурата на панелите в зависимост от растителната покривка под тях. В експеримента е установено, че при повдигане на панелите на 4 м над земната повърхност и засяване на соя под тях, температурата на фотоволтаиците спада с 10℃ през светлата част на деня в сравнение с тези, които са монтирани на 0,5 м над почва без растителност. Ефектът на охлаждане се дължи на два основни фактора, първият от които е промяна в отражателната способност (албедо) на почвата след засяване на културата. Вторият, играещ по-голяма роля, е евапотранспирацията, и по-специално транспирацията, която се осъществява от растенията. При този процес растенията отделят вода през надземните си части (основно листата), като по този начин създават отрицателен воден потенциал в тъканите си, което от своя страна им позволява да приемат вода през корените си.
Космос
Звездите на Волф-Райе са специфичен клас свръхгиганти, които имат сравнително кратък живот – няколко милиона години. Те се отличават с изключителна яркост и бързо преминаване към супернова, като в процеса отделят много голяма част от масата си.
Наскоро публикувана снимка от телескопа „Джеймс Уеб“ показва звездата WR 124 от съзвездието Стрела. Тя е около 30 пъти по-масивна от Слънцето и вече е загубила една трета от своята маса, като изхвърленият материал изстива при отдалечаването си от звездата, образувайки мъглявина от звезден прах, която се разширява със скорост от над 150 000 км/ч.
Тъй като мъглявината излъчва светлина основно в инфрачервената част от спектъра, наличието на детектори в инфрачервения спектър прави космическата обсерватория изключително важен инструмент за изучаването на подобен тип мъглявини и на процесите, протичащи в тях. Образуването на космически прах е въпрос, който активно вълнува астрономите, защото той е изключително важен за редица процеси във Вселената, включително образуването на по-сложни молекули, от които да се зароди живот.
Преди половин година астероидът Диморфос беше ударен от сондата DART на NASA, като основната цел на мисията бе да се проучи възможността за отклоняване на потенциални опасности за Земята. Той е с размер под 200 м и обикаля около четири пъти по-големия Дидим. След челния удар е отчетена бърза промяна в орбитите на двете тела.
Освен този непосредствен резултат от експеримента, за него продължават да се публикуват нови данни. С помощта на инструмента MUSE към Много големия телескоп (VLT) в Чили са проучени структурата и спектралното излъчване на изхвърлените при сблъсъка частици. Един от основните въпроси, на който са искали да отговорят учените, е дали в астероида се съдържа вода, тъй като повечето астероиди са съставени от каменисти частици, които не са в плътна структура. Въпреки това по повърхността на някои астероиди, например 24 Themis, е открита вода под формата на лед, като дори е възможно в сърцевината му да има резервоари. Това е интересно с оглед на хипотезата, че водата на Земята е резултат от сблъсъци на тела с високо водно съдържание в началните стадии от развитието ѝ.
За съжаление, Диморфос се е оказал сух – в получените спектри няма данни за вода или за органични молекули. Все пак учените са успели да проследят образуването на облака от изхвърлени частици и техния размер. Ударът е предизвикал изхвърлянето на почти 1000 тона материал, който под влияние на слънчевия натиск и гравитацията на Дидим се е оформил като опашка на двойната система, образувана от двата астероида.
Карта на мозъка
Човешкият мозък е сложна структура, в която милиарди неврони образуват трилиони връзки помежду си, позволявайки на отделните му части да комуникират една с друга. Тези своеобразни мрежи съхраняват нашите спомени, определят как възприемаме света, и изграждат нашата същност. Наличието на пълна схема на мозъка, т.нар. конектом, би помогнало много за цялостното ни разбиране на тези процеси. Заради това изграждането на такава схема е поле на изключително интензивна изследователска дейност.
Голямата плътност и сложност на човешкия мозък и на мозъците на другите гръбначни животни правят разплитането на невронната мрежа в тях изключително трудна задача. До момента са публикувани няколко конектома на сравнително прости организми с малък брой неврони, като нематода Caenorhabditis elegans, при който са малко над 300.
По тази причина публикуването на първата пълна карта на мозъка на насекомо с над 3000 неврона и 500 000 синапса е изключително вълнуващо. Въпреки че ларвата на Drosophila melanogaster е по-малка от оризово зърно, тя носи в себе си напълно развит мозък, който има паралели с човешкия: две полукълба, структура, наподобяваща мозъчния ствол, и издатък, аналогичен на гръбначния мозък, който контролира мускулите на насекомото.
Конектомът е резултат от съвместната работа на учени от три институции и над 12-годишно събиране и обработване на данни. За съставянето му мозъкът на ларвата е бил нарязан на множество тънки слоеве, които впоследствие са заснети с електронен микроскоп. След получаването на изображенията, връзките между невроните е трябвало да бъдат проследени и описани. Тези данни са дадени на друг екип, който с помощта на специално разработен от него софтуер е съставил картата и е определил типа на невроните на основата на техните връзки.
Едно от първите неща, които стават видни, е наличието на различни видове връзки между невроните. До момента се считаше, че повечето са свързани чрез своите аксони (своеобразната опашка) с дендритите (късите израстъци от ядрото им) на други неврони, като по този начин предават информация един на друг.


Въпреки че връзките между два аксона или два дендрита са били известни на учените, от този конектом се вижда, че те не са рядко срещани и са почти половината от всички връзки в мозъка. Същевременно някои са били свързани и с няколко различни връзки – това не беше известно на учените досега.
Изследването ще помогне и за определяне на вида на невроните, като до момента това се правеше основно на базата на тяхното групиране и форма. Софтуерът, използван за анализ на този конектом, е позволил разделянето на невроните според връзките, които изграждат, дефинирайки 93 отделни вида клетки в мозъка на ларвата. Проследени са и връзките между двете полукълба на мозъка, което до момента е било обект само на повърхностни наблюдения.
Особено голям интерес представлява и откритието, че невроните образуват структури, които се срещат и при компютърните невронни мрежи – многослойни, циклични, минаващи пряко през няколко функционални слоя на мозъка. Това се наблюдава най-вече в областите, отговорни за учене и памет, които имат голямо сходство с невронните мрежи с обратна връзка (рекурентни, RNNs), използвани за задачи като машинен превод, разпознаване и синтез на глас. По-доброто разбиране за биологичните системи ще даде възможност за вникване и подобряване на синтетичните им аналози. Ако симулирането дори на прост мозък като този на дрозофилата стане възможно, това ще бъде огромен скок както във възможностите на изкуствения интелект, така и в неговата енергийна ефективност, тъй като това е фактор, който не бива да се пренебрегва.
Въпреки че мозъците на гръбначните животни са много по-сложни, тази карта има потенциала за значителен принос в редица научни области. Освен при изкуствения интелект, поради структурната сходност и редица общи гени с бозайниците, може да допринесе пряко за разбирането ни за процесите при човека, както и да служи за модел на някои неврологични заболявания.
Заглавно изображение: звездата WR 124. Източник: NASA, ESA, CSA, STScI, Webb ERO Production Team
The Complete LGR Woodgrain 486 Saga
Post Syndicated from LGR original https://www.youtube.com/watch?v=D9U03YbPGN4
Privacy Implications of Web 3.0 and Darknets
Post Syndicated from original https://www.darknet.org.uk/2023/03/privacy-implications-of-web-3-0-and-darknets/
The evolution of the internet has been rapid over the years and has impacted the privacy implications of Web 3.0 and Darknets, from Web 1.0 to Web 2.0, and now to Web 3.0. Web 3.0, also known as the decentralized web, is a network of interconnected and distributed systems that allow users to interact with […]
Creating scalable architectures with AWS IoT Greengrass stream manager
Post Syndicated from Neil Mehta original https://aws.amazon.com/blogs/architecture/creating-scalable-architectures-with-aws-iot-greengrass-stream-manager/
Designing a scalable, global, real-time, distributed system to process millions of messages from a variety of critical devices can complicate architectures. Collecting large data streams or image recognition from the edge also requires scalable solutions.
AWS IoT Core is designed to handle large numbers of Internet of things (IoT) devices sending a few messages per second. However, when IoT devices send large numbers of messages per second and processing occurs at the edge, managing large data streams is challenging. Further, data that is buffered or processed at the edge can increase latency.
This post describes how to create a scalable IoT architecture with AWS IoT Greengrass stream manager that can handle thousands of critical messages per second from a variety of IoT devices.
Relaying critical messages from high-throughput IoT devices
Let’s explore an example. Consider the architecture in Figure 1, where you have two types of IoT devices sending messages to AWS IoT Core. One set of IoT devices sends thousands of messages per second while the other set of devices sends tens of messages per second.
The IoT devices that are sending thousands of messages per second contain critical data that cannot be lost and must be processed at the edge. The IoT devices sending tens of messages per second are of less importance.

Figure 1. IoT devices sending messages to AWS IoT Core
In considering this architecture, the critical IoT devices sending thousands of messages per second take the following path:
- IoT devices send data to an AWS IoT Greengrass component for processing with a Quality of Service (QoS) of 0.
- The AWS IoT Greengrass component processes the data and sends it to the AWS IoT Greengrass message broker.
- AWS IoT Greengrass message broker relays the data to AWS IoT Core with a QoS of 1.
- AWS IoT Core sends the data to Amazon Kinesis Data Streams for further processing.
In contrast, the IoT devices that send a few messages per second take the following path:
- IoT devices send data to the AWS IoT Greengrass message broker.
- The AWS IoT Greengrass message broker relays the data to AWS IoT Core.
- AWS IoT Core sends the data to Kinesis Data Streams for further processing.
Due to the critical nature of the messages being sent, the AWS IoT Greengrass message broker is configured to send messages to the AWS IoT Core with a QoS of 1. However, when you configure QoS to 1, the AWS IoT Greengrass message broker has to wait for an acknowledgement (ACK) before sending more data.
As you add more IoT devices, many choose to batch the messages before sending them to AWS IoT Core. This can be a good strategy when you are dealing with many IoT devices that send a small number of messages per second. But when you are adding IoT devices that send thousands of messages per second, the time waiting for an ACK can add latency and cause inconsistencies when reporting the data downstream.
This is because the AWS IoT Greengrass message broker is capable of sending 100 messages to AWS IoT Core before waiting for an ACK when QoS is set to 1. As a result, scaling this architecture to handle additional IoT devices can become challenging.
For more information about the AWS IoT Greengrass message broker’s limits, refer to the AWS IoT Core message broker and protocol limits and quotas section of the AWS General Reference Guide.
AWS IoT Greengrass stream manager for speed and reliability
To scale this type of architecture, you can use a pre-built AWS IoT Greengrass component called AWS IoT Greengrass stream manager to bypass the Greengrass message broker and AWS IoT Core to send your data directly to AWS IoT Analytics, AWS IoT SiteWise, Amazon Kinesis, or Amazon Simple Storage Service (Amazon S3).
For example, consider the earlier scenario where one set of IoT devices is sending thousands of critical messages per second and another set is sending data of less importance.
Instead, you can use AWS IoT Greengrass stream manager to create an architecture that can easily and reliably send large amounts of data from the edge directly to Kinesis, as in Figure 2.

Figure 2. AWS IoT Greengrass stream manager sending data directly to Kinesis
As opposed to the Figure 1 configuration, the critical IoT devices that send thousands of messages per second can now take the following path:
- Critical IoT devices send data to an AWS IoT Greengrass component for processing.
- The AWS IoT Greengrass component processes the data and sends it to AWS IoT Core stream manager.
- AWS IoT Greengrass stream manager sends the data directly Amazon Kinesis Data Streams.
Note that the IoT devices sending a few messages per second can also be sent to AWS IoT Greengrass stream manager at a lower priority. You are still using AWS IoT Core, but it is no longer the main data path. By continuing to use AWS IoT Core, you can benefit from its control plane features such as managing updates, certificates, and policies. However, AWS IoT Core’s data plane features—like Rules Engine—are no longer used in this architecture, which can help reduce costs. If you choose to bypass the AWS IoT Greengrass message broker and use AWS IoT Core stream manager, any components that you have built must be moved so that processing occurs at the edge.
In the architecture in Figure 2, AWS IoT Greengrass stream manager is being used to bypass the main data path away from the AWS IoT Greengrass message broker and AWS IoT Core. Bypassing these services reduces the latency in Figure 1 caused by the AWS IoT Greengrass message broker waiting for an ACK from AWS IoT Core.
AWS IoT Greengrass stream manager can handle thousands of messages per second so you can:
- Reliably scale your architecture
- Create multiple data paths to send both critical and non-critical data to AWS IoT Core stream manager while still leveraging AWS IoT Core control plane features
- Prioritize your critical data paths to have specific IoT devices take higher priority
- Create configurations to handle situations where you have IoT devices with limited or intermittent connectivity. (For example, you can create configurations to use local storage or memory to cache your data when internet connectivity is lost, and then flush data when an ACK is received from the destination.)
All of these features can help you reduce latency, costs, data inconsistencies, and the potential loss of critical data. They also provide a mechanism to scale the number of devices that your architecture can reliably handle.
Get started with stream manager by using the AWS IoT Greengrass Core SDK or the AWS IoT console.
Conclusion
In this blog post, we discussed how to create a scalable IoT architecture that can handle thousands of critical messages per second from a variety of IoT devices. Incorporating AWS IoT Greengrass stream manager into your architecture can help reduce latency, data inconsistencies, and the potential loss of critical data by providing a way to bypass AWS IoT Core and send large amounts of data efficiently and reliably.
Upgrading one of the oldest components in Cloudflare’s software stack
Post Syndicated from Maciej Lechowski original https://blog.cloudflare.com/upgrading-one-of-the-oldest-components-in-cloudflare-software-stack/


Cloudflare serves a huge amount of traffic: 45 million HTTP requests per second on average (as of 2023; 61 million at peak) from more than 285 cities in over 100 countries. What inevitably happens with that kind of scale is that software will be pushed to its limits. As we grew, one of the problems we faced was related to deploying our code. Sometimes, a release would be delayed because of inadequate hardware resources on our servers. Buying more and more hardware is expensive and there are limits to e.g. how much memory we can realistically have on a server. In this article, we explain how we optimised our software and its release process so that no additional resources are needed.
In order to handle traffic, each of our servers runs a set of specialised proxies. Historically, they were based on NGINX, but increasingly they include services created in Rust. Out of our proxy applications, FL (Front Line) is the oldest and still has a broad set of responsibilities.
At its core, it’s one of the last uses of NGINX at Cloudflare. It contains a large amount of business logic that runs many Cloudflare products, using a variety of Lua and Rust libraries. As a result, it consumes a large amount of system resources: up to 50-60 GiB of RAM. As FL grew, it became more and more difficult to release it. The upgrade mechanism requires double the memory (which sometimes is not available) than at runtime. This was causing delays in releases. We have now improved the release procedure of FL, and in effect, removed the need for additional memory during the release process, improving its speed and performance.
Architecture
To accomplish all of its work, each FL instance runs many workers (individual processes). By design, individual processes handle requests while the master process controls them and makes sure they stay up. This allows NGINX to handle more traffic by adding more workers. We take advantage of this architecture.
The number of workers depends on the numbers of total CPU cores present. It’s typically equal to half of the CPU cores available, e.g. on a 128-core CPU we use 64 FL workers.
So far so good, what’s the problem then?
We aim to deploy code in a way that’s transparent to our customers. We want to continue serving requests without interruptions. In practice, this means briefly running both versions of FL at the same time during the upgrade, so that we can flawlessly transition from one version to another. As soon as the new instance is up and running, we begin to shut down the old one, giving it some time to finish its work. In the end, only the new version is left running. NGINX implements this procedure and FL makes use of it.
After a new version of FL is installed on a server, the upgrade procedure starts. NGINX’s implementation revolves around communicating with the master process using signals. The upgrade process starts by sending the USR2 signal which will start the new master process and its workers.
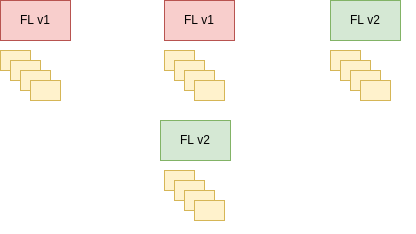
At that point, as can be seen below, both versions will be running and processing requests. The unfortunate side effect of this is the memory footprint has been doubled.
  PID  PPID COMMAND
33126     1 nginx: master process /usr/local/nginx/sbin/nginx
33134 33126 nginx: worker process (nginx)
33135 33126 nginx: worker process (nginx)
33136 33126 nginx: worker process (nginx)
36264 33126 nginx: master process /usr/local/nginx/sbin/nginx
36265 36264 nginx: worker process (nginx)
36266 36264 nginx: worker process (nginx)
36267 36264 nginx: worker process (nginx)
Then, the WINCH signal will be sent to the master process which will then ask its workers to gracefully shut down. Eventually, they will all quit, leaving just the original master process running (which can be shut down with the QUIT signal). The successful outcome of this will leave just the new instance running, which will look similar to this:
  PID  PPID COMMAND
36264     1 nginx: master process /usr/local/nginx/sbin/nginx
36265 36264 nginx: worker process (nginx)
36266 36264 nginx: worker process (nginx)
36267 36264 nginx: worker process (nginx)
The standard NGINX upgrade mechanism is visualised in this diagram:
It’s also clearly visible in the memory usage graph below (notice the large bump during the upgrade).
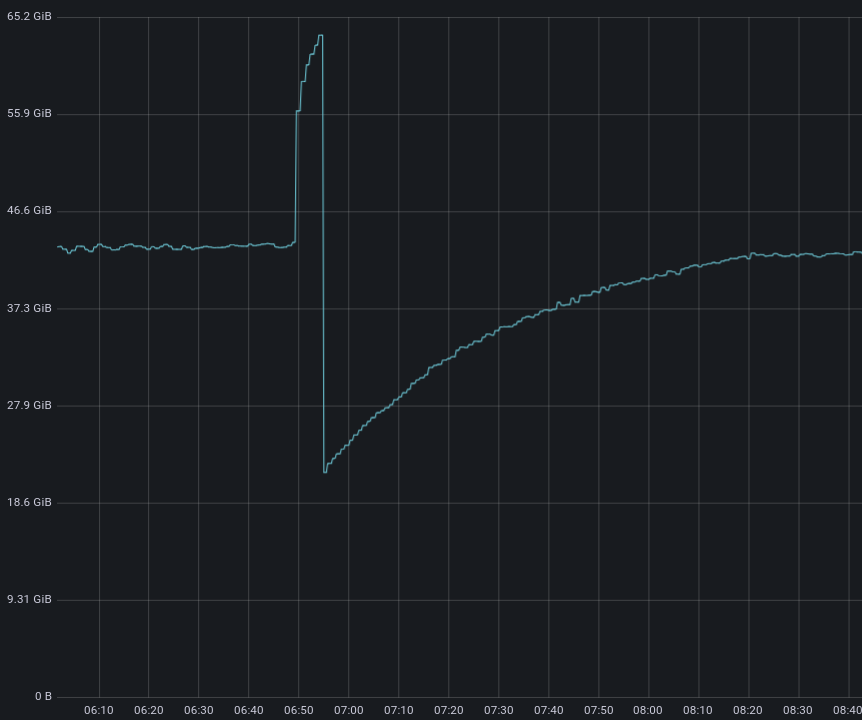
The mechanism outlined above has both versions running at the same time for a while. When both sets of workers are running, they are still sharing the same sockets, so all of them accept requests. As the release progresses, ‘old’ workers stop listening and accepting new requests (at that point only the new workers accept new requests). As we release new code multiple times per week, this process is effectively doubling up our memory requirements. At our scale, it’s easy to see how multiplying this event by the number of servers we operate results in an immense waste of memory resources.
In addition, sometimes servers would take hours to upgrade (a concern especially when we need to release something quickly), as we are waiting to have enough memory available to kick off the reload action.
New upgrade mechanism
We solved this problem by modifying NGINX’s method for upgrading executable. Here’s how it works.
The crux of the problem is that NGINX treats the entire instance (master + workers) as one. When upgrading, we need to start all the workers whilst all the previous ones are still running. Considering the number of workers we use and how heavy they are, this is not sustainable.
So, instead, we modified NGINX to be able to control individual workers. Rather than starting and stopping them all at once, we can do so by selecting them individually. To accomplish this, the master process and workers understand additional signals compared to the ones NGINX uses. The actual mechanism to accomplish this in NGINX is nearly the same as when handling workers in bulk. However, there’s a crucial difference.
Typically, NGINX’s master process ensures that the right number of workers is actually running (per configuration). If any of them crashes, it will be restarted. This is good, but it doesn’t work for our new upgrade mechanism because when we need to shut down a single worker, we don’t want the NGINX master process to think that a worker has crashed and needs to be restarted. So we introduced a signal to disable that behaviour in NGINX while we’re shutting down a single process.
Step by step
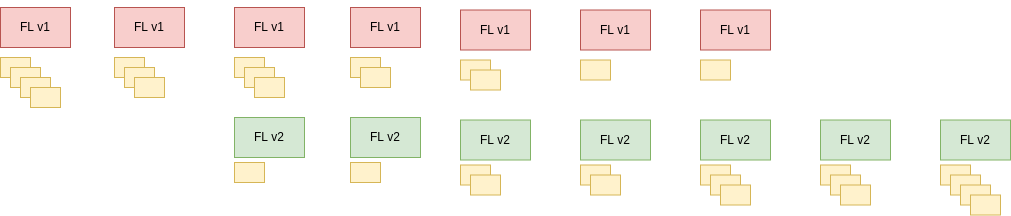
Our improved mechanism handles each worker individually. Here are the steps:
- At the beginning, we have an instance of FL running 64 workers.
- Disable the feature to automatically restart workers which exit.
- Shut down a worker from the first (old) instance of FL. We’re down to 63 workers.
- Create a new instance of FL but only with a single worker. We’re back to 64 workers but including one from the new version.
- Re-enable the feature to automatically restart worker processes which exit.
- We continue this pattern of shutting down a worker from an older instance and creating a new one to replace it. This can be visualised in the diagram below.
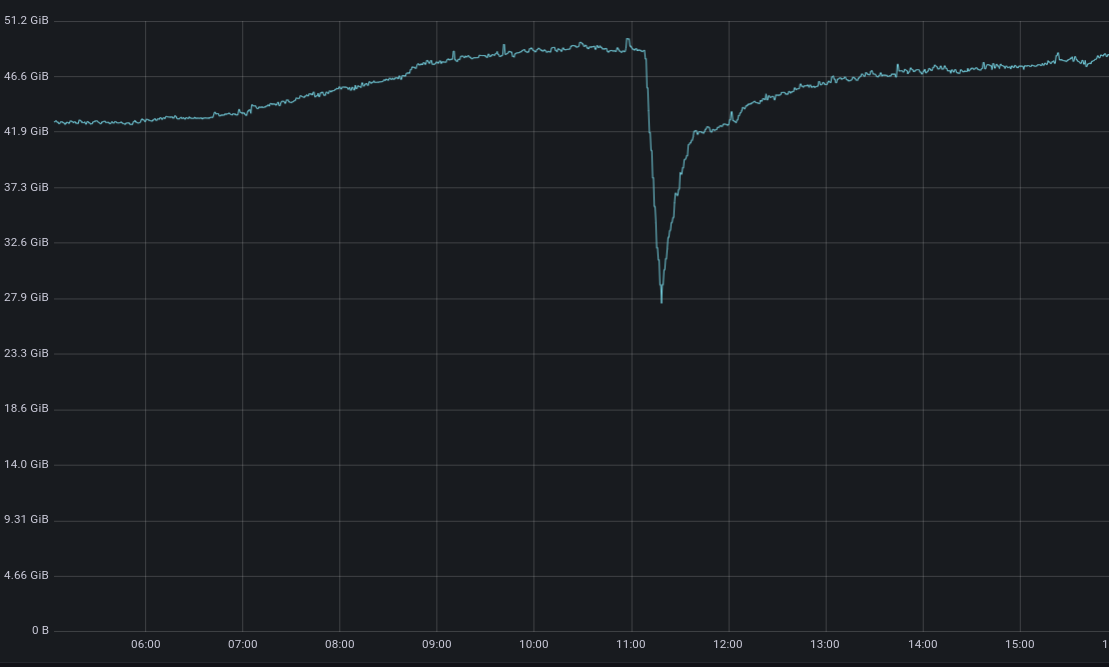
We can observe our new mechanism in action in the graph below. Thanks to our new procedure, our use of memory remains stable during the release.
But why do we begin by shutting down a worker belonging to an older instance (v1)? This turns out to be important.
Worker-CPU pinning
During this workflow, we also had to take care of CPU pinning. FL workers on our servers are pinned to CPU cores with one process occupying one CPU core to help us distribute resources more efficiently. If we start a new worker first, it will share the CPU core with another one for a brief amount of time. This will make one CPU overloaded compared to other ones running FL, impacting the latency for requests served. That’s why we start by freeing up a CPU core which then can be taken over by a new worker rather than starting by creating a new worker.
For the same reason, pinning of worker processes to cores must be maintained throughout the whole operation. At no point, we can have two different workers sharing a CPU core. We make sure this is the case by executing the whole procedure in the same order every time.
We start from CPU core 1 (or whichever is the first one used by FL) and do the following:
- Shut down a worker that’s running there.
- Create a new worker. NGINX will pin it to the CPU core we have freed up in the previous step.
After doing that for all workers, we end up with a new set of workers which are correctly pinned to their CPU cores.
Conclusion
At Cloudflare, we need to release new software multiple times per day across our fleet. Standard upgrade mechanism used by NGINX is not suitable at our scale. For this reason, we customised the process to avoid increasing the amount of memory needed to release FL. This enabled us to safely ship code whenever it’s needed, everywhere. The custom upgrade mechanism enables us to release a large application such as FL reliably regardless of how much memory we have available on an edge server. We showed that it’s possible to extend NGINX and its built-in upgrade mechanism to accommodate the unique requirements of Cloudflare.
If you enjoy solving challenging application infrastructure problems and want to help maintain the busiest web server in the world, we’re hiring!
The 1957 Cosa Nostra "Apalachin Meeting."
Post Syndicated from The History Guy: History Deserves to Be Remembered original https://www.youtube.com/watch?v=_oSCmu4dmXU
За бога, българи, разгневете се!
Post Syndicated from Емилия Милчева original https://www.toest.bg/za-boga-bulgari-razgnevete-se/

Музо, възпей оня гибелен гняв на Ахила Пелеев,
който донесе безбройни беди на войските ахейски,
прати в подземното царство душите на много герои…
(Из Първа песен, „Илиада“, Омир)
В Омировата „Илиада“ гневът е гибелен и опасен, поразява като чумата, но в демокрацията гневът на избирателите отрезвява политиците.
Разгневената на пенсионната реформа на президента Макрон Франция може и да не успее да я отмени, но със сигурност ще накара Макрон да преосмисли действията си и да избере друга стратегия за приемането ѝ. Президентът кара своя втори и последен 5-годишен мандат, който изтича през 2027 г., но нестихващите протести, в които се включват стотици хиляди, може да провалят амбициите му да бъде запомнен като един от големите реформатори на Петата република – „независимо от цената“, както пише Le Figaro.
Разгневените през зимата на 1997 г. български избиратели вразумиха БСП, която върна мандата за съставяне на правителство, и предизвикаха предсрочни избори, спечелени от Обединените демократични сили, които излъчиха правителството на Иван Костов. Този гняв отвори пътя на България към европейската нормалност, след като 38-мият парламент прие Декларацията за национално съгласие, стратегическа цел в която беше пълноправното членство в ЕС и НАТО. (Макар че молбата, с която България кандидатства в Европейския съюз, е подадена още през декември 1995 г. от премиера социалист Жан Виденов.)
Стратегическият избор
Има ли днес избиратели, които да се разгневят на хипокрити? Стратегическият избор, изстрадан с преживяната от милиони българи национална катастрофа, е застрашен от действията на президента Радев и подопечното му правителство. Не поради опасността България да напусне тези съюзи, а поради заплахата да скъса мостовете към същността и ценностите, които ги определят като общности. И това даже е по-голямата злина.
Според бившия премиер Иван Костов това, че България не предостави безвъзмездна помощ на Украйна, а продава оръжие през посредници, не създава голямо доверие в българските евроатлантически ценности. С коментара си, че Радев говори като руски агент на влияние, определяйки като „войнолюбци“ именно евроатлантическата общност, Костов предизвика президента, който му отговори с познатото от сатанизирането на Костов клише, че е разпродал България на безценица.
По БНР тази седмица политологът и преподавател в НБУ проф. Димитър Вацов също беше директен, че „през служебните правителства имаме едно русофилско управление в България“, а президентът се оказва най-вредната фигура в българския политически живот.
„Радев си позволява да се представя за суверен, заемайки позиция срещу решението на Народното събрание и шикалкавейки. Начинът, по който остро критикува политическите партии, руинира доверието в цялата политическа система – когато чуем такава агресивна реторика, състояща се от лъжи“, коментира Вацов.
Президентът обаче използва необорими аргументи – провалът на партиите да съставят правителство и пети поред парламентарни избори за две години.
„Политическите партии, а не президентската институция, отдавна излязоха извън нормите на българската Конституция със системния си отказ да поемат отговорност и да съставят правителство“, заяви Радев, подчертавайки, че президентът го прави, когато партиите не искат или не могат, или ги е страх от това.
През пролуките
Ерозията на доверие в парламентарната република няма да трасира пътя към широко рекламираното, включително чрез референдум, президентско управление и авторитарен режим ала Путин. Но отваря множество пролуки, през които навлиза несъгласие, враждебност, недоверие към общностите, към които България избра да се присъедини.
За тази стратегическа – но не за България, а за неприятелски сили – цел в употреба се пускат всякакви измислици и полуистини. Например за разрешени от ЕС насекоми на прах в храната, което предизвиква рак заради хитина, или за влагане на човешка коса в хляба, пак утвърдено от ЕС. Но това са най-безобидните фейкове, макар че и те нанасят трайни поражения.
Разиграва се отново картата за ремонт на старите руски изтребители МиГ-29 и доставка на нови двигатели, тъй като, по думите на президента, имало само две оферти за заместваща платформа на МиГ-29 и „цената няма да се хареса на народните представители“. По време на втория кабинет на ГЕРБ и Бойко Борисов бяха направени опити да се блокира ремонтът на шест двигателя МиГ-29 в Полша, а не в Русия. Парламентарното мнозинство гласува за ремонт в Полша, за да се ограничи зависимостта от страни извън НАТО, докато за Русия настояваха БСП и „Атака“. Москва реагира остро, заплашвайки България с дело. Задейства се обаче българската прокуратура срещу министъра на отбраната – Николай Ненчев (Реформаторски блок), че не е изпълнил договора с руската корпорация „МиГ“, но в крайна сметка той беше окончателно оправдан.
Сега, благодарение на служебната власт, България е принудена да остане със старата руска военна техника. Причината е в протакането и нежеланието на служебната власт да реализира триъгълни сделки – съветско въоръжение за Украйна срещу получаване на западно от същия вид от партньори от НАТО. Оправданията са различни – техниката е стара или пък България е закъсняла.
Хипокрити
Като че ли целият служебен кабинет е впрегнал сили да насажда враждебност към Украйна – като се почне от протестите на зърнарите милионери срещу евтиното украинско зърно, което им подбива цените, до оръжието. Също и за изпращане на български военни в Украйна, за което военният министър Димитър Стоянов се пъчи как „български войник няма да стъпи там, докато служебното правителство е на власт“ – а всъщност никой и не е искал. Като цяло, Стоянов – президентски съветник, преди да оглави Министерството на отбраната – смята, че „България е приключила с военната помощ за Украйна и правителството е изпълнило решенията на последното Народно събрание“.
Вече няма съмнение, че служебният кабинет не възнамерява да изпълни решението на 48-мия парламент за оказване на военна помощ на Украйна, защото го приема като еднократен акт, а не като процес. Президентът, от своя страна, не спира да повтаря, че България няма да изпраща оръжия или боеприпаси за Украйна – независимо че на заседанието на Европейския съвет (23–24 март) е подкрепил противната на тази „яснота“ позиция. Заключенията, подкрепени с консенсус от европейските лидери, са категорични – т. 7 гласи:
… Като взема предвид интересите на всички държави членки в областта на сигурността и отбраната, Европейският съвет приветства постигнатото в Съвета споразумение спешно да се доставят боеприпаси за комплекси „земя-земя“ и боеприпаси за артилерийски системи за Украйна, а при поискване – и ракети, включително чрез съвместно възлагане на обществени поръчки и мобилизиране на подходящо финансиране, в т.ч. чрез Европейския механизъм за подкрепа на мира, с цел да се осигурят 1 милион броя боеприпаси за артилерийски системи чрез съвместни усилия в рамките на следващите дванадесет месеца, без да се засяга специфичният характер на политиката за сигурност и отбрана на определени държави членки.
Дори и България да не се включи в общото закупуване на боеприпаси за Украйна, тя участва в Европейския механизъм за подкрепа на мира, където внася и съответна вноска.
На 2 април ще стане ясно гневът или омерзението ще вземат връх. Кандидатите и избирателите да не забравят, че гневът може да докара на власт и чудовища.
Силата на медиацията
Post Syndicated from Владимир Вълков original https://www.toest.bg/silata-na-mediatsiyata/

Кой не се чувства поне малко неловко при работата по неговите собствени социални конфликти, ако знае, че там, на тази маса, присъства експерт по този специален въпрос.¹ (проф. Нилс Кристи)
Какво е медиация?
Едва ли някой ще оспори, че замесените в проблема най-добре знаят какво е важно за тях, и могат да намерят най-добрия начин за разрешаването му. На практика обаче нещата не се случват от само себе си. Имаме спор с някой близък, съсед, работодател и всякакъв друг човек, с когото имаме някакво отношение и не можем да се разберем. Оставаме с впечатление, че той, тя или те не ни чуват. Ние също изпитваме напрежение, когато ги видим или отворим спорната тема. Същевременно обаче темата е важна за нас, а нашият интерес може да бъде адекватно посрещнат само със съдействието на другата страна в спора.
Медиацията ни помага да разговаряме пълноценно. Медиаторът е специално обучен човек, който осигурява възможност на спорещите да се чуят един друг и заедно да търсят решение на своя проблем. Затова може да определим медиацията като способ за подпомогнато разрешаване не само на спора, но и на провокиралия го проблем.
Процедурата по медиация е доброволна. Само от нас зависи дали, как и докога да участваме в нея.
Медиацията е и поверителна. Страните и медиаторът лично се задължават да не разкриват нищо от казаното без изричното съгласие на споделилия информацията. Медиаторът не може и да бъде разпитван за чутото без изричното съгласие на страната в процедурата, поверила му тази информация. Тайната може да бъде разказана само в предвидени от закона случаи и под контрола на орган на власт, натоварен да осигури защита при извършено престъпление или за опазване на обществения ред, ако съществува непосредствена опасност за физическо или психическо насилие над някого, застрашен е интересът на дете или това се налага за правилното разбиране на споразумението в процеса на неговото прилагане.
Кога медиацията (не) работи?
Поначало медиация е приложима при всеки спор, който касае обещано ни от закона благо и страните по спора могат сами да постигнат решение. Тази процедура е неприложима, ако нормативен акт предвижда особен ред за постигане на споразумение.
Разбира се, медиацията не е панацея. Понеже решението се основава на постигнато съгласие, важно е да държим сметка за спецификата във взаимоотношенията ни. Дори и спорът да позволява наше общо решение, постигането му в значителна степен зависи от нивото на емоционалното напрежение. Когато то е достигнало до неподлежащи на контрол нива – у нас самите или у другата страна, – необходима е специална и индивидуална психологическа подкрепа, каквато утвърдената в България медиация не предлага. Затова е важно да прибегнем към процедура по медиация колкото може по-скоро, след като сме установили, че емоцията препятства ползотворния разговор.
Важно е също така да се отбележи, че дори и да не постигнем споразумение в процедура по медиация, прякото ни ангажиране с проблема и самият процес на търсене на неговото разрешение осигуряват допълнителни, непосилни за съдебния процес ползи. Участници в процедурата в Центъра за спогодби и медиация към Софийския районен съд и Софийския градски съд споделят, че макар и да не са постигнали споразумение, разговорът е довел до намаляване на емоционалното напрежение помежду им, подобряване на комуникацията или разрешаване на спорове по някои факти от значение за крайното решение. Този ефект позволява на страните да погледнат по различен начин дори и висящ съдебен процес. Овладяната емоция позволява концентрация на вниманието върху възможното според закона.
Медиацията е приложима дори и когато съдебният спор вече е приключил. Съдебното решение слага точка на спора дали проблемът съществува. Когато съдебното решение определя за дължимо определено поведение – ответникът да направи нещо, да даде или да плати, – правоимащият може да се обърне към съдебен изпълнител, който да осигури изпълнението според предписан в закона ред. Понякога обаче това не е възможно. Законът не освобождава длъжника от отговорност, когато няма пари. Той е длъжен да осигури пари, за да плати дължимото. Това обаче изисква време. Медиацията може да помогне и в такава ситуация, като страните договорят нещо различно, което решава друг актуален интерес за кредитора и е по възможностите на длъжника.
Даденото предписание в съдебното решение далеч не е достатъчно и при семейни спорове на плоскостта на отношенията (например разпределяне на родителската отговорност след раздяла на родителите, регламентиране на режима на лични отношения с детето или между детето и неговите баба и дядо). Примерите от практиката показват, че медиацията може да утвърди и заздрави отношенията.
Медиация или исков процес – какво да изберем?
Тъй като медиацията не е панацея, краткият отговор е: зависи. Както от естеството на спора, така и от редица други фактори, относими към пряко въвлечените в конфликта, които често се нуждаят от трезва преценка, каквато, попаднали в спиралата на конфликта, не сме в състояние да осигурим.
Важно е да се отбележи, че медиацията намира приложение дори и в ситуации, при които разговорът с другата страна изглежда невъзможен. Добрата новина е, че собствената ни представа по този въпрос не е меродавна. Нуждаем се от страничен поглед. Винаги може да се обърнем към медиатор и той да ни ориентира дали конкретният случай е подходящ за процедура по медиация. Практиката показва, че съдебни спорове, дори и силно емоционално натоварени, могат да преминат през медиация и да приключат със споразумение. Затова след като необходимата индивидуална подкрепа бъде получена своевременно, се открива пътят към медиацията.
Смятам представения под заглавието цитат от статията на проф. Нилс Кристи за красноречив пример за нагласата, с която поверяваме значим за нас проблем другиму с очакване да получи разрешение. Понякога това се налага, но когато имаме възможност за избор, важно е да отчитаме спецификите на двете процедури, за да вземем информирано решение коя да предпочетем.

Обикновено знаем какво искаме, но невинаги сме наясно дали имаме потребност от него. Същевременно опасността да загубим желаното интуитивно оприличава човека отсреща на преграда, което логично води до впрягане на внимание и сили, за да я преодолеем. Ако по една или друга причина не можем, използваме всяка възможност, за да му докажем, че не е прав. От друга страна, когато сме длъжни на някого и по една или друга причина отказваме да го признаем, правим всичко възможно, за да избегнем отговорност. Тези стратегии ни гарантират характерното за съдебния процес противопоставяне, каквото възниква и при преките преговори, ако се стремим да се наложим.
Когато преговорите с другата страна не водят до очаквания резултат или просто тя не откликва на нашата покана за разговор при неизпълнение, законът предписва правила за постигане на обещаното от него. Ако разчитаме на сила, за да наложим определено решение обаче, било то и обещано от закона, държим да докажем, че сме прави, цялото ни внимание бива съсредоточено върху миналото. Усилията ни да възродим представата за случилото се, за да убедим този, от когото зависи решението, допълнително нагнетява напрежение. Колкото повече затруднения срещаме в тази насока, толкова повече се фокусираме върху битката в отстояване на собствената си позиция. В такава ситуация губим чувствителност към чуждата гледна точка, а съществува и опасност да загубим представа за реалността.
Дори и правото да се окаже на наша страна, признаването му не е достатъчно, за да получим желаното. То продължава да зависи от другата страна. Ако сме на страната на длъжника, вероятността да претърпим принуда ни мотивира да търсим начин да се спасим, включително и чрез омаловажаване на проблема. Дори и да избегнем принудата (ако не ни хванат), не можем да се спасим от съда на собствената си съвест. Усещането, че сме длъжни на някого, продължава да тежи. От друга страна, и собственото ни щастие е под въпрос, ако е за чужда сметка – изпълнението на обещаното ни от закона по една или друга причина се оказва твърде обременяващо за длъжника.
Когато търсим решение на проблема и желаем да постигнем разбирателство, медиацията е на наше разположение. В процедурата по медиация невъзможното на пръв поглед става възможно, защото медиаторът следи вниманието на страните да се фокусира върху техните потребности – всяка страна да осмисли важното за нея, и то към момента. Потребностите са универсални, което ги прави и лесно разпознаваеми, дори и да не засягат нас самите. Те са и индивидуални, което пък изключва конкуренцията. Идентифицирането, споделянето и зачитането им отвежда спора на качествено ново ниво. Медиаторът е в състояние да осигури този ефект.
Вниманието на медиатора като страничен наблюдател на процеса е съсредоточено върху ефективната комуникация между страните. Добрият медиатор знае как да ни освободи от примката на емоцията, без това да стане за сметка на отсрещната страна. Разтоварени от бремето на емоцията, откриваме пространство за разума. Медиаторът направлява този процес, като подпомага всяка страна да заяви еднозначно важното за нея, но и да чуе споделеното от другата страна. Характерно за потребностите е също, че често могат да бъдат посрещнати по различни начини, което от своя страна е реален стимул за коопериране на усилията при намиране на приложимо в случая решение.
Доколкото решението зависи само от нас, не се нуждаем да убеждаваме никого. Същевременно осигурената обратна връзка в процедурата по медиация ни дава реална представа за действителната ситуация. Съсредоточавайки вниманието си върху бъдещето, някак естествено възникват и най-различни варианти за изход от ситуацията. Дори когато такива липсват за конкретната ни потребност, провокирала актуалния спор, процедурата по медиация предоставя възможност да посрещнем някоя друга своя актуална потребност. Затова и вариантите за изход от спор в процедура по медиация са практически неизброими. Затова и само при медиацията са възможни решения „печеля–печелиш“. Освен това взетото решение с наше участие гарантира и неговата изпълняемост. От една страна, то бива съобразено с наличните ни ресурси, а от друга, личното ни обещание, провокирано и от посрещане на непосредствена наша потребност, е допълнителен стимул да изпълним обещаното.
В обобщение смятам, че осъзнатата и поета отговорност обогатява, но бъде ли наложена – тежи и наранява. От нас зависи дали ще допринесем за разрешаването на проблема по удачен за нас начин, или ще се подложим на риска да търпим принуда.
1 Макар и тезата да е развита в контекста на различна процедура – възстановително правосъдие, концепцията е обща: овластяване и подкрепа на участниците в конфликт да поемат неговото управление.
BOXX APEXX S3 Overview An Intel Core i9 and NVIDIA RTX 6000 Ada Workstation
Post Syndicated from Peter Liu original https://www.servethehome.com/boxx-apexx-s3-overview-an-intel-core-i9-and-nvidia-rtx-6000-ada-workstation-pny-asrock/
As a fun piece, we wanted to show off the BOXX APEX S3, an Intel Core i9 platform we are using to test the NVIDIA RTX 6000 Ada edition GPU
The post BOXX APEXX S3 Overview An Intel Core i9 and NVIDIA RTX 6000 Ada Workstation appeared first on ServeTheHome.
Evolution of quality at Grab
Post Syndicated from Grab Tech original https://engineering.grab.com/evolution-of-quality
To achieve our vision of becoming the leading superapp in Southeast Asia, we constantly need to balance development velocity with maintaining the high quality of the Grab app. Like most tech companies, we started out with the traditional software development lifecycle (SDLC) but as our app evolved, we soon noticed several challenges like high feature bugs and production issues.
In this article, we dive deeper into our quality improvement journey that officially began in 2019, the challenges we faced along the way, and where we stand as of 2022.
Background
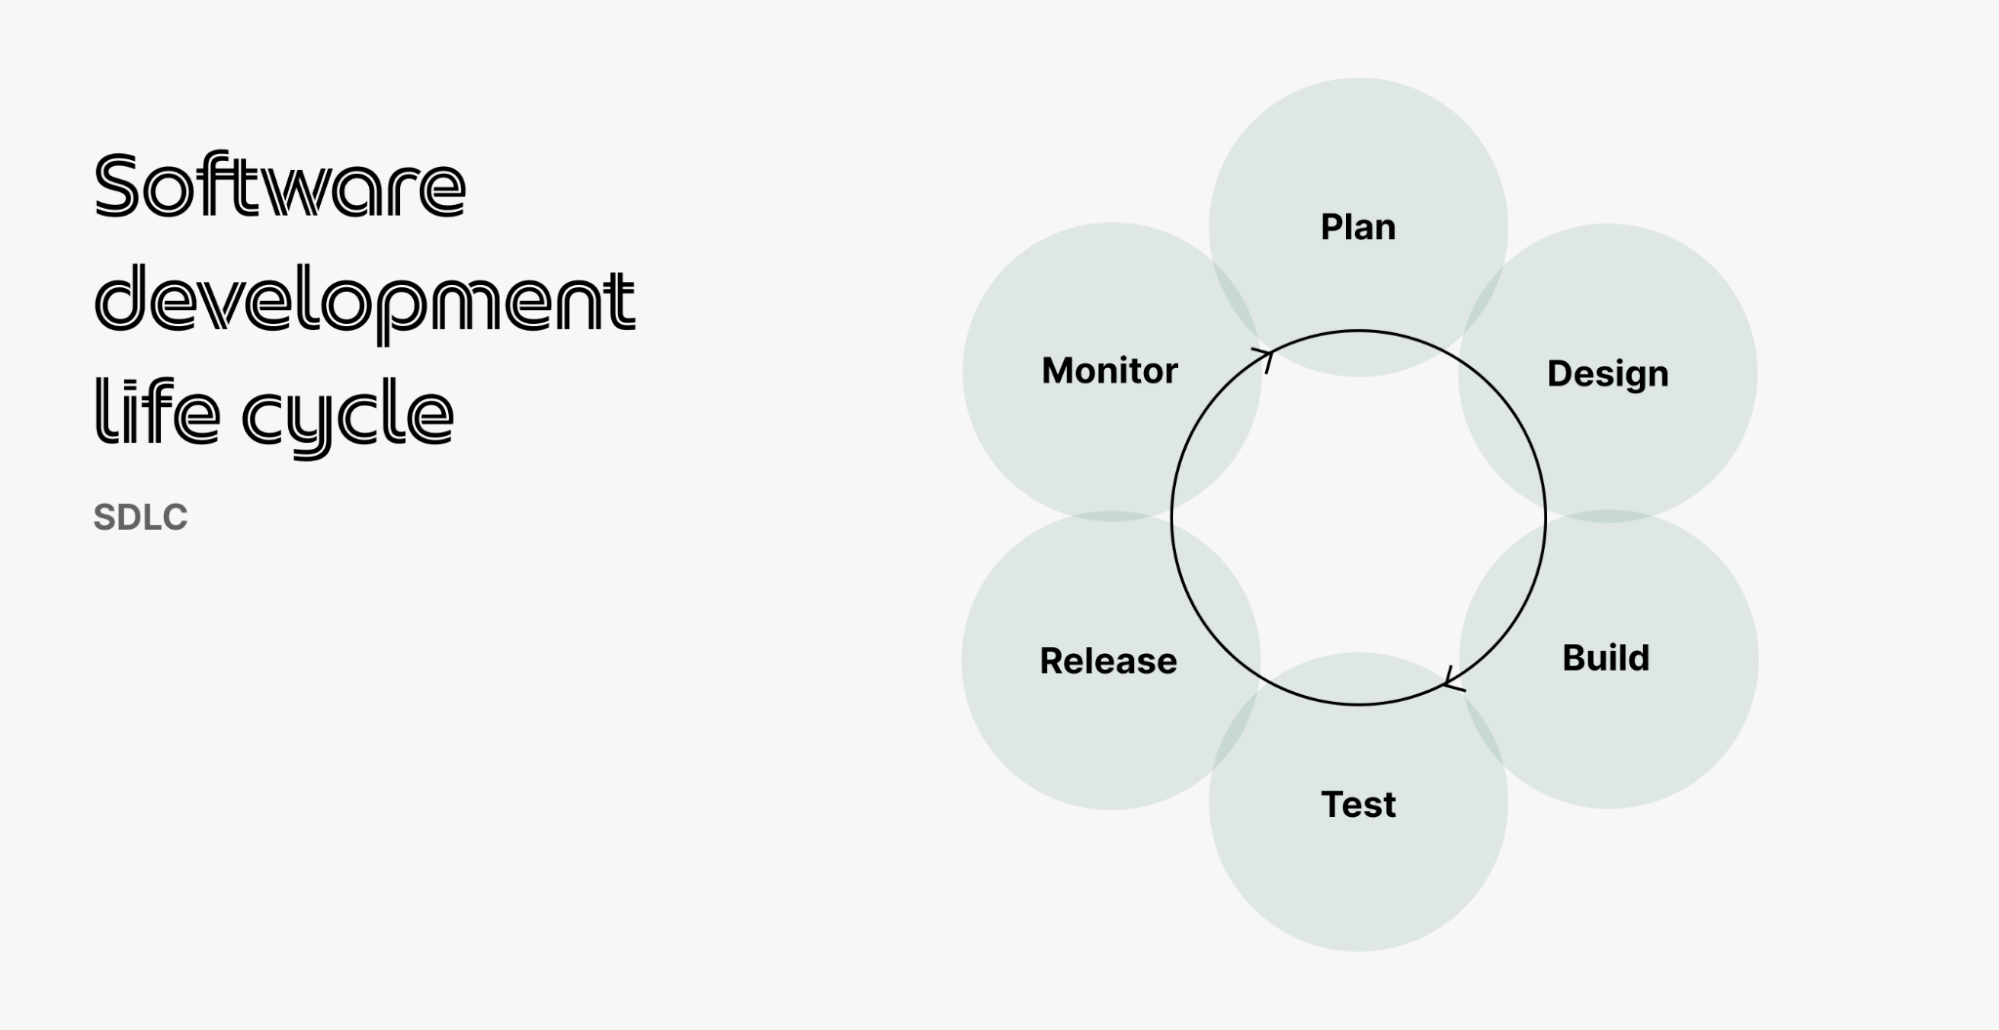
When Grab first started in 2012, we were using the Agile SDLC (Figure 1) across all teams and features. This meant that every new feature went through the entire process and was only released to app distribution platforms (PlayStore or AppStore) after the quality assurance (QA) team manually tested and signed off on it.
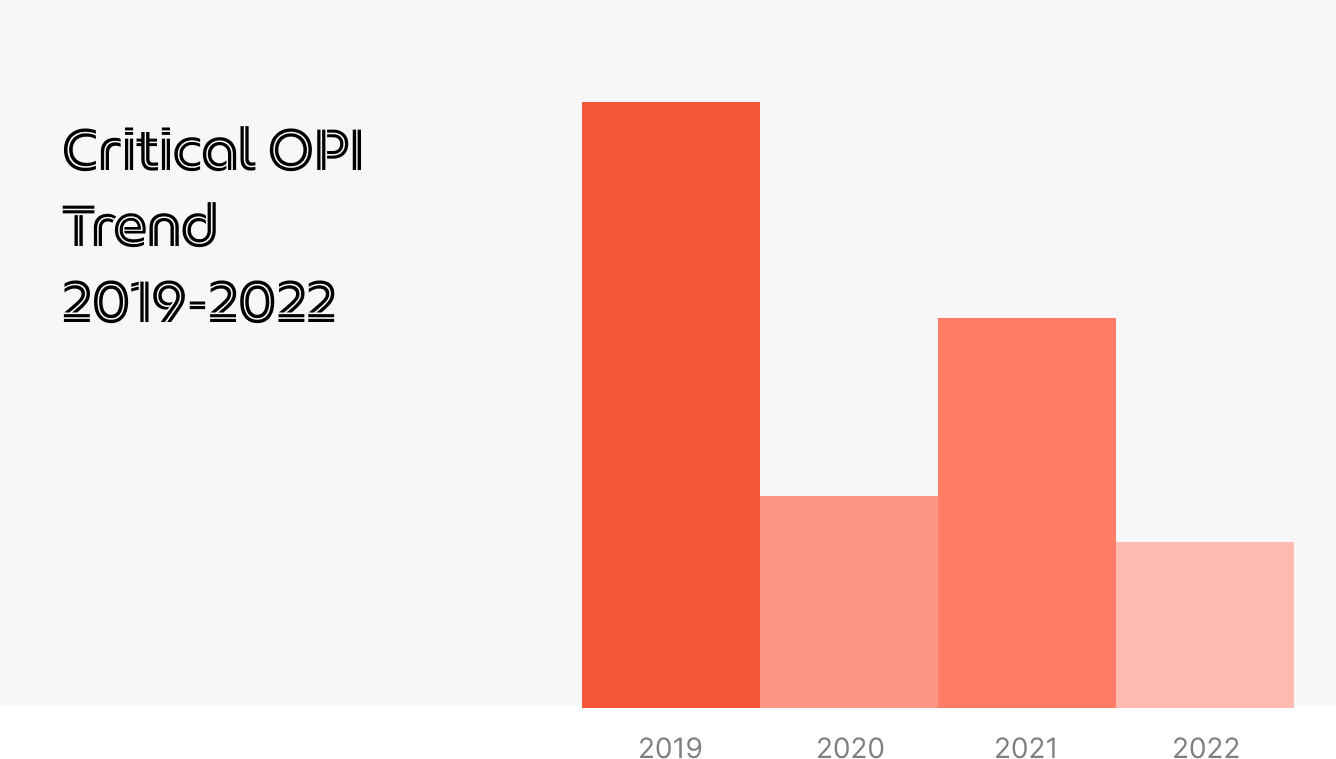
Over time, we discovered that feature testing took longer, with more bugs being reported and impact areas that needed to be tested. This was the same for regression testing as QA engineers had to manually test each feature in the app before a release. Despite the best efforts of our QA teams, there were still many major and critical production issues reported on our app – the highest numbers were in 2019 (Figure 2).
This surge in production issues and feature bugs was directly impacting our users’ experience on our app. To directly address the high production issues and slow testing process, we changed our testing strategy and adopted shift-left testing.
Solution
Shift-left testing is an approach that brings testing forward to the early phases of software development. This means testing can start as early as the planning and design phases.
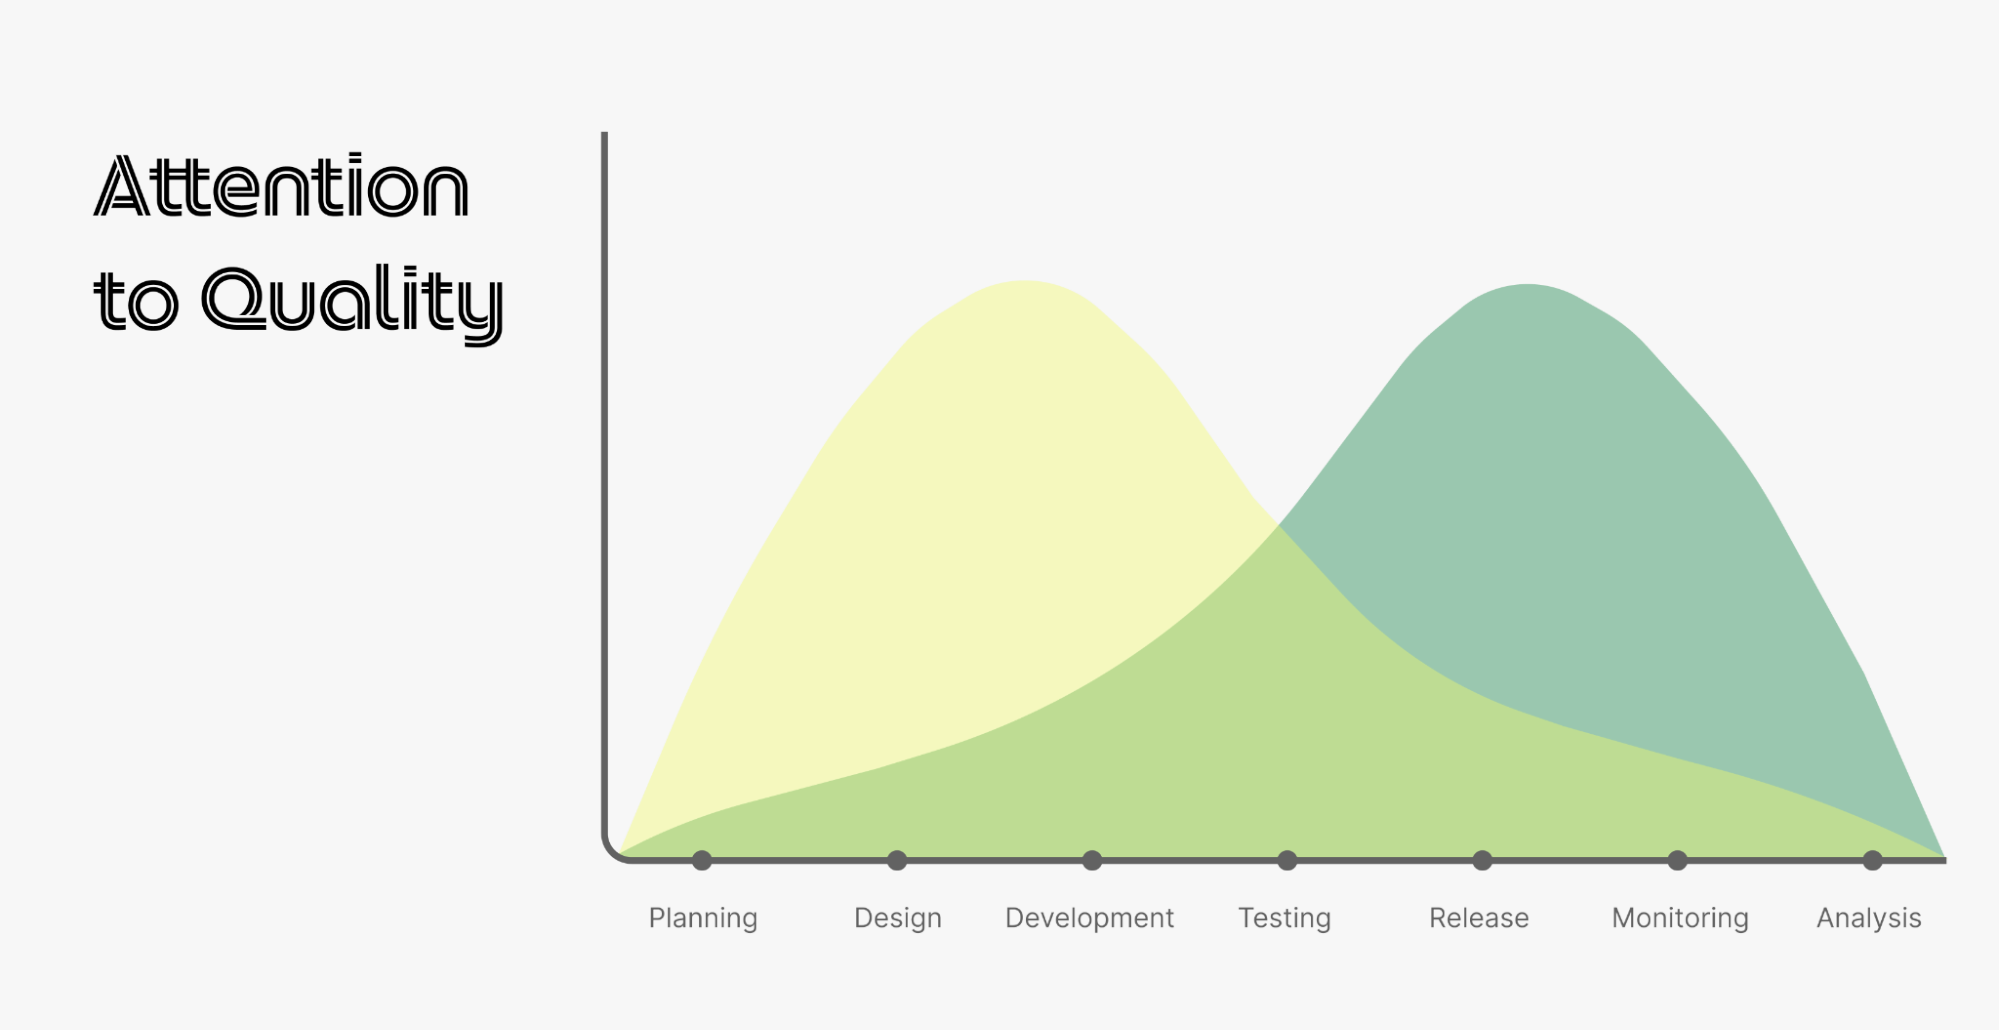
By adopting shift-left testing, engineering teams at Grab are able to proactively prevent possible defect leakage in the early stages of testing, directly addressing our users’ concerns without delaying delivery times.
With shift-left testing, we made three significant changes to our SDLC:
- Software engineers conduct acceptance testing
- Incorporate Definition of Ready (DoR) and Definition of Done (DoD)
- Balanced testing strategy
Let’s dive deeper into how we implemented each change, the challenges, and learnings we gained along the way.
Software engineers conduct acceptance testing
Acceptance testing determines whether a feature satisfies the defined acceptance criteria, which helps the team evaluate if the feature fulfills our consumers’ needs. Typically, acceptance testing is done after development. But our QA engineers still discovered many bugs and the cost of fixing bugs at this stage is more expensive and time-consuming. We also realised that the most common root causes of bugs were associated with insufficient requirements, vague details, or missing test cases.
With shift-left testing, QA engineers start writing test cases before development starts and these acceptance tests will be executed by the software engineers during development. Writing acceptance tests early helps identify potential gaps in the requirements before development begins. It also prevents possible bugs and streamlines the testing process as engineers can find and fix bugs even before the testing phase. This is because they can execute the test cases directly during the development stage.
On top of that, QA and Product managers also made Given/When/Then (GWT) the standard for acceptance criteria and test cases, making them easier for all stakeholders to understand.
| Step by Step style | GWT format |
|---|---|
|
Given user opens the app And user navigates to the home feed When the user taps on the merchant entry point card Then the user should see the merchant’s landing page |
By enabling software engineers to conduct acceptance testing, we minimised back-and-forth discussions within the team regarding bug fixes and also, influenced a significant shift in perspective – quality is everyone’s responsibility.
Another key aspect of shift-left testing is for teams to agree on a standard of quality in earlier stages of the SDLC. To do that, we started incorporating Definition of Ready (DoR) and Definition of Done (DoD) in our tasks.
Incorporate Definition of Ready (DoR) and Definition of Done (DoD)
As mentioned, quality checks can be done before development even begins and can start as early as backlog grooming and sprint planning. The team needs to agree on a standard for work products such as requirements, design, engineering solutions, and test cases. Having this alignment helps reduce the possibility of unclear requirements or misunderstandings that may lead to re-work or a low-quality feature.
To enforce consistent quality of work products, everyone in the team should have access to these products and should follow DoRs and DoDs as standards in completing their tasks.
- DoR: Explicit criteria that an epic, user story, or task must meet before it can be accepted into an upcoming sprint.
- DoD: List of criteria to fulfill before we can mark the epic, user story, or task complete, or the entry or exit criteria for each story state transitions.
Including DoRs and DoDs have proven to improve delivery pace and quality. One of the first teams to adopt this observed significant improvements in their delivery speed and app quality – consistently delivering over 90% of task commitments, minimising technical debt, and reducing manual testing times.
Unfortunately, having these two changes alone were not sufficient – testing was still manually intensive and time consuming. To ease the load on our QA engineers, we needed to develop a balanced testing strategy.
Balanced testing strategy
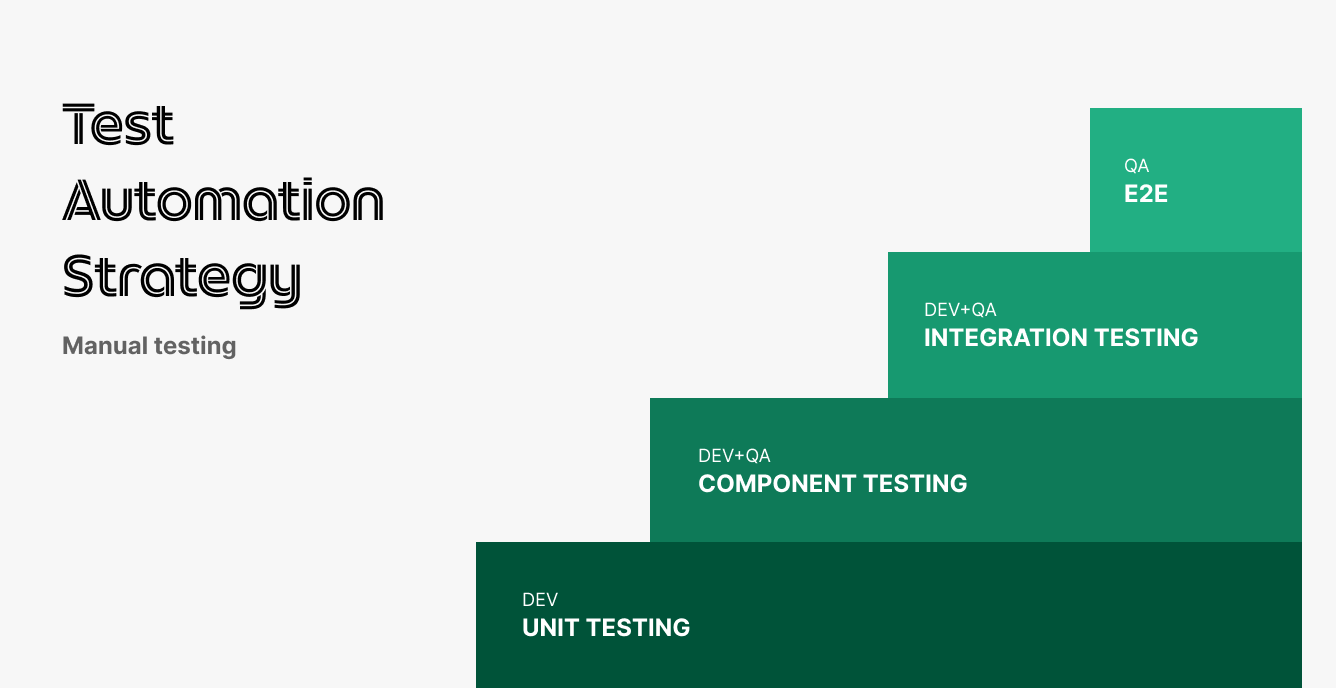
Our initial automation strategy only included unit testing, but we have since enhanced our testing strategy to be more balanced.
- Unit testing
- UI component testing
- Backend integration testing
- End-to-End (E2E) testing
Simply having good coverage in one layer does not guarantee good quality of an app or new feature. It is important for teams to test vigorously with different types of testing to ensure that we cover all possible scenarios before a release.
As you already know, unit tests are written and executed by software engineers during the development phases. Let’s look at what the remaining three layers mean.
UI component testing
This type of testing focuses on individual components within the application and is useful for testing specific use cases of a service or feature. To reduce manual effort from QA engineers, teams started exploring automation and introduced a mobile testing framework for component testing.
This UI component testing framework used mocked API responses to test screens and interactions on the elements. These UI component tests were automatically executed whenever the pipeline was run, which helped to reduce manual regression efforts. With shift-left testing, we also revised the DoD for new features to include at least 70% coverage of UI component tests.
Backend integration testing
Backend integration testing is especially important if your application regularly interacts with backend services, much like the Grab app. This means we need to ensure the quality and stability of these backend services. Since Grab started its journey toward becoming a superapp, more teams started performing backend integration tests like API integration tests.
Our backend integration tests also covered positive and negative test cases to determine the happy and unhappy paths. At the moment, majority of Grab teams have complete test coverage for happy path use cases and are continuously improving coverage for other use cases.
End-to-End (E2E) testing
E2E tests are important because they simulate the entire user experience from start to end, ensuring that the system works as expected. We started exploring E2E testing frameworks, from as early as 2015, to automate tests for critical services like logging in and booking a ride.
But as Grab introduced more services, off-the-shelf solutions were no longer a viable option, as we noticed issues like automation limitations and increased test flakiness. We needed a framework that is compatible with existing processes, stable enough to reduce flakiness, scalable, and easy to learn.
With this criteria in mind, our QA engineering teams built an internal E2E framework that could make API calls, test different account-based scenarios, and provide many other features. Multiple pilot teams have started implementing tests with the E2E framework, which has helped to reduce regression efforts. We are continuously improving the framework by adding new capabilities to cover more test scenarios.
Now that we’ve covered all the changes we implemented with shift-left testing, let’s take a look at how this changed our SDLC.
Impact
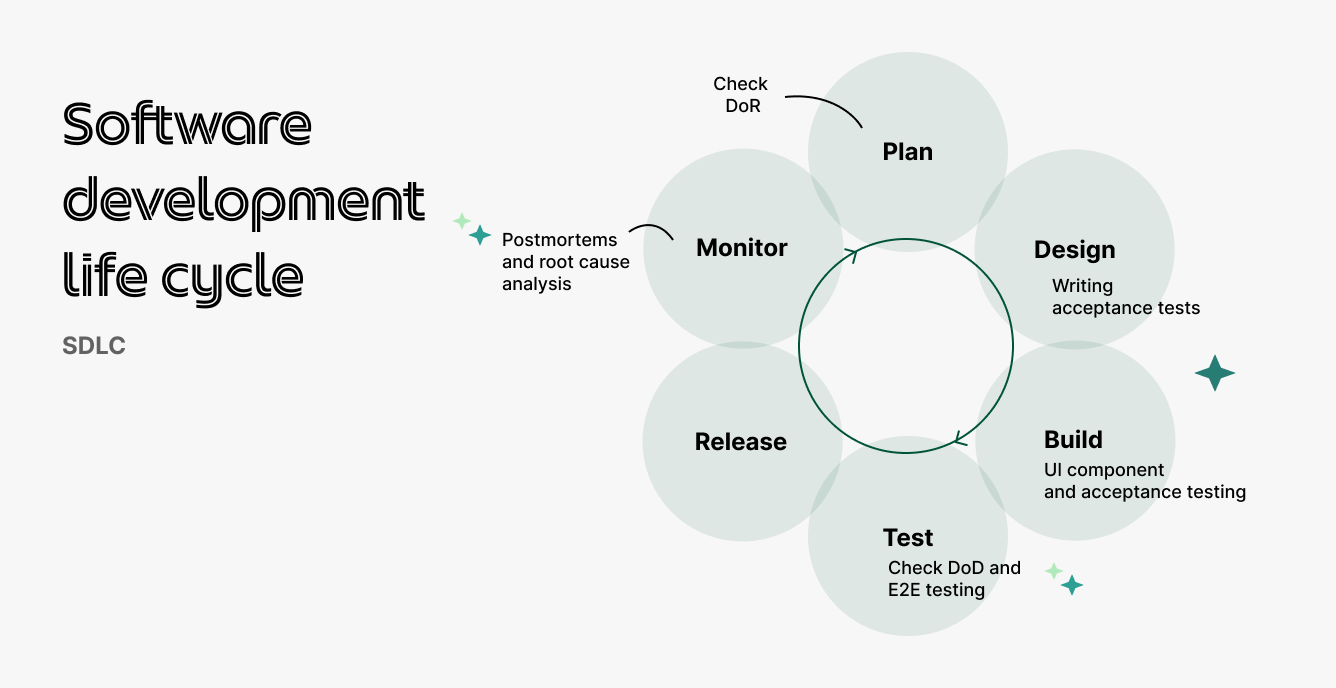
Since the implementation of shift-left testing, we have improved our app quality without compromising our project delivery pace. Compared to 2019, we observed the following improvements within the Grab superapp in 2022:
- Production issues with “Major and Critical” severity bugs found in production were reduced by 60%
- Bugs found in development phase with “Major and Critical” severity were reduced by 40%
What’s next?
Through this journey, we recognise that there’s no such thing as a bug-free app – no matter how much we test, production issues still happen occasionally. To minimise the occurrence of bugs, we’re regularly conducting root cause analyses and writing postmortem reports for production incidents. These allow us to retrospect with other teams and come up with corrective actions and prevention plans. Through these continuous learnings and improvements, we can continue to shape the future of the Grab superapp.
Special thanks to Sori Han for designing the images in this article.
Join us
Grab is the leading superapp platform in Southeast Asia, providing everyday services that matter to consumers. More than just a ride-hailing and food delivery app, Grab offers a wide range of on-demand services in the region, including mobility, food, package and grocery delivery services, mobile payments, and financial services across 428 cities in eight countries.
Powered by technology and driven by heart, our mission is to drive Southeast Asia forward by creating economic empowerment for everyone. If this mission speaks to you, join our team today!
Towed Message
Post Syndicated from original https://xkcd.com/2757/
Russian Cyberwarfare Documents Leaked
Post Syndicated from Bruce Schneier original https://www.schneier.com/blog/archives/2023/03/russian-cyberwarfare-documents-leaked.html
Now this is interesting:
Thousands of pages of secret documents reveal how Vulkan’s engineers have worked for Russian military and intelligence agencies to support hacking operations, train operatives before attacks on national infrastructure, spread disinformation and control sections of the internet.
The company’s work is linked to the federal security service or FSB, the domestic spy agency; the operational and intelligence divisions of the armed forces, known as the GOU and GRU; and the SVR, Russia’s foreign intelligence organisation.
Lots more at the link.
The documents are in Russian, so it will be a while before we get translations.
EDITED TO ADD (4/1): More information.
Amazon GuardDuty Now Supports Amazon EKS Runtime Monitoring
Post Syndicated from Channy Yun original https://aws.amazon.com/blogs/aws/amazon-guardduty-now-supports-amazon-eks-runtime-monitoring/
Since Amazon GuardDuty launched in 2017, GuardDuty has been capable of analyzing tens of billions of events per minute across multiple AWS data sources, such as AWS CloudTrail event logs, Amazon Virtual Private Cloud (Amazon VPC) Flow Logs, and DNS query logs, Amazon Simple Storage Service (Amazon S3) data plane events, Amazon Elastic Kubernetes Service (Amazon EKS) audit logs, and Amazon Relational Database Service (Amazon RDS) login events to protect your AWS accounts and resources.
In 2020, GuardDuty added Amazon S3 protection to continuously monitor and profile S3 data access events and configurations to detect suspicious activities in Amazon S3. Last year, GuardDuty launched Amazon EKS protection to monitor control plane activity by analyzing Kubernetes audit logs from existing and new EKS clusters in your accounts, Amazon EBS malware protection to scan malicious files residing on an EC2 instance or container workload using EBS volumes, and Amazon RDS protection to identify potential threats to data stored in Amazon Aurora databases—recently generally available.
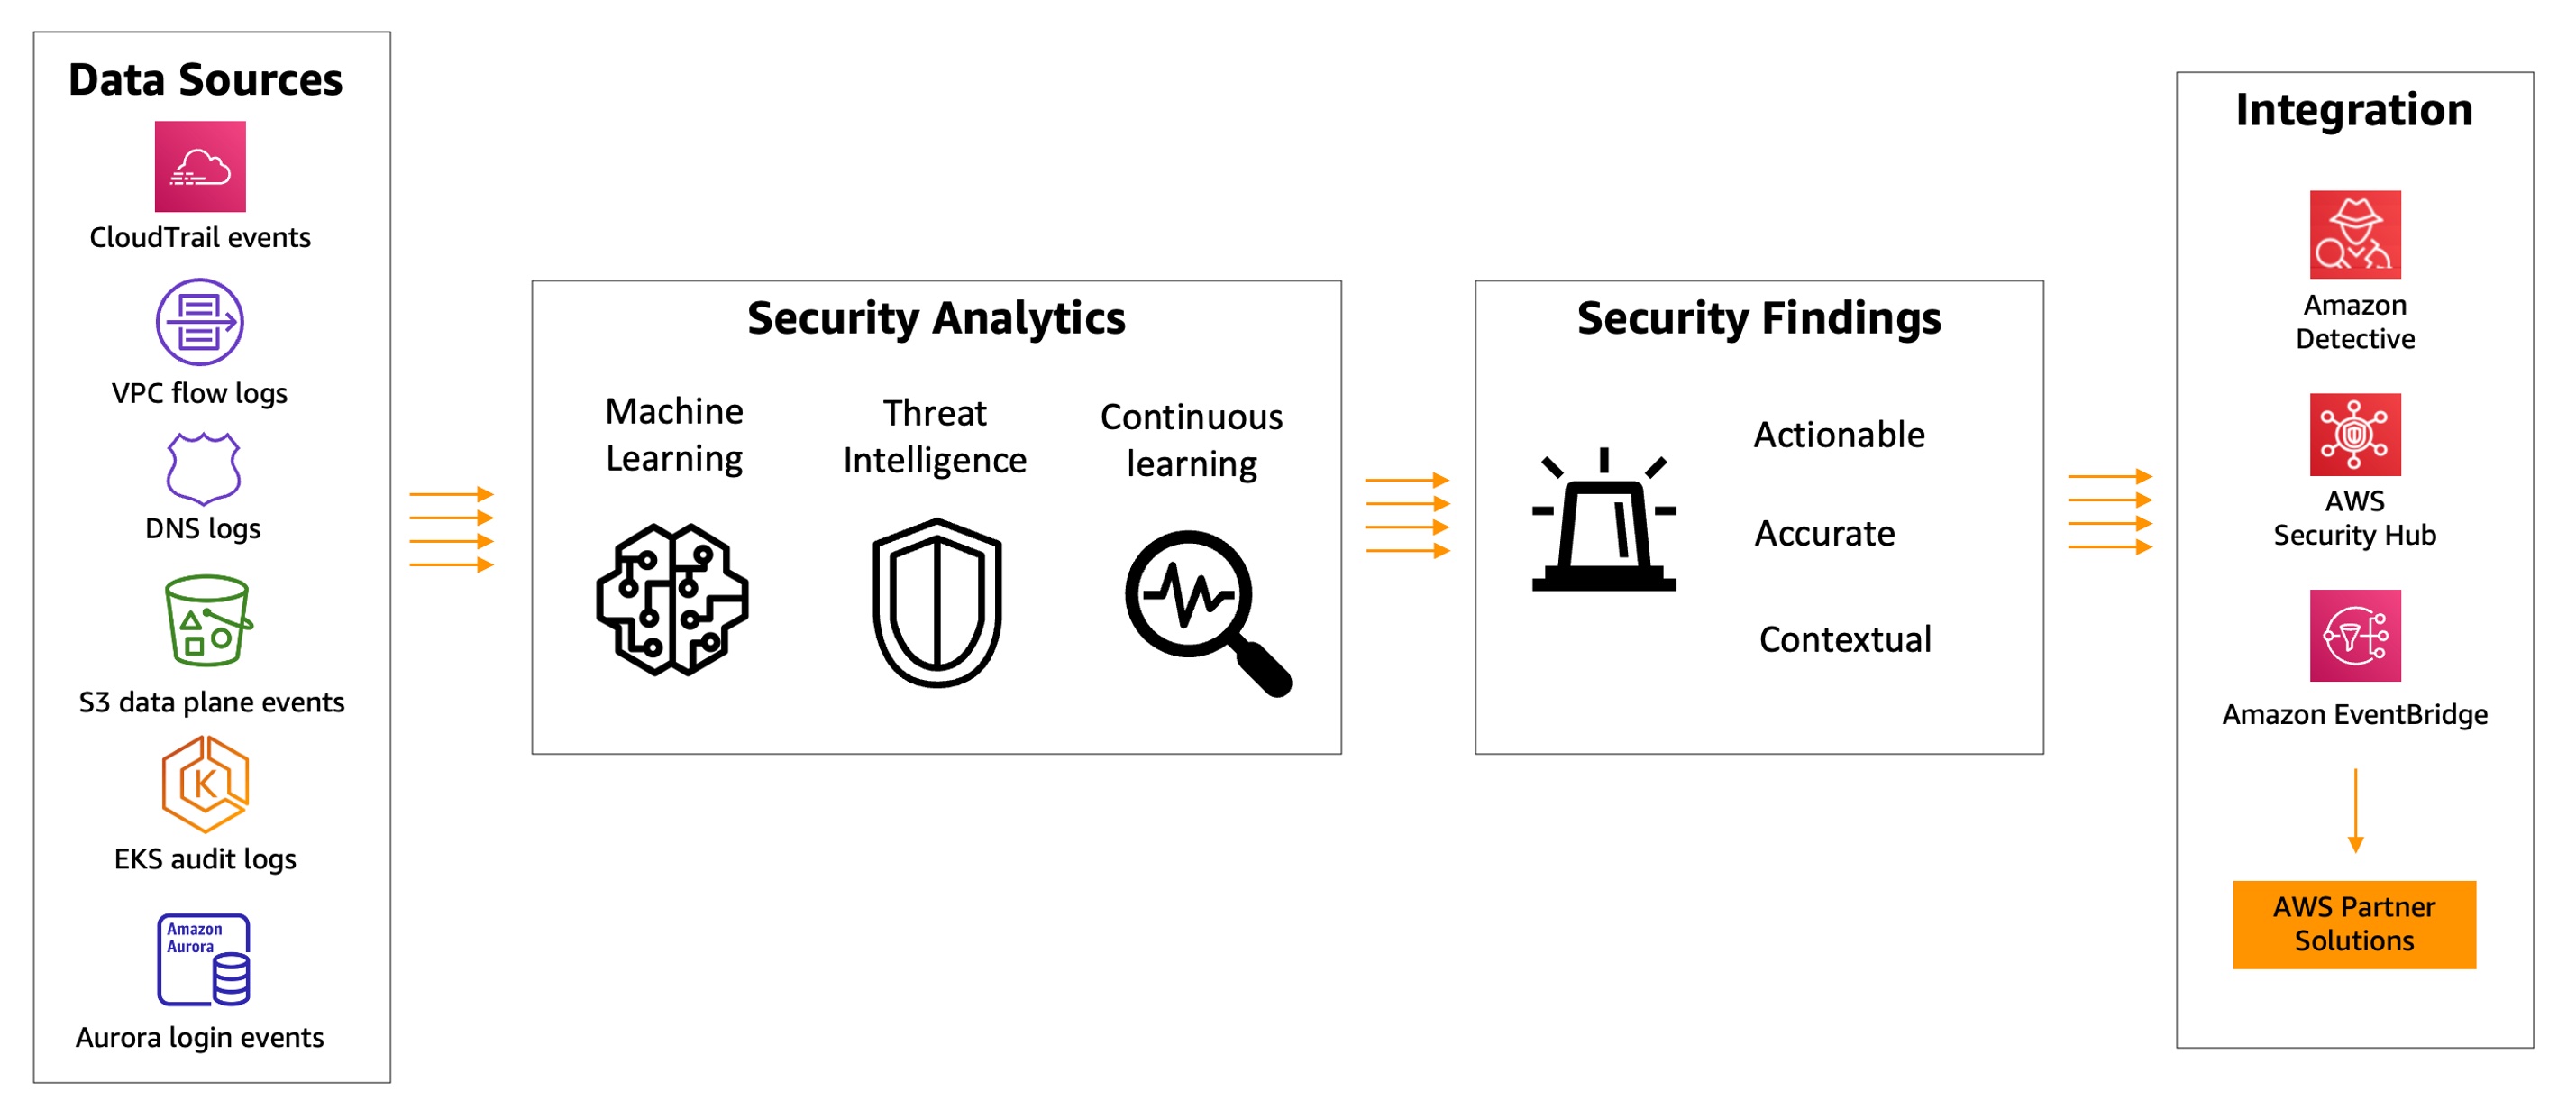
GuardDuty combines machine learning (ML), anomaly detection, network monitoring, and malicious file discovery using various AWS data sources. When threats are detected, GuardDuty automatically sends security findings to AWS Security Hub, Amazon EventBridge, and Amazon Detective. These integrations help centralize monitoring for AWS and partner services, automate responses to malware findings, and perform security investigations from GuardDuty.
Today, we are announcing the general availability of Amazon GuardDuty EKS Runtime Monitoring to detect runtime threats from over 30 security findings to protect your EKS clusters. The new EKS Runtime Monitoring uses a fully managed EKS add-on that adds visibility into individual container runtime activities, such as file access, process execution, and network connections.
GuardDuty can now identify specific containers within your EKS clusters that are potentially compromised and detect attempts to escalate privileges from an individual container to the underlying Amazon EC2 host and the broader AWS environment. GuardDuty EKS Runtime Monitoring findings provide metadata context to identify potential threats and contain them before they escalate.
Configure EKS Runtime Monitoring in GuardDuty
To get started, first enable EKS Runtime Monitoring with just a few clicks in the GuardDuty console.

Once you enable EKS Runtime Monitoring, GuardDuty can start monitoring and analyzing the runtime-activity events for all the existing and new EKS clusters for your accounts. If you want GuardDuty to deploy and update the required EKS-managed add-on for all the existing and new EKS clusters in your account, choose Manage agent automatically. This will also create a VPC endpoint through which the security agent delivers the runtime events to GuardDuty.
If you configure EKS Audit Log Monitoring and runtime monitoring together, you can achieve optimal EKS protection both at the cluster control plane level, and down to the individual pod or container operating system level. When used together, threat detection will be more contextual to allow quick prioritization and response. For example, a runtime-based detection on a pod exhibiting suspicious behavior can be augmented by an audit log-based detection, indicating the pod was unusually launched with elevated privileges.
These options are default, but they are configurable, and you can uncheck one of the boxes in order to disable EKS Runtime Monitoring. When you disable EKS Runtime Monitoring, GuardDuty immediately stops monitoring and analyzing the runtime-activity events for all the existing EKS clusters. If you had configured automated agent management through GuardDuty, this action also removes the security agent that GuardDuty had deployed.
Manage GuardDuty Agent Manually
If you want to manually deploy and update the EKS managed add-on, including the GuardDuty agent, per cluster in your account, uncheck Manage agent automatically in the EKS protection configuration.
When managing the add-on manually, you are also responsible for creating the VPC endpoint through which the security agent delivers the runtime events to GuardDuty. In the VPC endpoint console, choose Create endpoint. In the step, choose Other endpoint services for Service category, enter com.amazonaws.us-east-1.guardduty-data for Service name in the US East (N. Virginia) Region, and choose Verify service.
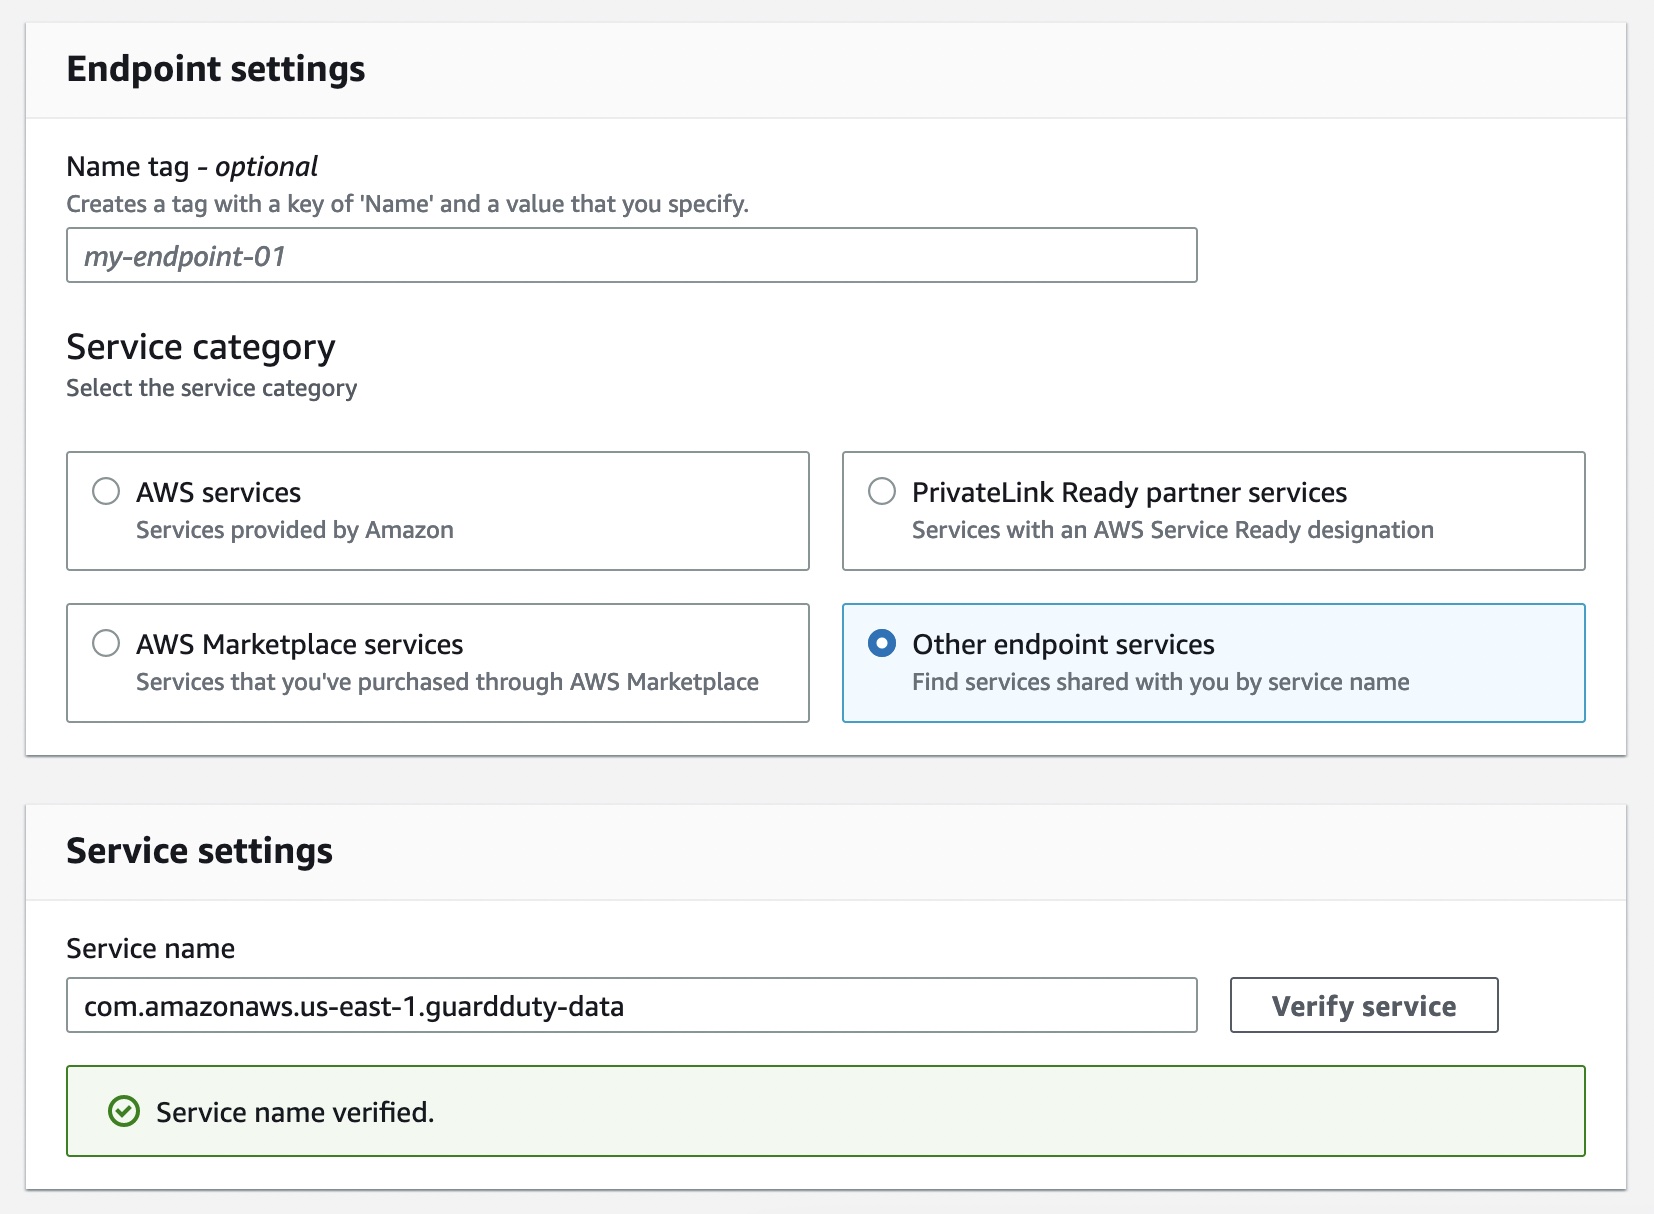
After the service name is successfully verified, choose VPC and subnets where your EKS cluster resides. Under Additional settings, choose Enable DNS name. Under Security groups, choose a security group that has the in-bound port 443 enabled from your VPC (or your EKS cluster).
Add the following policy to restrict VPC endpoint usage to the specified account only:
{
	"Version": "2012-10-17",
	"Statement": [
		{
			"Action": "*",
			"Resource": "*",
			"Effect": "Allow",
			"Principal": "*"
		},
		{
			"Condition": {
				"StringNotEquals": {
					"aws:PrincipalAccount": "123456789012"
				}
			},
			"Action": "*",
			"Resource": "*",
			"Effect": "Deny",
			"Principal": "*"
		}
	]
}
Now, you can install the Amazon GuardDuty EKS Runtime Monitoring add-on for your EKS clusters. Select this add-on in the Add-ons tab in your EKS cluster profile on the Amazon EKS console.
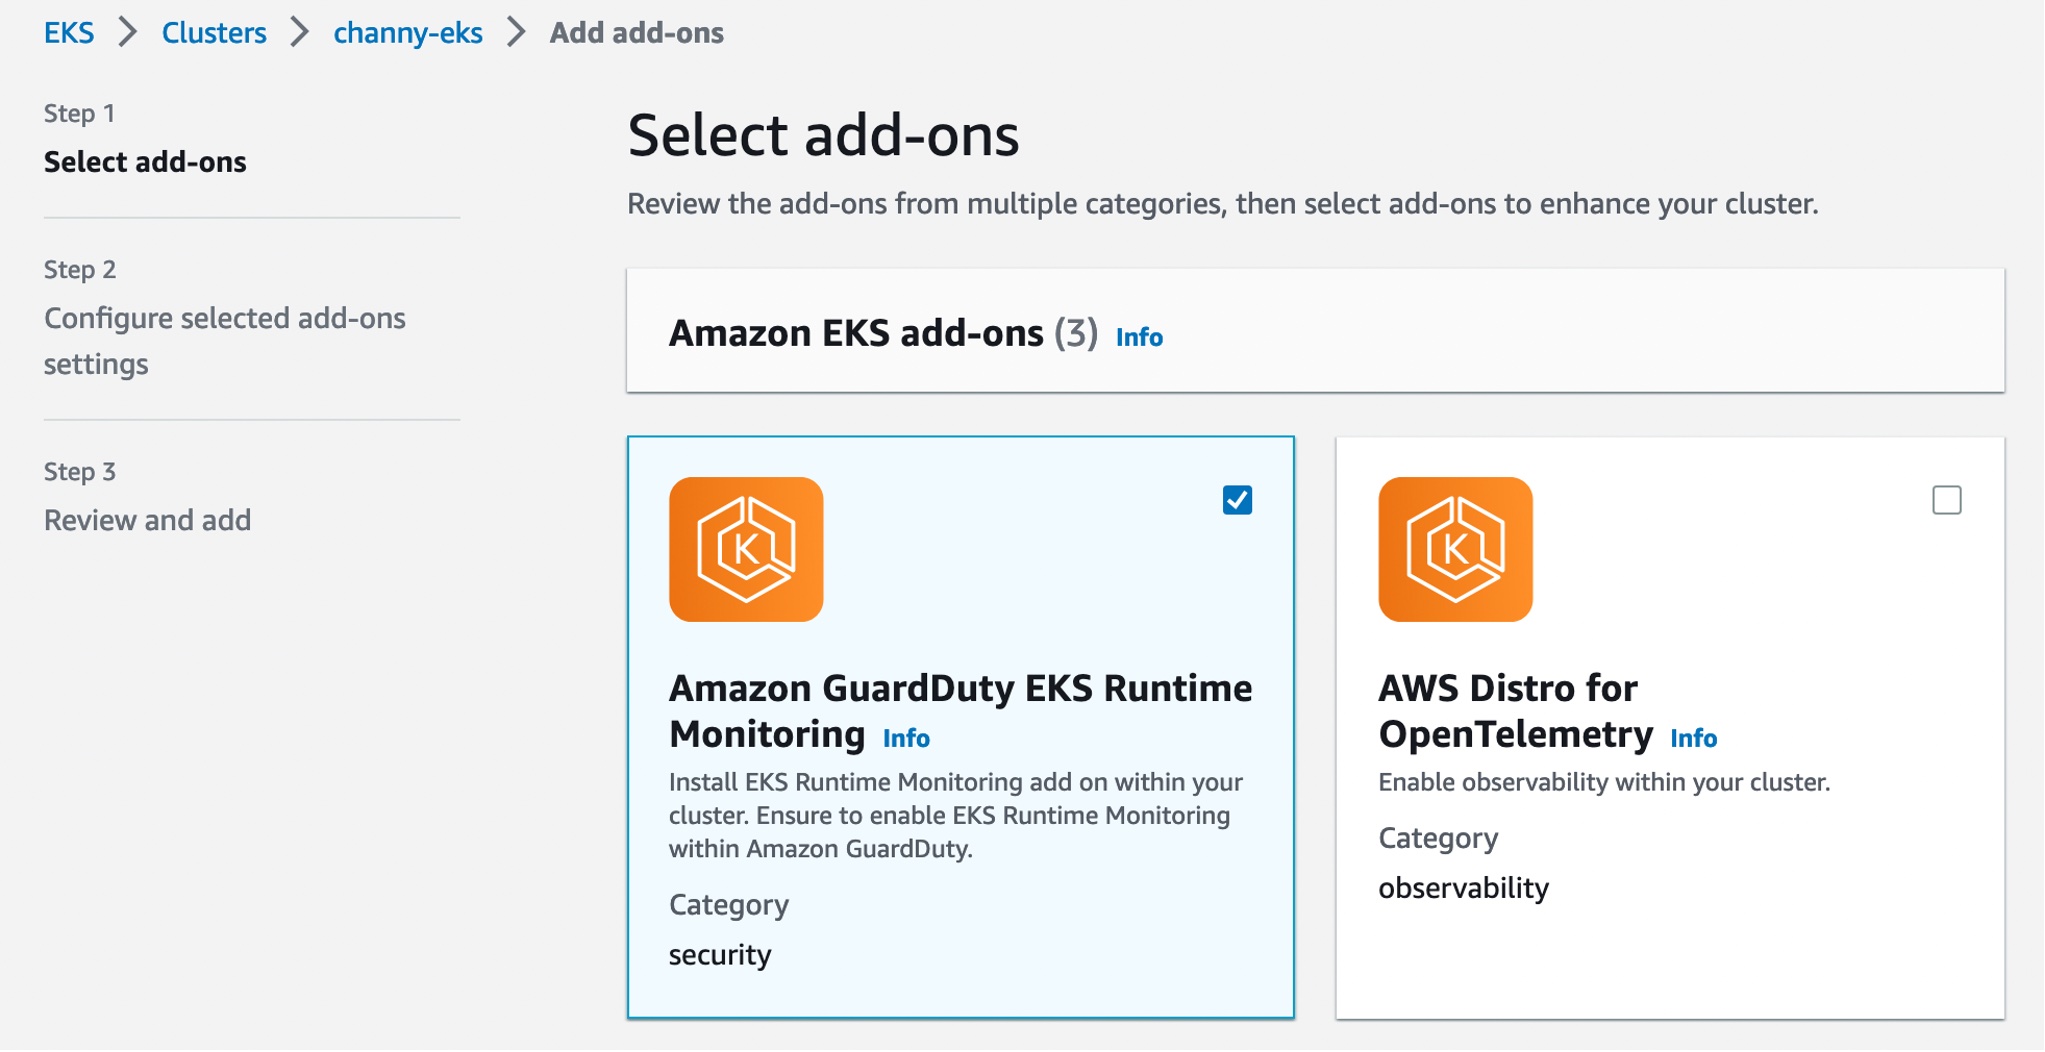
When you enable EKS Runtime Monitoring in GuardDuty and deploy the Amazon EKS add-on for your EKS cluster, you can view the new pods with the prefix amazon-guardduty-agent. GuardDuty now starts to consume runtime-activity events from all EC2 hosts and containers in the cluster. GuardDuty then analyzes these events for potential threats.

These pods collect various event types and send them to the GuardDuty backend for threat detection and analysis. When managing the add-on manually, you need to go through these steps for each EKS cluster that you want to monitor, including new EKS clusters. To learn more, see Managing GuardDuty agent manually in the AWS documentation.
Checkout EKS Runtime Security Findings
When GuardDuty detects a potential threat and generates a security finding, you can view the details of the corresponding findings. These security findings indicate either a compromised EC2 instance, container workload, an EKS cluster, or a set of compromised credentials in your AWS environment.
If you want to generate EKS Runtime Monitoring sample findings for testing purposes, see Generating sample findings in GuardDuty in the AWS documentation. Here is an example of potential security issues: a newly created or recently modified binary file in an EKS cluster has been executed.

The ResourceType for an EKS Protection finding type could be an Instance, EKSCluster, or Container. If the Resource type in the finding details is EKSCluster, it indicates that either a pod or a container inside an EKS cluster is potentially compromised. Depending on the potentially compromised resource type, the finding details may contain Kubernetes workload details, EKS cluster details, or instance details.

The Runtime details such as process details and any required context describe information about the observed process, and the runtime context describes any additional information about the potentially suspicious activity.

To remediate a compromised pod or container image, see Remediating Kubernetes security issues discovered by GuardDuty in the AWS documentation. This document describes the recommended remediation steps for each resource type. To learn more about security finding types, see GuardDuty EKS Runtime Monitoring finding types in the AWS documentation.
Now Available
You can now use Amazon GuardDuty for EKS Runtime Monitoring. For a full list of Regions where EKS Runtime Monitoring is available, visit region-specific feature availability.
The first 30 days of GuardDuty for EKS Runtime Monitoring are available at no additional charge for existing GuardDuty accounts. If you enabled GuardDuty for the first time, EKS Runtime Monitoring is not enabled by default, and needs to be enabled as described above. After the trial period ends in the GuardDuty, you can see the estimated cost of EKS Runtime Monitoring. To learn more, see the GuardDuty pricing page.
For more information, see the Amazon GuardDuty User Guide and send feedback to AWS re:Post for Amazon GuardDuty or through your usual AWS support contacts.
– Channy
Velociraptor Version 0.6.8 Available Now
Post Syndicated from Carlos Canto original https://blog.rapid7.com/2023/03/30/velociraptor-version-0-6-8-available-now/
A New Client-Server Communication Protocol, VFS GUI, and More Performance Upgrades Make This The Fastest and Most Scalable Velociraptor Yet

Rapid7 is excited to announce the release of version 0.6.8 of Velociraptor—an advanced, open-source digital forensics and incident response (DFIR) tool that enhances visibility into your organization’s endpoints. This release has been in development and testing for several months and features significant contributions and testing from our community. We are thrilled to share its powerful new features and improvements here today.
Performance Improvements
A big theme in the 0.6.8 release was about performance improvement, making Velociraptor faster, more efficient and more scalable (even more so than it currently is!).
New Client-Server Communication Protocol
When collecting artifacts from endpoints Velociraptor maintains a collection state (e.g. how many bytes were transferred?, how many rows? was the collection successful? etc). Previously tracking the collection was the task of the server, but this extra processing limited the total number of collections it could process.
In the 0.6.8 release, a new communication protocol was added to offload a lot of the collection tracking to the client itself. This reduces the amount of work on the server and allows more collections to be processed at the same time.
To maintain support with older clients, the server continues to use the older communication protocol with them—but will achieve the most improvement in performance once the newer clients are deployed.
New Virtual File System GUI
The VFS feature in Velociraptor allows users to interactively inspect directories and files on the endpoint, in a familiar tree-style user interface. The previous VFS view would store the entire directory listing in a single table for each directory. For very large directories like C:\Windows or C:\Windows\System32 (which typically have thousands of files) this would strain the browser leading to unusable UI.
In the latest release, the VFS GUI uses the familiar paged table and syncs this directory listing in a more efficient way. This improves performance significantly: for example, it is now possible and reasonable to perform a recursive directory sync on C:\Windows, on my system syncs over 250k files in less than 90 seconds.

Since the VFS is now using the familiar paging table UI, it is also possible to filter, sort on any column using that same UI.
Faster Export Functionality
Velociraptor hunts and collections can be exported to a ZIP file for easy consumption in other tools. The 0.6.8 release improved the export code to make it much faster. Additionally, the GUI was improved to show how many files were exported into the zip, and other statistics.

Tracing Capability On Client Collections
We often get questions about what happened to a collection that seems to be hung? It is difficult to know why a collection seems to be unresponsive or stopped – it could mean the client was killed for some reason, (e.g. due to excessive memory use or a timeout).
Previously the only way to gather client side information was to collect a Generic.Client.Profile collection. This required running it at just the right time and did not guarantee that we would get helpful insight of what the query and the client binary were doing during the operation in question.
In the latest release it is now possible to specify a trace on any collection to automatically collect client side state as the collection is progressing.


VQL Improvement – Disk Based Materialize Operator
The VQL LET ... <= operator is called the materializing LET operator because it expands the following query into a memory array which can be accessed cheaply multiple times.
While this is useful for small queries, it has proved dangerous in some cases, because users inadvertently attempted to materialize a very large query (e.g. a large glob() operation) dramatically increasing memory use. For example, the following query could cause problems in earlier versions.
LET X <= SELECT * FROM glob(globs=specs.Glob, accessor=Accessor)
In the latest release the VQL engine was improved to support a temp file based materialized operator. If the materialized query exceeds a reasonable level (by default 1000 rows), the engine will automatically switch away from memory based storage into file backed storage. Although file based storage is slower, memory usage is more controlled.
Ideally the VQL is rewritten to avoid this type of operation, but sometimes it is unavoidable, and in this case, file based materialize operations are essential to maintain stability and acceptable memory consumption.
New MSI Deployment Option
On Windows the recommended way to install Velociraptor is via an MSI package. The MSI package allows the software to be properly installed and uninstalled and it is also compatible with standard Windows software management procedures.
Previously however, building the MSI required using the WIX toolkit – a Windows only MSI builder which is difficult to run on other platforms. Operationally building with WIX complicates deployment procedures and requires using a complex release platform.
In the 0.6.8 release, a new method for repacking the official MSI package is now recommended. This can be done on any operating system and does not require WIX to be installed. Simply embed the client configuration file in the officially distributed MSI packages using the following command:
velociraptor-v0.6.8-rc1-linux-amd64 config repack --msi
velociraptor-v0.6.8-rc1-windows-amd64.msi client.config.yaml
output.msi

Conclusion
If you’re interested in any of these new features, we welcome you to take Velociraptor for a spin by downloading it from our release page. It’s available for free on GitHub under an open-source license.
As always, please file bugs on the GitHub issue tracker or submit questions to our mailing list by emailing [email protected]. You can also chat with us directly on our Discord server.
Learn more about Velociraptor by visiting any of our web and social media channels below: