Тази седмица спокойно можеше и да не се състои. Започна с опустошителното земетресение в Турция и Сирия, отнело живота на хиляди хора, и завърши с новината, че още един българин е бил убит от съседа си, защото мига шумно. Предишният случай беше от ноември миналата година, когато Константин Дамов (62 г.) след многобройни междусъседски разпри застреля 41-годишния баща на три деца Иво Андреев. Поводът, твърди се, е някаква врата. Може и да е онази същата, зад която упорито крием обществените си угризения, че допускаме да се случва всичко това.
Паралелно с трагедията на местно ниво, където, изглежда, всички сме съучастници, вървят и световните процеси, в които също се включваме посвоему. Тази седмица Александър Нуцов се опитва да опише как би изглеждал мирът след края на войната в Украйна и какво ще е състоянието на международната система. В текста „Устойчив мир или нова желязна завеса“ той обръща внимание и на реалните отношения между ЕС, НАТО и Русия. Древните са казали: „Ако искаш мир, готви се за война“, но не е лошо да се има предвид и обратният вариант: „Ако искаш война, готви се за мир.“ Александър обяснява защо.
Оставяме международното положение леко встрани, правим един пирует и се приземяваме не чак толкова елегантно в блатото на българския политически живот, където редиците се стягат за нови избори. Емилия Милчева повдига въпроса как се избират от партиите онези, които ще избираме после ние – с други думи, каква е механиката, с която ще се запълват новите партийни листи. Във „Вот 2023. „Мат’рял“ за листи или хора за избиране“ отново можем да си припомним къде живеем (в случай че ни се е удала възможност да забравим), като обърнем внимание на следното: няма демократични регламенти и добри практики за номинации на кандидати и всичко изглежда като кастинг, а не като реален политически процес.
Като казах „политически процес“, ми се прииска да направя очевидната констатация, че политиката в България е населявана от всякакви „политически животни“ (да ме прощава Аристотел) и това може би има известна очарователност, особено когато ги „изследваме“ през балоните в социалните си мрежи. Но когато политиците нападат с безпочвени обвинения журналисти, защото журналистите се осмеляват да си вършат работата, изглежда, че нещата леко излизат от коловозите на основополагащите принципи на демократичните общества, сред които са свободата на словото и независимостта на медиите.
Буквално преди дни Емилия Милчева беше атакувана от политическа партия „Възраждане“ за свой репортаж в „Дойче Веле“, който разглежда какви са хората, подписващи се против еврото, и какви са техните съображения. Емилия пита, записва отговорите и без да знае, се оказва нарушител на обществения ред. После, разбира се, има пресконференция на „Възраждане“, на която представители на партията „разобличават“ Емилия Милчева като лице, минало през много „българоезични американски медии в България“, пратено да провокира. Истината е, че тук вече всяко по-настоятелно задаване на въпроси се смята за лошо възпитание, както казва журналистката Миролюба Бенатова в едно свое интервю. Така че каквото и да се каже по този въпрос, все ще е провокация. Затова спирам, понеже основната цел на „Тоест“ е да ни провокира да мислим, а не да правим пресконференции.
Българското участие във Венецианското архитектурно биенале е тема, по която със сигурност тепърва ще се мисли и говори. България не се е представяла на този форум от 15 години. Повечето кандидати, явили се на конкурса за избор на наш участник, са показали съвсем адекватни предложения, както пише в текста си „Венеция, България и изоставените сгради“ арх. Анета Василева. Този избор не минава и без скандал или поне без опит за такъв. В крайна сметка е излъчен проектът на POV Architects „Образованието е придвижването от тъмнина към светлина“, поставящ фокус върху изоставените сгради на стари училища в България. Какъв е контекстът, в който ще се представи нашето предложение, какво представлява то и какви са възможностите за неговото по-добро реализиране, разказва арх. Василева.
От тъмнината към светлината със сигурност ни придвижват и книгите. Особено когато осветляват истории „от архивите“. Тази седмица тръгваме по буквите със Зорница Христова, която ни представя „Кой е Сава Попов? Отключването на един архив“ от Антон Стайков и Свобода Цекова, „Оловна тишина. Историята на един разстрел“ от Ивайла Александрова и „Световна литература. Космополитизъм. Изгнание“ от Галин Тиханов.
Първата книга разказва за писателя и журналист Сава Попов. Неговата история остава някак неглижирана, но сега се появява като резултат от изключително задълбочено изследване на архивите на писателя „с обаянието на автентичния материал, но и с осезаемо разказваческо умение“, както пише Зорница.
„Оловна тишина“ е още един изследователски труд, целящ да разкаже истинската история, а не кратката ѝ версия за пред знамето. Ивайла Александрова се заема да разгледа документите по делото на Никола Вапцаров и да ги предостави като контрааргумент срещу всички клишета за него. Добре е да се отбележи, че „Оловна тишина“ не е съд над Вапцаров. Особено пък като поет“, както казва Зорница Христова.
Тази седмица „По буквите“ завършва с представяне на „Световната литература. Космополитизъм. Изгнание“ на Галин Тиханов, в която участва и Марин Бодаков. Историята на идеите е сърцевината на книгата на проф. Тиханов, литературовед, член на Британската академия. Какво всъщност е космополитизмът, ако си представим понятието като персонаж, и къде се крие политическият потенциал на тази книга – прочетете в текста на Зорница Христова.
Taking a stroll down memory lane (Tomcat Init Script Privilege Escalation)
Do you remember the issue with Tomcat init script that was originally discovered by Dawid Golunski back in 2016 that led to privilege escalation? This week’s Metasploit release includes an exploit module for CVE-2016-1240 by h00die. This vulnerability allows any local users who already have tomcat accounts to perform privilege escalation and gain access to a target system as a root user. This exploit can be used against the following tomcat versions Tomcat 8 (8.0.36-2), Tomcat 7 (7.0.70-2) and Tomcat 6 (6.0.45+dfsg-1~deb8u1).
Lenovo Diagnostics Driver IOCTL memmove
Our own Jack Heysel contributed an exploit module for CVE-2022-3699 using the proof of concept created by alfarom256. A vulnerability within Lenovo Diagnostics Driver due to incorrect access control allows low-privileged users to issue device IOCTLs to perform arbitrary physical/virtual memory read/write.
New module content (8)
Nagios XI 5.5.6 to 5.7.5 – ConfigWizards Authenticated Remote Code Execution
Author: Matthew Mathur
Type: Exploit
Pull request: #17494 contributed by k0pak4
AttackerKB reference: CVE-2021-25298
Description: A new authenticated RCE module for NagiosXI has been added which exploits CVE-2021-25296, CVE-2021-25297, and CVE-2021-25298 to get a shell as the apache user on NagiosXI devices running version 5.5.6 to 5.7.5 inclusive.
F5 Big-IP Create Admin User
Author: Ron Bowes
Type: Exploit
Pull request: #17392 contributed by rbowes-r7
Description: This PR adds a privilege escalation module for F5 that uses the unsecured MCP socket to create a new root account.
Apache Tomcat on Ubuntu Log Init Privilege Escalation
Authors: Dawid Golunski and h00die
Type: Exploit
Pull request: #17483 contributed by h00die
AttackerKB reference: CVE-2016-1240
Description: Adds a new exploit/linux/local/tomcat_ubuntu_log_init_priv_esc module for CVE-2016-1240 targetting Tomcat (6, 7, 8). By default repositories on Debian-based distributions (including Debian, Ubuntu etc.) provide a vulnerable tomcat init script that allows local attackers who have already gained access to the tomcat account (for example, by exploiting an RCE vulnerability in a java web application hosted on Tomcat, uploading a webshell etc.) to escalate their privileges from tomcat user to root and fully compromise the target system.
Fortra GoAnywhere MFT Unsafe Deserialization RCE
Author: Ron Bowes
Type: Exploit
Pull request: #17607 contributed by rbowes-r7
AttackerKB reference: CVE-2023-0669
Description: This PR adds a module that exploits CVE-2023-0669, which is an object deserialization vulnerability in Fortra GoAnywhere MFT.
ManageEngine ADSelfService Plus Unauthenticated SAML RCE
Authors: Christophe De La Fuente, Khoa Dinh, and horizon3ai
Type: Exploit
Pull request: #17556 contributed by cdelafuente-r7
AttackerKB reference: CVE-2022-47966
Description: This PR adds an exploit that uses an unauthenticated remote code execution vulnerability that affects Zoho ManageEngine ADSelfService Plus versions 6210 and below (https://github.com/advisories/GHSA-4w3v-83v8-mg94).
ManageEngine ServiceDesk Plus Unauthenticated SAML RCE
Authors: Christophe De La Fuente, Khoa Dinh, and horizon3ai
Type: Exploit
Pull request: #17527 contributed by cdelafuente-r7
AttackerKB reference: CVE-2022-47966
Description: This adds an unauthenticated remote code execution vulnerability that affects Zoho ManageEngine ServiceDesk Plus versions 14003 and below. (https://github.com/advisories/GHSA-4w3v-83v8-mg94).
ManageEngine Endpoint Central Unauthenticated SAML RCE
Authors: Christophe De La Fuente, Khoa Dinh, h00die-gr3y, and horizon3ai
Type: Exploit
Pull request: #17567 contributed by h00die-gr3y
AttackerKB reference: CVE-2022-47966
Authors: alfarom256 and jheysel-r7
Type: Exploit
Pull request: #17371 contributed by jheysel-r7
AttackerKB reference: CVE-2022-3699
Description: This PR adds a module that makes use of incorrect access control for the Lenovo Diagnostics Driver allowing a low-privileged user the ability to issue device IOCTLs to perform arbitrary physical/virtual memory read/write.
Enhancements and features (3)
#17597 from bcoles – Fix notes for SideEffects and Reliability in the auxiliary/dos/mirageos/qubes_mirage_firewall_dos module.
#17603 from dwelch-r7 – Updates admin/kerberos/inspect_ticket to show the UPN and DNS Information within a decrypted PAC.
#17615 from adfoster-r7 – Adds missing module notes for stability, reliability, and side effects to several modules.
Bugs fixed (2)
#17591 from zeroSteiner – A bug has been fixed in metasm_shell and nasm_shell whereby the shells were using readline but the dependency wasn’t correctly imported. This has since been fixed and improved validation has been added.
#17592 from zeroSteiner – A bug has been fixed in the bypassuac_injection_winsxs module whereby a string was not properly being treated as being NULL terminated. Additionally, the definitions of the FindFirstFileA and FindFirstFileW functions have been corrected so that they work on x64 systems.
Documentation added (3)
#17398 from bwatters-r7 – Adds additional details on using command stagers.
#17587 from adfoster-r7 – This PR updates docs.metasploit.com to use the latest ruby conventions.
#17595 from mkonda – Updates the documentation on debugging dead Meterpreter sessions to use the correct option name ReverseListenerBindAddress.
You can always find more documentation on our docsite at docs.metasploit.com.
Get it
As always, you can update to the latest Metasploit Framework with msfupdate
and you can get more details on the changes since the last blog post from
GitHub:
If you are a git user, you can clone the Metasploit Framework repo (master branch) for the latest.
To install fresh without using git, you can use the open-source-only Nightly Installers or the binary installers (which also include the commercial edition).
In this blog post, we show you how to build an event-driven and serverless solution for property leasing and search that is scalable and resilient. This solution was created for AvalonBay Communities, Inc.—a leading residential Real Estate Investment Trusts (REITs). It enables:
More than 150,000 multi-parameter searches per day
The processing of more than 3,500 lease applications and 85,000 individual rent payments per month
Introduction
AvalonBay is an equity REIT. The company has a long track record of developing, redeveloping, acquiring, and managing apartment homes in top U.S. markets. AvalonBay builds long-term value for customers using innovative technology solutions.
The company understands that data-driven insights contribute to targeted business growth. But AvalonBay found that managing the complex interdependencies between multiple data sets—from real estate and property management systems to financial and payment systems—required a new solution.
The challenge
AvalonBay owned or held a direct or indirect ownership interest in 293 apartment communities containing 88,405 apartment homes in 12 states and Washington, D.C., as of September 30, 2022.
Of these, 18 communities were under development and one was under redevelopment. This presented a unique challenge to both internal and external users looking to search and lease apartment units based on multi-parameter selection criteria in geographically dispersed regions. For example, finding units in buildings with specific amenities, lease terms, furnishings and availability dates.
Overview of solution
AvalonBay’s fully managed leasing solution for applicants and residents is hosted by Amazon Web Services (AWS). The solution is secure, autoscaling, and multi-region, ensuring resiliency and performance with efficient resource usage.
In this event-driven solution, AvalonBay’s leasing service is hosted in multiple AWS Regions to provide low latency response to users across various geolocations. This blog post focuses on showing use case implementation in only one region—Region East— as shown in Figure 1.
Figure 1. AvalonBay lease processing platform
Several AWS services come together in this solution to meet key company objectives. Let’s explore each one and its purpose within the architecture.
Amazon Route 53: For AvalonBay’s Lease Processing solution, any non-transient service failure is unacceptable. In addition to providing a high degree of resiliency through a Multi-AZ architecture, Lease Processing also provides regional-level high availability through its multi-Region active-active architecture. Route 53 with latency-based routing allows dynamic rerouting of requests within seconds to alternate Regions.
AWS Lambda with provisioned concurrency: The Lambda services are set up for automatic scaling, secured through a private subnet, and span across Availability Zones. This provides horizontal scaling capability, self-healing capacity, and resiliency across Availability Zones. Provisioned concurrency minimizes the estimate of cold starts by generating execution environments. It also greatly reduces time spent on APIs invocations.
Amazon Aurora V2 for Amazon Relational Database Service (Amazon RDS) PostgreSQL-Compatible Edition: Aurora Serverless V2 is an on-demand, autoscaling configuration for Aurora. Serverless Aurora V2 PostgreSQL-Compatible is used for the Lease Processing solution. The global database was configured with two Regions; us-east-1 as the primary cluster and us-west-2 as the secondary cluster. Automated Aurora global database endpoint management for planned and unplanned failover is configured through a Route 53 private hosted zone, Amazon EventBridge, and Lambda.
Amazon RDS Proxy for Aurora: Amazon RDS Proxy allows the leasing application to pool and share database connections to improve its ability to scale. It also makes the leasing solution more resilient to database failures by automatically connecting to a standby database instance while preserving application connections.
Amazon EventBridge: EventBridge supports the solution through two primary purposes:
Oversees lease flow events – During the lease application process, the solution generates various events which are consumed by AvalonBay and external applications such as property management, finance portals, administration, and more. Leasing events are sent to EventBridge and various event rules are configured for multiple destinations including Lambda, Amazon Simple Notification Service (Amazon SNS), and external API endpoints.
Handles global Aurora V2 failover – Aurora generates events when certain actions are taken or events occur, including any type of global database activity.
When a managed planned failover is initiated—either via the AWS Command Line Interface (AWS CLI), API, or console—the global database failover process starts and generates an event.
When an Aurora cluster is removed from a global cluster through the AWS CLI, API, or console, the Aurora cluster is promoted as a single primary cluster. Once this process is completed, it generates an event.
An EventBridge rule is created to match an event pattern any time a global database managed planned failover completes successfully in a Region. When a failover is completed, the completion event is detected, and this rule is triggered. The event rule is configured to invoke a Lambda function that is triggered on global database failover and updates the Amazon CloudFront CNAME record to the correct value.
Scalable search solution
Leasing professionals need to easily scan a huge amount of property information using AvalonBay’s Search Solution to obtain required information.
Using the Amazon OpenSearch Service, agents can generate property profiles and other asset data to identify matching units and quickly respond to end customers. OpenSearch is a fully open-source search and analytics engine that securely unlocks real-time search, monitoring, and analysis of business and operational data. It is employed for use cases such as application monitoring, log analytics, observability, and website search.
The AvalonBay Search Service solution architecture featuring OpenSearch is shown in Figure 2.
Figure 2: AvalonBay Search Service solution architecture
OpenSearch automatically detects and replaces failed OpenSearch Service nodes, reducing the overhead associated with self-managed infrastructures.
Let’s explore this architecture further by step.
Amazon Kinesis event stream – The AvalonBay community requires near real-time updates to search attributes such as amenities, features, promotion, and pricing. Events created through various producers are streamed through Kinesis and inserted or updated through OpenSearch.
Amazon OpenSearch – OpenSearch is used for end-to-end community search—a managed service making it easy to deploy, operate, and scale OpenSearch clusters in the AWS Cloud. As community search data is read-only, UltraWarm and cold storage are also used based on usage frequency.
This post showed how AvalonBay has built and deployed custom leasing and search solutions on AWS serverless platforms without compromising resiliency, performance, and capacity requirements. This is a 24/7, fully managed solution with no additional equipment on-premises.
Choosing AWS for leasing and search solutions gives AvalonBay the ability to dynamically scale and meet future growth demands while introducing cost advantages. In addition, the global availability of AWS services makes it possible to deploy services across geographic locations to meet performance requirements.
Amazon Web Services is excited to announce that we’ve updated the AWS ebook, Protecting your AWS environment from ransomware. The new ebook includes the top 10 best practices for ransomware protection and covers new services and features that have been released since the original published date in April 2020.
We know that customers care about ransomware. Security teams across the board are ramping up their protective, detective, and reactive measures. AWS serves all customers, including those most sensitive to disruption like teams responsible for critical infrastructure, healthcare organizations, manufacturing, educational institutions, and state and local governments. We want to empower our customers to protect themselves against ransomware by using a range of security capabilities. These capabilities provide unparalleled visibility into your AWS environment, as well as the ability to update and patch efficiently, to seamlessly and cost-effectively back up your data, and to templatize your environment, enabling a rapid return to a known good state. Keep in mind that there is no single solution or quick fix to mitigate ransomware. In fact, the mitigations and controls outlined in this document are general security best practices. We hope you find this information helpful and take action.
For example, to help protect against a security event that impacts stored backups in the source account, AWS Backup supports cross-account backups and the ability to centrally define backup policies for accounts in AWS Organizations by using the management account. Also, AWS Backup Vault Lock enforces write-once, read-many (WORM) backups to help protect backups (recovery points) in your backup vaults from inadvertent or malicious actions. You can copy backups to a known logically isolated destination account in the organization, and you can restore from the destination account or, alternatively, to a third account. This gives you an additional layer of protection if the source account experiences disruption from accidental or malicious deletion, disasters, or ransomware.
Learn more about solutions like these by checking out our Protecting against ransomware webpage, which discusses security resources that can help you secure your AWS environments from ransomware.
For those who have been anxiously awaiting the release of a GCC-based
compiler for the COBOL language, James K. Lowden has a
status report with some good news:
The GCC Cobol aspirant is now 16 months old, and pupating. If
Cobol’s 60-year history were an hour, gcobol is now one minute old.
When last we met our intrepid duo, gcobol had compiled 100
programs, perhaps 1000 lines of Cobol. Today we’re pleased to
announce a milestone: success with “nucleus” and “intrinsic
function” modules of the NIST CCVS-85 test suite. […]
We have, in other words, a verified, working Cobol-85 compiler.
It was only a matter of time before somebody tried to bring BPF to the
kernel’s CPU scheduler. At the end of January, Tejun Heo posted the second
revision of a 30-part patch series, co-written with David Vernet, Josh
Don, and Barret Rhoden, that does just that. There are clearly interesting
things that could be done by deferring scheduling decisions to a BPF
program, but it may take some work to sell this idea to the development
community as a whole.
This blog post is written by Wassim Benhallam, Sr Cloud Application Architect AWS WWCO ProServe, and Rajesh Kesaraju, Sr. Specialist Solution Architect, EC2 Flexible Compute.
Scaling an Amazon EC2 Auto Scaling group based on Amazon Simple Queue Service (Amazon SQS) is a commonly used design pattern in decoupled applications. For example, an EC2 Auto Scaling Group can be used as a worker tier to offload the processing of audio files, images, or other files sent to the queue from an upstream tier (e.g., web tier). For latency-sensitive applications, AWS guidance describes a common pattern that allows an Auto Scaling group to scale in response to the backlog of an Amazon SQS queue while accounting for the average message processing duration (MPD) and the application’s desired latency.
This post builds on that guidance to focus on latency-sensitive applications where the MPD varies over time. Specifically, we demonstrate how to dynamically update the target value of the Auto Scaling group’s target tracking policy based on observed changes in the MPD. We also cover the utilization of Amazon EC2 Spot instances, mixed instance policies, and attribute-based instance selection in the Auto Scaling Groups as well as best practice implementation to achieve greater cost savings.
The challenge
The key challenge that this post addresses is applications that fail to honor their acceptable/target latency in situations where the MPD varies over time. Latency refers here to the time required for any queue message to be consumed and fully processed.
Consider the example of a customer using a worker tier to process image files (e.g., resizing, rescaling, or transformation) uploaded by users within a target latency of 100 seconds. The worker tier consists of an Auto Scaling group configured with a target tracking policy. To achieve the target latency mentioned previously, the customer assumes that each image can be processed in one second, and configures the target value of the scaling policy so that the average image backlog per instance is maintained at approximately 100 images.
In the first week, the customer submits 1000 images to the Amazon SQS queue for processing, each of which takes one second of processing time. Therefore, the Auto Scaling group scales to 10 instances, each of which processes 100 images in 100s, thereby honoring the target latency of 100s.
In the second week, the customer submits 1000 slightly larger images for processing. Since an image’s processing duration scales with its size, each image takes two seconds to process. As in the first week, the Auto Scaling group scales to 10 instances, but this time each instance processes 100 images in 200s, which is twice as long as was needed in the first round. As a result, the application fails to process the latter images within its acceptable latency.
Therefore, the challenge is common to any latency-sensitive application where the MPD is subject to change. Applications where the processing duration scales with input data size are particularly vulnerable to this problem. This includes image processing, document processing, computational jobs, and others.
Solution overview
Before we dive into the solution, let’s briefly review the target tracking policy’s scaling metric and its corresponding target value. A target tracking scaling policy works by adjusting the capacity to keep a scaling metric at, or close to, the specified target value. When scaling in response to an Amazon SQS backlog, it’s good practice to use a scaling metric known as the Backlog Per Instance (BPI) and a target value based on the acceptable BPI. These are computed as follows:
Given the acceptable BPI equation, a longer MPD requires us to use a smaller target value if we are to process these messages in the same acceptable latency, and vice versa. Therefore, the solution we propose here works by monitoring the average MPD over time and dynamically adjusting the target value of the Auto Scaling group’s target tracking policy (acceptable BPI) based on the observed changes in the MPD. This allows the scaling policy to adapt to variations in the average MPD over time, and thus enables the application to honor its acceptable latency.
Solution architecture
To demonstrate how the approach above can be implemented in practice, we put together an example architecture highlighting the services involved (see the following figure). We also provide an automated deployment solution for this architecture using an AWS Serverless Application Model (AWS SAM) template and some Python code (repository link). The repository also includes a README file with detailed instructions that you can follow to deploy the solution. The AWS SAM template deploys several resources, including an autoscaling group, launch template, target tracking scaling policy, an Amazon SQS queue, and a few AWS Lambda functions that serve various functions described as follows.
The Amazon SQS queue is used to accumulate messages intended for processing, while the Auto Scaling group instances are responsible for polling the queue and processing any messages received. To do this, a launch template defines a bootstrap script that allows the group’s instances to download and execute a Python code when first launched. The Python code consumes messages from the Amazon SQS queue and simulates their processing by sleeping for the MPD duration specified in the message body. After processing each message, the instance publishes the MPD as an Amazon CloudWatch metric (see the following figure).
Figure 1: Architecture diagram showing the components deployed by the AWS SAM template.
To enable scaling, the Auto Scaling group is configured with a target tracking scaling policy that specifies BPI as the scaling metric and with an initial target value provided by the user.
The BPI CloudWatch metric is calculated and published by the “Metric-Publisher” Lambda function which is invoked every one minute using an Amazon EventBridge rate expression. To calculate BPI, the Lambda function simply takes the ratio of the number of messages visible in the Amazon SQS queue by the total number of in-service instances in the Auto Scaling group, as shown in equation (2) above.
On the other hand, the scaling policy’s target value is updated by the “Target-Setter” Lambda function, which is invoked every 30 minutes using another EventBridge rate expression. To calculate the new target value, the Lambda function simply takes the ratio of the user-defined acceptable latency value by the current average MPD queried from the corresponding CloudWatch metric, as shown in the previous equation (1).
Finally, to help you quickly test this solution, a Lambda function “Testing Lambda” is also provided and can be used to send messages to the Amazon SQS queue with a processing duration of your choice. This is specified within each message’s body. You can invoke this Lambda function with different MPDs (by modifying the corresponding environment variable) to verify how the Auto Scaling group scales in response. A CloudWatch dashboard is also deployed to enable you to track key scaling metrics through time. These include the number of messages visible in the queue, the number of in-service instances in the Auto Scaling group, the MPD, and BPI vs acceptable BPI.
Solution testing
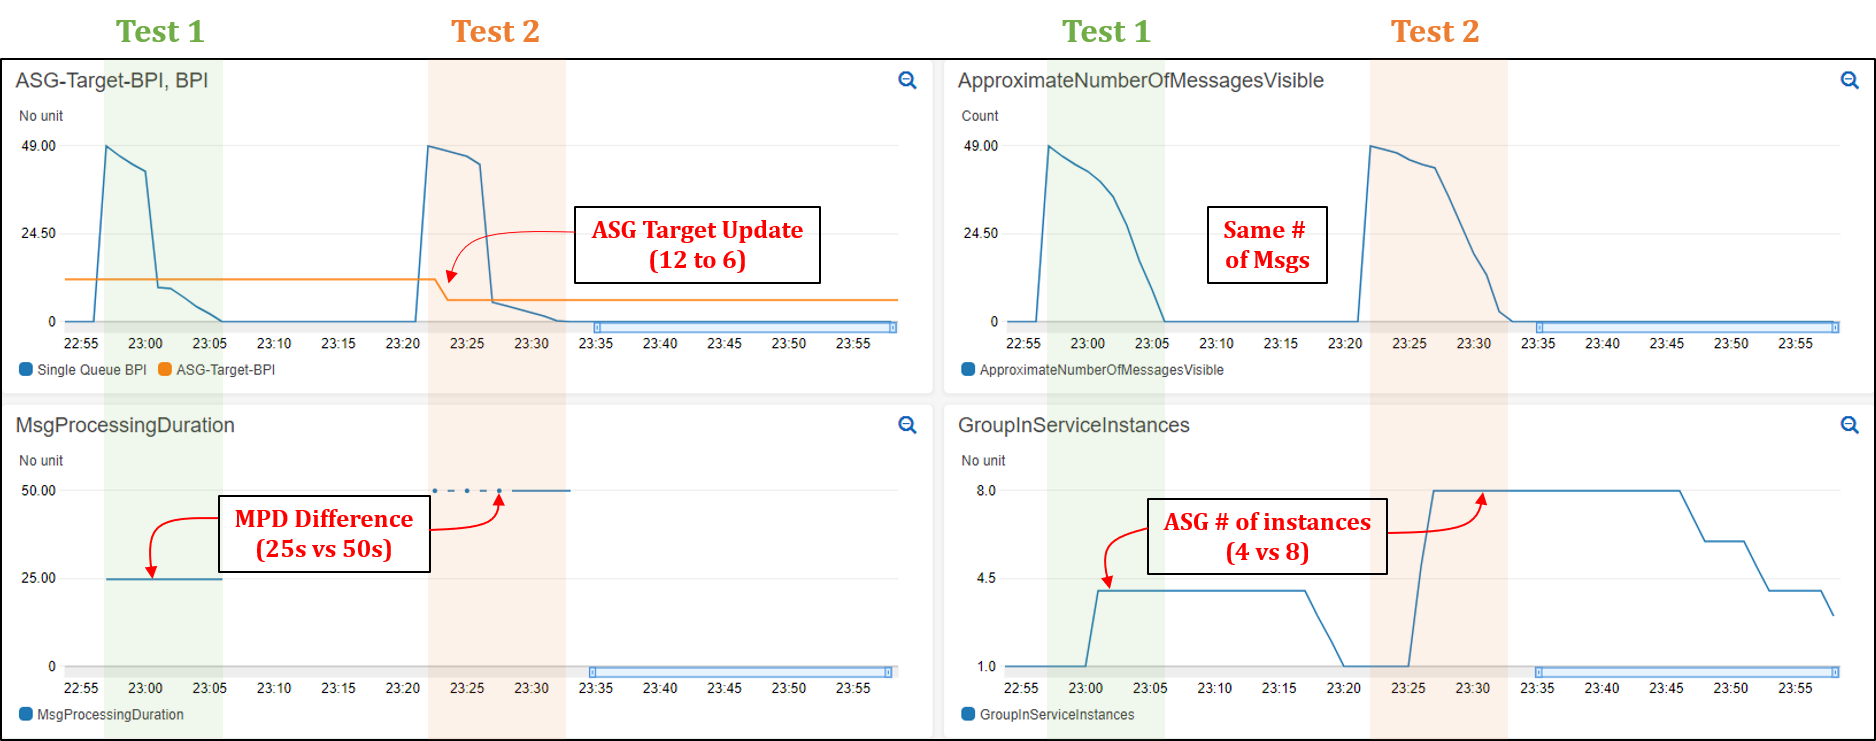
To demonstrate the solution in action and its impact on application latency, we conducted two tests that you can reproduce by following the instructions described in the “Testing” section of the repository’s README file (repository link). In both tests, we assume a hypothetical application with a target latency of 300s. We also modified the invocation frequency of the “Target Setter” Lambda function to one minute to quickly assess the impact of target value changes. In both tests, we submit 50 messages to the Amazon SQS queue through the provided helper lambda. An MPD of 25s and 50s was used for the first and second test, respectively. The provided CloudWatch dashboard shows that the ASG scales to a total of four instances in the first test, and eight instances in the second (see the following figure). See README file for a detailed description of how various metrics evolve over time.
Comparison of Tests 1 and 2
Since Test 2 messages take twice as long to process, the Auto Scaling group launched twice as many instances to attempt to process all of the messages in the same amount of time as Test 1 (latency). The following figure shows that the total time to process all 50 messages in Test 1 was 9 mins vs 10 mins in Test 2. In contrast, if we were to use a static/fixed acceptable BPI of 12, then a total of four instances would have been operational in Test 2, thereby requiring double the time of Test 1 (~20 minutes) to process all of the messages. This demonstrates the value of using a dynamic scaling target when processing messages from Amazon SQS queues, especially in circumstances where the MPD is prone to vary with time.
Figure 2: CloudWatch dashboard showing Auto Scaling group scaling test results (Test 1 and 2).
Recommended best practices for Auto Scaling groups
This section highlights a few key best practices that we recommend adopting when deploying and working with Auto Scaling groups.
Reducing cost using EC2 Spot instances
Amazon SQS helps build loosely coupled application architectures, while providing reliable asynchronous communication between the various layers/components of an application. If a worker node fails to process a message within the Amazon SQS message visibility time-out, then the message is returned to the queue and another worker node can pick up and process that message. This makes Amazon SQS-backed applications fault-tolerant by design and thus a great fit for EC2 Spot instances. EC2 spot instances are spare compute capacity in the AWS cloud that is available to you at steep discounts as compared to On-Demand prices.
Maximizing capacity using attribute-based instance selection
With the recently released attribute-based instance selection feature, you can define infrastructure requirements based on application needs such as vCPU, RAM, and processor family (e.g., x86, ARM). This removes the need to define specific instances in your Auto Scaling group configuration, and it eliminates the burden of identifying the correct instance families and sizes. In addition, newly released instance types will be automatically considered if they fit your requirements. Attribute-based instance selection lets you tap into hundreds of different EC2 instance pools, which increases the chance of getting EC2 (Spot/On-demand) instances. When using attribute-based instance selection with the capacity optimized allocation strategy, Amazon EC2 allocates instances from deeper Spot capacity pools, thereby further reducing the chance of Spot interruption.
The following sample configuration creates an Auto Scaling group with attribute-based instance selection:
As can be seen from the test results, this approach demonstrates how an Auto Scaling group can honor a user-provided acceptable latency constraint while accomodating variations in the MPD over time. This is possible because the average MPD is monitored and regularly updated as a CloudWatch metric. In turn, this is continously used to update the target value of the group’s target tracking policy. Moreover, we have covered additional Auto Scaling group best practices suitable for this use case, including the use of Spot instances to reduce costs and attribute-based instance selection to simplify the selection of relevant instance types.
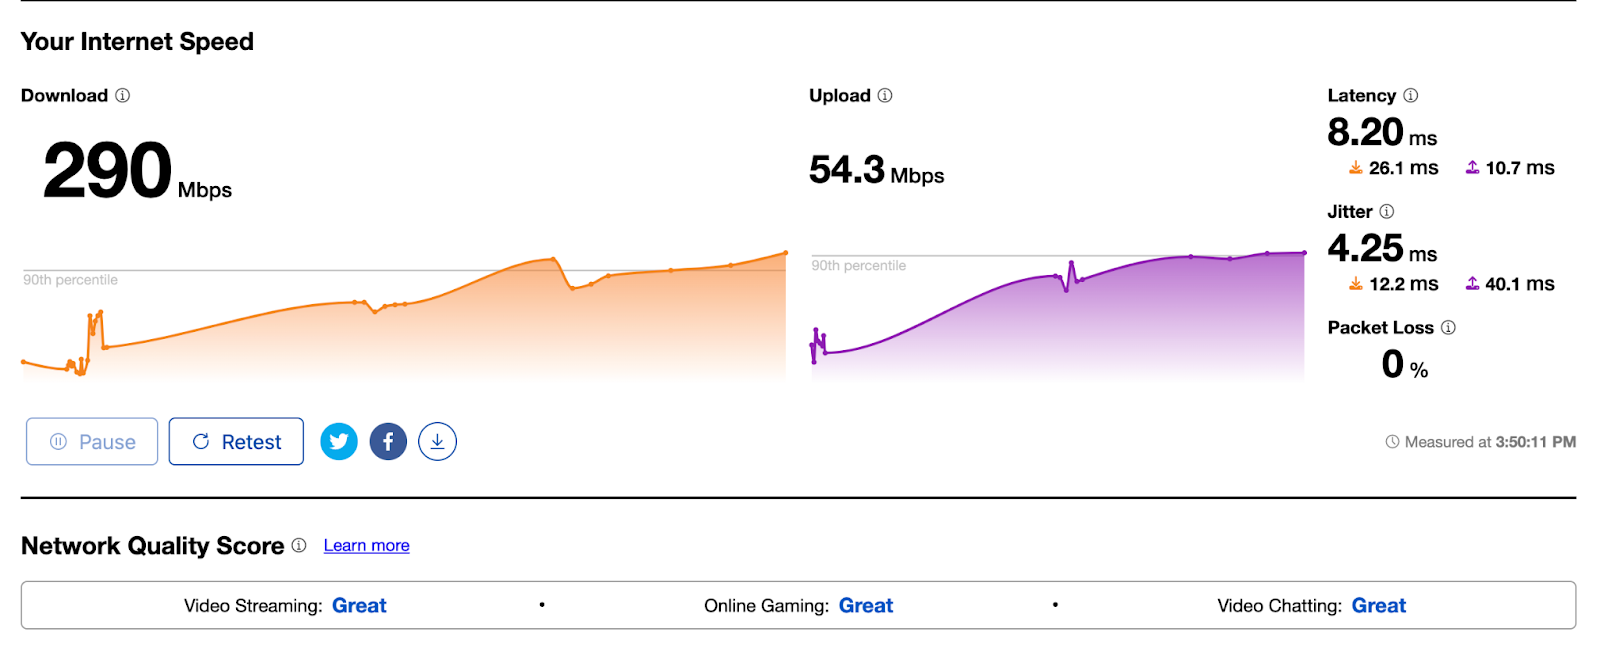
You’re visiting your family for the holidays and you connect to the WiFi, and then notice Netflix isn’t loading as fast as it normally does. You go to speed.cloudflare.com, fast.com, speedtest.net, or type “speed test” into Google Chrome to figure out if there is a problem with your Internet connection, and get something that looks like this:
If you want to see what that looks like for you, try it yourself here. But what do those numbers mean? How do those numbers relate to whether or not your Netflix isn’t loading or any of the other common use cases: playing games or audio/video chat with your friends and loved ones? Even network engineers find that speed tests are difficult to relate to the user experience of… using the Internet..
Amazingly, speed tests have barely changed in nearly two decades, even though the way we use the Internet has changed a lot. With so many more people on the Internet, the gaps between speed tests and the user’s experience of network quality are growing. The problem is so important that the Internet’s standards organization is paying attention, too.
From a high-level, there are three grand network test challenges:
Finding ways to efficiently and accurately measure network quality, and convey to end-users if and how the quality affects their experience.
When a problem is found, figuring out where the problem exists, be it the wireless connection, or one many cables and machines that make up the Internet.
Understanding a single user’s test results in context of their neighbors’, or archiving the results to, for example, compare neighborhoods or know if the network is getting better or worse.
Cloudflare is excited to announce a new Aggregated Internet Measurement (AIM) initiative to help address all three challenges. AIM is a new and open format for displaying Internet quality in a way that makes sense to end users of the Internet, around use cases that demand specific types of Internet performance while still retaining all of the network data engineers need to troubleshoot problems on the Internet. We’re excited to partner with Measurement Lab on this project and store all of this data in a publicly available repository that you can access to analyze the data behind the scores you see on your speed test page.
What is a speed test?
A speed test is a point-in-time measurement of your Internet connection. When you connect to any speed test, it typically tries to fetch a large file (important for video streaming), performs a packet loss test (important for gaming), measures jitter (important for video/VoIP calls), and latency (important for all Internet use cases). The goal of this test is to measure your Internet connection’s ability to perform basic tasks.
There are some challenges with this approach that start with a simple observation: At the “network-layer” of the Internet that moves data and packets around, there are three and only three measures that can be directly observed. They are,
available bandwidth, sometimes known as “throughput;
packet loss, which has to happen but not too much; and
latency, often referred to as the round-trip time (RTT).
These three attributes are tightly interwoven. In particular, the portion of available bandwidth that a user actually achieves (throughput) is directly affected by loss and latency. Your computer uses loss and latency to decide when to send a packet, or not. Some loss and latency is expected, even needed! Too much of either, and bandwidth starts to fall.
These are simple numbers, but their relationship is far from simple. Think about all the ways to add two numbers to equal as much as one-hundred, x + y ≤ 100. If x and y are just right, then they add to one hundred. However, there are many combinations of x and y that do. Worse is that if either x or y or both are a little wrong, then they add to less than one-hundred. In this example, x and y are loss and latency, and 100 is the available bandwidth.
There are other forces at work, too, and these numbers do not tell the whole story. But they are the only numbers that are directly observable. Their meaning and the reasons they matter for diagnosis are important, so let’s discuss each one of those in order and how Aggregated Internet Measurement tries to solve each of these.
What do the numbers in a speed test mean?
Most speed tests will run and produce the numbers you saw above: bandwidth, latency, jitter, and packet loss. Let’s break down each of these numbers one by one to explain what they mean:
Bandwidth
Bandwidth is the maximum throughput/capacity over a communication link. The common analogy used to define bandwidth is if your Internet connection is a highway, bandwidth is how many lanes the highway has and cars that fit on it. Bandwidth has often been called “speed” in the past because Internet Service Providers (ISPs) measure speed as the amount of time it takes to download a large file, and having more bandwidth on your connection can make that happen faster.
Packet loss
Packet loss is exactly what it sounds like: some packets are sent from a source to a destination, but the packets are not received by the destination. This can be very impactful for many applications, because if information is lost in transit en route to the receiver, it an e ifiult fr te recvr t udrsnd wt s bng snt (it can be difficult for the receiver to understand what is being sent).
Latency
Latency is the time it takes for a packet/message to travel from point A to point B. At its core, the Internet is composed of computers sending signals in the form of electrical signals or beams of light over cables to other computers. Latency has generally been defined as the time it takes for that electrical signal to go from one computer to another over a cable or fiber. Therefore, it follows that one way to reduce latency is to shrink the distance the signals need to travel to reach their destination.
There is a distinction in latency between idle latency and latency under load. This is because there are queues at routers and switches that store data packets when they arrive faster than they can be transmitted. Queuing is normal, by design, and keeps data flowing correctly. However, if the queues are too big, or when other applications behave very differently from yours, the connection can feel slower than it actually is. This event is called bufferbloat.
In our AIM test we look at idle latency to show you what your latency could be, but we also collect loaded latency, which is a better reflection of what your latency is during your day-to-day Internet experience.
Jitter
Jitter is a special way of measuring latency. It is the variance in latency on your Internet connection. If jitter is high, it may take longer for some packets to arrive, which can impact Internet scenarios that require content to be delivered in real time, such as voice communication.
A good way to think about jitter is to think about a commute to work along some route or path. Latency, alone, asks “how far am I from the destination measured in time?” For example, the average journey on a train is 40 minutes. Instead of journey time, jitter asks, “how consistent is my travel time?” Thinking about the commute, a jitter of zero means the train always takes 40 minutes. However, if the jitter is 15 then, well, the commute becomes a lot more challenging because it could take anywhere from 25 to 55 minutes.
But even if we understand these numbers, for all that they might tell us what is happening, they are unable to tell us where something is happening.
Is Wi-Fi or my Internet connection the problem?
When you run a speed test, you’re not just connecting to your ISP, you’re also connecting to your local network which connects to your ISP. And your local network may have problems of its own. Take a speed test that has high packet loss and jitter: that generally means something on the network could be dropping packets. Normally, you would call your ISP, who will often say something like “get closer to your Wi-Fi access point or get an extender”.
This is important — Wi-Fi uses radio waves to transmit information, and materials like brick, plaster, and concrete can interfere with the signal and make it weaker the farther away you get from your access point. Mesh Wi-Fi appliances like Nest Wi-Fi and Eero periodically take speed tests from their main access point specifically to help detect issues like this. So having potential quick solutions for problems like high packet loss and jitter and giving that to users up front can help users better ascertain if the problem is related to their wireless connection setup.
While this is true for most issues that we see on the Internet, it often helps if network operators are able to look at this data in aggregate in addition to simply telling users to get closer to their access points. If your speed test went to a place where your network operator could see it and others in your area, network engineers may be able to proactively detect issues before users report them. This not only helps users, it helps network providers as well, because fielding calls and sending out technicians for issues due to user configuration are expensive in addition to being time-consuming.
This is one of the goals of AIM: to help solve the problem before anyone picks up a phone. End users can get a series of tips that will help them understand what their Internet connection can and can’t do and how they can improve it in an easy-to-read format, and network operators can get all the data they need to detect last mile issues before anyone picks up a phone, saving time and money. Let’s talk about how that can work with a real example.
An example from real life
When you get a speed test result, the numbers you get can be confusing. This is because you may not understand how those numbers combine to impact your Internet experience. Let’s talk about a real life example and how that impacts you.
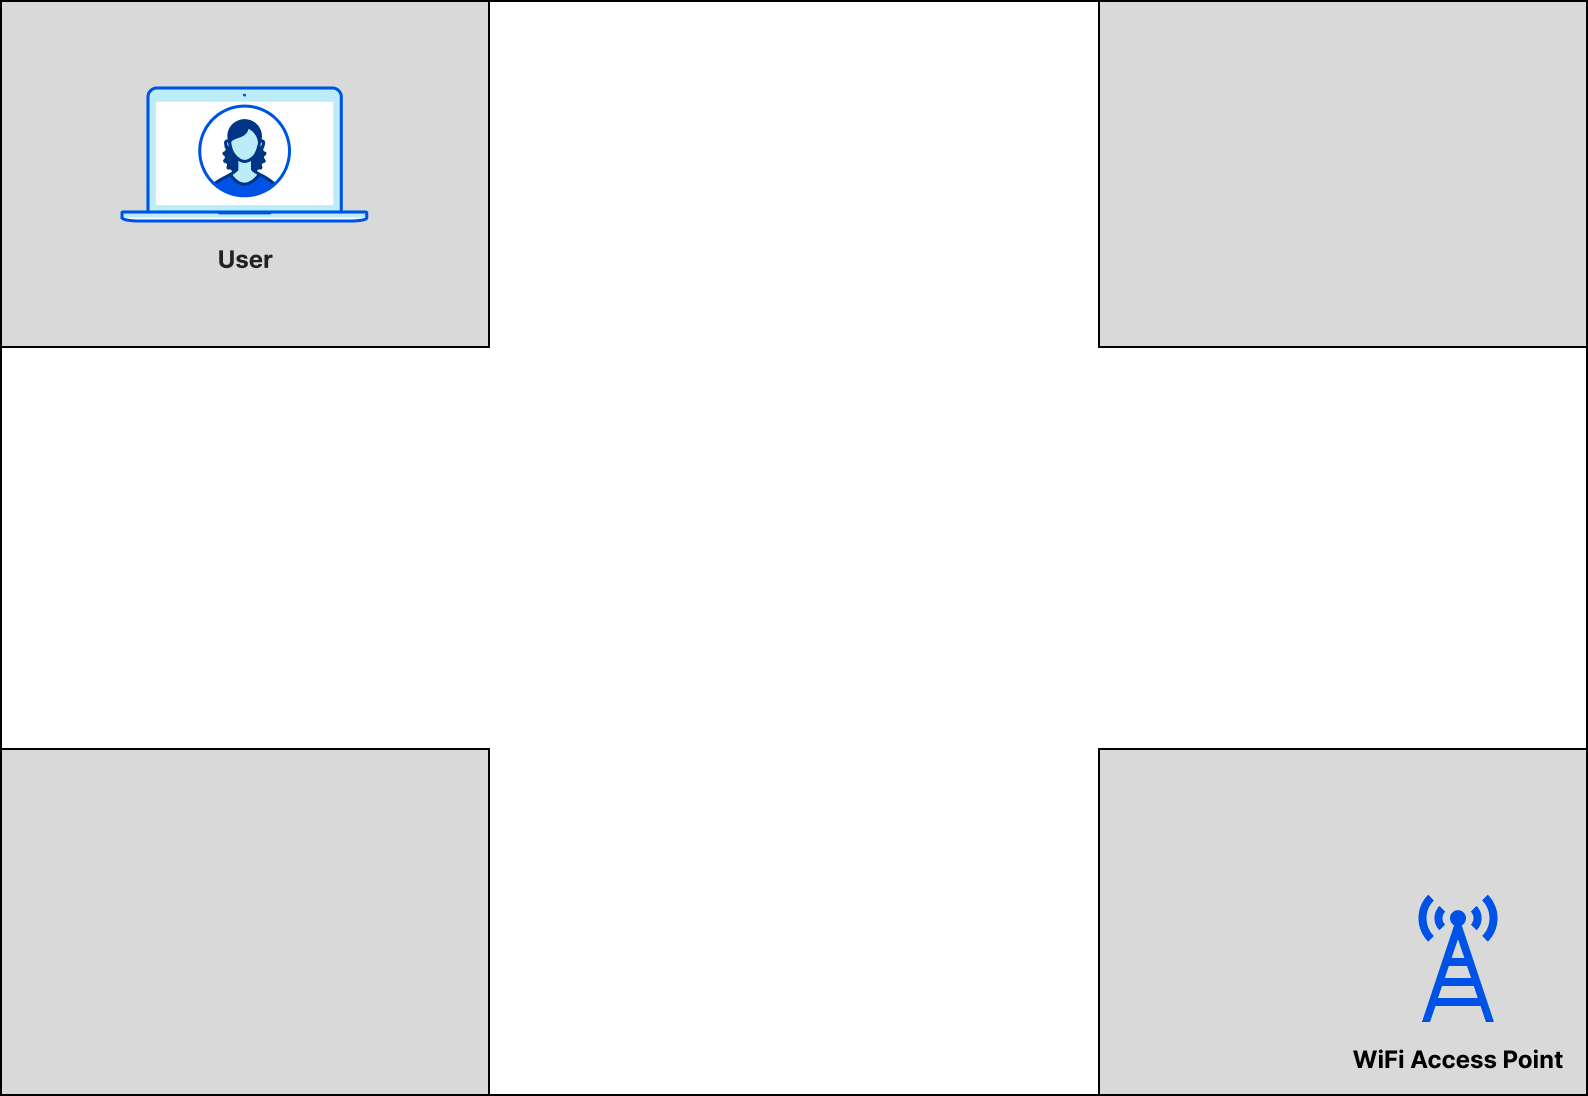
Say you work in a building with four offices and a main area that looks like this:
You have to make video calls to your clients all day, and you sit in the office the farthest away from the wireless access point. Your calls are dropping constantly, and you’re having an awful experience. When you run a speed test from your office, you see this result:
Metric
Far away from access point
Close to access point
Download Bandwidth
21.8 Mbps
25.7 Mbps
Upload Bandwidth
5.66 Mbps
5.26 Mbps
Unloaded Latency
19.6 ms
19.5 ms
Jitter
61.4 ms
37.9 ms
Packet Loss
7.7%
0%
How can you make sense of these? A network engineer would take a look at the high jitter and the packet loss and think “well this user probably needs to move closer to the router to get a better signal”. But you may take a look at these results and have no idea, and have to ask a network engineer for help, which could lead to a call to your ISP, wasting the time and money of everyone. But you shouldn’t have to consult a network engineer to figure out if you need to move your Wi-Fi access point, or if your ISP isn’t giving her a good experience.
Aggregated Internet Measurement assigns qualitative assessments to the numbers on your speed test to help you make sense of these numbers. We’ve created scenario-specific scores, which is a singular qualitative value that is calculated on a scenario level: we calculate different quality scores based on what you’re trying to do. To start, we’ve created three AIM scores: Streaming, Gaming, and WebChat/RTC. Those scores weigh each metric differently based on what Internet conditions are required for the application to run successfully.
The AIM scoring rubric assigns point values to your connection based on the tests. We’re releasing AIM with a “weighted score,” in which the point values are calculated based on what metrics matter the most in those scenarios. These point scores aren’t designed to be static, but to evolve based on what application developers, network operators, and the Internet community discover about how different performance characteristics affect application experience for each scenario — and it’s one more reason to post the data to M-Lab, so that the community can help design and converge on good scoring mechanisms.
Here is the full rubric and each of the point values associated with the metrics today:
Metric
0 points
5 points
10 points
20 points
30 points
50 points
Loss Rate
> 5%
< 5%
< 1%
Jitter
> 20 ms
< 20ms
< 10ms
Unloaded latency
> 100ms
< 50ms
< 20ms
< 10ms
Download Throughput
< 1Mbps
< 10Mbps
< 50Mbps
< 100Mbps
< 1000Mbps
Upload Throughput
< 1Mbps
< 10Mbps
< 50Mbps
< 100Mbps
< 1000Mbps
Difference between loaded and unloaded latency
> 50ms
< 50ms
< 20ms
< 10ms
And here’s a quick overview of what values matter and how we calculate scores for each scenario:
To calculate each score, we take the point values from your speed test and calculate that out of the total possible points for that scenario. So based on the result, we can give your Internet connection a judgment for each scenario: Bad, Poor, Average, Good, and Great. For example, for Video calls, packet loss, jitter, unloaded latency, and the difference between loaded and unloaded latency matter when determining whether your Internet quality is good for video calls. We add together the point values derived from your speed test values, and we get a score that shows how far away from the perfect video call experience your Internet quality is. Based on your speed test, here are the AIM scores from your office far away from the access point:
Metric
Result
Streaming Score
25/70 pts (Average)
Gaming Score
15/40 pts (Poor)
RTC Score
15/50 pts (Average)
So instead of saying “Your bandwidth is X and your jitter is Y”, we can say “Your Internet is okay for Netflix, but poor for gaming, and only average for Zoom”. In this case, moving the Wi-Fi access point to a more centralized location turned out to be the solution, and turned your AIM scores into this:
Metric
Result
Streaming Score
45/70 pts (Good)
Gaming Score
35/40 pts (Great)
RTC Score
35/50 pts (Great)
You can even see these results on the Cloudflare speed test today as a Network Quality Score:
In this particular case, there was no call required to the ISP, and no network engineers were consulted. Simply moving the access point closer to the middle of the office improved the experience for everyone, and no one needed to pick up the phone, providing a more seamless experience for everyone.
AIM takes the metrics that network engineers care about, and it translates them into a more human-readable metric that’s based on the applications you are trying to use. Aggregated data is anonymously stored in a public repository (in compliance with our privacy policy), so that your ISP can actually look up speed tests in your metro area and that use your ISP and get the underlying data to help translate user complaints into something that is actionable by network engineers. Additionally, policymakers and researchers can examine the aggregate data to better understand what users in their communities are experiencing to help lobby for better Internet quality.
Working conditions
Here’s an interesting question: When you run a speed test, where are you connecting to, and what is the Internet like at the other end of the connection? One of the challenges that speed tests often face is that the servers you run your test against are not the same servers that run or protect your websites. Because of this, the network paths your speed test may take to the host on the other side may be vastly different, and may even be optimized to serve as many speed tests as possible. This means that your speed test is not actually testing the path that your traffic normally takes when it’s reaching the applications you normally use. The tests that you ran are measuring a network path, but it’s not the network path you use on a regular basis.
Speed tests should be run under real-world network conditions that reflect how people use the Internet, with multiple applications, browser tabs, and devices all competing for connectivity. This concept of measuring your Internet connection using application-facing tools and doing so while your network is being used as much as possible is called measuring under working conditions. Today, when speed tests run, they make entirely new connections to a website that is reserved for testing network performance. Unfortunately, day-to-day Internet usage isn’t done on new connections to dedicated speed test websites. This is actually by design for many Internet applications, which rely on reusing the same connection to a website to provide a better performing experience to the end-user by eliminating costly latency incurred by establishing encryption, exchanging of certificates, and more.
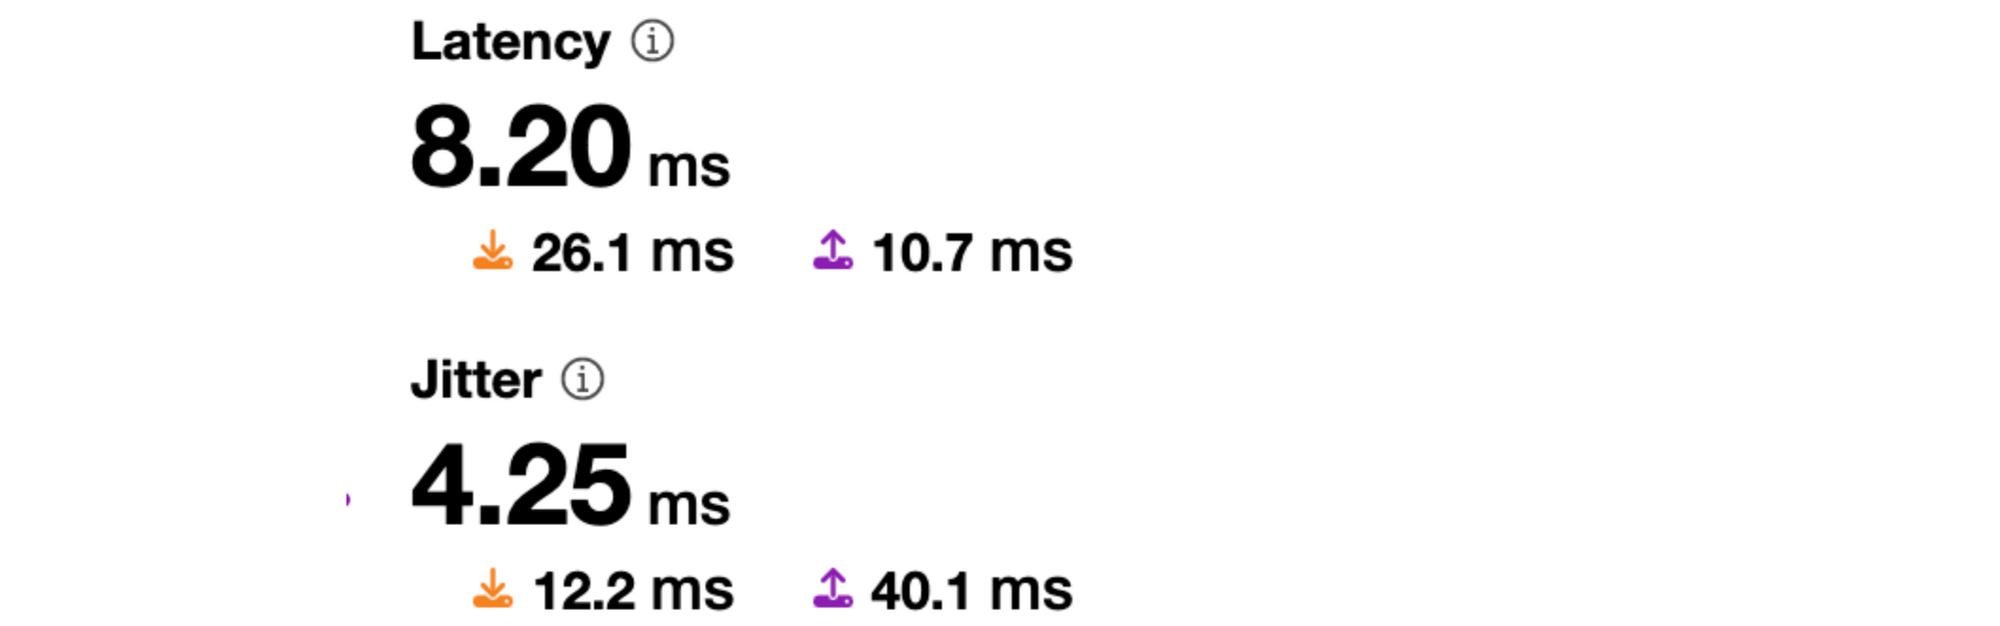
AIM is helping to solve this problem in several ways. The first is that we’ve implemented all of our tests the same way our applications would, and measure them under working conditions. We measure loaded latency to show you how your Internet connection behaves when you’re actually using it. You can see it on the speed test today:
The second is that we are collecting speed test results against endpoints that you use today. By measuring speed tests against Cloudflare and other sites, we are showing end user Internet quality against networks that are frequently used in your daily life, which gives a better idea of what actual working conditions are.
AIM database
We’re excited to announce that AIM data is publicly available today through a partnership with Measurement Lab (M-Lab), and end-users and network engineers alike can parse through network quality data across a variety of networks. M-Lab and Cloudflare will both be calculating AIM scores derived from their speed tests and putting them into a shared database so end-users and network operators alike can see Internet quality from as many points as possible across a multitude of different speed tests.
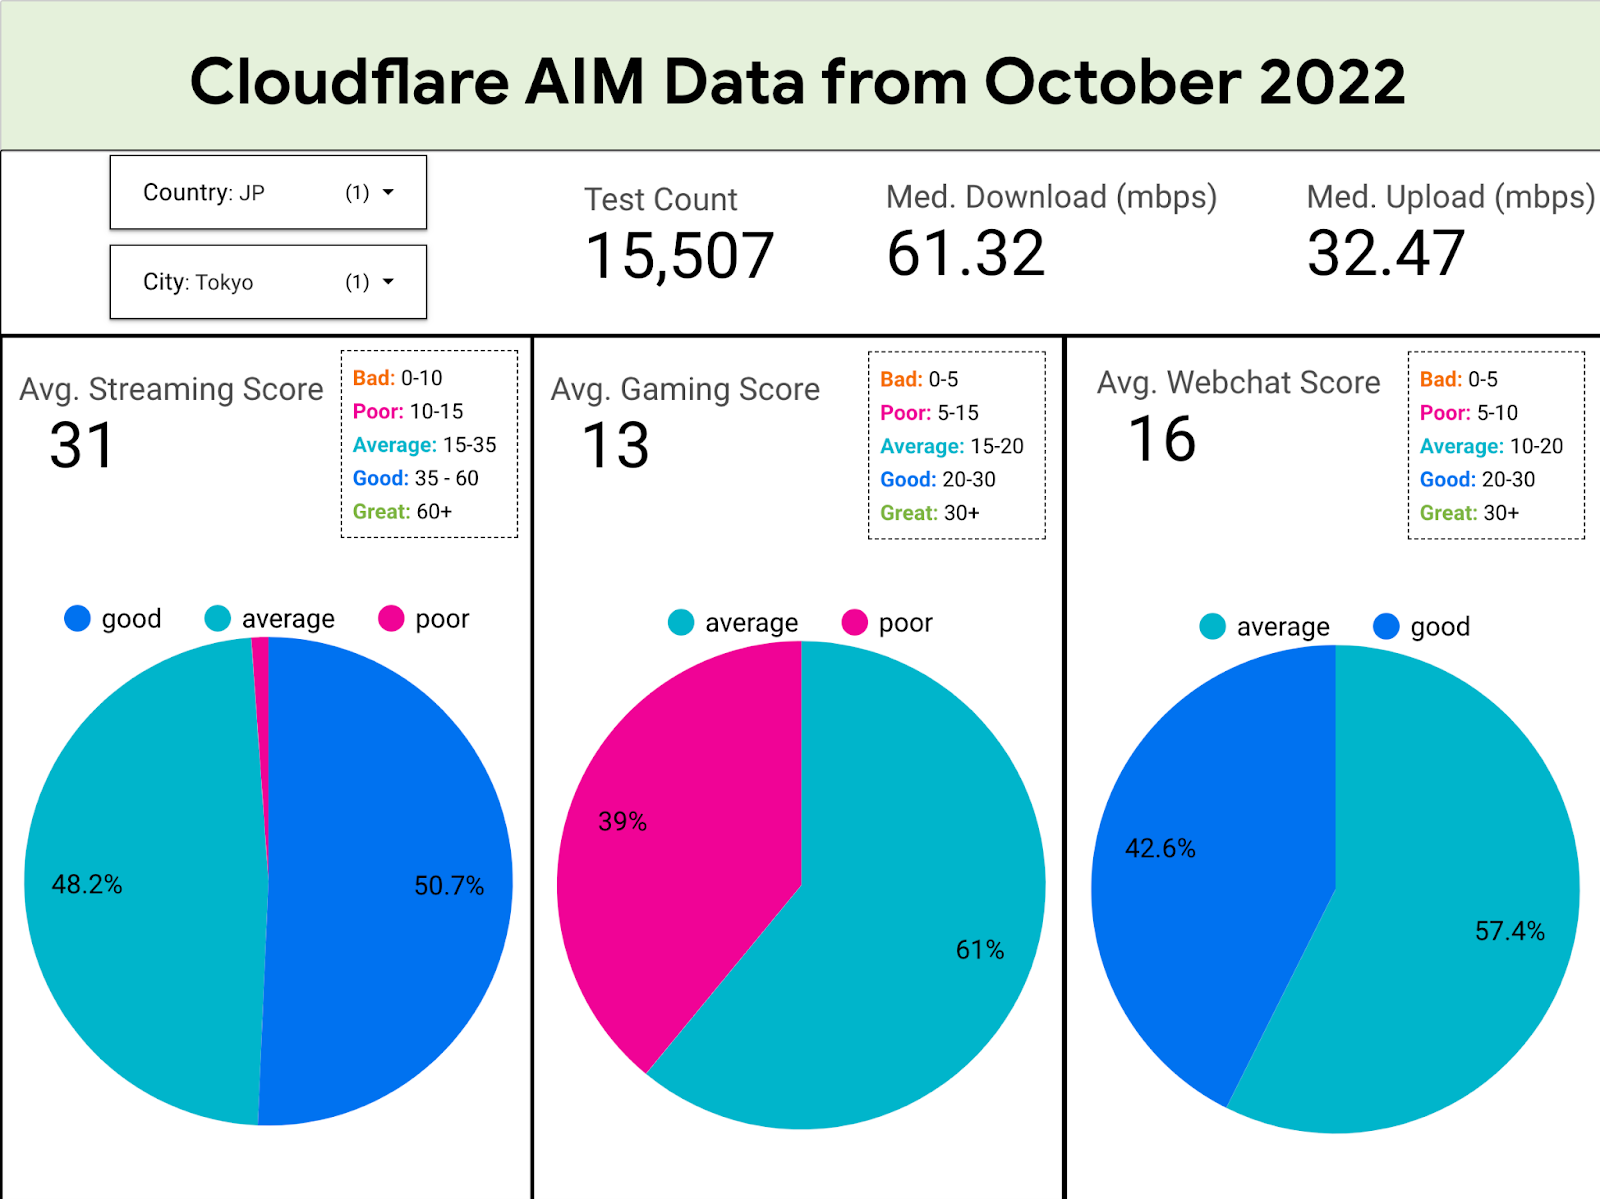
For just a sample of what we’re seeing, let’s take a look at a visual we’ve made using this data plotting scores from only Cloudflare data per scenario in Tokyo, Japan for the first week of October:
Based on this, you can see that out of the 5,814 speed tests run, 50.7% of those users had a good streaming quality, but 48.2% were only average. Gaming is hard in Tokyo as 39% of users had a poor gaming experience, but most users had a pretty average-to-decent RTC experience. Let’s take a look at how that compares to some of the other cities we see:
City
Average Streaming Score
Average Gaming Score
Average RTC Score
Tokyo
31
13
16
New York
33
13
17
Mumbai
25
13
16
Dublin
32
14
18
Based on our data, we can see that most users do okay for video streaming except for Mumbai, which is a bit behind. Users generally have a pretty bad gaming experience due to high latency, but their RTC apps do slightly better, being generally average in all the locales.
Collaboration with M-Lab
M-Lab is an open, Internet measurement repository whose mission is to measure the Internet, save the data, and make it universally accessible and useful. In addition to providing free and open access to the AIM data for network operators, M-Lab will also be giving policymakers, academic researchers, journalists, digital inclusion advocates, and anyone who is interested access to the data they need to make important decisions that can help improve the Internet.
In addition to already being an established name in open sharing of Internet quality data to policymakers and academics, M-Lab already provides a “speed” test called Network Diagnostic Test (NDT) that is the same speed test you run when you type “speed test” into Google. By partnering with M-Lab, we are getting Aggregated Internet Measurement metrics from many more users. We want to partner with other speed tests as well to get the complete picture of how Internet quality is mapped across the world for as many users as possible. If you measure Internet performance today, we want you to join us to help show users what their Internet is really good for.
A bright future for Internet quality
We’re excited to put this data together to show Internet quality across a variety of tests and networks. We’re going to be analyzing this data and improving our scoring system, even open-sourcing it so that you can see how we are using speed test measurements to score Internet quality across a variety of different applications and even implement AIM yourself. Eventually we’re going to put our AIM scores in the speed test alongside all the tests you see today so that you can finally get a better understanding of what your Internet is good for.
If you’re running a speed test today, and you’re interested in partnering with us to help gather data on how users experience Internet quality, reach out to us and let’s work together to help make the Internet better.
Figuring out what your Internet is good for shouldn’t require you to become a networking expert; that’s what we’re here for. With AIM and our collaborators at MLab, we want to be able to tell you what your Internet can do and use that information to help make the Internet better for everyone.
This blog post is written by Sumit Menaria, Senior Hybrid Solutions Architect AWS WWSO Core Services.
AWS Outposts Rack is a fully-managed service that extends AWS infrastructure, services, APIs, and tools to customer premises. By providing local access to AWS managed infrastructure and services, Outposts rack enables customers to build and run applications on premises using the same programming interfaces as in AWS Regions, while using local compute and storage resources for low latency, local data processing, and data residency needs.
There are various data sources on premises that you might want to connect from your Outpost. These sources can include field devices, on-premises databases, mainframes, storage arrays, or end users. Each Outpost supports a single Local Gateway (LGW) construct, which enables connectivity from your Outpost subnets to an on-premises network. Note that this post is specific to Outposts racks and a different method of local communication is used for AWS Outposts servers.
Two different options for facilitating communication between your Outpost based resources and on-premises network: Direct VPC routing and customer-owned IP pool. Both of these are mutually exclusive options, and routing works differently based on your choice of the mode. The two modes are the attributes of the LGW route table that your Outpost subnets’ VPC is associated with, which specifies the communication mode for the Outpost subnets.
Direct VPC routing mode
Direct VPC routing uses the private IP address of the instances in the VPC CIDR block to facilitate communication with your on-premises network. These addresses are advertised to your on-premises network with Border Gateway Protocol (BGP). Advertisement via BGP is only for the private IP addresses that belong to the subnets on your Outpost and have a route pointing to the LGW via the subnet’s route table. This type of routing is the default mode for Outposts Rack. In this mode, the LGW doesn’t perform Network Address Translation (NAT) for instances. Furthermore, you don’t have to assign an Elastic IP address to your Amazon Elastic Compute Cloud (Amazon EC2) instance from a (CoIP) to enable communication with your on-premises resources.
In this diagram, when the instance Y wants to communicate with an on-premises server, it traverses the LGW and can talk to the on-premises server using its source address (10.0.1.11) in the Subnet CIDR range (10.0.1.0/24) that is advertised over BGP from the LGW to the Customer Network Device. Similarly when the on-premises server wants to initiate communication with the Outpost based EC2 instance, it uses the instance’s private IP address (10.0.1.11) as the destination IP address to set up the connection.
CoIP mode
Utilizing CoIP mode means that you must provide a separate IP address range from your on-premises IP space for AWS to create an address pool, known as a CoIP. With CoIP, when an Outpost based resources, such as EC2 instances, Application Load Balancer (ALB), or Amazon Relational Database Service (Amazon RDS) instances, need to communicate to your on-premises network, the Local Gateway will perform 1:1 NAT from the resource’s private IP address from the Outpost subnet range to an IP address from the CoIP pool. The subnet-to-CoIP address mapping is done by assigning an Elastic IP (EIP) from the CoIP address range allocated for resources such as EC2 instances. To enable the communication with the CoIP pool from the on-premises network, and then the LGW advertises the CoIP pool through BGP over its peering with the Customer Network Device.
In this diagram, when the instance Y wants to talk to an on-premises server, the traffic traverses the LGW and the source IP address (10.0.1.11) of the instance gets translated to an IP address (192.168.0.11) in the CoIP range that is associated with the instance. Similarly, when the on-premises server initiates the communication, the request will be sent with the CoIP address (192.168.0.11) of the instance as the destination IP address. This will be changed to the instance’s private IP address (10.0.1.11) via NAT at the LGW. The CoIP pool (192.168.0.0/26) is advertised via BGP to the Customer Network Device to provide the route to the on-premises environment for reaching the Outpost based resources.
When to choose CoIP routing mode
CoIP is particularly useful when you want to isolate your Outpost based workloads from the on-premises infrastructure and only need specific resources on the Outpost to be able to communicate to the on-premises infrastructure. This is useful in situations where large enterprise networks have hundreds of IP pools allocated and there is a high chance of overlap between IP addresses allocated to Outpost based VPCs/Subnets and those allocated to on-premises infrastructure. Furthermore, CoIP can act as another layer of security, as you may choose to allocate the CoIP addresses to only the resources which must communicate with the on-premises network. Then you can allocate for the rest of them using the subnet private IP address range for communication within the Outpost or Region based resources.
This means that you don’t need to have the number of IPs in the CoIP pool be equal to the number of resources on your Outpost. For example, you may choose to configure a /26 CoIP range and a /22 pool for subnets to meet your workload requirements.
CoIP mode can also be useful when using an external ALB on Outpost and you want to make it routable through the local internet connectivity. By using a smaller internet routable CoIP address range assignment for your external ALB, you can route traffic to the ALB on the Outpost without needing to traverse through the internet gateway (IGW) in the parent Region.
When to choose Direct VPC routing mode
You can choose Direct VPC routing if you don’t want the operational overhead of managing the additional IP pools for NAT between your Outpost based resources and on-premises network. There are also few applications which may not work well if there is an NAT of IPs between the two endpoints communicating with each other. Some examples you may see are Active Directory communication with on-premises based servers, or iSCSI mount of your instances as an additional storage to on-premises Storage Area Network (SAN). These applications may not work or may need additional tuning if they encounter NATed IP addresses between an Outpost based client on an EC2 instance and on-premises based server for a two-way communication.
When Direct VPC routing mode is used, multiple VPCs can be associated to an Outpost LGW route table, and the Outpost subnets with the LGW as the route target, are automatically advertised to the on-premises network through BGP. Therefore, you must make sure that appropriate IP planning is in place to avoid any overlap of the Outpost VPC/Subnet IP range with the on-premises IP range, as they are directly advertised from LGW toward the Customer Network Device. Having overlapping IP subnets in your network can lead to undesired effects on your application connectivity and you must pay special attention when allocating IP pools for your on-premises and Outpost based VPC address space. You can use Amazon VPC IP Address Manager (IPAM) to plan the IP space of your VPCs and CoIP pools, as well as add on-premises based IP Pools using manual allocation.
Conclusion
You can select either Direct VPC routing or CoIP mode for routing through an Outpost Local Gateway. Since this selection affects the routing for all of the subnets on your Outpost associated with the LGW route table, it should be selected based on your workload requirements and existing IP infrastructure planning. You can also change the LGW route table mode at a later stage. However, that involves network disruption and the creation of a new LGW route table. To learn more about Outposts Racks routing, visit the LGW Route table documentation.
The tax code isn’t software. It doesn’t run on a computer. But it’s still code. It’s a series of algorithms that takes an input—financial information for the year—and produces an output: the amount of tax owed. It’s incredibly complex code; there are a bazillion details and exceptions and special cases. It consists of government laws, rulings from the tax authorities, judicial decisions, and legal opinions.
Like computer code, the tax code has bugs. They might be mistakes in how the tax laws were written. They might be mistakes in how the tax code is interpreted, oversights in how parts of the law were conceived, or unintended omissions of some sort or another. They might arise from the exponentially huge number of ways different parts of the tax code interact.
A recent example comes from the 2017 Tax Cuts and Jobs Act. That law was drafted in both haste and secret, and quickly passed without any time for review—or even proofreading. One of the things in it was a typo that accidentally categorized military death benefits as earned income. The practical effect of that mistake is that surviving family members were hit with surprise tax bills of US$10,000 or more.
That’s a bug, but not a vulnerability. An example of a vulnerability is the “Double Irish with a Dutch Sandwich.” It arises from the interactions of tax laws in multiple countries, and it’s how companies like Google and Apple have avoided paying U.S. taxes despite being U.S. companies. Estimates are that U.S. companies avoided paying nearly US$200 billion in taxes in 2017 alone.
In the tax world, vulnerabilities are called loopholes. Exploits are called tax avoidance strategies. And there are thousands of black-hat researchers who examine every line of the tax code looking for exploitable vulnerabilities—tax attorneys and tax accountants.
Some vulnerabilities are deliberately created. Lobbyists are constantly trying to insert this or that provision into the tax code that benefits their clients financially. That same 2017 U.S. tax law included a special tax break for oil and gas investment partnerships, a special exemption that ensures that fewer than 1 in 1,000 estates will have to pay estate tax, and language specifically expanding a pass-through loophole that industry uses to incorporate companies offshore and avoid U.S. taxes. That’s not hacking the tax code. It’s hacking the processes that create them: the legislative process that creates tax law.
We know the processes to use to fix vulnerabilities in computer code. Before the code is finished, we can employ some sort of secure development processes, with automatic bug-finding tools and maybe source code audits. After the code is deployed, we might rely on vulnerability finding by the security community, perhaps bug bounties—and most of all, quick patching when vulnerabilities are discovered.
What does it mean to “patch” the tax code? Passing any tax legislation is a big deal, especially in the United States where the issue is so partisan and contentious. (That 2017 earned income tax bug for military families hasn’t yet been fixed. And that’s an easy one; everyone acknowledges it was a mistake.) We don’t have the ability to patch tax code with anywhere near the same agility that we have to patch software.
We can patch some vulnerabilities, though. The other way tax code is modified is by IRS and judicial rulings. The 2017 tax law capped income tax deductions for property taxes. This provision didn’t come into force in 2018, so someone came up with the clever hack to prepay 2018 property taxes in 2017. Just before the end of the year, the IRS ruled about when that was legal and when it wasn’t. Short answer: most of the time, it wasn’t.
There’s another option: that the vulnerability isn’t patched and isn’t explicitly approved, and slowly becomes part of the normal way of doing things. Lots of tax loopholes end up like this. Sometimes they’re even given retroactive legality by the IRS or Congress after a constituency and lobbying effort gets behind them. This process is how systems evolve. A hack subverts the intent of a system. Whatever governing system has jurisdiction either blocks the hack or allows it—or does nothing and the hack becomes the new normal.
Here’s my question: what happens when artificial intelligence and machine learning (ML) gets hold of this problem? We already have ML systems that find software vulnerabilities. What happens when you feed a ML system the entire U.S. tax code and tell it to figure out all of the ways to minimize the amount of tax owed? Or, in the case of a multinational corporation, to feed it the entire planet’s tax codes? What sort of vulnerabilities would it find? And how many? Dozens or millions?
In 2015, Volkswagen was caught cheating on emissions control tests. It didn’t forge test results; it got the cars’ computers to cheat for them. Engineers programmed the software in the car’s onboard computer to detect when the car was undergoing an emissions test. The computer then activated the car’s emissions-curbing systems, but only for the duration of the test. The result was that the cars had much better performance on the road at the cost of producing more pollution.
ML will result in lots of hacks like this. They’ll be more subtle. They’ll be even harder to discover. It’s because of the way ML systems optimize themselves, and because their specific optimizations can be impossible for us humans to understand. Their human programmers won’t even know what’s going on.
Any good ML system will naturally find and exploit hacks. This is because their only constraints are the rules of the system. If there are problems, inconsistencies, or loopholes in the rules, and if those properties lead to a “better” solution as defined by the program, then those systems will find them. The challenge is that you have to define the system’s goals completely and precisely, and that that’s impossible.
The tax code can be hacked. Financial markets regulations can be hacked. The market economy, democracy itself, and our cognitive systems can all be hacked. Tasking a ML system to find new hacks against any of these is still science fiction, but it’s not stupid science fiction. And ML will drastically change how we need to think about policy, law, and government. Now’s the time to figure out how.
This essay originally appeared in the September/October 2020 issue of IEEE Security & Privacy. I wrote it when I started writing my latest book, but never published it here.
The collective thoughts of the interwebz
Manage Consent
To provide the best experiences, we use technologies like cookies to store and/or access device information. Consenting to these technologies will allow us to process data such as browsing behavior or unique IDs on this site. Not consenting or withdrawing consent, may adversely affect certain features and functions.
Functional
Always active
The technical storage or access is strictly necessary for the legitimate purpose of enabling the use of a specific service explicitly requested by the subscriber or user, or for the sole purpose of carrying out the transmission of a communication over an electronic communications network.
Preferences
The technical storage or access is necessary for the legitimate purpose of storing preferences that are not requested by the subscriber or user.
Statistics
The technical storage or access that is used exclusively for statistical purposes.The technical storage or access that is used exclusively for anonymous statistical purposes. Without a subpoena, voluntary compliance on the part of your Internet Service Provider, or additional records from a third party, information stored or retrieved for this purpose alone cannot usually be used to identify you.
Marketing
The technical storage or access is required to create user profiles to send advertising, or to track the user on a website or across several websites for similar marketing purposes.