Give us a ping. (Cloudflare) One ping only

Post Syndicated from Abe Carryl original https://blog.cloudflare.com/the-most-exciting-ping-release/

Give us a ping. (Cloudflare) One ping only

Give us a ping. (Cloudflare) One ping only

Ping was born in 1983 when the Internet needed a simple, effective way to measure reachability and distance. In short, ping (and subsequent utilities like traceroute and MTR)  provides users with a quick way to validate whether one machine can communicate with another. Fast-forward to today and these network utility tools have become ubiquitous. Not only are they now the de facto standard for troubleshooting connectivity and network performance issues, but they also improve our overall quality of life by acting as a common suite of tools almost all Internet users are comfortable employing in their day-to-day roles and responsibilities.

Making network utility tools work as expected is very important to us, especially now as more and more customers are building their private networks on Cloudflare. Over 10,000 teams now run a private network on Cloudflare. Some of these teams are among the world’s largest enterprises, some are small crews, and yet others are hobbyists, but they all want to know – can I reach that?

That’s why today we’re excited to incorporate support for these utilities into our already expansive troubleshooting toolkit for Cloudflare Zero Trust. To get started, sign up to receive beta access and start using the familiar debugging tools that we all know and love like ping, traceroute, and MTR to test connectivity to private network destinations running behind Tunnel.

Cloudflare Zero Trust

With Cloudflare Zero Trust, we’ve made it ridiculously easy to build your private network on Cloudflare. In fact, it takes just three steps to get started. First, download Cloudflare’s device client, WARP, to connect your users to Cloudflare. Then, create identity and device aware policies to determine who can reach what within your network. And finally, connect your network to Cloudflare with Tunnel directly from the Zero Trust dashboard.

Give us a ping. (Cloudflare) One ping only

We’ve designed Cloudflare Zero Trust to act as a single pane of glass for your organization. This means that after you’ve deployed any part of our Zero Trust solution, whether that be ZTNA or SWG, you are clicks, not months, away from deploying Browser Isolation, Data Loss Prevention, Cloud Access Security Broker, and Email Security. This is a stark contrast from other solutions on the market which may require distinct implementations or have limited interoperability across their portfolio of services.

It’s that simple, but if you’re looking for more prescriptive guidance watch our demo below to get started:

To get started, sign-up for early access to the closed beta. If you’re interested in learning more about how it works and what else we will be launching in the future, keep scrolling.

So, how do these network utilities actually work?

Ping, traceroute and MTR are all powered by the same underlying protocol, ICMP. Every ICMP message has 8-bit type and code fields, which define the purpose and semantics of the message. While ICMP has many types of messages, the network diagnostic tools mentioned above make specific use of the echo request and echo reply message types.

Every ICMP message has a type, code and checksum. As you may have guessed from the name, an echo reply is generated in response to the receipt of an echo request, and critically, the request and reply have matching identifiers and sequence numbers. Make a mental note of this fact as it will be useful context later in this blog post.

Give us a ping. (Cloudflare) One ping only

A crash course in ping, traceroute, and MTR

As you may expect, each one of these utilities comes with its own unique nuances, but don’t worry. We’re going to provide a quick refresher on each before getting into the nitty-gritty details.

Ping

Ping works by sending a sequence of echo request packets to the destination. Each router hop between the sender and destination decrements the TTL field of the IP packet containing the ICMP message and forwards the packet to the next hop. If a hop decrements the TTL to 0 before reaching the destination, or doesn’t have a next hop to forward to, it will return an ICMP error message – “TTL exceeded” or “Destination host unreachable” respectively – to the sender. A destination which speaks ICMP will receive these echo request packets and return matching echo replies to the sender. The same process of traversing routers and TTL decrementing takes place on the return trip. On the sender’s machine, ping reports the final TTL of these replies, as well as the roundtrip latency of sending and receiving the ICMP messages to the destination. From this information a user can determine the distance between themselves and the origin server, both in terms of number of network hops and time.

Traceroute and MTR

As we’ve just outlined, while helpful, the output provided by ping is relatively simple. It does provide some useful information, but we will generally want to follow up this request with a traceroute to learn more about the specific path to a given destination. Similar to ping, traceroutes start by sending an ICMP echo request. However, it handles TTL a bit differently. You can learn more about why that is the case in our Learning Center, but the important takeaway is that this is how traceroutes are able to map and capture the IP address of each unique hop on the network path. This output makes traceroute an incredibly powerful tool to understanding not only if a machine can connect to another, but also how it will get there! And finally, we’ll cover MTR. We’ve grouped traceroute and MTR together for now as they operate in an extremely similar fashion. In short, the output of an MTR will provide everything traceroute can, but with some additional, aggregate statistics for each unique hop. MTR will also run until explicitly stopped allowing users to receive a statistical average for each hop on the path.

Checking connectivity to the origin

Now that we’ve had a quick refresher, let’s say I cannot connect to my private application server. With ICMP support enabled on my Zero Trust account, I could run a traceroute to see if the server is online.

Here is simple example from one of our lab environments:

Give us a ping. (Cloudflare) One ping only

Then, if my server is online, traceroute should output something like the following:

traceroute -I 172.16.10.120
traceroute to 172.16.10.120 (172.16.10.120), 64 hops max, 72 byte packets
 1  172.68.101.57 (172.68.101.57)  20.782 ms  12.070 ms  15.888 ms
 2  172.16.10.100 (172.16.10.100)  31.508 ms  30.657 ms  29.478 ms
 3  172.16.10.120 (172.16.10.120)  40.158 ms  55.719 ms  27.603 ms

Let’s examine this a bit deeper. Here, the first hop is the Cloudflare data center where my Cloudflare WARP device is connected via our Anycast network. Keep in mind this IP may look different depending on your location. The second hop will be the server running cloudflared. And finally, the last hop is my application server.

Conversely, if I could not connect to my app server I would expect traceroute to output the following:

traceroute -I 172.16.10.120
traceroute to 172.16.10.120 (172.16.10.120), 64 hops max, 72 byte packets
 1  172.68.101.57 (172.68.101.57)  20.782 ms  12.070 ms  15.888 ms
 2  * * *
 3  * * *

In the example above, this means the ICMP echo requests are not reaching cloudflared. To troubleshoot, first I will make sure cloudflared is running by checking the status of the Tunnel in the ZeroTrust dashboard. Then I will check if the Tunnel has a route to the destination IP. This can be found in the Routes column of the Tunnels table in the dashboard. If it does not, I will add a route to my Tunnel to see if this changes the output of my traceroute.

Once I have confirmed that cloudflared is running and the Tunnel has a route to my app server, traceroute will show the following:

raceroute -I 172.16.10.120
traceroute to 172.16.10.120 (172.16.10.120), 64 hops max, 72 byte packets
 1  172.68.101.57 (172.68.101.57)  20.782 ms  12.070 ms  15.888 ms
 2  172.16.10.100 (172.16.10.100)  31.508 ms  30.657 ms  29.478 ms
 3  * * *

However, it looks like we still can’t quite reach the application server. This means the ICMP echo requests reached cloudflared, but my application server isn’t returning echo replies. Now, I can narrow down the problem to my application server, or communication between cloudflared and the app server. Perhaps the machine needs to be rebooted or there is a firewall rule in place, but either way we have what we need to start troubleshooting the last hop. With ICMP support, we now have many network tools at our disposal to troubleshoot connectivity end-to-end.

Note that the route cloudflared to origin is always shown as a single hop, even if there are one or more routers between the two. This is because cloudflared creates its own echo request to the origin, instead of forwarding the original packets. In the next section we will explain the technical reason behind it.

What makes ICMP traffic unique?

A few quarters ago, Cloudflare Zero Trust extended support for UDP end-to-end as well. Since UDP and ICMP are both datagram-based protocols, within the Cloudflare network we can reuse the same infrastructure to proxy both UDP and ICMP traffic. To do this, we send the individual datagrams for either protocol over a QUIC connection using QUIC datagrams between Cloudflare and the cloudflared instances within your network.

With UDP, we establish and maintain a session per client/destination pair, such that we are able to send only the UDP payload and a session identifier in datagrams. In this way, we don’t need to send the IP and port to which the UDP payload should be forwarded with every single packet.

However, with ICMP we decided that establishing a session like this is far too much overhead, given that typically only a handful of ICMP packets are exchanged between endpoints. Instead, we send the entire IP packet (with the ICMP payload inside) as a single datagram.

What this means is that cloudflared can read the destination of the ICMP packet from the IP header it receives. While this conveys the eventual destination of the packet to cloudflared, there is still work to be done to actually send the packet. Cloudflared cannot simply send out the IP packet it receives without modification, because the source IP in the packet is still the original client IP, and not a source that is routable to the cloudflared instance itself.

To receive ICMP echo replies in response to the ICMP packets it forwards, cloudflared must apply a source NAT to the packet. This means that when cloudflared receives an IP packet, it must complete the following:

  • Read the destination IP address of the packet
  • Strip off the IP header to get the ICMP payload
  • Send the ICMP payload to the destination, meaning the source address of the ICMP packet will be the IP of a network interface to which cloudflared can bind
  • When cloudflared receives replies on this address, it must rewrite the destination address of the received packet (destination because the direction of the packet is reversed) to the original client source address

Network Address Translation like this is done all the time for TCP and UDP, but is much easier in those cases because ports can be used to disambiguate cases where the source and destination IPs are the same. Since ICMP packets do not have ports associated with them, we needed to find a way to map packets received from the upstream back to the original source which sent cloudflared those packets.

For example, imagine that two clients 192.0.2.1 and 192.0.2.2 both send an ICMP echo request to a destination 10.0.0.8. As we previously outlined, cloudflared must rewrite the source IPs of these packets to a source address to which it can bind. In this scenario, when the echo replies come back, the IP headers will be identical: source=10.0.0.8 destination=<cloudflared’s IP>. So, how can cloudflared determine which packet needs to have its destination rewritten to 192.0.2.1 and which to 192.0.2.2?

To solve this problem, we use fields of the ICMP packet to track packet flows, in the same way that ports are used in TCP/UDP NAT. The field we’ll use for this purpose is the Echo ID. When an echo request is received, conformant ICMP endpoints will return an echo reply with the same identifier as was received in the request. This means we can send the packet from 192.0.2.1 with ID 23 and the one from 192.0.2.2 with ID 45, and when we receive replies with IDs 23 and 45, we know which one corresponds to each original source.

Of course this strategy only works for ICMP echo requests, which make up a relatively small percentage of the available ICMP message types. For security reasons, however, and owing to the fact that these message types are sufficient to implement the ubiquitous ping and traceroute functionality that we’re after, these are the only message types we currently support. We’ll talk through the security reasons for this choice in the next section.

How to proxy ICMP without elevated permissions

Generally, applications need to send ICMP packets through raw sockets. Applications have control of the IP header using this socket, so it requires elevated privileges to open. Whereas the IP header for TCP and UDP packets are added on send and removed on receive by the operating system. To adhere to security best-practices, we don’t really want to run cloudflared with additional privileges. We needed a better solution. To solve this, we found inspiration in the ping utility, which you’ll note can be run by any user, without elevated permissions. So then, how does ping send ICMP echo requests and listen for echo replies as a normal user program? Well, the answer is less satisfying: it depends (on the platform). And as cloudflared supports all the following platforms, we needed to answer this question for each.

Linux

On linux, ping opens a datagram socket for the ICMP protocol with the syscall socket(PF_INET, SOCK_DGRAM, PROT_ICMP). This type of socket can only be opened if the group ID of the user running the program is in /proc/sys/net/ipv4/ping_group_range, but critically, the user does not need to be root. This socket is “special” in that it can only send ICMP echo requests and receive echo replies. Great! It also has a conceptual “port” associated with it, despite the fact that ICMP does not use ports. In this case, the identifier field of echo requests sent through this socket are rewritten to the “port” assigned to the socket. Reciprocally, echo replies received by the kernel which have the same identifier are sent to the socket which sent the request.

Therefore, on linux cloudflared is able to perform source NAT for ICMP packets simply by opening a unique socket per source IP address. This rewrites the identifier field and source address of the request. Replies are delivered to this same socket meaning that cloudflared can easily rewrite the destination IP address (destination because the packets are flowing to the client) and echo identifier back to the original values received from the client.

Darwin

On Darwin (the UNIX-based core set of components which make up macOS), things are similar, in that we can open an unprivileged ICMP socket with the same syscall socket(PF_INET, SOCK_DGRAM, PROT_ICMP). However, there is an important difference. With Darwin the kernel does not allocate a conceptual “port” for this socket, and thus, when sending ICMP echo requests the kernel does not rewrite the echo ID as it does on linux. Further, and more importantly for our purposes, the kernel does not demultiplex ICMP echo replies to the socket which sent the corresponding request using the echo identifier. This means that on macOS, we effectively need to perform the echo ID rewriting manually. In practice, this means that when cloudflared receives an echo request on macOS, it must choose an echo ID which is unique for the destination. Cloudflared then adds a key of (chosen echo ID, destination IP) to a mapping it then maintains, with a value of (original echo ID, original source IP). Cloudflared rewrites the echo ID in the echo request packet to the one it chose and forwards it to the destination. When it receives a reply, it is able to use the source IP address and echo ID to look up the client address and original echo ID and rewrite the echo ID and destination address in the reply packet before forwarding it back to the client.

Windows

Finally, we arrived at Windows which conveniently provides a Win32 API IcmpSendEcho that sends echo requests and returns echo reply, timeout or error. For ICMPv6 we just had to use Icmp6SendEcho. The APIs are in C, but cloudflared can call them through CGO without a problem. If you also need to call these APIs in a Go program, checkout our wrapper for inspiration.

And there you have it! That’s how we built the most exciting ping release since 1983. Overall, we’re thrilled to announce this new feature and can’t wait to get your feedback on ways we can continue improving our implementation moving forward.

What’s next

Support for these ICMP-based utilities is just the beginning of how we’re thinking about improving our Zero Trust administrator experience. Our goal is to continue providing tools which make it easy to identify issues within the network that impact connectivity and performance.

Looking forward, we plan to add more dials and knobs for observability with announcements like Digital Experience Monitoring across our Zero Trust platform to help users proactively monitor and stay alert to changing network conditions. In the meantime, try applying Zero Trust controls to your private network for free by signing up today.


Cloudflare Application Services for private networks: do more with the tools you already love

Post Syndicated from Annika Garbers original https://blog.cloudflare.com/app-services-private-networks/

Cloudflare Application Services for private networks: do more with the tools you already love

Cloudflare Application Services for private networks: do more with the tools you already love

Cloudflare’s Application Services have been hard at work keeping Internet-facing websites and applications secure, fast, and reliable for over a decade. Cloudflare One provides similar security, performance, and reliability benefits for your entire corporate network. And today, we’re excited to announce new integrations that make it possible to use these services together in new ways. These integrations unlock operational and cost efficiencies for IT teams by allowing them to do more with fewer tools, and enable new use cases that are impossible without Cloudflare’s  “every service everywhere” architecture.

“Just as Canva simplifies graphic design, Cloudflare simplifies performance and security. Thanks to Cloudflare, we can focus on growing our product and expanding into new markets with confidence, knowing that our platform is fast, reliable, and secure.” – Jim Tyrrell, Head of Infrastructure, Canva

Every service everywhere, now for every network

One of Cloudflare’s fundamental architectural principles has always been to treat our network like one homogeneous supercomputer. Rather than deploying services in specific locations – for example, using some of our points of presence to enforce WAF policies, others for Zero Trust controls, and others for traffic optimization – every server runs a virtually identical stack of all of our software services. This way, a packet can land on any server and flow through a full set of security filters in a single pass, without having to incur the performance tax of hair pinning to multiple locations.

Cloudflare Application Services for private networks: do more with the tools you already love

The software that runs on each of these servers is Linux-based and takes advantage of core concepts of the Linux kernel in order to create “wiring” between services. This deep dive on our DDoS mitigation stack explains just one example of how we use these tools to route packets through multiple layers of protection without sacrificing performance. This approach also enables us to easily add new paths for packets and requests, enabling deeper integrations and new possibilities for traffic routed to Cloudflare’s network from any source or to any destination. Let’s walk through some of these new use cases we’re developing for private networks.

Web Application Firewall for private apps with any off-ramp

Today, millions of customers trust Cloudflare’s WAF to protect their applications that are exposed to the public Internet – either fully public apps or private apps connected via Cloudflare Tunnel and surfaced with a public hostname. We’ve increasingly heard from customers that are excited about putting our WAF controls in front of any application with any traffic on or off-ramp, for a variety of reasons.

Some customers want to do this in order to enforce stronger Zero Trust principles: filtering all traffic, even requests sourced from within a “trusted” private network, as though it came from the open Internet. Other customers want to connect an entire datacenter or cloud property with a network-layer on-ramp like a GRE or IPsec tunnel or CNI. And yet others want to adopt the Cloudflare WAF for their private apps without specifying public hostnames.

By fully integrating Cloudflare’s WAF with the Cloudflare One dataplane, we’re excited to address all of these use cases: enabling customers to create WAF policies in-path for fully private traffic flows by building their private network on Cloudflare.

API security for internal APIs

After web applications, one of the next attack surfaces our customers turn to addressing is their public-facing APIs. Cloudflare offers services to protect public APIs from DDoS, abuse, sensitive data loss, and many other attack vectors. But security concerns don’t stop with public-facing APIs: as engineering organizations continue to embrace distributed architecture, multicloud and microsegmentation, CIOs and teams that provide internal services are also interested in securing their private APIs.

With Cloudflare One, customers can connect and route their entire private network through our global fabric, enabling private API traffic to flow through the same stack of security controls we’ve previously made available for public APIs. Networking and security teams will be able to apply the principles of zero trust to their private API traffic flow to help improve their overall security posture.

Global and local traffic management for private apps

So far, we’ve focused on the security controls customers have available to filter malicious traffic to their applications and APIs. But Cloudflare’s services don’t stop with security: we make anything connected to the Internet faster and more reliable. One of the key tools enabling this is our suite of load balancing services, which include application-layer controls for any origin server behind Cloudflare’s reverse proxy and network-layer controls for any IP traffic.

Customers have asked for even more flexibility and new ways to use our traffic management tools: the ability to create application-layer load balancing policies for traffic connected with any off-ramp, such as Cloudflare Tunnel for applications, GRE or IPsec tunnels or CNI for IP networks. They also are excited about the potential to extend load balancing policies into their local networks, managing traffic across servers within a datacenter or cloud property in addition to across multiple “global” locations. These capabilities, which will improve resiliency for any application – both by enforcing more granular controls for private apps and managing local traffic for any app – are coming soon; stay tuned for more updates.

Full-stack performance optimization for private apps

Cloudflare has always obsessed over the speed of every request routed through our network. We’re constantly developing new ways to deliver content closer to users, automatically optimize any kind of traffic, and route packets over the best possible paths, avoiding congestion and other issues on the Internet. Argo Smart Routing speeds up any reverse proxied traffic with application-layer optimizations and IP packets with intelligent decisions at the network layer, using Cloudflare’s extensive interconnectivity and global private backbone to make sure that traffic is delivered as quickly and efficiently as possible.

As we more deeply integrate Cloudflare’s private networking dataplane and our application services to realize the security and reliability benefits described above, customers will automatically be able to see the benefits of Argo Smart Routing at all layers of the OSI stack for any traffic connected to Cloudflare.

Private DNS for one-stop management of internal network resources

Cloudflare’s industry-leading authoritative DNS protects millions of public Internet domains. These can be queried by anyone on the public Internet, which is great for most organizations, but some want to be able to restrict this access. With our private DNS, customers will be able to resolve queries to private domains only when connected to the Zero Trust private network they define within Cloudflare. Because we’re building this using our robust authoritative DNS and Gateway filtering services, you can expect all the other goodness already possible with Cloudflare to also apply to private DNS: support for all common DNS record types, the ability to resolve to DNS queries to virtual networks with overlapping IPs, and all the other Zero Trust filtering control offered by Gateway DNS filtering. Consolidating management of external and internal DNS in one place, with the fastest response time, unparalleled redundancy, and advanced security already built in, will greatly simplify customers’ infrastructure and save time and operational overhead.

And more new use cases every day

We love hearing about new ways you’re using Cloudflare to make any user, application, or network faster, more secure, and more reliable. Get on the list for beta access to the new integrations described today and reach out to us in the comments if you’ve got more ideas for new problems you’d like to solve using Cloudflare.

China Express: Cloudflare partners to boost performance in China for corporate networks

Post Syndicated from Dafu Wang original https://blog.cloudflare.com/china-express/

China Express: Cloudflare partners to boost performance in China for corporate networks

China Express: Cloudflare partners to boost performance in China for corporate networks

Cloudflare has been helping global organizations offer their users a consistent experience all over the world. This includes mainland China, a market our global customers cannot ignore but that continues to be challenging for infrastructure teams trying to ensure performance, security and reliability for their applications and users both in and outside mainland China. We are excited to announce China Express — a new suite of capabilities and best practices in partnership with our partners China Mobile International (CMI) and CBC Tech — that help address some of these performance challenges and ensure a consistent experience for customers and employees everywhere.

Cloudflare has been providing Application Services to users in mainland China since 2015, improving performance and security using in-country data centers and caching. Today, we have a presence in 30 cities in mainland China thanks to our strategic partnership with JD Cloud. While this delivers significant performance improvements, some requests still need to go back to the origin servers which may live outside mainland China. With limited international Internet gateways and restrictive cross-border regulations, international traffic has a very high latency and packet drop rate in and out of China. This results in inconsistent cached content within China and a poor experience for users trying to access dynamic content that requires frequent access to the origin.

Last month, we expanded our Cloudflare One, Zero Trust network-as-a-service platform to users and organizations in China with additional connectivity options. This has received tremendous interest from customers, so we’re looking at what else we could do to further improve the user experience for customers with employees or offices in China.

What is China Express?

China Express is a suite of connectivity and performance offerings designed to simplify connectivity and improve performance for users in China. To understand these better, let’s take an example of Acme Corp, a global company with offices in Shanghai and Beijing — with origin data centers in London and Ashburn. And let’s see how we can help their infrastructure teams better serve employees and users in mainland China.

China Express Premium DIA

Premium Dedicated Internet Access, is an optimized, high-quality public Internet circuit for cross-border connectivity provided by our local partners CMI and CBC Tech. With this service, traffic from mainland China will arrive at our partner data center in Hong Kong, using a fixed NAT IP. Customers do not worry about compliance issues because their traffic still goes through the public Internet with all regulatory controls in place.

Acme Corp can use Premium DIA to improve origin performance for their Cloudflare service in mainland China. Requests to the origin data centers in Ashburn and London would traverse the Premium DIA connection, which offers more bandwidth and lower packet loss resulting in more than a 60% improvement in performance.

Acme employees in mainland China would also see an improvement while accessing SaaS applications such as Microsoft 365 over the Internet when these apps are delivered from outside China. They would also notice an improvement in Internet speed in general.

While Premium DIA offers Acme performance improvements over the public Internet, they may want to keep some mission-critical application traffic on a private network for security reasons. Private link offers a dedicated private tunnel between Acme’s locations in China and their data centers outside of China. Private Link can also be used to establish dedicated private connectivity to SaaS data centers like Salesforce.

Private Link is a highly regulated area in China and depending on your use case, there might be additional requirements from our partners to implement it.

China Express: Cloudflare partners to boost performance in China for corporate networks

China Express Travel SIM

Acme Corp might have employees visiting China on a regular basis and need access to their corporate apps on their mobile devices including phones and tablets. Their IT teams not only have to procure and provision mobile Internet connectivity for their users, but also enforce consistent Zero Trust security controls.

Cloudflare is pleased to announce that the Travel SIM provided by Cloudflare’s partner CMI automatically provides network connectivity and can be used together with the Cloudflare WARP Client on mobile devices to provide Cloudflare’s suite of Zero Trust security services. Using the same Zero Trust profiles assigned to the user, the WARP client will automatically use the available 4G LTE network and establish a WireGuard tunnel to the closest Cloudflare data center outside of China. The data connection can also be shared with other devices using the hotspot function on the mobile device.

With the Travel SIM, users can enjoy the same Cloudflare global service as the rest of the world when traveling to China. And IT and security teams no longer need to worry about purchasing or deploying additional Zero Trust seats and device clients to ensure the employees’ Internet connection and the security policy enforcement.

China Express: Cloudflare partners to boost performance in China for corporate networks

China Express — Extending Cloudflare One to China

As mentioned in a previous blog post, we are extending Cloudflare One, our zero trust network-as-a-service product, to mainland China through our strategic partnerships. Acme Corp will now be able to ensure their employees both inside and outside China will be able to use consistent zero trust security policy using the Cloudflare WARP device client. In addition, they will be able to connect their physical offices in China to their global private WAN using Magic WAN with consistent security policies applied globally.

Get started today

Cloudflare is excited to work with  our partners to help our customers solve connectivity and performance challenges in mainland China. All the above solutions are easy and fast to deploy and are available now. If you’d like to get started, contact us here or reach out to your account team.

re:Invent 2022 DevOps and Developer Productivity Playlist

Post Syndicated from original https://aws.amazon.com/blogs/devops/reinvent-2022-devops-and-developer-productivity-playlist/

Danielle Kucera, Karun Bakshi, and I were privileged to organize the DevOps and Developer Productivity (DOP) track for re:Invent 2022. For 2022, the DOP track included 58 sessions and nearly 100 speakers.  If you weren’t able to attend, I have compiled a list of the on-demand sessions for you below.

Leadership Sessions

Delighting developers: Builder experience at AWS Adam Seligman, Vice President of Developer Experience, and Emily Freeman, Head of Community Development, share the latest AWS tools and experiences for teams developing in the cloud. Adam recaps the latest launches and demos how key services can integrate to accelerate developer productivity.

Amazon CodeCatalyst

Amazon CodeCatalyst, announced during Dr. Werner Vogels Keynote, is a unified software development service that makes it faster to build and deliver on AWS.

Introducing Amazon CodeCatalyst – Harry Mower, Director of DevOps Services, and Doug Clauson, Product Manager, provide an overview of Amazon CodeCatalyst. CodeCatalyst provides one place where you can plan work, collaborate on code, and build, test, and deploy applications with nearly continuous integration/continuous delivery (CI/CD) tools.

Deep dive on CodeCatalyst Workspaces – Tmir Karia, Sr. Product Manager, and Rahul Gulati, Sr. Product Manager,  discuss how Amazon CodeCatalyst Workspaces decreases the time you spend creating and maintaining a local development environment and allows you to quickly set up a cloud development workspace, switch between projects, and replicate the development workspace configuration across team members.

DevOps

AWS Well-Architected best practices for DevOps on AWS Elamaran Shanmugam, Sr. Container Specialist, and Deval Perikh, Sr. Enterprise Solutions Architect, discuss the components required to align your DevOps practices to the pillars of the AWS Well-Architected Framework.

Best practices for securing your software delivery lifecycle Jams Bland, Principal Solutions Architect, and Curtis Rissi, Principal Solutions Architect, discus ways you can secure your CI/CD pipeline on AWS. Review topics like security of the pipeline versus security in the pipeline, ways to incorporate security checkpoints across various pipeline stages, security event management, and aggregating vulnerability findings into a single pane of glass.

Build it & run it: Streamline your DevOps capabilities with machine learning Rafael Ramos, Shivansh Singh, and Jared Reimer discuss how to use machine learning–powered tools like Amazon CodeWhisperer, Amazon CodeGuru, and Amazon DevOps Guru to boost your applications’ availability and write software faster and more reliably.

Infrastructure as Code

AWS infrastructure as code: A year in review  Tatiana Cooke, Principal Product Manager, and Ben Perak, Principal Product Manage, discuss the new features and improvements for AWS infrastructure as code with AWS CloudFormation and AWS CDK.

How to reuse patterns when developing infrastructure as code Ryan Bachman, Ethan Rucinski, and Ravi Palakodeti explore AWS Cloud Development Kit (AWS CDK) constructs and AWS CloudFormation modules and how they make it easier to build applications on AWS.

Governance and security with infrastructure as code David Hessler, Senior DevOps Consultant, and Eric Beard, Senior Solutions Architect, discuss how to use AWS CloudFormation and the AWS CDK to deploy cloud applications in regulated environments while enforcing security controls.

Developer Productivity

Building on AWS with AWS tools, services, and SDKs Kyle Thomson, Senior Software Development Engineer and Deval Parikh, Senior Solutions Architect, discuss the ways developers can set up secure development environments and use their favorite IDEs to interact with, and deploy to, the AWS Cloud.

The Amazon Builders’ Library: 25 years of operational excellence at Amazon Colm MacCarthaigh, Distinguished Engineer, and David Yanacek, Sr. Principal Engineer, discuss how Amazon practices have changed and improved over time and what we’ve learned as builders and as operators.

Sustainability in the cloud with Rust and AWS Graviton Emil Lerch, Principal DevOps Specialist, and Esteban Kuber, Principal Engineer, discuss the benefits of Rust and AWS Graviton that can reduce energy consumption and increase productivity.


About the author:

Brian Beach

Brian Beach has over 20 years of experience as a Developer and Architect. He is currently a Principal Solutions Architect at Amazon Web Services. He holds a Computer Engineering degree from NYU Poly and an MBA from Rutgers Business School. He is the author of “Pro PowerShell for Amazon Web Services” from Apress. He is a regular author and has spoken at numerous events. Brian lives in North Carolina with his wife and three kids.

Threats of Machine-Generated Text

Post Syndicated from Bruce Schneier original https://www.schneier.com/blog/archives/2023/01/threats-of-machine-generated-text.html

With the release of ChatGPT, I’ve read many random articles about this or that threat from the technology. This paper is a good survey of the field: what the threats are, how we might detect machine-generated text, directions for future research. It’s a solid grounding amongst all of the hype.

Machine Generated Text: A Comprehensive Survey of Threat Models and Detection Methods

Abstract: Advances in natural language generation (NLG) have resulted in machine generated text that is increasingly difficult to distinguish from human authored text. Powerful open-source models are freely available, and user-friendly tools democratizing access to generative models are proliferating. The great potential of state-of-the-art NLG systems is tempered by the multitude of avenues for abuse. Detection of machine generated text is a key countermeasure for reducing abuse of NLG models, with significant technical challenges and numerous open problems. We provide a survey that includes both 1) an extensive analysis of threat models posed by contemporary NLG systems, and 2) the most complete review of machine generated text detection methods to date. This survey places machine generated text within its cybersecurity and social context, and provides strong guidance for future work addressing the most critical threat models, and ensuring detection systems themselves demonstrate trustworthiness through fairness, robustness, and accountability.

Introducing maximum concurrency of AWS Lambda functions when using Amazon SQS as an event source

Post Syndicated from Julian Wood original https://aws.amazon.com/blogs/compute/introducing-maximum-concurrency-of-aws-lambda-functions-when-using-amazon-sqs-as-an-event-source/

This blog post is written by Solutions Architects John Lee and Jeetendra Vaidya.

AWS Lambda now provides a way to control the maximum number of concurrent functions invoked by Amazon SQS as an event source. You can use this feature to control the concurrency of Lambda functions processing messages in individual SQS queues.

This post describes how to set the maximum concurrency of SQS triggers when using SQS as an event source with Lambda. It also provides an overview of the scaling behavior of Lambda using this architectural pattern, challenges this feature helps address, and a demo of the maximum concurrency feature.

Overview

Lambda uses an event source mapping to process items from a stream or queue. The event source mapping reads from an event source, such as an SQS queue, optionally filters the messages, batches them, and invokes the mapped Lambda function.

The scaling behavior for Lambda integration with SQS FIFO queues is simple. A single Lambda function processes batches of messages within a single message group to ensure that messages are processed in order.

For SQS standard queues, the event source mapping polls the queue to consume incoming messages, starting at five concurrent batches with five functions at a time. As messages are added to the SQS queue, Lambda continues to scale out to meet demand, adding up to 60 functions per minute, up to 1,000 functions, to consume those messages. To learn more about Lambda scaling behavior, read ”Understanding how AWS Lambda scales with Amazon SQS standard queues.”

Lambda processing standard SQS queues

Lambda processing standard SQS queues

Challenges

When a large number of messages are in the SQS queue, Lambda scales out, adding additional functions to process the messages. The scale out can consume the concurrency quota in the account. To prevent this from happening, you can set reserved concurrency for individual Lambda functions. This ensures that the specified Lambda function can always scale to that much concurrency, but it also cannot exceed this number.

When the Lambda function concurrency reaches the reserved concurrency limit, the queue configuration specifies the subsequent behavior. The message is returned to the queue and retried based on the redrive policy, expired based on its retention policy, or sent to another SQS dead-letter queue (DLQ). While sending unprocessed messages to a DLQ is a good option to preserve messages, it requires a separate mechanism to inspect and process messages from the DLQ.

The following example shows a Lambda function reaching its reserved concurrency quota of 10.

Lambda reaching reserved concurrency of 10.

Lambda reaching reserved concurrency of 10.

Maximum Lambda concurrency with SQS as an event source

The launch of maximum concurrency for SQS as an event source allows you to control Lambda function concurrency per source. You set the maximum concurrency on the event source mapping, not on the Lambda function.

This event source mapping setting does not change the scaling or batching behavior of Lambda with SQS. You can continue to batch messages with a customized batch size and window. It rather sets a limit on the maximum number of concurrent function invocations per SQS event source. Once Lambda scales and reaches the maximum concurrency configured on the event source, Lambda stops reading more messages from the queue. This feature also provides you with the flexibility to define the maximum concurrency for individual event sources when the Lambda function has multiple event sources.

Maximum concurrency is set to 10 for the SQS queue.

Maximum concurrency is set to 10 for the SQS queue.

This feature can help prevent a Lambda function from consuming all available Lambda concurrency of the account and avoids messages returning to the queue unnecessarily because of Lambda functions being throttled. It provides an easier way to control and consume messages at a desired pace, controlled by the maximum number of concurrent Lambda functions.

The maximum concurrency setting does not replace the existing reserved concurrency feature. Both serve distinct purposes and the two features can be used together. Maximum concurrency can help prevent overwhelming downstream systems and unnecessary throttled invocations. Reserved concurrency guarantees a maximum number of concurrent instances for the function.

When used together, the Lambda function can have its own allocated capacity (reserved concurrency), while being able to control the throughput for each event source (maximum concurrency). When using the two features together, you must set the function reserved concurrency higher than the maximum concurrency on the SQS event source mapping to prevent throttling.

Setting maximum concurrency for SQS as an event source

You can configure the maximum concurrency for an SQS event source through the AWS Management Console, AWS Command Line Interface (CLI), or infrastructure as code tools such as AWS Serverless Application Model (AWS SAM). The minimum supported value is 2 and the maximum value is 1000. Refer to the Lambda quotas documentation for the latest limits.

Configuring the maximum concurrency for an SQS trigger in the console

Configuring the maximum concurrency for an SQS trigger in the console

You can set the maximum concurrency through the create-event-source-mapping AWS CLI command.

aws lambda create-event-source-mapping --function-name my-function --ScalingConfig {MaxConcurrency=2} --event-source-arn arn:aws:sqs:us-east-2:123456789012:my-queue

Seeing the maximum concurrency setting in action

The following demo compares Lambda receiving and processes messages differently when using maximum concurrency compared to reserved concurrency.

This GitHub repository contains an AWS SAM template that deploys the following resources:

  • ReservedConcurrencyQueue (SQS queue)
  • ReservedConcurrencyDeadLetterQueue (SQS queue)
  • ReservedConcurrencyFunction (Lambda function)
  • MaxConcurrencyQueue (SQS queue)
  • MaxConcurrencyDeadLetterQueue (SQS queue)
  • MaxConcurrencyFunction (Lambda function)
  • CloudWatchDashboard (CloudWatch dashboard)

The AWS SAM template provisions two sets of identical architectures and an Amazon CloudWatch dashboard to monitor the resources. Each architecture comprises a Lambda function receiving messages from an SQS queue, and a DLQ for the SQS queue.

The maxReceiveCount is set as 1 for the SQS queues, which sends any returned messages directly to the DLQ. The ReservedConcurrencyFunction has its reserved concurrency set to 5, and the MaxConcurrencyFunction has the maximum concurrency for the SQS event source set to 5.

Pre-requisites

Running this demo requires the AWS CLI and the AWS SAM CLI. After installing both CLIs, clone this GitHub repository and navigate to the root of the directory:

git clone https://github.com/aws-samples/aws-lambda-amazon-sqs-max-concurrency
cd aws-lambda-amazon-sqs-max-concurrency

Deploying the AWS SAM template

  1. Build the AWS SAM template with the build command to prepare for deployment to your AWS environment.
  2. sam build
  3. Use the guided deploy command to deploy the resources in your account.
  4. sam deploy --guided
  5. Give the stack a name and accept the remaining default values. Once deployed, you can track the progress through the CLI or by navigating to the AWS CloudFormation page in the AWS Management Console.
  6. Note the queue URLs from the Outputs tab in the AWS SAM CLI, CloudFormation console, or navigate to the SQS console to find the queue URLs.
The Outputs tab of the launched AWS SAM template provides URLs to CloudWatch dashboard and SQS queues.

The Outputs tab of the launched AWS SAM template provides URLs to CloudWatch dashboard and SQS queues.

Running the demo

The deployed Lambda function code simulates processing by sleeping for 10 seconds before returning a 200 response. This allows the function to reach a high function concurrency number with only a small number of messages.

To add 25 messages to the Reserved Concurrency queue, run the following commands. Replace <ReservedConcurrencyQueueURL> with your queue URL from the AWS SAM Outputs.

for i in {1..25}; do aws sqs send-message --queue-url <ReservedConcurrencyQueueURL> --message-body testing; done 

To add 25 messages to the Maximum Concurrency queue, run the following commands. Replace <MaxConcurrencyQueueURL> with your queue URL from the AWS SAM Outputs.

for i in {1..25}; do aws sqs send-message --queue-url <MaxConcurrencyQueueURL> --message-body testing; done 

After sending messages to both queues, navigate to the dashboard URL available in the Outputs tab to view the CloudWatch dashboard.

Validating results

Both Lambda functions have the same number of invocations and the same concurrent invocations fixed at 5. The CloudWatch dashboard shows the ReservedConcurrencyFunction experienced throttling and 9 messages, as seen in the top-right metric, were sent to the corresponding DLQ. The MaxConcurrencyFunction did not experience any throttling and messages were not delivered to the DLQ.

CloudWatch dashboard showing throttling and DLQs.

CloudWatch dashboard showing throttling and DLQs.

Clean up

To remove all the resources created in this demo, use the delete command and follow the prompts:

sam delete

Conclusion

You can now control the maximum number of concurrent functions invoked by SQS as a Lambda event source. This post explains the scaling behavior of Lambda using this architectural pattern, challenges this feature helps address, and a demo of maximum concurrency in action.

There are no additional charges to use this feature besides the standard SQS and Lambda charges. You can start using maximum concurrency for SQS as an event source with new or existing event source mappings by connecting it with SQS. This feature is available in all Regions where Lambda and SQS are available.

For more serverless learning resources, visit Serverless Land.

Rust to be allowed for Chromium development

Post Syndicated from original https://lwn.net/Articles/919830/

The Chromium browser project has announced
that it will be integrating support for third-party libraries written in Rust.

Our goal in bringing Rust into Chromium is to provide a simpler
(no IPC) and safer (less complex C++ overall, no memory safety
bugs in a sandbox either) way to satisfy the rule of two, in order
to speed up development (less code to write, less design docs,
less security review) and improve the security (increasing the
number of lines of code without memory safety bugs, decreasing the
bug density of code) of Chrome. And we believe that we can use
third-party Rust libraries to work toward this goal.

Rust was developed by Mozilla specifically for use in writing a
browser, so it’s very fitting that Chromium would finally begin to
rely on this technology too. Thank you Mozilla for your huge
contribution to the systems software industry. Rust has been an
incredible proof that we should be able to expect a language to
provide safety while also being performant.

HPE ProLiant Gen11 Servers with 4th Gen Intel Xeon Scalable Launched

Post Syndicated from Cliff Robinson original https://www.servethehome.com/hpe-proliant-gen11-servers-with-4th-gen-intel-xeon-scalable-launched-sapphire-rapids/

Supporting new 4th Gen Intel Xeon Scalable and Intel Xeon MAX processors, the HPE ProLiant Gen11 series offers a huge number of new features

The post HPE ProLiant Gen11 Servers with 4th Gen Intel Xeon Scalable Launched appeared first on ServeTheHome.

Improve the performance of Apache Iceberg’s metadata file operations using Amazon FSx for Lustre on Amazon EMR

Post Syndicated from Rajarshi Sarkar original https://aws.amazon.com/blogs/big-data/improve-the-performance-of-apache-icebergs-metadata-file-operations-using-amazon-fsx-for-lustre-on-amazon-emr/

Apache Iceberg is an open table format for large datasets in Amazon Simple Storage Service (Amazon S3), and provides fast query performance over large tables, atomic commits, concurrent writes, and SQL-compatible table evolution. With Amazon EMR 6.5+, you can use Apache Spark on EMR clusters with the Iceberg table format.

Iceberg helps data engineers manage complex challenges such as continuously evolving datasets while maintaining query performance. Iceberg allows you to do the following:

  • Maintain transactional consistency on tables between multiple applications where files can be added, removed, or modified atomically with full read isolation and multiple concurrent writes
  • Implement full schema evolution to track changes to a table over time
  • Issue time travel queries to query historical data and verify changes between updates
  • Organize tables into flexible partition layouts with partition evolution, enabling updates to partition schemes as queries and data volume changes without relying on physical directories
  • Roll back tables to prior versions to quickly correct issues and return tables to a known good state
  • Perform advanced planning and filtering in high-performance queries on large datasets

In this post, we show you how to improve the performance of Iceberg’s metadata file operations using Amazon FSx for Lustre and Amazon EMR.

Performance of metadata file operations in Iceberg

The catalog, metadata layer, and data layer of Iceberg are outlined in the following diagram.

Iceberg maintains metadata across multiple small files (metadata file, manifest list, and manifest files) to effectively prune data, filter data, read the correct snapshot, merge delta files, and more. Although Iceberg has implemented fast scan planning to make sure that metadata file operations don’t take a large amount of time, the time taken is slightly high for object storage like Amazon S3 because it has a higher read/write latency.

In use cases like a high-throughput streaming application writing data into an S3 data lake in near-real time, snapshots are produced in microbatches at a very fast rate, resulting in a high number of snapshot files and causing degradation in performance of metadata file operations.

As shown in the following architecture diagram, the EMR cluster consumes from Kafka and writes to an Iceberg table, which uses Amazon S3 as storage and AWS Glue as the catalog.

In this post, we dive deep into how to improve query performance by caching metadata files in a low-latency file system like FSx for Lustre.

Overview of solution

FSx for Lustre makes it easy and cost-effective to launch and run the high-performance Lustre file system. You use it for workloads where speed matters, such as high throughput streaming writes, machine learning, high performance computing (HPC), video processing, and financial modelling. You can also link the FSx for Lustre file system to an S3 bucket, if required. FSx for Lustre offers multiple deployment options, including the following:

  • Scratch file systems, which are designed for temporary storage and short-term processing of data. Data isn’t replicated and doesn’t persist if a file server fails. Use scratch file systems when you need cost-optimized storage for short-term, processing-heavy workloads.
  • Persistent file systems, which are designed for long-term storage and workloads. The file servers are highly available, and data is automatically replicated within the same Availability Zone in which the file system is located. The data volumes attached to the file servers are replicated independently from the file servers to which they are attached.

The use case with Iceberg’s metadata files is related to caching, and the workloads are short-running (a few hours), so the scratch file system can be considered as a viable deployment option. A Scratch-2 file system with 200 MB/s/TiB of throughput is sufficient for our needs because Iceberg’s metadata files are small in size and we don’t expect a very high number of parallel connections.

You can use FSx for Lustre as a cache for the metadata files (on top of an S3 location) to offer better performance in terms of metadata file operations. To read/write files, Iceberg provides a capability to load a custom FileIO dynamically during runtime. You can pass the FSxForLustreS3FileIO reference using a Spark configuration, which takes care of reading/writing to appropriate file systems (FSx for Lustre for reads and Amazon S3 for writes). By enabling the catalog properties lustre.mount.path, lustre.file.system.path, and data.repository.path, Iceberg resolves the S3 path to FSx for Lustre path at runtime.

As shown in the following architecture diagram, the EMR cluster consumes from Kafka and writes to an Iceberg table that uses Amazon S3 as storage and AWS Glue as the catalog. Metadata reads are redirected to FSx for Lustre, which updates asynchronously.

Pricing and performance

We took a sample dataset across 100, 1,000, and 10,000 snapshots, and could observe up to 8.78 times speedup in metadata file operations and up to 1.26 times speedup in query time. Note that the benefit was observed for tables with a higher number of snapshots. The environment components used in this benchmark are listed in the following table.

Iceberg Version Spark Version Cluster Version Master Workers
0.14.1-amzn-0 3.3.0-amzn-1 Amazon EMR 6.9.0 m5.8xlarge 15 x m5.8xlarge

The following graph compares the speedup for each amount of snapshots.

You can calculate the price using the AWS Pricing Calculator. The estimated monthly cost of an FSx for Lustre file system (scratch deployment type) in the US East (N. Virginia) Region with 1.2 TB storage capacity and 200 MBps/TiB per unit storage throughput is $336.38.

The overall benefit is significant considering the low cost incurred. The performance gain in terms of metadata file operations can help you achieve low-latency read for high-throughput streaming workloads.

Prerequisites

For this walkthrough, you need the following prerequisites:

Create an FSx for Lustre file system

In this section, we walk through the steps to create your FSx for Lustre file system via the FSx for Lustre console. To use the AWS Command Line Interface (AWS CLI), refer to create-file-system.

  1. On the Amazon FSx console, create a new file system.
  2. For File system options, select Amazon FSx for Lustre.
  3. Choose Next.
  4. For File system name¸ enter an optional name.
  5. For Deployment and storage type, select Scratch, SSD, because it’s designed for short-term storage and workloads.
  6. For Throughput per unit of storage, select 200 MB/s/TiB.You can choose the storage capacity according to your use case. A Scratch-2 file system with 200 MB/s/TiB of throughput is sufficient for our needs because Iceberg’s metadata files are small in size and we don’t expect a very high number of parallel connections.
  7. Enter an appropriate VPC, security group, and subnet.Make sure that the security group has the appropriate inbound and outbound rules enabled to access the FSx for Lustre file system from Amazon EMR.
  8. In the Data Repository Import/Export section, select Import data from and export data to S3.
  9. Select Update my file and directory listing as objects are added to, changed in, or deleted from my S3 bucket to keep the file system listing updated.
  10. For Import bucket, enter the S3 bucket to store the Iceberg metadata.
  11. Choose Next and verify the summary of the file system, then choose Create File System.

When the file system is created, you can view the DNS name and mount name.

Create an EMR cluster with FSx for Lustre mounted

This section shows how to create an Iceberg table using Spark, though we can use other engines as well. To create your EMR cluster with FSx for Lustre mounted, complete the following steps:

  1. On the Amazon EMR console, create an EMR cluster (6.9.0 or above) with Iceberg installed. For instructions, refer to Use a cluster with Iceberg installed.

To use the AWS CLI, refer to create-cluster.

  1. Keep the network (VPC) and EC2 subnet the same as the ones you used when creating the FSx for Lustre file system.
  2. Create a bootstrap script and upload it to an S3 bucket that is accessible to EMR.Refer to the following bootstrap script to mount FSx for Lustre in an EMR cluster (the file system gets mounted in the /mnt/fsx path of the cluster). The file system DNS name and the mount name can be found in the file system summary details.
    sudo amazon-linux-extras install -y lustre2.10
    sudo mkdir -p /mnt/fsx
    sudo mount -t lustre -o noatime <Lustre-File-System-DNS-Name>@tcp:/<mount-Name> /mnt/fsx
    sudo ln -s /mnt/fsx /lustre
    sudo chmod -R 755 /mnt/fsx
    sudo chmod -R 755 /lustre

  3. Add the bootstrap action script to the EMR cluster.
  4. Specify your EC2 key pair.
  5. Choose Create cluster.
  6. When the EMR cluster is running, SSH into the cluster and launch the spark-sql using the following code:
    spark-sql --conf spark.sql.catalog.my_catalog=org.apache.iceberg.spark.SparkCatalog \
        --conf spark.sql.catalog.my_catalog.warehouse=s3://<bucket>/warehouse/sample_table \
        --conf spark.sql.catalog.my_catalog.catalog-impl=org.apache.iceberg.aws.glue.GlueCatalog \
        --conf spark.sql.catalog.my_catalog.io-impl=org.apache.iceberg.aws.s3.FSxForLustreS3FileIO \
        --conf spark.sql.catalog.my_catalog.lustre.mount.path=file:///mnt/fsx \
        --conf spark.sql.catalog.my_catalog.lustre.file.system.path=/warehouse/sample_table/metadata \
        --conf spark.sql.catalog.my_catalog.data.repository.path=s3://<bucket>/warehouse/sample_table/metadata

Note the following:

    • At a Spark session level, the catalog properties io-impl, lustre.mount.path, lustre.file.system.path, and data.repository.path have been set.
    • io-impl sets a custom FileIO implementation that resolves the FSx for Lustre location (from the S3 location) during reads. lustre.mount.path is the local mount path in the EMR cluster, lustre.file.system.path is the FSx for Lustre file system path, and data.repository.path is the S3 data repository path, which is linked to the FSx for Lustre file system path. After all these properties are provided, the data.repository.path is resolved to the concatenation of lustre.mount.path and lustre.file.system.path during reads. Note that FSx for Lustre is eventually consistent after an update in Amazon S3. So, in case FSx for Lustre is catching up with the S3 updates, the FileIO will fall back to appropriate S3 paths.
    • If write.metadata.path is configured, make sure that the path doesn’t contain any trailing slashes and data.repository.path is equivalent to write.metadata.path.
  1. Create the Iceberg database and table using the following queries:
    spark-sql> CREATE DATABASE IF NOT EXISTS my_catalog.db_iceberg;
    
    spark-sql> CREATE TABLE IF NOT EXISTS my_catalog.db_iceberg.sample_table (id int, data string)
    USING iceberg
    LOCATION 's3://<bucket>/warehouse/sample_table';

    Note that to migrate an existing table to use FSx for Lustre, you must create the FSx for Lustre file system, mount the same while starting the EMR cluster, and start the Spark session as highlighted in the previous step. The Amazon S3 listing of the existing table is updated in the FSx for Lustre file system eventually.

  2. Insert the data into the table using an INSERT INTO query and then query the same:
    spark-sql> INSERT INTO my_catalog.db_iceberg.sample_table VALUES (1, 'a'), (2, 'b'), (3, 'c');
    
    spark-sql> SELECT * FROM my_catalog.db_iceberg.sample_table;

  3. You can now view the metadata files in the local FSx mount, which is also linked to the S3 bucket s3://<bucket>/warehouse/sample_table/metadata/:
    $ ls -ltr /mnt/fsx/warehouse/sample_table/metadata/
    total 3
    -rw-r--r-- 1 hadoop hadoop 1289 Mar 22 12:01 00000-40c0ef36-5a4c-4b3e-ba88-68398581c1a8.metadata.json
    -rw-r--r-- 1 hadoop hadoop 1289 Mar 22 12:01 00000-0b2b7ee5-4167-4fab-9527-d79d05c0a864.metadata.json
    -rw-r--r-- 1 hadoop hadoop 3727 Mar 22 12:03 snap-8127395396703547805-1-9a1cf328-db72-4cac-ad61-018048c3c470.avro
    -rw-r--r-- 1 hadoop hadoop 5853 Mar 22 12:03 9a1cf328-db72-4cac-ad61-018048c3c470-m0.avro
    -rw-r--r-- 1 hadoop hadoop 2188 Mar 22 12:03 00001-100c61d1-51c4-4337-8641-a6ed5ed9802e.metadata.json

  4. You can view the metadata files in Amazon S3:
    [hadoop@ip-172-31-17-161 ~]$ aws s3 ls s3://<bucket>/warehouse/sample_table/metadata/
    2022-03-24 05:29:46         20 .00000-0b2b7ee5-4167-4fab-9527-d79d05c0a864.metadata.json.crc
    2022-03-24 05:29:45         20 .00000-40c0ef36-5a4c-4b3e-ba88-68398581c1a8.metadata.json.crc
    2022-03-24 05:29:45         28 .00001-100c61d1-51c4-4337-8641-a6ed5ed9802e.metadata.json.crc
    2022-03-24 05:29:46         56 .9a1cf328-db72-4cac-ad61-018048c3c470-m0.avro.crc
    2022-03-24 05:29:45         40 .snap-8127395396703547805-1-9a1cf328-db72-4cac-ad61-018048c3c470.avro.crc
    2022-03-24 05:29:45       1289 00000-0b2b7ee5-4167-4fab-9527-d79d05c0a864.metadata.json
    2022-03-24 05:29:46       1289 00000-40c0ef36-5a4c-4b3e-ba88-68398581c1a8.metadata.json
    2022-03-24 05:29:45       2188 00001-100c61d1-51c4-4337-8641-a6ed5ed9802e.metadata.json
    2022-03-24 05:29:45       5853 9a1cf328-db72-4cac-ad61-018048c3c470-m0.avro
    2022-03-24 05:29:46       3727 snap-8127395396703547805-1-9a1cf328-db72-4cac-ad61-018048c3c470.avro

  5. You can also view the data files in Amazon S3:
    $ aws s3 ls s3://<bucket>/warehouse/sample_table/data/
    2022-03-22 12:03:04        619 00000-0-2a0e3499-189e-42c3-8c86-df47c91b1a11-00001.parquet
    2022-03-22 12:03:04        619 00001-1-b3e34418-30cf-4a81-80c7-04d2fc089435-00001.parquet

Clean up

When you’re done exploring the solution, complete the following steps to clean up the resources:

  1. Drop the Iceberg table.
  2. Delete the EMR cluster.
  3. Delete the FSx for Lustre file system.
  4. If any orphan files are present, empty the S3 bucket.
  5. Delete the EC2 key pair.
  6. Delete the VPC.

Conclusion

In this post, we demonstrated how to create an FSx for Lustre file system and an EMR cluster with the file system mounted. We observed the performance gain in terms of Iceberg metadata file operations and then cleaned up so as not to incur any additional charges.

Using FSx for Lustre with Iceberg on Amazon EMR allows you to gain significant performance in terms of metadata file operations. We observed 6.33–8.78 times speedup in metadata file operations and 1.06–1.26 times speedup in query time for Iceberg tables with 100, 1,000, and 10,000 snapshots. Note that this approach reduces the time for metadata file operations and not for the data operations. The overall performance gain would be dependent on the number of metadata files, size of each metadata files, amount of data that is being processed, and so on.


About the Author

Rajarshi Sarkar is a Software Development Engineer at Amazon EMR. He works on cutting-edge features of Amazon EMR and is also involved in open-source projects such as Apache Iceberg and Trino. In his spare time, he likes to travel, watch movies and hang out with friends.


Amazon QuickSight AWS re:Invent recap 2022

Post Syndicated from Mia Heard original https://aws.amazon.com/blogs/big-data/amazon-quicksight-aws-reinvent-recap-2022/

AWS re:Invent is a learning conference hosted by AWS for the global cloud computing community. Re:Invent was held at the end of 2022 in Las Vegas, Nevada, from November 28 to December 2.

Amazon QuickSight powers data-driven organizations with unified business intelligence (BI) at hyperscale. This post walks you through a full recap of QuickSight at this year’s re:Invent, including key launch announcements, sessions available virtually, and additional resources for continued learning.

Launch announcements

AWS Announces Five New Capabilities for Amazon QuickSight

This press release covers five new QuickSight capabilities to help you streamline business intelligence operations, using the most popular serverless BI service built for the cloud.

New analytical questions available in Amazon QuickSight Q: “Why” and “Forecast”

QuickSight announces support for two new question types that simplify and scale complex analytical tasks using natural language: “forecast” and “why.”

Announcing Automated Data Preparation for Amazon QuickSight Q

Automated data preparation utilizes machine learning (ML) to infer semantic information about data and adds it to datasets as metadata about the columns (fields), making it faster for you to prepare data in order to support natural language questions.

New Amazon QuickSight API Capabilities to Accelerate Your BI Transformation

New QuickSight API capabilities allow programmatic creation and management of dashboards, analysis, and templates.

Create and Share Operational Reports at Scale with Amazon QuickSight Paginated Reports

This feature allows you to create and share highly formatted, personalized reports containing business-critical data to hundreds of thousands of end-users—without any infrastructure setup or maintenance, up-front licensing, or long-term commitments.

Keynotes

Adam Selipsky, Chief Executive Officer of Amazon Web Services

Watch Adam Selipsky, Chief Executive Officer of Amazon Web Services, as he looks at the ways that forward-thinking builders are transforming industries and even our future, powered by AWS. He highlights innovations in data, infrastructure, and more that are helping customers achieve their goals faster, take advantage of untapped potential, and create a better future with AWS.

Swami Sivasubramanian, Vice President of AWS Data and Machine Learning

Watch Swami Sivasubramanian, Vice President of AWS Data and Machine Learning, as he reveals the latest AWS innovations that can help you transform your company’s data into meaningful insights and actions for your business. In this keynote, several speakers discuss the key components of a future-proof data strategy and how to empower your organization to drive the next wave of modern invention with data. Hear from leading AWS customers who are using data to bring new experiences to life for their customers.

Leadership sessions

Unlock the value of your data with AWS analytics

Data fuels digital transformation and drives effective business decisions. To survive in an ever-changing world, organizations are turning to data to derive insights, create new experiences, and reinvent themselves so they can remain relevant today and in the future. AWS offers analytics services that allow organizations to gain faster and deeper insights from all their data. In this session, G2 Krishnamoorthy, VP of AWS Analytics, addresses the current state of analytics on AWS, covers the latest service innovations around data, and highlights customer successes with AWS analytics. Also, learn from organizations like FINRA and more who have turned to AWS for their digital transformation journey.

Reinvent how you derive value from your data with Amazon QuickSight

In this session, learn how you can use AWS-native business analytics to provide your users with ML-powered interactive dashboards, natural language query (NLQ), and embedded analytics to provide insights to users at scale, when and where they need it. Watch this session to also learn more about how Amazon uses QuickSight internally.

Breakout sessions

What’s New with Amazon QuickSight?

This session covers all of QuickSight’s newly launched capabilities, including paginated reporting in the cloud, 1 billion rows of data with SPICE, assets as code, and new Amazon QuickSight Q capabilities, including ML-powered semantic inferencing, forecasting, new question types, and more.

Differentiate your apps with Amazon QuickSight embedded analytics

Watch this session to learn how to enable new monetization opportunities and grow your business with QuickSight embedded analytics. Discover how you can differentiate your end-user experience by embedding data visualizations, dashboards, and ML-powered natural language query into your applications at scale with no infrastructure to manage. Hear from customers Guardian Life and Showpad and learn more about their QuickSight use cases.

Migrate to cloud-native business analytics with Amazon QuickSight

Legacy BI systems can hurt agile decision-making in the modern organization, with expensive licensing, outdated capabilities, and expensive infrastructure management. In this session, discover how migrating your BI to the cloud with cloud-native, fully managed business analytics capabilities from QuickSight can help you overcome these challenges. Learn how you can use QuickSight’s interactive dashboards and reporting capabilities to provide insights to every user in the organization, lowering your costs and enabling better decision-making. Watch this session to also learn more about Siemens’s QuickSight use case.

Get clarity on your data in seconds with Amazon QuickSight Q

Amazon QuickSight Q is an ML–powered natural language capability that empowers business users to ask questions about all of their data using everyday business language and get answers in seconds. Q interprets questions to understand their intent and generates an answer instantly in the form of a visual without requiring authors to create graphics, dashboards, or analyses. In this session, the QuickSight Q team provides an overview and demonstration of Q in action. Watch this session to also learn more about NASDAQ’s QuickSight use case.

Optimize your AWS cost and usage with Cloud Intelligence Dashboards

Do your engineers know how much they’re spending? Do you have insight into the details of your cost and usage on AWS? Are you taking advantage of all your cost optimization opportunities? Attend this session to learn how organizations are using the Cloud Intelligence Dashboards to start their FinOps journeys and create cost-aware cultures within their organizations. Dive deep into specific use cases and learn how you can use these insights to drive and measure your cost optimization efforts. Discover how unit economics, resource-level visibility, and periodic spend updates make it possible for FinOps practitioners, developers, and business executives to come together to make smarter decisions. Watch this session to also learn more about Dolby laboratories’ QuickSight use case.

Useful resources

With the QuickSight re:Invent breakout session recordings and additional resources, we hope that you learn how to dive deeper into your data with QuickSight. For continued learning, check out more information and resources via our website.


About the author

Mia Heard is a product marketing manager for Amazon QuickSight, AWS’ cloud-native, fully managed BI service.

How to Download and Back Up Your Mastodon Account

Post Syndicated from Stephanie Doyle original https://www.backblaze.com/blog/how-to-download-and-back-up-your-mastodon-account/

Mastodon: Have you heard of it? As a social media platform, it’s unique in that it’s free, open-source, and crowdfunded. It doesn’t have ads, and it’s not owned by a corporation. When you set up an account on Mastodon, you select a server (called an “instance”) where your account lives. All of that can sound confusing to your average computer user, though it also makes it a favorite amongst the more tech-savvy users in the world.

The truth of Mastodon’s distributed servers is that it doesn’t really matter which server you choose to set up on. Since each server talks to every other server (just like email), you’ll be able to use the social network just like you would Twitter or any other microblogging platform. You can publish text posts (adorably called “toots”) and attach media such as pictures, audio, video, or polls. Mastodon lets you follow friends and discover new ones, and also uses hashtags to find communities or topics you may be interested in.

Also just any other social media site, you’ll want to back up all your posts. That’s what we’re going to talk about today. 

How Mastodon Works: The Nuts and Bolts

There are some people who want to host their own Mastodon server (if that’s you, it means that other accounts would be hosted on your server, and you’d be responsible for setting standards to moderate content). In that case, you may want to back up your Mastodon server data to Backblaze B2 Cloud Storage—or even use our always-hot storage to actively run your server like this Mastodon user who kept running out of storage and used Backblaze for a cost-effective storage solution.

Stay tuned: We’re planning on writing about this in the future.

But, if you’re just using your account like you would on any other social media platform—that is, you’re posting, finding friends, sharing cute pictures of dogs, etc.—you’ll want to make sure that your posts and memories are protected. There’s the normal run of data loss dangers: natural disasters, computer crashes, and so on. But also, since anyone can bring up their own Mastodon server, they can just as easily take them down. In that case, having a backup means that you can easily move your account to another server on the Mastodon platform without losing your toots.

Let’s talk about the best way to keep your data backed up with Backblaze Computer Backup.

Download Your Mastodon Data

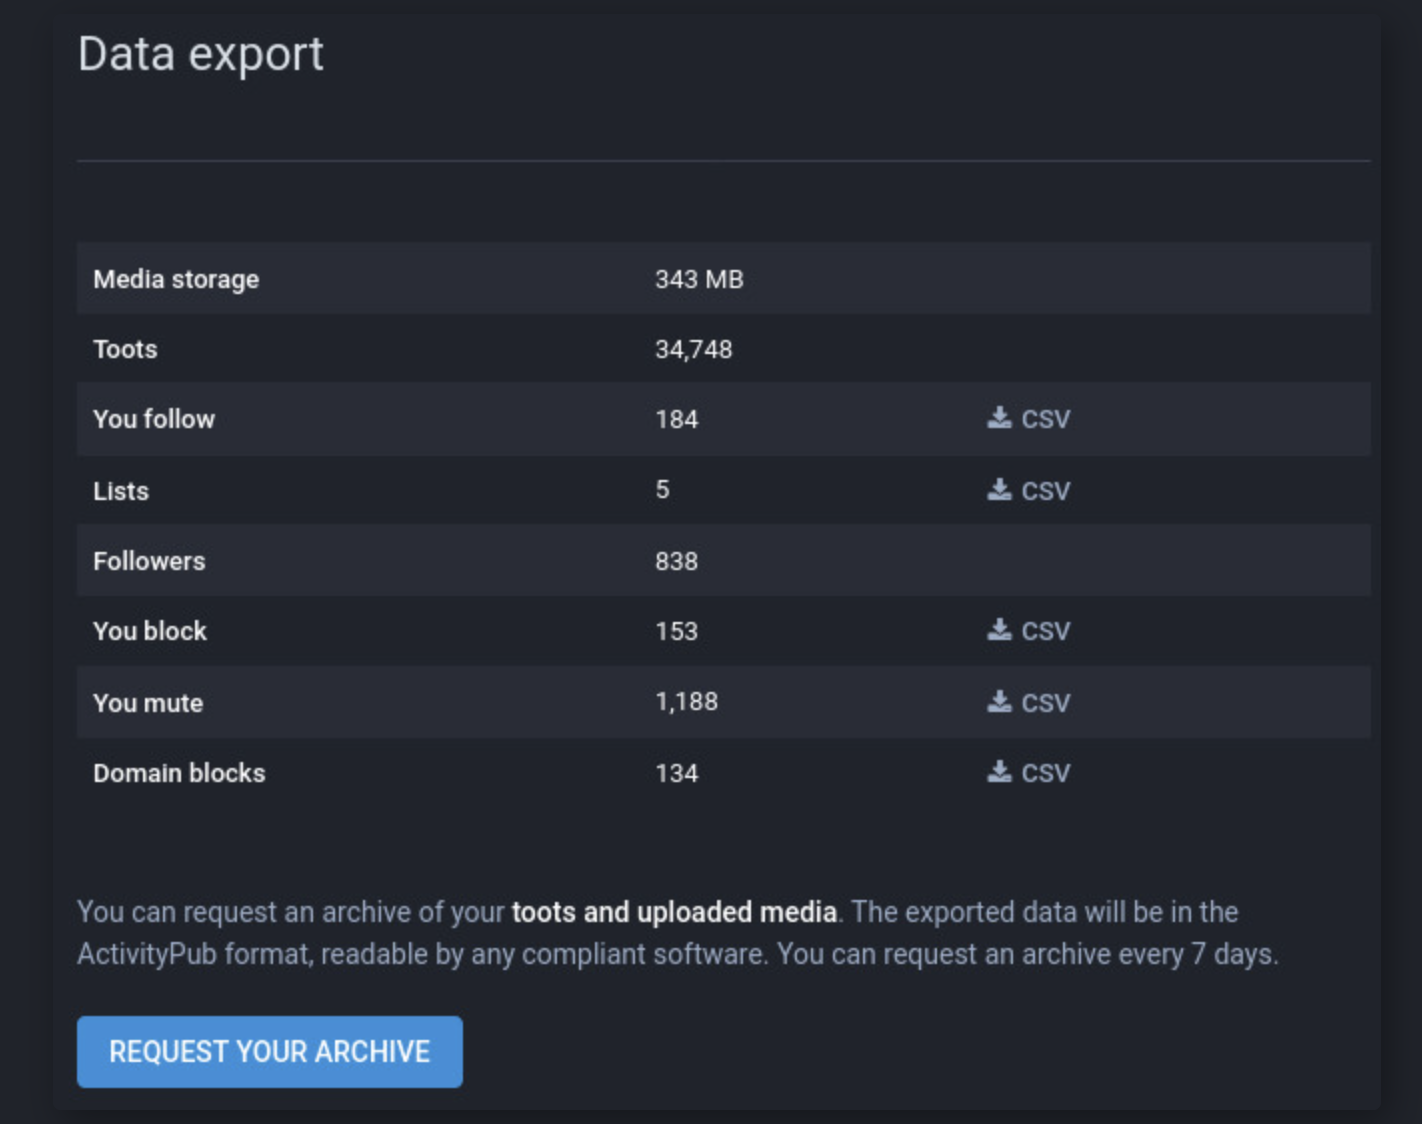
Like most services that prioritize open sourcing, Mastodon has a fantastic documentation center. If you ever have questions, start there first (that’s what we did). To get started with your Mastodon back up, you’ll want to download your account information. After you log into your account, navigate to Settings > Export. The screen should look like this:

As you can see, there are lots of lists you can download straight from this screen. These include your block lists and mute lists—an excellent feature which means you can maintain your privacy settings if you need to move your account, or open a new account on a different server.

To get your toots as well as any uploaded media, like photos or videos, you simply click the button to request your archive. You can request this archive once every seven days.

Once you have that file, you can either upload a copy of it to Backblaze B2 (which is free for your first 10GB of storage), or, Backblaze Personal Backup (we’ve got a free trial there too, of course). Backblaze Personal Backup is super easy—just save that file natively on your computer so that it’s included in your always-running backup service.

Why Back Up Your Mastodon Archive?

It’s always smart to protect your data with a 3-2-1 backup strategy. This means that you’ll have three copies of your data stored in two different local destinations with one copy kept off-site.

Taking your Mastodon archive file as an example, let’s see where those files would live to make sure we satisfy the 3-2-1 backup strategy:

  1. The downloaded copy of your Mastodon archive is saved to your personal computer.
  2. You also back up that archive on your external hard drive.
  3. You have a third copy of the file saved in your Backblaze account.

Especially if you’re using a sync service for the files on your computer, sometimes things get modified or deleted accidentally. When that happens, you can restore from the backup copy on your hard drive. If your hard drive crashes for some reason, then you also have another copy you can easily restore from your Backblaze account. Since it lives in the cloud, even if your computer and your hard drive are lost (say, in a natural disaster), you will still have another copy of your data you can use to get back online.

Even better: If you enable Extended Version History on your Backblaze Computer Backup account, you can see older versions of your file. That’s useful if you accidentally replace your Mastodon archive and there was something you needed, but got changed. They have the same name, right? It’d be an easy mistake to make and not notice until you need to restore. With Extended Version History, you’d just choose an earlier instance of the file, restore it, and then move that file back to your computer and hard drive.

Mastodon Users Are On Top of Back Up

Of course, you can always go above those minimum standards, as these folks were discussing in this Mastodon thread.

We’re not surprised that Mastodon users are talking about their intricate back up systems. Generally speaking, if you’re someone who is interested in or uses open-source tech, you know that it can be a double-edged sword. The community is constantly finding and fixing bugs, asking questions, and creating tech. It’s exciting and creative, but sometimes you have to do a bit more legwork to make things work well.

So, users on Mastodon know the risks when they choose to host their data on someone else’s server, and Mastodon gives you options for how to reconstitute your account if that happens. It’s one of the reasons we love Mastodon: they thought about how to back up when they built the platform.

And, because Mastodon is open source, “they” = users who are (often) also contributing to the code. Of course they’re having spirited debates about how to make their tech lives better and more secure—and we love to see it!

In Theory, It’s Easier to Lose Your Data on Mastodon

We said at the beginning of this article that it really doesn’t matter which server (“instance”) you choose to host your Mastodon account on—and it doesn’t, when you’re talking about interacting with the platform as a user.

The thing that is different about Mastodon is that because it runs on distributed servers, Mastodon is (in theory) more vulnerable than other networks to distributed denial of service (DDoS) attacks. If your server gets overloaded, it may result in you losing data.

A DDoS attack is like all these people shouting different questions at you at the same time and expecting answers—you’d crash and burn too.

Another thing to take note of is that Mastodon doesn’t have automatic updates. As a user, the onus is on you to check GitHub and to update accordingly. Since platform updates are often released to close security vulnerabilities, if you aren’t on top of this, you’re at risk of losing your data from a cyberattack.

This doesn’t mean that Mastodon as a social media site is less safe. In fact, because they automatically set up multi-factor authentication (MFA) and store less of your personal identifiable information, in some ways it’s safer than other platforms.

As long as you’re regularly backing up your Mastodon archive, you should be totally (“toot-ally”?) covered. Start your free trial with Backblaze Computer Backup, follow the steps we’ve set out above, and you’ll be all set.

The post How to Download and Back Up Your Mastodon Account appeared first on Backblaze Blog | Cloud Storage & Cloud Backup.

[$] Six years with the 4.9 kernel

Post Syndicated from original https://lwn.net/Articles/919570/

The release of the 4.9.337 stable
kernel update on January 7 marked the end of an era: after just over
six years of maintenance, the 4.9.x series will receive no more updates. This
kernel saw a lot of change after Linus Torvalds made the “final” release
and left the building; it’s time for a look at the “stable” portion of this
kernel’s life to see what can be learned.

Three new stable kernels

Post Syndicated from original https://lwn.net/Articles/919790/

Greg Kroah-Hartman has announced the release of the 6.1.5, 6.0.19,
and 5.15.87 stable kernels. As usual, they
contain lots of important fixes all over the kernel tree; users should
upgrade. This is also the last release in the 6.0.y kernel series: “All
users must move to the
6.1.y branch at this point in time, as this branch is now end-of-life.
”

Security updates for Thursday

Post Syndicated from original https://lwn.net/Articles/919785/

Security updates have been issued by Debian (emacs, libxstream-java, and netty), Fedora (mingw-binutils, pgadmin4, phoronix-test-suite, vim, and yarnpkg), Red Hat (.NET 6.0, dbus, expat, java-1.8.0-ibm, kernel, kernel-rt, kpatch-patch, libreoffice, libtasn1, libtiff, postgresql:10, sqlite, systemd, usbguard, and virt:rhel and virt-devel:rhel), and SUSE (net-snmp, openstack-barbican, openstack-barbican, openstack-heat-gbp, openstack-horizon-plugin-gbp-ui, openstack-neutron, openstack-neutron-gbp, php7, php74, php8, python-future, python3, samba, SDL2, and w3m).

Recog Release v3.0.3

Post Syndicated from Matthew Kienow original https://blog.rapid7.com/2023/01/12/recog-release-v3-0-3-2022-10-20/

Recog Release v3.0.3

Recog Release v3.0.3, which is available now, includes updated fingerprints for Zoho ManageEngine PAM360, Password Manager Pro, and Access Manager Plus; Atlassian Bitbucket Server; and Supervisord Supervisor. It also includes new fingerprints and a number of bug fixes, all of which are detailed below.

Recog is an open source recognition framework used to identify products, operating systems, and hardware through matching network probe data against its extensive fingerprint collection. Support for Recog is part of Rapid7’s ongoing commitment to open source initiatives.

Zoho ManageEngine PAM360, Password Manager Pro, and Access Manager Plus

Fingerprints for these three Zoho ManageEngine products were added shortly after Cybersecurity and Infrastructure Security Agency (CISA) added CVE-2022-35405 to their Known Exploited Vulnerabilities (KEV) catalog on September 22nd, 2022. Favicon, HTML title, and HTTP server fingerprints were created for both PAM360 and Password Manager Pro, and favicon and HTML title fingerprints were created for Access Manager Plus. PAM360 version 5500 (and older) and Password Manager Pro version 12100 (and older) are both vulnerable to an unauthenticated remote code execution (RCE) vulnerability, and Access Manager Plus version 4302 (and older) is vulnerable to an authenticated remote code execution (RCE) vulnerability. In addition, Grant Willcox contributed the Metasploit Zoho Password Manager Pro XML-RPC Java Deserialization exploit module which is capable of exploiting the unauthenticated vulnerability via the XML-RPC interface in Password Manager Pro and PAM360 and attaining RCE as the NT AUTHORITY\SYSTEM user.

More recently, on January 4th, 2023, Zoho released details of a SQL injection vulnerability (CVE-2022-47523) in PAM360 version 5800 (and older), Password Manager Pro version 12200 (and older) and Access Manager Plus version 4308 (and older). From a quick analysis of internet scan data there appears to be only about 76 Password Manager Pro and 21 PAM360 instances on the internet.

Recog Release v3.0.3

Recog Release v3.0.3

Atlassian Bitbucket Server

Favicon, HTML title and HTTP cookie fingerprints for the Atlassian Bitbucket server were added shortly after our Emergent Threat Response for CVE-2022-36804 was published on September 20th, 2022 in response to the command injection vulnerability in multiple API endpoints of both Bitbucket Server and Data Center. An adversary with access to either a public repository or read permissions on a private repository can perform remote code execution simply through a malicious HTTP request. Shelby Pace contributed the Metasploit Bitbucket Git Command Injection exploit module which is capable of exploiting the unauthenticated command injection. Bitbucket Server and Data Center versions 7.6 prior to 7.6.17, 7.17 prior to 7.17.10, 7.21 prior to 7.21.4, 8.0 prior to 8.0.3, 8.1 prior to 8.1.3, 8.2 prior to 8.2.2 and 8.3 prior to 8.3.1 are vulnerable. From a quick analysis of internet scan data there appears to be just under a thousand of these exposed on the internet.

Recog Release v3.0.3

Supervisord Supervisor

Favicon and HTML title fingerprints were added for anyone interested in locating unsupervised Supervisor instances on their networks. The web interface for the process control system allows users to restart or stop processes under the software’s control, and even tail the standard output and error streams. There might be some interesting information in those streams! From a quick analysis of internet scan data there appears to be only about 165 instances on the internet.

Recog Release v3.0.3

New fingerprints (23)

Bugs fixed (3)

Get the release

You can get the v3.0.3 Recog Ruby gem from RubyGems, the v3.0.3 Recog content archive from the Recog v3.0.3 release page, and you can get more details on the changes since the last release from GitHub:

Celebrating the community: Adarsh

Post Syndicated from Meg Wang original https://www.raspberrypi.org/blog/celebrating-the-community-adarsh/

In our work, we get to meet so many super inspiring young people who make things with technology. Our series of community stories is one way we share their journeys and enthusiasm for digital making with you.

Today we’re introducing you to Adarsh from California, USA.

Young tech creator Adarsh with his Raspberry Pi projects.

Meet Adarsh

Help us celebrate Adarsh and inspire other young people by sharing his story on Twitter, LinkedIn, Facebook, or Instagram.

We first met Adarsh at the Coolest Projects USA showcase in 2019, when he was 15 years old. Adarsh was chosen as the Coolest Projects judges’ favourite in the showcase’s Hardware category for making a Smart Sprinkler System, which can serve an entire community. He was inspired to create this project by the need he saw in California to manage water during a drought. Using a Raspberry Pi computer, he built a moisture sensor–based sprinkler system that integrates real-time weather forecast data and Twitter feeds to dispense only optimum amounts of water, in compliance with city water regulations. Adarsh says:

“The world around us right now has a lot of different problems that need to be solved and so the way that I get inspired is by looking outwards.”

In 2020, Coolest Projects Global went online with young people across the world sharing their tech projects, and Adarsh created a project for the showcase to solve another real-life problem he had witnessed. When Adarsh had been in middle school, his mother had to be rushed to hospital with a sudden heart problem. The experience of seeing her hooked up to lots of vital sign monitors, with the wires hindering her movement, stayed in his memory. It led Adarsh to create another tech project: the Contactless Vital Signs Monitor. This low-cost device can be used to monitor a person’s skin temperature, heart rate, respiratory rate, blood pressure, and oxygen saturation without needing to be in direct contact with them. Adarsh’s contactless monitor lets patients rest more comfortably and also keeps healthcare staff safer from infections.

Tech creator Adarsh and his mother on a walk in their California neighbourhood.
Adarsh and his mother on a walk in their California neighbourhood.

Adarsh entered his Contactless Vital Signs Monitor in the Davidson Fellows Scholarship programme, which recognises students who have completed significant projects that have the potential to benefit society.

Adarsh has this message for other young people who think they might like to try creating things with tech:

“None of these projects, to get to the stage where they are today, were without frustration or difficulties. That’s part of the process. You should expect that. Because of all the struggles I had, the fact that I was able to build all of this is so much more rewarding to me.”

Helping each other solve problems

A big part of coding and digital making is problem-solving and collaboration. Adarsh told us that he had a really great mentor, Johan, who introduced him to coding and Raspberry Pi hardware, and showed him where Adarsh could ask for help online.

“[The Raspberry Pi community] is such a large and inclusive community. It welcomes young students — even older adults who are first starting to develop their interest in computer science — and we all are developing our own skills, our own projects, and our own passions together, and while doing so, we’re helping each other out.”

Tech creator Adarsh and his mentor Johan.
Adarsh with his mentor Johan.

The future for Adarsh

Now a freshman at Stanford University, Adarsh is currently doing an epidemiology-related research project about the relationship between COVID-19 mutations and environmental, health, and demographic statistics. He wants to focus either on biomedical engineering or environmental engineering in his studies.

“Really [what I’m studying at university] is going to involve engineering or computer science largely due to the Raspberry Pi and the early influence it has had on my life.”

Thanks for inspiring us, Adarsh, and for letting us share your story with the community!

Help us celebrate Adarsh and inspire other young people to discover coding and digital making as a passion, by sharing his story on Twitter, LinkedIn, Facebook, or Instagram.

The post Celebrating the community: Adarsh appeared first on Raspberry Pi.

The collective thoughts of the interwebz