We’re excited to announce the launch of small multiples in Amazon QuickSight at AWS re:Invent 2022! Small multiples is one of the most powerful data visualization features when it comes to comparative analysis. Previously, you had to either use a filter or create multiple visuals side by side to analyze multiples slices of the same data. With the launch of small multiples, authors can simply add a dimension to the Small multiples field well to create multiple variations of the same chart.
In this post, we explore this new feature and its benefits.
What are Small Multiples?
Small multiples (aka trellis, facet, lattice, grid, or panel charts) allows you to compare data across many values for a given dimension. It splits a base visual into multiple versions of itself, presented side by side, with its data partitioned across these versions by a dimension. It provides an easier way to get a holistic view of your business instead of looking at data in silos. For example, you can view how your business is doing in each state without needing to create over 50 different visuals. Instead, you can see one visual with multiple small charts inside of it, as shown in the following screenshot.
Common use cases for small multiples
The small multiples feature provides the following benefits to your use cases:
Comparative analysis with easy pattern recognition – You can use small multiples to compare different subsets (categories) of the same dataset. Compared to animation, small multiples presents all of the data at once, making it easier for viewers to naturally compare each chart with others, instead of trying to flip back and forth between views.
Clean and digestible data – Trying to display multiple variables in a single chart can lead to overplotting and obscure readers, which can be overcome using small multiples(refer below example). Also, once the reader understands the design of one chart, they can apply this knowledge as they scan the rest of the charts. This shifts the reader’s effort from understanding how the chart works to what the data says, which makes decoding the chart lot easier.
Storytelling – Small multiples is a great tool often used by newspapers to depict a story and allow customers to view changes in patterns (for example, consider the following Washington Post article).
Track or view multiple slices of data at once – You can monitor multiple resources at once without generating multiple visualizations or filtering to slice and dice the data.
Create your own small multiples in QuickSight
Currently, you can create small multiples on vertical bar, clustered bar, line, dual axis line, and pie charts. To get started, create one of the supported visuals and drag the field by which you want to partition the data to the Small multiples field well. This creates multiples of the chart split by the dimension assigned in a grid fashion.
For charts supporting axes like line and bar, the X-axis is made common across charts. This provides a cleaner look to easily spot trends and identify the pain points or contributing factors. The axis display settings and axis titles are controlled by the individual chart settings. The following screenshot shows an example.
Styling small multiples
You can customize the style of small multiples in the following ways:
Choose a layout – For ease of use, small multiples by default chooses the best possible panel layout depending on the cardinality of the field. You can also adjust the number of rows and columns up to a max of 10 rows per column and 64 panels. Any multiples that don’t fit in the layout are loaded as you scroll vertically. In the following example, we have selected two rows and three columns as our layout. This means you only see six panels at a time; the rest can be accessed via vertical scroll.
Limit panels – You can define the maximum number of panels to be displayed based on the sort order applied on the field in your Small multiples field well.
Format panel titles – Panel titles add context to the multiples being viewed. You can add rich text formatting like font styling and alignment options.
Customize panel styling – You can further customize the small multiples look and feel by playing around with the panel border styling options, adjusting the panel spacing, and adding panel background color.
Interacting with the data
Sorting– Depending on the chart type, you can sort by axis, value, and small multiples fields in ascending or descending order.
Filtering experience- You can also set filter actions in same way you set for other charts. Filtering on small multiples will pass both the small multiples and axis (in case of line or bar charts) or group (pie charts) context.
More to come
We’re excited about our launch, and we have lots more planned for small multiples. In upcoming releases, we will tackle the current limitations:
Drill-down is currently not supported for small multiples.
Reference lines have been disabled for now.
Show Other small multiples panel is not supported.
Small multiples isn’t supported when the primary category is sorted by a field that has the distinct count aggregation function.
Small multiples doesn’t support calculated values with table calculation.
Data zoom on the X axis for line and bar charts is disabled for now.
Panel title is not displayed in the tooltip by default. To see it, you have to manually customize the tooltip and add a Small multiples field in it.
Summary
In this post, we looked at the small multiples features, and learned about its various use cases and how to configure them in QuickSight. You can analyze data by multiple dimension attributes in an easy-to-understand and easy-to-maintain way. With small multiples, readers can quickly see which categories are most important, and spot trends and insights. Start using small multiples to enrich your dashboards’ current visualization and unlock new business use cases today!
About the Author
Bhupinder Chadha is a senior product manager for Amazon QuickSight focused on visualization and front end experiences. He is passionate about BI, data visualization and low-code/no-code experiences. Prior to QuickSight he was the lead product manager for Inforiver, responsible for building a enterprise BI product from ground up. Bhupinder started his career in presales, followed by a small gig in consulting and then PM for xViz, an add on visualization product.
We are excited to announce the launch of text boxes in Amazon QuickSight. Now you can add text for common use cases, including but not limited to titles, subtitles, annotations, adding additional information for KPIs etc has been simplified than ever before with the new text box. You can reposition, resize, and make your text stand out with various rich text formatting options like font styling, text alignment, and text box styling. You can also add dynamic text values with the help of user-defined parameters and system-defined parameters like date and page number.
In this post, we explore the new text box feature and its benefits.
Solution overview
The new text box feature may feel like an overlap with narrative insight capabilities, which is focused on advance use cases where a text box is lightweight, focused on simplified textual content, and doesn’t need any data assignment. You can add text boxes without being restricted by the total visual limit because it’s not counted towards the sheet visual limit.
You can do the following with a text box in QuickSight:
Add freehand text and display dynamic text values with the help of parameters
Support reporting use cases with system-defined parameters like date and page count
Perform rich text editing with font styling options, alignment options, and bulleting
Add an image to your text box, such as displaying your company logo with the analysis title text
Hyperlink your text to navigate to a different sheet or external URLs
Style your text box with background color and border styling options
Add a text box to an analysis sheet
To add a text box to your analysis, you can either choose Add on the drop-down menu or choose the text box icon from the visual selector. Note that unlike other visuals, you can’t convert a text box to another visual, or vice versa.
You now have an empty text box on the sheet. To position the text box, select the box and drag it from the borders. To resize the text box, select and drag any of the outline handles.
Now you can add text and format it by using the various formatting options, such as:
Font styling, including font style, color, and size
Typographical emphasis, such as bold, italics, underline, and strikethrough
Alignment options and bulleting
You can hyperlink text or add a static or dynamic URL by choosing the URL icon.
Just like adding parameters to titles and subtitles, you can display parameter values in a text box as well. Choose from a list of parameters available in the analysis from the parameter drop-down menu.
Along with text, you can add images as well inside the text box by clicking the image icon.
Apart from text formatting you can also format background and border color.
When you’ve finished editing the text box, click on the blank space on the sheet.
Add a text box to a reporting sheet
Although the steps to add a text box to a reporting sheet remain the same as that of an analysis sheet, you have two new system parameter options while adding the text box to the header or footer of your reporting sheet:
Date parameter – Add the print date and time to your report by choosing the date parameter (AWS:printTime) and selecting from a list of date formats. If your organization uses a different date format, you can customize it by choosing the added date and selecting from the list of supported date formats.
Page parameter – Display the current page number (AWS:pageNumber), total number of pages (AWS:pageCount), or a combination of both by choosing the page parameter.
Summary
In this post, we looked at how the new text box feature in QuickSight provides a great way to add text and format it with rich text capabilities and provide parameter support, URLs, and images. The new text box is now generally available in all supported QuickSight Regions.
Give the text box a try and let us know about your experience in the comments section.
About the author
Bhupinder Chadha is a senior product manager for Amazon QuickSight focused on visualization and front end experiences. He is passionate about BI, data visualization and low-code/no-code experiences. Prior to QuickSight he was the lead product manager for Inforiver, responsible for building a enterprise BI product from ground up. Bhupinder started his career in presales, followed by a small gig in consulting and then PM for xViz, an add on visualization product.
Amazon QuickSight is a serverless, cloud-based business intelligence (BI) service that brings data insights to your teams and end-users through machine learning (ML)-powered dashboards and data visualizations that can be accessed via QuickSight or embedded in apps and portals that your users access.
Line charts in QuickSight have undergone a major overhaul this year, starting with an increased limit on the number of data points that can be rendered in a single chart from 2,500 to 10,000 points, followed by missing data treatment, and finally ending this year with line and marker customization options.
With the new styling options, you can make line charts more readable and drive readers’ attention towards the line series you want to emphasize. Although colors help convey meaning, in certain cases choosing different line patterns could help differentiate between lines for people with color blindness, and making lines bold could make them stand out from the rest. Some enhancements like step line interpolation are more than a styling feature, where you can display step lines for data that changes at a specific point in time and at irregular intervals. For example, if you were to build a chart of postage stamp prices in the US, a step line would be preferred than a slope to indicate change in price. The line between the dates would remain flat until the next price change is observed.
In this post, we discuss the updates to the line chart customization options and their benefits.
Line chart format pane updates
The data series section under the format pane has been updated with a new flyout menu consisting of line styling, marker customization, and axis settings. Authors can choose to set a base style, which is a common style across all series, and also customize individual series by either choosing Select Series to Style or by directly selecting the series on the line chart on the sheet. Previously, the long list of series names made it difficult to track series where the axis setting was changed. This has been updated to only display individually styled series. Also, you can remove and reset to default styling if you wish to go back to the previous style.
The following figure compares the old and new experience.
Line styling
The data series tab, where users adjust axis placement (left and right Y axis), now also includes options to style individual series or all series in the line chart and change presentation options. For example, you can create a dot plot chart in QuickSight by hiding the line series and displaying only markers.
Let’s look at the recently added line styling options:
Line interpolation – Allow authors to choose between linear, smooth, and stepped line interpolation options:
Linear – The most commonly used line interpolation for trend analysis.
Smooth – A variation of line charts, which connects the data points using smooth curves instead of straight lines. Apart from the aesthetic aspect, these charts are preferred for displaying a gradual change in trends and where data accuracy isn’t critical.
Stepped – A specialized version of the traditional line charts, where the data points are connected via step-like progressions instead of straight lines. You can use stepped lines to view sudden and exact time of changes in the data, where the vertical lines represent the magnitude of the changes and the horizontal lines represent periods of time where data is constant. You can also use this approach to create bump charts, which are commonly used to visualize changes in rank over time.
Line style – Another way to make your line charts more accessible and printer friendly is to define line styles to differentiate between series. A classic example would be visualizing actual and target values across a given time period. You can choose between solid, dotted, and dash line style.
Color customization – Colors play an important role in conveying meaning and driving user attention. Although defining a distinct color for each series helps distinguish between the different series, doing the same for a large number of series could add visual clutter. As part of best practices in such cases, highlighting certain series makes it easier for readers to focus on the important information, especially while viewing a large number of line series.
Line width – You can choose from predefined line widths to easily differentiate between line series and let important values stick out to drive reader focus. In the following example, we’re interested in showing the seasonality trends for gardening and home decor in relation to other parts of the business. To do that, instead of assigning each series a different color, we might only adjust color and increase thickness for gardening and home decor and keep other series as grey and thin. This way, reader attention is easily drawn towards the thicker, colored lines.
Marker customization
Data markers help draw attention to the data points along a line. They also come in handy when showing which data points are covered by your data in case your line chart contains missing data points. Data markers can be enabled for all series or individual series. When enabling data markers for all series, you should be judicious to avoid visual clutter and draw attention to too many elements.
These new customizations enable new use cases such as dot plot charts (hide line series and display only markers) and slope graphs. Data point markers will only show up for data points where data exists and not for interpolated values using the missing data control. The following are the marker properties:
Shape – Choose from a predefined list of marker shapes like circle, diamond, or square.
Size – Define a size for the marker. Note that the marker size should be greater than the line width to be visible.
Color – By default, markers are assigned the same color as individual series. However, this can be changed as desired.
How to style lines and markers
Create or choose a line chart that you want to style and choose the pencil icon to open the Format visual pane. Navigate to the data series section and select the base style to apply common styling options to all series—color toned down to light grey and line interpolation as smooth.
Line styling – To style a specific series, select the series to style on the drop-down menu and set the desired line styling options. In our example, the high series line width has been increased to 4px and the color is set to purple.
Marker styling – Turn the marker styling toggle on to customize markers and choose marker styling options. Select your desired marker shape and size.
Axis placement – You can change the series axis from left to right and convert it into a dual axis chart.
Remove styling – If you want to reset to the default styling, choose Remove styling for an individual series and choose the reset icon for the base style.
Visual ingress – Apart from using the format pane for styling, authors can also style a series directly by selecting the series on the visual.
Summary
In this post, we looked at the new line and marker styling options for line charts and how you can apply a common style across all series as well as style each series individually. We also looked at the different ingress and Y axis placement options. Learn more on how to use small multiples in QuickSight To learn more, click here
We look forward to learning more about your interesting use cases and feedback on how we can better serve you! Follow the QuickSight Community to stay up to date with new feature announcement, events, learning center, and questions and answers.
About the author
Bhupinder Chadha is a senior product manager for Amazon QuickSight focused on visualization and front end experiences. He is passionate about BI, data visualization and low-code/no-code experiences. Prior to QuickSight he was the lead product manager for Inforiver, responsible for building a enterprise BI product from ground up. Bhupinder started his career in presales, followed by a small gig in consulting and then PM for xViz, an add on visualization product.
This is a guest post co-written with Siva Bangaru and Leon Liu from ADP.
ADP helps organizations of all types and sizes by providing human capital management (HCM) solutions that unite HR, payroll, talent, time, tax, and benefits administration. ADP is a leader in business outsourcing services, analytics, and compliance expertise. ADP’s unmatched experience, deep insights, and cutting-edge technology have transformed human resources from a back-office administrative function to a strategic business advantage.
People Analytics powered by ADP DataCloud is an application that provides analytics and enhanced insights to ADP’s clients. It delivers a guided analytics experience that make it easy for you to create, use, and distribute tailored analytics for your organization. ADP People Analytics’s streamlined, configurable dashboards can help you identify potential issues in key areas, like overtime, turnover, compensation, and much more.
ADP provides this analytics experience to thousands of clients today. Securing customers’ data is a top priority for ADP. The company requires the highest security standards when implementing a multi-tenant analytics platform on Amazon Redshift.
ADP DataCloud integrates with Amazon Redshift row-level security (RLS) to implement granular data entitlements and enforce the access restrictions on their tables in Amazon Redshift.
In this post, we discuss how the ADP DataCloud team implemented Amazon Redshift RLS on the foundation of role-based access control (RBAC) to simplify managing privileges required in a multi-tenant environment, and also enabled and enforced access to granular data entitlements in business terms.
The ADP DataCloud team had the following key requirements and challenges:
Support a multi-tenant application to enforce a logical separation of each tenant’s data rows
Support dynamic provisioning of new tenants
Minimal impact on performance
Row-level security in Amazon Redshift
Amazon Redshift is a fully managed, petabyte-scale data warehouse service in the cloud. One of the challenges with security is that enterprises want to provide fine-grained access control at the row level for sensitive data. This can be done by creating views or using different databases and schemas for different users. However, this approach isn’t scalable and becomes complex to maintain over time, especially when supporting multi-tenant environments.
In early 2022, Amazon Redshift released row-level security, which is built on the foundation of role-based access control. RLS allows you to control which users or roles can access specific records of data within tables, based on security policies that are defined at the database object level. This new RLS capability in Amazon Redshift enables you to dynamically filter existing rows of data in a table along with session context variable setting capabilities to dynamically assign the appropriate tenant configuration. This is in addition to column-level access control, where you can grant users permissions to a subset of columns. Now you can combine column-level access control with RLS policies to further restrict access to particular rows of visible columns. Refer to Achieve fine-grained data security with row-level access control in Amazon Redshift for additional details.
Solution overview
As part of ADP’s key requirements to support a multi-tenant data store wherein a single table holds data of multiple tenants, enforcement of security policies to ensure no cross-tenant data access is of paramount importance. One obvious way to ensure this is by creating database users for each tenant and implementing RLS policies to filter a single tenant’s data as per the logged-in user. But this can be tedious and become cumbersome to maintain as the number of tenants grow by the thousands.
This post presents another way to handle this use case by combining session context variables and RLS policies on tables to filter a single tenant’s data, thereby easing the burden of creating and maintaining thousands of database users. In fact, a single database user is all that is needed to connect and query different tenant’s data in different sessions from a multi-tenant table by setting different values to a session context variable in each session, as shown in the following diagram.
Let’s start by covering the high-level implementation steps. Consider there is a database user in Amazon Redshift app_user (which is neither a super user, nor has the sys:secadmin role granted, nor has the IGNORE RLS system privilege granted via another role). The user app_user owns a schema with the same name and all objects in it. The following is a typical multi-tenant table employee in the app_user schema with some sample records shown in the table:
CREATE TABLE app_user.employee (
    tenant_id varchar(50) not null,
    id varchar(50) not null,
    name varchar(200),
    email varchar(200),
    ssn char(9),
    constraint employee_pkey primary key (tenant_id,id)
);
TENANT_ID
ID
NAME
EMAIL
SSN
T0001
E4646
Andy
.
XXXXXXXXX
T0001
E4689
Bob
.
XXXXXXXXX
T0001
E4691
Christina
.
XXXXXXXXX
T0002
E4733
Peter
.
XXXXXXXXX
T0002
E4788
Quan
.
XXXXXXXXX
T0002
E4701
Rose
.
XXXXXXXXX
T0003
E5699
Diana
.
XXXXXXXXX
T0003
E5608
Emily
.
XXXXXXXXX
T0003
E5645
Florence
.
XXXXXXXXX
To implement that, the following steps are required:
Create a RLS policy on a column using a predicate that is set using a session context variable.
Enable RLS at the table level and attach the RLS policy on the table.
Create a stored procedure that sets the session context variable used in the RLS policy predicate.
Connect and call the stored procedure to set the session context variable and query the table.
Now RLS can be enabled on this table in such a way that whenever app_user queries the employee table, the user will either see no rows or retrieve only rows specific to single tenant despite being the owner of the table.
An administrator, such as app_admin, either a super user or a user that has the sys:secadmin role, can enforce this as follows:
Create a RLS policy that attaches a tenant_id predicate using a session context variable:
create rls policy tenant_policy
with (tenant_id varchar(50))
using (tenant_id = current_setting('app_context.tenant_id'));
Enable RLS and attach the policy on the employee table:
alter table app_user.employee row level security on;

attach rls policy tenant_policy on app_user.employee to public;
Create a stored procedure to set the tenant_id in a session variable and grant access to app_user:
create or replace procedure app_admin.set_app_context
(p_tenant_id in varchar)
	language plpgsql
as $$
declare
		v_tenant_id  varchar(50);
begin
    reset all;
	v_tenant_id := set_config('app_context.tenant_id',p_tenant_id,false);
end;
 $$
;

grant execute on app_admin. set_app_context(varchar) to app_user;
Connect to app_user and call the stored procedure to set the session context variable:
call app_admin.set_app_context('T0001');
When this setup is complete, whenever tenants are connecting to ADP Analytics dashboards, it connects as app_user and runs stored procedures by passing tenant_id, which sets the session context variable using the tenant ID. In this case, when requests come to connect and query the employee table, the user will experience the following scenarios:
No data is retrieved if current_setting('app_context.tenant_id') is not set or is null
Data is retrieved if current_setting('app_context.tenant_id') is set by calling the app_admin.set_app_context(varchar) procedure to a value that exists in the employee table (for example, app_admin.set_app_context(‘T0001’))
No data is retrieved if current_setting('app_context.tenant_id') is set to a value that doesn’t exist in the employee table (for example, app_admin.set_app_context(‘T9999’))
Validate RLS by examining query plans
Now let’s review the preceding scenarios by running an explain plan and observing how RLS works for the test setup. If a query contains a table that is subject to RLS policies, EXPLAIN displays a special RLS SecureScan node. Amazon Redshift also logs the same node type to the STL_EXPLAIN system table. EXPLAIN doesn’t reveal the RLS predicate that applies to the employee table. To view an explain plan with RLS predicate details, the EXPLAIN RLS system privilege is granted to app_user via a role.
In this first scenario, tenant_id wasn’t set by the stored procedure and was passed as a null value, therefore below select statement returns no rows .
=> select count(1),tenant_id from employee group by 2;

count | tenant_id

-------+-------------

(0 rows)
Explain plan output shows the filter as NULL:
=> explain select count(1),tenant_id from employee group by 2;

QUERY PLAN

--------------------------------------------------------------------------------

XN HashAggregate (cost=0.10..0.11 rows=4 width=20)

-> XN RLS SecureScan employee (cost=0.00..0.08 rows=4 width=20)

-> XN Result (cost=0.00..0.04 rows=4 width=20)

One-Time Filter: NULL::boolean

-> XN Seq Scan on employee (cost=0.00..0.04 rows=4 width=20)

(5 rows)
In the second scenario, tenant_id was set by the stored procedure and passed as a value of T0001, therefore returning only corresponding rows as shown in the explain plan output:
Call stored procedure to set the session context variable as ‘T0001’ and then run the select :
=> call app_admin.set_app_context('T0001');

=> select count(1),tenant_id from employee group by 2;
 count |   tenant_id
-------+------------------
     3 | T0001
(1 row)
Explain plan output shows the filter on tenant_id as ‘T0001’
=> explain select count(1),tenant_id from employee group by 2;
                                QUERY PLAN
--------------------------------------------------------------------------
 XN HashAggregate  (cost=0.07..0.07 rows=1 width=20)
   ->  XN RLS SecureScan employee  (cost=0.00..0.06 rows=1 width=20)
         ->  XN Seq Scan on employee  (cost=0.00..0.05 rows=1 width=20)
               Filter: ((tenant_id)::text = 'T0001'::text)
(4 rows)
In the third scenario, a non-existing tenant_id was set by the stored procedure, therefore returning no rows:
=> call app_admin.set_app_context('T9999');

=> select count(1),tenant_id from employee group by 2;
 count | tenant_id
-------+-------------
(0 rows)


=> explain select count(1),tenant_id from employee group by 2;
                                QUERY PLAN
--------------------------------------------------------------------------
 XN HashAggregate  (cost=0.07..0.07 rows=1 width=20)
   ->  XN RLS SecureScan employee  (cost=0.00..0.06 rows=1 width=20)
         ->  XN Seq Scan on employee  (cost=0.00..0.05 rows=1 width=20)
               Filter: ((tenant_id)::text = 'T9999'::text)
(4 rows)
Another key point is that you can apply the same policy to multiple tables as long as they have the column (tenant_id varchar(50)) defined with the same data type, because RLS polices are strongly typed in Amazon Redshift. Similarly, you can combine multiple RLS policies defined using different session context variables or other relevant column predicates and attach them to a single table.
Also, this RLS implementation doesn’t need any changes when a new tenant’s data is added to the table, because it can be queried by simply setting the new tenant’s identifier in the session context variable that is used to define the filter predicate inside the RLS policy. A tenant to its corresponding identifier mapping is typically done during an application’s tenant onboarding process and is generally maintained in a separate metastore, which is also referred to during each tenant’s login to get the tenant’s identifier. With that, thousands of tenants could be provisioned without needing to change any policy in Amazon Redshift. In our testing, we found no performance impact by tenants after RLS was implemented.
Conclusion
In this post, we demonstrated how the ADP DataCloud team implemented row-level security in a multi-tenant environment for thousands of customers using Amazon Redshift RLS and session context variables. For more information about RLS best practices, refer to Amazon Redshift security overview.
Try out RLS for your future Amazon Redshift implementations, and feel free to leave a comment about your use cases and experience.
About the authors
Siva Bangaru is a Database Architect at ADP. He has more than 13 years of experience with technical expertise on design, development, administration, and performance tuning of database solutions for a variety of OLAP and OLTP use cases on multiple database engines like Oracle, Amazon Aurora PostgreSQL, and Amazon Redshift.
Leon Liu is a Chief Architect at ADP. He has over 20 years of experience with enterprise application framework, architecture, data warehouses, and big data real-time processing.
Neha Daudani is a Solutions Architect at AWS. She has 15 years of experience in the data and analytics space. She has enabled clients on various projects on enterprise data warehouses, data governance, data visualization, master data management, data modeling, and data migration for clients to use business intelligence and analytics in business growth and operational efficiency.
Rohit Bansal is an Analytics Specialist Solutions Architect at AWS. He specializes in Amazon Redshift and works with customers to build next-generation analytics solutions using other AWS Analytics services.
The CCCS is Canada’s authoritative source of cyber security expert guidance for the Canadian government, industry, and the general public. Public and commercial sector organizations across Canada rely on CCCS’s rigorous Cloud Service Provider (CSP) IT Security (ITS) assessment in their decisions to use cloud services. In addition, CCCS’s ITS assessment process is a mandatory requirement for AWS to provide cloud services to Canadian federal government departments and agencies.
The CCCS Cloud Service Provider Information Technology Security Assessment Process determines if the Government of Canada (GC) ITS requirements for the CCCS Medium cloud security profile (previously referred to as GC’s Protected B/Medium Integrity/Medium Availability [PBMM] profile) are met as described in ITSG-33 (IT security risk management: A lifecycle approach). As of November 2022, 132 AWS services in the Canada (Central) Region have been assessed by the CCCS and meet the requirements for the CCCS Medium cloud security profile. Meeting the CCCS Medium cloud security profile is required to host workloads that are classified up to and including the medium categorization. On a periodic basis, CCCS assesses new or previously unassessed services and reassesses the AWS services that were previously assessed to verify that they continue to meet the GC’s requirements. CCCS prioritizes the assessment of new AWS services based on their availability in Canada, and on customer demand for the AWS services. The full list of AWS services that have been assessed by CCCS is available on our Services in Scope for CCCS Assessment page.
To learn more about the CCCS assessment or our other compliance and security programs, visit AWS Compliance Programs. As always, we value your feedback and questions; you can reach out to the AWS Compliance team through the Contact Us page.
If you have feedback about this post, submit comments in the Comments section below. Want more AWS Security news? Follow us on Twitter.
This post has been updated since it was originally published in 2017.
Programs, processes, and threads are all terms that relate to software execution, but you may not know what they really mean. Whether you’re a seasoned developer, an aspiring enthusiast, or you’re just wondering what you’re looking at when you open Task Manager on a PC or Activity Monitor on a Mac, learning these terms is essential for understanding how a computer works.
This post explains the technical concepts behind computer programs, processes, and threads to give you a better understanding of the functionality of your digital devices. With this knowledge, you can quickly diagnose problems and come up with solutions, like knowing if you need to install more memory for better performance. If you care about having a fast, efficient computer, it is worth taking the time to understand these key terms.
What Is a Computer Program?
A program is a sequence of coded commands that tells a computer to perform a given task. There are many types of programs, including programs built into the operating system (OS) and ones to complete specific tasks. Generally, task-specific programs are called applications (or apps). For example, you are probably reading this post using a web browser application like Google Chrome, Mozilla Firefox, or Apple Safari. Other common applications include email clients, word processors, and games.
The process of creating a computer program involves designing algorithms, writing code in a programming language, and then compiling or interpreting that code to transform it into machine-readable instructions that the computer can execute.
What Are Programming Languages?
Programming languages are the way that humans and computers talk to each other. They are formalized sets of rules and syntax.
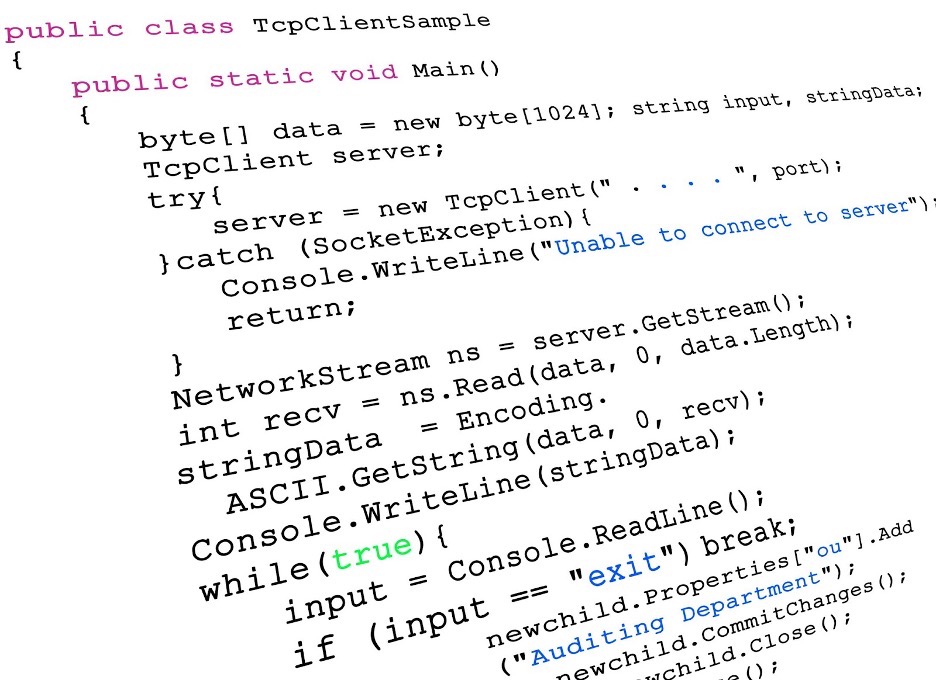
C# example of program code.
Compiled vs. Interpreted Programs
Many programs are written in a compiled language and created using programming languages like C, C++, C#. The end result is a text file of code that is compiled into binary form in order to run on the computer (more on binary form in a few paragraphs). The text file speaks directly to your computer. While they’re typically fast, they are also fixed compared to interpreted programs. That has positives and negatives: you have more control over things like memory management, but you’re platform dependent and, if you have to change something in your code, it typically takes longer to build and test.
There is another kind of program called an interpreted program. They require an additional program to take your program instructions and translate that to code for your computer. Compared with compiled languages, these types of programs are platform-independent (you just have to find a different interpreter, instead of writing a whole new program) and they typically take up less space. Some of the most common interpreted programming languages are Python, PHP, JavaScript, and Ruby.
Ultimately, both kinds of programs are run and loaded into memory in binary form. Programs have to run in binary because your computer’s CPU understands only binary instructions.
What Is Binary Code?
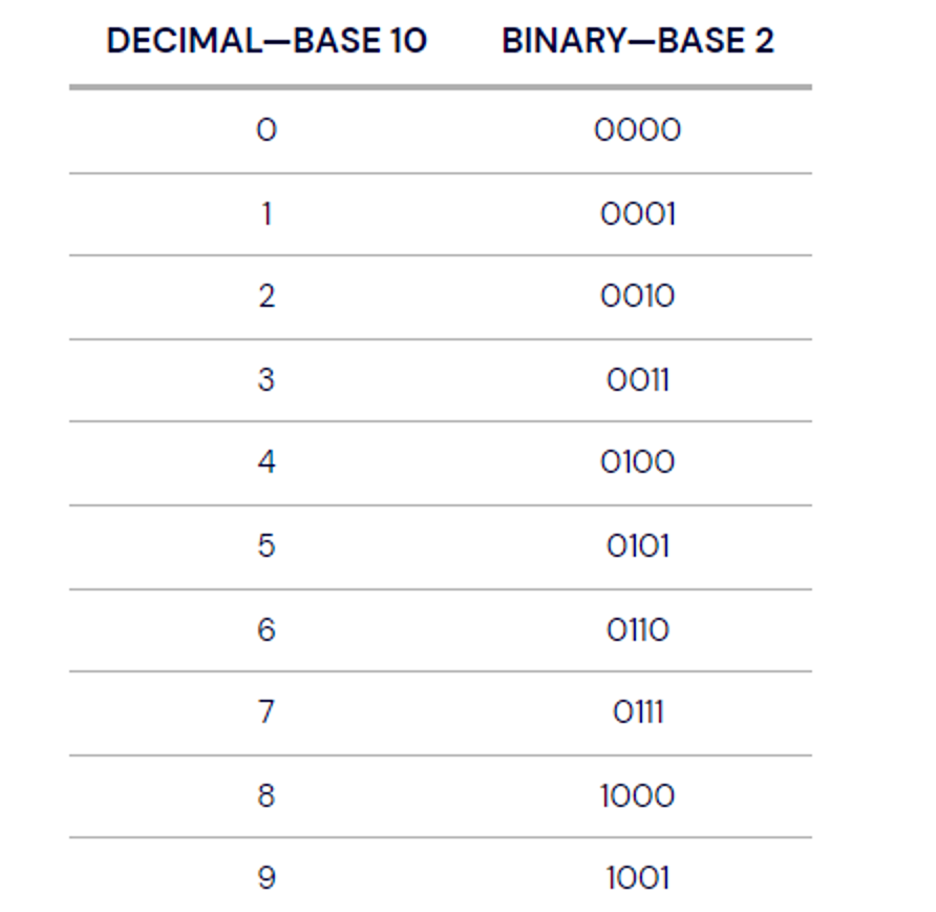
Binary is the native language of computers. At their most basic level, computers use only two states of electrical current—on and off. The on state is represented by 1 and the off state is represented by 0. Binary is different from the number system—base 10—that we use in daily life. In base 10, each digit position can be anything from 0 to 9. In the binary system, also known as base 2, each position is either a 0 or a 1.
Perhaps you’ve heard the programmer’s joke, “There are only 10 types of people in the world, those who understand binary, and those who don’t.”
How Are Computer Programs Stored and Run?
Programs are typically stored on a disk or in nonvolatile memory in executable format. Let’s break that down to understand why.
In this context, we’ll talk about your computer having two types of memory: volatile and nonvolatile. Volatile memory is temporary and processes in real time. It’s faster, easily accessible, and increases the efficiency of your computer. However, it’s not permanent. When your computer turns off, this type of memory resets.
Nonvolatile memory, on the other hand, is permanent unless deleted. While it’s slower to access, it can store more information. So, that makes it a better place to store programs. A file in an executable format is simply one that runs a program. It can be run directly by your CPU (that’s your processor). Examples of these file types are .exe in Windows and .app in Mac.
What Resources Does a Program Need to Run?
Once a program has been loaded into memory in binary form, what happens next?
Your executing program needs resources from the OS and memory to run. Without these resources, you can’t use the program. Fortunately, your OS manages the work of allocating resources to your programs automatically. Whether you use Microsoft Windows, macOS, Linux, Android, or something else, your OS is always hard at work directing your computer’s resources needed to turn your program into a running process.
In addition to OS and memory resources, there are a few essential resources that every program needs.
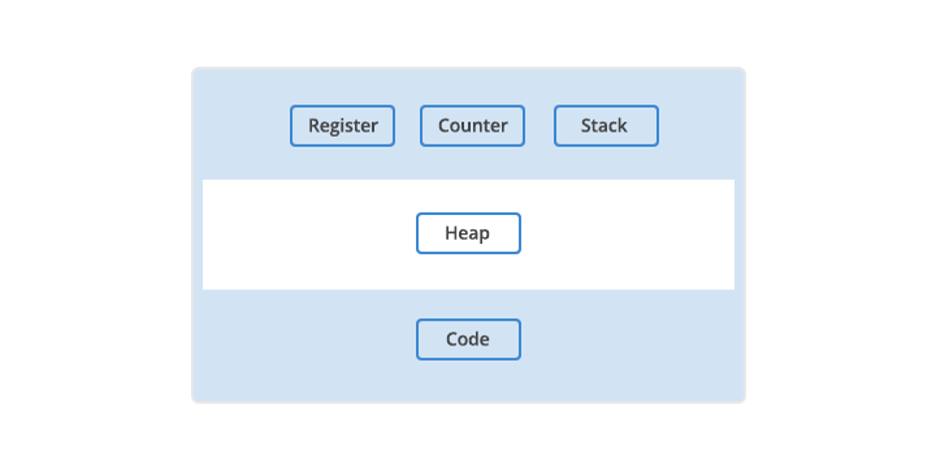
Register. Think of a register as a holding pen that contains data that may be needed by a process like instructions, storage addresses, or other data.
Program counter. Also known as an instruction pointer, the program counter plays an organizational role. It keeps track of where a computer is in its program sequence.
Stack. A stack is a data structure that stores information about the active subroutines of a computer program. It is used as scratch space for the process. It is distinguished from dynamically allocated memory for the process that is known as the “heap.”
The main resources a program needs to run.
What Is a Computer Process?
When a program is loaded into memory along with all the resources it needs to operate, it is called a process. You might have multiple instances of a single program. In that situation, each instance of that running program is a process.
Each process has a separate memory address space. That separate memory address is helpful because it means that a process runs independently and is isolated from other processes. However, processes cannot directly access shared data in other processes. Switching from one process to another requires some amount of time (relatively speaking) for saving and loading registers, memory maps, and other resources.
Having independent processes matters for users because it means one process won’t corrupt or wreak havoc on other processes. If a single process has a problem, you can close that program and keep using your computer. Practically, that means you can end a malfunctioning program and keep working with minimal disruptions.
What Are Threads?
The final piece of the puzzle is threads. A thread is the unit of execution within a process.
A process can have anywhere from one thread to many.
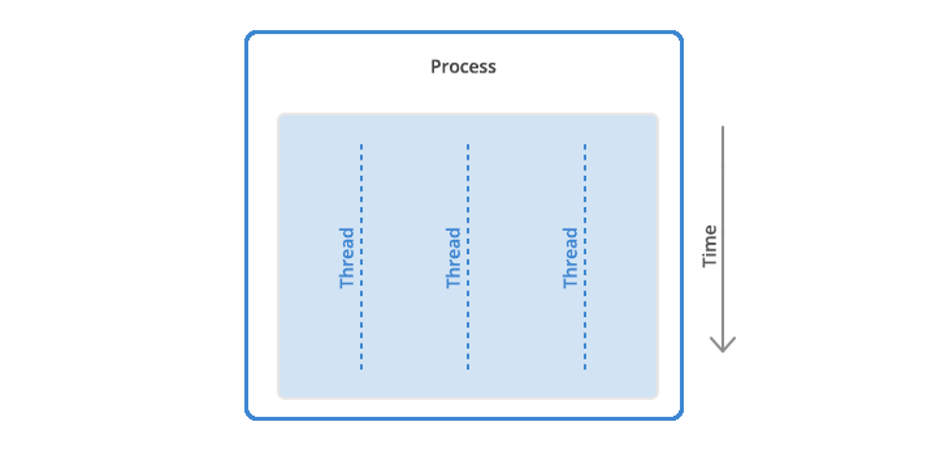
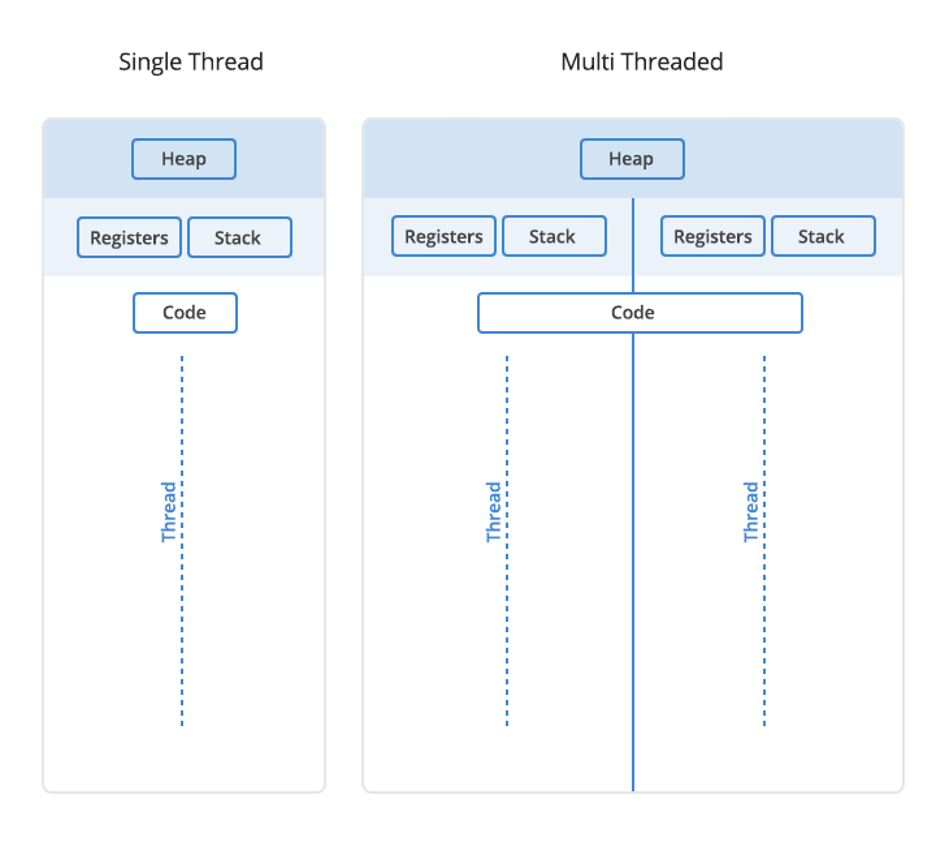
When a process starts, it receives an assignment of memory and other computing resources. Each thread in the process shares that memory and resources. With single-threaded processes, the process contains one thread.
The difference between single thread and multi-thread processes.
In multi-threaded processes, the process contains more than one thread, and the process is accomplishing a number of things at the same time (to be more accurate, we should say “virtually” the same time—you can read more about that in the section below on concurrency).
Earlier, we talked about the stack and the heap, the two kinds of memory available to a thread or process. Distinguishing between these kinds of memory matters because each thread will have its own stack. However, all the threads in a process will share the heap.
Some people call threads lightweight processes because they have their own stack but can access shared data. Since threads share the same address space as the process and other threads within the process, it is easy to communicate between the threads. The disadvantage is that one malfunctioning thread in a process can impact the viability of the process itself.
How Threads and Processes Work Step By Step
Here’s what happens when you open an application on your computer.
The program starts out as a text file of programming code.
The program is compiled or interpreted into binary form.
The program is loaded into memory.
The program becomes one or more running processes. Processes are typically independent of one another.
Threads exist as the subset of a process.
Threads can communicate with each other more easily than processes can.
Threads are more vulnerable to problems caused by other threads in the same process.
Computer Process vs. Threads
Aspect
Processes
Threads
Definition
Independent programs with their own memory space.
Lightweight, smaller units of a process, share memory.
Creation Overhead
Higher overhead due to separate memory space.
Lower overhead as they share the same memory space.
Isolation
Processes are isolated from each other.
Threads share the same memory space.
Resource Allocation
Each process has its own set of system resources.
Threads share resources within the same process.
Independence
Processes are more independent of each other.
Threads are dependent on each other within a process.
Failure Impact
A failure in one process does not directly affect others.
A failure in one thread can affect others in the same process.
Sychronization
Less need from synchronization, as processes are isolated.
Requires careful synchronization due to shared resources.
Example Use Cases
Running multiple independent applications.
Multithreading within a single application for parallelism.
Memory Usage
Typically consumes more memory.
Consumes less memory compared to processes.
What About Concurrency and Parallelism?
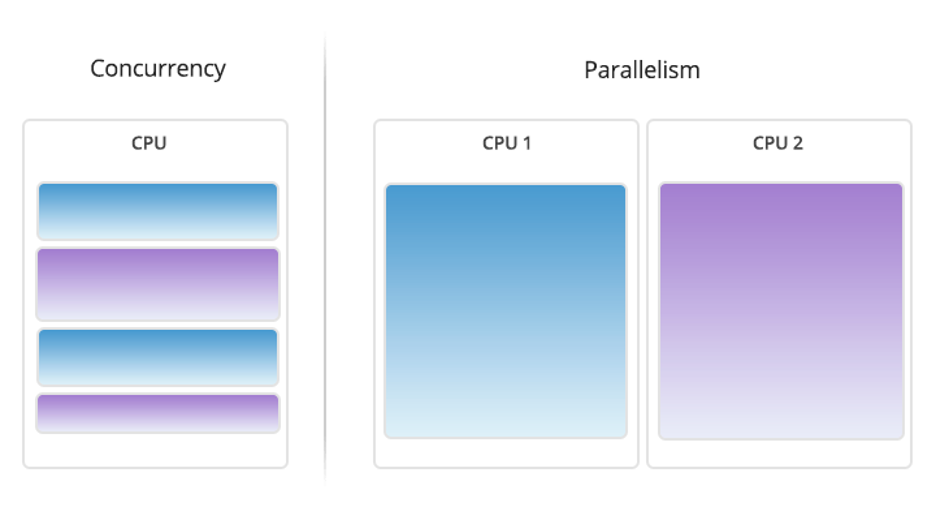
A question you might ask is whether processes or threads can run at the same time. The answer is: it depends. In environments with multiple processors or CPU cores, simultaneous execution of multiple processes or threads is feasible. However, on a single processor system, true simultaneous execution isn’t possible. In these cases, a process scheduling algorithm is employed to share the CPU among running processes or threads, creating the illusion of parallel execution. Each task is allocated a “time slice,” and the swift switching between tasks occurs seamlessly, typically imperceptible to users. The terms “parallelism” (denoting genuine simultaneous execution) and “concurrency” (indicating the interleaving of processes over time to simulate simultaneous execution) distinguish between the two modes of operation, whether truly simultaneous or approximated.
How Google Chrome Uses Processes and Threads
To illustrate the impact of processes and threads, let’s consider a real-world example with a program that many of us use, Google Chrome.
When Google designed the Chrome browser, they faced several important decisions. For instance, how should Chrome handle the fact that many different tasks often happen at the same time when using a browser? Every browser window (or tab) may communicate with several servers on the internet to download audio, video, text, and other resources. In addition, many users have 10 to 20 browser tabs (or more…) open most of the time, and each of these tabs may perform multiple tasks.
Google had to decide how to handle all of these tasks. They chose to run each browser window in Chrome as a separate process rather than a thread or many threads. That approach brought several benefits.
Running each window as a process protects the overall application from bugs and glitches.
Isolating a JavaScript program in a process prevents it from using too much CPU time and memory and making the entire browser unresponsive.
That said, there is a trade-off cost to Google’s design decision. Starting a new process for each browser window has a higher fixed cost in memory and resources compared to using threads. They were betting that their approach would end up with less memory bloat overall.
Using processes instead of threads provides better memory usage when memory is low. In practice, an inactive browser window is treated as a lower priority. That means the operating system may swap it to disk when memory is needed for other processes. If the windows were threaded, it would be more difficult to allocate memory efficiently which ultimately leads to lost computer performance.
The screen capture below shows the Google Chrome processes running on a MacBook Air with many tabs open. You can see that some Chrome processes are using a fair amount of CPU time and resources (e.g., the one at the top is using 44 threads) while others are using fewer.
Mac Activity Monitor displaying Google Chrome threads.
The Activity Monitor on the Mac (or Task Manager in Windows) on your system can be a valuable ally in fine-tuning your computer or troubleshooting problems. If your computer is running slowly or a program or browser window isn’t responding for a while, you can check its status using the system monitor.
In some cases, you’ll see a process marked as “Not Responding.” Try quitting that process and see if your system runs better. If an application is a memory hog, you might consider choosing a different application that will accomplish the same task.
Made It This Far?
We hope this Tron-like dive into the fascinating world of computer programs, processes, and threads has cleared up some questions.
At the start, we promised clarity on using these terms to improve performance. You can use Activity Monitor on the Mac or Task Manager on Windows to close applications and processes that are malfunctioning. That’s beneficial because it means you can end a malfunctioning program without the hassle of turning off your computer.
Still have questions? We’d love to hear from you in the comments.
FAQ
1. What are computer programs?
Computer programs are sets of coded instructions written in programming languages to direct computers in performing specific tasks or functions. Ranging from simple scripts to complex applications, computer programs enable users to interact with and leverage the capabilities of computing devices.
2. What are computer processes?
Computer processes are instances of executing computer programs. They represent the active state of a running application or task. Each process operates independently, with its own memory space and system resources, ensuring isolation from other processes. Processes are managed by the operating system, and they facilitate multitasking and parallel execution.
3. What are computer threads?
Computer threads are smaller units within computer processes, enabling parallel execution of tasks. Threads share the same memory space and resources within a process, allowing for more efficient communication and coordination. Unlike processes, threads operate in a cooperative manner, sharing data and context, making them suitable for tasks requiring simultaneous execution.
4. What’s the difference between computer processes and threads?
Computer processes are independent program instances with their own memory space and resources, operating in isolation. In contrast, threads are smaller units within processes that share the same memory, making communication easier but requiring careful synchronization. Processes are more independent, while threads enable concurrent execution and resource sharing within a process. The choice depends on the application’s requirements, balancing isolation with the benefits of parallelism and resource efficiency.
5. What’s the difference between concurrency and parallel processing?
Concurrency involves the execution of multiple tasks during overlapping time periods, enhancing system responsiveness. It doesn’t necessarily imply true simultaneous execution but rather the interleaving of processes to create an appearance of parallelism. Parallel processing, on the other hand, refers to the simultaneous execution of multiple tasks using multiple processors or cores, achieving genuine parallelism. Concurrency emphasizes efficient task management, while parallel processing focuses on concurrent tasks executing simultaneously for improved performance in tasks that can be divided into independent subtasks.
As described in an earlier blog post, Establishing a data perimeter on AWS, Amazon Web Services (AWS) offers a set of capabilities you can use to implement a data perimeter to help prevent unintended access. One type of unintended access that companies want to prevent is access to corporate data by users who do not belong to the company. A combination of AWS Identity and Access Management (AWS IAM) features and capabilities that can help you achieve this goal in AWS while fostering innovation and agility form the identity perimeter. In this blog post, I will provide an overview of some of the security risks the identity perimeter is designed to address, policy examples, and implementation guidance for establishing the perimeter.
The identity perimeter is a set of coarse-grained preventative controls that help achieve the following objectives:
Only trusted identities can access my resources
Only trusted identities are allowed from my network
Trusted identities encompass IAM principals that belong to your company, which is typically represented by an AWS Organizations organization. In AWS, an IAM principal is a person or application that can make a request for an action or operation on an AWS resource. There are also scenarios when AWS services perform actions on your behalf using identities that do not belong to your organization. You should consider both types of data access patterns when you create a definition of trusted identities that is specific to your company and your use of AWS services. All other identities are considered untrusted and should have no access except by explicit exception.
Security risks addressed by the identity perimeter
The identity perimeter helps address several security risks, including the following.
Unintended data disclosure due to misconfiguration. Some AWS services support resource-based IAM policies that you can use to grant principals (including principals outside of your organization) permissions to perform actions on the resources they are attached to. While this allows developers to configure resource-based policies based on their application requirements, you should ensure that access to untrusted identities is prohibited even if the developers grant broad access to your resources, such as Amazon Simple Storage Service (Amazon S3) buckets. Figure 1 illustrates examples of access patterns you would want to prevent—specifically, principals outside of your organization accessing your S3 bucket from a non-corporate AWS account, your on-premises network, or the internet.
Figure 1: Unintended access to your S3 bucket by identities outside of your organization
Unintended data disclosure through non-corporate credentials. Some AWS services, such as Amazon Elastic Compute Cloud (Amazon EC2) and AWS Lambda, let you run code using the IAM credentials of your choosing. Similar to on-premises environments where developers might have access to physical and virtual servers, there is a risk that the developers can bring personal IAM credentials to a corporate network and attempt to move company data to personal AWS resources. For example, Figure 2 illustrates unintended access patterns where identities outside of your AWS Organizations organization are used to transfer data from your on-premises networks or VPC to an S3 bucket in a non-corporate AWS account.
Figure 2: Unintended access from your networks by identities outside of your organization
Implementing the identity perimeter
Before you can implement the identity perimeter by using preventative controls, you need to have a way to evaluate whether a principal is trusted and do this evaluation effectively in a multi-account AWS environment. IAM policies allow you to control access based on whether the IAM principal belongs to a particular account or an organization, with the following IAM condition keys:
The aws:PrincipalOrgID condition key gives you a succinct way to refer to all IAM principals that belong to a particular organization. There are similar condition keys, such as aws:PrincipalOrgPaths and aws:PrincipalAccount, that allow you to define different granularities of trust.
The aws:PrincipalIsAWSService condition key gives you a way to refer to AWS service principals when those are used to access resources on your behalf. For example, when you create a flow log with an S3 bucket as the destination, VPC Flow Logs uses a service principal, delivery.logs.amazonaws.com, which does not belong to your organization, to publish logs to Amazon S3.
In the context of the identity perimeter, there are two types of IAM policies that can help you ensure that the call to an AWS resource is made by a trusted identity:
Using the IAM condition keys and the policy types just listed, you can now implement the identity perimeter. The following table illustrates the relationship between identity perimeter objectives and the AWS capabilities that you can use to achieve them.
Data perimeter
Control objective
Implemented by using
Primary IAM capability
Identity
Only trusted identities can access my resources.
Resource-based policies
aws:PrincipalOrgID aws:PrincipalIsAWSService
Only trusted identities are allowed from my network.
VPC endpoint policies
Let’s see how you can use these capabilities to mitigate the risk of unintended access to your data.
Only trusted identities can access my resources
Resource-based policies allow you to specify who has access to the resource and what actions they can perform. Resource-based policies also allow you to apply identity perimeter controls to mitigate the risk of unintended data disclosure due to misconfiguration. The following is an example of a resource-based policy for an S3 bucket that limits access to only trusted identities. Make sure to replace <DOC-EXAMPLE-MY-BUCKET> and <MY-ORG-ID> with your information.
The Deny statement in the preceding policy has two condition keys where both conditions must resolve to true to invoke the Deny effect. This means that this policy will deny any S3 action unless it is performed by an IAM principal within your organization (StringNotEqualsIfExists with aws:PrincipalOrgID) or a service principal (BoolIfExists with aws:PrincipalIsAWSService). Note that resource-based policies on AWS resources do not allow access outside of the account by default. Therefore, in order for another account or an AWS service to be able to access your resource directly, you need to explicitly grant access permissions with appropriate Allow statements added to the preceding policy.
Only trusted identities are allowed from my network
When you access AWS services from on-premises networks or VPCs, you can use public service endpoints or connect to supported AWS services by using VPC endpoints. VPC endpoints allow you to apply identity perimeter controls to mitigate the risk of unintended data disclosure through non-corporate credentials. The following is an example of a VPC endpoint policy that allows access to all actions but limits the access to trusted identities only. Replace <MY-ORG-ID> with your information.
As opposed to the resource-based policy example, the preceding policy uses Allow statements to enforce the identity perimeter. This is because VPC endpoint policies do not grant any permissions but define the maximum access allowed through the endpoint. Your developers will be using identity-based or resource-based policies to grant permissions required by their applications. We use two statements in this example policy to invoke the Allow effect in two scenarios: if an action is performed by an IAM principal that belongs to your organization (StringEquals with aws:PrincipalOrgID in the AllowRequestsByOrgsIdentities statement) or if an action is performed by a service principal (Bool with aws:PrincipalIsAWSService in the AllowRequestsByAWSServicePrincipals statement). We do not use IfExists in the end of the condition operators in this case, because we want the condition elements to evaluate to true only if the specified keys exist in the request.
There might be circumstances when you want to grant access to your resources to principals outside of your organization. For example, you might be hosting a dataset in an Amazon S3 bucket that is being accessed by your business partners from their own AWS accounts. In order to support this access pattern, you can use the aws:PrincipalAccount condition key to include third-party account identities as trusted identities in a policy. This is shown in the following resource-based policy example. Replace <DOC-EXAMPLE-MY-BUCKET>, <MY-ORG-ID>, <THIRD-PARTY-ACCOUNT-A>, and <THIRD-PARTY-ACCOUNT-B> with your information.
The preceding policy adds the aws:PrincipalAccount condition key to the StringNotEqualsIfExists operator. You now have a Deny statement with three condition keys where all three conditions must resolve to true to invoke the Deny effect. Therefore, this policy denies any S3 action unless it is performed by an IAM principal that belongs to your organization (StringNotEqualsIfExists with aws:PrincipalOrgID), by an IAM principal that belongs to specified third-party accounts (StringNotEqualsIfExists with aws:PrincipalAccount), or a service principal (BoolIfExists with aws:PrincipalIsAWSService).
There might also be circumstances when you want to grant access from your networks to identities external to your organization. For example, your applications could be uploading or downloading objects to or from a third-party S3 bucket by using third-party generated pre-signed Amazon S3 URLs. The principal that generates the pre-signed URL will belong to the third-party AWS account. Similar to the previously discussed S3 bucket policy, you can extend your identity perimeter to include identities that belong to trusted third-party accounts by using the aws:PrincipalAccount condition key in your VPC endpoint policy.
Additionally, some AWS services make unauthenticated requests to AWS owned resources through your VPC endpoint. An example of such a pattern is Kernel Live Patching on Amazon Linux 2, which allows you to apply security vulnerability and critical bug patches to a running Linux kernel. Amazon EC2 makes an unauthenticated call to Amazon S3 to download packages from Amazon Linux repositories hosted on Amazon EC2 service-owned S3 buckets. To include this access pattern into your identity perimeter definition, you can choose to allow unauthenticated API calls to AWS owned resources in the VPC endpoint policies.
The following example VPC endpoint policy demonstrates how to extend your identity perimeter to include access to Amazon Linux repositories and to Amazon S3 buckets owned by a third-party. Replace <MY-ORG-ID>, <REGION>, <ACTION>, <THIRD-PARTY-ACCOUNT-A>, and <THIRD-PARTY-BUCKET-ARN> with your information.
The preceding example adds two new statements to the VPC endpoint policy. The AllowUnauthenticatedRequestsToAWSResources statement allows the s3:GetObject action on buckets that host Amazon Linux repositories. The AllowRequestsByThirdPartyIdentitiesToThirdPartyResources statement allows actions on resources owned by a third-party entity by principals that belong to the third-party account (StringEquals with aws:PrincipalAccount).
Note that identity perimeter controls do not eliminate the need for additional network protections, such as making sure that your private EC2 instances or databases are not inadvertently exposed to the internet due to overly permissive security groups.
Apart from preventative controls established by the identity perimeter, we also recommend that you configure AWS Identity and Access Management Access Analyzer. IAM Access Analyzer helps you identify unintended access to your resources and data by monitoring policies applied to supported resources. You can review IAM Access Analyzer findings to identify resources that are shared with principals that do not belong to your AWS Organizations organization. You should also consider enabling Amazon GuardDuty to detect misconfigurations or anomalous access to your resources that could lead to unintended disclosure of your data. GuardDuty uses threat intelligence, machine learning, and anomaly detection to analyze data from various sources in your AWS accounts. You can review GuardDuty findings to identify unexpected or potentially malicious activity in your AWS environment, such as an IAM principal with no previous history invoking an S3 API.
IAM policy samples
This AWS git repository contains policy examples that illustrate how to implement identity perimeter controls for a variety of AWS services and actions. The policy samples do not represent a complete list of valid data access patterns and are for reference purposes only. They are intended for you to tailor and extend to suit the needs of your environment. Make sure that you thoroughly test the provided example policies before you implement them in your production environment.
Deploying the identity perimeter at scale
As discussed earlier, you implement the identity perimeter as coarse-grained preventative controls. These controls typically need to be implemented for each VPC by using VPC endpoint policies and on all resources that support resource-based policies. The effectiveness of these controls relies on their ability to scale with the environment and to adapt to its dynamic nature.
The methodology you use to deploy identity perimeter controls will depend on the deployment mechanisms you use to create and manage AWS accounts. For example, you might choose to use AWS Control Tower and the Customizations for AWS Control Tower solution (CfCT) to govern your AWS environment at scale. You can use CfCT or your custom CI/CD pipeline to deploy VPC endpoints and VPC endpoint policies that include your identity perimeter controls.
Because developers will be creating resources such as S3 buckets and AWS KMS keys on a regular basis, you might need to implement automation to enforce identity perimeter controls when those resources are created or their policies are changed. One option is to use custom AWS Config rules. Alternatively, you can choose to enforce resource deployment through AWS Service Catalog or a CI/CD pipeline. With the AWS Service Catalog approach, you can have identity perimeter controls built into the centrally controlled products that are made available to developers to deploy within their accounts. With the CI/CD pipeline approach, the pipeline can have built-in compliance checks that enforce identity perimeter controls during the deployment. If you are deploying resources with your CI/CD pipeline by using AWS CloudFormation, see the blog post Proactively keep resources secure and compliant with AWS CloudFormation Hooks.
Regardless of the deployment tools you select, identity perimeter controls, along with other baseline security controls applicable to your multi-account environment, should be included in your account provisioning process. You should also audit your identity perimeter configurations periodically and upon changes in your organization, which could lead to modifications in your identity perimeter controls (for example, disabling a third-party integration). Keeping your identity perimeter controls up to date will help ensure that they are consistently enforced and help prevent unintended access during the entire account lifecycle.
Conclusion
In this blog post, you learned about the foundational elements that are needed to define and implement the identity perimeter, including sample policies that you can use to start defining guardrails that are applicable to your environment and control objectives.
Following are additional resources that will help you further explore the identity perimeter topic, including a whitepaper and a hands-on-workshop.
If you have any questions, comments, or concerns, contact AWS Support or browse AWS re:Post. If you have feedback about this post, submit comments in the Comments section below.
Want more AWS Security news? Follow us on Twitter.
Nothing beats a dog’s nose for detecting explosives. Unfortunately, there aren’t enough dogs:
Last month, the US Government Accountability Office (GAO) released a nearly 100-page report about working dogs and the need for federal agencies to better safeguard their health and wellness. The GOA says that as of February the US federal government had approximately 5,100 working dogs, including detection dogs, across three federal agencies. Another 420 dogs “served the federal government in 24 contractor-managed programs within eight departments and two independent agencies,” the GAO report says.
The report also underscores the demands placed on detection dogs and the potential for overwork if there aren’t enough dogs available. “Working dogs might need the strength to suddenly run fast, or to leap over a tall barrier, as well as the physical stamina to stand or walk all day,” the report says. “They might need to search over rubble or in difficult environmental conditions, such as extreme heat or cold, often wearing heavy body armor. They also might spend the day detecting specific scents among thousands of others, requiring intense mental concentration. Each function requires dogs to undergo specialized training.”
A decade and a half ago I was optimistic about bomb-sniffing bees and wasps, but nothing seems to have come of that.
The Amazon Web Services (AWS) Cloud is a constantly expanding network of Regions and points of presence (PoP), with a global network infrastructure linking them together. The choice of Regions for your workload significantly affects your workload KPIs, including performance, cost, and carbon footprint.
The Well-Architected Framework’s sustainability pillar offers design principles and best practices that you can use to meet sustainability goals for your AWS workloads. It recommends choosing Regions for your workload based on both your business requirements and sustainability goals. In this blog, we explain how to select an appropriate AWS Region for your workload. This process includes two key steps:
Assess and shortlist potential Regions for your workload based on your business requirements.
Choose Regions near Amazon renewable energy projects and Region(s) where the grid has a lower published carbon intensity.
To demonstrate this two-step process, let’s assume we have a web application that must be deployed in the AWS Cloud to support end users in the UK and Sweden. Also, let’s assume there is no local regulation that binds the data residency to a specific location. Let’s select a Region for this workload based on guidance in the sustainability pillar of AWS Well-Architected Framework.
Shortlist potential Regions for your workload
Let’s follow the best practice on Region selection in the sustainability pillar of AWS Well-Architected Framework. The first step is to assess and shortlist potential Regions for your workload based on your business requirements.
Test the network latency between your end user locations and each AWS Region.
At this point, you should have a list of AWS Regions. For this sample workload, let’s assume only Europe (London) and Europe (Stockholm) Regions are shortlisted. They can address the requirements for latency, cost, and features for our use case.
Choose Regions for your workload
After shortlisting the potential Regions, the next step is to choose Regions for your workload. Choose Regions near Amazon renewable energy projects or Regions where the grid has a lower published carbon intensity. To understand this step, you need to first understand the Greenhouse Gas (GHG) Protocol to track emissions.
Based on the GHG Protocol, there are two methods to track emissions from electricity production: market-based and location-based. Companies may choose one of these methods based on their relevant sustainability guidelines to track and compare their year-to-year emissions. Amazon uses the market-based model to report our emissions.
AWS Region(s) selection based on market-based method
With the market-based method, emissions are calculated based on the electricity that businesses have chosen to purchase. For example, the business could decide to contract and purchase electricity produced by renewable energy sources like solar and wind.
Amazon’s goal is to power our operations with 100% renewable energy by 2025 – five years ahead of our original 2030 target. We contract for renewable power from utility-scale wind and solar projects that add clean energy to the grid. These new renewable projects support hundreds of jobs and hundreds of millions of dollars investment in local communities. Find more details about our work around the globe. We support these grids through the purchase of environmental attributes, like Renewable Energy Certificates (RECs) and Guarantees of Origin (GoO), in line with our renewable energy methodology. As a result, we have a number of Regions listed that are powered by more than 95% renewable energy on the Amazon sustainability website.
Choose one of these Regions to help you power your workload with more renewable energy and reduce your carbon footprint. For the sample workload we’re using as our example, both the Europe (London) and Europe (Stockholm) Regions are in this list. They are powered by over 95% renewable energy based on the market-based emission method.
AWS Regions selection based on location-based carbon method
The location-based method considers the average emissions intensity of the energy grids where consumption takes place. As a result, wherever the organization conducts business, it assesses emissions from the local electricity system. You can use the emissions intensity of the energy grids through a trusted data source to assess Regions for your workload.
Let’s look how we can use Electricity Maps data to select a Region for our sample workload:
2. Search for South Central Sweden zone to get carbon intensity of electricity consumed for Europe (Stockholm) Region (display aggregated data on yearly basis)
Figure 1. Carbon intensity of electricity for South Central Sweden
3. Search for Great Britain to get carbon intensity of electricity consumed for Europe (London) Region (display aggregated data on yearly basis)
Figure 2. Carbon intensity of electricity for Great Britain
As you can determine from Figure 2, the Europe (Stockholm) Region has a lower carbon intensity of electricity consumed compared to the Europe (London) Region.
For our sample workload, we have selected the Europe (Stockholm) Region due to latency, cost, features, and compliance. It also provides 95% renewable energy using the market-based method, and low grid carbon intensity with the location-based method.
Conclusion
In this blog, we explained the process for selecting an appropriate AWS Region for your workload based on both business requirements and sustainability goals.
For more architecture content, refer to AWS Architecture Center for reference architecture diagrams, vetted architecture solutions, Well-Architected best practices, patterns, icons, and more.
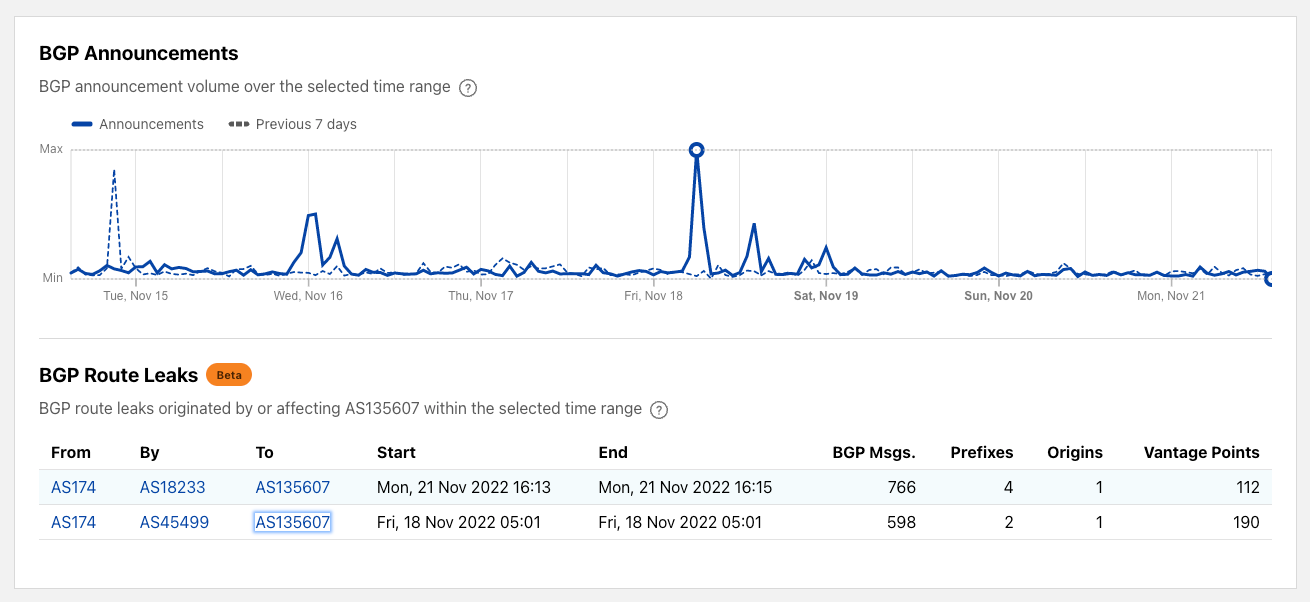
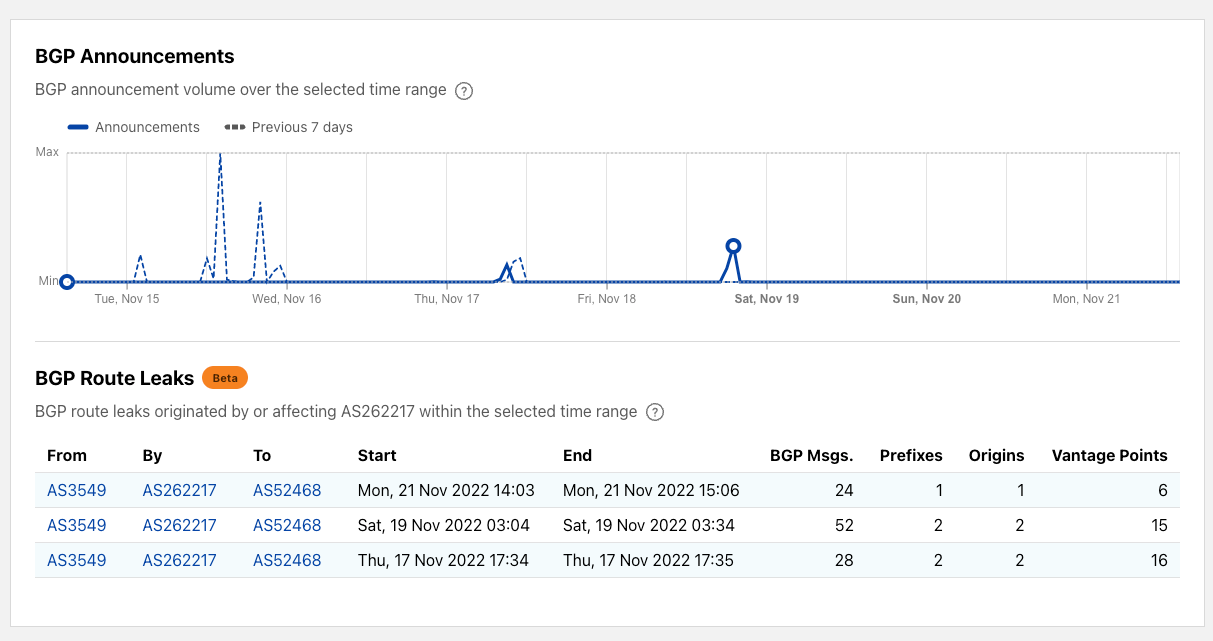
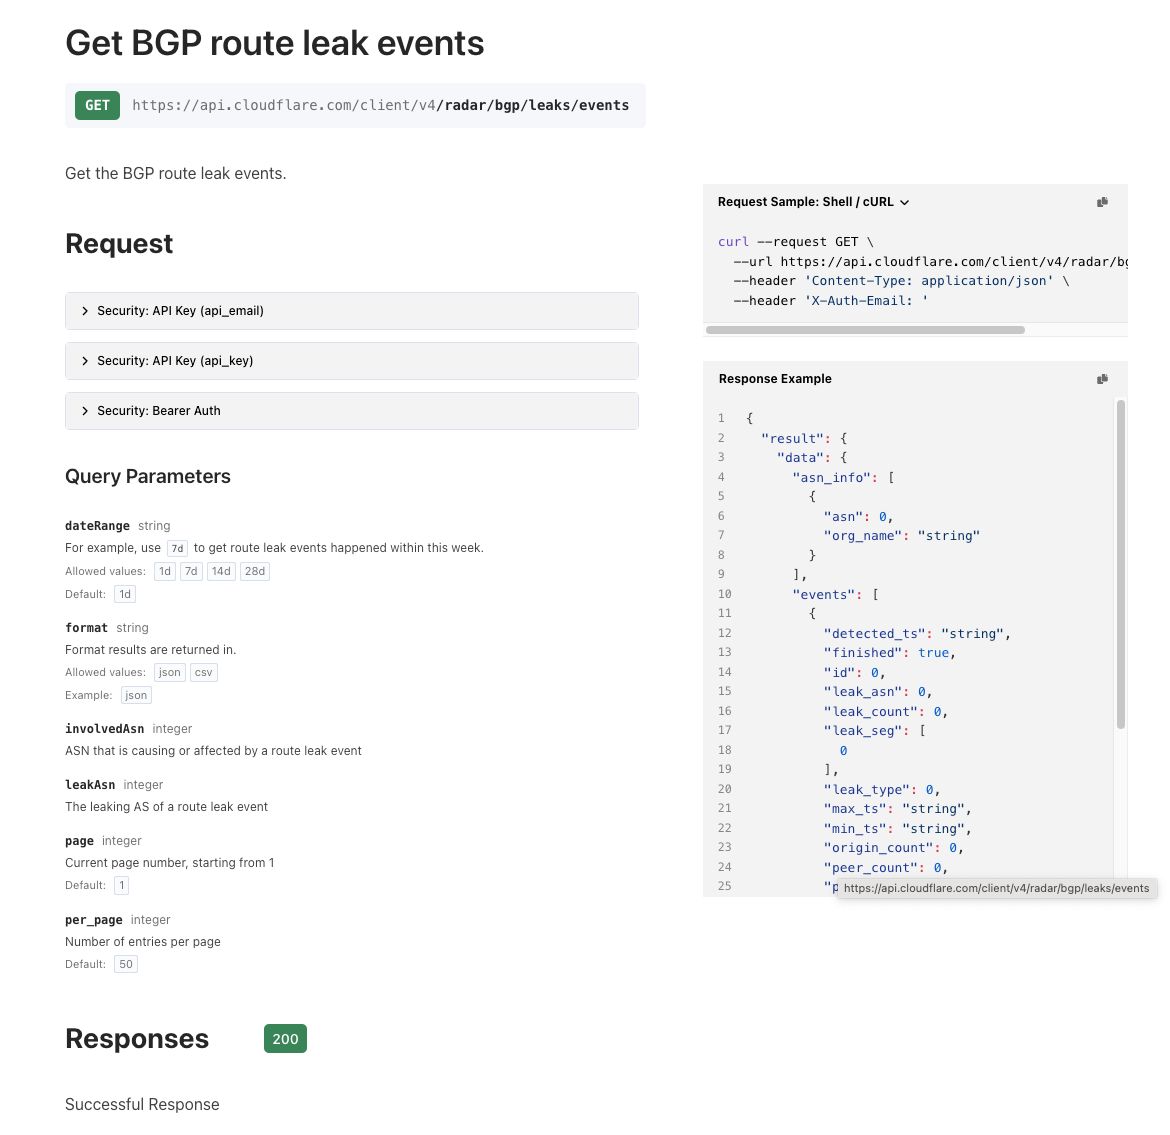
Today we’re introducing Cloudflare Radar’s route leak data and API so that anyone can get information about route leaks across the Internet. We’ve built a comprehensive system that takes in data from public sources and Cloudflare’s view of the Internet drawn from our massive global network. The system is now feeding route leak data on Cloudflare Radar’s ASN pages and via the API.
This blog post is in two parts. There’s a discussion of BGP and route leaks followed by details of our route leak detection system and how it feeds Cloudflare Radar.
About BGP and route leaks
Inter-domain routing, i.e., exchanging reachability information among networks, is critical to the wellness and performance of the Internet. The Border Gateway Protocol (BGP) is the de facto routing protocol that exchanges routing information among organizations and networks. At its core, BGP assumes the information being exchanged is genuine and trust-worthy, which unfortunately is no longer a valid assumption on the current Internet. In many cases, networks can make mistakes or intentionally lie about the reachability information and propagate that to the rest of the Internet. Such incidents can cause significant disruptions of the normal operations of the Internet. One type of such disruptive incident is route leaks.
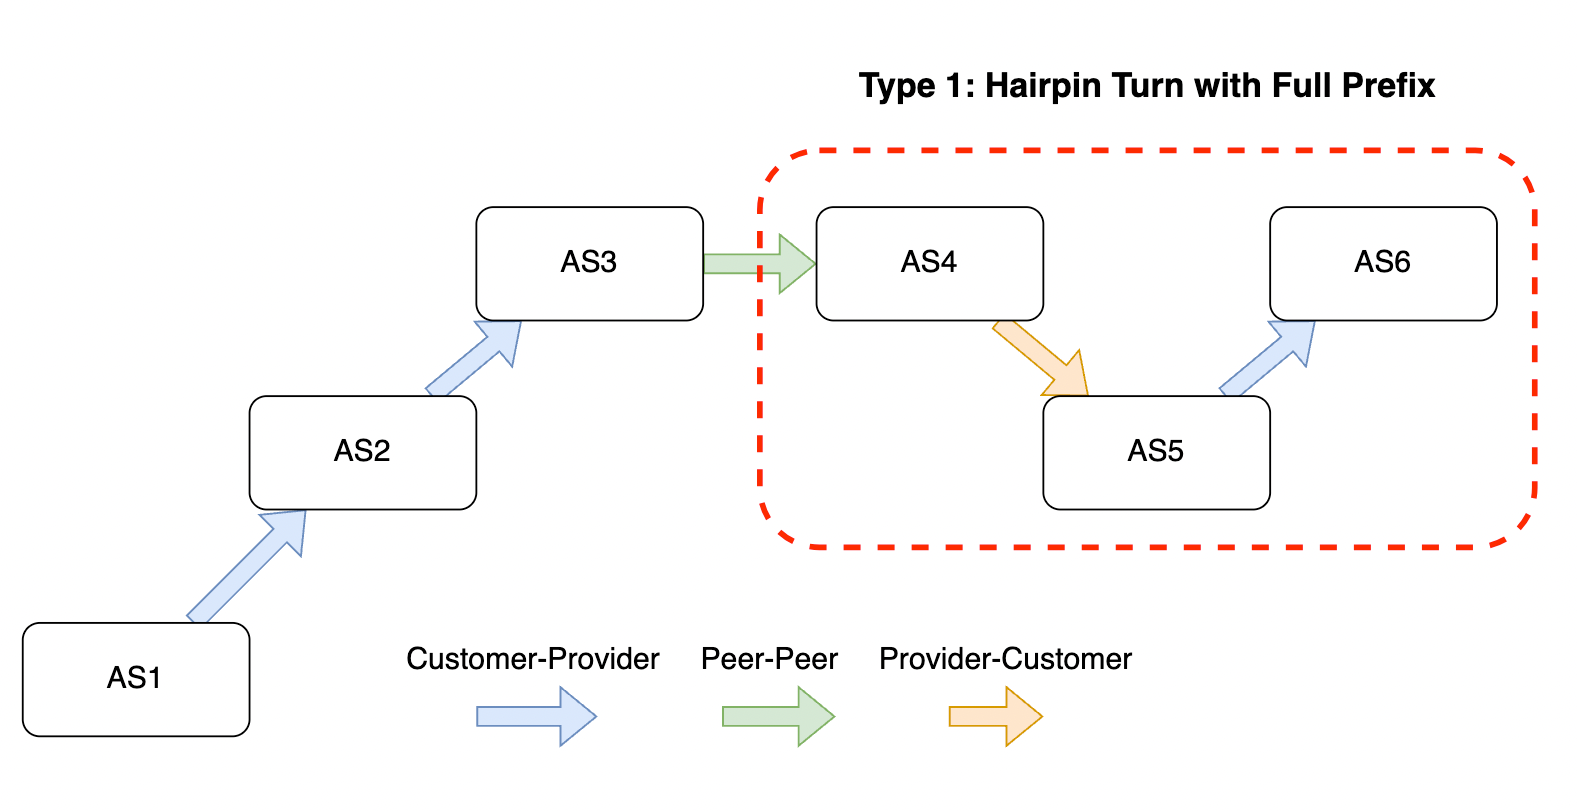
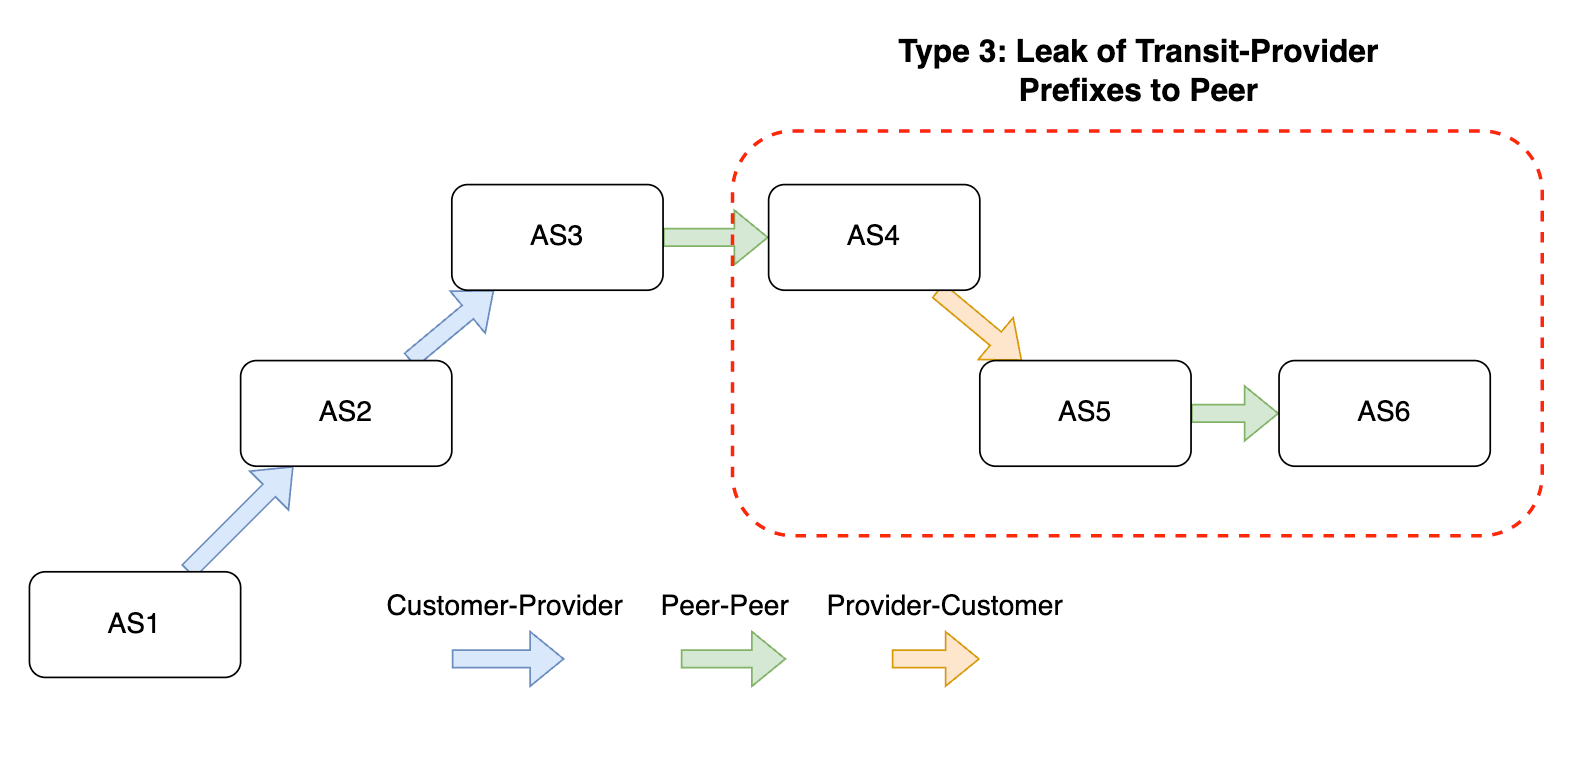
We consider route leaks as the propagation of routing announcements beyond their intended scope (RFC7908). Route leaks can cause significant disruption affecting millions of Internet users, as we have seen in many past notable incidents. For example, in June 2016 a misconfiguration in a small network in Pennsylvania, US (AS396531 – Allegheny Technologies Inc) accidentally leaked a Cloudflare prefix to Verizon, which proceeded to propagate the misconfigured route to the rest of its peers and customers. As a result, the traffic of a large portion of the Internet was squeezed through the limited-capacity links of a small network. The resulting congestion caused most of Cloudflare traffic to and from the affected IP range to be dropped.
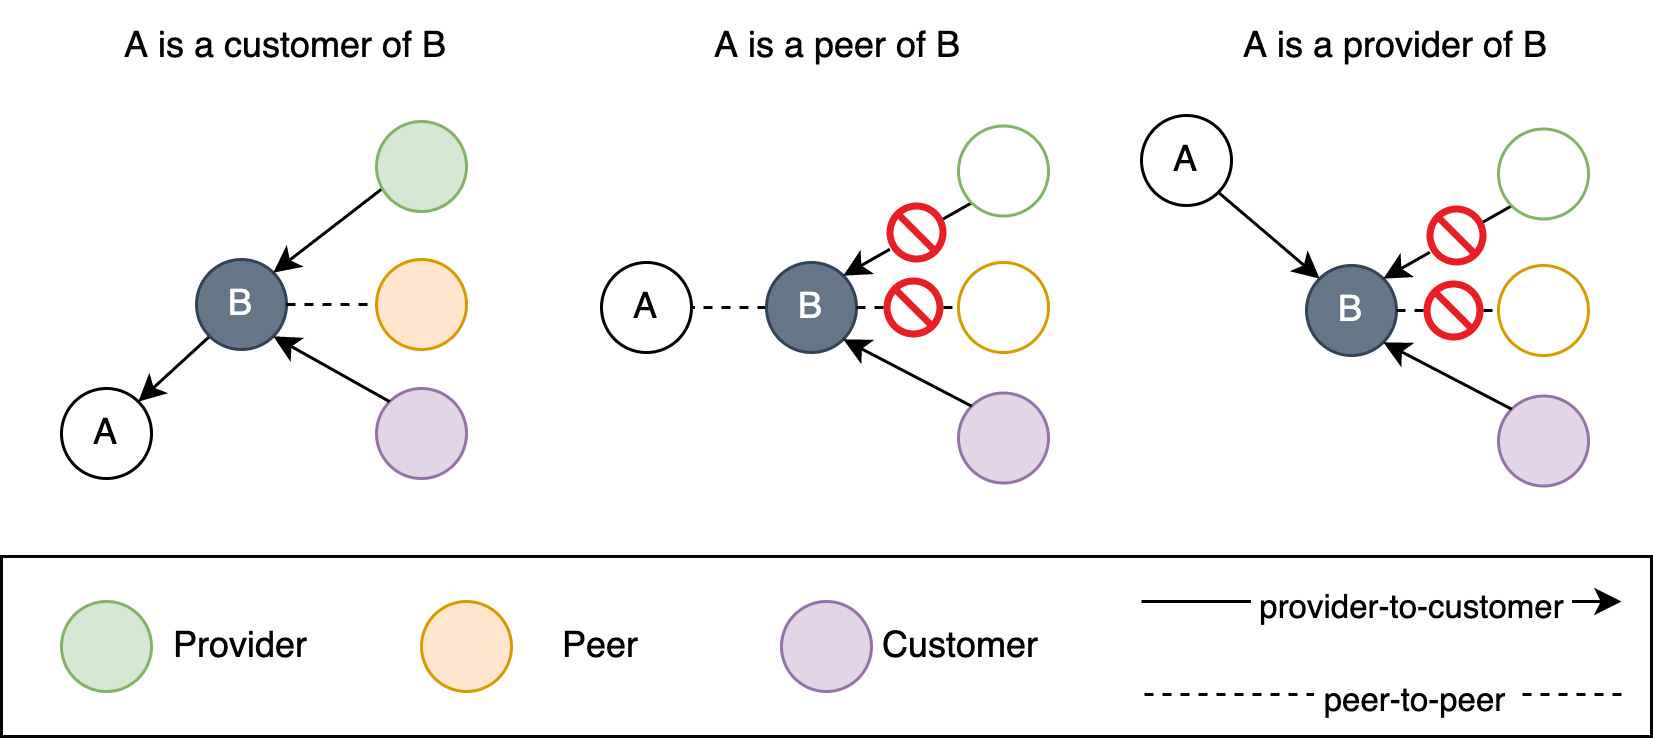
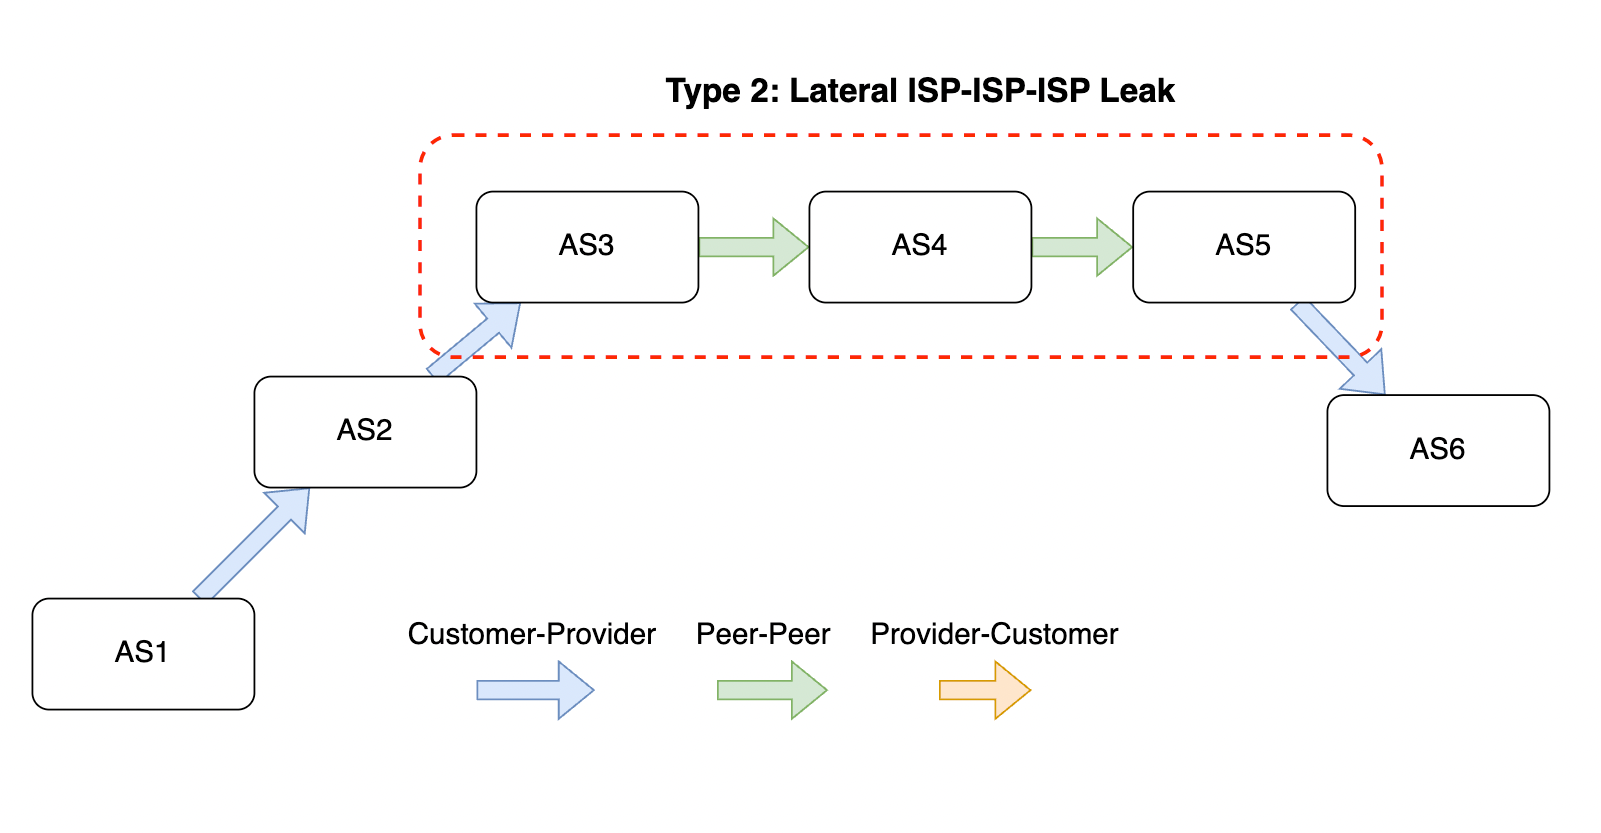
A similar incident in November 2018 caused widespread unavailability of Google services when a Nigerian ISP (AS37282 – Mainone) accidentally leaked a large number of Google IP prefixes to its peers and providers violating the valley-free principle.
These incidents illustrate not only that route leaks can be very impactful, but also the snowball effects that misconfigurations in small regional networks can have on the global Internet.
Despite the criticality of detecting and rectifying route leaks promptly, they are often detected only when users start reporting the noticeable effects of the leaks. The challenge with detecting and preventing route leaks stems from the fact that AS business relationships and BGP routing policies are generally undisclosed, and the affected network is often remote to the root of the route leak.
In the past few years, solutions have been proposed to prevent the propagation of leaked routes. Such proposals include RFC9234 and ASPA, which extends the BGP to annotate sessions with the relationship type between the two connected AS networks to enable the detention and prevention of route leaks.
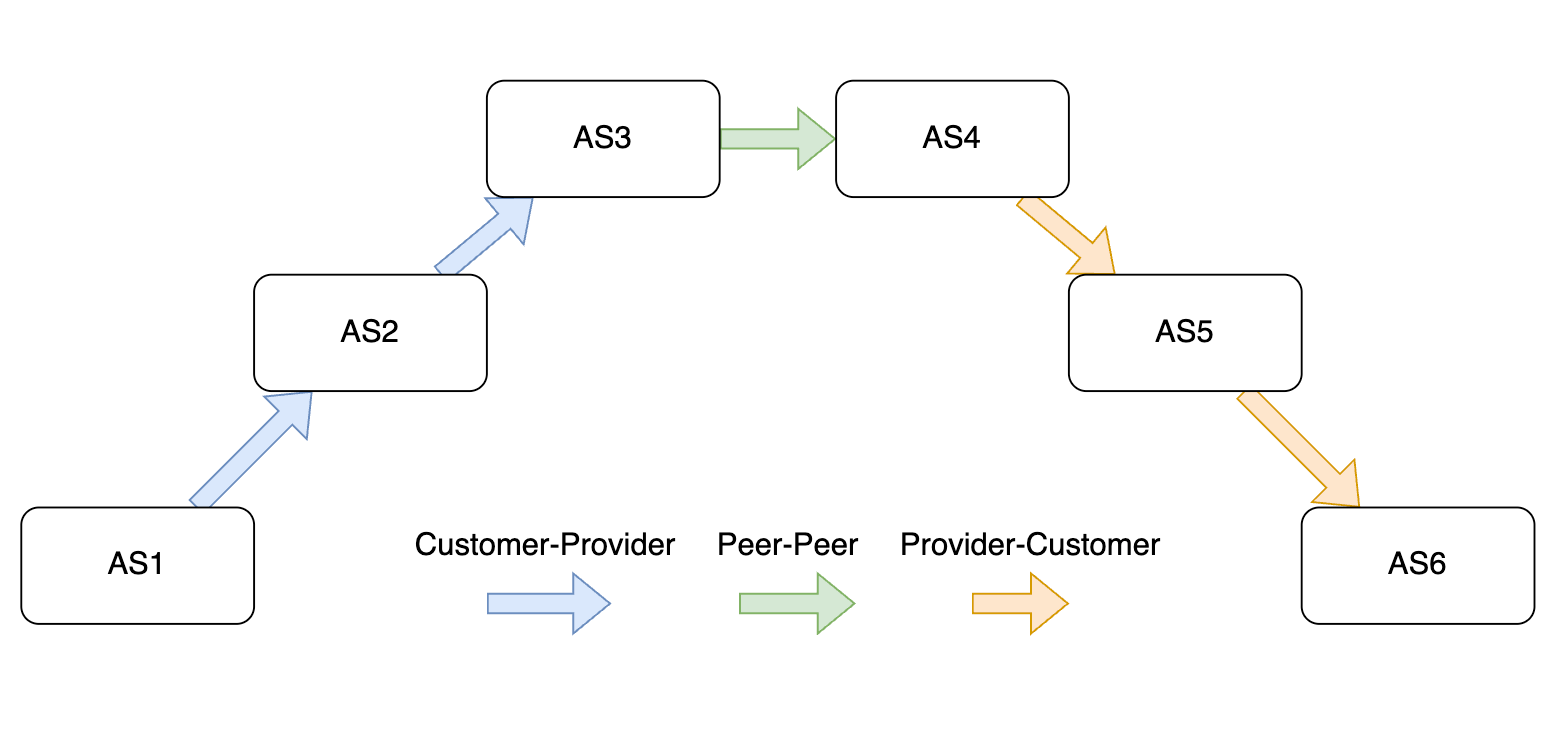
An alternative proposal to implement similar signaling of BGP roles is through the use of BGP Communities; a transitive attribute used to encode metadata in BGP announcements. While these directions are promising in the long term, they are still in very preliminary stages and are not expected to be adopted at scale soon.
At Cloudflare, we have developed a system to detect route leak events automatically and send notifications to multiple channels for visibility. As we continue our efforts to bring more relevant data to the public, we are happy to announce that we are starting an open data API for our route leak detection results today and integrate results to Cloudflare Radar pages.
Route leak definition and types
Before we jump into how we design our systems, we will first do a quick primer on what a route leak is, and why it is important to detect it.
> A route leak is the propagation of routing announcement(s) beyond their intended scope.
The intended scope is often concretely defined as inter-domain routing policies based on business relationships between Autonomous Systems (ASes). These business relationships are broadly classified into four categories: customers, transit providers, peers and siblings, although more complex arrangements are possible.
In a customer-provider relationship the customer AS has an agreement with another network to transit its traffic to the global routing table. In a peer-to-peer relationship two ASes agree to free bilateral traffic exchange, but only between their own IPs and the IPs of their customers. Finally, ASes that belong under the same administrative entity are considered siblings, and their traffic exchange is often unrestricted. The image below illustrates how the three main relationship types translate to export policies.
By categorizing the types of AS-level relationships and their implications on the propagation of BGP routes, we can define multiple phases of a prefix origination announcements during propagation:
upward: all path segments during this phase are customer to provider
peering: one peer-peer path segment
downward: all path segments during this phase are provider to customer
An AS path that follows valley-free routing principle will have upward, peering, downward phases, all optional but have to be in that order. Here is an example of an AS path that conforms with valley-free routing.
> A multihomed AS learns a route from one upstream ISP and simply propagates it to another upstream ISP (the turn essentially resembling a hairpin). Neither the prefix nor the AS path in the update is altered.
An AS path that contains a provider-customer and customer-provider segment is considered a type 1 leak. The following example: AS4 → AS5 → AS6 forms a type 1 leak.
Type 1 is the most recognized type of route leaks and is very impactful. In many cases, a customer route is preferable to a peer or a provider route. In this example, AS6 will likely prefer sending traffic via AS5 instead of its other peer or provider routes, causing AS5 to unintentionally become a transit provider. This can significantly affect the performance of the traffic related to the leaked prefix or cause outages if the leaking AS is not provisioned to handle a large influx of traffic.
In June 2015, Telekom Malaysia (AS4788), a regional ISP, leaked over 170,000 routes learned from its providers and peers to its other provider Level3 (AS3549, now Lumin). Level3 accepted the routes and further propagated them to its downstream networks, which in turn caused significant network issues globally.
Type 2: Lateral ISP-ISP-ISP Leak
Type 2 leak is defined as propagating routes obtained from one peer to another peer, creating two or more consecutive peer-to-peer path segments.
Here is an example: AS3 → AS4 → AS5 forms a type 2 leak.
However, in the real world, it is not unusual to see multiple small peering networks exchanging routes and passing on to each other. Legit business reasons exist for having this type of network path. We are less concerned about this type of route leak as compared to type 1.
Type 3 and 4: Provider routes to peer; peer routes to provider
These two types involve propagating routes from a provider or a peer not to a customer, but to another peer or provider. Here are the illustrations of the two types of leaks:
As in the previously mentioned example, a Nigerian ISP who peers with Google accidentally leaked its route to its provider AS4809, and thus generated a type 4 route leak. Because routes via customers are usually preferred to others, the large provider (AS4809) rerouted its traffic to Google via its customer, i.e. the leaking ASN, overwhelmed the small ISP and took down Google for over one hour.
Route leak summary
So far, we have looked at the four types of route leaks defined in RFC7908. The common thread of the four types of route leaks is that they’re all defined using AS-relationships, i.e., peers, customers, and providers. We summarize the types of leaks by categorizing the AS path propagation based on where the routes are learned from and propagate to. The results are shown in the following table.
Routes from / propagates to
To provider
To peer
To customer
From provider
Type 1
Type 3
Normal
From peer
Type 4
Type 2
Normal
From customer
Normal
Normal
Normal
We can summarize the whole table into one single rule: routes obtained from a non-customer AS can only be propagated to customers.
Note: Type 5 and type 6 route leaks are defined as prefix re-origination and announcing of private prefixes. Type 5 is more closely related to prefix hijackings, which we plan to expand our system to as the next steps, while type 6 leaks are outside the scope of this work. Interested readers can refer to sections 3.5 and 3.6 of RFC7908 for more information.
The Cloudflare Radar route leak system
Now that we know what a route leak is, let’s talk about how we designed our route leak detection system.
From a very high level, we compartmentalize our system into three different components:
Raw data collection module: responsible for gathering BGP data from multiple sources and providing BGP message stream to downstream consumers.
Leak detection module: responsible for determining whether a given AS-level path is a route leak, estimate the confidence level of the assessment, aggregating and providing all external evidence needed for further analysis of the event.
Storage and notification module: responsible for providing access to detected route leak events and sending out notifications to relevant parties. This could also include building a dashboard for easy access and search of the historical events and providing the user interface for high-level analysis of the event.
Data collection module
There are three types of data input we take into consideration:
Historical: BGP archive files for some time range in the past
a. RouteViews and RIPE RIS BGP archives
Semi-real-time: BGP archive files as soon as they become available, with a 10-30 minute delay.
a. RouteViews and RIPE RIS archives with data broker that checks new files periodically (e.g. BGPKIT Broker)
Real-time: true real-time data sources
a. RIPE RIS Live
b. Cloudflare internal BGP sources
For the current version, we use the semi-real-time data source for the detection system, i.e., the BGP updates files from RouteViews and RIPE RIS. For data completeness, we process data from all public collectors from these two projects (a total of 63 collectors and over 2,400 collector peers) and implement a pipeline that’s capable of handling the BGP data processing as the data files become available.
For data files indexing and processing, we deployed an on-premises BGPKIT Broker instance with Kafka feature enabled for message passing, and a custom concurrent MRT data processing pipeline based on BGPKIT Parser Rust SDK. The data collection module processes MRT files and converts results into a BGP messages stream at over two billion BGP messages per day (roughly 30,000 messages per second).
Route leak detection
The route leak detection module works at the level of individual BGP announcements. The detection component investigates one BGP message at a time, and estimates how likely a given BGP message is a result of a route leak event.
We base our detection algorithm mainly on the valley-free model, which we believe can capture most of the notable route leak incidents. As mentioned previously, the key to having low false positives for detecting route leaks with the valley-free model is to have accurate AS-level relationships. While those relationship types are not publicized by every AS, there have been over two decades of research on the inference of the relationship types using publicly observed BGP data.
While state-of-the-art relationship inference algorithms have been shown to be highly accurate, even a small margin of errors can still incur inaccuracies in the detection of route leaks. To alleviate such artifacts, we synthesize multiple data sources for inferring AS-level relationships, including CAIDA/UCSD’s AS relationship data and our in-house built AS relationship dataset. Building on top of the two AS-level relationships, we create a much more granular dataset at the per-prefix and per-peer levels. The improved dataset allows us to answer the question like what is the relationship between AS1 and AS2 with respect to prefix P observed by collector peer X. This eliminates much of the ambiguity for cases where networks have multiple different relationships based on prefixes and geo-locations, and thus helps us reduce the number of false positives in the system. Besides the AS-relationships datasets, we also apply the AS Hegemony dataset from IHR IIJ to further reduce false positives.
Route leak storage and presentation
After processing each BGP message, we store the generated route leak entries in a database for long-term storage and exploration. We also aggregate individual route leak BGP announcements and group relevant leaks from the same leak ASN within a short period together into route-leak events. The route leak events will then be available for consumption by different downstream applications like web UIs, an API, or alerts.
Route leaks on Cloudflare Radar
At Cloudflare, we aim to help build a better Internet, and that includes sharing our efforts on monitoring and securing Internet routing. Today, we are releasing our route leak detection system as public beta.
Starting today, users going to the Cloudflare Radar ASN pages will now find the list of route leaks that affect that AS. We consider that an AS is being affected when the leaker AS is one hop away from it in any direction, before or after.
The Cloudflare Radar ASN page is directly accessible via https://radar.cloudflare.com/as{ASN}. For example, one can navigate to https://radar.cloudflare.com/as174 to view the overview page for Cogent AS174. ASN pages now show a dedicated card for route leaks detected relevant to the current ASN within the selected time range.
There is a lot more we are planning to do with route-leak detection. More features like a global view page, route leak notifications, more advanced APIs, custom automations scripts, and historical archive datasets will begin to ship on Cloudflare Radar over time. Your feedback and suggestions are also very important for us to continue improving on our detection results and serve better data to the public.
Furthermore, we will continue to expand our work on other important topics of Internet routing security, including global BGP hijack detection (not limited to our customer networks), RPKI validation monitoring, open-sourcing tools and architecture designs, and centralized routing security web gateway. Our goal is to provide the best data and tools for routing security to the communities so that we can build a better and more secure Internet together.
In the meantime, we opened a Radar room on our Developers Discord Server. Feel free to join and talk to us; the team is eager to receive feedback and answer questions.
Visit Cloudflare Radar for more Internet insights. You can also follow us on Twitter for more Radar updates.
Security updates have been issued by Debian (heimdal, libarchive, and nginx), Fedora (varnish-modules and xterm), Red Hat (firefox), Scientific Linux (firefox, hsqldb, and thunderbird), SUSE (Botan, colord, containerized-data-importer, ffmpeg-4, java-1_8_0-ibm, krb5, nginx, redis, strongswan, tomcat, and xtrabackup), and Ubuntu (apr-util, freerdp2, and sysstat).
At Cloudflare, we have strived to build a workplace where our entire team feels safe and excited to bring their whole selves to work, so they can do their best work. That’s why we are proud to share that Cloudflare has been named one of the Top 100 Most Loved Workplaces in 2022by Newsweek and Best Practice Institute (BPI). Most Loved Workplaces recognizes companies where their workers love, and feel in sync with, the company they work for.
With this, and as we’re approaching the end-of 2022, we thought this was a good time to reflect on some of the things that go into being one of these Most Loved Workplaces and just some of what makes up our workplace and culture.
Something that really grounds our entire team is Cloudflare’s mission: to help build a better Internet. When you are solving some of the toughest challenges facing the Internet — helping make the Internet secure, fast, private, and reliable globally — you need a range of talented individuals to do this. The people at Cloudflare are exactly that, and are essential to our impact on the Internet.
The Internet wasn’t built for what it’s being used for today. In order for the Internet to work the way it does today, from powering critical infrastructure, to making it so that a busy working parent can order a healthy dinner right to their home, requires constant innovation on our part to make sure these online services can withstand the demand online, load quick, and not face cyber attacks and breaches. Cloudflare has a significantly large responsibility online, with about 20% of the web running through our network today — and every single team member here is contributing to this.
In addition to the results from Newsweek and BPI, Cloudflare additionally conducted an internal survey of its global team. This presented results of 94% of surveyed employees stating that they are inspired by Cloudflare’s mission to help build a better Internet. At Cloudflare, 92% of employees say their manager treats them with respect and 92% state that their work is important to the company.
“I’ve worked for so many Fortune 500, top companies in tech, and never have I felt more valued and grown so much than at Cloudflare. I love going to work, love working with my manager and team, we learn so much from each other and are motivated to smash sales goals and grow our presence in the world. ”
“…I love this company, management, and most of all my team. I am proud to be building a better Internet, and will continue to do so for years to come.”
“Honestly it is the best I’ve ever worked; it is a lot of work, and sometimes it can be stressful, but I’m sure I can count on my manager for support, and they take their time to explain again and again without making me feel bad for asking.”
“Having had the privilege to work at Cloudflare for the past five years, I can genuinely attest that our people are clearly our biggest asset. I personally feel empowered, respected, and yet intellectually challenged daily. It is impressive for any single company to assemble such a diverse and thoughtful group of co-workers. And it all starts with our leadership.”
Benefiting and having community
Cloudflare offers a comprehensive total rewards and benefits package, and invests in supporting team members through a variety of initiatives and programs.
Examples of benefits range — from our commuter benefits program, for employees working in an office or a hybrid role, we help support the transportation costs associated with commuting — to health and family benefits programs including fertility, caregiving, childcare, and family forming/planning, as well as emotional and mental health benefits — and, we encourage everyone to find a comfortable work-life balance by offering a take-what-you-need vacation policy.
One example of programs is Cloudflare’s Employee Resource Groups (ERGs), employee-led and company-supported groups of underrepresented and/or marginalized employees. These groups are focused on key Corporate Social Responsibility initiatives with leaders, executives, and members for each group, who join together in the workplace based on shared characteristics, life experiences, or interests. ERGs are generally based on creating a community of support and belonging, enhancing career development of their members, and contributing to the development of a more inclusive culture at Cloudflare. Today we have 16 ERGs at Cloudflare ranging from Proudflare, Womenflare, and Afroflare to Cloudflarents and Mindflare (you get the theme!).
Flexibility to work in your best environment
What’s been at the center of how we’ve approached supporting our team these past couple years is flexibility and experimentation. Cloudflare’s workplace shifted from completely in-office since the company’s launch and leading up to March 2020, to then an entirely new remote environment that we hadn’t had before. This has been a big experiment for us, and it’s an honor to be recognized among the top workplaces uplifting its people. We recognize that every team’s needs are different and that most of us want some level of flexibility in how and where we work. At Cloudflare, we support a variety of work environments that give teams the opportunity to establish their own optimal working arrangements. Whether that be hybrid, remote, or in-office that fit with their objectives and enable collaboration — each employee has flexibility.
Growing team
Cloudflare has grown its global team by 93% over the past two years and has overall prioritized the recruitment, retention, as well as success of employees. To give a sense of this, in 2021 we received more than 200,000 competitive applications, extending 1,455 offers — while seeing a 92% acceptance rate across the board, and alongside continuously low attrition rates.
Now approaching the end-of 2022, we have over 3,100 team members globally. As our co-founder, President & COO Michelle Zatlyn says, “Companies are collections of people. One of the best parts of my job is the people I get to work with.” And we are continuing to hire worldwide with hundreds of open positions across the organization ranging from Sales to Engineering. To learn more about the Cloudflare career opportunities, please check out Cloudflare Careers! And an enormous high-five to the entire Cloudflare team for your continuous effort and hand in helping build a better Internet.
„Имам нужда от муниции, не от превоз.“ Тези думи се приписват на Володимир Зеленски като реакция на предложение САЩ да съдействат за евакуацията му непосредствено след нахлуването на Русия в Украйна. Независимо дали е имало такова предложение и дали украинският президент действително е изрекъл тези думи, те се превръщат в символ на смелостта му и безкомпромисната му позиция по отношение на войната.
Украинските бежанци в България пък имат нужда от работа, не от хотел. И от доста време го казват, но остават нечути. Вместо това продължават да пребивават в една и съща несигурност, превърнала се почти в безвремие. Настаняването им в хотелски бази трябваше да е временна мярка. Девет месеца след началото на войната обаче тези от тях, които не са успели да се спасят поединично, в повечето случаи – напускайки България, продължават да живеят по хотели. Те са все така изпълнени с несигурност заради плановете на държавата да ги разселва в държавни бази. И все така протестират срещу неизвестността и липсата на информация.
За толкова време ситуацията на украинските бежанци не се подобри, а се влоши.
Новопристигналите биват настанявани във фургони в центъра за задържане (или както се казва официално – „принудително настаняване“) на чужденци в Елхово, който прилича на затвор и в който няма елементарни условия, да не говорим за медицинска помощ. И макар това да е временна мярка преди разпределянето им в държавни бази, то прилича на проява на излишна репресия. Вярно е, че мнозина бягащи от Сирия, Афганистан или Ирак не разполагат и с тези мизерни условия, а някои от тях са пребивани и ограбвани на границата. Или продължават да се възприемат като проблем дори когато незнайно как са починали. Тези ужасяващи факти обаче не превръщат отношението на институциите у нас към украинците в хуманно.
Последното издевателство над бягащите от руската агресия е спирането на парите за изхранването им. Промяната е извършена с наглед невинната формулировка в държавната програма за хуманитарното им подпомагане, че за настаняването им се полагат по 15 лв. на денонощие. Храната просто е „изпусната“. При наличие на протести и остри публични реакции държавата може би ще се „сети“ да я добави. Междувременно украинските бежанци ще оцеляват благодарение на дарения и доброволци, а държавата ще се държи, сякаш така е редно. Както беше по времето на сирийската бежанска вълна.
А защо не работят?
Според държавата настаняването на украинците в хотелски бази е луксозна мярка, за която те трябва да са благодарни. Доброто решение и за тях, и за България обаче е друго. То се нарича интеграция. Това означава бежанците да имат възможност да работят и да живеят в нормални жилища, да учат български език, а децата им да ходят на училище без риск да бъдат преместени неизвестно къде като чували с картофи. И средствата, които получава страната ни за тях, да се отделят за тази цел, вместо де факто да служат за поддържане на почивни бази извън активния сезон.
Ако може да се говори за предпочитан вид бежанци (преглъщайки цинизма да имаме предпочитания, когато става дума за бягащи от война), то украинците са от най-предпочитания вид. Не само защото са славяни и християни (повечето от които православни), и в огромната си част – жени с деца. По данни към месец май т.г. близо 70% от тях са с висше образование, една трета – със средно и само 3% – с основно. На фона на липсата на квалифицирана работна ръка, особено в здравеопазването и образованието, няма процедура за признаване на украинските дипломи въпреки препоръките на Европейската комисия. Медицинската сестра Светлана Дениченко е само една от многото, които не могат да работят по специалността си поради тази причина.
Кой каза „интеграция“?
Липсата на интеграция, с която се сблъскват бягащите от Украйна, си има история и контекст. По времето на социализма миграцията от и към България е по-скоро изключение. След падането на тоталитарния режим страната е основно източник на емиграция, а не приемник на имигранти и бежанци. Три десетилетия по-късно държавата продължава да функционира с предпоставката, че чужденците на територията ѝ са по-скоро изключение. В първите години след приемането в ЕС поне имаше някаква публична имитация на интеграционни мерки. Не за друго, а защото се даваха европейски пари за целта. Това се промени по времето на управлението на ГЕРБ с националистически партии.
„На практика в България няма действаща интеграционна програма от декември 2013 г., а приетата през 2017 г. наредба [за интеграцията, б.р.] е трудна за приложение, тъй като възлага отговорности и правомощия на общините без финансово обезпечаване“, се казва в експертен коментар на Центъра за правна помощ „Глас в България“ по повод приемането през 2021 г. на новата Национална стратегия по миграция на Република България 2021–2025. От заглавието на тази стратегия са изпаднали убежището и интеграцията, присъстващи в предишните ѝ варианти. И това не е случайно – на интеграцията се гледа като на нещо излишно.
От 50-те страници на стратегическия документ на интеграцията се полага… по-малко от една. Не глава, а страница. Половината от текста, посветен на нея, препраща към същия механизъм, който от „Глас в България“ определят като трудно приложим. В другата половина се твърди, че България си има много хубаво и европейско антидискриминационно законодателство. Един вид, правата на чужденците са гарантирани, няма нужда от специално уреждане на интеграцията им. (Друг въпрос е, че в Стратегията се говори само за бежанци със статут на убежище или международна закрила, но не и с временна закрила, с каквато са повечето бягащи от Украйна.)
Ако интеграцията е „излишна“, то е, защото самата миграция е „лоша“.
Така излиза според Стратегията, в която, макар с половин уста да се признава, че миграцията си има и някои добри страни, се твърди, че тя „обичайно се асоциира с наличието на конфликти и в действителност тя може да бъде породена от тях, но и да е техен източник“. Това е, което остава, ако се абстрахираме от всичко в този документ, написано само защото ще се прочете и от международни институции, чието законодателство България е ратифицирала.
Ето защо, колкото и да са квалифицирани украинските бежанци и колкото и да са културно близки до българите по език и религия, държавата ще продължава да ги третира като чуждо тяло, защото друго не може. А не може, защото систематично не иска. И докато Калина Константинова поне поемаше лична отговорност за издънките в отношението към тях, поредното им разиграване се случва безлично, чрез пропуснати думи във формулировка.
Междувременно губещи са не само бягащите от Украйна, озовали се в България, а и страната ни, която отказва да използва техния потенциал.
„Имам нужда от муниции, не от превоз.“ Тези думи се приписват на Володимир Зеленски като реакция на предложение САЩ да съдействат за евакуацията му непосредствено след нахлуването на Русия в Украйна. Независимо дали е имало такова предложение и дали украинският президент действително е изрекъл тези думи, те се превръщат в символ на смелостта му и безкомпромисната му позиция по отношение на войната.
Украинските бежанци в България пък имат нужда от работа, не от хотел. И от доста време го казват, но остават нечути. Вместо това продължават да пребивават в една и съща несигурност, превърнала се почти в безвремие. Настаняването им в хотелски бази трябваше да е временна мярка. Девет месеца след началото на войната обаче тези от тях, които не са успели да се спасят поединично, в повечето случаи – напускайки България, продължават да живеят по хотели. Те са все така изпълнени с несигурност заради плановете на държавата да ги разселва в държавни бази. И все така протестират срещу неизвестността и липсата на информация.
За толкова време ситуацията на украинските бежанци не се подобри, а се влоши.
Новопристигналите биват настанявани във фургони в центъра за задържане (или както се казва официално – „принудително настаняване“) на чужденци в Елхово, който прилича на затвор и в който няма елементарни условия, да не говорим за медицинска помощ. И макар това да е временна мярка преди разпределянето им в държавни бази, то прилича на проява на излишна репресия. Вярно е, че мнозина бягащи от Сирия, Афганистан или Ирак не разполагат и с тези мизерни условия, а някои от тях са пребивани и ограбвани на границата. Или продължават да се възприемат като проблем дори когато незнайно как са починали. Тези ужасяващи факти обаче не превръщат отношението на институциите у нас към украинците в хуманно.
Последното издевателство над бягащите от руската агресия е спирането на парите за изхранването им. Промяната е извършена с наглед невинната формулировка в държавната програма за хуманитарното им подпомагане, че за настаняването им се полагат по 15 лв. на денонощие. Храната просто е „изпусната“. При наличие на протести и остри публични реакции държавата може би ще се „сети“ да я добави. Междувременно украинските бежанци ще оцеляват благодарение на дарения и доброволци, а държавата ще се държи, сякаш така е редно. Както беше по времето на сирийската бежанска вълна.
А защо не работят?
Според държавата настаняването на украинците в хотелски бази е луксозна мярка, за която те трябва да са благодарни. Доброто решение и за тях, и за България обаче е друго. То се нарича интеграция. Това означава бежанците да имат възможност да работят и да живеят в нормални жилища, да учат български език, а децата им да ходят на училище без риск да бъдат преместени неизвестно къде като чували с картофи. И средствата, които получава страната ни за тях, да се отделят за тази цел, вместо де факто да служат за поддържане на почивни бази извън активния сезон.
Ако може да се говори за предпочитан вид бежанци (преглъщайки цинизма да имаме предпочитания, когато става дума за бягащи от война), то украинците са от най-предпочитания вид. Не само защото са славяни и християни (повечето от които православни), и в огромната си част – жени с деца. По данни към месец май т.г. близо 70% от тях са с висше образование, една трета – със средно и само 3% – с основно. На фона на липсата на квалифицирана работна ръка, особено в здравеопазването и образованието, няма процедура за признаване на украинските дипломи въпреки препоръките на Европейската комисия. Медицинската сестра Светлана Дениченко е само една от многото, които не могат да работят по специалността си поради тази причина.
Кой каза „интеграция“?
Липсата на интеграция, с която се сблъскват бягащите от Украйна, си има история и контекст. По времето на социализма миграцията от и към България е по-скоро изключение. След падането на тоталитарния режим страната е основно източник на емиграция, а не приемник на имигранти и бежанци. Три десетилетия по-късно държавата продължава да функционира с предпоставката, че чужденците на територията ѝ са по-скоро изключение. В първите години след приемането в ЕС поне имаше някаква публична имитация на интеграционни мерки. Не за друго, а защото се даваха европейски пари за целта. Това се промени по времето на управлението на ГЕРБ с националистически партии.
„На практика в България няма действаща интеграционна програма от декември 2013 г., а приетата през 2017 г. наредба [за интеграцията, б.р.] е трудна за приложение, тъй като възлага отговорности и правомощия на общините без финансово обезпечаване“, се казва в експертен коментар на Центъра за правна помощ „Глас в България“ по повод приемането през 2021 г. на новата Национална стратегия по миграция на Република България 2021–2025. От заглавието на тази стратегия са изпаднали убежището и интеграцията, присъстващи в предишните ѝ варианти. И това не е случайно – на интеграцията се гледа като на нещо излишно.
От 50-те страници на стратегическия документ на интеграцията се полага… по-малко от една. Не глава, а страница. Половината от текста, посветен на нея, препраща към същия механизъм, който от „Глас в България“ определят като трудно приложим. В другата половина се твърди, че България си има много хубаво и европейско антидискриминационно законодателство. Един вид, правата на чужденците са гарантирани, няма нужда от специално уреждане на интеграцията им. (Друг въпрос е, че в Стратегията се говори само за бежанци със статут на убежище или международна закрила, но не и с временна закрила, с каквато са повечето бягащи от Украйна.)
Ако интеграцията е „излишна“, то е, защото самата миграция е „лоша“.
Така излиза според Стратегията, в която, макар с половин уста да се признава, че миграцията си има и някои добри страни, се твърди, че тя „обичайно се асоциира с наличието на конфликти и в действителност тя може да бъде породена от тях, но и да е техен източник“. Това е, което остава, ако се абстрахираме от всичко в този документ, написано само защото ще се прочете и от международни институции, чието законодателство България е ратифицирала.
Ето защо, колкото и да са квалифицирани украинските бежанци и колкото и да са културно близки до българите по език и религия, държавата ще продължава да ги третира като чуждо тяло, защото друго не може. А не може, защото систематично не иска. И докато Калина Константинова поне поемаше лична отговорност за издънките в отношението към тях, поредното им разиграване се случва безлично, чрез пропуснати думи във формулировка.
Междувременно губещи са не само бягащите от Украйна, озовали се в България, а и страната ни, която отказва да използва техния потенциал.
The collective thoughts of the interwebz
Manage Consent
To provide the best experiences, we use technologies like cookies to store and/or access device information. Consenting to these technologies will allow us to process data such as browsing behavior or unique IDs on this site. Not consenting or withdrawing consent, may adversely affect certain features and functions.
Functional
Always active
The technical storage or access is strictly necessary for the legitimate purpose of enabling the use of a specific service explicitly requested by the subscriber or user, or for the sole purpose of carrying out the transmission of a communication over an electronic communications network.
Preferences
The technical storage or access is necessary for the legitimate purpose of storing preferences that are not requested by the subscriber or user.
Statistics
The technical storage or access that is used exclusively for statistical purposes.The technical storage or access that is used exclusively for anonymous statistical purposes. Without a subpoena, voluntary compliance on the part of your Internet Service Provider, or additional records from a third party, information stored or retrieved for this purpose alone cannot usually be used to identify you.
Marketing
The technical storage or access is required to create user profiles to send advertising, or to track the user on a website or across several websites for similar marketing purposes.
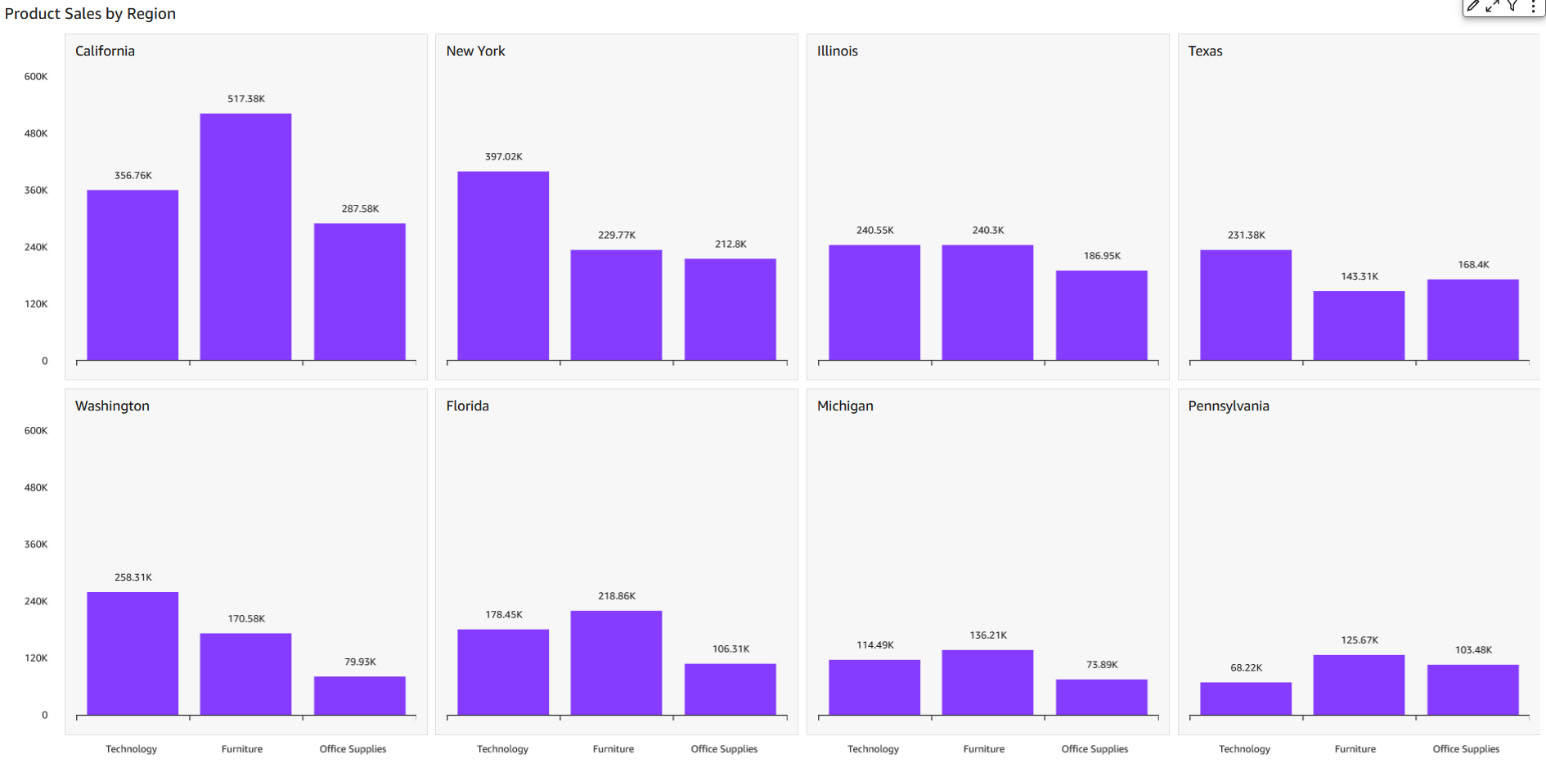


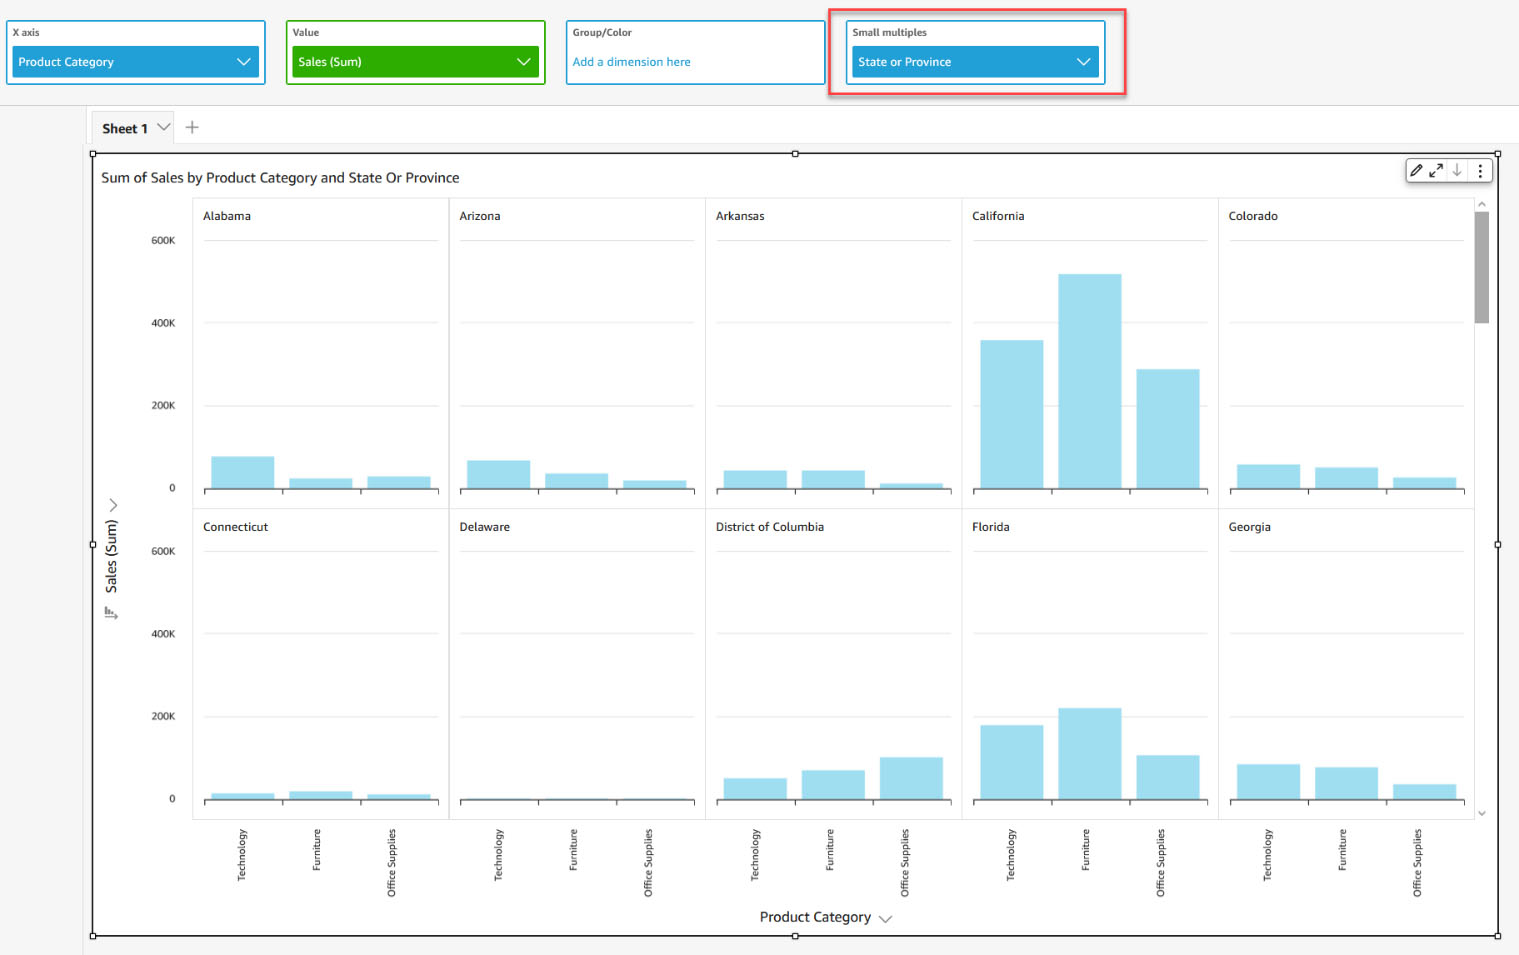


 Bhupinder Chadha is a senior product manager for Amazon QuickSight focused on visualization and front end experiences. He is passionate about BI, data visualization and low-code/no-code experiences. Prior to QuickSight he was the lead product manager for Inforiver, responsible for building a enterprise BI product from ground up. Bhupinder started his career in presales, followed by a small gig in consulting and then PM for xViz, an add on visualization product.


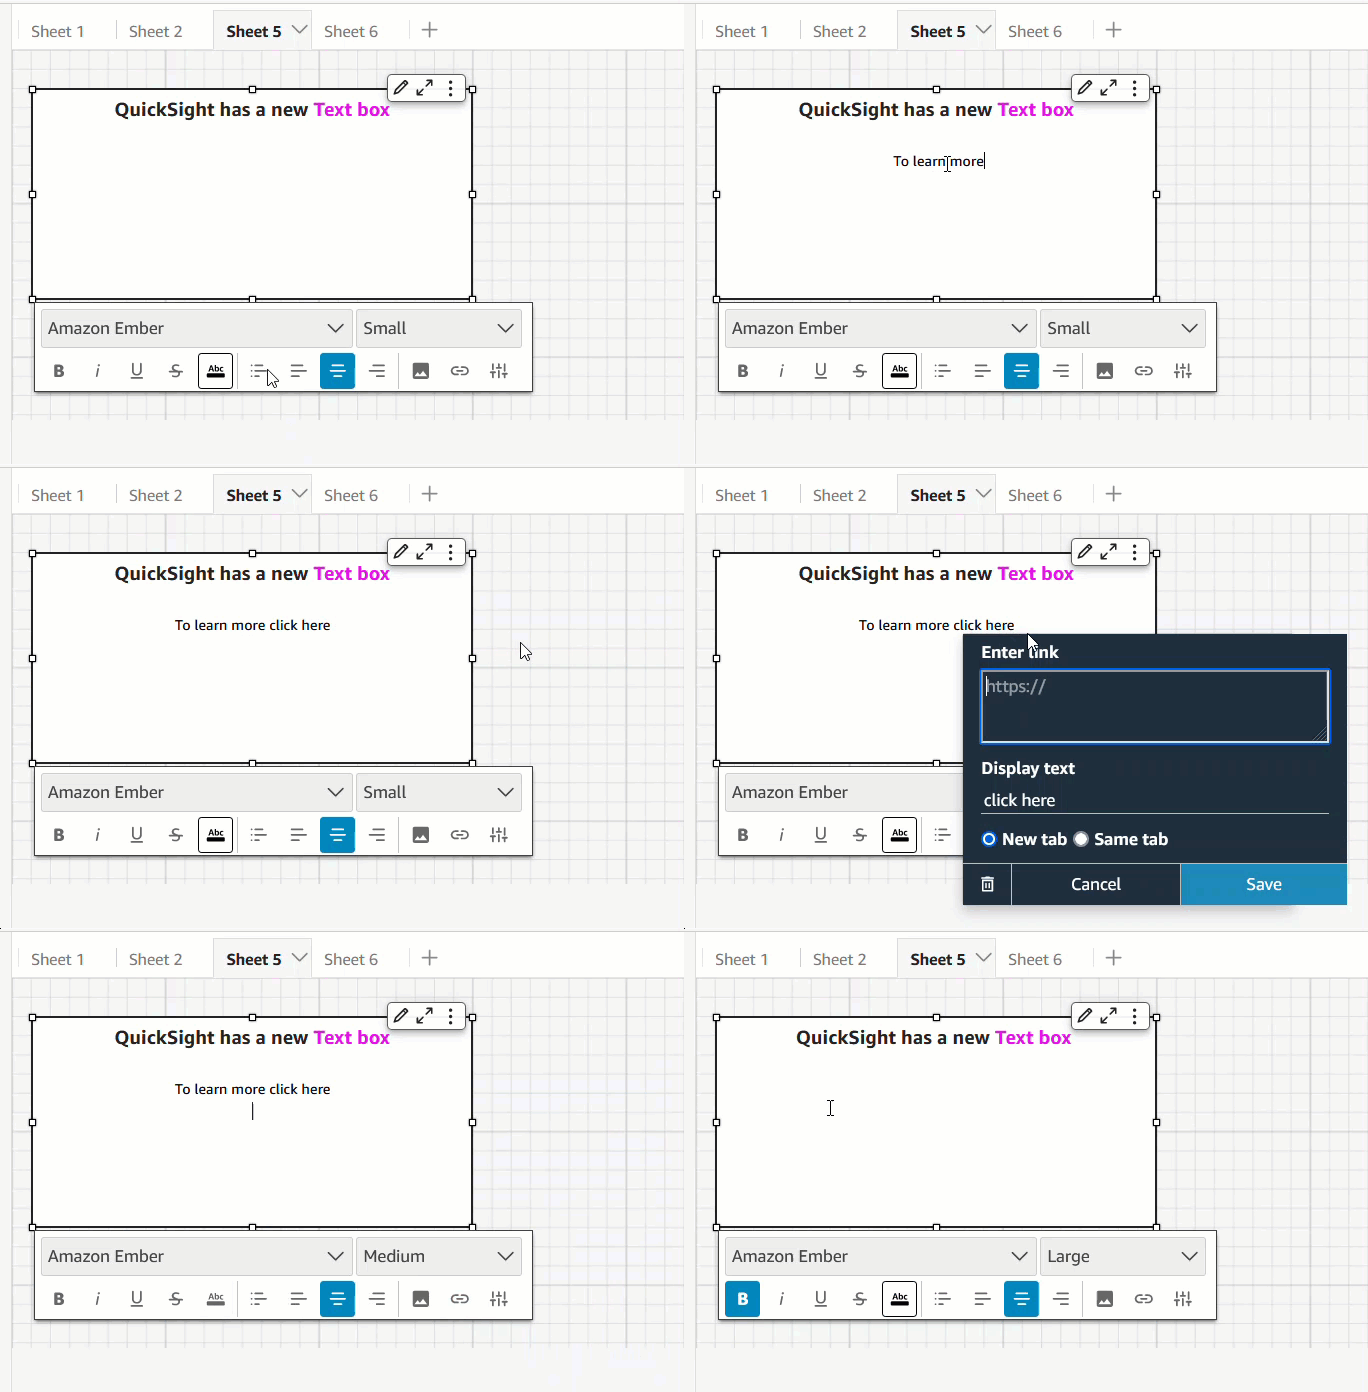


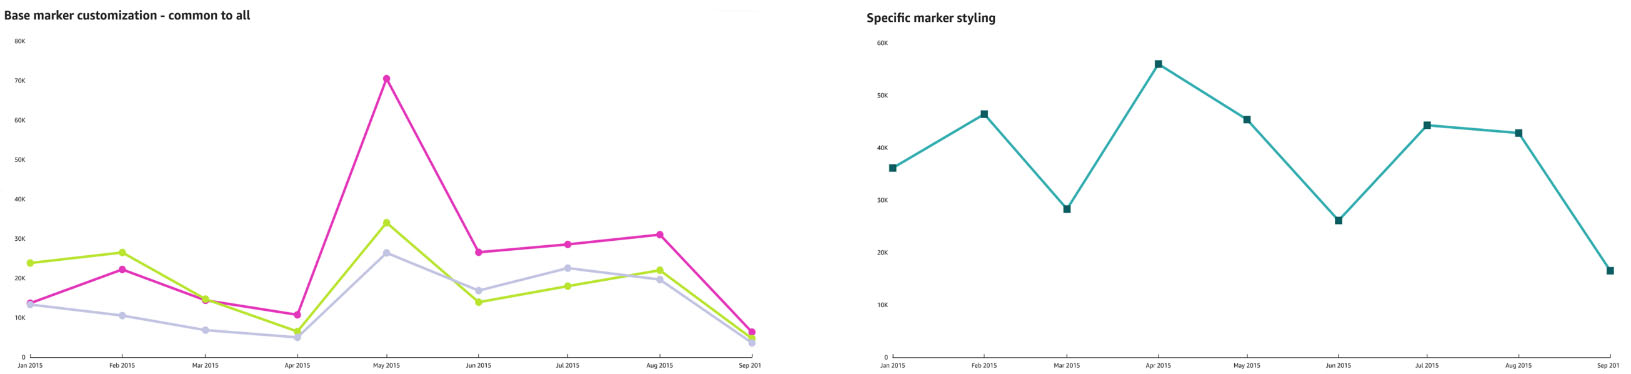


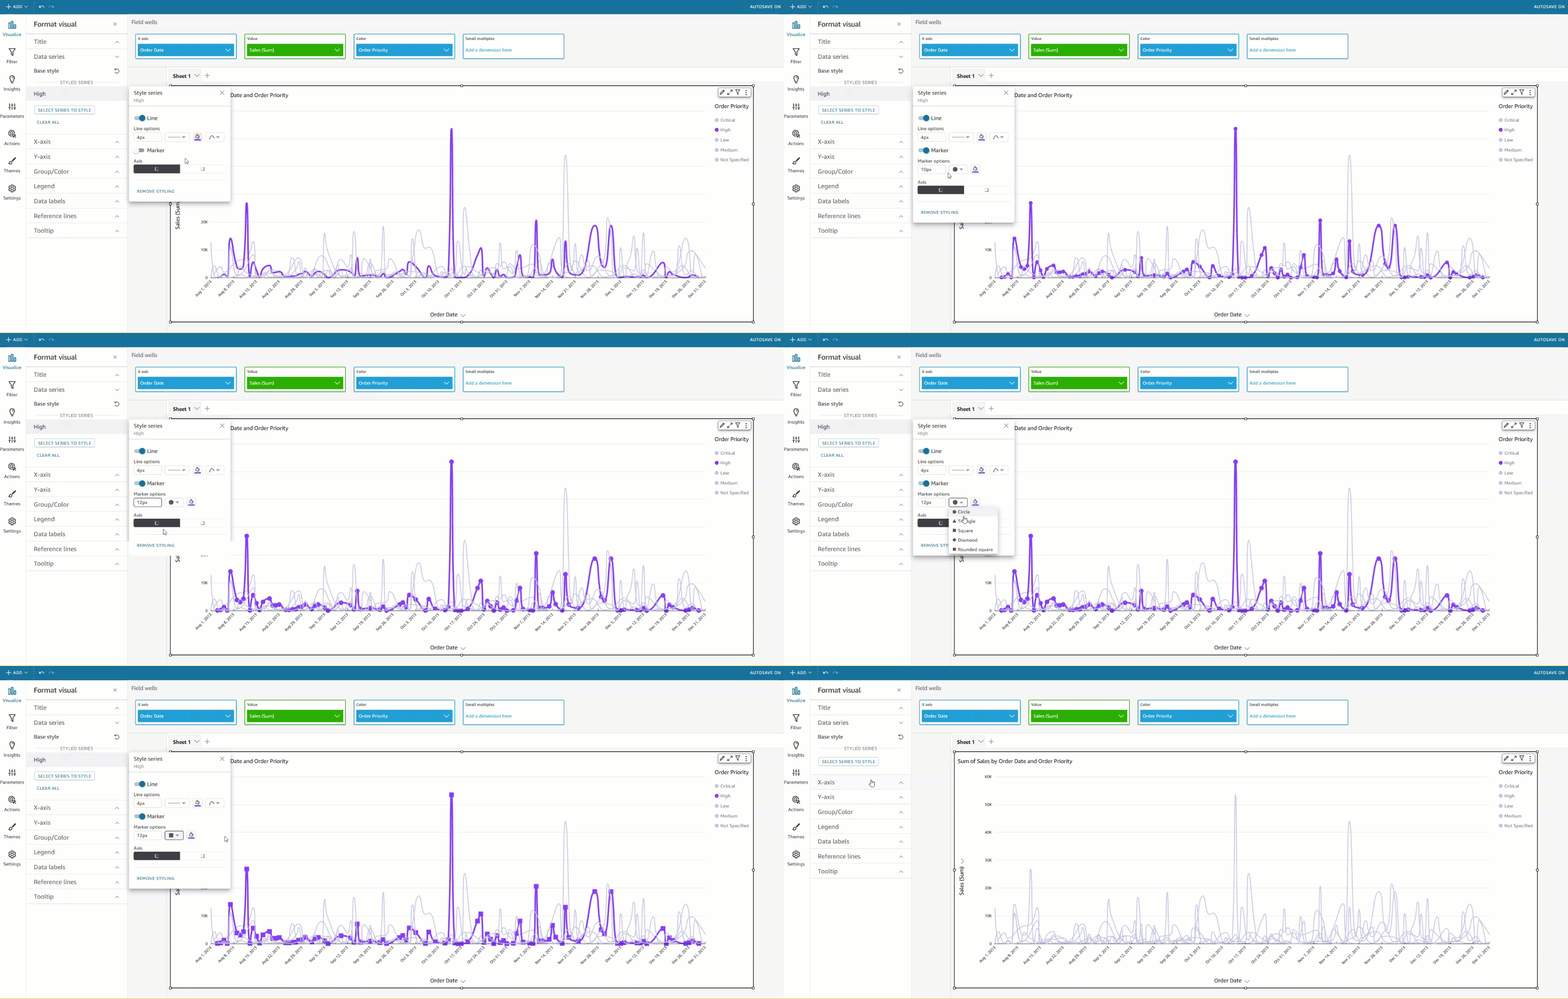


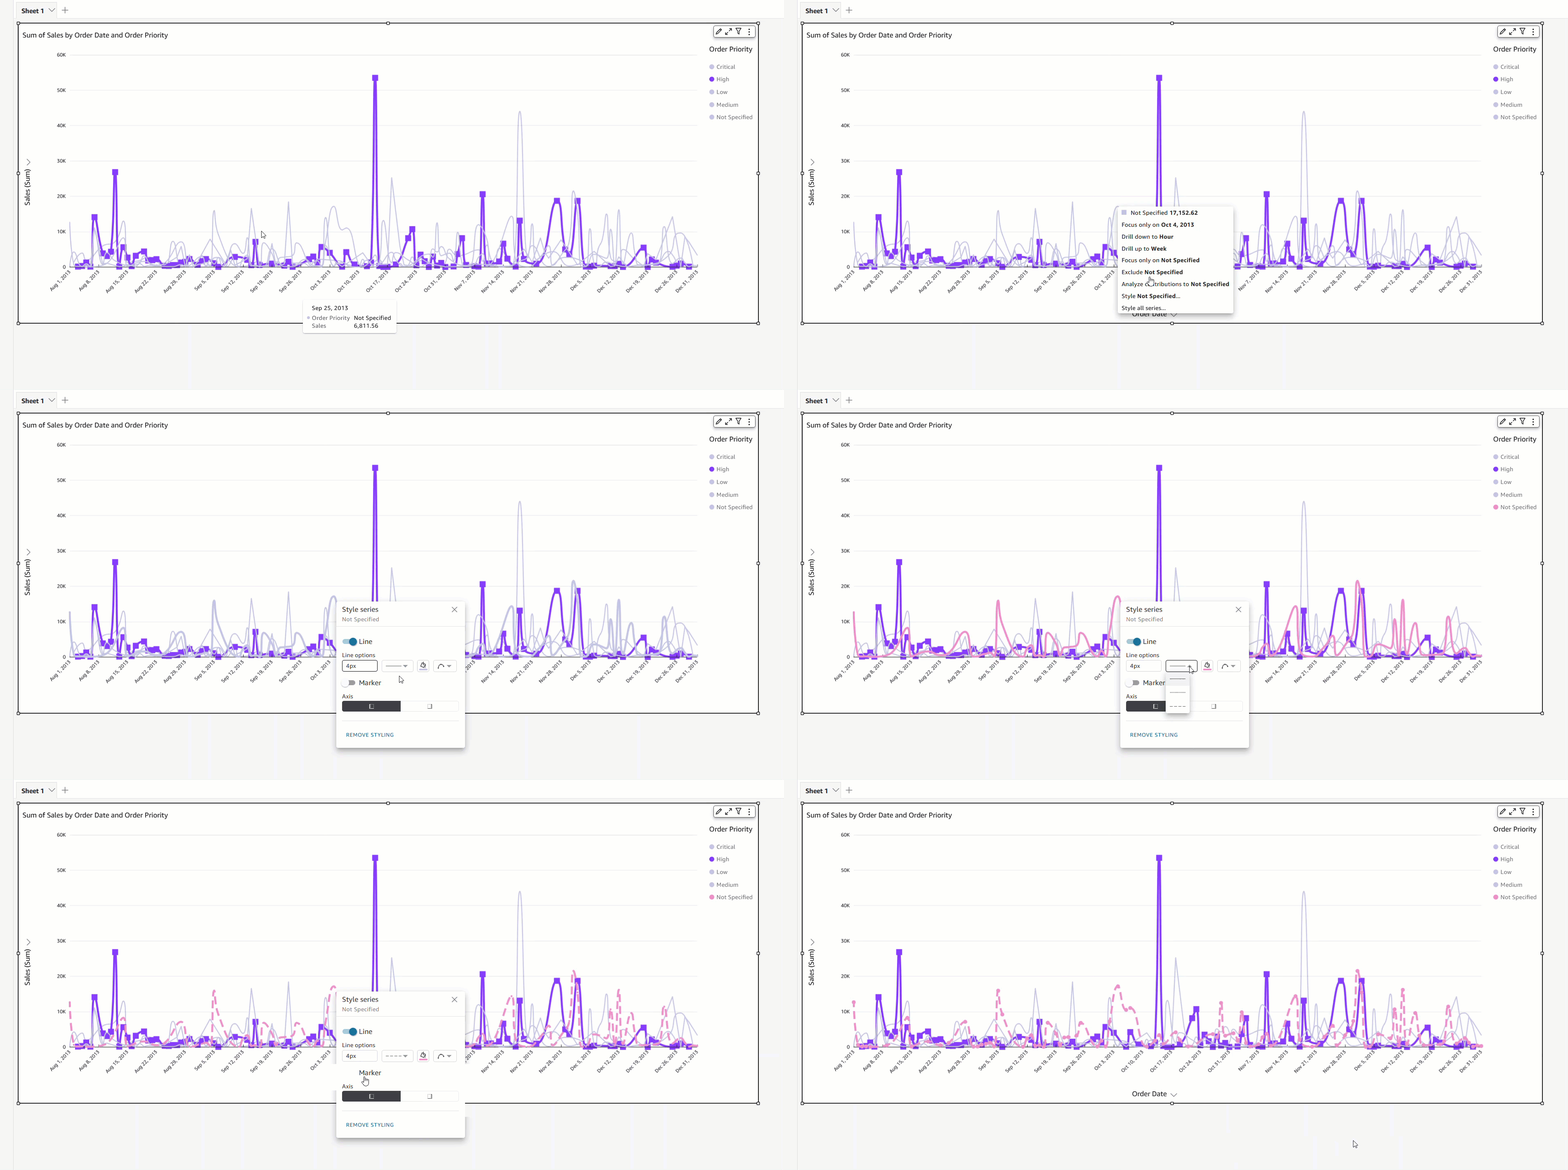



 Leon Liu is a Chief Architect at ADP. He has over 20 years of experience with enterprise application framework, architecture, data warehouses, and big data real-time processing.