Security updates for Monday

Post Syndicated from original https://lwn.net/Articles/869863/rss

Security updates have been issued by Debian (gnutls28, nettle, nextcloud-desktop, and openssl1.0), Fedora (dovecot-fts-xapian, drupal7, ghostscript, haproxy, libtpms, lynx, wordpress, and xen), openSUSE (xen), Red Hat (rh-ruby27-ruby), and SUSE (openssl, openssl1, and xen).

Building federated GraphQL on AWS Lambda

Post Syndicated from James Beswick original https://aws.amazon.com/blogs/compute/building-federated-graphql-on-aws-lambda/

This post is written by Krzysztof Lis, Senior Software Development Engineer, IMDb.

IMDb is the world’s most popular source for movie, TV, and celebrity content. It deals with a complex business domain including movies, shows, celebrities, industry professionals, events, and a distributed ownership model. There are clear boundaries between systems and data owned by various teams.

Historically, IMDb uses a monolithic REST gateway system that serves clients. Over the years, it has become challenging to manage effectively. There are thousands of files, business logic that lacks clear ownership, and unreliable integration tests tied to the data. To fix this, the team used GraphQL (GQL). This is a query language for APIs that lets you request only the data that you need and a runtime for fulfilling those queries with your existing data.

It’s common to implement this protocol by creating a monolithic service that hosts the complete schema and resolves all fields requested by the client. It is good for applications with a relatively small domain and clear, single-threaded ownership. IMDb chose the federated approach, that allows us to federate GQL requests to all existing data teams. This post shows how to build federated GraphQL on AWS Lambda.

Overview

This article covers migration from a monolithic REST API and monolithic frontend to a federated backend system powering a modern frontend. It enumerates challenges in the earlier system and explains why federated GraphQL addresses these problems.

I present the architecture overview and describe the decisions made when designing the new system. I also present our experiences with developing and running high-traffic and high-visibility pages on the new endpoint – improvement in IMDb’s ownership model, development lifecycle, in addition to ease of scaling.

Comparing GraphQL with federated GraphQL

Comparing GraphQL with federated GraphQL

Federated GraphQL allows you to combine GraphQLs APIs from multiple microservices into a single API. Clients can make a single request and fetch data from multiple sources, including joining across data sources, without additional support from the source services.

This is an example schema fragment:

type TitleQuote {
  "Quote ID"
  id: ID!
  "Is this quote a spoiler?"
  isSpoiler: Boolean!
  "The lines that make up this quote"
  lines: [TitleQuoteLine!]!
  "Votes from users about this quote..."
  interestScore: InterestScore!
  "The language of this quote"
  language: DisplayableLanguage!
}
"A specific line in the Title Quote. Can be a verbal line with characters speaking or stage directions"
type TitleQuoteLine {
  "The characters who speak this line, e.g.  'Rick'. Not required: a line may be non-verbal"
  characters: [TitleQuoteCharacter!]
  "The body of the quotation line, e.g 'Here's looking at you kid. '.  Not required: you may have stage directions with no dialogue."
  text: String
  "Stage direction, e.g. 'Rick gently places his hand under her chin and raises it so their eyes meet'. Not required."
  stageDirection: String
}

This is an example monolithic query: “Get the 2 top quotes from The A-Team (title identifier: tt0084967)”:

{ 
  title(id:"tt0084967"){ 
    quotes(first:2){ 
      lines { text } 
    } 
  }
}

Here is an example response:

{ 
  "data": { 
    "title": { 
      "quotes": { 
        "lines": [
          { 
            "text": "I love it when a plan comes together!"
          },
          {
            "text": "10 years ago a crack commando unit was sent to prison by a military court for a crime they didn't commit..."
          }
        ]
      } 
    }
  }
}

This is an example federated query: “What is Jackie Chan (id nm0000329) known for? Get the text, rating and image for each title”

{
  name(id: "nm0000329") {
    knownFor(first: 4) {
      title {
        titleText {
          text
        }
        ratingsSummary {
          aggregateRating
        }
        primaryImage {
          url
        }
      }
    }
  }
}

The monolithic example fetches quotes from a single service. In the federated example, knownFor, titleText, ratingsSummary, primaryImage are fetched transparently by the gateway from separate services. IMDb federates the requests across 19 graphlets, which are transparent to the clients that call the gateway.

Architecture overview

Architecture overview

IMDb supports three channels for users: website, iOS, and Android apps. Each of the channels can request data from a single federated GraphQL gateway, which federates the request to multiple graphlets (sub-graphs). Each of the invoked graphlets returns a partial response, which the gateway merges with responses returned by other graphlets. The client receives only the data that they requested, in the shape specified in the query. This can be especially useful when the developers must be conscious of network usage (for example, over mobile networks).

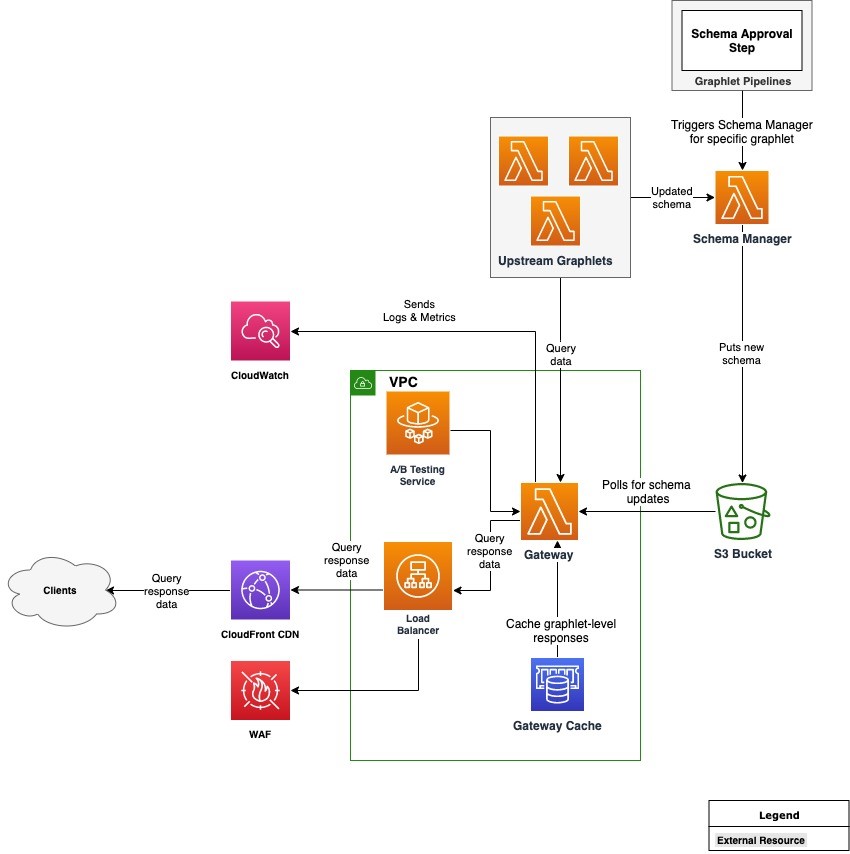
This is the architecture diagram:

Architecture diagram

There are two core components in the architecture: the Gateway and Schema Manager, which run on Lambda. The Gateway is a Node.js-based Lambda function that is built on top of open-source Apollo Gateway code. It is customized with code responsible predominantly for handling authentication, caching, metrics, and logging.

Other noteworthy components are Upstream Graphlets and an A/B Testing Service that enables A/B tests in the graph. The Gateway is connected to an Application Load Balancer, which is protected by AWS WAF and fronted by Amazon CloudFront as our CDN layer. This uses Amazon ElastiCache with Redis as the engine to cache partial responses coming from graphlets. All logs and metrics generated by the system are collected in Amazon CloudWatch.

Choosing the compute platform

This uses Lambda, since it scales on demand. IMDb uses Lambda’s Provisioned Concurrency to reduce cold start latency. The infrastructure is abstracted away so there is no need for us to manage our own capacity and handle patches.

Additionally, Application Load Balancer (ALB) has support for directing HTTP traffic to Lambda. This is an alternative to API Gateway. The workload does not need many of the features that API Gateway provides, since the gateway has a single endpoint, making ALB a better choice. ALB also supports AWS WAF.

Using Lambda, the team designed a way to fetch schema updates without needing to fetch the schema with every request. This is addressed with the Schema Manager component. This component improves latency and improves the overall customer experience.

Integration with legacy data services

The main purpose of the federated GQL migration is to deprecate a monolithic service that aggregates data from multiple backend services before sending it to the clients. Some of the data in the federated graph comes from brand new graphlets that are developed with the new system in mind.

However, much of the data powering the GQL endpoint is sourced from the existing backend services. One benefit of running on Lambda is the flexibility to choose the runtime environment that works best with the underlying data sources and data services.

For the graphlets relying on the legacy services, IMDb uses lightweight Java Lambda functions using provided client libraries written in Java. They connect to legacy backends via AWS PrivateLink, fetch the data, and shape it in the format expected by the GQL request. For the modern graphlets, we recommend the graphlet teams to explore Node.js as the first option due to improved performance and ease of development.

Caching

The gateway supports two caching modes for graphlets: static and dynamic. Static caching allows graphlet owners to specify a default TTL for responses returned by a graphlet. Dynamic caching calculates TTL based on a custom caching extension returned with the partial response. It allows graphlet owners to decide on the optimal TTL for content returned by their graphlet. For example, it can be 24 hours for queries containing only static text.

Permissions

Each of the graphlets runs in a separate AWS account. The graphlet accounts grant the gateway AWS account (as AWS principal) invoke permissions on the graphlet Lambda function. This uses a cross-account IAM role in the development environment that is assumed by stacks deployed in engineers’ personal accounts.

Experience with developing on federated GraphQL

The migration to federated GraphQL delivered on expected results. We moved the business logic closer to the teams that have the right expertise – the graphlet teams. At the same time, a dedicated platform team owns and develops the core technical pieces of the ecosystem. This includes the Gateway and Schema Manager, in addition to the common libraries and CDK constructs that can be reused by the graphlet teams. As a result, there is a clear ownership structure, which is aligned with the way IMDb teams are organized.

In terms of operational excellence of the platform team, this reduced support tickets related to business logic. Previously, these were routed to an appropriate data service team with a delay. Integration tests are now stable and independent from underlying data, which increases our confidence in the Continuous Deployment process. It also eliminates changing data as a potential root cause for failing tests and blocked pipelines.

The graphlet teams now have full ownership of the data available in the graph. They own the partial schema and the resolvers that provide data for that part of the graph. Since they have the most expertise in that area, the potential issues are identified early on. This leads to a better customer experience and overall health of the system.

The web and app developers groups are also impacted by the migration. The learning curve was aided by tools like GraphQL Playground and Apollo Client. The teams covered the learning gap quickly and started delivering new features.

One of the main pages at IMDb.com is the Title Page (for example, Shutter Island). This was successfully migrated to use the new GQL endpoint. This proves that the new, serverless federated system can serve production traffic at over 10,000 TPS.

Conclusion

A single, highly discoverable, and well-documented backend endpoint enabled our clients to experiment with the data available in the graph. We were able to clean up the backend API layer, introduce clear ownership boundaries, and give our client powerful tools to speed up their development cycle.

The infrastructure uses Lambda to remove the burden of managing, patching, and scaling our EC2 fleets. The team dedicated this time to work on features and operational excellence of our systems.

Part two will cover how IMDb manages the federated schema and the guardrails used to ensure high availability of the federated GraphQL endpoint.

For more serverless learning resources, visit Serverless Land.

Login Authentication Goes Automated With New InsightAppSec Improvements

Post Syndicated from Tom Caiazza original https://blog.rapid7.com/2021/09/20/login-authentication-goes-automated-with-new-insightappsec-improvements/

Login Authentication Goes Automated With New InsightAppSec Improvements

Move over, macros — automated login is here.

At Rapid7, we know the most powerful tools in your security portfolio are the ones that help you understand your risks quickly. With our new automated login for InsightAppSec, you can access and scan even the most complex, modern applications quickly and easily. That means you’ll spend less time worrying about whether your scans are authenticating and more time assessing and responding to vulnerabilities.

In the world before automated login — we’ll call these the dark ages — security professionals needed to write scripts and rely on macros to navigate more complex applications with their many layers of authentication. This has always been a time-consuming process that takes resources away from the work of identifying and remediating vulnerabilities.

InsightAppSec with automated authentication analyzes and identifies the login pages, enters the credentials, and logs in to the app automatically. Then, it provides you with a confidence score so you’re sure it’s been logged in successfully. Fewer confusing steps, fewer macros — just more understanding of risk from the restricted parts of your web applications.

A look inside

So, what’s different? Well, for starters, the look and feel of the scan will be intuitive and easy to use. We’ve taken great pains to maximize your efficiency at every turn so when you start a new application scan and select authentication, automated authentication will be the default.

Login Authentication Goes Automated With New InsightAppSec Improvements

We’ve also improved secondary navigation to include new, more logical groupings, making settings easier to find.

Login Authentication Goes Automated With New InsightAppSec Improvements

Login Authentication Goes Automated With New InsightAppSec Improvements

The process couldn’t be easier. Simply choose the application you wish to scan from the InsightAppSec All Apps page, open Scan Config, and select Automated Authentication from the Authentication’s page. Enter your credentials once, and you’re good to save for later or start the scan now.

For more on how this works and how automated login improves this process, check out our InsightAppSec Quick Start guide.

The first of many updates

Moving to automated login is more than just a single new feature — it opens the door to more innovations. Automated login uses a new architecture that allows InsightAppSec to interact with web apps in the same way a user and their browser would behave. This is critical as applications become more complex, which in turn presents new challenges to automating certain processes. Automated login is just the first feature we’re rolling out based on this new, more innovative architecture.

As web applications become more complex, the solutions you employ to secure them should become more powerful. Automated authentication provides your security team with the ability to efficiently and accurately scan even the most complex applications quickly and in an intuitive way right out of the box. It flattens the learning curve for setting up and running scans, giving any member of your security team the ability to run scans and identify vulnerabilities.

We are including automated login through InsightAppSec for existing and new customers right away. If you want to learn more, click here for more resources.

Kernel prepatch 5.15-rc2

Post Syndicated from original https://lwn.net/Articles/869838/rss

The 5.15-rc2 kernel prepatch is out for
testing.

So I’ve spent a fair amount of this week trying to sort out all the
odd warnings, and I want to particularly thank Guenter Roeck for his
work on tracking where the build failures due to -Werror come from.

Is it done? No. But on the whole I’m feeling fairly good about this
all, even if it has meant that I’ve been looking at some really odd
and grotty code. Who knew I’d still worry about some odd EISA driver
on alpha, after all these years? A slight change of pace 😉

How to customize your HTTP DDoS protection settings

Post Syndicated from Omer Yoachimik original https://blog.cloudflare.com/http-ddos-managed-rules/

How to customize your HTTP DDoS protection settings

How to customize your HTTP DDoS protection settings

We’re excited to announce the availability of the HTTP DDoS Managed Ruleset. This new feature allows Cloudflare customers to independently tailor their HTTP DDoS protection settings. Whether you’re on the Free plan or the Enterprise plan, you can now tweak and optimize the settings directly from within the Cloudflare dashboard or via API.

We expect that in most cases, Cloudflare customers won’t need to customize any settings. Our mission is to make DDoS disruptions a thing of the past, with no customer overhead. To achieve this mission we’re constantly investing in our automated detection and mitigation systems. In some rare cases, there is a need to make some configuration changes, and so now, Cloudflare customers can customize those protection mechanisms independently. The next evolutionary step is to make those settings learn and auto-tune themselves for our customers, based on their unique traffic patterns. Zero-touch DDoS protection at scale.

Unmetered DDoS Protection

Back in 2017, we announced that we will never kick a customer off of our network because they face large attacks, even if they are not paying us at all (i.e., using the Free plan). Furthermore, we committed to never charge a customer for DDoS attack traffic — no matter the size and duration of the attack. Just this summer, our systems automatically detected and mitigated one of the largest DDoS attacks of all time. As opposed to other vendors, Cloudflare customers don’t need to request a service credit for the attack traffic: we simply exclude DDoS traffic from our billing systems. This is done automatically, just like our attack detection and mitigation mechanisms.

Autonomous DDoS Protection

Our unmetered DDoS protection commitment is possible due to our ongoing investment in our network and technology stack. The global coverage and capacity of our network allows us to absorb the largest attacks ever recorded, without manual intervention. Using BGP Anycast, traffic is routed to the closest Cloudflare edge data center as a form of global inter-data center load balancing. Traffic is then load balanced efficiently inside the data center between servers with the help of Unimog, our home-grown L4 load balancer, to ensure that traffic arrives at the least loaded server. Then, each server scans for malicious traffic and, if detected, applies mitigations in the most optimal location in the tech stack. Each server detects and mitigates attacks completely autonomously without requiring any centralized consensus, and shares details with each other using multicast. This is done using our proprietary autonomous edge detection and mitigation system, and this is how we’re able to continue offering unmetered DDoS protection for free at the scale we operate at.

Configurable DDoS Protection

Our autonomous systems use a set of dynamic rules that scan for attack patterns, known attack tools, suspicious patterns, protocol violations, requests causing large amounts of origin errors, excessive traffic hitting the origin/cache, and additional attack vectors. Each rule has a predefined sensitivity level and default action that varies based on the rule’s confidence that the traffic is indeed part of an attack.

But how do we determine those confidence levels? The answer to that depends on each specific rule and what that rule is looking for. Some rules look for the patterns in HTTP attributes that are generated by known attack tools and botnets, known protocol violations and other general suspicious patterns and traffic abnormalities. If a given rule is searching for the HTTP patterns of known attack tools, then once found, the likelihood (i.e., confidence) that this traffic is part of an attack is high, and we can therefore safely block all the traffic that matches that rule. However, in other cases, the detected patterns or abnormal activity might resemble an attack but can actually be caused by faulty applications that generate abnormal HTTP calls, misbehaving API clients that flood their origin server, and even legitimate traffic that naively violates protocol standards. In those cases, we might want to rate-limit the traffic that matches the rule or serve a challenge action to verify and allow legitimate users in while blocking bad bots and attackers.

How to customize your HTTP DDoS protection settings

Configuring the DDoS Protection Settings

In the past, you’d have to go through our support channels to customize any of the default actions and sensitivity levels. In some cases, this may have taken longer to resolve than desired. With today’s release, you can tailor and fine-tune the settings of our autonomous edge system by yourself to quickly improve the accuracy of the protection for your specific application needs.

If you previously contacted Cloudflare Support to apply customizations, the DDoS Ruleset has been set to Essentially off or Low for your zone, based on your existing customization. You can visit the dashboard to view the settings and change them if you need.

If you’ve requested to exclude or bypass the mitigations for specific HTTP attributes or IPs, or if you’ve requested a significantly high threshold that requires Cloudflare approval, then those customizations are still active but may not yet be visible in the dashboard.

If you haven’t experienced this issue previously, there is no action required on your end. However, if you would like to customize your DDoS protection settings, go directly to the DDoS tab or follow these steps:

  1. Log in to the Cloudflare dashboard, and select your account and website.
  2. Go to Firewall > DDoS.
  3. Next to HTTP DDoS attack protection, click Configure.
  4. In Ruleset configuration, select the action and sensitivity values for all the rules in the HTTP DDoS Managed Ruleset.
How to customize your HTTP DDoS protection settings

Alternatively, follow the API documentation to programmatically configure the DDoS protection settings.

In the configuration page, you can select a different Action and Sensitivity Level to override all the DDoS protection rules as a group of rules (i.e., the “ruleset”).

How to customize your HTTP DDoS protection settings

Alternatively, you can click Browse Rules to override specific rules, rather than all of them as a set of rules.

Mitigation Action

The mitigation action defines what action to take when the mitigation rule is applied. Our systems constantly analyze traffic and track potentially malicious activity. When certain request-per-second thresholds exceed the configured sensitivity level, a mitigation rule with a dynamically generated signature will be applied to mitigate the attack. The default mitigation action can vary according to the specific rule. A rule with less confidence may apply a Challenge action as a form of soft mitigation, and a rule with a Block action is applied when there is higher confidence that the traffic is part of an attack — as a form of a stricter mitigation action.

The available values for the action are:

  • Block
  • Challenge (CAPTCHA)
  • Log
  • Use Rule Defaults
How to customize your HTTP DDoS protection settings

Some examples of when you may want to change the mitigation action include:

  • Safer onboarding: You’re onboarding a new HTTP application which has odd traffic patterns, naively violates protocol violations or causes spiky behavior. In this case, you can set the action to Log and see what traffic our systems flag. Afterwards, you can make the necessary changes to the sensitivity levels as required and switch the mitigation action back to the default.
  • Stricter mitigation: A DDoS attack has been detected but a Rate-limit or Challenge action have been applied due to the rule’s default logic. However, in this specific case, you’re sure that this is malicious traffic, so you can change the action to Block for a more complete mitigation.

Mitigation Sensitivity

The sensitivity level defines when the mitigation rule is applied. Our systems constantly analyze traffic and track potentially malicious activity. When certain request-per-second thresholds are crossed, a mitigation rule with a dynamically generated signature will be applied to mitigate the attack. Toggling the sensitivity levels allows you to define when the mitigation is applied. The higher the sensitivity, the faster the mitigation is applied. The available values for sensitivity are:

  1. High (default)
  2. Medium
  3. Low
  4. Essentially Off

Essentially Off means that we’ve set an exceptionally low sensitivity level so in most cases traffic won’t be mitigated for you. However, attack traffic will be mitigated at exceptional levels to ensure the safety and stability of the Cloudflare network.

How to customize your HTTP DDoS protection settings

Some examples of when you may want to change the sensitivity action include:

  • Avoid impact to legitimate traffic: One of the rules has applied mitigation to your legitimate traffic due to a suspicious pattern. In this case, you may want to reduce the rule sensitivity to avoid recurrence of the issue and negative impact to your traffic.
  • Legacy applications: One of your legacy HTTP applications is violating protocol standards, or you may have mistakenly introduced a bug into your mobile application/API client. These cases may result in abnormal traffic activity that may be flagged by our systems. In such a case, you can select the Essentially Off sensitivity level until you’ve resolved the issue on your end, to avoid false positives.

Overriding Specific Rules

As mentioned above, you can also select a specific rule to override its action and sensitivity levels. The per-rule override takes priority over the ruleset override.

How to customize your HTTP DDoS protection settings

When configuring per-rule overrides, you’ll see that some rules have a DDoS Dynamic action. This means that the mitigation is multi-staged and will apply different mitigation actions depending on various factors including attack type, request characteristics, and various other factors. This dynamic action can also be overridden if you choose to do so.

How to customize your HTTP DDoS protection settings

DDoS Attack Analytics

When a DDoS attack is detected and mitigated, you’ll receive a real-time DDoS alert (if you’ve configured one) and you’ll be able to view the attack in the Firewall analytics dashboard. The attack details and the rule ID that was triggered will also be displayed in the Activity log as part of each HTTP request log that was mitigated.

How to customize your HTTP DDoS protection settings

Helping Build a Better Internet

At Cloudflare, everything we do is guided by our mission to help build a better Internet. A significant part of that mission is to make DDoS downtime and service disruptions a thing of the past. By giving our users the visibility and tools they need in order to understand and improve their DDoS protection, we’re hoping to make another step towards a better Internet.

Do you have feedback about the user interface or anything else? In the new DDoS tab, we’ve added a link to provide feedback, so you too can help shape the future of Cloudflare’s DDoS protection Managed Rules.

Not using Cloudflare yet? Start now.

What’s a kangaroo?! AI ethics lessons for and from the younger generation

Post Syndicated from Sue Sentance original https://www.raspberrypi.org/blog/ai-ethics-lessons-education-children-research/

Between September 2021 and March 2022, we’re partnering with The Alan Turing Institute to host speakers from the UK, Finland, Germany, and the USA presenting a series of free research seminars about AI and data science education for young people. These rapidly developing technologies have a huge and growing impact on our lives, so it’s important for young people to understand them both from a technical and a societal perspective, and for educators to learn how to best support them to gain this understanding.

Mhairi Aitken.

In our first seminar we were beyond delighted to hear from Dr Mhairi Aitken, Ethics Fellow at The Alan Turing Institute. Mhairi is a sociologist whose research examines social and ethical dimensions of digital innovation, particularly relating to uses of data and AI. You can catch up on her full presentation and the Q&A with her in the video below.

Why we need AI ethics

The increased use of AI in society and industry is bringing some amazing benefits. In healthcare for example, AI can facilitate early diagnosis of life-threatening conditions and provide more accurate surgery through robotics. AI technology is also already being used in housing, financial services, social services, retail, and marketing. Concerns have been raised about the ethical implications of some aspects of these technologies, and Mhairi gave examples of a number of controversies to introduce us to the topic.

“Ethics considers not what we can do but rather what we should do — and what we should not do.”

Mhairi Aitken

One such controversy in England took place during the coronavirus pandemic, when an AI system was used to make decisions about school grades awarded to students. The system’s algorithm drew on grades awarded in previous years to other students of a school to upgrade or downgrade grades given by teachers; this was seen as deeply unfair and raised public consciousness of the real-life impact that AI decision-making systems can have.

An AI system was used in England last year to make decisions about school grades awarded to students — this was seen as deeply unfair.

Another high-profile controversy was caused by biased machine learning-based facial recognition systems and explored in Shalini Kantayya’s documentary Coded Bias. Such facial recognition systems have been shown to be much better at recognising a white male face than a black female one, demonstrating the inequitable impact of the technology.

What should AI be used for?

There is a clear need to consider both the positive and negative impacts of AI in society. Mhairi stressed that using AI effectively and ethically is not just about mitigating negative impacts but also about maximising benefits. She told us that bringing ethics into the discussion means that we start to move on from what AI applications can do to what they should and should not do. To outline how ethics can be applied to AI, Mhairi first outlined four key ethical principles:

  • Beneficence (do good)
  • Nonmaleficence (do no harm)
  • Autonomy
  • Justice

Mhairi shared a number of concrete questions that ethics raise about new technologies including AI: 

  • How do we ensure the benefits of new technologies are experienced equitably across society?
  • Do AI systems lead to discriminatory practices and outcomes?
  • Do new forms of data collection and monitoring threaten individuals’ privacy?
  • Do new forms of monitoring lead to a Big Brother society?
  • To what extent are individuals in control of the ways they interact with AI technologies or how these technologies impact their lives?
  • How can we protect against unjust outcomes, ensuring AI technologies do not exacerbate existing inequalities or reinforce prejudices?
  • How do we ensure diverse perspectives and interests are reflected in the design, development, and deployment of AI systems? 

Who gets to inform AI systems? The kangaroo metaphor

To mitigate negative impacts and maximise benefits of an AI system in practice, it’s crucial to consider the context in which the system is developed and used. Mhairi illustrated this point using the story of an autonomous vehicle, a self-driving car, developed in Sweden in 2017. It had been thoroughly safety-tested in the country, including tests of its ability to recognise wild animals that may cross its path, for example elk and moose. However, when the car was used in Australia, it was not able to recognise kangaroos that hopped into the road! Because the system had not been tested with kangaroos during its development, it did not know what they were. As a result, the self-driving car’s safety and reliability significantly decreased when it was taken out of the context in which it had been developed, jeopardising people and kangaroos.

A parent kangaroo with a young kangaroo in its pouch stands on grass.
Mitigating negative impacts and maximising benefits of AI systems requires actively involving the perspectives of groups that may be affected by the system — ‘kangoroos’ in Mhairi’s metaphor.

Mhairi used the kangaroo example as a metaphor to illustrate ethical issues around AI: the creators of an AI system make certain assumptions about what an AI system needs to know and how it needs to operate; these assumptions always reflect the positions, perspectives, and biases of the people and organisations that develop and train the system. Therefore, AI creators need to include metaphorical ‘kangaroos’ in the design and development of an AI system to ensure that their perspectives inform the system. Mhairi highlighted children as an important group of ‘kangaroos’. 

AI in children’s lives

AI may have far-reaching consequences in children’s lives, where it’s being used for decision-making around access to resources and support. Mhairi explained the impact that AI systems are already having on young people’s lives through these systems’ deployment in children’s education, in apps that children use, and in children’s lives as consumers.

A young child sits at a table using a tablet.
AI systems are already having an impact on children’s lives.

Children can be taught not only that AI impacts their lives, but also that it can get things wrong and that it reflects human interests and biases. However, Mhairi was keen to emphasise that we need to find out what children know and want to know before we make assumptions about what they should be taught. Moreover, engaging children in discussions about AI is not only about them learning about AI, it’s also about ethical practice: what can people making decisions about AI learn from children by listening to their views and perspectives?

AI research that listens to children

UNICEF, the United Nations Children’s Fund, has expressed concerns about the impact of new AI technologies used on children and young people. They have developed the UNICEF Requirements for Child-Centred AI.

Unicef Requirements for Child-Centred AI: Support childrenʼs development and well-being. Ensure inclusion of and for children. Prioritise fairness and non-discrimination for children. Protect childrenʼs data and privacy. Ensure safety for children. Provide transparency, explainability, and accountability for children. Empower governments and businesses with knowledge of AI and childrenʼs rights. Prepare children for present and future developments in AI. Create an enabling environment for child-centred AI. Engage in digital cooperation.
UNICEF’s requirements for child-centred AI, as presented by Mhairi. Click to enlarge.

Together with UNICEF, Mhairi and her colleagues working on the Ethics Theme in the Public Policy Programme at The Alan Turing Institute are engaged in new research to pilot UNICEF’s Child-Centred Requirements for AI, and to examine how these impact public sector uses of AI. A key aspect of this research is to hear from children themselves and to develop approaches to engage children to inform future ethical practices relating to AI in the public sector. The researchers hope to find out how we can best engage children and ensure that their voices are at the heart of the discussion about AI and ethics.

We all learned a tremendous amount from Mhairi and her work on this important topic. After her presentation, we had a lively discussion where many of the participants relayed the conversations they had had about AI ethics and shared their own concerns and experiences and many links to resources. The Q&A with Mhairi is included in the video recording.

What we love about our research seminars is that everyone attending can share their thoughts, and as a result we learn so much from attendees as well as from our speakers!

It’s impossible to cover more than a tiny fraction of the seminar here, so I do urge you to take the time to watch the seminar recording. You can also catch up on our previous seminars through our blogs and videos.

Join our next seminar

We have six more seminars in our free series on AI, machine learning, and data science education, taking place every first Tuesday of the month. At our next seminar on Tuesday 5 October at 17:00–18:30 BST / 12:00–13:30 EDT / 9:00–10:30 PDT / 18:00–19:30 CEST, we will welcome Professor Carsten Schulte, Yannik Fleischer, and Lukas Höper from the University of Paderborn, Germany, who will be presenting on the topic of teaching AI and machine learning (ML) from a data-centric perspective (find out more here). Their talk will raise the questions of whether and how AI and ML should be taught differently from other themes in the computer science curriculum at school.

Sign up now and we’ll send you the link to join on the day of the seminar — don’t forget to put the date in your diary.

I look forward to meeting you there!

In the meantime, we’re offering a brand-new, free online course that introduces machine learning with a practical focus — ideal for educators and anyone interested in exploring AI technology for the first time.

The post What’s a kangaroo?! AI ethics lessons for and from the younger generation appeared first on Raspberry Pi.

Project Myriagon: Cloudflare Passes 10,000 Connected Networks

Post Syndicated from Ticiane Takami original https://blog.cloudflare.com/10000-networks-and-beyond/

Project Myriagon: Cloudflare Passes 10,000 Connected Networks

Project Myriagon: Cloudflare Passes 10,000 Connected Networks

During Speed Week, we’ve talked a lot about the products we’ve improved and the places we’ve expanded to. Today, we have a final exciting announcement: Cloudflare now connects with more than 10,000 other networks. Put another way, over 10,000 networks have direct on-ramps to the Cloudflare network.

This is the culmination of a special project we’ve been working on for the last few months dubbed Project Myriagon, a reference to the 10,000-sided polygon of the same name. In going about this project, we have learned a lot about the performance impact of adding more direct connections to our network — in one recent case, we saw a 90% reduction in median round-trip end-user latency.

But to really explain why this is such a big milestone, we first need to explain a bit about how the Internet works.

More roads leading to Rome

The Internet that all know and rely on is, on a basic level, an interconnected series of independently run local networks. Each network is defined as its own “autonomous system.” These networks are delineated numerically with Autonomous Systems Numbers, or ASNs. An ASN is like the Internet version of a zip code, a short number directly mapping to a distinct region of IP space using a clearly defined methodology. Network interconnection is all about bringing together different ASNs to exponentially multiply the number of possible paths between source and destination.

Most of us have home networks behind a modem and router, connecting your individual miniature network to your ISP. Your ISP then connects with other networks, to fetch the web pages or other Internet traffic you request. These networks in turn have connections to different networks, who in turn connect to interconnected networks, and so on, until your data reaches its destination. The fewer networks your request has to traverse, generally, the lower the end-to-end latency and odds that something will get lost along the way.

The average number of hops between any one network on the Internet to any other network is around 5.7 and 4.7, for the IPv4 and IPv6 networks respectively.

Project Myriagon: Cloudflare Passes 10,000 Connected Networks
Source: https://blog.apnic.net/2020/01/14/bgp-in-2019-the-bgp-table/

How do ASNs work?

ASNs are a key part of the routing protocol that directs traffic along the Internet, BGP. Internet Assigned Numbers Authority (IANA), the global coordinator of the DNS Root, IP addressing, and other Internet protocol resources like AS Numbers, delegates ASN-making authority to Regional Internet Registries (RIRs), who in turn assign individual ASNs to network operators in line with their regional policies. The five RIRs are AFRINIC, APNIC, ARIN, LACNIC and RIPE, each entitled to assign and attribute ASN numbers in their respective appointed regions.

Cloudflare’s ASN is 13335, one of the approximately 70,000 ASNs advertised on the Internet. While we’d like to — and plan on — connecting to every one of these ASNs eventually, our team tries to prioritize those with the greatest impact on our overall breadth and improving the proximity to as many people on Earth as possible.

As enabling optimal routes is key to our core business and services, we continuously track how many ASNs we connect to (technically referred to as “adjacent networks”). With Project Myriagon, we aimed to speed up our rate of interconnection and pass 10,000 adjacent networks by the end of the year. By September 2021, we reached that milestone, bringing us from 8,300 at the start of 2020 to over 10,000 today.

As shown in the table below, that milestone is part of a continuous effort towards gradually hitting more of the total advertised ASNs on the Internet.

Project Myriagon: Cloudflare Passes 10,000 Connected Networks
The Regional Internet Registries and their Regions

Table 1: Cloudflare’s peer ASNs and their respective RIR

Project Myriagon: Cloudflare Passes 10,000 Connected Networks

Given that there are 70,000+ ASNs out there, you might be wondering: why is 10,000 a big deal? To understand this, we need to look deeply at BGP, the protocol that glues the Internet together. There are three different classes of ASNs:

  • Transit Only ASNs: these networks only provide connectivity to other networks. They don’t have any IP addresses inside their networks. These networks are quite rare, as it’s very unusual to not have any IP addresses inside your network. Instead, these networks are often used primarily for distinct management purposes within a single organization.
  • Origin Only ASNs: these are networks that do not provide connectivity to other networks. They are a stub network, and often, like your home network, only connected to a single ISP.
  • Mixed ASNs: these networks both have IP addresses inside their network, and provide connectivity to other networks.

Origin Only ASNs Mixed ASNs Transit Only ASNs
61,127 11,128 443

Source: https://bgp.potaroo.net/as6447/

One interesting fact: of the 61,127 origin only ASNs, nearly 43,000 of them are only connected to their ISP. As such, our direct connections to over 10,000 networks indicates that of the networks that connect more than one network, a very good percentage are now already connected to Cloudflare.

Cutting out the middle man

Directly connecting to a network — and eliminating the hops in between — can greatly improve performance in two ways. First, connecting with a network directly allows for Internet traffic to be exchanged locally rather than detouring through remote cities; and secondly, direct connections help avoid the congestion caused by bottlenecks that sometimes happen between networks.

To take a recent real-world example, turning up a direct peering session caused a 90% improvement in median end-user latency when turning up a peering session with a European network, from an average of 76ms to an average of 7ms.

Project Myriagon: Cloudflare Passes 10,000 Connected Networks
Immediate 90% improvement in median end-user latency after peering with a new network. 

By using our own on-ramps to other networks, we both ensure superior performance for our users and avoid adding load and causing congestion on the Internet at large.

And AS13335 is just getting started

Project Myriagon: Cloudflare Passes 10,000 Connected Networks

Cloudflare is an anycast network, meaning that the better connected we are, the faster and better-protected we are — obviating legacy concepts like scrubbing centers and slow origins. Hitting five digits of connected networks is something we’re really proud of as a step on our goal to helping to build a better Internet. As we’ve mentioned throughout the week, we’re all about high speed without having to pay a security or reliability cost.

There’s still work to do! While Project Myriagon has brought us, we believe, to be one of the top 5 most connected networks in the world, we estimate Google is connected to 12,000-15,000 networks. And so, today, we are kicking off Project CatchG. We won’t rest until we’re #1.

Interested in peering with us to help build a better Internet? Reach out to [email protected] with your request. More details on the locations we are present at can be found at http://as13335.peeringdb.com/.

Digital Transformation and Technological Utopianism

Post Syndicated from Bozho original https://techblog.bozho.net/digital-transformation-and-technological-utopianism/

Today I read a very interesting article about the prominence of Bulgarian hackers (in the black-hat sense) and virus authors in the 90s, linking that to the focus on technical education in the 80s, lead by the Bulgarian communist party in an effort to revive communism through technology.

Near the end of the article I was pleasantly surprised to read my name, as a political candidate who advocates for digital e-government and transformation of the public sector. The article then ended with something that I’m in deep disagreement with, but that has merit, and is worth discussing (and you can replace “Bulgaria” with probably any country there):

Of course, the belief that all the problems of a corrupt Bulgaria can be solved through the perfect tools is not that different to the Bulgarian Communist Party’s old dream that central planning through electronic brains would create communism. In both cases, the state is to be stripped back to a minimum

My first reaction was to deny ever claiming that the state would be stripped back to a minimum, as it will not (risking to enrage my libertarian readers), or to argue that I’ve never claimed there are “perfect tools” that can solve all problems, nor that digital transformation is the only way to solve those problems. But what I’ve said or written has little to do with the overall perception of techno-utopianism that IT people-turned-policy makers are usually struggling with.

So I decided to clearly state what e-government and digital transformation of the public sector is about.

First, it’s just catching up to the efficiency of the private sector. Sadly, there’s nothing visionary about wanting to digitize paper processes and provide services online. It’s something that’s been around for two decades in the private sector and the public sector just has to catch up, relying on all the expertise accumulated in those decades. Nothing grandiose or mind-boggling, just not being horribly inefficient.

When the world grows more complex, legislation and regulation grows more complex, the government gets more and more functions and more and more details to care about. There are more topics to have policy about (and many to take an informed decision to NOT have a policy about). All of that, today, can’t rely on pen-and-paper and a few proverbial smart and well-intentioned people. The government needs technology to catch up and do its job. It has had the luxury to not have competition and therefore it lagged behind. When there are no market forces to drive the digital transformation, what’s left is technocratic politicians. This efficiency has nothing to do with ideology, left or right. You can have “small government” and still have it inefficient and incapable of making sense of the world.

Second, technology is an enabler. Yes, it can help solve the problems with corruption, nepotism, lack of accountability. But as a tool, not as the solution itself. Take open data, for example (something I’ve been working on five years ago when Bulgaria jumped to the top of the EU open data index). Just having the data out there is an important effort, but by itself it doesn’t solve any problem. You need journalists, NGOs, citizens and a general understanding in society what transparency means. Same for accountability – it’s one thing to have every document digitized, every piece of data – published and every government official action leaving an audit trail; it’s a completely different story to have society act on those things – to have the institutions to investigate, to have the public pressure to turn that into political accountability.

Technology is also a threat – and that’s beyond the typical cybersecurity concerns. It poses the risk of dangerous institutions becoming too efficient; of excessive government surveillance; of entrenched interests carving their ways into the digital systems to perpetuate their corrupt agenda. I’m by no means ignoring those risks – they are real already. The Nazis, for example, were extremely efficient in finding the Jewish population in the Netherlands because the Dutch were very good at citizen registration. This doesn’t mean that you shouldn’t have an efficient citizen registration system. It means that it’s not good or bad per se.

And that gets us to the question of technological utopianism, of which I’m sometimes accused (though not directly in the quoted article). When you are an IT person, you have a technical hammer and everything may look like a binary nail. That’s why it’s very important to have a glimpse on humanities sides as well. Technology alone will not solve anything. And my blockchain skepticism is a hint in that direction – many blockchain enthusiasts are claiming that blockchain will solve many problems in many areas of life. It won’t. At least not just through clever cryptography and consensus algorithms. I once even wrote a sci-fi story about exactly the aforementioned communist dream of a centralized computer brain that solves all social issues while people are left to do what they want. And argued that no matter how perfect it is, it won’t work in a non-utopian human world. In other words, I’m rather critical of techno-utopianism as well.

The communist party, according to the author, saw technology as a tool by which the communist government would achieve its ideological goal.

My idea is quite different. First, technology necessary for “catching up” of the public sector, and second, I see technology as an enabler. What for – whether it’s for accountability or surveillance, fight with corruption or entrenching corruption even further – it’s our role as individuals, as society, and (in my case) as politicians, to formulate and advocate for. We have to embed our values, after democratic debate, into the digital tools (e.g. by making them privacy-preserving). But if we want to have good governance, and to be good at policy-making in the 21st century, we need digital tools, fully understanding their pitfalls and without putting them on a pedestal.

The post Digital Transformation and Technological Utopianism appeared first on Bozho's tech blog.

Cloudflare Pages is Lightning Fast

Post Syndicated from Nevi Shah original https://blog.cloudflare.com/cloudflare-pages-is-lightning-fast/

Cloudflare Pages is Lightning Fast

Cloudflare Pages is Lightning Fast

When we announced Cloudflare Pages in April, our goal wasn’t to bring just any web development tool to the table. As a front-end developer, it’s your responsibility to bring the ideas of your marketing, product and engineering teams to life by crafting a beautifully engaging experience for every customer. With all the hard work that goes into the development process — turning mock-ups to code, getting input from your team, staging and testing changes — you want the best performance possible for your site to showcase your work and optimize your customers’ experience.

Cloudflare Pages is the most secure and most scalable Jamstack platform to build and deploy your sites on the edge. But how is Pages so fast?

It comes down to three key reasons:

  • Pages is built on one of the fastest networks in the world, putting us within 50 ms of 95% of the world’s Internet-connected population. Delivering Pages from this network is the basis of our speed.
  • Cloudflare helps define and implement next generation standards, like QUIC + HTTP/3 and Early Hints, that push Pages performance to the next level.
  • Pages has a killer developer experience that makes it easy to build the fastest websites on the planet.

Pages is delivered from one of the fastest networks in the world

After all the sweat, finger cramps, and facepalms you’ve managed to survive through development, the last thing you need is poor performance and load times for your site. This not only drives off frustrated customers, but if the site is a storefront, it can also have revenue implications.

We’ve got you covered! With Cloudflare’s extensive network, consisting of 250+ cities, your Pages site is deployed directly to the edge in seconds. With even more optimizations to our network routing, your customers are routed to the best data center, ensuring optimal loading and performance globally.

How does our performance compare?

Optimized routing, a giant CDN network, support for the latest standards, more performance enhancements — these all sound great! But let’s put them to the ultimate test: benchmarking. How do our Pages sites’ performance compare to those of our competitors?

The TTFB test

We deployed the same static site on Pages and on two other popular deployment platforms for comparison. We understand that benchmark tools like Google Lighthouse may introduce some geographic bias; performing a benchmarking analysis from San Francisco and hitting a local data center doesn’t tell us much about performance on a global scale. We wanted to create a simulation to run tests from different locations to give us a globally accurate representation. Using a tool called Catchpoint, we executed our test from 35 different cities around the world to measure the Time to First Byte (TTFB) for different providers. To give as accurate a reading as possible, we ran our test up to eight times, and averaged the result per city and per provider.

Around the world in 80ms

It’s common to see good performance in regions like the US and Europe, but at Cloudflare, we think even more globally. Cloudflare’s network allows you to reach a myriad of regions around the world without any additional effort or cost. Everytime our map grows, your global reach does too.

In our TTFB comparison, Cloudflare Pages is leading the race to your customers against two leading providers.

Cloudflare Pages is Lightning Fast

Pages gets early access to the latest, greatest, and fastest standards and network protocols

But it’s not just our network. We are proud of both driving and adopting the latest web standards. Our mission has always been to help build a better Internet, and collaborating on the latest standards is an essential part of that goal, especially when thinking about your Pages sites.

TLS 1.3: As the new encryption protocol, TLS 1.3 sets out to improve both speed and security for Internet users everywhere. With 1.3, during the course of that infamous “TLS handshake” you hear so much about, only one round trip, or back and forth communication, is required instead of two, thus shortening the process by milliseconds. A huge step forward for web security and performance, TLS 1.3 is available to all Pages users with no additional action required — let the client and server handle it all.

IPv6: Today it’s extremely common for every person to have more than one Internet connected device, making the shift to IPv6 extremely crucial, now more than ever. Not only is IPv6 the answer to the “no more addresses” issue, but is also another added layer for performance and security with its ability to handle packets more efficiently, getting faster and faster as adoption of the standard increases.

QUIC & HTTP/3: The new internet transport protocol, QUIC & HTTP/3, team up to enable faster, reliable and more secure connections for your customers to web endpoints like your Pages site. QUIC, a transport layer protocol, aims to reduce connection and transport latency and avoid congestion and runs underneath HTTP/3. Enabled by default on every pages.dev domain, QUIC & HTTP/3 work in tandem to provide improved performance and security so long as the client complies.

With support for the latest standards like HTTP/3 and IPv6, as we work on support for dynamic frameworks, we will be able to offer response streaming, a feature other platforms don’t provide.

“Pages gives us more confidence than other providers, making it easier to migrate our app over and build new products that can easily scale with growing traffic.” David Simpson, COO at Designed.org

But we know that speed doesn’t just matter from a user perspective. It also matters from a developer perspective, too — and we’ve worked to make that just as great an experience.

A developer experience that we’d want to have

Generally speaking, performance of anything on the web is only as fast as the weakest link. A fast network, or support for the latest standards, doesn’t mean very much if we make it hard for a developer to do their job, or to optimize their code. So we knew the developer experience had to be a priority, too.

Fast for your users. Fast for you, too.

We set out to simplify every step of your developer experience by looking for ways to integrate into your existing publishing workflow. With Pages’ full git integration, grab your repo, tell us your framework and go! Collaborate with all members of your team — developers, PMs, marketers — quickly and efficiently with a protected preview URL per deployment to speed up the turnaround time for feedback. A simple Git commit and git push, and we’ll have your site up and running in seconds, and ready for you to share with your team or your customers.

Of course, even with lightning fast set-up and collaboration, we realize there’s more to the productivity of you and your team. From the time we launched Pages, we’ve been working on making our build times faster every day. Today, Pages builds are 3x faster than they were when we first launched the platform, but we’re not done yet. We’re aiming to have the fastest build times, so you can focus on what you do best — code, test, deploy, repeat — minus any wait.

Performance tuning, built in

In May of last year, Google announced a new program — Web Core Vitals — to provide unified guidance on how to measure the quality of a website, and to identify areas of improvement for developers, business owners, and marketers to deliver a better user experience. There are three key metrics as part of the program:

  • Largest Contentful Paint: measures loading performance
  • First Input Delay: measure interactivity
  • Cumulative Layout Shift: measures visual stability

Fast-forward a year to 2021, Google officially announced that performance on these metrics will now be incorporated into Google Search results.

Performance is becoming an ever important aspect of the success of any site on the web.

We recognize this, and it’s part of why we’re so relentlessly focused on making sites hosted on Pages so fast. But you don’t need to just take our word for it. In addition to providing you with stellar performance across the globe, our Web Analytics tool is available to Pages customers with one click — so you can track your site’s Web Core Vitals and understand specific areas of improvement. As an example, here’s the Web Analytics on our very own Cloudflare Docs site.

Cloudflare Pages is Lightning Fast

We’re big believers in dogfooding — running our Docs site on Pages, and then using our Web Analytics to identify areas of improvement. It’s a big part of the Cloudflare ethos, and it’s how we can be confident in recommending our products to you.

What’s Next

With the increasing momentum behind the Jamstack movement, it’s a great time to be in the field. With Pages, you can rest easy knowing you’re taken care of every step of the way. We are so excited about the future of Cloudflare Pages — integrating with Cloudflare Workers, supporting monorepos, enabling more sources of repo integration — and how it brings a fresh perspective on how you build and deploy your sites on the web.

Check our docs to get started on Cloudflare Pages today!

Profiling Your Workers with Wrangler

Post Syndicated from Joshua Nelson original https://blog.cloudflare.com/profiling-your-workers-with-wrangler/

Profiling Your Workers with Wrangler

Profiling Your Workers with Wrangler

In the year since Cloudflare’s launch of Workers Unbound, developers have unlocked the ability to run computationally intensive workloads on the Cloudflare edge network — like image processing, game logic, and other complex algorithms. With all that additional computing power comes a host of questions around performance. Our customers often ask us how they can profile or monitor their Workers to see where they spend the most CPU time, or to see whether their changes improve performance.

Here at Cloudflare, we not only want to build the fastest, most affordable, and most flexible compute platform at the edge; we also want to make the lives of our developers easier in building their applications. To do this, Cloudflare has begun to integrate with existing tools — places our developers feel comfortable and efficient in their day-to-day work. To help measure performance of our customers’ Workers, we’re beginning to integrate with the Chrome DevTools protocol. Just like you can use chrome://inspect to debug your Node backend, you can also use it to profile your Cloudflare Workers.

Introducing Chrome DevTools Integration (Beta)

We’re starting off this integration with beta support for local CPU profiling, using Wrangler. To show off how to use this feature, I’m going to be optimizing a simple JavaScript program which outputs the first thousand integers separated by a space. Let’s start by installing the latest version of Wrangler. We’ll also need a Worker cloned down to your local machine. I’ll be using Workers Profiling Example, but feel free to use any CPU intensive Worker for this tutorial.

For reference, my sample code is below. You’ll notice this code is intentionally performing a computation that will slow down our Worker.

addEventListener("fetch", event => {
  event.respondWith(handleRequest(event.request));
});

async function handleRequest(request) {
  let body = '';
  for (let i = 0; i < 1000; ++i) {
    body = body + ' ' + i;
  }

  return new Response(body, {
    headers: { 'content-type': 'text/plain' },
  });
}

To confirm this, we’ll run Chrome DevTools and profile our Worker locally. In the directory of your sample project, run wrangler dev --inspect. To launch the DevTools, open chrome://inspect in Chrome or Chromium. You’ll see Chrome’s DevTools homepage pop up:

Profiling Your Workers with Wrangler

Click ‘Configure’ and add localhost://9230 as one of the targets. You should see wrangler[{Worker name}] appear under “Remote Targets”, where {Worker name} is the name of your project.

Profiling Your Workers with Wrangler

Click ‘inspect’, then in the popup, ‘Profiler’.

Profiling Your Workers with Wrangler

Click ‘Start’ and, in a different browser tab, make a few requests to your site, then click ‘Stop’. It should be available locally on localhost:8787.

Analyze the flame graph. For my Slow Worker, I see the following graph:

Profiling Your Workers with Wrangler

When I click on handleRequest, I see the following annotated source of my Worker:

Profiling Your Workers with Wrangler

In particular, it shows that, unsurprisingly, most of the time is being spent on memory allocations in the body of the loop. Note that the profiler is not always accurate with regard to exact timing, but does paint a picture of your largest bottlenecks.

Understanding the Profile

The profiler works by gathering a stack trace of your program at a sampled rate, so remember that the profile is an approximation of where your code tends to spend the majority of its execution time, and is not meant to be perfectly accurate. In fact, functions that execute in less than 100 microseconds have a chance to not appear in the profile at all.

What’s Next?

With the Workers platform, we’re striving to build in the observability our users expect out of a robust compute platform. We’d love to hear more from the community about ways we can improve visibility into the code you’re writing on the edge. If you haven’t already, please join the Cloudflare Workers Discord community at https://discord.gg/PX8s2TmJ7s. Happy building!

The collective thoughts of the interwebz